WYNN RESORTS LTD
10-Ks and 10-Qs
|
|
|
|
|
|
|
|
|
|
|
|
|
|
|
|
|
|
|
|
|
|
|
|
|
|
|
|
|
|
|
|
|
|
|
|
|
|
|
|
|
|
|
|
|
|
|
|
|
|
|
|
|
|
|
|
UNITED STATES
SECURITIES AND EXCHANGE COMMISSION
Washington, D.C. 20549
FORM 10-K
|
ý
|
ANNUAL REPORT PURSUANT TO SECTION 13 OR 15(d) OF THE SECURITIES EXCHANGE ACT OF 1934
|
|
For the fiscal year ended December 31, 2014
|
|
OR
|
¨
|
TRANSITION REPORT PURSUANT TO SECTION 13 OR 15(d) OF THE SECURITIES EXCHANGE ACT OF 1934
|
|
For the transition period
to
|
|
Commission File No. 000-50028
WYNN RESORTS, LIMITED
(Exact name of registrant as specified in its charter)
|
N
EVADA
|
46-0484987
|
|
|
(State or other jurisdiction of
incorporation or organization)
|
(I.R.S. Employer
Identification Number)
|
|
3131 Las Vegas Boulevard South—Las Vegas, Nevada 89109
(Address of principal executive offices) (Zip Code)
(702) 770-7555
(Registrant’s telephone number, including area code)
Securities registered pursuant to Section 12(b) of the Act:
|
Title of Each Class
|
Name of Each Exchange on Which Registered
|
|
|
Common Stock, $.01 par value
|
Nasdaq Global Select Market
|
|
Securities registered pursuant to Section 12(g) of the Act:
None
Indicate by check mark if the registrant is a well-known seasoned issuer, as defined in Rule 405 of the Securities Act. Yes
ý
No
¨
Indicate by check mark if the registrant is not required to file reports pursuant to Section 13 or Section 15(d) of the Act. Yes
¨
No
ý
Indicate by check mark whether the registrant: (1) has filed all reports required to be filed by Section 13 or 15(d) of the Securities Exchange Act of 1934 during the preceding 12 months (or for such shorter period that the registrant was required to file such reports), and (2) has been subject to such filing requirements for the past 90 days. Yes
ý
No
¨
Indicate by check mark whether the registrant has submitted electronically and posted on its corporate Website, if any, every Interactive Data File required to be submitted and posted pursuant to Rule 405 of Regulation S-T (§232.405 of this chapter) during the preceding 12 months (or for such shorter period that the registrant was required to submit and post such files). Yes
ý
No
¨
Indicate by check mark if disclosure of delinquent filers pursuant to Item 405 of Regulation S-K is not contained herein, and will not be contained, to the best of the registrant’s knowledge, in definitive proxy or information statements incorporated by reference in Part III of this Form 10-K or any amendment to this Form 10-K.
ý
Indicate by check mark whether the registrant is a large accelerated filer, an accelerated filer, a non-accelerated filer, or a smaller reporting company. See definition of “large accelerated filer,” “accelerated filer” and “smaller reporting company” in Rule 12b-2 of the Exchange Act.
|
Large accelerated filer
|
ý
|
Accelerated filer
|
¨
|
|||
|
Non-accelerated filer
|
¨
|
Smaller reporting company
|
¨
|
|||
Indicate by check mark whether the registrant is a shell company (as defined in Rule 12b-2 of the Exchange Act). Yes
¨
No
ý
The aggregate market value of the registrant’s voting and non-voting common stock held by non-affiliates based on the closing price as reported on the NASDAQ Global Select Market on June 30, 2014 was approximately $16.8 billion.
As of February 13, 2015, 101,525,639 shares of the registrant’s Common Stock, $.01 par value, were outstanding.
DOCUMENTS INCORPORATED BY REFERENCE
Portions of the registrant’s Proxy Statement for its 2015 Annual Meeting of Stockholders to be filed not later than 120 days after the end of the fiscal year covered by this report are incorporated by reference into Part III of this Form 10-K.
WYNN RESORTS, LIMITED AND SUBSIDIARIES
FORM 10-K
TABLE OF CONTENTS
|
Item 1.
|
||
|
Item 1A.
|
||
|
Item 1B
|
||
|
Item 2.
|
||
|
Item 3.
|
||
|
Item 4.
|
||
|
Item 5.
|
||
|
Item 6.
|
||
|
Item 7.
|
||
|
Item 7A.
|
||
|
Item 8.
|
||
|
Item 9.
|
||
|
Item 9A.
|
||
|
Item 9B.
|
||
|
Item 10.
|
||
|
Item 11.
|
||
|
Item 12.
|
||
|
Item 13.
|
||
|
Item 14.
|
||
|
Item 15.
|
||
2
Overview
Wynn Resorts, Limited, ("Wynn Resorts", or together with its subsidiaries "we" or the "Company"), led by Chairman and Chief Executive Officer, Stephen A. Wynn, is a leading developer, owner and operator of destination casino resorts (integrated resorts) which integrate accommodations and amenities, including fine dining, premium retail offerings, distinctive entertainment and convention facilities.
Wynn Resorts currently owns
72
% of Wynn Macau, Limited, which operates an integrated resort in the Macau Special Administrative Region of the People’s Republic of China (“Macau”). Wynn Resorts also owns 100% of and operates an integrated resort in Las Vegas, Nevada.
We are currently constructing Wynn Palace, an integrated resort in the Cotai area of Macau, which we expect to open in the first half of 2016. In November 2014, we were awarded a gaming license in Massachusetts and expect to develop and construct an integrated resort in Everett, Massachusetts.
We present the operating results of our two existing integrated resorts in the following two segments: Macau Operations and Las Vegas Operations. For more information on our segments, see Item 8—“Financial Statements and Supplementary Data”, Note 18 “Segment Information.”
Wynn Resorts, a Nevada corporation, was formed in 2002. Wynn Resorts files annual reports on Form 10-K, quarterly reports on Form 10-Q, current reports on Form 8-K and amendments of such reports with the Securities and Exchange Commission (“SEC”). Any document Wynn Resorts files may be inspected, without charge, at the SEC’s public reference room at 100 F Street, N.E. Washington, D.C. 20549 or at the SEC’s internet site address at
http://www.sec.gov
. Information related to the operation of the SEC’s public reference room may be obtained by calling the SEC at 1-800-SEC-0330. In addition, through our own internet address at
www.wynnresorts.com
, Wynn Resorts provides a hyperlink to a third-party SEC filing website which posts these filings as soon as reasonably practicable, where they can be reviewed without charge. The information found on our website is not a part of this Annual Report on Form 10-K or any other report we file or furnish to the SEC.
Our Resorts
Macau Operations
Wynn Macau opened on September 6, 2006. On April 21, 2010, we opened Encore at Wynn Macau, an expansion of Wynn Macau. We refer to the integrated Wynn Macau and Encore at Wynn Macau resort as “Wynn Macau | Encore” or as our “Macau Operations.” We operate Wynn Macau | Encore under a 20-year casino concession agreement granted by the Macau government in June 2002. See "Regulation and Licensing—Macau" for details on the casino concession agreement. We lease from the Macau government an approximately 16 acre parcel of land in downtown Macau's inner harbor where Wynn Macau | Encore is located. See "Item 2—Properties" for details on the land concession agreement.
Wynn Macau | Encore features the following as of February 13, 2015:
|
•
|
Approximately
284,000
square feet of casino space offering 24-hour gaming and a full range of games with
498
table games and
625
slot machines, private gaming salons, sky casinos and a poker pit;
|
|
•
|
Two luxury hotel towers with a total of
1,008
spacious guest rooms and suites;
|
|
•
|
Casual and fine dining in
eight
restaurants;
|
|
•
|
Approximately
57,000
square feet of high-end, brand-name retail shopping, including stores and boutiques by Bvlgari, Cartier, Chanel, Dior, Dunhill, Ermenegildo Zegna, Ferrari, Giorgio Armani, Graff, Gucci, Hermes, Hugo Boss, Jaegar-LeCoultre, Loro Piana, Louis Vuitton, Miu Miu, Piaget, Prada, Richard Mille, Roger Dubuis, Rolex, Tiffany, Vacheron Constantin, Van Cleef & Arpels, Versace, Vertu, and others;
|
|
•
|
Approximately
31,000
square feet of space for lounges and meeting facilities;
|
|
•
|
Recreation and leisure facilities, including
two
health clubs, spas, a salon and a pool; and
|
|
•
|
Rotunda show featuring a Chinese zodiac-inspired ceiling along with gold "prosperity tree" and "dragon of fortune" attractions.
|
3
In response to our evaluation of our Macau Operations and the reactions of our guests, we have made and expect to continue to make enhancements and refinements to this resort. In February 2015, we completed the renovation of approximately 27,000 square feet of our casino space at Wynn Macau for new VIP gaming rooms.
Las Vegas Operations
Wynn Las Vegas opened on April 28, 2005. On December 22, 2008, we opened Encore at Wynn Las Vegas, an expansion of Wynn Las Vegas. We refer to the integrated Wynn Las Vegas and Encore at Wynn Las Vegas resort as “Wynn Las Vegas | Encore” or as our “Las Vegas Operations.” Wynn Las Vegas | Encore is located at the intersection of the Las Vegas Strip and Sands Avenue, and occupies approximately 215 acres of land fronting the Las Vegas Strip. In addition, we own approximately 18 acres across Sands Avenue, a portion of which is utilized for employee parking and an office building, and approximately 5 acres adjacent to the golf course on which an office building is located.
Wynn Las Vegas | Encore features the following as of February 13, 2015:
|
•
|
Approximately
186,000
square feet of casino space, offering 24-hour gaming and a full range of games with
232
table games and
1,849
slot machines, private gaming salons, a sky casino, a poker room, and a race and sports book;
|
|
•
|
Two luxury hotel towers with a total of
4,748
spacious guest rooms, suites and villas;
|
|
•
|
34
food and beverage outlets featuring signature chefs;
|
|
•
|
Approximately
99,000
square feet of high-end, brand-name retail shopping, including stores and boutiques by Alexander McQueen, Brioni, Cartier, Chanel, Chloé, Chopard, Dior, Givenchy, Graff, Hermes, IWC Schaffhausen, Jaeger-LeCoultre, Loro Piana, Louis Vuitton, Manolo Blahnik, Nicholas Kirkwood, Oscar de la Renta, Piaget, Rolex, Vertu and others;
|
|
•
|
Approximately
290,000
square feet of meeting and convention space;
|
|
•
|
Three
nightclubs and a beach club;
|
|
•
|
Specially designed theater presenting “Le Rêve-The Dream,” a water-based theatrical production and a theater presenting "Steve Wynn's Showstoppers," a Broadway-style entertainment production;
|
|
•
|
Recreation and leisure facilities, including an 18-hole golf course, swimming pools, private cabanas and two full service spas and salons;
|
|
•
|
A Ferrari and Maserati automobile dealership; and
|
|
•
|
Wedding chapels.
|
In response to our evaluation of our Las Vegas Operations and the reactions of our guests, we have and expect to continue to make enhancements and refinements to this resort.
Construction and Development Opportunities
In September 2011, Palo Real Estate Company Limited (“Palo”) and Wynn Resorts (Macau), S.A. (“Wynn Macau SA”), each an indirect subsidiary of Wynn Macau, Limited, formally accepted the terms and conditions of a land concession contract from the Macau government for approximately 51 acres of land in the Cotai area of Macau. On May 2, 2012, the land concession contract was gazetted by the government of Macau evidencing the final step in the granting of the land concession.
The initial term of the Cotai land concession contract is 25 years from May 2, 2012, and it may be renewed with government approval for successive periods. The total land premium payable, including interest as required by the land concession contract, is $193.4 million. An initial payment of $62.5 million was paid in December 2011, with eight additional semi-annual payments of approximately $16.4 million each (including interest at 5%) which began in November 2012. As of
December 31, 2014
, the Company has recorded this obligation with
$30.8 million
included as a current liability and
$16.0 million
included as a long-term liability. The Company will also be required to make annual lease payments of $0.8 million during the resort construction period and annual lease payments of approximately $1.1 million once the development is completed.
On the land subject to the Cotai land concession, we are currently constructing Wynn Palace, an integrated resort containing a
1,700
-room hotel, performance lake, meeting space, casino, spa, retail offerings and food and beverage outlets. The total project budget, including construction costs, capitalized interest, pre-opening expenses, land costs and financing fees,
4
is
$4.1 billion
. As of
December 31, 2014
, we have invested
$1.8 billion
in the project. We expect to open Wynn Palace in the first half of 2016.
On July 29, 2013, Wynn Macau SA and Palo executed a guaranteed maximum price construction (“GMP”) contract with Leighton Contractors (Asia) Limited, acting as the general contractor. Under the GMP contract, the general contractor is responsible for both the construction and design of the project. The general contractor is obligated to substantially complete the project in the first half of 2016 for a guaranteed maximum price of HK$20 billion (approximately $2.57 billion). An early completion bonus for achievement of substantial completion on or before January 25, 2016, will be paid to the general contractor if certain conditions are satisfied under the GMP contract. While our general contractor has notified us that certain conditions will not be satisfied under the GMP contract by the early completion target, the contractor stated it was still on target to complete the project on time and we continue to expect to open the property in the first half of 2016. Both the contract time and guaranteed maximum price are subject to further adjustment under certain specified conditions. The performance of the general contractor is backed by a full completion guarantee given by Leighton Holdings Limited, the parent company of the general contractor, as well as a performance bond for 5% of the guaranteed maximum price.
On September 17, 2014, the Massachusetts Gaming Commission ("MGC") designated Wynn MA, LLC ("Wynn MA"), an indirect wholly owned subsidiary of the Company, the award winner of the Greater Boston (Region A) gaming license. On November 4, 2014, a vote upheld the expanded gaming law in Massachusetts. On November 7, 2014, the gaming license awarded to us became effective and we paid the $85.0 million license fee.
On January 2, 2015, we purchased 33 acres of land in Everett, Massachusetts, along the Mystic River. On this land, we intend to develop and operate an integrated resort containing a hotel, restaurants, casino, spa, premium retail offerings, meeting and convention space and a waterfront boardwalk.
Our Strategy
We believe that Stephen A. Wynn is the preeminent designer, developer and operator of destination casino resorts and has developed brand name status. Mr. Wynn’s involvement with our resorts provides a distinct advantage over other gaming enterprises. We integrate luxurious surroundings, distinctive entertainment and superior amenities, including convention facilities, entertainment, fine dining and premium retail offerings, to create resorts that appeal to our international customer base.
Our resorts are designed, built and operated to provide a premium experience for our guests. Our business is dependent upon repeat visitation from our guests and we believe superior customer experience and service is the best marketing strategy to attract and retain our customers. Our company heavily emphasizes human resources and staff training to ensure our employees are prepared to provide the luxury service that our guests expect. We market our resorts directly to gaming customers using database marketing techniques, as well as traditional incentives, including reduced room rates and complimentary meals and suites. Our rewards system offers discounted and complimentary meals, lodging and entertainment for our guests. We also create general market awareness for our resorts through various media channels, including social media, television, radio, newspapers, magazines, the internet, direct mail and billboards.
Mr. Wynn and his team bring significant experience in designing, developing and operating casino resorts. The senior executive team has an average of over 25 years of experience in the hotel and gaming industries. We also have an approximately 120-person design, development and construction subsidiary, the senior management of which has significant experience in all major construction disciplines.
For the seventh consecutive year, Wynn Macau and The Spa at Wynn Macau received the Forbes five-star distinction, while Encore at Wynn Macau and the Spa at Encore at Wynn Macau received the Forbes five-star distinction for the third consecutive year. For the ninth consecutive year, The Tower Suites at Wynn Las Vegas has received the Forbes five-star distinction. The Spa at Wynn Las Vegas earned five-star recognition from Forbes for the seventh year in a row. The Tower Suites at Encore at Wynn Las Vegas and the Spa at Encore at Wynn Las Vegas are also recipients of the Forbes five-star distinction. In addition, a number of restaurants in our resorts have earned star-distinction from Forbes, with 51 stars in total for the current year.
We continually seek out new opportunities for additional gaming or related businesses, in the United States, and worldwide.
5
Market and Competition
The casino resort industry is highly competitive. Both our Macau Operations and our Las Vegas Operations compete with other high-quality casino resorts. Resorts located on or near our properties compete on the basis of overall atmosphere, range of amenities, level of service, price, location, entertainment, themes and size, among other factors. We seek to differentiate our Macau and Las Vegas resorts from other major resorts by concentrating on our fundamental elements of superior design, atmosphere, personal service and luxury.
Macau
Macau is governed as a special administrative region of China and is located approximately 37 miles southwest of, and approximately one hour away via ferry from, Hong Kong. Macau, which has been a casino destination for more than 50 years, consists principally of a peninsula on mainland China, with two neighboring islands, Taipa and Coloane, between which the Cotai area is located. In 2002, the government of Macau ended a 40 year monopoly of the conduct of gaming operations by conducting a competitive process resulting in the issuance of concessions to conduct gaming operations to three concessionaires (including Wynn Macau), who in turn were permitted, subject to the approval of the government of Macau, to each grant one subconcession, resulting in a total of six gaming concessionaires. In addition to Wynn Macau, each of Sociedade de Jogos de Macau (“SJM”) and Galaxy Entertainment Group Limited are primary concessionaires and Sands China Ltd., Melco Crown and MGM China Holdings Limited operate under subconcessions. There is no limit to the number of casinos each concessionaire is permitted to operate, but each facility is subject to government approval. Currently, there are 35 operating casinos in Macau.
We believe that Macau is located in one of the world’s largest concentrations of potential gaming customers. According to Macau Statistical Information, casinos in Macau, the largest gaming market in the world, generated approximately $44.1 billion in gaming revenue in 2014, a 2.6% decline from the approximately $45.2 billion generated in 2013. The Macau market has experienced a significant increase in annual gaming revenue from the $2.9 billion generated in 2002, with the 2014 year-over-year decline in annual gaming revenue being the first over this period.
Macau’s gaming market is primarily dependent on tourists. Tourist arrivals in 2014 were 31.5 million, compared to 29.3 million in 2013. The Macau market has also experienced tremendous growth in capacity in the last several years. As of December 31, 2014, there were 27,904 hotel rooms, 5,711 table games and 13,018 slot machines in Macau, compared to 12,978 hotel rooms, 2,762 table games and 6,546 slot machines as of December 31, 2006.
Gaming customers traveling to Macau have typically come from nearby destinations in Asia including Hong Kong, mainland China, Taiwan, South Korea and Malaysia. According to the Macau Statistics and Census Service Monthly Bulletin of Statistics, approximately 90% of the tourists who visited Macau in 2014 came from Hong Kong, mainland China and Taiwan. Travel to Macau by citizens of mainland China requires a visa. Chinese government officials have, on occasion, exercised their authority to adjust the visa policy and may do so in the future.
Wynn Macau faces competition from casinos located throughout the world, including Singapore, Australia, Philippines, Las Vegas and cruise ships in Asia that offer gaming.
Las Vegas
Las Vegas is the largest gaming market in the United States. During 2014, the economic environment in the gaming and hotel markets in Las Vegas continued to improve with increased visitation and hotel room demand. During 2014, the average daily room rate increased 5.2% and visitation increased 3.7% to 41.1 million visitors compared to 2013. Las Vegas Strip gaming revenues decreased by 2.1% from $6.5 billion for the year ended December 31, 2013 to $6.4 billion for the year ended December 31, 2014. During 2013, the average daily room rate increased 2.4%, visitation remained relatively flat at 39.7 million visitors, and Las Vegas Strip gaming revenues increased 4.8%, all as compared to the year ended December 31, 2012. Las Vegas Strip resorts experienced 2014 year-over-year increases of 2.2% and 7.8% in occupancy and revenue per available room, respectively.
Our Las Vegas Operations are located on the Las Vegas Strip and compete with other high-quality resorts and hotel casinos in Las Vegas. Our Las Vegas Operations also compete, to some extent, with other casino resorts throughout the United States, and elsewhere in the world. The legalization of casino gaming in or near metropolitan areas from which we attract customers could have a negative effect on our business. New or renovated casinos in Asia, including Singapore, the Philippines, South Korea and Macau, could draw gaming customers away from Las Vegas.
6
Geographic Data
Geographic data are reported in Item 8—“Financial Statements and Supplementary Data”, Note 18 “Segment Information.” Additional financial data about our geographic operations is provided in Item 7—“Management’s Discussion and Analysis of Financial Condition and Results of Operations.”
Regulation and Licensing
Macau
General.
As a casino concessionaire, Wynn Macau, an indirect
72%
owned subsidiary of the Company, is subject to the regulatory control of the Government of Macau. The government has adopted Laws and Administrative Regulations governing the operation of casinos in Macau. Only concessionaires or subconcessionaires are permitted to operate casinos. Subconcessions may be awarded subject to the approval of the Macau government and each concessionaire has issued one subconcession. Each concessionaire was required to enter into a concession agreement with the Macau government which, together with the Law and Administrative Regulations, form the framework for the regulation of the activities of the concessionaire.
Under the Law and Administrative Regulations, concessionaires are subject to suitability requirements relating to background, associations and reputation, as are stockholders of 5% or more of a concessionaire’s equity securities, officers, directors and key employees. The same requirements apply to any entity engaged by a concessionaire to manage casino operations. Concessionaires are required to satisfy minimum capitalization requirements, demonstrate and maintain adequate financial capacity to operate the concession and submit to continuous monitoring of their casino operations by the Macau government. Concessionaires also are subject to periodic financial reporting requirements and reporting obligations with respect to, among other things, certain contracts, financing activities and transactions with directors, financiers and key employees. Transfers or the encumbering of interests in concessionaires must be reported to the Macau government and are ineffective without government approval.
Each concessionaire is required to engage an executive director who must be a permanent resident of Macau and the holder of at least 10% of the capital stock of the concessionaire. The appointment of the executive director and of any successor is ineffective without the approval of the Macau government. All contracts placing the management of a concessionaire’s casino operations with a third party also are ineffective without the approval of the Macau government.
Concessionaires are subject to a special gaming tax of 35% of gross gaming revenue, and must also make an annual contribution of up to 4% of gross gaming revenue for the promotion of public interests, social security, infrastructure and tourism. Concessionaires are obligated to withhold applicable taxes, according to the rate in effect as set by the government, from any commissions paid to games promoters. The withholding rate may be adjusted from time to time.
A games promoter, also known as a junket representative, is a person who, for the purpose of promoting casino gaming activity, arranges customer transportation and accommodations, and provides credit in their sole discretion, food and beverage services and entertainment in exchange for commissions or other compensation from a concessionaire. Macau law provides that games promoters must be licensed by the Macau government in order to do business with and receive compensation from concessionaires. For a license to be obtained, direct and indirect owners of 5% or more of a games promoter (regardless of its corporate form or sole proprietor status), its directors and its key employees must be found suitable. Applicants are required to pay the cost of license investigations, and are required to maintain suitability standards during the period of licensure. The term of a games promoters’ license is one calendar year, and licenses can be renewed for additional periods upon the submission of renewal applications. Natural person junket representative licensees are subject to a suitability verification process every three years and business entity licensees are subject to the same requirement every six years. The Gaming Inspection and Coordination Bureau (“DICJ”) implemented certain instructions in 2009,which have the force of law, relating to commissions paid to, and by, games promoters. Such instructions also impose certain financial reporting and audit requirements on games promoters.
Under Macau law, licensed games promoters must identify outside contractors who assist them in their promotion activities. These contractors are subject to approval of the Macau government. Changes in the management structure of business entity games promoters licensees must be reported to the Macau government and any transfer or the encumbering of interests in such licensees is ineffective without prior government approval. To conduct gaming promotion activities licensees must be registered with one or more concessionaires and must have written contracts with such concessionaires, copies of which must be submitted to the Macau government.
7
Macau law further provides that concessionaires are jointly responsible with their games promoters for the activities of such representatives and their directors and contractors in the concessionaires’ casinos, and for their compliance with applicable laws and regulations. Concessionaires must submit annual lists of their games promoters, and must update such lists on a quarterly basis. The Macau government may designate a maximum number of games promoters and specify the number of games promoters a concessionaire is permitted to engage. Concessionaires are subject to periodic reporting requirements with respect to commissions paid to their games promoters representatives and are required to oversee their activities and report instances of unlawful activity.
The government of Macau may assume temporary custody and control over the operation of a concession in certain circumstances. During any such period, the costs of operations must be borne by the concessionaire. The government of Macau also may redeem a concession starting at an established date after the entering into effect of a concession. The government of Macau may also terminate a concession for cause, including, without limitation, failure of the concessionaire to fulfill its obligations under law or the concession contract.
Concession Agreement.
The concession agreement between Wynn Macau SA and the Macau government required Wynn Macau SA to construct and operate one or more casino gaming properties in Macau, including, at a minimum, one full-service casino resort by the end of December 2006, and to invest not less than a total of 4 billion Macau patacas (approximately $500 million) in Macau-related projects by June 2009. These obligations were satisfied upon the opening of Wynn Macau in 2006.
Wynn Macau SA was also obligated to obtain, and did obtain, a 700 million Macau pataca (approximately $87 million) bank guarantee from Banco National Ultramarino, S.A. (“BNU”) that was effective until March 31, 2007. The amount of this guarantee was reduced to 300 million Macau patacas (approximately $37 million) for the period from April 1, 2007 until 180 days after the end of the term of the concession agreement. This guarantee, which is for the benefit of the Macau government, assures Wynn Macau SA’s performance under the casino concession agreement, including the payment of premiums, fines and indemnity for any material failure to perform the concession agreement. Wynn Macau SA is obligated, upon demand by BNU, to promptly repay any claim made on the guarantee by the Macau government. BNU is currently paid an annual fee by Wynn Macau SA for the guarantee of approximately 2.3 million patacas (approximately $0.3 million).
The government of Macau may redeem the concession beginning on June 24, 2017, and in such event Wynn Macau SA will be entitled to fair compensation or indemnity. The amount of such compensation or indemnity will be determined based on the amount of revenue generated during the tax year prior to the redemption multiplied for the remaining years under the concession.
The government of Macau may unilaterally rescind the concession if Wynn Macau SA fails to fulfill its fundamental obligations under the concession agreement. The concession agreement expressly provides that the government of Macau may unilaterally rescind the concession agreement if Wynn Macau SA:
|
•
|
conducts unauthorized games or activities that are excluded from its corporate purpose;
|
|
•
|
abandons or suspends gaming operations in Macau for more than seven consecutive days (or more than 14 days in a civil year) without justification;
|
|
•
|
defaults in payment of taxes, premiums, contributions or other required amounts;
|
|
•
|
does not comply with government inspections or supervision;
|
|
•
|
systematically fails to observe its obligations under the concession system;
|
|
•
|
fails to maintain bank guarantees or bonds satisfactory to the government;
|
|
•
|
is the subject of bankruptcy proceedings or becomes insolvent;
|
|
•
|
engages in serious fraudulent activity, damaging to the public interest; or,
|
|
•
|
repeatedly and seriously violates applicable gaming laws.
|
If the government of Macau unilaterally rescinds the concession agreement for one of the reasons stated above, Wynn Macau SA will be required to compensate the government in accordance with applicable law, and the areas defined as casino under Macau law and all of the gaming equipment pertaining to the gaming operations of Wynn Macau SA will be transferred to the government without compensation. In addition, the government of Macau may, in the public interest, unilaterally terminate the concession at any time, in which case Wynn Macau SA would be entitled to reasonable compensation.
8
Nevada
Introduction.
The ownership and operation of casino gaming facilities in the State of Nevada are subject to the Nevada Gaming Control Act and the regulations made under the Act, as well as to various local ordinances. Our Las Vegas Operations are subject to the licensing and regulatory control of the Nevada Gaming Commission, the Nevada State Gaming Control Board and the Clark County Liquor and Gaming Licensing Board, which we refer to herein collectively as the “Nevada Gaming Authorities.”
Policy Concerns of Gaming Laws.
The laws, regulations and supervisory procedures of the Nevada Gaming Authorities are based upon declarations of public policy. Such public policy concerns include, among other things:
|
•
|
preventing unsavory or unsuitable persons from being directly or indirectly involved with gaming at any time or in any capacity;
|
|
•
|
establishing and maintaining responsible accounting practices and procedures;
|
|
•
|
maintaining effective controls over the financial practices of licensees, including establishing minimum procedures for internal fiscal affairs and safeguarding assets and revenue, providing reliable recordkeeping and requiring the filing of periodic reports with the Nevada Gaming Authorities;
|
|
•
|
preventing cheating and fraudulent practices; and
|
|
•
|
providing a source of state and local revenue through taxation and licensing fees.
|
Changes in applicable laws, regulations and procedures could have significant negative effects on our Las Vegas gaming operations and our financial condition and results of operations.
Owner and Operator Licensing Requirements.
Our subsidiary, Wynn Las Vegas, LLC, the owner and operator of our Las Vegas Operations, has been approved by the Nevada Gaming Authorities as a limited liability company licensee, referred to as a company licensee, which includes approval to conduct casino gaming operations, including a race book and sports pool and pari-mutuel wagering. These gaming licenses are not transferable.
Company Registration Requirements.
Wynn Resorts was found suitable by the Nevada Gaming Commission to own the equity interests of Wynn Resorts Holdings, LLC (“Wynn Resorts Holdings”), a wholly owned subsidiary of Wynn Resorts, and to be registered by the Nevada Gaming Commission as a publicly traded corporation, referred to as a registered company, for the purposes of the Nevada Gaming Control Act. Wynn Resorts Holdings was found suitable by the Nevada Gaming Commission to own the equity interests of Wynn Las Vegas, LLC and to be registered by the Nevada Gaming Commission as an intermediary company. In addition to being licensed, Wynn Las Vegas, LLC, as an issuer of debt securities registered with the SEC, also qualified as a registered company. Wynn Las Vegas Capital Corp., a co-issuer of the debt securities, was not required to be registered or licensed, but may be required to be found suitable as a lender or financing source.
Periodically, we are required to submit detailed financial and operating reports to the Nevada Gaming Commission and provide any other information that the Nevada Gaming Commission may require. Substantially all of our material loans, leases, sales of securities and similar financing transactions must be reported to, and/or approved by, the Nevada Gaming Commission.
Individual Licensing Requirements.
No person may become a more than 5% stockholder or member of, or receive any percentage of the profits of, an intermediary company or company licensee without first obtaining licenses and approvals from the Nevada Gaming Authorities. The Nevada Gaming Authorities may investigate any individual who has a material relationship to or material involvement with us to determine whether the individual is suitable or should be licensed as a business associate of a gaming licensee. Certain of our officers, directors and key employees have been or may be required to file applications with the Nevada Gaming Authorities and are or may be required to be licensed or found suitable by the Nevada Gaming Authorities. All applications required as of the date of this report have been filed. However, the Nevada Gaming Authorities may require additional applications and may also deny an application for licensing for any reason which they deem appropriate. A finding of suitability is comparable to licensing, and both require submission of detailed personal and financial information followed by a thorough investigation. An applicant for licensing or an applicant for a finding of suitability must pay or must cause to be paid all the costs of the investigation. Changes in licensed positions must be reported to the Nevada Gaming Authorities and, in addition to their authority to deny an application for a finding of suitability or licensing, the Nevada Gaming Authorities have the jurisdiction to disapprove a change in a corporate position.
If the Nevada Gaming Authorities were to find an officer, director or key employee unsuitable for licensing or unsuitable to continue having a relationship with us, we would have to sever all relationships with that person. In addition, the Nevada
9
Gaming Commission may require us to terminate the employment of any person who refuses to file appropriate applications. Determinations of suitability or questions pertaining to licensing are not subject to judicial review in Nevada.
Redemption of Securities Owned By an Unsuitable Person.
The Company’s articles of incorporation provide that, to the extent required by the gaming authority making the determination of unsuitability or to the extent the Board of Directors determines, in its sole discretion, that a person is likely to jeopardize the Company’s or any affiliate’s application for, receipt of, approval for, right to the use of, or entitlement to, any gaming license, shares of Wynn Resorts’ capital stock that are owned or controlled by an unsuitable person or its affiliates are subject to redemption by Wynn Resorts. The redemption price will be the amount, if any, required by the gaming authority or, if the gaming authority does not determine the price, the sum deemed by the Board of Directors to be the fair value of the securities to be redeemed. If Wynn Resorts determines the redemption price, the redemption price will be capped at the closing price of the shares on the principal national securities exchange on which the shares are listed on the trading day before the redemption notice is given. If the shares are not listed on a national securities exchange, the redemption price will be capped at the closing sale price of the shares as quoted on The NASDAQ Global Select Market or if the closing price is not reported, the mean between the bid and ask prices, as quoted by any other generally recognized reporting system. Wynn Resorts’ right of redemption is not exclusive of any other rights that it may have or later acquire under any agreement, its bylaws or otherwise. The redemption price may be paid in cash, by promissory note, or both, as required, and pursuant to the terms established by, the applicable Gaming Authority and, if not, as the Board of Directors of Wynn Resorts elects, and as set forth in the Company’s articles of incorporation.
On February 18, 2012, Wynn Resorts’ Gaming Compliance Committee concluded an investigation after receiving an independent report by Freeh, Sporkin & Sullivan, LLP (the “Freeh Report”) detailing a pattern of misconduct by Aruze USA, Inc. ("Aruze") (at the time a stockholder of Wynn Resorts), Universal Entertainment Corporation, Aruze’s parent company, and Kazuo Okada, (the majority shareholder of Universal Entertainment Corporation and a former member of the Board of Directors of Wynn Resorts and Wynn Macau, Limited) (collectively, the “Okada Parties”).
Based on the Freeh Report, the Board of Directors of Wynn Resorts determined that the Okada Parties are “unsuitable persons” under Article VII of the Company’s articles of incorporation. The Board of Directors was unanimous (other than Mr. Okada) in its determination. After authorizing the redemption of the Aruze shares, as discussed below, the Board of Directors took certain actions to protect the Company and its operations from any influence of an unsuitable person, including placing limitations on the provision of certain operating information to unsuitable persons and formation of an Executive Committee of the Board to manage the business and affairs of the Company during the period between each annual meeting. The Charter of the Executive Committee provides that “Unsuitable Persons” are not permitted to serve on the Committee. All members of the Board, other than Mr. Okada, were appointed to the Executive Committee on February 18, 2012. The Board of Directors also requested that Mr. Okada resign as a director of Wynn Resorts (under Nevada corporation law, a board of directors does not have the power to remove a director) and recommended that Mr. Okada be removed as a member of the Board of Directors of Wynn Macau, Limited. On February 18, 2012, Mr. Okada was removed from the Board of Directors of Wynn Las Vegas Capital Corp., an indirect wholly owned subsidiary of Wynn Resorts. On February 24, 2012, Mr. Okada was removed from the Board of Directors of Wynn Macau, Limited and on February 22, 2013, he was removed from the Board of Directors of Wynn Resorts by a stockholder vote in which 99.6% of the over 86 million shares voted were cast in favor of removal. Mr. Okada resigned from the Board of Directors of Wynn Resorts on February 21, 2013. Although the Company has retained the structure of the Executive Committee, the Board has resumed its past role in managing the business and affairs of the Company.
Based on the Board of Directors’ finding of “unsuitability,” on February 18, 2012, Wynn Resorts redeemed and canceled Aruze’s 24,549,222 shares of Wynn Resorts’ common stock. Following a finding of "unsuitability," Article VII of Wynn Resorts' articles of incorporation authorizes redemption at "fair value" of the shares held by the unsuitable persons. The Company engaged an independent financial advisor to assist in the fair value calculation and concluded that a discount to the then current trading price was appropriate because of, among other things, restrictions on most of the shares held by Aruze under the terms of the Stockholders Agreement (as defined below). Pursuant to its articles of incorporation, Wynn Resorts issued the Redemption Price Promissory Note (the “Redemption Note”) to Aruze in redemption of the shares. The Redemption Note has a principal amount of $1.94 billion, matures on February 18, 2022 and bears interest at the rate of 2% per annum, payable annually in arrears on each anniversary of the date of the Redemption Note. The Company may, in its sole and absolute discretion, at any time and from time to time, and without penalty or premium, prepay the whole or any portion of the principal or interest due under the Redemption Note. In no instance shall any payment obligation under the Redemption Note be accelerated except in the sole and absolute discretion of Wynn Resorts or as specifically mandated by law. The indebtedness evidenced by the Redemption Note is and shall be subordinated in right of payment, to the extent and in the manner provided in the Redemption Note, to the prior payment in full of all existing and future obligations of Wynn Resorts or any of its affiliates in respect of indebtedness for borrowed money of any kind or nature.
10
The Okada Parties have challenged the redemption of Aruze’s shares and the Company is currently involved in litigation with those parties as well as related shareholder derivative litigation. See Item 1A—“Risk Factors”, Item 3—“Legal Proceedings” and Item 8—“Financial Statements and Supplementary Data”, Note 17 “Commitments and Contingencies”. The outcome of these various proceedings cannot be predicted. The Company’s claims and the Okada Parties’ counterclaims are in a preliminary stage and management has determined that based on proceedings to date, it is currently unable to determine the probability of the outcome of this matter or the range of reasonably possible loss, if any. An adverse judgment or settlement involving payment of a material amount could cause a material adverse effect on our financial condition.
Consequences of Violating Gaming Laws.
If the Nevada Gaming Commission determines that we have violated the Nevada Gaming Control Act or any of its regulations, it could limit, condition, suspend or revoke our registrations and gaming license. In addition, we and the persons involved could be subject to substantial fines for each separate violation of the Nevada Gaming Control Act, or of the regulations of the Nevada Gaming Commission, at the discretion of the Nevada Gaming Commission. Further, the Nevada Gaming Commission could appoint a supervisor to operate our Las Vegas Operations and, under specified circumstances, earnings generated during the supervisor’s appointment (except for the reasonable rental value of the premises) could be forfeited to the State of Nevada. Limitation, conditioning or suspension of any of our gaming licenses and the appointment of a supervisor could, and revocation of any gaming license would, have a significant negative effect on our gaming operations.
Requirements for Voting or Nonvoting Securities Holders.
Regardless of the number of shares held, any beneficial owner of Wynn Resorts’ voting or nonvoting securities may be required to file an application, be investigated and have that person’s suitability as a beneficial owner of voting securities determined if the Nevada Gaming Commission has reason to believe that the ownership would be inconsistent with the declared policies of the State of Nevada. If the beneficial owner of the voting or nonvoting securities of Wynn Resorts who must be found suitable is a corporation, partnership, limited partnership, limited liability company or trust, it must submit detailed business and financial information including a list of its beneficial owners. The applicant must pay all costs of the investigation incurred by the Nevada Gaming Authorities in conducting any investigation.
The Nevada Gaming Control Act requires any person who acquires more than 5% of the voting securities of a registered company to report the acquisition to the Nevada Gaming Commission. The Nevada Gaming Control Act requires beneficial owners of more than 10% of a registered company’s voting securities to apply to the Nevada Gaming Commission for a finding of suitability within 30 days after the Chairman of the Nevada State Gaming Control Board mails the written notice requiring such filing. However, an “institutional investor,” as defined in the Nevada Gaming Control Act, which beneficially owns more than 10% but not more than 11% of a registered company’s voting securities as a result of a stock repurchase by the registered company may not be required to file such an application. Further, an institutional investor which acquires more than 10%, but not more than 25%, of a registered company’s voting securities may apply to the Nevada Gaming Commission for a waiver of a finding of suitability if the institutional investor holds the voting securities for investment purposes only. An institutional investor that has obtained a waiver may hold more than 25% but not more than 29% of a registered company’s voting securities and maintain its waiver where the additional ownership results from a stock repurchase by the registered company. An institutional investor will not be deemed to hold voting securities for investment purposes unless the voting securities were acquired and are held in the ordinary course of business as an institutional investor and not for the purpose of causing, directly or indirectly, the election of a majority of the members of the Board of Directors of the registered company, a change in the corporate charter, bylaws, management, policies or operations of the registered company, or any of its gaming affiliates, or any other action which the Nevada Gaming Commission finds to be inconsistent with holding the registered company’s voting securities for investment purposes only. Activities which are not deemed to be inconsistent with holding voting securities for investment purposes only include:
|
•
|
voting on all matters voted on by stockholders or interest holders;
|
|
•
|
making financial and other inquiries of management of the type normally made by securities analysts for informational purposes and not to cause a change in management, policies or operations; and,
|
|
•
|
other activities that the Nevada Gaming Commission may determine to be consistent with such investment intent.
|
The articles of incorporation of Wynn Resorts include provisions intended to assist its implementation of the above restrictions.
Wynn Resorts is required to maintain a current stock ledger in Nevada which may be examined by the Nevada Gaming Authorities at any time. If any securities are held in trust by an agent or by a nominee, the record holder may be required to disclose the identity of the beneficial owner to the Nevada Gaming Authorities. A failure to make the disclosure may be
11
grounds for finding the record holder unsuitable. We are required to provide maximum assistance in determining the identity of the beneficial owner of any of Wynn Resorts’ voting securities. The Nevada Gaming Commission has the power to require the stock certificates of any registered company to bear a legend indicating that the securities are subject to the Nevada Gaming Control Act. The certificates representing shares of Wynn Resorts’ common stock note that the shares are subject to a right of redemption and other restrictions set forth in Wynn Resorts’ articles of incorporation and bylaws and that the shares are, or may become, subject to restrictions imposed by applicable gaming laws.
Consequences of Being Found Unsuitable.
Any person who fails or refuses to apply for a finding of suitability or a license within 30 days after being ordered to do so by the Nevada Gaming Commission or by the Chairman of the Nevada State Gaming Control Board, or who refuses or fails to pay the investigative costs incurred by the Nevada Gaming Authorities in connection with the investigation of its application, may be found unsuitable. The same restrictions apply to a record owner if the record owner, after request, fails to identify the beneficial owner. Any person found unsuitable and who holds, directly or indirectly, any beneficial ownership of any voting security or debt security of a registered company beyond the period of time as may be prescribed by the Nevada Gaming Commission may be guilty of a criminal offense. We will be subject to disciplinary action if, after we receive notice that a person is unsuitable to hold an equity interest or to have any other relationship with us, we:
|
•
|
pay that person any dividend or interest upon any voting securities;
|
|
•
|
allow that person to exercise, directly or indirectly, any voting right held by that person relating to Wynn Resorts;
|
|
•
|
pay remuneration in any form to that person for services rendered or otherwise; or,
|
|
•
|
fail to pursue all lawful efforts to require the unsuitable person to relinquish such person’s voting securities including, if necessary, the immediate purchase of the voting securities for cash at fair market value.
|
Gaming Laws Relating to Debt Securities Ownership.
The Nevada Gaming Commission may, in its discretion, require the owner of any debt or similar securities of a registered company, to file applications, be investigated and be found suitable to own the debt or other security of the registered company if the Nevada Gaming Commission has reason to believe that such ownership would otherwise be inconsistent with the declared policies of the State of Nevada. If the Nevada Gaming Commission decides that a person is unsuitable to own the security, then under the Nevada Gaming Control Act, the registered company can be sanctioned, including the loss of its approvals if, without the prior approval of the Nevada Gaming Commission, it:
|
•
|
pays to the unsuitable person any dividend, interest or any distribution whatsoever;
|
|
•
|
recognizes any voting right by the unsuitable person in connection with the securities;
|
|
•
|
pays the unsuitable person remuneration in any form; or,
|
|
•
|
makes any payment to the unsuitable person by way of principal, redemption, conversion, exchange, liquidation or similar transaction.
|
Approval of Public Offerings.
Wynn Resorts and Wynn Las Vegas, LLC may not make a public offering (debt or equity) without the prior approval of the Nevada Gaming Commission if the proceeds from the offering are intended to be used to construct, acquire or finance gaming facilities in Nevada, or to retire or extend obligations incurred for those purposes or for similar transactions. On March 21, 2013, the Nevada Gaming Commission granted us and Wynn Las Vegas, LLC prior approval, subject to certain conditions, to make public offerings for a period of three years (the “Shelf Approval”). The Shelf Approval also applies to any affiliated company wholly owned by us which is a publicly traded corporation or would thereby become a publicly traded corporation pursuant to a public offering. The Shelf Approval may be rescinded for good cause without prior notice upon the issuance of an interlocutory stop order by the Chairman of the Nevada State Gaming Control Board. The Shelf Approval does not constitute a finding, recommendation or approval by any of the Nevada Gaming Authorities as to the accuracy or adequacy of the offering memorandum or the investment merits of the securities. Any representation to the contrary is unlawful.
Approval of Changes in Control.
A registered company must obtain the prior approval of the Nevada Gaming Commission with respect to a change in control through merger; consolidation; stock or asset acquisitions; management or consulting agreements; or any act or conduct by a person by which the person obtains control of the registered company.
Entities seeking to acquire control of a registered company must satisfy the Nevada State Gaming Control Board and Nevada Gaming Commission with respect to a variety of stringent standards before assuming control of the registered company. The Nevada Gaming Commission may also require controlling stockholders, officers, directors and other persons
12
having a material relationship or involvement with the entity proposing to acquire control to be investigated and licensed as part of the approval process relating to the transaction.
Approval of Defensive Tactics.
The Nevada legislature has declared that some corporate acquisitions opposed by management, repurchases of voting securities and corporate defense tactics affecting Nevada corporate gaming licensees or affecting registered companies that are affiliated with the operations of Nevada gaming licensees may be harmful to stable and productive corporate gaming. The Nevada Gaming Commission has established a regulatory scheme to reduce the potential adverse effects of these business practices upon Nevada’s gaming industry and to further Nevada’s policy in order to:
|
•
|
assure the financial stability of corporate gaming licensees and their affiliated companies;
|
|
•
|
preserve the beneficial aspects of conducting business in the corporate form; and,
|
|
•
|
promote a neutral environment for the orderly governance of corporate affairs.
|
Approvals may be required from the Nevada Gaming Commission before a registered company can make exceptional repurchases of voting securities above its current market price and before a corporate acquisition opposed by management can be consummated. The Nevada Gaming Control Act also requires prior approval of a plan of recapitalization proposed by a registered company’s Board of Directors in response to a tender offer made directly to its stockholders for the purpose of acquiring control.
Fees and Taxes.
License fees and taxes, computed in various ways depending on the type of gaming or activity involved, are payable to the State of Nevada and to the counties and cities in which the licensed subsidiaries’ respective operations are conducted. Depending upon the particular fee or tax involved, these fees and taxes are payable monthly, quarterly or annually and are based upon:
|
•
|
a percentage of the gross revenue received;
|
|
•
|
the number of gaming devices operated; or,
|
|
•
|
the number of table games operated.
|
A live entertainment tax also is imposed on admission charges and sales of food, beverages and merchandise where live entertainment is furnished.
Foreign Gaming Investigations.
Any person who is licensed, required to be licensed, registered, required to be registered in Nevada, or is under common control with such persons (collectively, “licensees”), and who proposes to become involved in a gaming venture outside of Nevada, is required to deposit with the Nevada State Gaming Control Board, and thereafter maintain, a revolving fund in the amount of $10,000 to pay the expenses of investigation of the Nevada State Gaming Control Board of the licensee’s or registrant’s participation in such foreign gaming. The revolving fund is subject to increase or decrease at the discretion of the Nevada Gaming Commission. Licensees and registrants are required to comply with the foreign gaming reporting requirements imposed by the Nevada Gaming Control Act. A licensee or registrant is also subject to disciplinary action by the Nevada Gaming Commission if it:
|
•
|
knowingly violates any laws of the foreign jurisdiction pertaining to the foreign gaming operation;
|
|
•
|
fails to conduct the foreign gaming operation in accordance with the standards of honesty and integrity required of Nevada gaming operations;
|
|
•
|
engages in any activity or enters into any association that is unsuitable because it poses an unreasonable threat to the control of gaming in Nevada, reflects or tends to reflect, discredit or disrepute upon the State of Nevada or gaming in Nevada, or is contrary to the gaming policies of Nevada;
|
|
•
|
engages in activities or enters into associations that are harmful to the State of Nevada or its ability to collect gaming taxes and fees; or,
|
|
•
|
employs, contracts with or associates with a person in the foreign operation who has been denied a license or finding of suitability in Nevada on the ground of unsuitability.
|
Licenses for Conduct of Gaming and Sale of Alcoholic Beverages.
The conduct of gaming activities and the service and sale of alcoholic beverages at Wynn Las Vegas are subject to licensing, control and regulation by the Clark County Liquor and Gaming Licensing Board, which has granted Wynn Las Vegas, LLC licenses for such purposes. In addition to approving Wynn Las Vegas, LLC, the Clark County Liquor and Gaming Licensing Board has the authority to approve all persons owning or controlling the stock of any corporation controlling a gaming license. Clark County gaming and liquor licenses are not transferable. The County has full power to limit, condition, suspend or revoke any license. Any disciplinary action could, and revocation would, have a substantial negative impact upon our operations.
13
Massachusetts
Introduction.
On November 22, 2011, Massachusetts Governor Deval Patrick signed Chapter 194 of the Acts of 2011 "An Act Establishing Expanded Gaming in the Commonwealth,” legislation (the “Gaming Act”) designed to provide significant benefits to the Commonwealth of Massachusetts by advancing job creation and economic development. The Gaming Act allows for up to three destination resort casinos located in three geographically diverse regions across the Commonwealth and a single slots facility, not pegged in any particular region. The licensing fee for each resort casino is $85 million and requires a capital investment, to include a hotel facility, of at least $500 million. The Commonwealth will receive 25% of gross gaming revenues.
The Gaming Act also called for the creation of a five member independent body, the MGC, to oversee the implementation and licensing process. The MGC is in the process of promulgating detailed regulations to govern the operations of the resort casinos and the slot parlor facility. These regulations and any changes in applicable laws, regulations and procedures could have significant negative effects on our future Massachusetts gaming operations and results of operations.
Owner and Operator Licensing Requirements.
Our indirect wholly owned subsidiary, Wynn MA, LLC, the future owner and operator of the Wynn resort in Massachusetts, was the “applicant” under the MGC’s Phase 1 regulations and was determined to be suitable for the purpose of holding a Category 1 Gaming License. On September 17, 2014, the MGC designated Wynn MA, LLC the award winner of the Greater Boston (Region A) gaming license. On November 7, 2014, the gaming license awarded to us became effective.
Company Registration Requirements.
In addition, pursuant to the Phase 1 regulations, the following entities and person are deemed to be “qualifiers” subject to investigation: all members, transferees of a member’s interest, directors and managers of the licensee and, in the judgment of the MGC, each lender, each holder of indebtedness, each underwriter, each close associate, each executive and each agent. As a result, Wynn Resorts, its key employees and its directors were therefore subject to a suitability investigation. Wynn Resorts and all individual qualifiers were found suitable by the MGC. As our progress in Massachusetts continues, additional entities and key employees may be required to file applications with the MGC and are or may be required to be licensed or found suitable by the MGC. Following Wynn America, LLC ("Wynn America"), an indirect wholly owned subsidiary of Wynn Resorts, Limited, entering into a senior secured credit facility in November 2014, the MGC has requested additional applications, which are pending. A finding of suitability is comparable to licensing, and both require submission of detailed personal and financial information followed by a thorough investigation. An applicant for licensing or an applicant for a finding of suitability must pay or must cause to be paid all the costs of the investigation. Changes in licensed positions must be reported to the MGC.
If the MGC were to find an officer, director or key employee unsuitable for licensing or unsuitable to continue having a relationship with us, we would have to sever all relationships with that person. In addition, the MGC may require us to terminate the employment of any person who refuses to file appropriate applications. Determinations of suitability or questions pertaining to licensing are not subject to judicial review.
Consequences of Violating Gaming Laws.
If the MGC determines that we have violated the Gaming Act or any of its regulations, it could limit, condition, suspend or revoke our registrations and gaming license. In addition, the MGC set forth certain conditions in our gaming license. Any violation of the Gaming Act, its regulations or any of our license conditions resulting in a limitation, conditioning or suspension of our gaming license would have a significant negative effect on our Massachusetts gaming operations.
Licenses for Conduct of Gaming and Sale of Alcoholic Beverages.
Pursuant to the Gaming Act, the MGC may grant a gaming beverage license for the sale and distribution of alcoholic beverages for a gaming establishment. The division of gaming liquor enforcement of the Alcoholic Beverage Control Commission will have the authority to enforce, regulate and control the distribution of alcoholic beverages in a gaming establishment. The MGC may revoke, suspend, refuse to renew or refuse to transfer a gaming beverage license for violations of the Gaming Act that pertain to the sale and distribution of alcohol consumed on the premises and the regulations adopted by the MGC. The MGC is in the process of adopting regulations for the issuance of gaming beverage licenses. These regulations and any changes in applicable laws, regulations and procedures could have significant negative effects on our future Massachusetts gaming operations and results of operations.
14
Other Regulations
In addition to gaming regulations, we are subject to extensive local, state, federal and foreign laws and regulations in the jurisdictions in which we operate. These include, but are not limited to, laws and regulations relating to alcoholic beverages, environmental matters, employment and immigration, currency and other transactions, taxation, zoning and building codes, marketing and advertising, lending, debt collection, privacy, telemarketing, money laundering, laws and regulations administered by the Office of Foreign Assets Control, and anti-bribery laws, including the Foreign Corrupt Practices Act. Such laws and regulations could change or could be interpreted differently in the future, or new laws and regulations could be enacted. Any material changes, new laws or regulations, or material differences in interpretations by courts or governmental authorities could adversely affect our business and operating results.
Seasonality
We may experience fluctuations in revenues and cash flows from month to month, however, we do not believe that our business is materially impacted by seasonality.
Employees
As of
December 31, 2014
, we had approximately 16,800 full-time equivalent employees (including approximately 7,200 in Macau and 9,600 in Las Vegas).
We entered into a ten year collective bargaining agreement with the Culinary and Bartenders Union local covering approximately 5,612 employees at our Las Vegas Operations that will expire in July 2015. We also entered into a ten year collective bargaining agreement with the Transportation Workers Union in November 2010, which covers 425 table games dealers at our Las Vegas Operations. Certain other unions may seek to organize the workers of our Las Vegas Operations.
Intellectual Property
Among our most important marks are our trademarks and service marks that use the name “WYNN.” Wynn Resorts has registered with the U.S. Patent and Trademark Office (“PTO”) a variety of the WYNN-related trademarks and service marks in connection with a variety of goods and services.
We have also filed applications with various foreign patent and trademark registries, including in Macau, China, Singapore, Hong Kong, Taiwan, Japan, certain European countries and various other jurisdictions throughout the world, to register a variety of WYNN-related trademarks and service marks in connection with a variety of goods and services.
We recognize that our intellectual property assets, including the word and logo version of “WYNN,” are among our most valuable assets. As a result, and in connection with expansion of our resorts and gaming activities outside the United States, we have undertaken a program to register our trademarks and other intellectual property rights in relevant jurisdictions. We have retained counsel and intend to take all steps necessary to protect our intellectual property rights against unauthorized use throughout the world.
On August 6, 2004, we entered into agreements with Mr. Wynn that confirm and clarify our rights to use the “Wynn” surname and Mr. Wynn’s persona in connection with our casino resorts. Under a Surname Rights Agreement, Mr. Wynn has acknowledged our exclusive, fully paid-up, perpetual, worldwide right to use, and to own and register trademarks and service marks incorporating, the “Wynn” surname for casino resorts and related businesses, together with the right to sublicense the name and marks to our affiliates. Under a Rights of Publicity License, Mr. Wynn has granted us the exclusive, royalty-free, worldwide right to use his full name, persona and related rights of publicity for casino resorts and related businesses, together with the ability to sublicense the persona and publicity rights to our affiliates, until October 24, 2017.
We have also registered various domain names with various domain registrars around the world. Our domain registrations extend to various foreign countries such as “.com.cn” and “.com.hk.” We pursue domain related infringement on a case by case basis depending on the infringing domain in question. The information found on these websites is not a part of this Annual Report on Form 10-K or any other report we file or furnish to the SEC.
For more information regarding the Company's intellectual property matters see Item 1A—"Risk Factors".
15
Forward-Looking Statements
We make forward-looking statements in this Annual Report on Form 10-K based upon the beliefs and assumptions of our management and on information currently available to us. Forward-looking statements include, but are not limited to, information about our business strategy, development activities, competition and possible or assumed future results of operations, throughout this report and are often preceded by, followed by or include the words “may,” “will,” “should,” “would,” “could,” “believe,” “expect,” “anticipate,” “estimate,” “intend,” “plan,” “continue” or the negative of these terms or similar expressions.
Forward-looking statements are subject to a number of risks and uncertainties that could cause actual results to differ materially from those we express in these forward-looking statements, including the risks and uncertainties in Item 1A—“Risk Factors” and other factors we describe from time to time in our periodic filings with the SEC, such as:
|
•
|
our dependence on Stephen A. Wynn;
|
|
•
|
restrictions or conditions on visitation by citizens of mainland China to Macau;
|
|
•
|
general global political and economic conditions, which may impact levels of travel, leisure and consumer spending;
|
|
•
|
potential violations of law by Mr. Kazuo Okada, a former shareholder of ours;
|
|
•
|
changes in the valuation of the promissory note we issued in connection with the redemption of Mr. Okada’s shares;
|
|
•
|
pending or future legal proceedings, regulatory or enforcement actions or probity investigations;
|
|
•
|
any violations by us of the anti-money laundering laws or Foreign Corrupt Practices Act;
|
|
•
|
competition in the casino/hotel and resort industries and actions taken by our competitors, including new development and construction activities of competitors;
|
|
•
|
our dependence on a limited number of resorts and locations for all of our cash flow;
|
|
•
|
our relationships with Macau games promoters;
|
|
•
|
factors affecting the development and success of new gaming and resort properties (including limited labor resources in Macau and government labor policies, unexpected cost increases, environmental regulation and our ability to secure federal, state and local permits and approvals necessary for our construction projects);
|
|
•
|
our ability to maintain our customer relationships and collect and enforce gaming receivables;
|
|
•
|
extensive regulation of our business and the cost of compliance or failure to comply with applicable laws and regulations;
|
|
•
|
our ability to maintain our gaming licenses and concessions;
|
|
•
|
changes in gaming laws or regulations (including stricter smoking regulations in Macau);
|
|
•
|
changes in federal, foreign, or state tax laws or the administration of such laws;
|
|
•
|
cybersecurity risk including misappropriation of customer information or other breaches of information security;
|
|
•
|
our current and future insurance coverage levels;
|
|
•
|
conditions precedent to funding under our credit facilities;
|
|
•
|
continued compliance with all provisions in our debt agreements;
|
|
•
|
leverage and debt service (including sensitivity to fluctuations in interest rates);
|
|
•
|
the impact on the travel and leisure industry from factors such as an outbreak of an infectious disease, extreme weather patterns or natural disasters, military conflicts and any future security alerts and/or terrorist attacks;
|
|
•
|
our subsidiaries’ ability to pay us dividends and distributions;
|
|
•
|
our ability to protect our intellectual property rights;
|
|
•
|
doing business in foreign locations such as Macau;
|
|
•
|
legalization of gaming in certain jurisdictions; and
|
|
•
|
changes in exchange rates.
|
Further information on potential factors that could affect our financial condition, results of operations and business are included in this report and our other filings with the SEC. You should not place undue reliance on any forward-looking statements, which are based only on information available to us at the time this statement is made. We undertake no obligation to update or revise any forward-looking statement, whether as a result of new information, future developments or otherwise.
16
You should carefully consider the risk factors set forth below, as well as the other information contained in this Annual Report on Form 10-K, regarding matters which could have an adverse effect, including a material one, on our business, financial condition, results of operations and cash flows. Additional risks and uncertainties not currently known to us or that we currently deem to be immaterial may also have a material adverse effect on our business, financial condition, results of operations and cash flows.
Risks Related to our Business
The loss of Stephen A. Wynn could significantly harm our business.
Our ability to maintain our competitive position is dependent to a large degree on the efforts, skills and reputation of Stephen A. Wynn, the Chairman of the Board, Chief Executive Officer and one of the principal stockholders of Wynn Resorts. Mr. Wynn’s employment agreement expires in October 2022. However, we cannot assure you that Mr. Wynn will remain with Wynn Resorts. If we lose the services of Mr. Wynn, or if he is unable to devote sufficient attention to our operations for any other reason, our business may be significantly impaired.
Visitation to Macau may decline due to economic disruptions in mainland China, restrictions on visitations to Macau from citizens of mainland China and the anti-corruption campaign.
A significant number of our gaming customers at Wynn Macau come from mainland China. Any economic disruption or contraction in China could disrupt the number of patrons visiting our property or the amount they may be willing to spend. In addition, policies adopted from time to time by the Chinese government, including any travel restrictions imposed by China on its citizens such as restrictions imposed on exit visas granted to residents of mainland China for travel to Macau, could disrupt the number of visitors from mainland China to our property. It is not known when, or if, policies similar to those implemented in 2009 restricting visitation by mainland Chinese citizens to Macau and Hong Kong, will be put in place and travel policies may be adjusted, without notice, in the future. Furthermore, the Chinese government’s ongoing anti-corruption campaign has had an overall chilling effect on the behavior of Chinese consumers and their spending patterns both domestically and abroad. The campaign has specifically led to tighter monetary transfer regulations, including real time monitoring of certain financial channels, which could disrupt the number of visitors and the amount of money they can bring from mainland China to Macau. The overall effect of the campaign and monetary transfer restrictions may result in decreased visitation and negatively affect our revenues and results of operations.
Our business is particularly sensitive to reductions in discretionary consumer and corporate spending as a result of downturns in the global economy.
Consumer demand for casino/hotel resorts, trade shows and conventions and for the type of luxury amenities that we offer is particularly sensitive to downturns in the global economy which adversely impact discretionary spending on leisure activities. Changes in discretionary consumer spending or consumer preferences brought about by factors such as perceived or actual general global economic conditions, high unemployment, the housing foreclosure crisis, perceived or actual changes in disposable consumer income and wealth, an economic recession and changes in consumer confidence in the global economy, or fears of war and future acts of terrorism could reduce customer demand for the luxury amenities and leisure activities we offer, and may have a significant negative impact on our operating results.
17
Potential violations of law by Mr. Okada (former director and formerly the largest beneficial owner of our shares) and his affiliates could have adverse consequences to the Company.
On February 18, 2012, the Board of Directors of Wynn Resorts received a report from Freeh, Sporkin & Sullivan, LLP detailing numerous instances of conduct constituting prima facie violations of the Foreign Corrupt Practices Act (the “FCPA”) by Kazuo Okada (formerly the largest beneficial owner of our shares) and certain of his affiliates. See Item 3—“Legal Proceedings” and Item 8—“Financial Statements and Supplementary Data”, Note 17 “Commitments and Contingencies.” The Company has provided the Freeh Report to applicable regulators and has been cooperating with related investigations of such regulators. The conduct of Mr. Okada and his affiliates and the outcome of any resulting regulatory findings could have adverse consequences to the Company. A finding by regulatory authorities that Mr. Okada violated the FCPA on Company property and/or otherwise involved the Company in criminal or civil violations could result in actions by regulatory authorities against the Company. Relatedly, regulators have and may pursue separate investigations into the Company’s compliance with applicable laws in connection with the Okada matter, as discussed in Item 3—“Legal Proceedings”. While the Company believes that it is in full compliance with all applicable laws, any such investigations could result in actions by regulators against the Company, which could negatively affect the Company’s financial condition or results of operations.
Mr. Okada and his affiliates have challenged the redemption of Aruze’s Shares. An adverse judgment or settlement resulting from the related litigation could reduce our profits or limit our ability to operate our business.
On February 18, 2012, after receiving the Freeh Report, the Board of Directors of Wynn Resorts determined that each of the Okada Parties was “unsuitable” within the meaning of Article VII of Wynn Resorts’ articles of incorporation and redeemed all of Aruze’s shares of Wynn Resorts’ common stock. See Item 3—“Legal Proceedings” and Item 8—“Financial Statements and Supplementary Data”, Note 17 “Commitments and Contingencies”. On February 19, 2012, Wynn Resorts filed a complaint in the Eighth Judicial District Court, Clark County, Nevada against the Okada Parties (as amended, the “Complaint”), alleging breaches of fiduciary duty and related claims (the “Redemption Action”) arising from the activities addressed in the Freeh Report. The Company is seeking compensatory and special damages as well as a declaration that it acted lawfully and in full compliance with its articles of incorporation, bylaws and other governing documents in redeeming and canceling the shares of Aruze. On March 12, 2012, the Okada Parties filed an answer denying the claims and a counterclaim (as amended, the “Counterclaim”) against the Company, each of the members of the Company’s Board of Directors (other than Mr. Okada) and Wynn Resorts’ General Counsel (collectively, the “Wynn Parties”), seeking, among other things a declaration that the redemption of Aruze’s shares was void, an injunction restoring Aruze’s share ownership, damages in an unspecified amount and rescission of the Amended and Restated Stockholders Agreement, dated as of January 6, 2010, by and among Aruze, Stephen A. Wynn, and Elaine P. Wynn (the “Stockholders Agreement”). In connection with the Redemption Action and Counterclaim (1) various Okada Parties filed a complaint in the Tokyo District Court against the Company, all members of the Board of Directors (other than Mr. Okada) and the Company’s General Counsel alleging that the press release issued by the Company in connection with the Redemption Action has damaged their social evaluation and credibility and seeking damages and legal fees, (2) four federal derivative actions were commenced against the Company and all members of its Board of Directors, (3) two state derivative actions were commenced against the Company and all members of its Board of Directors and (4) regulatory inquiries and investigations were initiated against the Company. See Item 3—“Legal Proceedings”, for a full description of these matters and status as of the date of this report. The Company is vigorously pursuing its claims against the Okada Parties, and together with the other counter-defendants, vigorously defending against the Counterclaim and other actions asserted against them. However, as with all litigation, the outcome of these proceedings cannot be predicted. Any adverse judgments or settlements involving payment of a material sum of money could cause a material adverse effect on our financial condition and results of operations and could expose us to additional claims by third parties, including current or former investors or regulators. Any adverse judgments or settlements would reduce our profits and could limit our ability to operate our business.
Change in valuation of our Redemption Price Promissory Note could have a negative impact on our results of operations.
In connection with the redemption of the shares previously held by Aruze, we recorded the fair value of the Redemption Note of approximately $1.94 billion in accordance with applicable accounting guidance. We utilized an independent third party valuation to assist in the determination of this fair value. In determining this fair value, we estimated the Redemption Note’s present value using discounted cash flows with a probability weighted expected return for redemption assumptions and a discount rate which included time value and non-performance risk adjustments commensurate with risk of the Redemption Note.
Considerations for the redemption assumptions included the stated maturity of the Redemption Note, uncertainty of the related cash flows as well as potential effects of the following: uncertainties surrounding the potential outcome and timing of
18
pending litigation with the Okada Parties (see Item 8—“Financial Statements and Supplementary Data”, Note 17 “Commitments and Contingencies”); the outcome of on-going investigations of Aruze by the United States Attorney’s Office, the U.S. Department of Justice and the Nevada Gaming Control Board; and other potential legal and regulatory actions. In addition, in the furtherance of various future business objectives, we considered our ability, at our sole option, to prepay the Redemption Note at any time in accordance with its terms without penalty. Accordingly, we reasonably determined that the estimated life of the Redemption Note could be less than the contractual life of the Redemption Note.
In determination of the appropriate discount rate to be used in the estimated present value, the Redemption Note’s subordinated position relative to all other debt in our capital structure and credit ratings associated with our traded debt were considered. Observable inputs for the risk free rate based on Federal Reserve rates for U.S. Treasury securities and credit risk spread based on a yield curve index of similarly rated debt was used. As a result of this analysis, we concluded the Redemption Notes’ stated rate of 2% approximated a market rate.
A change in any of the assumptions discussed above could result in a change in the fair value of this Redemption Note and significantly impact our results of operations.
Ongoing litigation and other disputes with Mr. Okada and certain of his affiliates could distract management and result in negative publicity and additional scrutiny of regulators.
There has been widespread publicity of the findings in the Freeh Report of prima facie violations of law by Mr. Okada and his affiliates, the Board of Director’s unsuitability finding, the redemption of shares and related litigation. The actions, litigation, and publicity could reduce demand for shares of Wynn Resorts and Wynn Macau, Limited and thereby have a negative impact on the trading prices of their respective shares. The disputes may also lead to additional scrutiny from regulators, which could lead to investigations relating to, and possibly a negative impact on, the Company’s gaming licenses, and possibly have a negative impact on the Company’s ability to bid successfully for new gaming market opportunities.
Any violation of applicable Anti-Money Laundering laws or regulations or the Foreign Corrupt Practices Act could adversely affect our business, performance, prospects, value, financial condition, and results of operations.
We deal with significant amounts of cash in our operations and are subject to various reporting and anti-money laundering laws and regulations. Recently, U.S. governmental authorities have evidenced an increased focus on the gaming industry and compliance with anti-money laundering laws and regulations. The Company has been subject to governmental and regulatory inquiries about compliance with such laws and regulations and continues to cooperate with all such inquiries. Any violation of anti-money laundering laws or regulations could adversely affect our business, performance, prospects, value, financial condition, and results of operations.
Further, we have operations, and a significant portion of our revenue is derived from customers, outside of the United States. We are therefore subject to regulations imposed by the FCPA and other anti-corruption laws that generally prohibit U.S. companies and their intermediaries from offering, promising, authorizing or making improper payments to foreign government officials for the purpose of obtaining or retaining business. Violations of the FCPA and other anti-corruption laws, may result in severe criminal and civil sanctions as well as other penalties and the SEC and U.S. Department of Justice have increased their enforcement activities with respect such laws and regulations.
Internal control policies and procedures and employee training and compliance programs that we have implemented to deter prohibited practices may not be effective in prohibiting our directors, employees, contractors or agents from violating or circumventing our policies and the law. If we or our directors, employees or agents fail to comply with applicable laws or Company policies governing our operations, the Company may face investigations, prosecutions and other legal proceedings and actions which could result in civil penalties, administrative remedies and criminal sanctions. Any such government investigations, prosecutions or other legal proceedings or actions could adversely affect our business, performance, prospects, value, financial condition, and results of operations.
Mr. Okada failed to comply with internal training in these matters and failed to return to Wynn Resorts an executed Acknowledgment agreeing to comply with the Wynn Resorts Code of Business Conduct and Ethics. On February 19, 2012, Wynn Resorts’ filed a complaint in Nevada state court against Mr. Okada and other entities alleging, among other things, breach of fiduciary duty in connection with alleged violations of the FCPA. For information on such complaint, the Freeh Report, which detailed numerous instances of conduct constituting prima facie violations of FCPA by Mr. Okada and certain of his affiliates, and the redemption Aruze's shares, see Item 8—“Financial Statements and Supplementary Data”, Note 17 “Commitments and Contingencies”.
19
Our casino, hotel, convention and other facilities face intense competition, which may increase in the future.
The casino/hotel industry is highly competitive. Our Macau operations face intense competition with approximately 35 casinos currently operating in Macau. We hold a concession under one of only three gaming concessions and three subconcessions authorized by the Macau government to operate casinos in Macau. The Macau government has had the ability to grant additional gaming concessions since April 2009. If the Macau government were to allow additional competitors to operate in Macau through the grant of additional concessions or subconcessions, we would face additional competition, which could have a material adverse effect on our business, financial condition, results of operations and cash flows. Several of the current concessionaires and subconcessionaires are expected to open additional facilities in the Cotai area of Macau over the next few years. The additional Cotai facilities currently with planned opening dates in 2015 and 2016 are expected to increase total hotel room inventory by over 40% and significantly increase other gaming and non-gaming offerings in Macau.
Our Macau resort complex also faces competition from casinos located in other areas of Asia, including the Marina Bay Sands and Resorts World Sentosa resorts operating in Singapore, Genting Highlands Resort, a major gaming and resort destination located outside of Kuala Lumpur, Malaysia, and casinos in the Philippines. We also encounter competition from other major gaming centers located around the world, including Australia and Las Vegas, cruise ships in Asia that offer gaming, and other casinos throughout Asia. Further, if current efforts to legalize gaming in other Asian countries are successful, our Wynn Macau resort will face additional regional competition.
In Las Vegas, we compete with other Las Vegas Strip hotels and with other hotel casinos in Las Vegas on the basis of overall atmosphere, range of amenities, level of service, price, location, entertainment, theme and size, among other factors.
Wynn Las Vegas also competes with other casino/hotel facilities in other cities. The proliferation of gaming activities in other areas could significantly harm our business as well. In particular, the legalization or expansion of casino gaming in or near metropolitan areas from which we attract customers could have a negative effect on our business. In addition, new or renovated casinos in Macau or elsewhere in Asia could draw Asian gaming customers away from our Las Vegas Operations.
We are entirely dependent on a limited number of resorts for all of our cash flow, which subjects us to greater risks than a gaming company with more operating properties.
We are currently entirely dependent upon our Macau Operations and Las Vegas Operations for all of our operating cash flow. As a result, we are subject to a greater degree of risk than a gaming company with more operating properties or greater geographic diversification. The risks to which we have a greater degree of exposure include the following:
|
•
|
local economic and competitive conditions;
|
|
•
|
changes in local and state governmental laws and regulations, including gaming laws and regulations;
|
|
•
|
natural and other disasters;
|
|
•
|
a decline in the number of visitors to Las Vegas or Macau;
|
|
•
|
a decrease in gaming and non-casino activities at our resorts; and
|
|
•
|
the outbreak of infectious diseases.
|
Any of the factors outlined above could negatively affect our ability to generate sufficient cash flow to make payments or maintain our covenants with respect to our debt.
We could encounter substantial cost increases higher than expected in the development of our projects.
We are currently constructing Wynn Palace, in the Cotai area of Macau, and in development of a Wynn resort in Massachusetts. The total project budget for Wynn Palace, including construction costs, capitalized interest, pre-opening expenses, land costs and financing fees, is $4.1 billion.
The projected development costs for Wynn Palace reflect our best estimates and the actual development costs may be higher than expected. Contingencies that have been set aside by us to cover cost overruns may be insufficient to cover the full amount of such overruns. If these contingencies are not sufficient to cover these costs, we may not have the funds required to pay the excess costs and these projects may not be completed. Failure to complete these projects may negatively affect our financial condition, our results of operations and our ability to pay our debt.
20
All our current and future construction projects will be subject to significant development and construction risks, which could have an adverse effect on our financial condition, results of operations or cash flows from this planned facility.
Major construction projects of the scope and scale of Wynn Palace and the Wynn resort in Massachusetts entail significant risks, including:
|
•
|
shortages of, and price increases in, materials or skilled labor;
|
|
•
|
changes to plans and specifications;
|
|
•
|
delays in obtaining or inability to obtain requisite licenses, permits and authorizations from regulatory authorities;
|
|
•
|
changes in laws and regulations, or in the interpretation and enforcement of laws and regulations, applicable to gaming, leisure, real estate development or construction projects;
|
|
•
|
unforeseen engineering, environmental and/or geological problems;
|
|
•
|
labor disputes or work stoppages;
|
|
•
|
disputes with and defaults by contractors and subcontractors;
|
|
•
|
personal injuries to workers and other persons;
|
|
•
|
environment, health and safety issues, including site accidents;
|
|
•
|
delays or interference from severe weather or natural disasters;
|
|
•
|
geological, construction, excavation, regulatory and equipment problems;
|
|
•
|
unanticipated cost increases; and
|
|
•
|
unavailability of construction equipment.
|
Construction, equipment or staffing problems or difficulties in obtaining any of the requisite licenses, permits and authorizations from regulatory authorities could increase the total cost, delay or prevent the construction or opening or otherwise affect the design and features of Wynn Palace.
We anticipate that only some of the subcontractors engaged for these projects will post bonds guaranteeing timely completion of the subcontractor’s work and payment for all of that subcontractor’s labor and materials. These bonds may not be adequate to ensure completion of the work.
Our Wynn Palace facility or the Wynn resort in Massachusetts facility may not commence operations on schedule and construction costs for these projects may exceed budgeted amounts. Failure to complete these projects on schedule or within budget may have a significant negative effect on us and on our ability to make payments on our debt.
Our new projects may not be successful.
In addition to the construction and regulatory risks associated with our current and future construction projects, we cannot assure you that the level of consumer demand for our casino resorts or for the type of luxury amenities that we will offer will meet our expectations. The operating results of our new projects may be materially different than the operating results of our current integrated resorts due to, among other reasons, differences in consumer and corporate spending and preferences in new geographic areas, increased competition from other markets or other developments that may be beyond our control. In addition, our new projects may be more sensitive to certain risks, including risks associated with downturns in the economy, than the integrated resorts we currently operate. The demands caused by new developments on our managerial, operational and other resources may impact our operation of our existing results. If any of these issues were to occur, it could adversely affect our prospects, financial condition, or results of operations.
Our business relies on high-end, international customers. We often extend credit, and we may not be able to collect gaming receivables from our credit players or credit play may decrease.
General.
A significant portion of our table games revenue at our resorts is attributable to the play of a limited number of international customers. The loss or a reduction in the play of the most significant of these customers could have a material adverse effect on our business, financial condition, results of operations and cash flows. A downturn in economic conditions in the countries in which these customers reside could cause a further reduction in the frequency of visits by and revenue generated from these customers.
We conduct our gaming activities on a credit as well as a cash basis. This credit is unsecured. We will extend credit to those customers whose level of play and financial resources, in the opinion of management, warrant such an extension. The collectability of receivables from international customers could be negatively affected by future business or economic trends or by significant events in the countries in which these customers reside.
21
In addition, premium gaming is more volatile than other forms of gaming, and variances in win-loss results attributable to high-end gaming may have a positive or negative impact on cash flow and earnings in a particular quarter.
Wynn Las Vegas.
While gaming debts evidenced by a credit instrument, including what is commonly referred to as a “marker,” are enforceable under the current laws of Nevada, and judgments on gaming debts are enforceable in all states of the United States under the Full Faith and Credit Clause of the United States Constitution, other jurisdictions may determine that direct or indirect enforcement of gaming debts is against public policy. Although courts of some foreign nations will enforce gaming debts directly and the assets in the United States of foreign debtors may be used to satisfy a judgment, judgments on gaming debts from U.S. courts are not binding on the courts of many foreign nations. We cannot assure that we will be able to collect the full amount of gaming debts owed to us, even in jurisdictions that enforce them. Changes in economic conditions may make it more difficult to assess creditworthiness and more difficult to collect the full amount of any gaming debt owed to us. Our inability to collect gaming debts could have a significant negative impact on our operating results.
Wynn Macau.
Although the law in Macau permits casino operators to extend credit to gaming customers, Wynn Macau may not be able to collect all of its gaming receivables from its credit players. We expect that Wynn Macau will be able to enforce these obligations only in a limited number of jurisdictions, including Macau. To the extent our gaming customers are visitors from other jurisdictions, we may not have access to a forum in which we will be able to collect all of our gaming receivables because, among other reasons, courts of many jurisdictions do not enforce gaming debts and we may encounter forums that will refuse to enforce such debts. Our inability to collect gaming debts could have a significant negative impact on our operating results.
Currently, the gaming tax in Macau is calculated as a percentage of gross gaming revenue. However, unlike Nevada, the gross gaming revenue calculation in Macau does not include deductions for uncollectible gaming debts. As a result, if we extend credit to our customers in Macau and are unable to collect on the related receivables from them, we remain obligated to pay taxes on our winnings from these customers.
We are subject to extensive state and local regulation and licensing and gaming authorities have significant control over our operations. The cost of compliance or failure to comply with such regulations and authorities could have a negative effect on our business.
The operations of our resorts are contingent upon our obtaining and maintaining all necessary licenses, permits, approvals, registrations, findings of suitability, orders and authorizations in the jurisdictions in which our resorts are located. The laws, regulations and ordinances requiring these licenses, permits and other approvals generally relate to the responsibility, financial stability and character of the owners and managers of gaming operations, as well as persons financially interested or involved in gaming operations. The Nevada Gaming Commission may require the holder of any debt or securities we or Wynn Las Vegas, LLC issue to file applications, be investigated and be found suitable to own Wynn Resorts’ securities if it has reason to believe that the security ownership would be inconsistent with the declared policies of the State of Nevada.
The Company’s articles of incorporation also provide that, to the extent required by the gaming authority making the determination of unsuitability or to the extent the Board of Directors determines, in its sole discretion, that a person is likely to jeopardize the Company’s or any affiliate’s application for, receipt of, approval for, right to the use of, or entitlement to, any gaming license, shares of Wynn Resorts’ capital stock that are owned or controlled by an unsuitable person or its affiliates are subject to redemption by Wynn Resorts. The redemption price may be paid in cash, by promissory note, or both, as required, and pursuant to the terms established by, the applicable gaming authority and, if not, as Wynn Resorts elects.
On February 18, 2012, after receiving the Freeh Report, the Board of Directors of Wynn Resorts determined that the Okada Parties were “unsuitable” within the meaning of Article VII of Wynn Resorts’ articles of incorporation and redeemed all of Aruze’s shares of Wynn Resorts’ common stock. See Item 3—“Legal Proceedings” and Item 8—“Financial Statements and Supplementary Data”, Note 17 “Commitments and Contingencies”.
Nevada and Massachusetts regulatory authorities also have broad powers to request detailed financial and other information, to limit, condition, suspend or revoke a registration, gaming license or related approvals, approve changes in our operations and levy fines or require forfeiture of assets for violations of gaming laws or regulations. Complying with gaming laws, regulations and license requirements is costly. Any change in the Nevada and Massachusetts laws, regulations or licenses applicable to our business or a violation of any current or future laws or regulations applicable to our business or gaming licenses could require us to make substantial expenditures and forfeit assets, and would negatively affect our gaming operations.
22
Wynn Macau’s operations are subject to unique risks. Failure to adhere to the regulatory and gaming environment in Macau could result in the revocation of Wynn Macau’s concession or otherwise negatively affect its operations in Macau. Moreover, we are subject to the risk that U.S. regulators could determine that Macau’s gaming regulatory framework has not developed in a way that would permit us to conduct operations in Macau in a manner consistent with the way in which we intend, or the Nevada gaming authorities require us, to conduct our operations in the United States.
Compliance with changing laws and regulations may result in additional expenses and compliance risks.
Changing laws and regulations are creating uncertainty for gaming companies. These changing laws and regulations are subject to varying interpretations in many cases due to their lack of specificity, recent issuance and/or lack of guidance. As a result, their application in practice may evolve over time as new guidance is provided by regulatory and governing bodies. In addition, further regulation of casinos, financial institutions and public companies is possible. This could result in continuing uncertainty and higher costs regarding compliance matters. Due to our commitment to maintain high standards of compliance with laws and public disclosure, our efforts to comply with evolving laws, regulations and standards have resulted in and are likely to continue to result in increased general and administrative expense. In addition, we are subject to different parties' interpretation of our compliance with these new and changing laws and regulations.
Win rates for our gaming operations depend on a variety of factors, some of which are beyond our control.
The gaming industry is characterized by an element of chance. In addition to the element of chance, win rates are also affected by other factors, including players’ skill and experience, the mix of games played, the financial resources of players, the spread of table limits, the volume of bets played and the amount of time played. Our gaming profits are mainly derived from the difference between our casino winnings and the casino winnings of our gaming customers. Since there is an inherent element of chance in the gaming industry, we do not have full control over our winnings or the winnings of our gaming customers.
Our information technology and other systems are subject to cyber security risk including misappropriation of customer information or other breaches of information security.
We rely on information technology and other systems (including those maintained by third-parties with whom we contract to provide data services) to maintain and transmit large volumes of customer financial information, credit card settlements, credit card funds transmissions, mailing lists and reservations information and other personally identifiable information. We also maintain important internal company data such as personally identifiable information about our employees and information relating to our operations. The systems and processes we have implemented to protect customers, employees and company information are subject to the ever-changing risk of compromised security. These risks include cyber and physical security breaches, system failure, computer viruses, and negligent or intentional misuse by customers, company employees, or employees of third party vendors. The steps we take to deter and mitigate these risks may not be successful and our insurance coverage for protecting against cybersecurity risks may not be sufficient. Our third-party information system service providers face risks relating to cybersecurity similar to ours, and we do not directly control any of such parties’ information security operations. A significant theft, loss or fraudulent use of customer or company data maintained by us or by a third-party service provider could have an adverse effect on our reputation, cause a material disruption to our operations and management team, and result in remediation expenses, regulatory penalties and litigation by customers and other parties whose information was subject to such attacks, all of which could have a material adverse effect on our business, results of operations and cash flows.
Our collection and use of personal data are governed by privacy laws and regulations and privacy law is an area that changes often and varies significantly by jurisdiction. Compliance with applicable privacy regulations may increase our operating costs and/or adversely impact our ability to market our products, properties and services to our guests. In addition, non-compliance with applicable privacy regulations by us (or in some circumstances non-compliance by third parties engaged by us) or a breach of security on systems storing our data may result in damage of reputation and/or subject us to fines, payment of damages, lawsuits or restrictions on our use or transfer of data.
Our insurance coverage may not be adequate to cover all possible losses that we could suffer, including losses resulting from terrorism, and our insurance costs may increase.
We have comprehensive property and liability insurance policies for our properties with coverage features and insured limits that we believe are customary in their breadth and scope. However, in the event of a substantial loss, the insurance
23
coverage we carry may not be sufficient to pay the full market value or replacement cost of our lost investment or could result in certain losses being totally uninsured. As a result, we could lose some or all of the capital we have invested in a property, as well as the anticipated future revenue from the property, and we could remain obligated for debt or other financial obligations related to the property.
Market forces beyond our control may limit the scope of the insurance coverage we can obtain in the future or our ability to obtain coverage at reasonable rates. Certain catastrophic losses may be uninsurable or too expensive to justify obtaining insurance. As a result, if we suffer such a catastrophic loss, we may not be successful in obtaining future insurance without increases in cost or decreases in coverage levels. Furthermore, our debt instruments and other material agreements require us to maintain a certain minimum level of insurance. Failure to satisfy these requirements could result in an event of default under these debt instruments or material agreements, which would negatively affect our business and financial condition.
Our business is particularly sensitive to the willingness of our customers to travel. Acts of terrorism, regional political events and developments in the conflicts in certain countries could cause severe disruptions in air travel that reduce the number of visitors to our facilities, resulting in a material adverse effect on our business and financial condition, results of operations or cash flows.
We are dependent on the willingness of our customers to travel. Only a small amount of our business is and will be generated by local residents. Most of our customers travel to reach our Las Vegas and Macau properties. Acts of terrorism may severely disrupt domestic and international travel, which would result in a decrease in customer visits to Las Vegas and Macau, including our properties. Regional conflicts could have a similar effect on domestic and international travel. Disruptions in air or other forms of travel as a result of any further terrorist act, outbreak of hostilities or escalation of war or worldwide infectious disease outbreak would have an adverse effect on our business and financial condition, results of operations or cash flows.
We are a parent company and our primary source of cash is and will be distributions from our subsidiaries.
We are a parent company with limited business operations of our own. Our main asset is the capital stock of our subsidiaries. We conduct most of our business operations through our direct and indirect subsidiaries. Accordingly, our primary sources of cash are dividends and distributions with respect to our ownership interests in our subsidiaries that are derived from the earnings and cash flow generated by our operating properties. Our subsidiaries might not generate sufficient earnings and cash flow to pay dividends or distributions in the future.
Our subsidiaries’ payments to us will be contingent upon their earnings and upon other business considerations. In addition, our subsidiaries’ debt instruments and other agreements limit or prohibit certain payments of dividends or other distributions to us. We expect that future debt instruments for the financing of our other developments will contain similar restrictions. An inability of our subsidiaries to pay us dividends and distributions would have a significant negative effect on our liquidity.
If a third party successfully challenges our ownership of, or right to use, the Wynn-related trademarks and/or service marks, our business or results of operations could be harmed.
Our intellectual property assets, especially the logo version of “Wynn,” are among our most valuable assets. We have filed applications with the PTO and with various foreign patent and trademark registries including registries in Macau, China, Hong Kong, Singapore, Taiwan, Japan, certain European countries and various other jurisdictions throughout the world, to register a variety of WYNN-related trademarks and service marks in connection with a variety of goods and services. These marks include “WYNN RESORTS,” “WYNN DESIGN AND DEVELOPMENT,” “WYNN LAS VEGAS,” “WYNN MACAU,” “WYNN PALACE” and “ENCORE.” Some of the applications are based upon ongoing use and others are based upon a bona fide intent to use the marks in the future.
A common element of most of these marks is the use of the surname “WYNN.” As a general rule, a surname (or the portion of a mark primarily constituting a surname) is not eligible for registration unless the surname has acquired “secondary meaning.” To date, we have been successful in demonstrating to the PTO such secondary meaning for the Wynn name, in certain of the applications, based upon factors including Mr. Wynn’s prominence as a resort developer, but we cannot assure you that we will be successful with the other pending applications.
Federal registrations are not completely dispositive of the right to such marks. Third parties who claim prior rights with respect to similar marks may nonetheless challenge our right to obtain registrations or our use of the marks and seek to overcome the presumptions afforded by such registrations.
24
Furthermore, due to the increased use of technology in computerized gaming machines and in business operations generally, other forms of intellectual property rights (such as patents and copyrights) are becoming of increased relevance. It is possible that, in the future, third parties might assert superior intellectual property rights or allege that their intellectual property rights cover some aspect of our operations. The defense of such allegations may result in substantial expenses, and, if such claims are successfully prosecuted, may have a material impact on our business. Efforts we take to acquire and protect our intellectual property rights against unauthorized use throughout the world, which may include retaining counsel and commencing litigation in various jurisdictions, may be costly and may not be successful in protecting and preserving the status and value of our intellectual property assets.
We are subject to taxation by various governments and agencies. The rate of taxation could change.
We are subject to tax by various governments and agencies, both in the U.S. and in Macau. Changes in the rates of taxation, the amount of taxes we owe and the time when income is subject to taxation, our ability to claim U.S. foreign tax credits, failure to renew our Macau dividend agreement and Macau income tax exemption after 2015 and the imposition of foreign withholding taxes could increase our overall rate of taxation.
Because we own real property, we are subject to extensive environmental regulation, which creates uncertainty regarding future environmental expenditures and liabilities.
We have incurred costs to comply with environmental requirements, such as those relating to discharges into the air, water and land, the handling and disposal of solid and hazardous waste and the cleanup of properties affected by hazardous substances. Under these and other environmental requirements we may be required to investigate and clean up hazardous or toxic substances or chemical releases at our property. As an owner or operator, we could also be held responsible to a governmental entity or third parties for property damage, personal injury and investigation and cleanup costs incurred by them in connection with any contamination.
These laws typically impose cleanup responsibility and liability without regard to whether the owner or operator knew of or caused the presence of the contaminants. The liability under those laws has been interpreted to be joint and several unless the harm is divisible and there is a reasonable basis for allocation of the responsibility. The costs of investigation, remediation or removal of those substances may be substantial, and the presence of those substances, or the failure to remediate a property properly, may impair our ability to use our property.
Contamination has been identified at and in the vicinity of our site in Everett, Massachusetts. The ultimate cost of remediating contaminated sites is difficult to accurately predict and we could exceed our current estimates. While we believe that we have adequate resources to cover the costs of the cleanup, we may be required to conduct additional investigations and remediation with respect to this site. As a result, we also could incur material costs in excess of our estimates as a result of additional cleanup obligations imposed or contamination identified in the future. Our proposed expenditures related to environmental matters are not currently expected to have a material adverse effect on our business, financial condition or results of operations. However, the environmental laws under which we operate are complicated and often increasingly more stringent, and may be applied retroactively. Accordingly, we may be required to make additional expenditures to remain in, or to achieve compliance with, environmental laws in the future.
Risks Associated with our Macau Operations
We depend upon games promoters for a significant portion of our gaming revenue. If we are unable to maintain, or develop additional, successful relationships with reputable games promoters, our ability to maintain or grow our gaming revenues could be adversely affected.
We may lose the clientele of our games promoters, who generate a significant portion of our gaming revenue. There is intense competition among casino operators in Macau for services provided by games promoters, which we expect to intensify as additional casinos open in Macau. If we are unable to maintain, or develop additional, successful relationships with reputable games promoters, or lose a significant number of our games promoters to our competitors, our ability to maintain or grow our gaming revenues will be adversely affected and we will have to seek alternative ways of developing relationships with VIP customers. In addition, if our games promoters are unable to develop or maintain relationships with our VIP customers, our ability to maintain or grow our gaming revenues will be hampered.
25
Increased competition for the services of games promoters may require us to pay increased commission rates to games promoters.
Certain games promoters have significant leverage and bargaining strength in negotiating operational agreements with casino operators. This leverage could result in games promoters negotiating changes to our operational agreements, including higher commissions, or the loss of business to a competitor or the loss of certain relationships with games promoters. If we need to increase our commission rates or otherwise change our practices with respect to games promoters due to competitive forces, our results of operations could be adversely affected.
Failure by the games promoters with whom we work to comply with Macau gaming laws and high standards of probity and integrity might affect our reputation and ability to comply with the requirements of our concession, Macau gaming laws and other gaming licenses.
The reputations and probity of the games promoters with whom we work are important to our own reputation and to our ability to operate in compliance with our concession, Macau gaming laws and other gaming licenses. We conduct periodic reviews of the probity and compliance programs of our gaming promoters. However, we are not able to control our games promoters’ compliance with these high standards of probity and integrity, and our games promoters may violate provisions in their contracts with us designed to ensure such compliance. In addition, if we enter into a new business relationship with a games promoter whose probity is in doubt, this may be considered by regulators or investors to reflect negatively on our own probity. If our games promoters are unable to maintain required standards of probity and integrity, we may face consequences from gaming regulators with authority over our operations. Furthermore, if any of our games promoters violate the Macau gaming laws while on our premises, the Macau government may, in its discretion, take enforcement action against us, the games promoter, or each concurrently, and we may be sanctioned and our reputation could be harmed.
The financial resources of our games promoters may be insufficient to allow them to continue doing business in Macau which could adversely affect our business and financial condition. Our games promoters may experience difficulty in attracting patrons.
Given present market conditions in Macau and certain economic and other factors occurring in the region, games promoters may encounter difficulties in attracting patrons to come to Macau. Further, gaming promoters may experience decreased liquidity, limiting their ability to grant credit to their patrons, resulting in decreased gaming volume in Macau and at Wynn Macau. Credit already extended by our games promoters to their patrons may become increasingly difficult for them to collect. This inability to attract sufficient patrons, grant credit and collect amounts due in a timely manner can negatively affect our games promoters’ operations, cause games promoters to wind up or liquidate their operations or result in our gaming promoters leaving Macau, and as a result, our results of operations could be adversely impacted.
Revenues from our Macau gaming operations will end if we cannot secure an extension of our concession in 2022 or if the Macau government exercises its redemption right in 2017.
Our concession agreement with the Macau government expires in June 2022. Unless our concession is extended, in June 2022, all of our gaming operations and related equipment in Macau will be automatically transferred to the Macau government without compensation to us and we will cease to generate any revenues from these operations. Beginning in June 2017, the Macau government may redeem the concession agreement by providing us at least one year’s prior notice. In the event the Macau government exercises this redemption right, we are entitled to fair compensation or indemnity. The amount of such compensation or indemnity will be determined based on the amount of revenue generated during the tax year prior to the redemption multiplied for the remaining years under the concession. We may not be able to renew or extend our concession agreement on terms favorable to us or at all and, if our concession is redeemed, the compensation paid to us may not be adequate to compensate us for the loss of future revenues. The redemption of or failure to extend our concession would have a material adverse effect on our results of operations.
If Wynn Macau fails to comply with the concession agreement, the Macau government can terminate our concession without compensation to us, which would have a material adverse effect on our business and financial condition.
The Macau government has the right to unilaterally terminate our concession in the event of our material non-compliance with the basic obligations under the concession and applicable Macau laws. The concession agreement expressly provides that the government of Macau may unilaterally rescind the concession agreement if Wynn Macau:
|
•
|
conducts unauthorized games or activities that are excluded from its corporate purpose;
|
26
|
•
|
suspends gaming operations in Macau for more than seven consecutive days (or more than 14 days in a civil year) without justification;
|
|
•
|
defaults in payment of taxes, premiums, contributions or other required amounts;
|
|
•
|
does not comply with government inspections or supervision;
|
|
•
|
systematically fails to observe its obligations under the concession system;
|
|
•
|
fails to maintain bank guarantees or bonds satisfactory to the government;
|
|
•
|
is the subject of bankruptcy proceedings or becomes insolvent;
|
|
•
|
engages in serious fraudulent activity, damaging to the public interest; or
|
|
•
|
repeatedly violates applicable gaming laws.
|
If the government of Macau unilaterally rescinds the concession agreement, Wynn Macau will be required to compensate the government in accordance with applicable law, and the areas defined as casino space under Macau law and all of the gaming equipment pertaining to our gaming operations will be transferred to the government without compensation. The loss of our concession would prohibit us from conducting gaming operations in Macau, which would have a material adverse effect on our business and financial condition.
Our Macau subsidiaries’ indebtedness is secured by a substantial portion of their assets.
Subject to applicable laws, including gaming laws, and certain agreed upon exceptions, our Macau subsidiaries’ debt is secured by liens on substantially all of their assets. In the event of a default by such subsidiaries under their financing documents, or if such subsidiaries experience insolvency, liquidation, dissolution or reorganization, the holders of such secured debt would first be entitled to payment from their collateral security, and only then would holders of our Macau subsidiaries’ unsecured debt be entitled to payment from their remaining assets.
We compete for limited labor resources in Macau and Macau government policies may also affect our ability to employ imported labor.
The success of our operations in Macau will be affected by our success in hiring and retaining employees. We compete with a large number of casino resorts in Macau for a limited number of qualified employees. In addition, the Macau government requires that we only hire Macau residents as dealers in our casinos. Competition for these individuals in Macau is likely to increase as we open Wynn Palace, and as other competitors expand their operations. We have to seek employees from other countries to adequately staff our resort and certain Macau government policies affect our ability to import labor in certain job classifications. Despite our coordination with the Macau labor and immigration authorities to assure that our labor needs are satisfied, we may not be able to recruit and retain a sufficient number of qualified employees for our operations or obtain required work permits for those employees. If we are unable to obtain, attract, retain and train skilled employees, our ability to adequately manage and staff our existing and planned casino and resort properties in Macau could be impaired, which could have a material adverse effect on our business, financial condition, results of operations or cash flows.
Wynn Macau may be affected by adverse political and economic conditions.
Our Macau operations are subject to significant political, economic and social risks inherent in doing business in an emerging market. Macau’s legislative, regulatory, legal, economic and cultural institutions are in a period of transition. The continued success of Wynn Macau will depend on political and economic conditions in Macau and mainland China. For example, fiscal decline and civil, domestic or international unrest in Macau, China or the surrounding region could significantly harm our business, not only by reducing customer demand for casino resorts, but also by increasing the risk of imposition of taxes and exchange controls or other governmental restrictions, laws or regulations that might impede Wynn Macau’s operations or ability to repatriate funds.
We are currently required to complete Wynn Palace by May 2017. If we are unable to meet this deadline, we may lose the respective land concession, which could prohibit us from operating any facilities developed under such land concession.
The Company has capitalized approximately $1.8 billion, including the land premium (net of amortization) and $148.4 million in outstanding construction payables, as of December 31, 2014. Under the Company’s land concession for Wynn Palace, the Company is required to complete the development by May 2017. Should the Company determine that it is unable to complete Wynn Palace by this deadline, the Company would expect to apply for an extension from the Macau government. If the Company is unable to meet the current deadline and the deadline for the development is not extended, the Company could lose its land concession for Wynn Palace, which would prohibit the Company from operating any facilities developed under the land concession. As a result, the Company could record a charge for all or some portion of its capitalized construction costs and land premiums (net of amortization).
27
Macau may not have an adequate transportation infrastructure to accommodate the demand from future development.
Because of additional casino projects which are under construction and to be developed in the future, the ferry and helicopter services which provide transportation between Macau and Hong Kong may need to be expanded to accommodate the increased visitation of Macau. If transportation facilities to and from Macau are inadequate to meet the demands of an increased volume of gaming customers visiting Macau, the desirability of Macau as a gaming destination, as well as the results of operations of Wynn Macau, could be negatively impacted.
The smoking control legislation in Macau could have an adverse effect on our business, financial condition, results of operations or cash flows.
In 2014, the Macau government approved smoking control legislation, which prohibits smoking in casinos starting on October 6, 2014. The legislation, however, permits casinos to maintain certain limited smoking areas open to VIP patrons if such areas are within restricted access areas, comply with certain square footage ratios based on overall gaming area square footage and comply with the conditions set out in the Dispatch of the Chief Executive, dated November 1, 2012, as amended by the Dispatch of the Chief Executive, dated June 3, 2014. Recent public announcements by the Macau government indicate that the Macau government intends to pursue a full smoking ban within all Macau casinos. The existing smoking legislation, and any smoking legislation intended to fully ban all smoking in casinos, may deter potential gaming customers who are smokers from frequenting casinos in Macau and disrupt the number of patrons visiting or the amount of time visiting patrons spend at our property, which could have a material adverse effect on our business, financial condition, results of operations and cash flows.
Extreme weather conditions may have an adverse impact on Wynn Macau.
Macau’s subtropical climate and location on the South China Sea are subject to extreme weather conditions including typhoons and heavy rainstorms. Unfavorable weather conditions could negatively affect the profitability of our resort complex and prevent or discourage guests from traveling to Macau.
Conflicts of interest may arise because certain of our directors and officers are also directors of Wynn Macau, Limited.
In October 2009, Wynn Macau, Limited, an indirect wholly owned subsidiary of Wynn Resorts and the developer, owner and operator of Wynn Macau, listed its ordinary shares of common stock on The Stock Exchange of Hong Kong Limited. Wynn Macau, Limited sold through an initial public offering, 1,437,500,000 shares, 27.7% of this subsidiary’s common stock. As a result of Wynn Macau, Limited having stockholders who are not affiliated with us, we and certain of our officers and directors who also serve as officers and/or directors of Wynn Macau, Limited may have conflicting fiduciary obligations to our stockholders and to the minority stockholders of Wynn Macau, Limited. Decisions that could have different implications for Wynn Resorts and Wynn Macau, Limited, including contractual arrangements that we have entered into or may in the future enter into with Wynn Macau, Limited, may give rise to the appearance of a potential conflict of interest.
Certain Nevada gaming laws apply to Wynn Macau’s gaming activities and associations.
Certain Nevada gaming laws also apply to gaming activities and associations in jurisdictions outside the State of Nevada. With respect to our Wynn Macau operations, we and our subsidiaries that must be licensed to conduct gaming operations in Nevada are required to comply with certain reporting requirements concerning gaming activities and associations in Macau conducted by our Macau-related subsidiaries. We and our licensed Nevada subsidiaries also will be subject to disciplinary action by the Nevada Gaming Commission if our Macau-related subsidiaries:
|
•
|
knowingly violate any Macau laws relating to their Macau gaming operations;
|
|
•
|
fail to conduct Wynn Macau’s operations in accordance with the standards of honesty and integrity required of Nevada gaming operations;
|
|
•
|
engage in any activity or enter into any association that is unsuitable for us because it poses an unreasonable threat to the control of gaming in Nevada, reflects or tends to reflect discredit or disrepute upon the State of Nevada or gaming in Nevada, or is contrary to Nevada gaming policies;
|
|
•
|
engage in any activity or enter into any association that interferes with the ability of the State of Nevada to collect gaming taxes and fees; or
|
|
•
|
employ, contract with or associate with any person in the foreign gaming operation who has been denied a license or a finding of suitability in Nevada on the ground of unsuitability, or who has been found guilty of cheating at gambling.
|
28
Such disciplinary action could include suspension, conditioning, limitation or revocation of the registration, licenses or approvals held by us and our licensed Nevada subsidiaries, including Wynn Las Vegas, LLC, and the imposition of substantial fines.
In addition, if the Nevada State Gaming Control Board determines that any actual or intended activities or associations of our Macau-related subsidiaries may be prohibited pursuant to one or more of the standards described above, the Nevada State Gaming Control Board can require us and our licensed Nevada subsidiaries to file an application with the Nevada Gaming Commission for a finding of suitability of the activity or association. If the Nevada Gaming Commission finds that the activity or association in Macau is unsuitable or prohibited, our Macau-related subsidiaries will either be required to terminate the activity or association, or will be prohibited from undertaking the activity or association. Consequently, should the Nevada Gaming Commission find that our Macau-related subsidiary’s gaming activities or associations in Macau are unsuitable, those subsidiaries may be prohibited from undertaking their planned gaming activities or associations in Macau, or be required to divest their investment in Macau, possibly on unfavorable terms.
Unfavorable changes in currency exchange rates may increase Wynn Macau’s obligations under the concession agreement and cause fluctuations in the value of our investment in Macau.
The currency delineated in Wynn Macau’s concession agreement with the government of Macau is the Macau pataca. The Macau pataca, which is not a freely convertible currency, is linked to the Hong Kong dollar, and the two are often used interchangeably in Macau. The Hong Kong dollar is linked to the U.S. dollar and the exchange rate between these two currencies has remained relatively stable over the past several years. However, the exchange linkages of the Hong Kong dollar and the Macau pataca, and the Hong Kong dollar and the U.S. dollar, are subject to potential changes due to changes in Chinese governmental policies and international economic and political developments.
If the Hong Kong dollar and the Macau pataca are no longer linked to the U.S. dollar, the exchange rate for these currencies may severely fluctuate. The current rate of exchange fixed by the applicable monetary authorities for these currencies may also change.
Because many of Wynn Macau’s payment and expenditure obligations are in Macau patacas, in the event of unfavorable Macau pataca or Hong Kong dollar rate changes, Wynn Macau’s obligations, as denominated in U.S. dollars, would increase. In addition, because we expect that most of the revenues for any casino that we operate in Macau will be in Hong Kong dollars, we are subject to foreign exchange risk with respect to the exchange rate between the Hong Kong dollar and the U.S. dollar. Also, if any of our Macau-related entities incur U.S. dollar-denominated debt, fluctuations in the exchange rates of the Macau pataca or the Hong Kong dollar, in relation to the U.S. dollar, could have adverse effects on our results of operations, financial condition and ability to service its debt.
Currency exchange controls and currency export restrictions could negatively impact Wynn Macau.
Currency exchange controls and restrictions on the export of currency by certain countries may negatively impact the success of Wynn Macau. For example, there are currently existing currency exchange controls and restrictions on the export of the renminbi, the currency of China. Restrictions on the export of the renminbi may impede the flow of gaming customers from China to Macau, inhibit the growth of gaming in Macau and negatively impact Wynn Macau’s gaming operations.
Risks Related to Share Ownership and Stockholder Matters
Our largest stockholders are able to exert significant influence over our operations and future direction.
As of December 31, 2014, Mr. Wynn and Elaine P. Wynn own 10,026,708 shares and 9,608,334 shares, respectively, or in the aggregate approximately 19.4%, of our outstanding common stock. As a result, Mr. Wynn and Elaine P. Wynn, to the extent they vote their shares in a similar manner, may be able to exert significant influence over all matters requiring our stockholders’ approval, including the approval of significant corporate transactions. In addition, until February 2012, Aruze owned 24,549,222 shares of our outstanding common stock. On February 18, 2012, the Company redeemed all of the shares of the Company’s common stock held by Aruze For additional information on the redemption, see Item 8—“Financial Statements and Supplementary Data”, Note 17 “Commitments and Contingencies”.
Under the Stockholders Agreement, Mr. Wynn and Elaine P. Wynn have agreed to vote the shares of the Company’s common stock held by them subject to the terms of the Stockholders Agreement in a manner so as to elect to our Board of
29
Directors each of the nominees contained on each and every slate of directors endorsed by Mr. Wynn, which slate will include, subject to certain exceptions, Elaine P. Wynn. As a result of this voting arrangement, Mr. Wynn, as a practical matter, exercises significant influence over the slate of directors to be elected to our Board of Directors. In addition, with stated exceptions, the Stockholders Agreement requires the written consent of the other party prior to any party selling any shares of the Company’s common stock that it owns.
In June 2012, in connection with the pending litigation between the Company and Aruze, Elaine P. Wynn submitted a cross claim against Mr. Wynn and Mr. Okada seeking to void the Stockholders Agreement. Certain Wynn Las Vegas, LLC indentures provide that if Mr. Wynn, together with certain related parties, in the aggregate beneficially owns a lesser percentage of the outstanding common stock of the Company than is beneficially owned by any other person, a change of control will have occurred. If Elaine P. Wynn prevails in her cross claim, Mr. Wynn would not beneficially own or control Elaine P. Wynn’s shares and a change in control may result under the Wynn Las Vegas, LLC debt documents. For additional information on the cross claim, see Item 8—“Financial Statements and Supplementary Data”, Note 8 “Long-Term Debt” and Note 17 “Commitments and Contingencies”.
In November 2006, the Board of Directors of Wynn Resorts approved an amendment of its bylaws that exempts future acquisitions of shares of Wynn Resorts’ common stock by either Mr. Wynn or Aruze from Nevada’s acquisition of controlling interest statutes. In light of the determination by the Board of Directors on February 18, 2012 that each of the Okada Parties is an “Unsuitable Person” under the Company’s articles of incorporation and the redemption and cancellation of Aruze’s shares of Company common stock, our Fifth Amended and Restated Bylaws amended these provisions to delete the reference to Aruze and its affiliates. The Nevada acquisition of controlling interest statutes require stockholder approval in order to exercise voting rights in connection with any acquisition of a controlling interest in certain Nevada corporations unless the articles of incorporation or bylaws of the corporation in effect on the 10th day following the acquisition of a controlling interest by certain acquiring persons provide that these statutes do not apply to the corporation or to the acquisition specifically by types of existing or future stockholders. These statutes define a “controlling interest” as (i) one-fifth or more but less than one third, (ii) one-third or more but less than a majority, or (iii) a majority or more, of the voting power in the election of directors. As a result of these bylaws provisions, Mr. Wynn or his affiliates may acquire ownership of outstanding voting shares of Wynn Resorts permitting him or them to exercise more than one-third but less than a majority, or a majority or more, of all of the voting power of the Company in the election of directors, without requiring a resolution of the Company’s stockholders granting voting rights in the control shares acquired.
Our stock price may be volatile.
The trading price of our common stock may be subject to wide fluctuations. Our stock price may fluctuate in response to a number of events and factors, such as general United States, China, and world economic and financial conditions, our own quarterly variations in operating results, increased competition, changes in financial estimates and recommendations by securities analysts, changes in applicable laws or regulations, and changes affecting the travel industry. The stock market in general, and prices for companies in our industry in particular, has experienced extreme volatility that may be unrelated to the operating performance of a particular company. These broad market and industry fluctuations may adversely affect the price of our common stock, regardless of our operating performance.
Risks Related to our Substantial Indebtedness
We are highly leveraged and future cash flow may not be sufficient for us to meet our obligations, and we might have difficulty obtaining more financing.
We have a substantial amount of consolidated debt in relation to our equity. As of December 31, 2014, we had total outstanding debt of approximately
$7.3 billion
, which includes a portion of the funds we expect to need for the development and construction of our projects, Wynn Palace and the Wynn resort in Massachusetts. We may, however, incur additional indebtedness in connection with the construction of these projects. See Item 1—“Business”, “Construction and Development Opportunities”. In addition, we are permitted to incur additional indebtedness if certain conditions are met, including conditions under our Wynn Macau credit facilities, our Wynn America credit facilities and our Wynn Las Vegas, LLC indentures in connection with other future potential development plans. On February 18, 2012, we issued a Redemption Note with a principal amount of approximately $1.94 billion in redemption of all of the shares of Wynn Resorts common stock held by Aruze. For additional information on the redemption and the Redemption Note, see Item 3—“Legal Proceedings” and Item 8—“Financial Statements and Supplementary Data”, Note 17 “Commitments and Contingencies”.
Our substantial indebtedness could have important consequences. For example:
30
|
•
|
failure to meet our payment obligations or other obligations could result in acceleration of our indebtedness, foreclosure upon our assets that serve as collateral or bankruptcy and trigger cross defaults under other agreements;
|
|
•
|
servicing our indebtedness requires a substantial portion of our cash flow from the operations of Wynn Las Vegas and Wynn Macau and reduces the amount of available cash, if any, to fund working capital and other cash requirements;
|
|
•
|
The Okada Parties have challenged the redemption of Aruze’s shares and we are currently involved in litigation with those parties as well as related shareholder derivative litigation. The outcome of these various proceedings cannot be predicted. Any adverse judgments or settlements involving payment of a material sum of money could cause a material adverse effect on our financial condition and results of operations and could expose us to additional claims by third parties including current or former investors or regulators. Any adverse judgments or settlements would reduce our profits and could limit our ability to operate our business. See Item 3—“Legal Proceedings” and Item 8—“Financial Statements and Supplementary Data”, Note 17 “Commitments and Contingencies”;
|
|
•
|
we may experience decreased revenues from our operations due to decreased consumer spending levels and high unemployment, and could fail to generate sufficient cash to fund our liquidity needs and/or fail to satisfy the financial and other restrictive covenants to which we are subject under our existing indebtedness. Our business may not generate sufficient cash flow from operations to pay our indebtedness or to fund our other liquidity needs;
|
|
•
|
we may not be able to obtain additional financing, if needed, to satisfy working capital requirements or pay for other capital expenditures, debt service or other obligations; and
|
|
•
|
rates with respect to a portion of the interest we pay will fluctuate with market rates and, accordingly, our interest expense will increase if market interest rates increase.
|
Under the terms of the documents governing our debt facilities, subject to certain limitations, we are permitted to incur indebtedness. If we incur additional indebtedness, the risks described above will be exacerbated.
The agreements governing our debt facilities contain certain covenants that restrict our ability to engage in certain transactions and may impair our ability to respond to changing business and economic conditions.
Some of our debt facilities require us to satisfy various financial covenants, which include requirements for minimum interest coverage ratios and leverage ratios pertaining to total debt to earnings before interest, tax, depreciation and amortization and a minimum earnings before interest, tax, depreciation and amortization. For more information on financial covenants we are subject to under our debt facilities, see Item 8—"Financial Statements and Supplementary Data”, Note 8 “Long-Term Debt." Future indebtedness or other contracts could contain covenants more restrictive than those contained in our existing debt facilities.
The agreements governing our debt facilities also contain restrictions on our ability to engage in certain transactions and may limit our ability to respond to changing business and economic conditions. These restrictions include, among other things, limitations on our ability and the ability of our restricted subsidiaries to:
|
•
|
pay dividends or distributions or repurchase equity;
|
|
•
|
incur additional debt;
|
|
•
|
make investments;
|
|
•
|
create liens on assets to secure debt;
|
|
•
|
enter into transactions with affiliates;
|
|
•
|
issue stock of, or member’s interests in, subsidiaries;
|
|
•
|
enter into sale-leaseback transactions;
|
|
•
|
engage in other businesses;
|
|
•
|
merge or consolidate with another company;
|
|
•
|
transfer, sell or otherwise dispose of assets;
|
|
•
|
issue disqualified stock;
|
|
•
|
create dividend and other payment restrictions affecting subsidiaries; and
|
|
•
|
designate restricted and unrestricted subsidiaries.
|
Our ability to comply with the terms of our outstanding facilities may be affected by general economic conditions, industry conditions and other events outside of our control. As a result, we may not be able to maintain compliance with these covenants. If our or our properties’ operations fail to generate adequate cash flow, we may violate those covenants, causing a default under our agreements, which would materially and adversely affect our operating results and our financial condition or result in our lenders or holders of our debt taking action to enforce their security interests in our various assets or cause all outstanding amounts to be due and payable immediately.
31
None.
Macau Land Concessions
The government of Macau owns most of the land in Macau. In most cases, private interests in real property located in Macau are obtained through long-term leases known as concessions and other grants of rights to use land from the government. In July 2004, our subsidiary, Wynn Macau, entered into a land concession contract under which Wynn Macau leases from the Macau government an approximately 16-acre parcel of land in downtown Macau’s inner harbor area where Wynn Macau is located. The term of the land concession contract is 25 years from August 2004, and it may be renewed with government approval for successive periods. Wynn Macau paid a land concession premium of approximately 319.4 million Macau patacas (approximately US $40 million) for this land concession. In 2009, the Company and the Macau government agreed to modify this land concession as a result of the expansion of Wynn Macau with Encore at Wynn Macau and the additional square footage that was added as a result of such expansion. In November 2009, the Company made an additional one-time land premium payment of approximately 113.4 million Macau patacas (approximately US $14.2 million). Annual rent of approximately 4.2 million Macau patacas (approximately US $525,000) is being paid in accordance with the land concession contract.
In September 2011, Palo and Wynn Macau SA, each an indirect subsidiary of Wynn Macau Limited, formally accepted the terms and conditions of a draft land concession contract from the Macau government for approximately 51 acres of land in the Cotai area of Macau. On May 2, 2012, the land concession contract was gazetted by the government of Macau evidencing the final step in the granting of the land concession. We are currently constructing Wynn Palace in the Cotai area of Macau, an integrated resort containing a
1,700
-room hotel, performance lake, meeting space, casino, spa, retail offerings and food and beverage outlets. The total project budget, including construction costs, capitalized interest, pre-opening expenses, land costs and financing fees, is
$4.1 billion
. As of
December 31, 2014
, we have invested approximately
$1.8 billion
in the project. We continue to remain on schedule for an opening in the first half of 2016.
Las Vegas Land
We own approximately 238 acres of land on or near the Las Vegas Strip consisting of approximately 75 acres at the northeast corner of the intersection of Las Vegas Boulevard and Sands Avenue, on which Wynn Las Vegas is located, the approximately 140-acre golf course behind Wynn Las Vegas, approximately 5 acres adjacent to the golf course on which an office building is located, and approximately 18 acres located across from the Wynn Las Vegas site at Koval Lane and Sands Avenue, a portion of which is improved with an employee parking garage and an office building.
Las Vegas Water Rights
We own approximately 834 acre-feet of permitted and certificated water rights, which we currently use to irrigate the golf course. We also own approximately 151.5 acre-feet of permitted and certificated water rights for commercial use. There are significant cost savings and conservation benefits associated with using water supplied pursuant to our water rights. We anticipate using our water rights to support future development of the golf course land.
Massachusetts Land
On January 2, 2015, we purchased 33 acres of land in Everett, Massachusetts, along the Mystic River. On this land, we intend to develop and operate an integrated resort containing a hotel, restaurants, casino, spa, premium retail offerings, meeting and convention space and a waterfront boardwalk.
We are occasionally party to lawsuits. As with all litigation, no assurance can be provided as to the outcome of such matters and we note that litigation inherently involves significant costs. For more information regarding the Company’s legal matters see Item 1A—“Risk Factors” and Item 8—“Financial Statements and Supplementary Data”, Note 17 “Commitments and Contingencies,” in this Annual Report on Form 10-K.
32
Determination of Unsuitability and Redemption of Aruze and Affiliates
On February 18, 2012, Wynn Resorts’ Gaming Compliance Committee received the Freeh Report detailing a pattern of misconduct by the Okada Parties. The factual record presented in the Freeh Report included evidence that the Okada Parties had provided valuable items to certain foreign gaming officials who were responsible for regulating gaming in a jurisdiction in which entities controlled by Mr. Okada were developing a gaming resort. Mr. Okada denied the impropriety of such conduct to members of the Board of Directors of Wynn Resorts and, while serving as one of the Company’s directors, Mr. Okada refused to acknowledge or abide by Wynn Resorts’ anti-bribery policies and refused to participate in the training all other directors received concerning these policies.
Based on the Freeh Report, the Board of Directors of Wynn Resorts determined that the Okada Parties are “unsuitable persons” under Article VII of the Company’s articles of incorporation. The Board of Directors was unanimous (other than Mr. Okada) in its determination. After authorizing the redemption of the Aruze shares, as discussed below, the Board of Directors took certain actions to protect the Company and its operations from any influence of an unsuitable person, including placing limitations on the provision of certain operating information to unsuitable persons and formation of an Executive Committee of the Board to manage the business and affairs of the Company during the period between each annual meeting. The Charter of the Executive Committee provides that “Unsuitable Persons” are not permitted to serve on the Committee. All members of the Board, other than Mr. Okada, were appointed to the Executive Committee on February 18, 2012. The Board of Directors also requested that Mr. Okada resign as a director of Wynn Resorts (under Nevada corporation law, a board of directors does not have the power to remove a director) and recommended that Mr. Okada be removed as a member of the Board of Directors of Wynn Macau, Limited. On February 18, 2012, Mr. Okada was removed from the Board of Directors of Wynn Las Vegas Capital Corp., an indirect wholly owned subsidiary of Wynn Resorts. On February 24, 2012, Mr. Okada was removed from the Board of Directors of Wynn Macau, Limited and on February 22, 2013, he was removed from the Board of Directors of Wynn Resorts by a stockholder vote in which 99.6% of the over 86 million shares voted were cast in favor of removal. Mr. Okada resigned from the Board of Directors of Wynn Resorts on February 21, 2013. Although the Company has retained the structure of the Executive Committee, the Board has resumed its past role in managing the business and affairs of the Company.
Based on the Board of Directors’ finding of “unsuitability,” on February 18, 2012, Wynn Resorts redeemed and canceled Aruze's 24,549,222 shares of Wynn Resorts’ common stock. Following a finding of “unsuitability,” Article VII of Wynn Resorts’ articles of incorporation authorizes redemption at “fair value” of the shares held by unsuitable persons. The Company engaged an independent financial advisor to assist in the fair value calculation and concluded that a discount to the then current trading price was appropriate because of, among other things, restrictions on most of the shares held by Aruze under the terms of the Stockholders Agreement (as defined below). Pursuant to its articles of incorporation, Wynn Resorts issued the Redemption Note to Aruze in redemption of the shares. The Redemption Note has a principal amount of $1.94 billion, matures on February 18, 2022, and bears interest at the rate of 2% per annum, payable annually in arrears on each anniversary of the date of the Redemption Note. The Company may, in its sole and absolute discretion, at any time and from time to time, and without penalty or premium, prepay the whole or any portion of the principal or interest due under the Redemption Note. In no instance shall any payment obligation under the Redemption Note be accelerated except in the sole and absolute discretion of Wynn Resorts or as specifically mandated by law. The indebtedness evidenced by the Redemption Note is and shall be subordinated in right of payment, to the extent and in the manner provided in the Redemption Note, to the prior payment in full of all existing and future obligations of Wynn Resorts or any of its affiliates in respect of indebtedness for borrowed money of any kind or nature.
The Company provided the Freeh Report to appropriate regulators and law enforcement agencies and has been cooperating with related investigations that such regulators and agencies have undertaken. The conduct of the Okada Parties and any resulting regulatory investigations could have adverse consequences to the Company and its subsidiaries. A finding by regulatory authorities that Mr. Okada violated anti-corruption statutes and/or other laws or regulations applicable to persons affiliated with a gaming licensee on Company property and/or otherwise involved the Company in criminal or civil violations could result in actions by regulatory authorities against the Company and its subsidiaries.
Redemption Action and Counterclaim
On February 19, 2012, Wynn Resorts filed a complaint in the Eighth Judicial District Court, Clark County, Nevada against the Okada Parties (as amended, the “Complaint”), alleging breaches of fiduciary duty and related claims (the “Redemption Action”) arising from the activities addressed in the Freeh Report. The Company is seeking compensatory and special damages as well as a declaration that it acted lawfully and in full compliance with its articles of incorporation, bylaws and other governing documents in redeeming and canceling the shares of Aruze.
33
On March 12, 2012, the Okada Parties removed the action to the United States District Court for the District of Nevada (the action was subsequently remanded to Nevada state court). On that same date, the Okada Parties filed an answer denying the claims and a counterclaim (as amended, the “Counterclaim”) that purports to assert claims against the Company and the Wynn Parties. The Counterclaim alleges, among other things: (1) that the shares of Wynn Resorts common stock owned by Aruze were exempt from the redemption-for-unsuitability provisions in the Wynn Resorts articles of incorporation (the “Articles”) pursuant to certain agreements executed in 2002; (2) that the Wynn Resorts directors who authorized the redemption of Aruze’s shares acted at the direction of Stephen A. Wynn and did not independently and objectively evaluate the Okada Parties’ suitability, and by so doing, breached their fiduciary duties; (3) that the Wynn Resorts directors violated the terms of the Wynn Resorts Articles by failing to pay Aruze fair value for the redeemed shares; and (4) that the terms of the Redemption Note that Aruze received in exchange for the redeemed shares, including the Redemption Note’s principal amount, duration, interest rate, and subordinated status, were unconscionable. Among other relief, the Counterclaim seeks a declaration that the redemption of Aruze’s shares was void, an injunction restoring Aruze’s share ownership, damages in an unspecified amount and rescission of the Amended and Restated Stockholders Agreement, dated as of January 6, 2010, by and among Aruze, Stephen A. Wynn, and Elaine Wynn (the “Stockholders Agreement”).
On June 19, 2012, Elaine Wynn asserted a cross claim against Stephen A. Wynn and Aruze seeking a declaration that (1) any and all of Elaine Wynn’s duties under the Stockholders Agreement shall be discharged; (2) the Stockholders Agreement is subject to rescission and is rescinded; (3) the Stockholders Agreement is an unreasonable restraint on alienation in violation of public policy; and/or (4) the restrictions on sale of shares shall be construed as inapplicable to Elaine Wynn. The indenture for Wynn Las Vegas, LLC's 4 1/4% Senior Notes due 2023 (the "2023 Indenture") provides that if Stephen A. Wynn, together with certain related parties, in the aggregate beneficially owns a lesser percentage of the outstanding common stock of the Company than are beneficially owned by any other person, a change of control will have occurred. The indenture for Wynn Las Vegas, LLC's 5 1/2% Senior Notes due 2025 (the "2025 Indenture") provides that if any event constitutes a "change of control" under the 2023 Indenture, it will constitute a change of control under the 2025 Indenture. If Elaine Wynn prevails in her cross claim, Stephen A. Wynn would not beneficially own or control Elaine Wynn’s shares, which could increase the likelihood that a change in control may occur under the Wynn Las Vegas debt documents. Under the 2023 Indenture and the 2025 Indenture, if a change of control occurs and within 60 days after that occurrence, the 4 1/4% Senior Notes due 2023 or the 5 1/2% Senior Notes due 2025, as applicable, are rated below investment grade by both rating agencies that rate such notes, the Company is required to make an offer to each applicable holder to repurchase all or any part of such holder’s notes at a purchase price equal to 101% of the aggregate principal amount thereof plus accrued and unpaid interest on the notes purchased, if any, to the date of repurchase (unless the notes have been previously called for redemption). Mr. Wynn is opposing Ms. Wynn’s cross claim.
The Company’s Complaint and the Okada Parties’ Counterclaim have been, and continue to be, challenged through motion practice. At a hearing held on November 13, 2012, the Nevada state court granted the Wynn Parties’ motion to dismiss the Counterclaim with respect to the Okada Parties’ claim under the Nevada Racketeer Influenced and Corrupt Organizations Act with respect to certain Company executives but otherwise denied the motion. At a hearing held on January 15, 2013, the court denied the Okada Parties’ motion to dismiss the Company’s Complaint. On April 22, 2013, the Company filed a second amended complaint. On August 30, 2013, the Okada Parties filed their third amended Counterclaim. On September 18, 2013, the Company filed a Partial Motion to Dismiss related to a claim in the third amended Counterclaim alleging civil extortion by Mr. Wynn and the Company’s General Counsel. On October 29, 2013, the court granted the motion and dismissed the claim. On November 26, 2013, the Okada Parties filed their fourth amended Counterclaim, and the Company filed an answer to that pleading on December 16, 2013.
On each of February 14, 2013 and February 13, 2014, the Company issued a check to Aruze in the amount of $38.7 million, representing the interest payments due on the Redemption Note at those times. However, those checks were not cashed. In February 2014, the Okada Parties advised of their intent to deposit any checks for interest and principal, past and future, due under the terms of the Redemption Note to the clerk of the court for deposit into the clerk’s trust account. On March 17, 2014, the parties stipulated that the checks be returned to the Company for reissue in the same amounts, payable to the clerk of the court for deposit into the clerk's trust account. Pursuant to the stipulation, on March 20, 2014, the Company delivered to the clerk of the court the reissued checks that were deposited into the clerk's trust account and filed a notice with the court with respect to the same. On February 13, 2015, the Company issued a check for the interest payment due at that time to the clerk of the court for deposit into the clerk's trust account.
On April 8, 2013, the United States Attorney’s Office and the U.S. Department of Justice filed a Motion to Intervene and for Temporary and Partial Stay of Discovery in the Redemption Action. The parties had been engaged in discovery at the time of the filing. The motion stated that the federal government has been conducting a criminal investigation of the Okada Parties involving the “same underlying allegations of misconduct-that is, potential violations of the Foreign Corrupt Practice Act and related fraudulent conduct-that form the basis of” the Company’s complaint, as amended, in the Redemption Action. The motion sought to stay all discovery in the Redemption Action related to the Okada Parties’ allegedly unlawful activities in
34
connection with their casino project in the Philippines until the conclusion of the criminal investigation and any resulting criminal prosecution, with an interim status update to the court in six months. At a hearing on May 2, 2013, the court granted the motion and ordered that all discovery in the Redemption Action be stayed for a period of six months (the “Stay”). On May 30, 2013, Elaine Wynn filed a motion for partial relief from the Stay, to allow her to conduct limited discovery related to her cross and counterclaims. The Wynn Parties opposed the motion so as to not interfere with the United States government’s investigation. At a hearing on August 1, 2013, the court denied the motion. On October 29, 2013, the United States Attorney’s Office and the U.S. Department of Justice filed a Motion to Extend the Stay for a further period of six months. At a hearing on October 31, 2013, the court granted the requested extension based upon an affidavit provided under seal that outlined, among other things, concerns for witness safety. The court did, however, order the parties to exchange written discovery propounded prior to May 2, 2013, including discovery related to the Elaine Wynn cross and counterclaims referred to above. The extended Stay expired on May 5, 2014. On April 29, 2014, the United States Attorney's Office and the U.S. Department of Justice filed a Motion for a Second Extension of Temporary Stay of Discovery for a further six months. At a hearing on May 1, 2014, the court denied the motion. On September 22, 2014, the court entered a new stipulation between the parties for discovery schedule with closing on August 1, 2016.
On September 16, 2014, Aruze filed a motion for partial summary judgment related to its counterclaim alleging the Company's directors violated the terms of the Articles by failing to pay Aruze fair value for the redeemed shares. At a hearing held on October 21, 2014, the court denied Aruze's motion.
On October 10, 2014, the Okada Parties filed a motion for partial judgment on the pleadings principally to seek dismissal of certain breach of fiduciary claims against Mr. Okada included in the Company's Complaint. On November 13, 2014, the court denied the motion and issued an order setting the trial and trial-related dates. The trial is scheduled to begin on February 6, 2017.
The Company will continue to vigorously pursue its claims against the Okada Parties, and the Company and the Wynn Parties will continue to vigorously defend against the counterclaims asserted against them. The Company’s claims and the Okada Parties’ counterclaims remain in an early stage and management has determined that based on proceedings to date, it is currently unable to determine the probability of the outcome of this matter or the range of reasonably possible loss, if any. An adverse judgment or settlement involving payment of a material amount could cause a material adverse effect on our financial condition.
Litigation Commenced by Kazuo Okada
Japan Action
On August 28, 2012, Mr. Okada, Universal Entertainment Corporation and Okada Holdings (“Okada Japan Parties”) filed a complaint in Tokyo District Court against the Wynn Parties, alleging that the press release issued by the Company with respect to the redemption has damaged plaintiffs’ social evaluation and credibility. The Okada Japan Parties seek damages and legal fees from the Wynn Parties. After asking the Okada Japan Parties to clarify the allegations in their complaint, the Wynn Parties objected to the jurisdiction of the Japanese court. On April 30, 2013, the Wynn Parties filed a memorandum in support of their jurisdictional position. On October 21, 2013, the court dismissed the action on jurisdictional grounds. On November 1, 2013, the Okada Japan Parties filed an appeal moving the matter to the Tokyo High Court. On June 11, 2014, the Tokyo High Court ruled in favor of the Wynn Parties and upheld the motion for dismissal. On June 25, 2014, the Okada Japan Parties filed a notice of appeal to the Supreme Court of Japan. On October 28, 2014, the Wynn Parties received a copy of the brief that the Okada Japan Parties had filed to explain why they believe the Supreme Court of Japan should hear the case. The Wynn Parties filed a reply brief on February 16, 2015.
Indemnification Action
On March 20, 2013, Mr. Okada filed a complaint against the Company in Nevada state court for indemnification under the Company’s Articles, bylaws and agreements with its directors. The complaint sought advancement of Mr. Okada’s costs and expenses (including attorney’s fees) incurred pursuant to the various legal proceedings and related regulatory investigations described above. The Company’s answer and counterclaim was filed on April 15, 2013. The counterclaim named each of the Okada Parties as defendants and sought indemnification under the Company’s Articles for costs and expenses (including attorney’s fees) incurred pursuant to the various legal proceedings and related regulatory investigations described above. On April 30, 2013, Mr. Okada filed his reply to the counterclaim. On February 4, 2014, the court entered an order on the parties’ stipulation that: (1) dismissed all claims Mr. Okada asserted against the Company; (2) reserved Mr. Okada’s right to assert, in the future, any claims for indemnity following the resolution of the Redemption Action; and (3) stayed the claims asserted by the Company against Mr. Okada pending the resolution of the Redemption Action.
35
Management has determined that based on proceedings to date, it is currently unable to determine the probability of the outcome of this action or the range of reasonably possible loss, if any.
Related Investigations and Derivative Litigation
Investigations
In the U.S. Department of Justice’s Motion to Intervene and for Temporary and Partial Stay of Discovery in the Redemption Action, the Department of Justice states in a footnote that the government also has been conducting a criminal investigation into the Company’s previously disclosed donation to the University of Macau. The Company has not received any target letter or subpoena in connection with such an investigation. The Company intends to cooperate fully with the government in response to any inquiry related to the donation to the University of Macau.
Other regulators may pursue separate investigations into the Company’s compliance with applicable laws arising from the allegations in the matters described above and in response to the Counterclaim and other litigation filed by Mr. Okada suggesting improprieties in connection with the Company’s donation to the University of Macau. While the Company believes that it is in full compliance with all applicable laws, any such investigations could result in actions by regulators against the Company. Prior investigations by the Nevada Gaming Control Board and SEC were closed with no actions taken.
Derivative Claims
Six derivative actions were commenced against the Company and all members of its Board of Directors: four in the United States District Court, District of Nevada, and two in the Eighth Judicial District Court of Clark County, Nevada.
The four federal actions brought by the following plaintiffs have been consolidated: (1) The Louisiana Municipal Police Employees’ Retirement System, (2) Maryanne Solak, (3) Excavators Union Local 731 Welfare Fund, and (4) Boilermakers Lodge No. 154 Retirement Fund (collectively, the “Federal Plaintiffs”).
The Federal Plaintiffs filed a consolidated complaint on August 6, 2012, asserting claims for: (1) breach of fiduciary duty; (2) waste of corporate assets; (3) injunctive relief; and (4) unjust enrichment. The claims were against the Company and all Company directors, including Mr. Okada, however, the plaintiffs voluntarily dismissed Mr. Okada as a defendant in this consolidated action on September 27, 2012. The Federal Plaintiffs claimed that the individual defendants breached their fiduciary duties and wasted assets by: (a) failing to ensure the Company’s officers and directors complied with federal and state laws and the Company’s Code of Conduct; (b) voting to allow the Company’s subsidiary to make the donation to the University of Macau; and (c) redeeming Aruze’s stock such that the Company incurs the debt associated with the redemption. The Federal Plaintiffs seek unspecified compensatory damages, restitution in the form of disgorgement, reformation of corporate governance procedures, an injunction against all future payments related to the donation/pledge, and all fees (attorneys, accountants, and experts) and costs. The directors responded to the consolidated complaint by filing a motion to dismiss on September 14, 2012. On February 1, 2013, the federal court dismissed the complaint for failure to plead adequately the futility of a pre-suit demand on the Board. The dismissal was without prejudice to the Federal Plaintiffs’ ability to file a motion within 30 days seeking leave to file an amended complaint. On April 9, 2013, the Federal Plaintiffs filed their amended complaint. The Company and the directors filed their motion to dismiss the amended complaint on May 23, 2013. On March 13, 2014, the federal court granted the motion to dismiss and entered judgment in favor of the Company and directors and against the Federal Plaintiffs without prejudice. On April 10, 2014, the Federal Plaintiffs filed a notice of appeal to the United States Court of Appeals for the Ninth Circuit. The Federal Plaintiffs' opening brief was filed on September 19, 2014. The Company filed a response on December 18, 2014 and the Federal Plaintiffs’ filed a reply brief on January 30, 2015.
The two state court actions brought by the following plaintiffs have also been consolidated: (1) IBEW Local 98 Pension Fund and (2) Danny Hinson (collectively, the “State Plaintiffs”). Through a coordination of efforts by all parties, the directors and the Company (a nominal defendant) have been served in all of the actions. The State Plaintiffs filed a consolidated complaint on July 20, 2012 asserting claims for (1) breach of fiduciary duty; (2) abuse of control; (3) gross mismanagement; and (4) unjust enrichment. The claims are against the Company and all Company directors during the applicable period, including Mr. Okada, as well as the Company’s Chief Financial Officer who signed financial disclosures filed with the SEC during the applicable periods. The State Plaintiffs claim that the individual defendants failed to disclose to the Company’s stockholders the investigation into, and the dispute with director Okada as well as the alleged potential violations of the FCPA related to, the University of Macau Development Foundation donation. The State Plaintiffs seek unspecified monetary damages (compensatory and punitive), disgorgement, reformation of corporate governance procedures, an order directing the Company to internally investigate the donation, as well as attorneys’ fees and costs. On October 13, 2012, the court entered the parties’
36
stipulation providing for a stay of the state derivative action for 90 days, subject to the parties’ obligation to monitor the progress of the pending litigation, discussed above, between Wynn Resorts (among others) and Mr. Okada (among others). Per the stipulation, the Company and the individual defendants were not required to respond to the consolidated complaint while the stay remained in effect. Following the expiration of the stay, the State Plaintiffs advised the Company and the individual defendants that they intended to resume the action by filing an amended complaint, which they did, on April 26, 2013. The Company and directors filed their motion to dismiss on June 10, 2013. However, on July 31, 2013, the parties agreed to a stipulation that was submitted to, and approved by the court. The stipulation contemplates a stay of the consolidated state court derivative action of equal duration as the Stay entered by the court in the Redemption Action. On June 18, 2014, the court entered a new stipulation between the parties that provides for further stay of the state derivative action and directs the parties, within 45 days of the conclusion of the latter of the Redemption Action or the federal derivative action, to discuss how the state derivative action should proceed and to file a joint report with the court.
The individual defendants are vigorously defending against the claims pleaded against them in the state derivative action. Management has determined that based on proceedings to date, it is currently unable to determine the probability of the outcome of this action or the range of reasonably possible loss, if any.
Massachusetts Gaming License Related Actions
On September 17, 2014, the MGC designated Wynn MA, an indirect wholly owned subsidiary of the Company, the award winner of the Greater Boston (Region A) gaming license. On November 7, 2014, the gaming license awarded to us became effective.
On October 16, 2014, the City of Revere, the host community to the unsuccessful bidder for the same license, and the International Brotherhood of Electrical Workers, Local 103, filed a complaint against the MGC and each of the five gaming commissioners in Suffolk Superior Court. On December 4, 2014, the City of Somerville, a surrounding community to the proposed site which Wynn MA will develop and construct an integrated resort, filed a similar complaint against the MGC and each of the five gaming commissioners in Suffolk Superior Court. The complaints challenge the MGC's decision and allege that the MGC failed to follow statutory requirements outlined in the Gaming Act. The complaints (1) seek to appeal the administrative decision, (2) assert that certiorari provides a remedy to correct errors in proceedings by an agency such as the MGC, (3) challenge the constitutionality of that section of the gaming law which bars judicial review of the Commission's decision to deny an applicant a gaming license, and (4) allege violations of the open meeting law requirements.
On January 5, 2015, the City of Boston, filed a complaint against the MGC and each of the five gaming commissioners in Suffolk Superior Court for certiorari and declaratory relief in connection with the MGC's award of the license to Wynn MA. The complaint seeks to contest the MGC's decision that Boston is a surrounding community, rather than a host community to the Wynn resort in Massachusetts.
Wynn MA is not named in the complaints. Wynn MA has been advised that the Attorney General for the Commonwealth of Massachusetts will be responding to the complaints.
CCAC Information Request
In July 2014, Wynn Macau SA was contacted by the Macau Commission Against Corruption of Macau (“CCAC”) requesting certain information related to its land in the Cotai area of Macau. Wynn Macau SA is cooperating with CCAC's request.
Not Applicable.
37
Market Information
Our common stock trades on the NASDAQ Global Select Market under the symbol “WYNN.” The following table sets forth the high and low sale prices for the indicated periods, as reported by the NASDAQ Global Select Market.
|
High
|
Low
|
||||||
|
Year Ended December 31, 2014
|
|||||||
|
First Quarter
|
$
|
249.31
|
|
$
|
189.03
|
|
|
|
Second Quarter
|
$
|
231.00
|
|
$
|
188.43
|
|
|
|
Third Quarter
|
$
|
220.50
|
|
$
|
172.53
|
|
|
|
Fourth Quarter
|
$
|
192.45
|
|
$
|
133.58
|
|
|
|
Year Ended December 31, 2013
|
|||||||
|
First Quarter
|
$
|
126.98
|
|
$
|
113.39
|
|
|
|
Second Quarter
|
$
|
144.99
|
|
$
|
114.41
|
|
|
|
Third Quarter
|
$
|
159.85
|
|
$
|
124.57
|
|
|
|
Fourth Quarter
|
$
|
194.53
|
|
$
|
155.77
|
|
|
Holders
There were approximately 193 holders of record of our common stock as of February 13, 2015.
Dividends
Wynn Resorts is a holding company and, as a result, our ability to pay dividends is dependent on our ability to obtain funds and our subsidiaries’ ability to provide funds to us. Restrictions imposed by our subsidiaries’ debt instruments significantly restrict certain key subsidiaries, including Wynn Las Vegas, LLC, Wynn America, LLC and Wynn Macau SA, from making dividends or distributions to Wynn Resorts. These restrictions are subject to certain exceptions for affiliated overhead expenses as defined in the agreements governing the debt instruments, unless certain financial and non-financial criteria have been satisfied.
In November 2014, we paid a cash dividend of $2.50 per share. In each of February 2014, May 2014, August 2014, we paid a cash dividend of $1.25 per share. In December 2013, we paid a cash dividend of $3.00 per share. In each of March 2013, June 2013, August 2013 and November 2013, we paid a cash dividend of $1.00 per share.
On February 3, 2015, we announced a cash dividend of $1.50 per share, payable on February 23, 2015 to Stockholders of record as of February 13, 2015.
Our Board of Directors will continue to periodically assess the level and appropriateness of any cash dividends.
Issuer Purchases of Equity Securities
During the fourth quarter of 2014, we had no repurchases of our common stock.
38
Stock Performance Graph
The graph below compares the five year cumulative total return on our common stock to the cumulative total return of the Standard & Poor’s 500 Stock Index (“S&P 500”) and the Dow Jones US Gambling Index. The performance graph assumes that $100 was invested on December 31, 2009 in each of the Company’s common stock, the S&P 500 and the Dow Jones US Gambling Index, and that all dividends were reinvested. The stock price performance shown in this graph is neither necessarily indicative of, nor intended to suggest, future stock price performance.
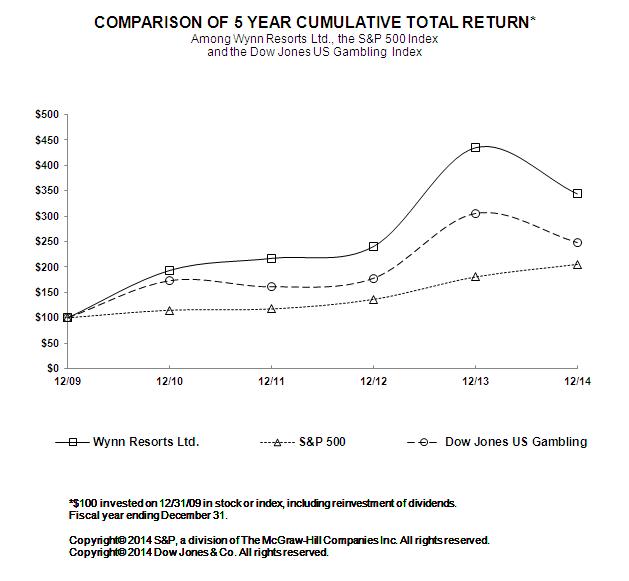
The following financial information for each of the five years ended December 31, 2014, 2013, 2012, 2011 and 2010 has been derived from our consolidated financial statements. This selected consolidated financial data should be read together with Item 7—“Management’s Discussion and Analysis of Financial Condition and Results of Operations”, our consolidated financial statements and related notes and other information contained in this Annual Report on Form 10-K. Operating results for the periods presented are not indicative of the results that may be expected for future years.
39
|
Years Ended December 31,
|
|||||||||||||||||||
|
2014
|
2013
|
2012 (1)
|
2011
|
2010 (2)
|
|||||||||||||||
|
(in thousands, except per share amounts)
|
|||||||||||||||||||
|
Consolidated Statements of Income Data:
|
|||||||||||||||||||
|
Net revenues
|
$
|
5,433,661
|
|
$
|
5,620,936
|
|
$
|
5,154,284
|
|
$
|
5,269,792
|
|
$
|
4,184,698
|
|
||||
|
Pre-opening costs
|
30,146
|
|
3,169
|
|
466
|
|
—
|
|
9,496
|
|
|||||||||
|
Operating income
|
1,266,278
|
|
1,290,091
|
|
1,029,276
|
|
1,008,240
|
|
625,252
|
|
|||||||||
|
Net income
|
962,644
|
|
1,004,157
|
|
728,699
|
|
825,113
|
|
316,596
|
|
|||||||||
|
Less: net income attributable to noncontrolling interest
|
(231,090
|
)
|
(275,505
|
)
|
(226,663
|
)
|
(211,742
|
)
|
(156,469
|
)
|
|||||||||
|
Net income attributable to Wynn Resorts, Limited
|
731,554
|
|
728,652
|
|
502,036
|
|
613,371
|
|
160,127
|
|
|||||||||
|
Basic income per share
|
$
|
7.25
|
|
$
|
7.25
|
|
$
|
4.87
|
|
$
|
4.94
|
|
$
|
1.30
|
|
||||
|
Diluted income per share
|
$
|
7.18
|
|
$
|
7.17
|
|
$
|
4.82
|
|
$
|
4.88
|
|
$
|
1.29
|
|
||||
|
As of December 31,
|
|||||||||||||||||||
|
2014
|
2013
|
2012 (1)
|
2011
|
2010
|
|||||||||||||||
|
(in thousands, except per share amounts)
|
|||||||||||||||||||
|
Consolidated Balance Sheets Data:
|
|||||||||||||||||||
|
Cash and cash equivalents
|
$
|
2,182,164
|
|
$
|
2,435,041
|
|
$
|
1,725,219
|
|
$
|
1,262,587
|
|
$
|
1,258,499
|
|
||||
|
Construction in progress
|
1,666,326
|
|
558,624
|
|
110,490
|
|
28,477
|
|
22,901
|
|
|||||||||
|
Total assets
|
9,062,861
|
|
8,377,030
|
|
7,276,594
|
|
6,899,496
|
|
6,674,497
|
|
|||||||||
|
Total long-term obligations (3)
|
7,538,605
|
|
6,789,145
|
|
6,041,285
|
|
3,096,149
|
|
3,405,983
|
|
|||||||||
|
Stockholders’ equity
|
211,091
|
|
132,351
|
|
103,932
|
|
2,223,454
|
|
2,380,585
|
|
|||||||||
|
Cash distributions declared per common share
|
$
|
6.25
|
|
$
|
7.00
|
|
$
|
9.50
|
|
$
|
6.50
|
|
$
|
8.50
|
|
||||
|
(1)
|
On February 18, 2012, we redeemed and canceled Aruze's 24,549,222 shares of Wynn Resorts common stock. In connection with the redemption and cancellation, stockholders’ equity was reduced by $1.94 billion, the face amount of the Redemption Note. Aruze has challenged the redemption and cancellation of the 24,549,222 shares and legal proceedings are ongoing. Please see Item 3—“Legal Proceedings”.
|
|
(2)
|
On April 21, 2010, we opened Encore at Wynn Macau, a further expansion of Wynn Macau.
|
|
(3)
|
Includes long-term debt, the required contract premium payments under our land concession contract at Wynn Macau, future charitable contributions and deferred income taxes.
|
The following discussion should be read in conjunction with, and is qualified in its entirety by, the consolidated financial statements and the notes thereto included elsewhere in this Annual Report on Form 10-K.
Overview
We are a developer, owner and operator of destination casino resorts (integrated resorts). In the Macau Special Administrative Region of the People’s Republic of China (“Macau”), we own
72%
of and operate Wynn Macau and Encore at Wynn Macau. We refer to the integrated Wynn Macau and Encore at Wynn Macau resort as Wynn Macau | Encore or as our Macau Operations. In Las Vegas, Nevada, we own 100% of and operate Wynn Las Vegas and Encore at Wynn Las Vegas, which we refer to as Wynn Las Vegas | Encore or our Las Vegas Operations. We are currently constructing Wynn Palace, an integrated casino resort in the Cotai area of Macau. In addition, we are developing an integrated casino resort in Everett, Massachusetts.
40
Macau Operations
Our Macau integrated resort of Wynn Macau and Encore at Wynn Macau features approximately 284,000 square feet of casino space with
498
table games and
625
slot machines and two luxury hotel towers with a total of
1,008
spacious guest rooms and suites. Wynn Macau | Encore includes casual and fine dining in eight restaurants, approximately 57,000 square feet of retail space, approximately 31,000 square feet of lounge and meeting facilities and recreation and leisure facilities.
In response to our evaluation of our Macau Operations and the reactions of our guests, we have made and expect to continue to make enhancements and refinements to our resort. In February 2015, we completed a renovation of approximately 27,000 square feet of our casino space at Wynn Macau into new VIP gaming rooms.
Las Vegas Operations
Our integrated Las Vegas resort of Wynn Las Vegas and Encore at Wynn Las Vegas features approximately
186,000
square feet of casino space with
232
table games,
1,849
slot machines and two luxury hotel towers with a total of
4,748
spacious guest rooms, suites and villas. Wynn Las Vegas | Encore includes 34 food and beverage outlets, approximately 99,000 square feet of retail space, approximately
290,000
square feet of meeting and convention space, an on-site 18 hole golf course, a Ferrari and Maserati dealership, as well as two showrooms, three nightclubs and a beach club.
In response to our evaluation of our Las Vegas Operations and the reactions of our guests, we have and expect to continue to make enhancements and refinements to our resort.
Future Development
We are currently constructing Wynn Palace, an integrated resort containing a
1,700
-room hotel, performance lake, meeting space, casino, spa, retail offerings and food and beverage outlets in the Cotai area of Macau. In July 2013, we signed a $2.6 billion GMP contract for the project's construction. The total project budget, including construction costs, capitalized interest, pre-opening expenses, land costs and financing fees, is approximately
$4.1 billion
. As of
December 31, 2014
, we have invested approximately
$1.8 billion
in the project. We expect to open Wynn Palace in the first half of 2016.
On September 17, 2014, the Massachusetts Gaming Commission designated Wynn MA, LLC, an indirect wholly owned subsidiary of the Company, the award winner of the Greater Boston (Region A) gaming license. On November 4, 2014, a vote upheld the expanded gaming law in Massachusetts. On November 7, 2014, the gaming license awarded to us became effective.
On January 2, 2015, we purchased 33 acres of land in Everett, Massachusetts, along the Mystic River. On this land, we intend to develop and operate an integrated resort containing a hotel, restaurants, casino, spa, premium retail offerings, meeting and convention space and a waterfront boardwalk.
We continually seek out new opportunities for additional gaming or related businesses, in the United States, and worldwide.
Key Operating Measures
Certain key operating measures specific to the gaming industry are included in our discussion of our operational performance for the periods for which a Consolidated Statement of Income is presented. Below are definitions of these key operating measures discussed:
|
•
|
Table games win is the amount of drop or turnover that is retained and recorded as casino revenue.
|
|
•
|
Drop is the amount of cash and net markers issued that are deposited in a gaming table’s drop box.
|
|
•
|
Turnover is the sum of all losing rolling chip wagers within our Macau Operations’ VIP program.
|
|
•
|
Rolling chips are identifiable chips that are used to track turnover for purposes of calculating incentives.
|
|
•
|
Slot win is the amount of handle (representing the total amount wagered) that is retained by us and is recorded as casino revenue.
|
|
•
|
Average daily rate (“ADR”) is calculated by dividing total rooms revenue including the retail value of promotional allowances (less service charges, if any) by total rooms occupied including complimentary rooms.
|
|
•
|
Revenue per available room (“REVPAR”) is calculated by dividing total rooms revenue including the retail value of promotional allowances (less service charges, if any) by total rooms available.
|
|
•
|
Occupancy is calculated by dividing total occupied rooms, including complimentary rooms, by the total rooms available.
|
41
Below is a discussion of the methodologies used to calculate win percentage at our resorts.
In our VIP casino in Macau, customers primarily purchase non-negotiable chips, commonly referred to as rolling chips, from the casino cage and there is no deposit into a gaming table drop box from chips purchased from the cage. Non-negotiable chips can only be used to make wagers. Winning wagers are paid in cash chips. The loss of the non-negotiable chips in the VIP casino is recorded as turnover and provides a base for calculating VIP casino win percentage. It is customary in Macau to measure VIP casino play using this rolling chip method. We expect our win as a percentage of turnover in this segment to be within the range of 2.7% to 3.0%.
The measurement base used in the mass market casino in Macau is not the same as that used in the VIP casino. In our mass market casino in Macau, customers may purchase cash chips at either the gaming tables or at the casino cage. The cash used to purchase the cash chips at the gaming tables is deposited into the gaming table’s drop box. This is the base of measurement that we use for calculating win percentage in our mass market casino. We do not report an expected range for the win percentage in our mass market casino as chips purchased at the casino cage are excluded from table games drop and distort our expected win percentage. Because of the large number of chip purchases occurring at the casino cage, we believe the relevant indicator of volumes in the mass market segment should be table games win.
The measurements in our VIP casino and the mass market casino are not comparable as the mass market casino tracks the initial purchase of chips at the table while the measurement method in our VIP casino tracks the sum of all losing wagers. Accordingly, the base measurement in the VIP casino is much larger than the base measurement in the mass market casino. As a result, the expected win percentage with the same amount of gaming win is smaller in the VIP casino when compared to the mass market casino.
In Las Vegas, customers purchase chips at the gaming tables. The cash and net markers used to purchase chips are deposited in the gaming table’s drop box. This is the base of measurement that we use for calculating win percentage in Las Vegas. Each type of table game has its own theoretical win percentage. Our expected table games win percentage in Las Vegas is 21% to 24%.
Results of Operations
Summary annual results
The following table summarizes our financial results for the periods presented (in thousands, except per share data).
|
Years Ended December 31,
|
|||||||||||
|
2014
|
2013
|
2012
|
|||||||||
|
Net revenues
|
$
|
5,433,661
|
|
$
|
5,620,936
|
|
$
|
5,154,284
|
|
||
|
Net income attributable to Wynn Resorts, Limited
|
$
|
731,554
|
|
$
|
728,652
|
|
$
|
502,036
|
|
||
|
Diluted net income per share
|
$
|
7.18
|
|
$
|
7.17
|
|
$
|
4.82
|
|
||
|
Adjusted Property EBITDA
|
$
|
1,773,278
|
|
$
|
1,810,801
|
|
$
|
1,575,812
|
|
||
During the year ended
December 31, 2014
, our net income attributable to Wynn Resorts, Limited was
$731.6 million
, an increase of
0.4%
over the same period of 2013, resulting in diluted earnings per share of
$7.18
. Adjusted Property EBITDA decreased year-over-year by
2.1%
, from
$1,810.8 million
for the year ended
December 31, 2013
to
$1,773.3 million
for the same period of 2014. Our results for the year ended
December 31, 2014
compared to the same period of 2013 were primarily attributable to a
5.8%
decline in casino revenues from our Macau Operations offset by non-casino revenue growth from our Las Vegas Operations. Although we experienced stable overall visitation to our Macau Operations, a significant slowdown in activity from our premium customers drove the decline in casino revenues.
During the year ended December 31, 2013, our net income attributable to Wynn Resorts, Limited was
$728.7 million
, an increase of
45.1%
over the same period of 2012, resulting in diluted earnings per share of
$7.17
. Adjusted Property EBITDA increased year-over-year by
14.9%
, from
$1,575.8 million
for the year ended December 31, 2012 to
$1,810.8 million
for the same period of 2013. Our results for the year ended December 31, 2013 compared to the same period of 2012 were primarily driven by an increase of
10.6%
, or
$365.4 million
in casino revenue from our Macau Operations and an increase of
15.3%
, or
$90.5 million
in casino revenues from our Las Vegas Operations.
42
Financial results for the year ended
December 31, 2014
compared to the year ended
December 31, 2013
.
Net revenues
The following table presents net revenues from our Macau and Las Vegas Operations (in thousands):
|
|
Years Ended December 31,
|
|||||||||
|
|
2014
|
2013
|
Percent
Change
|
|||||||
|
Net revenues
|
||||||||||
|
Macau Operations
|
$
|
3,796,750
|
|
$
|
4,040,526
|
|
(6.0
|
)
|
||
|
Las Vegas Operations
|
1,636,911
|
|
1,580,410
|
|
3.6
|
|
||||
|
$
|
5,433,661
|
|
$
|
5,620,936
|
|
(3.3
|
)
|
|||
Net revenues decreased
3.3%
to
$5,433.7 million
for the year ended
December 31, 2014
, from
$5,620.9 million
for the same period in 2013. The decline in net revenues was primarily driven by a decrease of
5.8%
, or
$221.1 million
in casino revenue from our Macau Operations, partially offset by an increase of
5.8%
, or
$51.8 million
, in non-casino revenues from our Las Vegas Operations.
Non-casino revenues consist of operating revenues from rooms, food and beverage, entertainment, retail and other, less promotional allowances. The following table presents net revenues from our casino revenues and non-casino revenues (in thousands).
|
|
Years Ended December 31,
|
|||||||||
|
|
2014
|
2013
|
Percent
Change
|
|||||||
|
Net revenues
|
||||||||||
|
Casino revenues
|
$
|
4,274,221
|
|
$
|
4,490,637
|
|
(4.8
|
)
|
||
|
Non-casino revenues
|
1,159,440
|
|
1,130,299
|
|
2.6
|
|
||||
|
$
|
5,433,661
|
|
$
|
5,620,936
|
|
(3.3
|
)
|
|||
Casino revenues were
78.7%
of total net revenues for the year ended
December 31, 2014
compared to
79.9%
of total net revenues for the same period of 2013, while non-casino revenues were
21.3%
of total net revenues compared to
20.1%
in the prior year.
Casino revenues
Casino revenues decreased
4.8%
to
$4,274.2 million
for the year ended
December 31, 2014
, from
$4,490.6 million
in the same period of 2013. Our Macau Operations experienced a year-over-year decrease in casino revenues of
5.8%
from
$3,807.9 million
to
$3,586.8 million
. The decrease is primarily due to a decrease from our VIP gaming operations, partially offset by an increase of
7.1%
in table games win percentage from our mass market gaming operations. Our VIP gaming operations experienced a 12.1% reduction in turnover and a decline in win as a percentage of turnover from
3.01%
to
2.82%
. Las Vegas Operations were relatively flat year-over-year with casino revenues of
$687.4 million
for the year ended December 31, 2014 compared to
$682.8 million
in the same period of 2013.
43
The table below sets forth our casino revenues and associated key operating measures for our Macau and Las Vegas Operations (in thousands, except for win per unit per day and average number of table games and slots).
|
|
Years Ended December 31,
|
|||||||||||||
|
|
2014
|
2013
|
Increase/
(Decrease) |
Percent
Change |
||||||||||
|
Macau Operations:
|
||||||||||||||
|
Total casino revenues
|
$
|
3,586,781
|
|
$
|
3,807,850
|
|
$
|
(221,069
|
)
|
(5.8
|
)
|
|||
|
Average number of table games
|
461
|
|
491
|
|
(30
|
)
|
(6.1
|
)
|
||||||
|
VIP
|
||||||||||||||
|
VIP turnover
|
$
|
108,077,342
|
|
$
|
122,991,763
|
|
$
|
(14,914,421
|
)
|
(12.1
|
)
|
|||
|
VIP win as a % of turnover
|
2.82
|
%
|
3.01
|
%
|
(0.19
|
)
|
||||||||
|
Mass market
|
||||||||||||||
|
Drop (1)
|
$
|
2,650,359
|
|
$
|
2,633,870
|
|
$
|
16,489
|
|
0.6
|
|
|||
|
Table games win
|
$
|
1,187,997
|
|
$
|
992,872
|
|
$
|
195,125
|
|
19.7
|
|
|||
|
Table games win % (1)
|
44.8
|
%
|
37.7
|
%
|
7.1
|
|
||||||||
|
Table games win per unit per day
|
$
|
16,154
|
|
$
|
13,098
|
|
$
|
3,056
|
|
23.3
|
|
|||
|
Average number of slot machines
|
679
|
|
866
|
|
(187
|
)
|
(21.6
|
)
|
||||||
|
Slot machine handle
|
$
|
5,415,127
|
|
$
|
4,846,938
|
|
$
|
568,189
|
|
11.7
|
|
|||
|
Slot machine win
|
$
|
264,763
|
|
$
|
245,578
|
|
$
|
19,185
|
|
7.8
|
|
|||
|
Slot machine win per unit per day
|
$
|
1,068
|
|
$
|
777
|
|
$
|
291
|
|
37.5
|
|
|||
|
Las Vegas Operations:
|
||||||||||||||
|
Total casino revenues
|
$
|
687,440
|
|
$
|
682,787
|
|
$
|
4,653
|
|
0.7
|
|
|||
|
Average number of table games
|
232
|
|
233
|
|
(1
|
)
|
(0.4
|
)
|
||||||
|
Drop
|
$
|
2,556,452
|
|
$
|
2,617,634
|
|
$
|
(61,182
|
)
|
(2.3
|
)
|
|||
|
Table games win
|
$
|
623,968
|
|
$
|
657,927
|
|
$
|
(33,959
|
)
|
(5.2
|
)
|
|||
|
Table games win %
|
24.4
|
%
|
25.1
|
%
|
(0.7
|
)
|
||||||||
|
Table games win per unit per day
|
$
|
7,354
|
|
$
|
7,729
|
|
$
|
(375
|
)
|
(4.9
|
)
|
|||
|
Average number of slot machines
|
1,858
|
|
2,030
|
|
(172
|
)
|
(8.5
|
)
|
||||||
|
Slot machine handle
|
$
|
3,008,563
|
|
$
|
2,874,646
|
|
$
|
133,917
|
|
4.7
|
|
|||
|
Slot machine win
|
$
|
186,458
|
|
$
|
177,452
|
|
$
|
9,006
|
|
5.1
|
|
|||
|
Slot machine win per unit per day
|
$
|
275
|
|
$
|
239
|
|
$
|
36
|
|
15.1
|
|
|||
|
(1)
|
Customers purchase mass market casino gaming chips at either the gaming tables or the casino cage. Chips purchased at the casino cage are excluded from table games drop and will increase the expected win percentage. Because of the large number of chip purchases occurring at the casino cage in our Macau mass market casino, we believe the relevant indicator of volumes in the mass market casino should be actual table games win.
|
Non-casino revenues
Non-casino revenues increased
2.6%
, or
$29.1 million
, to
$1,159.4 million
for the year ended
December 31, 2014
, from
$1,130.3 million
for the same period of 2013, driven by a
10.3%
increase in rooms revenue.
Rooms revenue increased
10.3%
, or
$50.5 million
, to
$542.8 million
for the year ended
December 31, 2014
, from
$492.2 million
in the same period of 2013. Our Las Vegas Operations accounted for
$31.4 million
of the increase, while Macau Operations accounted for
$19.1 million
, both experiencing an increase in ADR and occupancy.
44
The table below sets forth our rooms revenue and associated key operating measures for our Macau and Las Vegas Operations.
|
Years Ended December 31,
|
|||||||||
|
2014
|
2013
|
Percent
Change (a) |
|||||||
|
Macau Operations:
|
|||||||||
|
Total rooms revenue (in thousands)
|
$
|
133,781
|
|
$
|
114,638
|
|
16.7
|
||
|
Occupancy
|
98.4
|
%
|
95.5
|
%
|
2.9
|
||||
|
ADR
|
$
|
333
|
|
$
|
313
|
|
6.4
|
||
|
REVPAR
|
$
|
327
|
|
$
|
299
|
|
9.4
|
||
|
Las Vegas Operations:
|
|||||||||
|
Total rooms revenue (in thousands)
|
$
|
408,981
|
|
$
|
377,592
|
|
8.3
|
||
|
Occupancy
|
86.9
|
%
|
84.6
|
%
|
2.3
|
||||
|
ADR
|
$
|
274
|
|
$
|
258
|
|
6.2
|
||
|
REVPAR
|
$
|
238
|
|
$
|
218
|
|
9.2
|
||
(a) Except occupancy, which is presented as a percentage point change.
Food and beverage revenues increased
3.1%
, or
$18.0 million
, to
$604.7 million
for the year ended
December 31, 2014
, from
$586.7 million
for the same period of 2013. The increase is primarily a result of an increase in revenues at our Las Vegas Operations.
Entertainment, retail and other decreased
4.2%
, or
$17.5 million
, to
$401.2 million
for the year ended December 31, 2014, from
$418.7 million
for the same period of 2013. The decrease is primarily due to a decline in revenue from retail shops at our Macau Operations.
Promotional allowances increased
6.0%
, or
$21.9 million
, to
$389.2 million
for the year ended
December 31, 2014
, from
$367.3 million
for the same period of 2013. As a percentage of total casino revenues, promotional allowances were
9.1%
for the year ended
December 31, 2014
compared to
8.2%
for the same period of 2013.
Operating costs and expenses
Operating costs and expenses decreased
3.8%
, or
$163.5 million
, to
$4,167.4 million
for the year ended
December 31, 2014
, from
$4,330.8 million
for the same period of 2013. The reduction was primarily driven by decreases of casino expenses and depreciation and amortization, partially offset by increases in general and administrative expenses and pre-opening costs.
Casino expenses decreased
6.3%
, or
$179.5 million
, to
$2,667.0 million
for the year ended
December 31, 2014
, from
$2,846.5 million
for the same period of 2013, primarily due to lower gaming taxes from the 39.0% gross win tax incurred at our Macau Operations. The decline in gaming taxes was commensurate with the
5.8%
decrease in casino revenues at our Macau Operations.
Rooms expense increased
11.1%
, or
$14.8 million
, to
$148.3 million
for the year ended
December 31, 2014
, from
$133.5 million
for the same period of 2013. The increase is due to certain rooms expense from our Las Vegas Operations to maintain a premium guest experience and expenses associated with the increase in occupancy over the prior year at both our Macau and Las Vegas Operations.
Food and beverage expenses increased
4.2%
, or
$13.6 million
, to
$337.2 million
for the year ended
December 31, 2014
, from
$323.6 million
for the same period of 2013. The increase in food and beverage expenses is primarily a result of higher costs in the current period for entertainment at Wynn Las Vegas nightclubs.
General and administrative expenses increased
9.7%
, or
$43.7 million
, to
$492.5 million
for the year ended
December 31, 2014
, from
$448.8 million
in the same period of 2013 primarily from our Macau Operations. Our Macau Operations experienced an increase compared to the prior year in labor costs, along with certain property maintenance and repair expenses
45
and other miscellaneous items. Our Macau Operations incurred additional general and administrative labor costs associated with a new 2014 bonus program for non-management employees.
Pre-opening costs were
$30.1 million
for the year ended
December 31, 2014
, compared to
$3.2 million
for the same period of 2013 and were primarily associated with the design and planning for Wynn Palace. We expect our pre-opening costs to increase in the future as the construction and development of Wynn Palace progresses toward the expected completion in the first half of 2016 and with the beginning of development for the Wynn resort in Massachusetts.
Depreciation and amortization decreased
15.3%
, or
$56.9 million
, to
$314.1 million
for the year ended
December 31, 2014
, from
$371.1 million
for the same period of 2013 due to certain Las Vegas Operations assets with a five year useful life becoming fully depreciated.
Interest expense, net of capitalized interest
Interest expense, net of capitalized interest, increased
5.4%
, or
$16.0 million
, to
$315.1 million
for the year ended
December 31, 2014
, up from
$299.0 million
for the same period of 2013, attributable to a
$39.0 million
increase in interest expense partially offset by a
$23.0 million
increase in capitalized interest. During 2013, we completed issuances of $500 million 4 1/4% senior notes, $600 million 5 1/4% senior notes and exercised our option to increase our Macau senior term loan facility by $200 million. During the first quarter of 2014, we issued an additional $750 million of 5 1/4% senior notes. These issuances of long-term debt were partially offset by the principal repayment of $500 million 7 7/8% first mortgage notes through a cash tender offer in May 2013 and redemption of untendered notes in November 2013. In addition, our interest expense associated with our first mortgage notes reduced year-over-year as a result of open market repurchases we made during 2014. Capitalized interest increased due to the construction costs of Wynn Palace. Capitalized interest will continue to increase with the ongoing borrowings and construction costs related to Wynn Palace.
Other non-operating income and expenses
We incurred a loss of
$9.6 million
on the extinguishment of debt for the year ended
December 31, 2014
compared to a loss of
$40.4 million
for the same period of 2013. During the year ended
December 31, 2014
, the loss was due to the premium paid on the purchase of first mortgage notes due in 2020 through open market transactions and the write-off of related unamortized deferred financing costs and original issue discount. During the year ended
December 31, 2013
, the loss was primarily from the premium paid in the cash tender offer of our first mortgage notes due in 2017 and the write-off of related unamortized deferred financing costs and original issue discount.
We incurred a loss of
$4.4 million
for the year ended
December 31, 2014
from the decrease in the fair value of our interest rate swaps compared to a gain of
$14.2 million
from the increase in fair value for the same period in 2013.
Interest income was
$20.4 million
for the year ended
December 31, 2014
, compared to
$15.7 million
for the same period in 2013. During 2014 and 2013, our short-term investment strategy has been to preserve capital while retaining sufficient liquidity. The majority of our short-term investments were in time deposits, fixed deposits and money market accounts with a maturity of three months or less.
Income Taxes
For the years ended
December 31, 2014
and 2013, we recorded a tax benefit of
$3.8 million
and
$17.6 million
, respectively. For the year ended December 31, 2014, our benefit for income taxes primarily relates to a release of valuation allowance on prior year foreign tax credits resulting from the implementation of a tax planning strategy. For the year ended December 31, 2013, our income tax benefit is primarily related to a decrease in our deferred tax liabilities reduced by foreign taxes assessable on the dividends of Wynn Macau SA. Since June 30, 2010, we have no longer considered our portion of the tax earnings and profits of Wynn Macau, Limited to be permanently reinvested. No additional U.S. tax provision has been made with respect to amounts not considered permanently reinvested as we anticipate that U.S. foreign tax credits should be sufficient to eliminate any U.S. tax provision relating to such repatriation. We have not provided deferred U.S. income taxes or foreign withholding taxes on temporary differences which are considered indefinitely reinvested.
Wynn Macau SA received an exemption from Macau’s 12% Complementary Tax on casino gaming profits through December 31, 2015. Accordingly, we were exempt from the payment of
$99.4 million
and
$107.3 million
in such taxes during the year ended
December 31, 2014
and 2013, respectively. Our non-gaming profits remain subject to the Macau Complementary Tax and casino winnings remain subject to the Macau Special Gaming tax and other levies together totaling 39% in accordance with our concession agreement.
46
In December 2013, we received notification that for the 2014 tax year we had been accepted for the Compliance Maintenance phase of the Internal Revenue Service ("IRS") Compliance Assurance Program ("CAP"), which accelerates IRS examination of key transactions with the goal of resolving any issues before the taxpayer files its return. In the Compliance Maintenance phase, the IRS, at its discretion, may reduce the level of review of the taxpayer's tax positions based on the complexity and number of issues, and the taxpayer's history of compliance, cooperation and transparency in the CAP.
In February 2014, we received notification that the IRS completed its examination of our 2012 U.S. income tax return and had no changes. In December 2014, we received notification that we were accepted into the Compliance Maintenance phase of CAP for the 2015 tax year.
In March 2013, the Financial Services Bureau commenced an examination of the 2009, 2010, and 2011 Macau income tax returns of Wynn Macau SA In December 2014, Wynn Macau SA reached an agreement with the Macau Financial Services Bureau regarding issues raised during its examination. While no additional tax was due as a result of the examination, adjustments were made to Wynn Macau SA's foreign net operating loss carryforwards. On December 31, 2014, the statute of limitations for the 2009 Macau Complementary tax return expired.
Net income attributable to noncontrolling interests
Net income attributable to noncontrolling interests was
$231.1 million
for the year ended
December 31, 2014
, compared to
$275.5 million
for the year ended
December 31, 2013
. These amounts represent the noncontrolling interests’ share of net income from Wynn Macau, Limited for each year.
Financial results for the year ended
December 31, 2013
compared to the year ended
December 31, 2012
.
Net Revenues
The following table presents net revenues from our Macau and Las Vegas Operations (in thousands):
|
|
Years Ended December 31,
|
||||||||
|
|
2013
|
2012
|
Percent
Change |
||||||
|
Net revenues
|
|||||||||
|
Macau Operations
|
$
|
4,040,526
|
|
$
|
3,667,454
|
|
10.2
|
||
|
Las Vegas Operations
|
1,580,410
|
|
1,486,830
|
|
6.3
|
||||
|
$
|
5,620,936
|
|
$
|
5,154,284
|
|
9.1
|
|||
Net revenues increased
9.1%
to
$5,620.9 million
for the year ended
December 31, 2013
, from
$5,154.3 million
for the same period in 2012. The net revenue growth was primarily driven by an increase of
10.6%
, or
$365.4 million
in casino revenue from our Macau Operations and an increase of
15.3%
, or
$90.5 million
in casino revenues from our Las Vegas Operations.
The following table presents net revenues from our casino revenues and non-casino revenues (in thousands).
|
|
Years Ended December 31,
|
||||||||
|
|
2013
|
2012
|
Percent
Change |
||||||
|
Net revenues
|
|||||||||
|
Casino revenues
|
$
|
4,490,637
|
|
$
|
4,034,759
|
|
11.3
|
||
|
Non-casino revenues
|
1,130,299
|
|
1,119,525
|
|
1.0
|
||||
|
$
|
5,620,936
|
|
$
|
5,154,284
|
|
9.1
|
|||
Casino revenues were
79.9%
of total net revenues for the year ended
December 31, 2013
compared to
78.3%
of total net revenues for the same period of 2012, while non-casino revenues were
20.1%
of total net revenues compared to
21.7%
in the prior year.
47
Casino Revenues
Casino revenues increased
11.3%
to
$4,490.6 million
for the year ended
December 31, 2013
, from
$4,034.8 million
in the same period of 2012. Our Macau Operations experienced a year-over-year increase in casino revenues of
10.6%
from
$3,442.5 million
to
$3,807.9 million
. The increase is primarily due to stronger table game volumes in both mass market and VIP gaming operations. Our Las Vegas Operations experienced a 15.3% increase in casino revenues from $592.3 million for the year ended December 31, 2012 to $682.8 million in the same period of 2013 due to a significant increase in our table games win percentage.
The table below sets forth our casino revenues and associated key operating measures for our Macau and Las Vegas Operations (in thousands, except for win per unit per day and average number of table games and slots).
|
|
Years Ended December 31,
|
|||||||||||||
|
|
2013
|
2012
|
Increase/
(Decrease) |
Percent
Change |
||||||||||
|
Macau Operations:
|
||||||||||||||
|
Total casino revenues
|
$
|
3,807,850
|
|
$
|
3,442,451
|
|
$
|
365,399
|
|
10.6
|
|
|||
|
Average number of table games
|
491
|
|
489
|
|
2
|
|
0.4
|
|
||||||
|
VIP
|
||||||||||||||
|
VIP turnover
|
$
|
122,991,763
|
|
$
|
119,251,854
|
|
$
|
3,739,909
|
|
3.1
|
|
|||
|
VIP win as a % of turnover
|
3.01
|
%
|
2.84
|
%
|
0.17
|
|
||||||||
|
Mass market
|
||||||||||||||
|
Drop (1)
|
$
|
2,633,870
|
|
$
|
2,764,664
|
|
$
|
(130,794
|
)
|
(4.7
|
)
|
|||
|
Table games win
|
$
|
992,872
|
|
$
|
843,001
|
|
$
|
149,871
|
|
17.8
|
|
|||
|
Table games win % (1)
|
37.7
|
%
|
30.5
|
%
|
7.2
|
|
||||||||
|
Table games win per unit per day
|
$
|
13,098
|
|
$
|
11,549
|
|
$
|
1,549
|
|
13.4
|
|
|||
|
Average number of slot machines
|
866
|
|
941
|
|
(75
|
)
|
(8.0
|
)
|
||||||
|
Slot machine handle
|
$
|
4,846,938
|
|
$
|
4,697,463
|
|
$
|
149,475
|
|
3.2
|
|
|||
|
Slot machine win
|
$
|
245,578
|
|
$
|
247,020
|
|
$
|
(1,442
|
)
|
(0.6
|
)
|
|||
|
Slot machine win per unit per day
|
$
|
777
|
|
$
|
718
|
|
$
|
59
|
|
8.2
|
|
|||
|
Las Vegas Operations:
|
||||||||||||||
|
Total casino revenues
|
$
|
682,787
|
|
$
|
592,308
|
|
$
|
90,479
|
|
15.3
|
|
|||
|
Average number of table games
|
233
|
|
220
|
|
13
|
|
5.9
|
|
||||||
|
Drop
|
$
|
2,617,634
|
|
$
|
2,591,833
|
|
$
|
25,801
|
|
1.0
|
|
|||
|
Table games win
|
$
|
657,927
|
|
$
|
567,014
|
|
$
|
90,913
|
|
16.0
|
|
|||
|
Table games win %
|
25.1
|
%
|
21.9
|
%
|
3.2
|
|
||||||||
|
Table games win per unit per day
|
$
|
7,729
|
|
$
|
7,031
|
|
$
|
698
|
|
9.9
|
|
|||
|
Average number of slot machines
|
2,030
|
|
2,358
|
|
(328
|
)
|
(13.9
|
)
|
||||||
|
Slot machine handle
|
$
|
2,874,646
|
|
$
|
2,908,678
|
|
$
|
(34,032
|
)
|
(1.2
|
)
|
|||
|
Slot machine win
|
$
|
177,452
|
|
$
|
177,420
|
|
$
|
32
|
|
—
|
|
|||
|
Slot machine win per unit per day
|
$
|
239
|
|
$
|
206
|
|
$
|
33
|
|
16.0
|
|
|||
|
(1)
|
Customers purchase mass market casino gaming chips at either the gaming tables or the casino cage. Chips purchased at the casino cage are excluded from table games drop and will increase the expected win percentage. Because of the large number of chip purchases occurring at the casino cage in our Macau mass market casino, we believe the relevant indicator of volumes in the mass market casino should be table games win.
|
Non-casino revenues
Non-casino revenues increased
1.0%
, or
$10.8 million
, to
$1,130.3 million
for the year ended
December 31, 2013
, from
$1,119.5 million
for the same period of
2012
.
48
Rooms revenue increased
2.6%
, or
$12.2 million
, to
$492.2 million
for the year ended
December 31, 2013
, from
$480.0 million
in the same period of
2012
. Rooms revenue at our Las Vegas Operations increased
4.2%
, or
$15.3 million
, due to increased occupancy and an increase in room rates compared to 2012. Rooms revenue at our Macau Operations decreased
2.6%
, or
$3.0 million
, to
$114.6 million
compared to the prior year period of
$117.7 million
. During 2013, we renovated approximately 600 guest rooms in the original Wynn Macau tower, contributing to an approximate 4.8% reduction in the number of available room-nights during the year.
The table below sets forth our rooms revenue and associated key operating measures for our Macau and Las Vegas Operations.
|
Years Ended December 31,
|
||||||||||
|
2013
|
2012
|
Percent
Change (a) |
||||||||
|
Macau Operations:
|
||||||||||
|
Total rooms revenue (in thousands)
|
$
|
114,638
|
|
$
|
117,666
|
|
(2.6
|
)
|
||
|
Occupancy
|
95.5
|
%
|
93.0
|
%
|
2.5
|
|
||||
|
ADR
|
$
|
313
|
|
$
|
315
|
|
(0.6
|
)
|
||
|
REVPAR
|
$
|
299
|
|
$
|
293
|
|
2.0
|
|
||
|
Las Vegas Operations:
|
||||||||||
|
Total rooms revenue (in thousands)
|
$
|
377,592
|
|
$
|
362,317
|
|
4.2
|
|
||
|
Occupancy
|
84.6
|
%
|
82.9
|
%
|
1.7
|
|
||||
|
ADR
|
$
|
258
|
|
$
|
252
|
|
2.4
|
|
||
|
REVPAR
|
$
|
218
|
|
$
|
209
|
|
4.3
|
|
||
|
(a)
|
Except occupancy, which is presented as a percentage point change.
|
Entertainment, retail and other revenues were relatively flat at $418.7 million for the year ended December 31, 2013 compared $417.2 million for the same period in 2012. An increase in retail revenues at our Macau Operations from stronger business in leased stores and Las Vegas Operations with the completed reconfiguration of certain stores in our retail area during 2012 was offset by a decrease in entertainment revenues. Decline in entertainment revenues was driven by a Las Vegas show which ended its run in November 2012.
Operating costs and expenses
Operating costs and expenses increased
5.0%
, or
$205.8 million
, to
$4,330.8 million
for the year ended
December 31, 2013
, from
$4,125.0 million
for the same period of 2012.
Casino expenses increased
8.4%
, or
$219.7 million
, to
$2,846.5 million
for the year ended
December 31, 2013
, from
$2,626.8 million
for the same period of 2012. The increase was due primarily to higher gaming taxes commensurate with the increase in casino revenue at our Las Vegas Operations and Macau Operations (where we incur a gaming tax and other levies at a rate totaling 39% in accordance with the concession agreement).
Food and beverage expenses increased
4.9%
, or
$15.2 million
, to
$323.6 million
for the year ended
December 31, 2013
, from
$308.4 million
for the same period of 2012. The increase in food and beverage expenses is primarily due to additional nightclub promotional costs at our Las Vegas Operations.
Entertainment, retail and other expenses decreased
7.7%
, or
$14.6 million
, to
$175.3 million
for the year ended
December 31, 2013
, from
$189.8 million
for the same period of 2012 due primarily to a Las Vegas show that ended its run in November 2012.
General and administrative expenses increased
1.6%
, or
$7.1 million
, to
$448.8 million
for the year ended
December 31, 2013
from
$441.7 million
in the same period of 2012. The increase was primarily due to higher stock-based compensation expense related to the accelerated vesting of a restricted stock award that was previously granted to our former chief operating officer and increased development costs. The increase was partially offset by higher expenses incurred during the prior year related to the share redemption and litigation with a former shareholder.
49
Provision for doubtful accounts decreased
34.3%
, or
$6.2 million
, to
$11.9 million
for the year ended December 31, 2013, from
$18.1 million
for the same period of 2012. During years ended 2013 and 2012, we recorded adjustments of $14.9 million and $30.9 million, respectively, to our reserve estimates for casino accounts receivable based on the results of historical collection patterns and current collection trends.
Pre-opening costs were
$3.2 million
for the year ended
December 31, 2013
, compared to
$0.5 million
for the same period of 2012 and were attributable to Wynn Palace. We began to incur pre-opening costs during October 2012 related to the design and planning for Wynn Palace.
Depreciation and amortization for the year ended
December 31, 2013
, was
$371.1 million
compared to
$373.2 million
for the year ended December 31, 2012. During the construction of our resorts, costs incurred in the construction of the buildings, improvements to land and the purchases of assets for use in operations were capitalized. Once these resorts opened, their assets were placed into service and we began recognizing the associated depreciation expense. Depreciation expenses will continue throughout the estimated useful lives of these assets. In addition, we continually evaluate the useful life of our property and equipment, intangible assets and other assets and adjust them when warranted. The maximum useful life of assets at our Macau Operations is the remaining life of the gaming concession or land concession, which currently expire in June 2022 and August 2029, respectively. Consequently, depreciation related to our Macau Operations is charged on an accelerated basis when compared to our Las Vegas Operations.
Property charges and other
Property charges and other for the year ended
December 31, 2013
, was
$17.1 million
compared to
$40.0 million
for the year ended December 31, 2012. For the year ended
December 31, 2013
, property charges and other related primarily to miscellaneous renovations and abandonments at our resorts, a contract termination fee and entertainment development costs. For the year ended December 31, 2012, property charges and other related primarily to a remodel of a Las Vegas restaurant, charges related to the cancellation of a Las Vegas show which ended its run in November 2012, and miscellaneous renovations and abandonments.
Interest expense, net of capitalized interest
Interest expense was
$299.0 million
, net of capitalized interest of $10.5 million, for the year ended December 31, 2013, compared to $288.8 million, net of capitalized interest of $2.0 million, for the year ended December 31, 2012. Our interest expense increased compared to the prior year period primarily due to the issuance of $500 million 4 1/4% senior notes in May 2013 and a full period of expense for the $1.94 billion Redemption Note and $900 million 5 3/8% first mortgage notes, which were issued in 2012. Capitalized interest increased due to the construction costs of Wynn Palace.
Other non-operating costs and expenses
Interest income was $15.7 million and $12.5 million for the years ended December 31, 2013 and 2012, respectively. This increase is mainly due to higher cash balances during 2013. During 2013 and 2012, our short-term investment strategy was to preserve capital while retaining sufficient liquidity. The majority of our short-term investments were primarily in money market accounts, time deposits and fixed deposits with a maturity of three months or less.
We recorded a gain of $14.2 million and $1.0 million for the years ended December 31, 2013 and December 31, 2012, respectively, resulting from the changes in the fair value of our interest rate swaps during those years.
During the year ended December 31, 2013, we recognized $40.4 million in loss from extinguishment of debt. On May 22, 2013, Wynn Las Vegas completed the purchase of $274.7 million of the 7 7/8% First Mortgage Notes due 2017 (the “2017 Notes”) pursuant to a tender offer for any and all of the 2017 Notes. In connection with this tender offer, Wynn Las Vegas, LLC paid $19.6 million in consideration to holders who tendered their notes. Additionally, Wynn Las Vegas, LLC expensed $6.7 million of unamortized financing costs and original issue discount related to the 2017 Notes and incurred other fees of approximately $0.3 million related to the tender offer. On November 1, 2013, Wynn Las Vegas, LLC redeemed the untendered 2017 Notes plus accrued and unpaid interest. As a result of the redemption, we incurred redemption fees of $8.9 million and expensed $4.9 million of unamortized financing costs and original issue discount.
During the year ended December 31, 2012, we recognized $25.2 million in loss from extinguishment of debt primarily attributable to the amendment of our credit agreements. In March 2012, Wynn Las Vegas, LLC entered into an eighth amendment to its Amended and Restated Credit Agreement (the “Wynn Las Vegas Credit Agreement”). In connection with this
50
amendment, Wynn Las Vegas, LLC prepaid all term loans under the Wynn Las Vegas Credit Agreement, terminated all of its revolving credit commitments that were due to expire in 2013, and terminated all but $100 million of its revolving credit commitments expiring in 2015. In connection with this transaction, we expensed deferred financing fees of $4.8 million. Additionally, as described in Item 8—“Financial Statements and Supplementary Data”, Note 8 “Long-Term Debt” to our Consolidated Financial Statements, we amended our Wynn Macau credit facilities in July 2012. In connection with amending the Wynn Macau credit facilities, we expensed $17.7 million of deferred financing costs and third party fees.
Income Taxes
For the year ended December 31, 2013, we recorded a tax benefit of $17.6 million, and for the year ended December 31, 2012, we recorded a tax expense of $4.3 million. Our income tax benefit was primarily related to a decrease in our deferred tax liabilities reduced by foreign taxes assessable on the dividends of Wynn Macau SA. Since June 30, 2010, we have no longer considered our portion of the tax earnings and profits of Wynn Macau, Limited to be permanently reinvested. No additional U.S. tax provision has been made with respect to amounts not considered permanently reinvested as we anticipate that U.S. foreign tax credits should be sufficient to eliminate any U.S. tax provision relating to such repatriation. We have not provided deferred U.S. income taxes or foreign withholding taxes on temporary differences which are considered indefinitely reinvested.
On November 30, 2010, Wynn Macau SA received an exemption from Macau’s 12% Complementary Tax on casino gaming profits, thereby exempting the casino gaming profits of Wynn Macau SA through December 31, 2015. Accordingly, we were exempted from the payment of approximately $107.3 million and $87.1 million in such taxes for the years ended December 31, 2013 and 2012, respectively. Our non-gaming profits remain subject to the Macau Complementary Tax and casino winnings remain subject to the Macau Special Gaming tax and other levies at a rate totaling 39% in accordance with our concession agreement.
In April 2012, the Company reached an agreement with the Appellate division of the IRS regarding issues raised during the examination of the 2006 through 2009 U.S. income tax returns. The settlement with the Appellate division did not impact the Company’s unrecognized tax benefits. The settlement of the 2006 through 2009 examination issues resulted in a cash tax payment of $1.3 million and the utilization of $3.1 million and $0.9 million in foreign tax credit and general business credit carryforwards, respectively.
During December 2012, the IRS completed an examination of the Company’s 2010 U.S. income tax return and had no changes. In May 2013, the Company received notification that the IRS completed its examination of the Company’s 2011 U.S. income tax return and had no changes.
In July 2012, the Macau Financial Services Bureau commenced an examination of the 2008 Macau income tax return of Wynn Macau SA. In November 2012, the Company received the results of the examination. While no additional tax was due, adjustments were made to the Company’s foreign net operating loss carryforwards.
In January 2013, the Macau Financial Services Bureau examined the 2009 and 2010 Macau income tax returns of Palo, which is a co-holder of the land concession for Wynn Palace. The exam resulted in no change to the tax returns.
Net income attributable to noncontrolling interests
Net income attributable to noncontrolling interests of $275.5 million for the year ended December 31, 2013, compared to $226.7 million for the year ended December 31, 2012. These amounts represent the noncontrolling interests’ share of net income from Wynn Macau, Limited for each year.
51
Adjusted Property EBITDA
We use Adjusted Property EBITDA to manage the operating results of our segments. Adjusted Property EBITDA is earnings before interest, taxes, depreciation, amortization, pre-opening costs, property charges and other, corporate expenses, intercompany golf course and water rights leases, stock-based compensation, and other non-operating income and expenses, and includes equity in income from unconsolidated affiliates. Adjusted Property EBITDA is presented exclusively as a supplemental disclosure because we believe that it is widely used to measure the performance, and as a basis for valuation, of gaming companies. We use Adjusted Property EBITDA as a measure of the operating performance of our segments and to compare the operating performance of our properties with those of our competitors. We also present Adjusted Property EBITDA because it is used by some investors as a way to measure a company’s ability to incur and service debt, make capital expenditures and meet working capital requirements. Gaming companies have historically reported EBITDA as a supplement to financial measures in accordance with U.S. generally accepted accounting principles (“GAAP”). In order to view the operations of their casinos on a more stand-alone basis, gaming companies, including us, have historically excluded from their EBITDA calculations pre-opening expenses, property charges, corporate expenses and stock-based compensation that do not relate to the management of specific casino properties. However, Adjusted Property EBITDA should not be considered as an alternative to operating income as an indicator of our performance, as an alternative to cash flows from operating activities as a measure of liquidity, or as an alternative to any other measure determined in accordance with GAAP. Unlike net income, Adjusted Property EBITDA does not include depreciation or interest expense and therefore does not reflect current or future capital expenditures or the cost of capital. We have significant uses of cash flows, including capital expenditures, interest payments, debt principal repayments, taxes and other non-recurring charges, which are not reflected in Adjusted Property EBITDA. Also, our calculation of Adjusted Property EBITDA may be different from the calculation methods used by other companies and, therefore, comparability may be limited.
The following table summarizes Adjusted Property EBITDA (in thousands) for our Macau and Las Vegas Operations as reviewed by management and summarized in Item 8—“Financial Statements and Supplementary Data”, Note 18 “Segment Information.” That footnote also presents a reconciliation of Adjusted Property EBITDA to net income.
|
Years Ended December 31,
|
|||||||||||
|
2014
|
2013
|
2012
|
|||||||||
|
Macau Operations
|
$
|
1,258,082
|
|
$
|
1,324,119
|
|
$
|
1,167,340
|
|
||
|
Las Vegas Operations
|
515,196
|
|
486,682
|
|
408,472
|
|
|||||
|
$
|
1,773,278
|
|
$
|
1,810,801
|
|
$
|
1,575,812
|
|
|||
Adjusted Property EBITDA at our Macau Operations decreased year-over-year by
5.0%
for the year ended December 31, 2014 due to decline in VIP turnover, partially offset by an increase in table games win from our mass market gaming operations. Adjusted Property EBITDA at our Las Vegas Operations increased year-over-year by
5.9%
for the year ended December 31, 2014 driven by our non-casino revenue performance.
Adjusted Property EBITDA at our Macau and Las Vegas Operations increased year-over-year by
13.4%
and
19.1%
for the year ended December 31, 2013, respectively. Both benefited from stronger operating results primarily in the casino department due to an increase in table games volume and win percentage.
Refer to the discussions above regarding the specific details of our results of operations.
Liquidity and Capital Resources
Operating Activities
Our operating cash flows primarily consist of our operating income generated by our Macau and Las Vegas Operations (excluding depreciation and other non-cash charges), interest paid and earned, and changes in working capital accounts such as receivables, inventories, prepaid expenses, and payables. Our table games play both in Macau and Las Vegas is a mix of cash play and credit play, while our slot machine play is conducted primarily on a cash basis. A significant portion of our table games revenue is attributable to the play of a limited number of premium international customers that gamble on credit. The ability to collect these gaming receivables may impact our operating cash flow for the period. Our rooms, food and beverage, and entertainment, retail, and other revenue is conducted primarily on a cash basis or as a trade receivable. Accordingly, operating cash flows will be impacted by changes in operating income and accounts receivables.
52
Net cash provided by operations for the year ended December 31, 2014 was
$1,098.3 million
compared to
$1,676.6 million
provided by operations for the year ended December 31, 2013. The decline in cash provided by operations was primarily due to a decrease in our accounts payable, accrued expenses and customer deposits and from a reduction in operating income driven by our casino revenue results. Net cash provided by operations for the year ended December 31, 2013 was $1,676.6 million compared to $1,185.7 million provided by operations for the year ended December 31, 2012. Cash flow from operations improved due to significant changes in ordinary working capital accounts such as accounts payable and accrued expenses. Also benefiting operating cash flow for the year ended December 31, 2013 was increased operating income that was driven primarily by stronger operating results in the casino department.
Investing Activities
Net cash used in investing activities for the year ended
December 31, 2014
was
$1,114.4 million
compared to net cash used in investing activities of
$677.6 million
for the same period in 2013. During the year ended
December 31, 2014
, we had
$1,127.0 million
in capital expenditures, net of construction payables and retention, primarily for Wynn Palace construction. In addition, we used $218.9 million in cash for deposits primarily associated with the Wynn Palace construction and for payment of our Massachusetts gaming license. Net cash used in investing activities for the year ended
December 31, 2014
was partially offset by proceeds of
$198.9 million
provided by restricted cash that we applied to repayment of certain Wynn Palace related construction and development costs. The primary use of cash for the year ended December 31, 2013 was
$506.8 million
for capital expenditures related to site preparation costs for Wynn Palace land and various renovations at our resorts including Wynn Macau guest room renovations.
Net cash used in investing activities for the year ended December 31, 2012 was
$344.9 million
. During 2012, our primary uses were capital expenditures of $241.0 million and the restriction of $99.2 million in proceeds from our debt instruments for the payment of certain Wynn Palace related construction and development costs. Capital expenditures included site preparation costs for the Wynn Palace land, a one-time payment in consideration of an unrelated third party’s relinquishment of certain rights in and future development on the Wynn Palace land, remodel of two Las Vegas restaurants and the conversion of certain storage and office areas in Macau to two new retail outlets.
Financing Activities
Net cash flows used in financing activities was
$235.6 million
for the year ended
December 31, 2014
, mainly due to the payment of dividends of
$942.9 million
and payments on our long-term debt, primarily offset by proceeds of $755.6 million from the issuance of senior notes and $132.6 million from borrowings, net of repayments, under our Wynn Macau revolving credit facility. During 2014, we used
$98.4 million
for open market purchases of principal on our first mortgage notes and $31.5 million for the repayment of remaining principal on our note payable secured by aircraft.
Net cash flows used in financing activities of
$291.1 million
for the year ended December 31, 2013 was primarily for the payment of dividends of
$1,035.0 million
and the redemption of first mortgage notes of $500.0 million, offset by proceeds from the issuance of senior notes of $1,100.0 million and the increase in our senior term loan facility of $200.0 million.
Net cash flows used in financing activities were
$382.5 million
for the year ended December 31, 2012, which was primarily attributable to principal payments of
$1,022.8 million
on term loan facilities and payment of dividends of
$955.5 million
, partially offset by proceeds of
$1,648.6 million
from the issuance of first mortgage notes of $900.0 million and proceeds of $748.6 million from the fully funded senior term loan facility.
Capital Resources
At
December 31, 2014
, we had approximately
$2,182.2 million
of cash and cash equivalents and
$250.3 million
of available-for-sale investments in domestic debt securities. Cash and cash equivalents include cash in bank and fixed deposits, investments in money market funds, domestic and foreign bank time deposits and commercial paper, all with maturities of less than 90 days. Of these amounts, Wynn Macau, Limited and its subsidiaries held
$1,391.0 million
in cash, of which we own
72%
. If our portion of this cash was repatriated to the U.S. on
December 31, 2014
, approximately 72% of this amount would be subject to U.S. tax in the year of repatriation. Wynn Resorts, Limited, which is not a guarantor of the debt of its subsidiaries, held
$524.8 million
(including cash of its subsidiaries other than those of Wynn Las Vegas, LLC and Wynn Macau, Limited) and
$250.3 million
of cash and available-for-sale investments, respectively. Wynn Las Vegas, LLC held cash balances of
$266.4 million
.
53
We expect that our future cash needs will relate primarily to the funding of our development projects, debt service and retirement, general corporate purposes and enhancements to our operating resorts. We intend to primarily fund our development projects with the available borrowing capacity under our bank credit facilities.
The Wynn Macau credit facilities consist of a $950 million equivalent fully funded senior secured term loan facility and a $1.55 billion equivalent senior secured revolving credit facility (together, the "Wynn Macau Credit Facilities"). Borrowings under the Wynn Macau Credit Facilities, which consist of both Hong Kong and United States dollar tranches, will be used to fund the design, development, construction and pre-opening expenses of Wynn Palace, and for general corporate purposes. As of
December 31, 2014
, the Company had
$1.42 billion
of available borrowing capacity under the senior secured revolving credit facility.
The Wynn America credit facilities consist of a $375 million senior secured revolving credit facility and an $875 million delay draw senior secured term loan facility (together, the "Wynn America Credit Facilities"). Borrowings under the Wynn America Credit Facilities will be used to fund the design, development, construction and pre-opening expenses of the Wynn resort in Massachusetts and for other general corporate purposes. As of December 31, 2014, there were no amounts drawn under the Wynn America Credit Facilities, however there were outstanding letters of credit totaling $8.9 million reducing the available borrowing capacity to
$1.24 billion
.
We believe that cash flow from operations, availability under our bank credit facilities and our existing cash balances will be sufficient to satisfy our currently anticipated cash requirements through at least the next 12 months. If any additional financing becomes necessary, we cannot provide assurance that future borrowings will be available.
Macau Related Debt
Our Macau related debt consists of senior notes and the Wynn Macau Credit Facilities.
On March 20, 2014, Wynn Macau, Limited (“WML”), an indirect subsidiary of Wynn Resorts, Limited, issued $750 million aggregate principal amount of 5 1/4% Senior Notes due 2021 (the “Additional 2021 Notes”), which were consolidated and form a single series with the $600 million aggregate principal amount of 5 1/4% Senior Notes due 2021 issued by WML on October 16, 2013 (the “Original 2021 Notes” and together with the “Additional 2021 Notes”, the “2021 Notes”). WML received net proceeds of approximately $748.8 million after adding the original issue premium and deducting commissions and expenses of the offering. WML will use the net proceeds for working capital requirements and general corporate purposes.
The Additional 2021 Notes have the same terms and conditions as those of the Original 2021 Notes. The 2021 Notes will bear interest at the rate of 5 1/4% per annum and will mature on October 15, 2021. Interest on the 2021 Notes is payable semi-annually in arrears on April 15 and October 15 of each year, beginning on April 15, 2014. At any time on or before October 14, 2016, WML may redeem the 2021 Notes, in whole or in part, at a redemption price equal to the greater of (a) 100% of the aggregate principal amount of the 2021 Notes or (b) a “make-whole” amount as determined by an independent investment banker in accordance with the terms of the indenture for the 2021 Notes, dated as of October 16, 2013 (the "WML Indenture"). In either case, the redemption price would include accrued and unpaid interest. In addition, on or after October 15, 2016, WML may redeem the 2021 Notes, in whole or in part, at a premium decreasing annually from 103.94% of the principal amount to zero, plus accrued and unpaid interest. If WML undergoes a Change of Control (as defined in the WML Indenture), it must offer to repurchase the 2021 Notes at a price equal to 101% of the aggregate principal amount thereof, plus accrued and unpaid interest. In addition, the Company may redeem the 2021 Notes, in whole but not in part, at a redemption price equal to 100% of the principal amount, plus accrued and unpaid interest, in response to any change in or amendment to certain tax laws or tax positions. Further, if a holder or beneficial owner of the 2021 Notes fails to meet certain requirements imposed by any Gaming Authority (as defined in the WML Indenture), WML may require the holder or beneficial owner to dispose of or redeem its 2021 Notes.
The 2021 Notes are WML’s general unsecured obligations and rank pari passu in right of payment with all of WML’s existing and future senior unsecured indebtedness; will rank senior to all of WML’s future subordinated indebtedness, if any; will be effectively subordinated to all of WML’s future secured indebtedness to the extent of the value of the assets securing such debt; and will be structurally subordinated to all existing and future obligations of WML’s subsidiaries, including Wynn Macau Credit Facilities’ existing credit facilities. The 2021 Notes are not registered under the Securities Act of 1933, as amended (the “Securities Act”), and the 2021 Notes are subject to restrictions on transferability and resale.
The WML Indenture contains covenants limiting WML’s (and certain of its subsidiaries’) ability to, among other things: merge or consolidate with another company; transfer or sell all or substantially all of its properties or assets; and lease all or substantially all of its properties or assets. The terms of the WML Indenture contain customary events of default, including, but
54
not limited to: default for 30 days in the payment when due of interest on the 2021 Notes; default in the payment when due of the principal of, or premium, if any, on the 2021 Notes; failure to comply with any payment obligations relating to the repurchase by WML of the 2021 Notes upon a change of control; failure to comply with certain covenants in the WML Indenture; certain defaults on certain other indebtedness; failure to pay judgments against WML or certain subsidiaries that, in the aggregate, exceed $50 million; and certain events of bankruptcy or insolvency. In the case of an event of default arising from certain events of bankruptcy or insolvency, all 2021 Notes then outstanding will become due and payable immediately without further action or notice.
Under the Wynn Macau Credit Facilities, the revolving credit facility matures in July 2017 and the term loan facility matures in July 2018. The principal amount of the term loan is required to be repaid in two equal installments in July 2017 and July 2018. The Wynn Macau Credit Facilities bear interest for the first six months after closing at LIBOR or HIBOR plus a margin of 2.50% and thereafter is subject to LIBOR or HIBOR plus a margin of between 1.75% to 2.50% based on Wynn Macau SA’s leverage ratio. The annual fee required to pay for unborrowed amounts, if any, is 0.61% per annum, payable quarterly in arrears, calculated based on the daily average of the unborrowed amounts under such credit facilities.
Borrowings under the Wynn Macau Credit Facilities are guaranteed by Palo, a subsidiary of Wynn Macau SA, and by certain subsidiaries of the Company that own equity interests in Wynn Macau SA, and are secured by substantially all of the assets of Wynn Macau SA, the equity interests in Wynn Macau SA and substantially all of the assets of Palo.
The Wynn Macau Credit Facilities contain a requirement that Wynn Macau SA must make mandatory repayments of indebtedness from specified percentages of excess cash flow. If Wynn Macau SA meets a Consolidated Leverage Ratio, as defined in the Wynn Macau Credit Facilities, of greater than 4.0 to 1, such repayment is defined as 50% of Excess Cash Flow, as defined in the Wynn Macau Credit Facilities. If the Consolidated Leverage Ratio is equal or less than 4.0 to 1, then no repayment is required.
The Wynn Macau Credit Facilities contain customary covenants restricting certain activities including, but not limited to: the incurrence of additional indebtedness, the incurrence or creation of liens on any of its property, sale and leaseback transactions, the ability to dispose of assets, and making loans or other investments. In addition, Wynn Macau SA was required by the financial covenants to maintain a Leverage Ratio, as defined in the Wynn Macau Credit Facilities, of not greater than 4.5 to 1 as of December 31, 2014, and an Interest Coverage Ratio, as defined in the Wynn Macau Credit Facilities, of not less than 2.00 to 1.
In connection with the initial financing of Wynn Macau SA, Wynn Macau SA entered into a Bank Guarantee Reimbursement Agreement with Banco Nacional Ultramarino, S.A. (“BNU”) for the benefit of the Macau government. This guarantee assures Wynn Macau SA’s performance under the casino concession agreement, including the payment of premiums, fines and indemnity for any material failure to perform under the terms of the concession agreement. As of December 31, 2014, the guarantee was in the amount of 300 million Macau patacas (approximately $37 million) and will remain at such amount until 180 days after the end of the term of the concession agreement (2022). BNU, as issuer of the guarantee, is currently secured by a second priority security interest in the senior lender collateral package. From and after repayment of all indebtedness under the Wynn Macau Credit Facilities, Wynn Macau SA is obligated to promptly, upon demand by BNU, repay any claim made on the guarantee by the Macau government. BNU is paid an annual fee for the guarantee of approximately 2.3 million Macau patacas (approximately $0.3 million).
U.S. and Corporate Related Debt
Our U.S. related debt consists of first mortgage notes, senior notes and the Wynn America Credit Facilities. The Corporate related debt consists of the Redemption Price Promissory Note ("Redemption Note").
The first mortgage notes are issued by Wynn Las Vegas, LLC and Wynn Las Vegas Capital Corp., an indirect wholly owned subsidiary of Wynn Resorts, Limited (together, the "Issuers"). Our first mortgage notes are senior obligations of the Issuers and are unsecured (except by the first priority pledge by Wynn Resorts Holdings, LLC of its equity interests in Wynn Las Vegas, LLC (the "Holdings pledge"). These issuances rank pari passu in right of payment with each issuance and are not guaranteed by any of our subsidiaries. If the Issuers undergo a change of control, they must offer to repurchase the first mortgage notes at 101% of the principal amount, plus accrued and unpaid interest. The indentures governing the first mortgage notes contain customary negative covenants and financial covenants, including, but not limited to, covenants that restrict Wynn Las Vegas, LLC's ability to: pay dividends or distributions or repurchase equity; incur additional debt; make investments; create liens on assets to secure debt; enter into transactions with affiliates; enter into sale-leaseback transactions; merge or consolidate with another company; transfer and sell assets or create dividend and other payment restrictions affecting subsidiaries.
55
In February 2015, the Issuers commenced a cash tender offer for any and all of the outstanding aggregate principal amounts of the 7 3/4% first mortgage notes and the 7 7/8% first mortgage notes (together the "2020 Notes"). Separately, the Issuers completed the issuance of $1.8 billion aggregate principal amount of 5 1/2% senior notes due 2025 (the "2025 Notes"). We used the net proceeds from the 2025 Notes to cover the cost of purchasing the 2020 Notes tendered in the tender offer. We also satisfied and discharged the indentures under which the 2020 Notes were issued and will use the remaining net proceeds to redeem the 2020 Notes not tendered and for general corporate purposes. For more information on the cash tender offer of the 2020 Notes and the issuance of the 2025 Notes, see Item 8—“Financial Statements and Supplementary Data”, Note 20 “Subsequent Events”.
In May 2013, the Issuers completed the issuance of $500 million aggregate principal amount of 4 1/4% Senior Notes due 2023 (the “2023 Notes”) pursuant to an indenture, dated as of May 22, 2013 (the “2023 Indenture”), among the Issuers, the Guarantors (as defined below) and U.S. Bank National Association, as trustee. The 2023 Notes were issued at par. The Issuers used the net proceeds from the 2023 Notes to cover the cost of purchasing the 2017 Notes tendered in a tender offer. In addition, the Issuers satisfied and discharged the 2017 Indenture and, in November 2013, used the remaining net proceeds to redeem all of the 2017 Notes not previously tendered. In connection with the issuance of the 2023 Notes, the Company capitalized approximately $4.1 million of financing costs.
The 2023 Notes will mature on May 30, 2023 and bear interest at the rate of 4 1/4% per annum. The Issuers may, at their option, redeem the 2023 Notes, in whole or in part, at any time or from time to time prior to their stated maturity. The redemption price for 2023 Notes that are redeemed before February 28, 2023 will include a make-whole premium. The 2023 Notes are also subject to mandatory redemption requirements imposed by gaming laws and regulations of gaming authorities in Nevada.
The 2023 Notes are the Issuers’ senior unsecured obligations and rank pari passu in right of payment with the Issuers’ first mortgage notes. The 2023 Notes are secured by a first priority pledge of the Company’s equity interests. The equity interests of the Company also secure the first mortgage notes. If Wynn Resorts, Limited receives an investment grade rating from one or more ratings agencies, the first priority pledge securing the 2023 Notes will be released.
The 2023 Notes are jointly and severally guaranteed by all of the Issuers’ subsidiaries, other than Wynn Las Vegas Capital Corp. which was a co-issuer (the “Guarantors”). The guarantees are senior unsecured obligations of the Guarantors and rank senior in right of payment to all of their existing and future subordinated debt. The guarantees rank equally in right of payment with all existing and future liabilities of the Guarantors that are not so subordinated and will be effectively subordinated in right of payment to all of such Guarantors’ existing and future secured debt (to the extent of the collateral securing such debt).
The 2023 Indenture contains covenants limiting the Issuers’ and the Guarantors' ability to create liens on assets to secure debt; enter into sale-leaseback transactions; and merge or consolidate with another company. These covenants are subject to a number of important and significant limitations, qualifications and exceptions.
On November 20, 2014, Wynn America, an indirect wholly owned subsidiary, and certain subsidiaries of Wynn America entered into a $1.25 billion senior secured credit facility. Borrowings under the Wynn America Credit Facilities will be used by us primarily to fund the design, development, construction and pre-opening expenses of the Wynn resort in Massachusetts and for other general corporate purposes.
The revolving credit facility matures in November 2019. The term loan facility matures in November 2020 and will require quarterly principal payments, scheduled to begin in June 2018. Subject to certain exceptions, the Wynn America Credit Facilities bear interest at either base rate plus 0.75% per annum or the reserve adjusted eurodollar rate plus 1.75% per annum. The annual fee required to pay for unborrowed amounts, if any, is 0.30% per annum, payable quarterly in arrears, calculated based on the daily average of the unborrowed amounts under such credit facilities.
Certain subsidiaries of Wynn America will guarantee the obligation of Wynn America under the credit facilities. Wynn America has agreed to use commercially reasonable efforts to cause a series of corporate restructurings and related transactions, including receipt of gaming approvals from relevant gaming authorities, pursuant to which Wynn Las Vegas, LLC and its subsidiaries will become subsidiaries of Wynn Las Vegas Holdings, LLC, a direct subsidiary of Wynn America (the "Wynn Las Vegas Reorganization"). Upon the consummation of the Wynn Las Vegas Reorganization (including receipt of all approvals required under applicable gaming laws and regulations), Wynn Las Vegas, LLC and its subsidiaries shall be restricted subsidiaries under the credit facilities but shall not guarantee the obligations of Wynn America until such time, and then only to such extent, as may be permitted by any then existing Wynn Las Vegas, LLC's senior secured notes.
56
The Wynn America Credit Facilities contain customary representation and warranties, events of default and negative and affirmative covenants, including, among other things, limitations on: indebtedness; investments; restricted payments; mergers and acquisitions; payments of indebtedness; negative pledges; liens; transactions with affiliates and sales of assets. In addition, Wynn America is subject to financial covenants including maintaining a Maximum Consolidated Senior Secured Net Leverage Ratio and a Minimum Consolidated EBITDA, each as defined in the Wynn America Credit Facilities. Commencing with the second full fiscal quarter ending after the fiscal quarter in which the opening of the Wynn resort in Massachusetts occurs, the Maximum Consolidated Senior Secured Net Leverage Ratio is not to exceed 2.75 to 1. Commencing with the first full fiscal quarter ending with the fiscal quarter in which the Wynn Las Vegas Reorganization occurs, the Minimum Consolidated EBITDA is not to be less than $200.0 million.
The Company has provided a completion guaranty in favor of the lenders under the Wynn America Credit Facilities to support the development and opening of the Wynn resort in Massachusetts.
Wynn America and the guarantors have entered into a security agreement in favor of the lenders under the Wynn America Credit Facilities pursuant to which, subject to certain exceptions, Wynn America and the guarantors have pledged all equity interests in the guarantors to the extent permitted by applicable law and granted a first priority security interest in substantially all of the other existing and future assets of the guarantors.
Based on the Board of Director's finding of "unsuitability," on February 18, 2012, we redeemed and canceled Aruze's 24,549,222 shares of Wynn Resorts' common stock. Following a finding of "unsuitability," our articles of incorporation authorize redemption at "fair value" of the shares held by unsuitable persons. Pursuant to the articles of incorporation, we issued the Redemption Note to Aruze, a former stockholder and related party, in redemption of the shares. The Redemption Note has a principal amount of approximately $1.94 billion, matures on February 18, 2022 and bears interest at the rate of 2% per annum, payable annually in arrears on each anniversary of the date of the Redemption Note. We may, in our sole and absolute discretion, at any time and from time to time, and without penalty or premium, prepay the whole or any portion of the principal or interest due under the Redemption Note. In no instance shall any payment obligation under the Redemption Note be accelerated except in the sole and absolute discretion of Wynn Resorts or as specifically mandated by law. The indebtedness evidenced by the Redemption Note, to the prior payment in full of all existing and future obligations of Wynn Resorts and any of its affiliates in respect of indebtedness for borrowed money of any kind or nature. Aruze, Universal Entertainment Corporation and Kazuo Okada have challenged the redemption of Aruze's shares and we are currently involved in litigation with those parties as well as related shareholder derivative litigation. The outcome of these various proceedings cannot be predicted. Any adverse judgments or settlements involving payment of a material sum of money could cause a material adverse effect on our financial condition and results of operations and could expose us to additional claims by third parties, including current or former investors or regulators. Any adverse judgments or settlements would reduce our profits and could limit our ability to operate our business. See Item 1A—"Risk Factors", Item 3—"Legal Proceedings" and Item 8—"Financial Statements and Supplementary Data", Note 17 "Commitments and Contingencies".
Other Factors Affecting Liquidity
Wynn Resorts is a holding company and, as a result, our ability to pay dividends is highly dependent on our ability to obtain funds and our subsidiaries’ ability to provide funds to us. Restrictions imposed by our Wynn Las Vegas, LLC, Wynn America and Wynn Macau SA debt instruments restrict our ability to pay dividends. Specifically, Wynn Las Vegas, LLC and certain of its subsidiaries are restricted under the indentures governing its first mortgage notes from making certain “restricted payments” as defined in the indentures. These restricted payments include the payment of dividends or distributions to any direct or indirect holders of equity interests of Wynn Las Vegas, LLC. These restricted payments may not be made unless certain financial and non-financial criteria have been satisfied. The Wynn Macau Credit Facilities contain similar restrictions, including a specified leverage ratio, which must be met in order to pay dividends and Wynn Macau is presently able to pay dividends in accordance with the Wynn Macau Credit Facilities.
Wynn Las Vegas, LLC intends to fund its operations and capital requirements from cash on hand and operating cash flow. We cannot assure you however, that our Las Vegas Operations will generate sufficient cash flow from operations or the availability of additional indebtedness will be sufficient to enable us to service and repay Wynn Las Vegas, LLC’s indebtedness and to fund its other liquidity needs. Similarly, we expect that our Macau Operations will fund Wynn Macau, Limited's debt service obligations with existing cash, operating cash flow and availability under the Wynn Macau Credit Facilities. However, we cannot assure you that operating cash flows will be sufficient to do so. We may refinance all or a portion of our indebtedness on or before maturity. We cannot assure you that we will be able to refinance any of the indebtedness on acceptable terms or at all.
57
Legal proceedings in which we are involved also may impact our liquidity. No assurance can be provided as to the outcome of such proceedings. In addition, litigation inherently involves significant costs. For information regarding legal proceedings, see Item 8—"Financial Statements and Supplementary Data", Note 17 "Commitments and Contingencies".
We have in the past repurchased, and in the future, we may periodically consider repurchasing our outstanding notes for cash. The amount of any notes to be repurchased, as well as the timing of any repurchases, will be based on business, market and other conditions and factors, including price, contractual requirements or consents, and capital availability. Any repurchases might be made using a variety of methods, which may include open market purchases, privately negotiated transactions, or by any combination of those methods, in compliance with applicable securities laws and regulations.
Our Board of Directors has authorized an equity repurchase program of up to $1.7 billion. The repurchase program may include repurchases from time to time through open market purchases, in privately negotiated transactions, and under plans complying with Rules 10b5-1 and 10b-18 under the Exchange Act. As of December 31, 2014, we had purchased a cumulative total of 12,804,954 shares of our common stock for a net cost of $1.1 billion under the program, with no purchases made under this program during the years ended December 31, 2014, 2013 and 2012.
New business developments or other unforeseen events may occur, resulting in the need to raise additional funds. We continue to explore opportunities to develop additional gaming or related businesses in domestic and international markets. There can be no assurances regarding the business prospects with respect to any other opportunity. Any new development would require us to obtain additional financing. We may decide to conduct any such development through Wynn Resorts or through subsidiaries separate from the Las Vegas or Macau-related entities.
The Company’s articles of incorporation provide that, to the extent required by the gaming authority making the determination of unsuitability or to the extent the Board of Directors determines, in its sole discretion, that a person is likely to jeopardize the Company’s or any affiliate’s application for, receipt of, approval for, right to the use of, or entitlement to, any gaming license, shares of Wynn Resorts’ capital stock that are owned or controlled by an unsuitable person or its affiliates are subject to redemption by the Company. The redemption price may be paid in cash, by promissory note or both, as required by the applicable gaming authority and, if not, as we elect. Any promissory note that we issue to an unsuitable person or its affiliate in exchange for its shares could increase our debt to equity ratio and would increase our leverage ratio.
Off Balance Sheet Arrangements
We have not entered into any transactions with special purpose entities nor do we engage in any derivatives except for previously discussed interest rate swaps. We do not have any retained or contingent interest in assets transferred to an unconsolidated entity. At
December 31, 2014
, we had outstanding letters of credit totaling
$8.9 million
.
Contractual Obligations and Commitments
The following table summarizes our scheduled contractual commitments at December 31, 2014 (in millions):
|
Payments Due By Period
|
|||||||||||||||||||
|
Less
Than 1 Year |
1 to 3
Years |
4 to 5
Years |
After
5 Years |
Total
|
|||||||||||||||
|
Long-term debt obligations
|
$
|
—
|
|
$
|
508.9
|
|
$
|
576.3
|
|
$
|
6,260.0
|
|
$
|
7,345.2
|
|
||||
|
Fixed interest payments
|
301.6
|
|
603.2
|
|
603.2
|
|
457.5
|
|
1,965.5
|
|
|||||||||
|
Estimated variable interest payments (1)
|
25.1
|
|
44.4
|
|
6.5
|
|
—
|
|
76.0
|
|
|||||||||
|
Operating leases
|
12.6
|
|
21.2
|
|
16.8
|
|
31.1
|
|
81.7
|
|
|||||||||
|
Construction contracts and commitments
|
1,269.4
|
|
252.3
|
|
—
|
|
—
|
|
1,521.7
|
|
|||||||||
|
Leasehold interest in land
|
30.8
|
|
16.0
|
|
—
|
|
—
|
|
46.8
|
|
|||||||||
|
Employment agreements
|
61.4
|
|
63.7
|
|
14.0
|
|
3.5
|
|
142.6
|
|
|||||||||
|
Other (2)
|
239.8
|
|
112.2
|
|
65.1
|
|
78.3
|
|
495.4
|
|
|||||||||
|
Total commitments
|
$
|
1,940.7
|
|
$
|
1,621.9
|
|
$
|
1,281.9
|
|
$
|
6,830.4
|
|
$
|
11,674.9
|
|
||||
|
(1)
|
Amounts for all periods represent our estimated future interest payments on our debt facilities based upon amounts outstanding and LIBOR or HIBOR rates at
December 31, 2014
. Such rates continue at historical lows as of
December 31, 2014
. Actual rates will vary.
|
58
|
(2)
|
Other includes open purchase orders, future charitable contributions, fixed gaming tax payments in Macau, aircraft purchase obligations and other contracts. As further discussed in Item 8—“Financial Statements and Supplementary Data”, Note 16 “Income Taxes”, of this report, we had
$88.9 million
of unrecognized tax benefits as of
December 31, 2014
. Due to the inherent uncertainty of the underlying tax positions, it is not practicable to assign this liability to any particular year and therefore it is not included in the table above as of
December 31, 2014
.
|
Critical Accounting Policies and Estimates
Management’s discussion and analysis of our results of operations and liquidity and capital resources are based on our consolidated financial statements. Our consolidated financial statements were prepared in conformity with accounting principles generally accepted in the United States of America. A summary of our significant accounting policies are presented in Item 8—"Financial Statements and Supplementary Data", Note 2 "Summary of Significant Accounting Policies". Certain of our accounting policies require management to apply significant judgment in defining the appropriate assumptions integral to financial estimates. On an ongoing basis, management evaluates those estimates, including those relating to the estimated lives of depreciable assets, asset impairment, allowances for doubtful accounts, accruals for customer loyalty programs, contingencies, litigation and other items. Judgments are based on historical experience, terms of existing contracts, industry trends and information available from outside sources, as appropriate. However, by their nature, judgments are subject to an inherent degree of uncertainty, and therefore actual results could differ from our estimates.
Development, Construction and Property and Equipment Estimates
During the construction and development of a resort, pre-opening or start-up costs are expensed when incurred. In connection with the construction and development of our resorts, significant start-up costs are incurred and charged to pre-opening costs through their respective openings. Once our resorts open, expenses associated with the opening of the resorts are no longer charged as pre-opening costs.
During the construction and development stage, direct costs such as those incurred for the design and construction of our resorts, including applicable portions of interest, are capitalized. Accordingly, the recorded amounts of property and equipment increase significantly during construction periods. Depreciation expense related to capitalized construction costs is recognized when the related assets are placed in service. Upon the opening of our resorts, we began recognizing depreciation expense on the resort’s fixed assets. The remaining estimated useful lives of assets are periodically reviewed.
Our leasehold interest in land in Macau under the land concession contracts entered into in August 2004 and May 2012 are being amortized over 25 years, to the initial term of the concession contract, which currently terminate in August 2029 and May 2037. Depreciation on a majority of the assets comprising Wynn Macau commenced in September of 2006, when Wynn Macau opened. The maximum useful life of assets at Wynn Macau is deemed to be the remaining life of the land concession which currently expires in August 2029, or the gaming concession which currently expires in June 2022. Consequently, depreciation related to Wynn Macau will generally be charged over shorter periods when compared to Wynn Las Vegas.
Costs of repairs and maintenance are charged to expense when incurred. The cost and accumulated depreciation of property and equipment retired or otherwise disposed of are eliminated from the respective accounts and any resulting gain or loss is included in property charges and other.
We also evaluate our property and equipment and other long-lived assets for impairment in accordance with applicable accounting standards. For assets to be disposed of, we recognize the asset at the lower of carrying value or fair market value less costs of disposal, as estimated based on comparable asset sales, solicited offers, or a discounted cash flow model. For assets to be held and used, we review for impairment whenever indicators of impairment exist. In reviewing for impairment, we compare the estimated future cash flows of the asset, on an undiscounted basis, to the carrying value of the asset. If the undiscounted cash flows exceed the carrying value, no impairment is indicated. If the undiscounted cash flows do not exceed the carrying value, an impairment is recorded based on the fair value of the asset, typically measured using a discounted cash flow model. If an asset is still under development, future cash flows include remaining construction costs. All recognized impairment losses, whether for assets to be disposed of or assets to be held and used, are recorded as operating expenses.
Redemption Price Promissory Note
In connection with the redemption of the shares previously held by Aruze, we recorded the fair value of the Redemption Note of approximately $1.94 billion in accordance with applicable accounting guidance. We utilized an independent third party valuation to assist in the determination of this fair value. In determining this fair value, we estimated the Redemption Note’s
59
present value using discounted cash flows with a probability weighted expected return for redemption assumptions and a discount rate which included time value and non-performance risk adjustments commensurate with risk of the Redemption Note.
Considerations for the redemption assumptions included the stated maturity of the Redemption Note, uncertainty of the related cash flows as well as potential effects of the following: uncertainties surrounding the potential outcome and timing of pending litigation with the Okada Parties (see Item 8—"Financial Statements and Supplementary Data", Note 17 “Commitments and Contingencies”); the outcome of on-going investigations of Aruze by the United States Attorney’s Office, the U.S. Department of Justice and the Nevada Gaming Control Board; and other potential legal and regulatory actions. In addition, in the furtherance of various future business objectives, we considered our ability, at our sole option, to prepay the Redemption Note at any time in accordance with its terms without penalty. Accordingly, we reasonably determined that the estimated life of the Redemption Note could be less than the contractual life of the Redemption Note.
In determination of the appropriate discount rate to be used in the estimated present value, the Redemption Note’s subordinated position relative to all other debt in our capital structure and credit ratings associated with our traded debt were considered. Observable inputs for the risk free rate based on Federal Reserve rates for U.S. Treasury securities and credit risk spread based on a yield curve index of similarly rated debt were used. As a result of this analysis, we concluded the Redemption Notes’ stated rate of 2% approximated a market rate.
Investments and Fair Value
We have made investments in domestic and foreign corporate debt securities and commercial paper. Our investment policy requires investments to be investment grade and limits the amount of exposure to any one issuer with the objective of minimizing the potential risk of principal loss. We determine the appropriate classification (held-to-maturity/available-for-sale) of our investments at the time of purchase and reevaluate such designation as of each balance sheet date. Our investments are reported at fair value, with unrealized gains and losses, net of tax, reported in other comprehensive income (loss). Adjustments are made for amortization of premiums and accretion of discounts to maturity computed under the effective interest method. Such amortization is included in interest income together with realized gains and losses and the stated interest on such securities.
We measure certain of our financial assets and liabilities, such as cash equivalents, available-for-sale securities and interest rate swaps, at fair value on a recurring basis pursuant to accounting standards for fair value measurements. Fair value is the price that would be received to sell an asset or paid to transfer a liability in an orderly transaction between market participants at the measurement date. These accounting standards establish a three-tier fair value hierarchy, which prioritizes the inputs used in measuring fair value. These tiers include: Level 1, defined as observable inputs such as quoted prices in active markets; Level 2, defined as inputs other than quoted prices in active markets that are either directly or indirectly observable; and Level 3, defined as unobservable inputs in which little or no market data exists, therefore requiring an entity to develop its own assumptions.
We obtain pricing information in determining the fair value of our available-for-sale securities from independent pricing vendors. Based on our inquiries, the pricing vendors use various pricing models consistent with what other market participants would use. The assumptions and inputs used by the pricing vendors are derived from market observable sources including: reported trades, broker/dealer quotes, issuer spreads, benchmark curves, bids, offers and other market-related data. We have not made adjustments to such prices. Each quarter, we validate the fair value pricing methodology to determine the fair value consistent with applicable accounting guidance and to confirm that the securities are classified properly in the fair value hierarchy. We also compare the pricing received from our vendors to independent sources for the same or similar securities.
Allowance for Estimated Doubtful Accounts Receivable
A substantial portion of our outstanding receivables relates to casino credit play. Credit play, through the issuance of markers, represents a significant portion of the table games volume at our Las Vegas Operations. While offered, the issuance of credit at our Macau Operations is less significant when compared to Las Vegas. Our goal is to maintain strict controls over the issuance of credit and aggressively pursue collection from those customers who fail to pay their balances in a timely fashion. These collection efforts may include the mailing of statements and delinquency notices, personal contacts, the use of outside collection agencies, and litigation. Markers issued at our Las Vegas Operations are generally legally enforceable instruments in the United States, and United States assets of foreign customers may be used to satisfy judgments entered in the United States.
The enforceability of markers and other forms of credit related to gaming debt outside of the United States varies from country to country. Some foreign countries do not recognize the enforceability of gaming related debt, or make enforcement
60
burdensome. We closely consider the likelihood and difficulty of enforceability, among other factors, when issuing credit to customers who are not residents of the United States. In addition to our internal credit and collection departments, located in both Las Vegas and Macau, we have a network of legal, accounting and collection professionals to assist us in our determinations regarding enforceability and our overall collection efforts.
As of
December 31, 2014
and
2013
, approximately
85%
and
86%
of our casino accounts receivable were owed by customers from foreign countries, primarily in Asia. In addition to enforceability issues, the collectability of markers given by foreign customers is affected by a number of factors including changes in currency exchange rates and economic conditions in the customers’ home countries.
We regularly evaluate our reserve for bad debts based on a specific review of customer accounts as well as management’s prior experience with collection trends in the casino industry and current economic and business conditions. In determining our allowance for estimated doubtful accounts receivable, we apply loss factors based on historical marker collection history to aged account balances and we specifically analyze the collectability of each account with a balance over a specified dollar amount, based upon the age, the customer’s financial condition, collection history and any other known information.
The following table presents key statistics related to our casino accounts receivable (in thousands):
|
December 31,
|
|||||||
|
2014
|
2013
|
||||||
|
Casino accounts receivable
|
$
|
257,930
|
|
$
|
252,998
|
|
|
|
Allowance for doubtful casino accounts receivable
|
$
|
74,149
|
|
$
|
73,561
|
|
|
|
Allowance as a percentage of casino accounts receivable
|
28.7
|
%
|
29.1
|
%
|
|||
|
Percentage of casino accounts receivable outstanding over 180 days
|
32.5
|
%
|
30.3
|
%
|
|||
Our reserve for doubtful casino accounts receivable is based on our estimates of amounts collectible and depends on the risk assessments and judgments by management regarding realizability, the state of the economy and our credit policy. In June 2014, the Company recorded an adjustment to its reserve estimates for casino accounts receivable based on the results of historical collection patterns and current collection trends. For the year ended
December 31, 2014
, this adjustment benefited operating income by
$8.7 million
and net income attributable to Wynn Resorts, Limited by
$6.8 million
(or
$0.07
per share on a fully diluted basis). For the year ended December 31, 2013, this adjustment benefited operating income by
$30.9 million
and net income attributable to Wynn Resorts, Limited by
$23.3 million
(or
$0.22
per share on a fully diluted basis). Our reserve methodology is applied similarly to credit extended at each of our resorts. As of
December 31, 2014
and 2013, approximately
28.2%
and
24.8%
, respectively, of our outstanding casino account receivable balance originated at our Macau Operations.
At
December 31, 2014
, a 100 basis-point change in the allowance for doubtful accounts as a percentage of casino accounts receivable would change the provision for doubtful accounts by approximately
$2.6 million
.
As our customer payment experience evolves, we will continue to refine our estimated reserve for bad debts. Accordingly, the associated provision for doubtful accounts expense may fluctuate. Because individual customer account balances can be significant, the reserve and the provision can change significantly between periods, as we become aware of additional information about a customer or changes occur in a region’s economy or legal system.
Derivative Financial Instruments
We seek to manage our market risk, including interest rate risk associated with variable rate borrowings, through balancing fixed-rate and variable-rate borrowings and the use of derivative financial instruments. We account for derivative financial instruments in accordance with applicable accounting standards. Derivative financial instruments are recognized as assets or liabilities, with changes in fair value affecting net income. As of
December 31, 2014
, changes in our interest rate swap fair values are being recorded in our Consolidated Statements of Income, as the swaps do not qualify for hedge accounting.
We measure the fair value of our interest rate swaps on a recurring basis. We categorize our interest rate swap contracts as Level 2 in the hierarchy as described above. The fair value approximates the amount we would receive (pay) if these contracts were settled at the respective valuation dates. Fair value is estimated based upon current, and predictions of future, interest rate levels along a yield curve, the remaining duration of the instruments and other market conditions, and therefore is subject to significant estimation and a high degree of variability of fluctuation between periods. We adjust this amount by applying a non-performance valuation, considering our creditworthiness or the creditworthiness of our counterparties at each settlement date, as applicable.
61
Stock-Based Compensation
Accounting standards for stock-based payments establish standards for the accounting for transactions in which an entity exchanges its equity instruments for goods and services or incurs a liability in exchange for goods and services that are based on the fair value of the entity’s equity instruments or that may be settled by the issuance of those equity instruments. It requires an entity to measure the costs of employee services received in exchange for an award of equity instruments based on the grant-date fair value of the award and recognize that cost over the service period. We use the Black-Scholes option pricing model to determine grant-date fair value of our stock options. The Black-Scholes model uses assumptions of expected volatility, risk-free interest rates, the expected term of options granted, and expected rates of dividends. Management determines these assumptions by reviewing current market rates, making industry comparisons and reviewing conditions relevant to our Company.
The expected volatility and expected term assumptions can significantly impact the fair value of stock options. We believe that the valuation techniques and the approach utilized to develop our assumptions are reasonable in calculating the fair value of the options we grant. We estimate the expected stock price volatility using a combination of implied and historical factors related to our stock price in accordance with applicable accounting standards. As our stock price fluctuates, this estimate will change. A hypothetical 10% change in the volatility assumption for the
25,800
options granted in 2014 would not have a material effect on the change in fair value. Expected term represents the estimated average time between the option’s grant date and its exercise date. A hypothetical 10% change in the expected term assumption for the
25,800
options granted in 2014 would not have a material effect on the change in fair value. These assumed changes in fair value would have been recognized over the vesting schedule of such awards.
Accounting standards also require the classification of stock compensation expense in the same financial statement line items as cash compensation, and therefore impacts our departmental expenses (and related operating margins), pre-opening costs and construction in progress for our development projects, and our general and administrative expenses (including corporate expenses).
Income Taxes
We are subject to income taxes in the United States and other foreign jurisdictions where we operate. Accounting standards require the recognition of deferred tax assets, net of applicable reserves, and liabilities for the estimated future tax consequences attributable to differences between financial statement carrying amounts of existing assets and liabilities and their respective tax bases and operating loss and tax credit carryforwards. Deferred tax assets and liabilities are measured using enacted tax rates in effect for the year in which those temporary differences are expected to be recovered or settled. The effect of a change in tax rates on the income tax provision and deferred tax assets and liabilities is recognized in the results of operations in the period that includes the enactment date. Accounting standards require recognition of a future tax benefit to the extent that realization of such benefit is more likely than not. Otherwise, a valuation allowance is applied.
As of
December 31, 2014
, we have a foreign tax credit carryover of
$3,284 million
and we have recorded a valuation allowance of
$3,242 million
against this asset based on our estimate of future realization. The foreign tax credits are attributable to the Macau special gaming tax which is 35% of gross gaming revenue in Macau. The U.S. taxing regime only allows a credit for 35% of “net” foreign source income. Due to our recent operating history of U.S. losses, we currently do not rely on forecasted taxable income in order to support the utilization of the foreign tax credits. We assess the recoverability of our deferred tax asset for foreign tax credits ("FTCs") and the appropriateness for a valuation allowance on a quarterly basis. We consider factors such as: our three year cumulative pre-tax book income, the reversal of taxable timing differences, expectations regarding the occurrence of U.S. source income versus foreign source income within the FTCs carryforward period and tax planning strategies. Historically, we have recorded a partial valuation allowance on FTCs. Based on the expectations for these factors in the next year, we may determine that the deferred tax asset is not recoverable and an additional valuation allowance is necessary. This determination would have a significant impact on the effective tax rate.
Our income tax returns are subject to examination by the IRS and other tax authorities in the locations where we operate. We assess potentially unfavorable outcomes of such examinations based on accounting standards for uncertain income taxes. The accounting standards prescribe a minimum recognition threshold a tax position is required to meet before being recognized in the financial statements.
Uncertain tax position accounting standards apply to all tax positions related to income taxes. These accounting standards utilize a two-step approach for evaluating tax positions. The tax benefit is measured as the largest amount of benefit that is more likely than not to be realized upon settlement.
62
As applicable, we recognize accrued penalties and interest related to unrecognized tax benefits in the provision for income taxes.
Recently Issued Accounting Standards
See related disclosure at Item 8—“Financial Statements and Supplementary Data”, Note 2 "Summary of Significant Accounting Policies."
Market risk is the risk of loss arising from adverse changes in market rates and prices, such as interest rates, foreign currency exchange rates and commodity prices.
Interest Rate Risks
One of our primary exposures to market risk is interest rate risk associated with our debt facilities that bear interest based on floating rates. We attempt to manage interest rate risk by managing the mix of long-term fixed rate borrowings and variable rate borrowings, supplemented by hedging activities as believed by us to be appropriate. We cannot assure you that these risk management strategies have had the desired effect, and interest rate fluctuations could have a negative impact on our results of operations.
The following table provides estimated future cash flow information derived from our best estimates of repayments at
December 31, 2014
of our expected long-term indebtedness and related weighted average interest rates by expected maturity dates. However, we cannot predict the LIBOR or HIBOR rates that will be in effect in the future. As of
December 31, 2014
, such rates remain at historic lows. Actual rates will vary. The one-month LIBOR and HIBOR rates at
December 31, 2014
of 0.17% and 0.24%, respectively were used for all variable rate calculations in the table below.
The information is presented in U.S. dollar equivalents as applicable.
|
Years Ending December 31,
|
||||||||||||||||||||||||||||
|
Expected Maturity Date
|
||||||||||||||||||||||||||||
|
2015
|
2016
|
2017
|
2018
|
2019
|
Thereafter
|
Total
|
||||||||||||||||||||||
|
(in millions)
|
||||||||||||||||||||||||||||
|
Long-term debt:
|
||||||||||||||||||||||||||||
|
Fixed rate
|
$
|
—
|
|
$
|
—
|
|
$
|
—
|
|
$
|
—
|
|
$
|
—
|
|
$
|
6,260
|
|
$
|
6,260
|
|
|||||||
|
Average interest rate
|
—
|
%
|
—
|
%
|
—
|
%
|
—
|
%
|
—
|
%
|
4.8
|
%
|
4.8
|
%
|
||||||||||||||
|
Variable rate
|
$
|
—
|
|
$
|
—
|
|
$
|
509
|
|
$
|
576
|
|
$
|
—
|
|
$
|
—
|
|
$
|
1,085
|
|
|||||||
|
Average interest rate
|
—
|
%
|
—
|
%
|
2.0
|
%
|
2.0
|
%
|
—
|
%
|
—
|
|
2.0
|
%
|
||||||||||||||
Interest Rate Swap Information
We have entered into floating-for-fixed interest rate swap arrangements relating to certain of our floating-rate debt facilities. We measure the fair value of our interest rate swaps on a recurring basis. Changes in the fair values of our interest rate swaps for each reporting period recorded are, and will continue to be, recognized as an increase (decrease) in swap fair value in our Consolidated Statements of Income, as the swaps do not qualify for hedge accounting.
Macau Operations
We currently have three interest rate swap agreements intended to hedge a portion of the underlying interest rate risk on borrowings under our Wynn Macau Credit Facilities. Under two of the swap agreements, we pay a fixed interest rate (excluding the applicable interest margin) of 0.73% on notional amounts corresponding to borrowings of HK$3.95 billion (approximately $509.4 million) incurred under the Wynn Macau Credit Facilities in exchange for receipts on the same amount at a variable interest rate based on the applicable HIBOR at the time of payment. These interest rate swaps fix the all-in interest rate on such amounts at 2.48% to 3.23%. These interest rate swap agreements mature in July 2017.
Under the third swap agreement, we pay a fixed interest rate (excluding the applicable interest margin) of 0.68% on notional amounts corresponding to borrowings of $243.8 million incurred under the Wynn Macau Credit Facilities in exchange
63
for receipts on the same amount at a variable rate based on the applicable LIBOR at the time of payment. This interest rate swap fixes the all-in interest rate on such amounts at 2.43% to 3.18%. This interest rate swap agreement matures in July 2017.
As of
December 31, 2014
and 2013, the interest rate swaps were recorded as an asset of
$5.9 million
and
$10.3 million
, respectively, and included in deposits and other assets.
The fair value approximates the amount we would pay or receive if these contracts were settled at the respective valuation dates. Fair value is estimated based upon current, and predictions of future, interest rate levels along a yield curve, the remaining duration of the instruments and other market conditions, and therefore, is subject to significant estimation and a high degree of variability of fluctuation between periods. We adjust this amount by applying a non-performance valuation, considering our creditworthiness or the creditworthiness of our counterparties at each settlement date, as applicable.
Las Vegas Operations
In June 2012, we terminated our only Wynn Las Vegas, LLC swap for a payment of $2.4 million.
Other Interest Rate Swap Information
The following table provides information about our interest rate swaps, by contractual maturity dates, as of
December 31, 2014
and using estimated future LIBOR and HIBOR rates based upon implied forward rates in the yield curve. The information is presented in U.S. dollar equivalents, which is our reporting currency:
|
Years Ending December 31,
|
||||||||||||||||||||||||||||
|
Expected Maturity Date
|
||||||||||||||||||||||||||||
|
2015
|
2016
|
2017
|
2018
|
2019
|
Thereafter
|
Total
|
||||||||||||||||||||||
|
(in millions)
|
||||||||||||||||||||||||||||
|
Average notional amount
|
$
|
—
|
|
$
|
—
|
|
$
|
753
|
|
$
|
—
|
|
$
|
—
|
|
$
|
—
|
|
$
|
753
|
|
|||||||
|
Average pay rate
|
—
|
%
|
—
|
%
|
0.71
|
%
|
—
|
%
|
—
|
%
|
—
|
%
|
0.71
|
%
|
||||||||||||||
|
Average receive rate
|
—
|
%
|
—
|
%
|
0.60
|
%
|
—
|
%
|
—
|
%
|
—
|
%
|
0.60
|
%
|
||||||||||||||
We do not use derivative financial instruments, other financial instruments or derivative commodity instruments for trading or speculative purposes.
Interest Rate Sensitivity
As of
December 31, 2014
, approximately
96%
all of our debt was based on fixed rates, including the notional amounts related to interest rate swaps. Based on our borrowings as of
December 31, 2014
, an assumed 1% change in the variable rates would cause our annual interest cost to change by
$3.3 million
.
Foreign Currency Risks
The currency delineated in Wynn Macau’s concession agreement with the government of Macau is the Macau pataca. The Macau pataca, which is not a freely convertible currency, is linked to the Hong Kong dollar, and in many cases the two are used interchangeably in Macau. The Hong Kong dollar is linked to the U.S. dollar and the exchange rate between these two currencies has remained relatively stable over the past several years. However, the exchange linkages of the Hong Kong dollar and the Macau pataca, and the Hong Kong dollar and the U.S. dollar, are subject to potential changes due to, among other things, changes in Chinese governmental policies and international economic and political developments.
If the Hong Kong dollar and the Macau pataca are not linked to the U.S. dollar in the future, severe fluctuations in the exchange rate for these currencies may result. We also cannot assure you that the current rate of exchange fixed by the applicable monetary authorities for these currencies will remain at the same level.
Because many of Wynn Macau’s payment and expenditure obligations are in Macau patacas, in the event of unfavorable Macau pataca or Hong Kong dollar rate changes, Wynn Macau’s obligations, as denominated in U.S. dollars, would increase. In addition, because we expect that most of the revenues for any casino that Wynn Macau operates in Macau will be in Hong Kong dollars, we are subject to foreign exchange risk with respect to the exchange rate between the Hong Kong dollar and the U.S. dollar. Also, if any of our Macau-related entities incur U.S. dollar-denominated debt, fluctuations in the exchange rates of the Macau pataca or the Hong Kong dollar, in relation to the U.S. dollar, could have adverse effects on Wynn Macau’s results of
64
operations, financial condition, and ability to service its debt. To date, we have not engaged in hedging activities intended to protect against foreign currency risk. Approximately
18.7%
of our cash balances are denominated in foreign currencies, primarily the Hong Kong Dollar. Based on our balances at
December 31, 2014
, an assumed 1% change in the US dollar/Hong Kong dollar exchange rate would cause a foreign currency transaction gain/loss of approximately
$6.1 million
.
65
INDEX TO CONSOLIDATED FINANCIAL STATEMENTS
|
Page
|
||
|
67
|
|
|
|
68
|
|
|
|
69
|
|
|
|
70
|
|
|
|
71
|
|
|
|
72
|
|
|
|
73
|
|
|
|
74
|
|
|
66
REPORT OF INDEPENDENT REGISTERED PUBLIC ACCOUNTING FIRM
The Board of Directors and Stockholders of Wynn Resorts, Limited and subsidiaries:
We have audited Wynn Resorts, Limited and subsidiaries’ (the “Company”) internal control over financial reporting as of December 31, 2014, based on criteria established in Internal Control—Integrated Framework issued by the Committee of Sponsoring Organizations of the Treadway Commission (2013 framework) (the “COSO criteria”). The Company’s management is responsible for maintaining effective internal control over financial reporting, and for its assessment of the effectiveness of internal control over financial reporting included in the accompanying Management Report on Internal Control Over Financial Reporting, included in Item 9A. Our responsibility is to express an opinion on the Company’s internal control over financial reporting based on our audit.
We conducted our audit in accordance with the standards of the Public Company Accounting Oversight Board (United States). Those standards require that we plan and perform the audit to obtain reasonable assurance about whether effective internal control over financial reporting was maintained in all material respects. Our audit included obtaining an understanding of internal control over financial reporting, assessing the risk that a material weakness exists, testing and evaluating the design and operating effectiveness of internal control based on the assessed risk, and performing such other procedures as we considered necessary in the circumstances. We believe that our audit provides a reasonable basis for our opinion.
A company’s internal control over financial reporting is a process designed to provide reasonable assurance regarding the reliability of financial reporting and the preparation of financial statements for external purposes in accordance with generally accepted accounting principles. A company’s internal control over financial reporting includes those policies and procedures that (1) pertain to the maintenance of records that, in reasonable detail, accurately and fairly reflect the transactions and dispositions of the assets of the company; (2) provide reasonable assurance that transactions are recorded as necessary to permit preparation of financial statements in accordance with generally accepted accounting principles, and that receipts and expenditures of the company are being made only in accordance with authorizations of management and directors of the company; and (3) provide reasonable assurance regarding prevention or timely detection of unauthorized acquisition, use, or disposition of the company’s assets that could have a material effect on the financial statements.
Because of its inherent limitations, internal control over financial reporting may not prevent or detect misstatements. Also, projections of any evaluation of effectiveness to future periods are subject to the risk that controls may become inadequate because of changes in conditions, or that the degree of compliance with the policies or procedures may deteriorate.
In our opinion, the Company maintained, in all material respects, effective internal control over financial reporting as of December 31, 2014, based on the COSO criteria.
We also have audited, in accordance with the standards of the Public Company Accounting Oversight Board (United States), the 2014 consolidated financial statements of Wynn Resorts, Limited and subsidiaries and our report dated February 27, 2015 expressed an unqualified opinion thereon.
/s/ Ernst & Young LLP
Las Vegas, Nevada
February 27, 2015
67
REPORT OF INDEPENDENT REGISTERED PUBLIC ACCOUNTING FIRM
The Board of Directors and Stockholders of Wynn Resorts, Limited and subsidiaries:
We have audited the accompanying consolidated balance sheets of Wynn Resorts, Limited and subsidiaries (the “Company”) as of December 31, 2014 and 2013, and the related consolidated statements of income, comprehensive income, stockholders’ equity and cash flows for each of the three years in the period ended December 31, 2014. Our audits also included the financial statement schedules listed in the Index at item 15(a)2. These financial statements and schedules are the responsibility of the Company’s management. Our responsibility is to express an opinion on these financial statements and schedules based on our audits.
We conducted our audits in accordance with the standards of the Public Company Accounting Oversight Board (United States). Those standards require that we plan and perform the audit to obtain reasonable assurance about whether the financial statements are free of material misstatement. An audit includes examining, on a test basis, evidence supporting the amounts and disclosures in the financial statements. An audit also includes assessing the accounting principles used and significant estimates made by management, as well as evaluating the overall financial statement presentation. We believe that our audits provide a reasonable basis for our opinion.
In our opinion, the financial statements referred to above present fairly, in all material respects, the consolidated financial position of Wynn Resorts, Limited and subsidiaries at December 31, 2014 and 2013, and the consolidated results of their operations and their cash flows for each of the three years in the period ended December 31, 2014, in conformity with U.S. generally accepted accounting principles. Also, in our opinion, the related financial statement schedules referred to above, when considered in relation to the basic financial statements taken as a whole, present fairly in all material respects the information set forth therein.
We also have audited, in accordance with the standards of the Public Company Accounting Oversight Board (United States), the Company’s internal control over financial reporting as of December 31, 2014, based on criteria established in Internal Control—Integrated Framework issued by the Committee of Sponsoring Organizations of the Treadway Commission (2013 framework) and our report dated
February 27, 2015
expressed an unqualified opinion thereon.
/s/ Ernst & Young LLP
Las Vegas, Nevada
February 27, 2015
68
WYNN RESORTS, LIMITED AND SUBSIDIARIES
(in thousands, except share data)
|
December 31,
|
|||||||
|
2014
|
2013
|
||||||
|
ASSETS
|
|||||||
|
Current assets:
|
|||||||
|
Cash and cash equivalents
|
$
|
2,182,164
|
|
$
|
2,435,041
|
|
|
|
Investment securities
|
240,140
|
|
174,399
|
|
|||
|
Receivables, net
|
237,957
|
|
241,932
|
|
|||
|
Inventories
|
72,223
|
|
74,739
|
|
|||
|
Prepaid expenses and other
|
49,847
|
|
42,703
|
|
|||
|
Total current assets
|
2,782,331
|
|
2,968,814
|
|
|||
|
Property and equipment, net
|
5,855,842
|
|
4,934,449
|
|
|||
|
Restricted cash
|
977
|
|
199,936
|
|
|||
|
Investment securities
|
10,173
|
|
79,989
|
|
|||
|
Intangible assets, net
|
112,367
|
|
30,767
|
|
|||
|
Deferred financing costs, net
|
84,413
|
|
67,926
|
|
|||
|
Deposits and other assets
|
212,515
|
|
91,001
|
|
|||
|
Investment in unconsolidated affiliates
|
4,243
|
|
4,148
|
|
|||
|
Total assets
|
$
|
9,062,861
|
|
$
|
8,377,030
|
|
|
|
LIABILITIES AND STOCKHOLDERS' EQUITY
|
|||||||
|
Current liabilities:
|
|||||||
|
Accounts and construction payables
|
$
|
303,284
|
|
$
|
272,861
|
|
|
|
Current portion of long-term debt
|
—
|
|
1,050
|
|
|||
|
Current portion of land concession obligation
|
30,814
|
|
29,341
|
|
|||
|
Customer deposits
|
548,818
|
|
704,401
|
|
|||
|
Gaming taxes payable
|
137,269
|
|
205,260
|
|
|||
|
Accrued compensation and benefits
|
113,228
|
|
83,769
|
|
|||
|
Accrued interest
|
107,318
|
|
101,442
|
|
|||
|
Other accrued liabilities
|
67,587
|
|
53,375
|
|
|||
|
Deferred income taxes, net
|
4,847
|
|
4,035
|
|
|||
|
Total current liabilities
|
1,313,165
|
|
1,455,534
|
|
|||
|
Long-term debt
|
7,345,262
|
|
6,586,518
|
|
|||
|
Land concession obligation
|
15,987
|
|
46,819
|
|
|||
|
Other long-term liabilities
|
152,131
|
|
141,465
|
|
|||
|
Deferred income taxes, net
|
25,225
|
|
14,343
|
|
|||
|
Total liabilities
|
8,851,770
|
|
8,244,679
|
|
|||
|
Commitments and contingencies (Note 17)
|
|
|
|||||
|
Stockholders’ equity:
|
|||||||
|
Preferred stock, par value $0.01; 40,000,000 shares authorized; zero shares issued and outstanding
|
—
|
|
—
|
|
|||
|
Common stock, par value $0.01; 400,000,000 shares authorized; 114,426,960 and 114,170,493 shares issued; 101,439,297 and 101,192,408 shares outstanding
|
1,144
|
|
1,142
|
|
|||
|
Treasury stock, at cost; 12,987,663 and 12,978,085 shares
|
(1,145,481
|
)
|
(1,143,419
|
)
|
|||
|
Additional paid-in capital
|
948,566
|
|
888,727
|
|
|||
|
Accumulated other comprehensive income
|
2,505
|
|
2,913
|
|
|||
|
Retained earnings
|
164,487
|
|
66,130
|
|
|||
|
Total Wynn Resorts, Limited stockholders’ deficit
|
(28,779
|
)
|
(184,507
|
)
|
|||
|
Noncontrolling interest
|
239,870
|
|
316,858
|
|
|||
|
Total equity
|
211,091
|
|
132,351
|
|
|||
|
Total liabilities and stockholders' equity
|
$
|
9,062,861
|
|
$
|
8,377,030
|
|
|
The accompanying notes are an integral part of these consolidated financial statements.
69
WYNN RESORTS, LIMITED AND SUBSIDIARIES
(in thousands, except per share data)
|
Years Ended December 31,
|
|||||||||||
|
2014
|
2013
|
2012
|
|||||||||
|
Operating revenues:
|
|||||||||||
|
Casino
|
$
|
4,274,221
|
|
$
|
4,490,637
|
|
$
|
4,034,759
|
|
||
|
Rooms
|
542,762
|
|
492,230
|
|
479,983
|
|
|||||
|
Food and beverage
|
604,701
|
|
586,672
|
|
588,437
|
|
|||||
|
Entertainment, retail and other
|
401,181
|
|
418,705
|
|
417,209
|
|
|||||
|
Gross revenues
|
5,822,865
|
|
5,988,244
|
|
5,520,388
|
|
|||||
|
Less: promotional allowances
|
(389,204
|
)
|
(367,308
|
)
|
(366,104
|
)
|
|||||
|
Net revenues
|
5,433,661
|
|
5,620,936
|
|
5,154,284
|
|
|||||
|
Operating costs and expenses:
|
|||||||||||
|
Casino
|
2,667,013
|
|
2,846,489
|
|
2,626,822
|
|
|||||
|
Rooms
|
148,338
|
|
133,503
|
|
126,527
|
|
|||||
|
Food and beverage
|
337,206
|
|
323,573
|
|
308,394
|
|
|||||
|
Entertainment, retail and other
|
163,754
|
|
175,257
|
|
189,832
|
|
|||||
|
General and administrative
|
492,464
|
|
448,788
|
|
441,699
|
|
|||||
|
Provision for doubtful accounts
|
3,906
|
|
11,877
|
|
18,091
|
|
|||||
|
Pre-opening costs
|
30,146
|
|
3,169
|
|
466
|
|
|||||
|
Depreciation and amortization
|
314,119
|
|
371,051
|
|
373,199
|
|
|||||
|
Property charges and other
|
10,437
|
|
17,138
|
|
39,978
|
|
|||||
|
Total operating costs and expenses
|
4,167,383
|
|
4,330,845
|
|
4,125,008
|
|
|||||
|
Operating income
|
1,266,278
|
|
1,290,091
|
|
1,029,276
|
|
|||||
|
Other income (expense):
|
|||||||||||
|
Interest income
|
20,441
|
|
15,713
|
|
12,543
|
|
|||||
|
Interest expense, net of amounts capitalized
|
(315,062
|
)
|
(299,022
|
)
|
(288,759
|
)
|
|||||
|
(Decrease) increase in swap fair value
|
(4,393
|
)
|
14,235
|
|
991
|
|
|||||
|
Loss on extinguishment of debt
|
(9,569
|
)
|
(40,435
|
)
|
(25,151
|
)
|
|||||
|
Equity in income from unconsolidated affiliates
|
1,349
|
|
1,085
|
|
1,086
|
|
|||||
|
Other
|
(182
|
)
|
4,856
|
|
3,012
|
|
|||||
|
Other income (expense), net
|
(307,416
|
)
|
(303,568
|
)
|
(296,278
|
)
|
|||||
|
Income before income taxes
|
958,862
|
|
986,523
|
|
732,998
|
|
|||||
|
Benefit (provision) for income taxes
|
3,782
|
|
17,634
|
|
(4,299
|
)
|
|||||
|
Net income
|
962,644
|
|
1,004,157
|
|
728,699
|
|
|||||
|
Less: net income attributable to noncontrolling interest
|
(231,090
|
)
|
(275,505
|
)
|
(226,663
|
)
|
|||||
|
Net income attributable to Wynn Resorts, Limited
|
$
|
731,554
|
|
$
|
728,652
|
|
$
|
502,036
|
|
||
|
Basic and diluted income per common share:
|
|||||||||||
|
Net income attributable to Wynn Resorts, Limited:
|
|||||||||||
|
Basic
|
$
|
7.25
|
|
$
|
7.25
|
|
$
|
4.87
|
|
||
|
Diluted
|
$
|
7.18
|
|
$
|
7.17
|
|
$
|
4.82
|
|
||
|
Weighted average common shares outstanding:
|
|||||||||||
|
Basic
|
100,927
|
|
100,540
|
|
103,092
|
|
|||||
|
Diluted
|
101,931
|
|
101,641
|
|
104,249
|
|
|||||
The accompanying notes are an integral part of these consolidated financial statements.
70
WYNN RESORTS, LIMITED AND SUBSIDIARIES
CONSOLIDATED STATEMENTS OF COMPREHENSIVE INCOME
(in thousands)
|
Years Ended December 31,
|
|||||||||||
|
2014
|
2013
|
2012
|
|||||||||
|
Net income
|
$
|
962,644
|
|
$
|
1,004,157
|
|
$
|
728,699
|
|
||
|
Other comprehensive income:
|
|||||||||||
|
Foreign currency translation adjustments, net of tax
|
(282
|
)
|
(2,106
|
)
|
2,749
|
|
|||||
|
Unrealized (loss) gain on available-for-sale securities, net of tax
|
(195
|
)
|
319
|
|
1,780
|
|
|||||
|
Total comprehensive income
|
962,167
|
|
1,002,370
|
|
733,228
|
|
|||||
|
Less: comprehensive income attributable to noncontrolling interest
|
(231,021
|
)
|
(274,982
|
)
|
(227,855
|
)
|
|||||
|
Comprehensive income attributable to Wynn Resorts, Limited
|
$
|
731,146
|
|
$
|
727,388
|
|
$
|
505,373
|
|
||
The accompanying notes are an integral part of these consolidated financial statements.
71
WYNN RESORTS, LIMITED AND SUBSIDIARIES
CONSOLIDATED STATEMENTS OF STOCKHOLDERS’ EQUITY
(in thousands, except share data)
|
Common stock
|
||||||||||||||||||||||||||||||||||
|
Shares
outstanding
|
Par
value
|
Treasury
stock
|
Additional
paid-in
capital
|
Accumulated
other
comprehensive
income
|
Retained
earnings
|
Total
Wynn Resorts, Ltd
stockholders’
equity (deficit)
|
Noncontrolling
interest
|
Total stockholders'
equity
|
||||||||||||||||||||||||||
|
Balances, January 1, 2012
|
125,080,998
|
|
$
|
1,379
|
|
$
|
(1,127,036
|
)
|
$
|
3,177,471
|
|
$
|
840
|
|
$
|
36,368
|
|
$
|
2,089,022
|
|
$
|
134,432
|
|
$
|
2,223,454
|
|
||||||||
|
Stock redemption
|
(24,549,222
|
)
|
(245
|
)
|
—
|
|
(1,936,198
|
)
|
—
|
|
—
|
|
(1,936,443
|
)
|
—
|
|
(1,936,443
|
)
|
||||||||||||||||
|
Net income
|
—
|
|
—
|
|
—
|
|
—
|
|
—
|
|
502,036
|
|
502,036
|
|
226,663
|
|
728,699
|
|
||||||||||||||||
|
Currency translation adjustment
|
—
|
|
—
|
|
—
|
|
—
|
|
1,987
|
|
—
|
|
1,987
|
|
762
|
|
2,749
|
|
||||||||||||||||
|
Net unrealized gain on investments
|
—
|
|
—
|
|
—
|
|
—
|
|
1,350
|
|
—
|
|
1,350
|
|
430
|
|
1,780
|
|
||||||||||||||||
|
Exercise of stock options
|
332,576
|
|
3
|
|
—
|
|
15,580
|
|
—
|
|
—
|
|
15,583
|
|
—
|
|
15,583
|
|
||||||||||||||||
|
Cancellation of restricted stock
|
(31,500
|
)
|
—
|
|
—
|
|
—
|
|
—
|
|
—
|
|
—
|
|
—
|
|
—
|
|
||||||||||||||||
|
Shares repurchased by the company and held as treasury shares
|
(7,640
|
)
|
—
|
|
(911
|
)
|
—
|
|
—
|
|
—
|
|
(911
|
)
|
—
|
|
(911
|
)
|
||||||||||||||||
|
Issuance of restricted stock
|
41,500
|
|
—
|
|
—
|
|
—
|
|
—
|
|
—
|
|
—
|
|
—
|
|
—
|
|
||||||||||||||||
|
Cash dividends declared
|
—
|
|
—
|
|
—
|
|
(462,730
|
)
|
—
|
|
(493,629
|
)
|
(956,359
|
)
|
—
|
|
(956,359
|
)
|
||||||||||||||||
|
Excess tax benefits from stock-based compensation
|
—
|
|
—
|
|
—
|
|
5,537
|
|
—
|
|
—
|
|
5,537
|
|
—
|
|
5,537
|
|
||||||||||||||||
|
Stock-based compensation
|
—
|
|
—
|
|
—
|
|
19,161
|
|
—
|
|
—
|
|
19,161
|
|
682
|
|
19,843
|
|
||||||||||||||||
|
Balances, December 31, 2012
|
100,866,712
|
|
1,137
|
|
(1,127,947
|
)
|
818,821
|
|
4,177
|
|
44,775
|
|
(259,037
|
)
|
362,969
|
|
103,932
|
|
||||||||||||||||
|
Net income
|
—
|
|
—
|
|
—
|
|
—
|
|
—
|
|
728,652
|
|
728,652
|
|
275,505
|
|
1,004,157
|
|
||||||||||||||||
|
Currency translation adjustment
|
—
|
|
—
|
|
—
|
|
—
|
|
(1,522
|
)
|
—
|
|
(1,522
|
)
|
(584
|
)
|
(2,106
|
)
|
||||||||||||||||
|
Net unrealized gain on investments
|
—
|
|
—
|
|
—
|
|
—
|
|
258
|
|
—
|
|
258
|
|
61
|
|
319
|
|
||||||||||||||||
|
Exercise of stock options
|
383,151
|
|
5
|
|
—
|
|
20,431
|
|
—
|
|
—
|
|
20,436
|
|
—
|
|
20,436
|
|
||||||||||||||||
|
Cancellation of restricted stock
|
(78,500
|
)
|
(1
|
)
|
—
|
|
1
|
|
—
|
|
—
|
|
—
|
|
—
|
|
—
|
|
||||||||||||||||
|
Shares repurchased by the company and held as treasury shares
|
(114,355
|
)
|
—
|
|
(15,472
|
)
|
—
|
|
—
|
|
—
|
|
(15,472
|
)
|
—
|
|
(15,472
|
)
|
||||||||||||||||
|
Issuance of restricted stock
|
135,400
|
|
1
|
|
—
|
|
(1
|
)
|
—
|
|
—
|
|
—
|
|
—
|
|
—
|
|
||||||||||||||||
|
Cash dividends declared
|
—
|
|
—
|
|
—
|
|
480
|
|
—
|
|
(707,297
|
)
|
(706,817
|
)
|
(322,305
|
)
|
(1,029,122
|
)
|
||||||||||||||||
|
Excess tax benefits from stock-based compensation
|
—
|
|
—
|
|
—
|
|
10,474
|
|
—
|
|
—
|
|
10,474
|
|
—
|
|
10,474
|
|
||||||||||||||||
|
Stock-based compensation
|
—
|
|
—
|
|
—
|
|
38,521
|
|
—
|
|
—
|
|
38,521
|
|
1,212
|
|
39,733
|
|
||||||||||||||||
|
Balances, December 31, 2013
|
101,192,408
|
|
1,142
|
|
(1,143,419
|
)
|
888,727
|
|
2,913
|
|
66,130
|
|
(184,507
|
)
|
316,858
|
|
132,351
|
|
||||||||||||||||
|
Net income
|
—
|
|
—
|
|
—
|
|
—
|
|
—
|
|
731,554
|
|
731,554
|
|
231,090
|
|
962,644
|
|
||||||||||||||||
|
Currency translation adjustment
|
—
|
|
—
|
|
—
|
|
—
|
|
(203
|
)
|
—
|
|
(203
|
)
|
(79
|
)
|
(282
|
)
|
||||||||||||||||
|
Net unrealized (loss) gain on investments
|
—
|
|
—
|
|
—
|
|
—
|
|
(205
|
)
|
—
|
|
(205
|
)
|
10
|
|
(195
|
)
|
||||||||||||||||
|
Exercise of stock options
|
211,133
|
|
2
|
|
—
|
|
11,643
|
|
—
|
|
—
|
|
11,645
|
|
214
|
|
11,859
|
|
||||||||||||||||
|
Cancellation of restricted stock
|
(9,166
|
)
|
—
|
|
—
|
|
—
|
|
—
|
|
—
|
|
—
|
|
—
|
|
—
|
|
||||||||||||||||
|
Shares repurchased by the Company and held as treasury shares
|
(9,578
|
)
|
—
|
|
(2,062
|
)
|
—
|
|
—
|
|
—
|
|
(2,062
|
)
|
—
|
|
(2,062
|
)
|
||||||||||||||||
|
Issuance of restricted stock
|
54,500
|
|
—
|
|
—
|
|
—
|
|
—
|
|
—
|
|
—
|
|
—
|
|
—
|
|
||||||||||||||||
|
Shares of subsidiary repurchased for share award plan
|
—
|
|
—
|
|
—
|
|
—
|
|
—
|
|
—
|
|
—
|
|
(2,081
|
)
|
(2,081
|
)
|
||||||||||||||||
|
Cash dividends declared
|
—
|
|
—
|
|
—
|
|
59
|
|
—
|
|
(633,197
|
)
|
(633,138
|
)
|
(312,287
|
)
|
(945,425
|
)
|
||||||||||||||||
|
Excess tax benefits from stock-based compensation
|
—
|
|
—
|
|
—
|
|
9,376
|
|
—
|
|
—
|
|
9,376
|
|
—
|
|
9,376
|
|
||||||||||||||||
|
Stock-based compensation
|
—
|
|
—
|
|
—
|
|
38,761
|
|
—
|
|
—
|
|
38,761
|
|
6,145
|
|
44,906
|
|
||||||||||||||||
|
Balances, December 31, 2014
|
101,439,297
|
|
$
|
1,144
|
|
$
|
(1,145,481
|
)
|
$
|
948,566
|
|
$
|
2,505
|
|
$
|
164,487
|
|
$
|
(28,779
|
)
|
$
|
239,870
|
|
$
|
211,091
|
|
||||||||
The accompanying notes are an integral part of these consolidated financial statements.
72
WYNN RESORTS, LIMITED AND SUBSIDIARIES
(in thousands)
|
Years Ended December 31,
|
|||||||||||
|
2014
|
2013
|
2012
|
|||||||||
|
Cash flows from operating activities:
|
|||||||||||
|
Net income
|
$
|
962,644
|
|
$
|
1,004,157
|
|
$
|
728,699
|
|
||
|
Adjustments to reconcile net income to net cash provided by operating activities:
|
|||||||||||
|
Depreciation and amortization
|
314,119
|
|
371,051
|
|
373,199
|
|
|||||
|
Deferred income taxes
|
(8,086
|
)
|
(19,826
|
)
|
(3,655
|
)
|
|||||
|
Stock-based compensation
|
39,196
|
|
39,537
|
|
19,648
|
|
|||||
|
Excess tax benefits from stock-based compensation
|
(9,339
|
)
|
(12,332
|
)
|
(5,253
|
)
|
|||||
|
Amortization and write-offs of deferred financing costs and other
|
36,649
|
|
21,453
|
|
23,965
|
|
|||||
|
Loss on extinguishment of debt
|
9,569
|
|
40,435
|
|
25,151
|
|
|||||
|
Provision for doubtful accounts
|
3,906
|
|
11,877
|
|
18,091
|
|
|||||
|
Property charges and other
|
10,466
|
|
6,950
|
|
36,714
|
|
|||||
|
Equity in income of unconsolidated affiliates, net of distributions
|
(95
|
)
|
122
|
|
106
|
|
|||||
|
Decrease (increase) in swap fair value
|
4,393
|
|
(14,235
|
)
|
(991
|
)
|
|||||
|
Increase (decrease) in cash from changes in:
|
|||||||||||
|
Receivables, net
|
38
|
|
(14,875
|
)
|
(21,019
|
)
|
|||||
|
Inventories and prepaid expenses and other
|
(6,917
|
)
|
(17,749
|
)
|
3,644
|
|
|||||
|
Customer deposits
|
(155,399
|
)
|
159,850
|
|
(31,362
|
)
|
|||||
|
Accounts payable and accrued expenses
|
(102,827
|
)
|
100,227
|
|
18,781
|
|
|||||
|
Net cash provided by operating activities
|
1,098,317
|
|
1,676,642
|
|
1,185,718
|
|
|||||
|
Cash flows used in investing activities:
|
|||||||||||
|
Capital expenditures, net of construction payables and retention
|
(1,127,015
|
)
|
(506,786
|
)
|
(240,985
|
)
|
|||||
|
Purchase of corporate debt securities
|
(200,258
|
)
|
(222,856
|
)
|
(183,445
|
)
|
|||||
|
Proceeds from sale or maturity of corporate debt securities
|
200,090
|
|
146,112
|
|
216,051
|
|
|||||
|
Restricted cash
|
198,943
|
|
(100,709
|
)
|
(99,163
|
)
|
|||||
|
Deposits and purchase of intangibles and other assets
|
(218,925
|
)
|
(13,961
|
)
|
(38,042
|
)
|
|||||
|
Proceeds from sale of assets
|
32,813
|
|
20,620
|
|
730
|
|
|||||
|
Net cash used in investing activities
|
(1,114,352
|
)
|
(677,580
|
)
|
(344,854
|
)
|
|||||
|
Cash flows from financing activities:
|
|||||||||||
|
Proceeds from exercise of stock options
|
11,859
|
|
20,436
|
|
15,583
|
|
|||||
|
Excess tax benefits from stock-based compensation
|
9,339
|
|
12,332
|
|
5,253
|
|
|||||
|
Dividends paid
|
(942,928
|
)
|
(1,034,986
|
)
|
(955,493
|
)
|
|||||
|
Proceeds from issuance of long-term debt
|
958,008
|
|
1,297,870
|
|
1,648,643
|
|
|||||
|
Principal payments on long-term debt
|
(101,339
|
)
|
(501,400
|
)
|
(1,022,847
|
)
|
|||||
|
Repurchase of first mortgage notes
|
(98,400
|
)
|
—
|
|
—
|
|
|||||
|
Repurchase of common stock
|
(2,062
|
)
|
(15,472
|
)
|
(911
|
)
|
|||||
|
Shares of subsidiary repurchased for share award plan
|
(2,081
|
)
|
—
|
|
—
|
|
|||||
|
Interest rate swap settlement
|
—
|
|
—
|
|
(2,368
|
)
|
|||||
|
Payments on long-term land concession obligation
|
(29,338
|
)
|
(27,917
|
)
|
(13,449
|
)
|
|||||
|
Payment of financing costs
|
(38,683
|
)
|
(42,006
|
)
|
(56,890
|
)
|
|||||
|
Net cash used in financing activities
|
(235,625
|
)
|
(291,143
|
)
|
(382,479
|
)
|
|||||
|
Effect of exchange rate on cash
|
(1,217
|
)
|
1,903
|
|
4,247
|
|
|||||
|
Cash and cash equivalents:
|
|||||||||||
|
(Decrease) increase in cash and cash equivalents
|
(252,877
|
)
|
709,822
|
|
462,632
|
|
|||||
|
Balance, beginning of year
|
2,435,041
|
|
1,725,219
|
|
1,262,587
|
|
|||||
|
Balance, end of year
|
$
|
2,182,164
|
|
$
|
2,435,041
|
|
$
|
1,725,219
|
|
||
|
Supplemental cash flow disclosures
|
|||||||||||
|
Cash transactions:
|
|||||||||||
|
Cash paid for interest, net of amounts capitalized
|
$
|
295,041
|
|
$
|
284,849
|
|
$
|
225,499
|
|
||
|
Cash paid for income taxes
|
$
|
3,041
|
|
$
|
2,518
|
|
$
|
4,547
|
|
||
|
Non-cash transactions:
|
|||||||||||
|
Increase in debt related to the redemption of stock
|
$
|
—
|
|
$
|
—
|
|
$
|
1,936,443
|
|
||
|
Stock-based compensation capitalized into construction
|
$
|
5,710
|
|
$
|
195
|
|
$
|
195
|
|
||
|
Change in property and equipment included in accounts and construction payables
|
$
|
132,079
|
|
$
|
67,650
|
|
$
|
6,557
|
|
||
|
Increase in liability for dividends declared on nonvested stock
|
$
|
1,668
|
|
$
|
2,708
|
|
$
|
866
|
|
||
The accompanying notes are an integral part of these consolidated financial statements.
73
WYNN RESORTS, LIMITED AND SUBSIDIARIES
NOTES TO CONSOLIDATED FINANCIAL STATEMENTS
Wynn Resorts, Limited, a Nevada corporation (together with its subsidiaries, “Wynn Resorts” or the “Company”) is a developer, owner and operator of destination casino resorts (integrated resorts). In the Macau Special Administrative Region of the People's Republic of China ("Macau"), the Company owns
72%
of Wynn Macau, Limited, which operates the integrated Wynn Macau and Encore at Wynn Macau resort. In Las Vegas, Nevada, the Company owns
100%
of and operates the integrated Wynn Las Vegas and Encore at Wynn Las Vegas resort.
The Company's integrated Macau resort of Wynn Macau and Encore at Wynn Macau features
two
luxury hotel towers with a total of
1,008
spacious guest rooms and suites, approximately
284,000
square feet of casino space, casual and fine dining in
eight
restaurants, approximately
31,000
square feet of lounge and meeting space, approximately
57,000
square feet of retail space, recreation and leisure facilities, including
two
health clubs, spas and
one
pool. The Company refers to this integrated resort as its Macau Operations.
The Company's integrated Las Vegas resort of Wynn Las Vegas and Encore at Wynn Las Vegas features
two
luxury hotel towers with a total of
4,748
spacious guest rooms, suites and villas, approximately
186,000
square feet of casino space,
34
food and beverage outlets, an on-site 18-hole golf course, approximately
290,000
square feet of meeting and convention space, a Ferrari and Maserati dealership, approximately
99,000
square feet of retail space, as well as
two
showrooms,
three
nightclubs and a beach club. The Company refers to this integrated resort as its Las Vegas Operations.
The Company is currently constructing Wynn Palace, an integrated resort in the Cotai area of Macau, containing a
1,700
-room hotel, performance lake, meeting space, casino, spa, retail offerings, and food and beverage outlets. The Company expects to open Wynn Palace in the first half of 2016.
On September 17, 2014, the Massachusetts Gaming Commission ("MGC") designated Wynn MA, LLC ("Wynn MA"), an indirect wholly owned subsidiary of the Company, the award winner of the Greater Boston (Region A) gaming license. On November 4, 2014, a vote upheld the expanded gaming law in Massachusetts. On November 7, 2014, the gaming license awarded to the Company became effective. The Company will develop and operate an integrated resort in Everett, Massachusetts containing a hotel, restaurants, casino, spa, premium retail offerings, meeting and convention space and a waterfront boardwalk.
Principles of Consolidation
The accompanying consolidated financial statements include the accounts of the Company and its majority-owned subsidiaries. Investments in the
50%
-owned joint ventures operating the Ferrari and Maserati automobile dealership and the Brioni mens’ retail clothing store inside Wynn Las Vegas are accounted for under the equity method. All significant intercompany accounts and transactions have been eliminated. Certain amounts in the consolidated financial statements for the previous years have been reclassified to be consistent with the current year presentation. These reclassifications had no effect on the previously reported net income.
Use of Estimates
The preparation of financial statements in conformity with U.S. generally accepted accounting principles requires management to make estimates and assumptions that affect the reported amounts of assets and liabilities and disclosure of contingent assets and liabilities at the date of the financial statements and the reported amounts of revenues and expenses during the reporting period. Actual results could differ from those estimates.
Cash and Cash Equivalents
Cash and cash equivalents are comprised of highly liquid investments with original maturities of
three months
or less and include both U.S. dollar-denominated and foreign currency-denominated securities. Cash equivalents are carried at cost, which approximates fair value. Cash equivalents of
$1,156.3 million
and
$1,349.6 million
at
December 31, 2014
and
2013
, respectively, were invested in bank time deposits, money market funds and commercial paper. In addition, the Company held bank deposits and cash on hand of approximately
$1,025.9 million
and
$1,085.4 million
as of December 31, 2014 and 2013, respectively.
74
WYNN RESORTS, LIMITED AND SUBSIDIARIES
NOTES TO CONSOLIDATED FINANCIAL STATEMENTS (continued)
Restricted Cash
The Company had restricted cash of
$1.0 million
and
$199.9 million
at December 31, 2014 and 2013, respectively. Restricted cash at December 31, 2014 consists of cash held in trust in accordance with the Company's majority owned subsidiary's share award plan. Restricted cash at December 31, 2013 consisted of certain proceeds of the Company’s financing activities that were restricted by the agreements governing the Company’s debt instruments for the payment of certain Wynn Palace related construction and development costs. During the first quarter of 2014, the Company applied the restricted cash balances to payment of certain Wynn Palace related construction and development costs.
Investment Securities
Investment securities consist of domestic and foreign short-term and long-term investments in corporate bonds and commercial paper reported at fair value, with unrealized gains and losses, net of tax, reported in other comprehensive income. Short-term investments have maturities of greater than three months but equal to or less than one year and long-term investments are those with a maturity date greater than one year. The Company’s investment policy limits the amount of exposure to any one issuer with the objective of minimizing the potential risk of principal loss. Management determines the appropriate classification (held-to-maturity/available-for-sale) of its securities at the time of purchase and reevaluates such designation as of each balance sheet date. Adjustments are made for amortization of premiums and accretion of discounts to maturity computed under the effective interest method. Such amortization is included in interest income together with realized gains and losses and the stated interest on such securities.
Accounts Receivable and Credit Risk
Financial instruments that potentially subject the Company to concentrations of credit risk consist principally of casino accounts receivable. The Company issues credit in the form of “markers” to approved casino customers following investigations of creditworthiness. At
December 31, 2014
and
2013
, approximately
85%
and
86%
, respectively, of the Company’s markers were due from customers residing outside the United States, primarily in Asia. Business or economic conditions or other significant events in these countries could affect the collectability of such receivables.
Accounts receivable, including casino and hotel receivables, are typically non-interest bearing and are initially recorded at cost. Accounts are written off when management deems them to be uncollectible. Recoveries of accounts previously written off are recorded when received. An estimated allowance for doubtful accounts is maintained to reduce the Company’s receivables to their carrying amount, which approximates fair value. The allowance is estimated based on historical collection patterns and current collection trends. In addition, the estimate reflects specific review of customer accounts as well as management's experience with collection trends in the casino industry and current economic and business conditions.
During 2014, 2013 and 2012 , the Company recorded adjustments to its reserve estimates for casino accounts receivable based on results of historical collection patterns and current collection trends. The adjustment benefited operating income by
$8.7 million
and net income attributable to Wynn Resorts, Limited by
$6.8 million
(or
$0.07
per share on a fully diluted basis) for the year ended
December 31, 2014
. For the year ended December 31, 2013, this adjustment benefited operating income by
$14.9 million
and net income attributable to Wynn Resorts, Limited by
$12.0 million
(or
$0.12
per share on a fully diluted basis for the year ended December 31, 2013). For the year ended December 31, 2012, this adjustment benefited operating income by
$30.9 million
and net income attributable to Wynn Resorts, Limited by
$23.3 million
(or
$0.22
per share on a fully diluted basis for the year ended December 31, 2012).
Inventories
Inventories consist of retail merchandise, food and beverage items which are stated at the lower of cost or market value and certain operating supplies. Cost is determined by the first-in, first-out, average and specific identification methods.
75
WYNN RESORTS, LIMITED AND SUBSIDIARIES
NOTES TO CONSOLIDATED FINANCIAL STATEMENTS (continued)
Property and Equipment
Purchases of property and equipment are stated at cost. Depreciation is provided over the estimated useful lives of the assets using the straight-line method as follows:
|
Buildings and improvements
|
10 to 45 years
|
|
Land improvements
|
10 to 45 years
|
|
Leasehold interest in land
|
25 years
|
|
Airplanes
|
18 to 20 years
|
|
Furniture, fixtures and equipment
|
3 to 20 years
|
Costs related to improvements are capitalized, while costs of repairs and maintenance are charged to expense as incurred. The cost and accumulated depreciation of property and equipment retired or otherwise disposed of are eliminated from the respective accounts and any resulting gain or loss is included in property charges and other.
Capitalized Interest
The interest cost associated with major development and construction projects is capitalized and included in the cost of the project. Interest capitalization ceases once a project is substantially complete or no longer undergoing construction activities to prepare it for its intended use. When no debt is specifically identified as being incurred in connection with a construction project, the Company capitalizes interest on amounts expended on the project at the Company’s weighted average cost of borrowed money. Interest of
$33.5 million
,
$10.5 million
and
$2.0 million
, was capitalized for the years ended December 31, 2014, 2013 and 2012, respectively.
Intangible Assets
The Company’s indefinite-lived intangible assets consist primarily of water rights acquired as part of the original purchase price of the property on which Wynn Las Vegas is located, and trademarks. Indefinite-lived intangible assets are not amortized, but are reviewed for impairment annually. The Company’s finite-lived intangible assets consist primarily of our Massachusetts gaming license and Macau gaming concession. Finite-lived intangible assets are amortized over the shorter of their contractual terms or estimated useful lives.
Long-Lived Assets
Long-lived assets, which are to be held and used, including intangible assets and property and equipment, are periodically reviewed by management for impairment whenever events or changes in circumstances indicate that the carrying value of the asset may not be recoverable. If an indicator of impairment exists, the Company compares the estimated future cash flows of the asset, on an undiscounted basis, to the carrying value of the asset. If the undiscounted cash flows exceed the carrying value, no impairment is indicated. If the undiscounted cash flows do not exceed the carrying value, then impairment is measured as the difference between fair value and carrying value, with fair value typically based on a discounted cash flow model. If an asset is still under development, future cash flows include remaining construction costs.
Deferred Financing Costs
Direct and incremental costs incurred in obtaining loans or in connection with the issuance of long-term debt are capitalized and amortized to interest expense over the terms of the related debt agreements. Approximately
$12.6 million
,
$11.2 million
and
$11.0 million
were amortized to interest expense during the years ended
December 31, 2014
, 2013 and 2012, respectively. Debt discounts incurred in connection with the issuance of debt have been capitalized and are being amortized to interest expense using the effective interest method.
Derivative Financial Instruments
The Company seeks to manage its market risk, including interest rate risk associated with variable rate borrowings, through balancing fixed-rate and variable-rate borrowings with the use of derivative financial instruments. The fair value of derivative financial instruments are recognized as assets or liabilities at each balance sheet date, with changes in fair value affecting net income as the Company’s current interest rate swaps do not qualify for hedge accounting. Accordingly, changes in
76
WYNN RESORTS, LIMITED AND SUBSIDIARIES
NOTES TO CONSOLIDATED FINANCIAL STATEMENTS (continued)
the fair value of the interest rate swaps are presented as an increase (decrease) in swap fair value in the accompanying Consolidated Statements of Income. The differentials paid or received on interest rate swap agreements are recognized as adjustments to interest expense.
Redemption Price Promissory Note
The Company recorded the fair value of the Redemption Price Promissory Note (the “Redemption Note”) of approximately
$1.94 billion
in accordance with applicable accounting guidance. In determining this fair value, the Company estimated the Redemption Note’s present value using discounted cash flows with a probability weighted expected return for redemption assumptions and a discount rate which included time value and non-performance risk adjustments commensurate with risk of the Redemption Note.
Considerations for the redemption assumptions included the stated maturity of the Redemption Note, uncertainty of the related cash flows as well as potential effects of the following: uncertainties surrounding the potential outcome and timing of pending litigation with Aruze USA, Inc. ("Aruze"), Universal Entertainment Corporation and Mr. Kazuo Okada (collectively, the “Okada Parties”) (see Note 17 “Commitments and Contingencies”); the outcome of on-going investigations of Aruze USA, Inc. by the United States Attorney’s Office, the U.S. Department of Justice and the Nevada Gaming Control Board; and other potential legal and regulatory actions. In addition, in the furtherance of various future business objectives, the Company considered its ability, at its sole option, to prepay the Redemption Note at any time in accordance with its terms without penalty. Accordingly, the Company reasonably determined that the estimated life of the Redemption Note could be less than the contractual life of the Redemption Note
.
In determination of the appropriate discount rate to be used in the estimated present value, the Redemption Note’s subordinated position relative to all other debt in the Company’s capital structure and credit ratings associated with the Company’s traded debt were considered. Observable inputs for the risk free rate based on Federal Reserve rates for U.S. Treasury securities and credit risk spread based on a yield curve index of similarly rated debt were used. As a result of this analysis, the Company concluded the Redemption Note's stated rate of
2%
approximated a market rate.
Revenue Recognition and Promotional Allowances
The Company recognizes revenues at the time persuasive evidence of an arrangement exists, the service is provided or the retail goods are sold, prices are fixed or determinable and collection is reasonably assured.
Casino revenues are measured by the aggregate net difference between gaming wins and losses, with liabilities recognized for funds deposited by customers before gaming play occurs and for chips in the customers’ possession. Cash discounts, other cash incentives related to casino play and commissions rebated through junkets to customers are recorded as a reduction to casino revenue. Hotel, food and beverage, entertainment and other operating revenues are recognized when services are performed. Entertainment, retail and other revenue includes rental income which is recognized on a time proportion basis over the lease term. Contingent rental income is recognized when the right to receive such rental income is established according to the lease agreements. Advance deposits on rooms and advance ticket sales are recorded as customer deposits until services are provided to the customer.
Revenues are recognized net of certain sales incentives which are required to be recorded as a reduction of revenue; consequently, the Company’s casino revenues are reduced by discounts, commissions and points earned by customers from the Company's loyalty programs.
The retail value of accommodations, food and beverage, and other services furnished to guests without charge is included in gross revenues. Such amounts are then deducted as promotional allowances. The estimated cost of providing such promotional allowances is primarily included in casino expenses as follows (in thousands):
|
Years Ended December 31,
|
|||||||||||
|
2014
|
2013
|
2012
|
|||||||||
|
Rooms
|
$
|
54,981
|
|
$
|
52,585
|
|
$
|
53,487
|
|
||
|
Food and beverage
|
120,070
|
|
112,897
|
|
107,882
|
|
|||||
|
Entertainment, retail and other
|
14,977
|
|
14,659
|
|
17,522
|
|
|||||
|
$
|
190,028
|
|
$
|
180,141
|
|
$
|
178,891
|
|
|||
77
WYNN RESORTS, LIMITED AND SUBSIDIARIES
NOTES TO CONSOLIDATED FINANCIAL STATEMENTS (continued)
Customer Loyalty Programs
The Company offers loyalty programs at both its Macau Operations and its Las Vegas Operations. Under the program at its Las Vegas Operations, customers earn points based on their level of slots play which can be redeemed for free play. Under the program at its Macau Operations, customers earn points based on their level of table games and slots play which can be redeemed for free play, gifts and complimentary dining and retail shopping. The points are recognized as a liability and as a separate element of the gaming transaction with allocation of the consideration received between the points and gaming transaction. The initial recognition of the point liability is fair value based on points earned multiplied by redemption value, less an estimate for points not expected to be redeemed. The revenue from the points is recognized when redeemed.
Slot Machine Jackpots
The Company does not accrue a liability for base jackpots because it has the ability to avoid such payment as slot machines can legally be removed from the gaming floor without payment of the base amount. When the Company is unable to avoid payment of the jackpot (i.e., the incremental amount on a progressive slot machine) due to legal requirements, the jackpot is accrued as the obligation becomes unavoidable. This liability is accrued over the time period in which the incremental progressive jackpot amount is generated with a related reduction in casino revenue.
Gaming Taxes
The Company is subject to taxes based on gross gaming revenue in the jurisdictions in which it operates, subject to applicable jurisdictional adjustments. These gaming taxes are an assessment on the Company’s gross gaming revenues and are recorded as casino expenses in the accompanying Consolidated Statements of Income. These taxes totaled
$1.8 billion
,
$2.0 billion
and
$1.8 billion
for the years ended
December 31, 2014
, 2013 and 2012, respectively.
Advertising Costs
The Company expenses advertising costs the first time the advertising takes place. Advertising costs incurred in development periods are included in pre-opening costs. Once a project is completed, advertising costs are primarily included in general and administrative expenses. Total advertising costs were
$23.3 million
,
$21.5 million
and
$23.0 million
for the years ended December 31, 2014, 2013 and 2012, respectively.
Pre-Opening Costs
Pre-opening costs consist primarily of direct salaries and wages, legal and consulting fees, insurance, utilities and advertising, and are expensed as incurred. During the years ended
December 31, 2014
, 2013 and 2012, the Company incurred pre-opening costs primarily in connection with the design and construction of Wynn Palace in the Cotai area of Macau.
Income Taxes
The Company is subject to income taxes in the U.S. and other foreign jurisdictions where it operates. Accounting standards require the recognition of deferred tax assets, net of applicable reserves, and liabilities for the estimated future tax consequences attributable to differences between financial statement carrying amounts of existing assets and liabilities and their respective tax bases and operating loss and tax credit carryforwards. Deferred tax assets and liabilities are measured using enacted tax rates in effect for the year in which those temporary differences are expected to be recovered or settled. The effect of a change in tax rates on the income tax provision and deferred tax assets and liabilities is recognized in the results of operations in the period that includes the enactment date. Accounting standards also require recognition of a future tax benefit to the extent that realization of such benefit is more likely than not. Otherwise, a valuation allowance is applied.
The Company’s income tax returns are subject to examination by the IRS and other tax authorities in the locations where it operates. The Company assesses potentially unfavorable outcomes of such examinations based on accounting standards for uncertain income taxes. The accounting standards prescribe a minimum recognition threshold a tax position is required to meet before being recognized in the financial statements.
Uncertain tax position accounting standards apply to all tax positions related to income taxes. These accounting standards utilize a two-step approach for evaluating tax positions. If a tax position, based on its technical merits, is deemed more likely
78
WYNN RESORTS, LIMITED AND SUBSIDIARIES
NOTES TO CONSOLIDATED FINANCIAL STATEMENTS (continued)
than not to be sustained, then the tax benefit is measured as the largest amount of benefit that is more likely than not to be realized upon settlement.
As applicable, the Company will recognize accrued penalties and interest related to unrecognized tax benefits in the provision for income taxes.
Foreign Currency
Gains or losses from foreign currency remeasurements are included in other income (expense) in the accompanying Consolidated Statements of Income. The results of operations and the balance sheet of Wynn Macau, Limited and its subsidiaries are translated from Macau patacas to U.S. dollars. Balance sheet accounts are translated at the exchange rate in effect at each year-end. Income statement accounts are translated at the average rate of exchange prevailing during the year. Translation adjustments resulting from this process are charged or credited to other comprehensive income.
Comprehensive Income
Comprehensive income includes net income and all other non-stockholder changes in equity, or other comprehensive income. Components of the Company’s comprehensive income are reported in the accompanying Consolidated Statements of Stockholders’ Equity and Consolidated Statements of Comprehensive Income. The cumulative balance of other comprehensive income consists solely of currency translation adjustments and unrealized gain (loss) on available-for-sale securities.
Fair Value Measurements
The Company measures certain of its financial assets and liabilities, such as cash equivalents, available-for-sale securities and interest rate swaps, at fair value on a recurring basis pursuant to accounting standards for fair value measurements. Fair value is the price that would be received to sell an asset or paid to transfer a liability in an orderly transaction between market participants at the measurement date. These accounting standards establish a three-tier fair value hierarchy, which prioritizes the inputs used in measuring fair value. These tiers include: Level 1, defined as observable inputs such as quoted prices in active markets; Level 2, defined as inputs other than quoted prices in active markets that are either directly or indirectly observable; and Level 3, defined as unobservable inputs in which little or no market data exists, therefore requiring an entity to develop its own assumptions.
79
WYNN RESORTS, LIMITED AND SUBSIDIARIES
NOTES TO CONSOLIDATED FINANCIAL STATEMENTS (continued)
The following table presents assets and liabilities carried at fair value (in thousands):
|
Fair Value Measurements Using:
|
||||||||||||||
|
December 31, 2014
|
Quoted
Market Prices in Active Markets (Level 1) |
Other
Observable Inputs (Level 2) |
Unobservable
Inputs (Level 3) |
|||||||||||
|
Assets:
|
||||||||||||||
|
Cash equivalents
|
$
|
1,156,285
|
|
$
|
828
|
|
$
|
1,155,457
|
|
—
|
|
|||
|
Interest rate swaps
|
$
|
5,915
|
|
—
|
|
$
|
5,915
|
|
—
|
|
||||
|
Restricted cash
|
$
|
977
|
|
$
|
977
|
|
—
|
|
—
|
|
||||
|
Available-for-sale securities
|
$
|
250,313
|
|
—
|
|
$
|
250,313
|
|
—
|
|
||||
|
Liabilities:
|
||||||||||||||
|
Redemption note
|
$
|
1,936,443
|
|
—
|
|
$
|
1,936,443
|
|
—
|
|
||||
|
Fair Value Measurements Using:
|
||||||||||||||
|
December 31, 2013
|
Quoted
Market Prices in Active Markets (Level 1) |
Other
Observable Inputs (Level 2) |
Unobservable
Inputs (Level 3) |
|||||||||||
|
Assets:
|
||||||||||||||
|
Cash equivalents
|
$
|
1,349,647
|
|
$
|
220,923
|
|
$
|
1,128,724
|
|
—
|
|
|||
|
Interest rate swaps
|
$
|
10,308
|
|
—
|
|
$
|
10,308
|
|
—
|
|
||||
|
Restricted cash
|
$
|
199,936
|
|
—
|
|
$
|
199,936
|
|
—
|
|
||||
|
Available-for-sale securities
|
$
|
254,388
|
|
—
|
|
$
|
254,388
|
|
—
|
|
||||
|
Liabilities:
|
||||||||||||||
|
Redemption note
|
$
|
1,936,443
|
|
—
|
|
$
|
1,936,443
|
|
—
|
|
||||
As of
December 31, 2014
and 2013, approximately
19%
and
91%
of the Company’s cash equivalents categorized as Level 2 were deposits held in foreign currencies, respectively.
Earnings Per Share
Basic earnings per share (“EPS’) is computed by dividing net income attributable to Wynn Resorts, Limited by the weighted average number of shares outstanding during the year. Diluted EPS is computed by dividing net income attributable to Wynn Resorts, Limited by the weighted average number of common shares outstanding during the period increased to include the number of additional shares of common stock that would have been outstanding if the potential dilutive securities had been issued. Potentially dilutive securities include outstanding stock options and unvested restricted stock.
80
WYNN RESORTS, LIMITED AND SUBSIDIARIES
NOTES TO CONSOLIDATED FINANCIAL STATEMENTS (continued)
The weighted average number of common and common equivalent shares used in the calculation of basic and diluted EPS consisted of the following (in thousands, except per share amount):
|
Years Ended December 31,
|
|||||||||||
|
2014
|
2013
|
2012
|
|||||||||
|
Numerator:
|
|||||||||||
|
Net income attributable to Wynn Resorts, Ltd.
|
$
|
731,554
|
|
$
|
728,652
|
|
$
|
502,036
|
|
||
|
Denominator:
|
|||||||||||
|
Weighted average common shares outstanding
|
100,927
|
|
100,540
|
|
103,092
|
|
|||||
|
Potential dilutive effect of stock options and restricted stock
|
1,004
|
|
1,101
|
|
1,157
|
|
|||||
|
Weighted average common and common equivalent shares outstanding
|
101,931
|
|
101,641
|
|
104,249
|
|
|||||
|
Net income attributable to Wynn Resorts, Ltd. per common share, basic
|
$
|
7.25
|
|
$
|
7.25
|
|
$
|
4.87
|
|
||
|
Net income attributable to Wynn Resorts, Ltd. per common share, diluted
|
$
|
7.18
|
|
$
|
7.17
|
|
$
|
4.82
|
|
||
|
Anti-dilutive stock options excluded from the calculation of diluted earnings per share
|
26
|
|
92
|
|
680
|
|
|||||
Stock-Based Compensation
The Company accounts for stock-based compensation in accordance with accounting standards which require the compensation cost relating to share-based payment transactions be recognized in the Company's Consolidated Statements of Income. The cost is measured at the grant date, based on the estimated fair value of the award using the Black-Scholes option pricing model for stock options, and based on the closing share price of the Company's stock on the grant date for nonvested share awards. The cost is recognized as an expense on a straight-line basis over the employee's requisite service period (the vesting period of the award) net of estimated forfeitures. The Company's stock-based employee compensation arrangements are more fully discussed in Note 15 “Stock-Based Compensation”.
Recently Issued Accounting Standards
In August 2014, the Financial Accounting Standards Board ("FASB") issued an accounting standards update that requires management to assess an entity’s ability to continue as a going concern and to provide related footnote disclosures in certain circumstances. Substantial doubt about an entity's ability to continue as a going concern exists when relevant conditions and events, consolidated in the aggregate, indicate that it is probable that an entity will be unable to meet its obligations as they become due within one year after the date that the financial statements are issued. Currently, there is no guidance in U.S. GAAP for management's responsibility to perform an evaluation. Under the update, management's evaluation is to be performed when preparing financial statements for each annual and interim reporting period and based on relevant conditions and events that are known and reasonably knowable at the date that the financial statements are issued. The Company will adopt this standard effective January 1, 2017. The Company is currently assessing the impact the adoption of this standard will have on its consolidated financial statements.
In June 2014, the FASB issued an accounting standards update that requires that a performance target that affects vesting, and that could be achieved after the requisite service period, be treated as a performance condition. As such, the performance target should not be reflected in estimating the grant date fair value of the award. This update further clarifies that compensation cost should be recognized in the period in which it becomes probable that the performance target will be achieved and should represent the compensation cost attributable to the period or periods for which the requisite service has already been rendered. The effective date for this update is for the annual and interim periods beginning after December 15, 2015. Early application is permitted. The Company does not anticipate that the adoption of this standard will have a material impact on its consolidated financial statements.
In May 2014, the FASB issued an accounting standards update that amends the FASB Accounting Standards Codification and creates a new topic for Revenue from Contracts with Customers. The new guidance is expected to clarify the principles for revenue recognition and to develop a common revenue standard for U.S. GAAP applicable to revenue transactions. This guidance provides that an entity should recognize revenue to depict the transfer of promised goods or services to customers in
81
WYNN RESORTS, LIMITED AND SUBSIDIARIES
NOTES TO CONSOLIDATED FINANCIAL STATEMENTS (continued)
an amount that reflects the consideration to which the entity expects to be entitled in exchange for those goods and services. This guidance also provides substantial revision of interim and annual disclosures. The update allows for either full retrospective adoption, meaning the guidance is applied for all periods presented, or modified retrospective adoption, meaning the guidance is applied only to the most current period presented in the financial statements with the cumulative effect of initially applying the guidance recognized at the date of initial application. The effective date for this update is for the annual and interim periods beginning after December 15, 2016. Early application is not permitted. The Company will adopt this standard effective January 1, 2017. The Company is currently assessing the impact the adoption of this standard will have on its consolidated financial statements.
In July 2013, the FASB issued an accounting standards update that amends the presentation requirements of an unrecognized tax benefit when a loss or other carryforward exists. The update would require the netting of unrecognized tax benefits against a deferred tax asset for a loss or other carryforward that would apply in settlement of the uncertain tax positions. The effective date for this update is for the annual and interim periods beginning after December 15, 2013. The Company adopted this standard during the first quarter of 2014. The adoption of this update prospectively resulted in the presentation of unrecognized tax benefits of
$29.2 million
previously reflected in other long-term liabilities to be classified in long-term deferred income taxes, net, in the accompanying Consolidated Balance Sheets, at
December 31, 2014
.
The following table presents the changes by component, net of tax and noncontrolling interest, in accumulated other comprehensive income of the Company (in thousands):
|
Foreign
currency translation |
Unrealized
gain (loss) on securities |
Accumulated
other comprehensive income |
|||||||||
|
December 31, 2013
|
$
|
2,874
|
|
$
|
39
|
|
$
|
2,913
|
|
||
|
Current period other comprehensive gain (loss)
|
129
|
|
(208
|
)
|
(79
|
)
|
|||||
|
Amounts reclassified from accumulated other comprehensive income
|
(333
|
)
|
4
|
|
(329
|
)
|
|||||
|
Net current-period other comprehensive loss
|
(204
|
)
|
(204
|
)
|
(408
|
)
|
|||||
|
December 31, 2014
|
$
|
2,670
|
|
$
|
(165
|
)
|
$
|
2,505
|
|
||
Investment securities consisted of the following (in thousands):
|
December 31, 2014
|
December 31, 2013
|
||||||||||||||||||||||||||||||
|
|
Amortized
cost |
Gross
unrealized gains |
Gross
unrealized losses |
Fair value
(net carrying amount) |
Amortized
cost |
Gross
unrealized gains |
Gross
unrealized losses |
Fair value
(net carrying amount) |
|||||||||||||||||||||||
|
Domestic and foreign corporate bonds
|
$
|
204,045
|
|
$
|
28
|
|
$
|
(174
|
)
|
$
|
203,899
|
|
$
|
221,418
|
|
$
|
140
|
|
$
|
(124
|
)
|
$
|
221,434
|
|
|||||||
|
Commercial paper
|
46,434
|
|
1
|
|
(21
|
)
|
46,414
|
|
32,941
|
|
16
|
|
(3
|
)
|
32,954
|
|
|||||||||||||||
|
$
|
250,479
|
|
$
|
29
|
|
$
|
(195
|
)
|
$
|
250,313
|
|
$
|
254,359
|
|
$
|
156
|
|
$
|
(127
|
)
|
$
|
254,388
|
|
||||||||
For investments with unrealized losses as of December 31, 2014, the Company has determined that (i) it does not have the intent to sell any of these investments, and (ii) it is not likely that the Company will be required to sell these investments prior to the recovery of the amortized cost. Accordingly, the Company has determined that no other-than-temporary impairments exist at the reporting date.
The Company obtains pricing information in determining the fair value of its available-for-sale securities from independent pricing vendors. Based on management’s inquiries, the pricing vendors use various pricing models consistent with what other market participants would use. The assumptions and inputs used by the pricing vendors are derived from market observable sources including: reported trades, broker/dealer quotes, issuer spreads, benchmark curves, bids, offers and other market-related data. The Company has not made adjustments to such prices. Each quarter, the Company validates the fair value pricing methodology to determine the fair value is consistent with applicable accounting guidance and to confirm that the
82
WYNN RESORTS, LIMITED AND SUBSIDIARIES
NOTES TO CONSOLIDATED FINANCIAL STATEMENTS (continued)
securities are classified properly in the fair value hierarchy. The Company compares the pricing received from its vendors to independent sources for the same or similar securities.
The fair value of these investment securities at December 31, 2014, by contractual maturity, are as follows (in thousands):
|
Fair value
|
|||
|
Available-for-sale securities
|
|||
|
Due in one year or less
|
$
|
240,140
|
|
|
Due after one year through two years
|
10,173
|
|
|
|
$
|
250,313
|
|
|
Receivables, net consisted of the following (in thousands):
|
As of December 31,
|
|||||||
|
2014
|
2013
|
||||||
|
Casino
|
$
|
257,930
|
|
$
|
252,998
|
|
|
|
Hotel
|
15,474
|
|
15,386
|
|
|||
|
Retail leases and other
|
39,231
|
|
47,539
|
|
|||
|
312,635
|
|
315,923
|
|
||||
|
Less: allowance for doubtful accounts
|
(74,678
|
)
|
(73,991
|
)
|
|||
|
$
|
237,957
|
|
$
|
241,932
|
|
||
Property and equipment, net consisted of the following (in thousands):
|
As of December 31,
|
|||||||
|
2014
|
2013
|
||||||
|
Land and improvements
|
$
|
734,625
|
|
$
|
733,233
|
|
|
|
Buildings and improvements
|
3,883,626
|
|
3,883,442
|
|
|||
|
Airplanes
|
126,491
|
|
135,040
|
|
|||
|
Furniture, fixtures and equipment
|
1,749,288
|
|
1,686,522
|
|
|||
|
Leasehold interest in land
|
316,431
|
|
316,550
|
|
|||
|
Construction in progress
|
1,666,326
|
|
558,624
|
|
|||
|
8,476,787
|
|
7,313,411
|
|
||||
|
Less: accumulated depreciation
|
(2,620,945
|
)
|
(2,378,962
|
)
|
|||
|
$
|
5,855,842
|
|
$
|
4,934,449
|
|
||
Construction in progress consists primarily of costs capitalized, including interest, for the construction of Wynn Palace.
83
WYNN RESORTS, LIMITED AND SUBSIDIARIES
NOTES TO CONSOLIDATED FINANCIAL STATEMENTS (continued)
Intangible assets, net consisted of the following (in thousands):
|
As of December 31,
|
|||||||
|
2014
|
2013
|
||||||
|
Indefinite-lived intangible assets:
|
|||||||
|
Trademarks
|
$
|
1,399
|
|
$
|
1,399
|
|
|
|
Water rights
|
6,400
|
|
6,400
|
|
|||
|
Total indefinite-lived intangible assets
|
7,799
|
|
7,799
|
|
|||
|
Finite-lived intangible assets:
|
|||||||
|
Macau Gaming Concession
|
42,300
|
|
42,300
|
|
|||
|
Less: accumulated amortization
|
(24,432
|
)
|
(22,048
|
)
|
|||
|
17,868
|
|
20,252
|
|
||||
|
Show Production rights
|
—
|
|
863
|
|
|||
|
Less: accumulated amortization
|
—
|
|
(863
|
)
|
|||
|
—
|
|
—
|
|
||||
|
Massachusetts Gaming License
|
86,700
|
|
—
|
|
|||
|
Less: accumulated amortization
|
—
|
|
—
|
|
|||
|
86,700
|
|
—
|
|
||||
|
Other
|
2,716
|
|
2,716
|
|
|||
|
Less: write-offs
|
(2,716
|
)
|
—
|
|
|||
|
—
|
|
2,716
|
|
||||
|
Total finite-lived intangible assets
|
104,568
|
|
22,968
|
|
|||
|
Total intangible assets, net
|
$
|
112,367
|
|
$
|
30,767
|
|
|
Water rights and trademarks are indefinite-lived assets and, accordingly, not amortized. Water rights reflect the fair value allocation determined in the purchase of the property on which Wynn Las Vegas is located in April 2000. The value of the trademarks primarily represents the costs to acquire the “Le Rêve” name.
The Macau gaming concession is a finite-lived intangible asset and being amortized over the
20
-year life of the concession. The Company expects that amortization of the Macau gaming concession will be
$2.4 million
each year from 2015 through 2021, and
$1.2 million
in 2022.
In November 2014, the Company was awarded a license to operate a casino in Massachusetts. The consideration paid to the State of Massachusetts for the license fee and certain costs incurred in connection with and contractually related to obtaining the license will be considered a finite-lived intangible asset. These amounts will be amortized beginning upon the opening of the resort.
84
WYNN RESORTS, LIMITED AND SUBSIDIARIES
NOTES TO CONSOLIDATED FINANCIAL STATEMENTS (continued)
Long-term debt consisted of the following (in thousands):
|
December 31,
|
|||||||
|
2014
|
2013
|
||||||
|
Macau Related:
|
|||||||
|
Wynn Macau Credit Facilities:
|
|||||||
|
Senior Term Loan, due July 31, 2017 and July 31, 2018; interest at LIBOR or HIBOR plus 1.75%—2.50%, net of original issue discount of $3,830 at December 31, 2014 and $4,900 at December 31, 2013
|
$
|
948,823
|
|
$
|
948,028
|
|
|
|
Senior Revolving Credit Facility, due July 31, 2017, interest at LIBOR or HIBOR plus 1.75%—2.50%
|
132,524
|
|
—
|
|
|||
|
5 1/4% Senior Notes, due October 15, 2021, including original issue premium of $5,141 at December 31, 2014 and none at December 31, 2013
|
1,355,141
|
|
600,000
|
|
|||
|
U.S. and Corporate Related:
|
|||||||
|
7 7/8% First Mortgage Notes, due May 1, 2020, net of original issue discount of $1,279 at December 31, 2014 and $1,463 at December 31, 2013
|
345,731
|
|
350,547
|
|
|||
|
7 3/4% First Mortgage Notes, due August 15, 2020
|
1,226,600
|
|
1,320,000
|
|
|||
|
5 3/8% First Mortgage Notes, due March 15, 2022
|
900,000
|
|
900,000
|
|
|||
|
4 1/4% Senior Notes, due May 30, 2023
|
500,000
|
|
500,000
|
|
|||
|
Redemption Price Promissory Note with former stockholder and related party, due February 18, 2022; interest at 2%
|
1,936,443
|
|
1,936,443
|
|
|||
|
Note Payable, due April 1, 2017; interest at LIBOR plus 1.25%
|
—
|
|
32,550
|
|
|||
|
7,345,262
|
|
6,587,568
|
|
||||
|
Current portion of long-term debt
|
—
|
|
(1,050
|
)
|
|||
|
$
|
7,345,262
|
|
$
|
6,586,518
|
|
||
Macau Related Debt
Wynn Macau Credit Facilities
On July 31, 2012, Wynn Resorts (Macau) S.A. (“Wynn Macau SA”), an indirect subsidiary of Wynn Resorts, Limited, amended and restated its credit facilities from September 2004 (as amended and restated, the “Wynn Macau Credit Facilities”). The Wynn Macau Credit Facilities and related agreements expanded availability under Wynn Macau SA’s senior secured bank facility to
$2.5 billion
(or equivalent in Hong Kong dollars), consisting of a
$1.55 billion
equivalent senior secured revolving credit facility and a
$950 million
equivalent fully funded senior secured term loan facility. The
$950 million
equivalent senior term loan facility includes an increase of
$200 million
equivalent from the exercise of an option by Wynn Macau SA on July 30, 2013. The exercise of Wynn Macau SA's option to increase the senior term loan facility was pursuant to the terms and provisions of the Wynn Macau Credit Facilities. Borrowings under the Wynn Macau Credit Facilities, which consist of both Hong Kong Dollar and United States Dollar tranches, were used to refinance Wynn Macau SA’s existing indebtedness, and will be used to fund the design, development, construction and pre-opening expenses of Wynn Palace and for general corporate purposes.
The revolving credit facility matures in July 2017 and the term loan facility matures in July 2018. The principal amount of the term loan is required to be repaid in two equal installments in
July 2017
and
July 2018
. The Wynn Macau Credit Facilities bear interest for the first six months after closing at LIBOR or HIBOR plus a margin of
2.50%
and thereafter will be subject to LIBOR or HIBOR plus a margin of between
1.75%
to
2.50%
based on Wynn Macau SA’s leverage ratio. The annual fee required to pay for unborrowed amounts, if any, is
0.61%
per annum, payable quarterly in arrears, calculated based on the daily average of the unborrowed amounts under such credit facilities.
Borrowings under the Wynn Macau Credit Facilities are guaranteed by Palo Real Estate Company Limited (“Palo”), a subsidiary of Wynn Macau SA, and by certain subsidiaries of the Company that own equity interests in Wynn Macau SA, and
85
WYNN RESORTS, LIMITED AND SUBSIDIARIES
NOTES TO CONSOLIDATED FINANCIAL STATEMENTS (continued)
are secured by substantially all of the assets of Wynn Macau SA, the equity interests in Wynn Macau SA and substantially all of the assets of Palo.
The Wynn Macau Credit Facilities contain a requirement that Wynn Macau SA must make mandatory repayments of indebtedness from specified percentages of excess cash flow. If Wynn Macau SA meets a Consolidated Leverage Ratio, as defined in the Wynn Macau Credit Facilities, of greater than
4.0
to 1, such repayment is defined as
50%
of Excess Cash Flow, as defined in the Wynn Macau Credit Facilities. If the Consolidated Leverage Ratio is equal or less than
4.0
to 1, then no repayment is required.
The Wynn Macau Credit Facilities contain customary covenants restricting certain activities including, but not limited to: the incurrence of additional indebtedness, the incurrence or creation of liens on any of its property, sale and leaseback transactions, the ability to dispose of assets, and making loans or other investments. In addition, Wynn Macau SA was required by the financial covenants to maintain a Leverage Ratio, as defined in the Wynn Macau Credit Facilities, of not greater than
4.50
to 1 as of
December 31, 2014
, and an Interest Coverage Ratio, as defined in the Wynn Macau Credit Facilities, of not less than
2.00
to 1.
In connection with the initial financing of Wynn Macau SA, Wynn Macau SA entered into a Bank Guarantee Reimbursement Agreement with Banco Nacional Ultramarino, S.A. (“BNU”) for the benefit of the Macau government. This guarantee assures Wynn Macau SA’s performance under the casino concession agreement, including the payment of premiums, fines and indemnity for any material failure to perform under the terms of the concession agreement. As of
December 31, 2014
, the guarantee was in the amount of
300 million
Macau patacas (approximately
$37 million
) and will remain at such amount until
180
days after the end of the term of the concession agreement (2022). BNU, as issuer of the guarantee, is currently secured by a second priority security interest in the senior lender collateral package. From and after repayment of all indebtedness under the Wynn Macau Credit Facilities, Wynn Macau SA is obligated to promptly, upon demand by BNU, repay any claim made on the guarantee by the Macau government. BNU is paid an annual fee for the guarantee of approximately
2.3 million
Macau patacas (approximately
$0.3 million
).
In connection with amending the Wynn Macau Credit Facilities, the Company expensed
$17.7 million
and capitalized
$33.2 million
of financing costs in the year ended December 31, 2012.
As of December 31, 2014, the Company had
$1.42 billion
of available borrowing capacity under the senior secured revolving credit facility.
5 1/4% Senior Notes due 2021
On March 20, 2014, Wynn Macau, Limited (“WML”), an indirect subsidiary of Wynn Resorts, Limited, issued
$750 million
aggregate principal amount of
5 1/4%
Senior Notes due 2021 (the “Additional 2021 Notes”), which were consolidated and form a single series with the
$600 million
aggregate principal amount of
5 1/4%
Senior Notes due 2021 issued by WML on October 16, 2013 (the “Original 2021 Notes” and together with the “Additional 2021 Notes”, the “2021 Notes”). WML received net proceeds of approximately
$748.8 million
after adding the original issue premium and deducting commissions and expenses of the offering. WML will use the net proceeds for working capital requirements and general corporate purposes.
The Additional 2021 Notes have the same terms and conditions as those of the Original 2021 Notes. The 2021 Notes will bear interest at the rate of 5 1/4% per annum and will mature on October 15, 2021. Interest on the 2021 Notes is payable semi-annually in arrears on April 15 and October 15 of each year, beginning on April 15, 2014. At any time on or before October 14, 2016, WML may redeem the 2021 Notes, in whole or in part, at a redemption price equal to the greater of (a)
100%
of the aggregate principal amount of the 2021 Notes or (b) a “make-whole” amount as determined by an independent investment banker in accordance with the terms of the indenture for the 2021 Notes, dated as of October 16, 2013 (the "WML Indenture"). In either case, the redemption price would include accrued and unpaid interest. In addition, on or after October 15, 2016, WML may redeem the 2021 Notes, in whole or in part, at a premium decreasing annually from
103.94%
of the principal amount to
zero
, plus accrued and unpaid interest. If WML undergoes a Change of Control (as defined in the WML Indenture), it must offer to repurchase the 2021 Notes at a price equal to
101%
of the aggregate principal amount thereof, plus accrued and unpaid interest. In addition, the Company may redeem the 2021 Notes, in whole but not in part, at a redemption price equal to
100%
of the principal amount, plus accrued and unpaid interest, in response to any change in or amendment to certain tax laws or tax positions. Further, if a holder or beneficial owner of the 2021 Notes fails to meet certain requirements imposed by any Gaming Authority (as defined in the WML Indenture), WML may require the holder or beneficial owner to dispose of or redeem its 2021 Notes.
86
WYNN RESORTS, LIMITED AND SUBSIDIARIES
NOTES TO CONSOLIDATED FINANCIAL STATEMENTS (continued)
The 2021 Notes are WML’s general unsecured obligations and rank pari passu in right of payment with all of WML’s existing and future senior unsecured indebtedness; will rank senior to all of WML’s future subordinated indebtedness, if any; will be effectively subordinated to all of WML’s future secured indebtedness to the extent of the value of the assets securing such debt; and will be structurally subordinated to all existing and future obligations of WML’s subsidiaries, including Wynn Macau SA’s existing credit facilities. The 2021 Notes are not registered under the Securities Act of 1933, as amended (the “Securities Act”), and the 2021 Notes are subject to restrictions on transferability and resale.
The WML Indenture contains covenants limiting WML’s (and certain of its subsidiaries’) ability to, among other things: merge or consolidate with another company; transfer or sell all or substantially all of its properties or assets; and lease all or substantially all of its properties or assets. The terms of the WML Indenture contain customary events of default, including, but not limited to: default for
30 days
in the payment when due of interest on the 2021 Notes; default in the payment when due of the principal of, or premium, if any, on the 2021 Notes; failure to comply with any payment obligations relating to the repurchase by WML of the 2021 Notes upon a change of control; failure to comply with certain covenants in the WML Indenture; certain defaults on certain other indebtedness; failure to pay judgments against WML or certain subsidiaries that, in the aggregate, exceed
$50 million
; and certain events of bankruptcy or insolvency. In the case of an event of default arising from certain events of bankruptcy or insolvency, all 2021 Notes then outstanding will become due and payable immediately without further action or notice.
U.S. and Corporate Related Debt
Wynn America Credit Facilities
On November 20, 2014, Wynn America, LLC ("Wynn America"), an indirect wholly owned subsidiary of Wynn Resorts, Limted, and certain subsidiaries of Wynn America, entered into a
$1.25 billion
senior secured credit facility. The senior secured credit facility consists of a
$375 million
senior secured revolving credit facility and an
$875 million
delay draw senior secured term loan facility (together, the "Wynn America Credit Facilities"). Borrowings under the Wynn America Credit Facilities will be used by the Company primarily to fund the design, development, construction and pre-opening expenses of the Wynn resort in Massachusetts and for other general corporate purposes.
The revolving credit facility matures in November 2019. The term loan facility matures in November 2020 and will require quarterly principal payments, scheduled to begin in June 2018. Subject to certain exceptions, the Wynn America Credit Facilities bear interest at either base rate plus
0.75%
per annum or the reserve adjusted eurodollar rate plus
1.75%
per annum. The annual fee required to pay for unborrowed amounts, if any, is
0.30%
per annum, payable quarterly in arrears, calculated based on the daily average of the unborrowed amounts under such credit facilities.
Certain subsidiaries of Wynn America will guarantee the obligation of Wynn America under the credit facilities. Wynn America has agreed to use commercially reasonable efforts to cause a series of corporate restructurings and related transactions, including receipt of gaming approvals from relevant gaming authorities, pursuant to which Wynn Las Vegas, LLC and its subsidiaries will become subsidiaries of Wynn Las Vegas Holdings, LLC, a direct subsidiary of Wynn America (the "Wynn Las Vegas Reorganization"). Upon the consummation of the Wynn Las Vegas Reorganization (including receipt of all approvals required under applicable gaming laws and regulations), Wynn Las Vegas, LLC and its subsidiaries shall be restricted subsidiaries under the credit facilities but shall not guarantee the obligations of Wynn America until such time, and then only to such extent, as may be permitted by any then existing Wynn Las Vegas, LLC' senior secured notes.
The Wynn America Credit Facilities contain customary representation and warranties, events of default and negative and affirmative covenants, including, among other things, limitations on: indebtedness; investments; restricted payments; mergers and acquisitions; payments of indebtedness; negative pledges; liens; transactions with affiliates and sales of assets. In addition, Wynn America is subject to financial covenants including maintaining a Maximum Consolidated Senior Secured Net Leverage Ratio and a Minimum Consolidated EBITDA, each as defined in the Wynn America Credit Facilities. Commencing with the second full fiscal quarter ending after the fiscal quarter in which the opening of the Wynn Resort in Massachusetts occurs, the Maximum Consolidated Senior Secured Net Leverage Ratio is not to exceed
2.75
to 1. Commencing with the first full fiscal quarter ending with the fiscal quarter in which the Wynn Las Vegas Reorganization occurs, the Minimum Consolidated EBITDA is not to be less than
$200.0 million
.
The Company has provided a completion guaranty in favor of the lenders under the Wynn America Credit Facilities to support the development and opening of the Wynn resort in Massachusetts.
87
WYNN RESORTS, LIMITED AND SUBSIDIARIES
NOTES TO CONSOLIDATED FINANCIAL STATEMENTS (continued)
Wynn America and the guarantors have entered into a security agreement in favor of the lenders under the Wynn America Credit Facilities pursuant to which, subject to certain exceptions, Wynn America and the guarantors have pledged all equity interests in the guarantors to the extent permitted by applicable law and granted a first priority security interest in substantially all of the other existing and future assets of the guarantors.
In connection with entering into the Wynn America Credit Facilities, the Company capitalized
$23.4 million
of financing costs in the year ended December 31, 2014.
As of December 31, 2014, there were no amounts drawn under the Wynn America Credit Facilities, however, there were outstanding letters of credit totaling
$8.9 million
reducing the available borrowing capacity to
$1.24 billion
.
7 7/8% First Mortgage Notes due 2020
In April 2010, Wynn Las Vegas, LLC and Wynn Las Vegas Capital Corp. ("Wynn Capital"), an indirect wholly owned subsidiary of Wynn Resorts, Limited (together, the "Issuers") issued, in a private offering,
$352 million
aggregate principal amount of 7 7/8% first mortgage notes due May 1, 2020 (the “7 7/8%
2020
Notes”). The 7 7/8% 2020 Notes were issued pursuant to an exchange offer for previously issued notes that were to mature in
December 2014
. Interest is due on the 7 7/8% 2020 Notes on May 1st and November 1st of each year. Commencing May 1, 2015, the 7 7/8% 2020 Notes are redeemable at the Issuers’ option at a price equal to
103.938%
of the principal amount redeemed and the premium over the principal amount declines ratably on May 1st of each year thereafter to
zero
on or after May 1, 2018. The 7 7/8% 2020 Notes are senior obligations of the Issuers and are unsecured (except by the first priority pledge by Wynn Resorts Holdings, LLC of its equity interests in Wynn Las Vegas, LLC (the "Holdings pledge")). The Issuers’ obligations under the 7 7/8% 2020 Notes rank pari passu in right of payment with the 7 3/4% 2020 Notes (as defined below), the
2022
Notes (as defined below) and the 2023 Notes (as defined below). The 7 7/8% 2020 Notes are not guaranteed by any of the Company’s subsidiaries. If the Issuers undergo a change of control, they must offer to repurchase the 7 7/8% 2020 Notes at
101%
of the principal amount, plus accrued and unpaid interest. The indenture governing the 7 7/8% 2020 Notes contains customary negative covenants and financial covenants, including, but not limited to, covenants that restrict Wynn Las Vegas, LLC's ability to: pay dividends or distributions or repurchase equity; incur additional debt; make investments; create liens on assets to secure debt; enter into transactions with affiliates; enter into sale-leaseback transactions; merge or consolidate with another company; transfer and sell assets or create dividend and other payment restrictions affecting subsidiaries.
During the year ended
December 31, 2014
, Wynn Las Vegas, LLC repurchased and canceled
$5.0 million
in principal, plus interest, of its 7 7/8% first mortgage notes due May 1, 2020 through the open market. The Company incurred
$0.5 million
in expenses associated primarily with the premium paid for the repurchases and unamortized deferred financing costs and original issue discount, which is included in loss on extinguishment of debt in the accompanying Consolidated Statements of Income.
On February 10, 2015, the Issuers commenced a cash tender offer for any and all of the outstanding aggregate principal amount of the 7 7/8% 2020 Notes. Wynn Las Vegas, LLC accepted for purchase valid tenders with respect to approximately
$305.8 million
of the
$377.0 million
aggregate principal amount. For more information on the cash tender offer of the 7 7/8% 2020 Notes, see Note 20 "Subsequent Events".
88
WYNN RESORTS, LIMITED AND SUBSIDIARIES
NOTES TO CONSOLIDATED FINANCIAL STATEMENTS (continued)
7 3/4% First Mortgage Notes due 2020
In August 2010, the Issuers issued
$1.32 billion
aggregate principal amount of 7 3/4% first mortgage notes due August 15, 2020 (the “7 3/4% 2020 Notes”). The 7 3/4% 2020 Notes were issued at par. The 7 3/4% 2020 Notes refinanced a previous notes issue that was to mature in
December 2014
. Interest is due on the 7 3/4% 2020 Notes on February 15th and August 15th of each year. Commencing August 15, 2015, the 7 3/4% 2020 Notes are redeemable at the Issuers’ option at a price equal to
103.875%
of the principal amount redeemed and the premium over the principal amount declines ratably on August 15th of each year thereafter to
zero
on or after August 15, 2018. The 7 3/4% 2020 Notes are senior obligations of the Issuers and are unsecured (except by the Holdings pledge). The Issuers’ obligations under the 7 3/4% 2020 Notes rank pari passu in right of payment with the 7 7/8% 2020 Notes, the 2022 Notes (as defined below) and the 2023 Notes (as defined below). The 7 3/4% 2020 Notes are not guaranteed by any of the Company’s subsidiaries. If the Issuers undergo a change of control, they must offer to repurchase the 7 3/4% 2020 Notes at
101%
of the principal amount, plus accrued and unpaid interest. The indenture governing the 7 3/4% 2020 Notes contains customary negative covenants and financial covenants, including, but not limited to, covenants that restrict Wynn Las Vegas, LLC’s ability to: pay dividends or distributions or repurchase equity; incur additional debt; make investments; create liens on assets to secure debt; enter into transactions with affiliates; enter into sale-leaseback transactions; merge or consolidate with another company; transfer and sell assets or create dividend and other payment restrictions affecting subsidiaries.
During the year ended
December 31, 2014
, Wynn Las Vegas, LLC repurchased and canceled
$93.4 million
in principal, plus interest, of its 7 3/4% first mortgage notes due August 15, 2020 through the open market. The Company incurred
$9.1 million
in expenses associated primarily with the premium paid for the repurchases and unamortized deferred financing costs included in loss on extinguishment of debt in the accompanying Consolidated Statements of Income.
On February 10, 2015, the Issuers commenced a cash tender offer for any and all of the outstanding aggregate principal amount of the 7 3/4% 2020 Notes. Wynn Las Vegas, LLC accepted for purchase valid tenders with respect to approximately
$1,146.5 million
of the
$1,226.6 million
aggregate principal amount. For more information on the cash tender offer of the 7 3/4% 2020 Notes, see Note 20 "Subsequent Events".
5 3/8%
First Mortgage Notes due 2022
In March 2012, the Issuers issued, in a private offering,
$900 million
aggregate principal amount of 5 3/8% First Mortgage Notes due 2022 (the “
2022
Notes”). A portion of the proceeds were used to repay all amounts outstanding under the Wynn Las Vegas, LLC term loan facilities. In October 2012, the Issuers commenced an offer to exchange all of the 2022 Notes for notes registered under the Securities Act of 1933, as amended. The exchange offer closed on November 6, 2012. Interest is due on the 2022 Notes on March 15th and September 15th of each year. Commencing March 15, 2017, the 2022 Notes are redeemable at the Issuers’ option at a price equal to
102.688%
of the principal amount redeemed and the premium over the principal amount declines ratably on March 15th of each year thereafter to
zero
on or after March 15, 2020. The 2022 Notes are senior obligations of the Issuers and are unsecured (except by the Holdings pledge). The Issuers’ obligations under the 2022 Notes rank pari passu in right of payment with the 7 7/8% 2020 Notes, the 7 3/4% 2020 Notes and the 2023 Notes (as defined below). The 2022 Notes are not guaranteed by any of the Company’s subsidiaries. If the Issuers undergo a change of control, they must offer to repurchase the 2022 Notes at
101%
of the principal amount, plus accrued and unpaid interest. The indenture governing the 2022 Notes contains customary negative covenants and financial covenants, including, but not limited to, covenants that restrict Wynn Las Vegas, LLC’s ability to: pay dividends or distributions or repurchase equity; incur additional debt; make investments; create liens on assets to secure debt; enter into transactions with affiliates; enter into sale-leaseback transactions; merge or consolidate with another company; transfer and sell assets or create dividend and other payment restrictions affecting subsidiaries.
4 1/4% Senior Notes due 2023
In May 2013, the Issuers completed the issuance of
$500 million
aggregate principal amount of 4 1/4% Senior Notes due
2023
(the “
2023
Notes”) pursuant to an indenture, dated as of
May 22, 2013
(the “2023 Indenture”), among the Issuers, the Guarantors (as defined below) and U.S. Bank National Association, as trustee. The 2023 Notes were issued at par. The Issuers used the net proceeds from the 2023 Notes to cover the cost of purchasing the 2017 Notes tendered in the tender offer. In addition, the Issuers satisfied and discharged the 2017 Indenture and, in November 2013, used the remaining net proceeds to redeem all of the 2017 Notes not previously tendered. In connection with the issuance of the 2023 Notes, the Company capitalized approximately
$4.1 million
of financing costs.
89
WYNN RESORTS, LIMITED AND SUBSIDIARIES
NOTES TO CONSOLIDATED FINANCIAL STATEMENTS (continued)
The 2023 Notes will mature on
May 30, 2023
and bear interest at the rate of 4 1/4% per annum. The Issuers may, at their option, redeem the 2023 Notes, in whole or in part, at any time or from time to time prior to their stated maturity. The redemption price for 2023 Notes that are redeemed before
February 28, 2023
will be equal to the greater of (a)
100%
of the principal amount of the 2023 Notes to be redeemed or (b) a “make-whole” amount described in the 2023 Indenture, plus in either case accrued and unpaid interest to, but not including, the redemption date. The redemption price for the 2023 Notes that are redeemed on or after
February 28, 2023
will be equal to
100%
of the principal amount of the 2023 Notes to be redeemed, plus accrued and unpaid interest to, but not including, the redemption date. In the event of a change of control triggering event, the Issuers will be required to offer to repurchase the 2023 Notes at
101%
of the principal amount, plus accrued and unpaid interest to but not including the repurchase date. The 2023 Notes are also subject to mandatory redemption requirements imposed by gaming laws and regulations of gaming authorities in Nevada.
The 2023 Notes are the Issuers’ senior unsecured obligations and rank pari passu in right of payment with the Issuers’ outstanding 7 7/8% 2020 Notes, 7 3/4% 2020 Notes and the 2022 Notes. The 2023 Notes are secured by a first priority pledge of the Company’s equity interests. The equity interests of the Company also secure the Issuers' outstanding 7 7/8% 2020 Notes, 7 3/4% 2020 Notes and the 2022 Notes. If Wynn Resorts, Limited receives an investment grade rating from one or more ratings agencies, the first priority pledge securing the 2023 Notes will be released.
The 2023 Notes are jointly and severally guaranteed by all of the Issuers’ subsidiaries, other than Wynn Las Vegas Capital Corp., which was a co-issuer (the “Guarantors”). The guarantees are senior unsecured obligations of the Guarantors and rank senior in right of payment to all of their existing and future subordinated debt. The guarantees rank equally in right of payment with all existing and future liabilities of the Guarantors that are not so subordinated and will be effectively subordinated in right of payment to all of such Guarantors’ existing and future secured debt (to the extent of the collateral securing such debt).
The 2023 Indenture contains covenants limiting the Issuers’ and the Guarantors' ability to create liens on assets to secure debt; enter into sale-leaseback transactions; and merge or consolidate with another company. These covenants are subject to a number of important and significant limitations, qualifications and exceptions.
Events of default under the 2023 Indenture include, among others, the following: default for
30
days in the payment when due of interest on the 2023 Notes; default in payment when due of the principal of, or premium, if any, on the 2023 Notes; failure to comply with certain covenants in the 2023 Indenture; and certain events of bankruptcy or insolvency. In the case of an event of default arising from certain events of bankruptcy or insolvency with respect to the Issuers or any Guarantor, all 2023 Notes then outstanding will become due and payable immediately without further action or notice.
The 2023 Notes were offered pursuant to an exemption under the Securities Act of 1933, as amended (the “Securities Act”). The 2023 Notes were offered only to qualified institutional buyers in reliance on Rule 144A under the Securities Act or outside the United States to certain persons in reliance on Regulation S under the Securities Act. The 2023 Notes have not been and will not be registered under the Securities Act of 1933 or under any state securities laws. Therefore, the 2023 Notes may not be offered or sold within the United States to, or for the account or benefit of, any United States person unless the offer or sale would qualify for a registration exemption from the Securities Act and applicable state securities laws.
Redemption Price Promissory Note
Based on the Board of Directors’ finding of “unsuitability,” on February 18, 2012, the Company redeemed and canceled Aruze’s
24,549,222
shares of Wynn Resorts’ common stock. Following a finding of “unsuitability,” Wynn Resorts’ articles of incorporation authorize redemption of the shares held by unsuitable persons at a “fair value” redemption price. The Company engaged an independent financial advisor to assist in the fair value calculation and concluded that a discount to the then current trading price was appropriate because of, among other things, restrictions on most of the shares held by Aruze under the terms of the Stockholders Agreement (as defined below). Pursuant to its articles of incorporation, the Company issued the Redemption Note to Aruze, a former stockholder and related party, in redemption of the shares. The Redemption Note has a principal amount of
$1.94 billion
, matures on
February 18, 2022
and bears interest at the rate of
2%
per annum payable annually in arrears on each anniversary of the date of the Redemption Note. The Company may, in its sole and absolute discretion, at any time and from time to time, and without penalty or premium, prepay the whole or any portion of the principal or interest due under the Redemption Note. In no instance shall any payment obligation under the Redemption Note be accelerated except in the sole and absolute discretion of the Company or as specifically mandated by law. The indebtedness evidenced by the Redemption Note is and shall be subordinated in right of payment, to the extent and in the manner provided in the Redemption Note, to the prior payment in full of all existing and future obligations of Wynn Resorts and any of its affiliates in respect of indebtedness for borrowed money of any kind or nature.
90
WYNN RESORTS, LIMITED AND SUBSIDIARIES
NOTES TO CONSOLIDATED FINANCIAL STATEMENTS (continued)
The Company recorded the fair value of the Redemption Note of approximately
$1.94 billion
in accordance with applicable accounting guidance. The Company utilized an independent third party valuation to assist in the determination of this fair value. In determining this fair value, the Company estimated the Redemption Note’s present value using discounted cash flows with a probability weighted expected return for redemption assumptions and a discount rate which included time value and non-performance risk adjustments commensurate with risk of the Redemption Note.
Considerations for the redemption assumptions included the stated maturity of the Redemption Note, uncertainty of the related cash flows as well as potential effects of the following: uncertainties surrounding the potential outcome and timing of pending litigation with the Okada Parties (see Note 17 “Commitments and Contingencies”); the outcome of on-going investigations of Aruze by the United States Attorney’s Office, the U.S. Department of Justice and the Nevada Gaming Control Board; and other potential legal and regulatory actions. In addition, in the furtherance of various future business objectives, the Company considered its ability, at its sole option, to prepay the Redemption Note at any time in accordance with its terms without penalty. Accordingly, the Company reasonably determined that the estimated life of the Redemption Note could be less than the contractual life of the Redemption Note.
In determination of the appropriate discount rate to be used in the estimated present value, the Redemption Note’s subordinated position relative to all other debt in the Company’s capital structure and credit ratings associated with the Company’s traded debt were considered. Observable inputs for the risk free rate based on Federal Reserve rates for U.S. Treasury securities and credit risk spread based on a yield curve index of similarly rated debt was used. As a result of this analysis, the Company concluded the Redemption Notes’s stated rate of
2%
approximated a market rate.
The Okada Parties have challenged the redemption of Aruze’s shares and the Company is currently involved in litigation with those parties as well as related shareholder derivative litigation. See further discussion in Note 17 “Commitments and Contingencies”.
On each of February 14, 2013 and February 13, 2014, the Company issued checks to Aruze in the amount of
$38.7 million
, representing the interest payments due on the Redemption Note at those times. However, those checks were not cashed. In February 2014, the Okada Parties advised of their intent to deposit any checks for interest and principal, past and future, due under the terms of the Redemption Note to the clerk of the court for deposit into the clerk’s trust account. On March 17, 2014, the parties stipulated that the checks be returned to the Company for reissue in the same amounts, payable to the clerk of the court for deposit into the clerk's trust account. Pursuant to the stipulation, on March 20, 2014, the Company delivered to the clerk of the court the reissued checks that were deposited into the clerk's trust account and filed a notice with the court with respect to the same. On February 13, 2015, the Company issued a check for interest payment due at that time to the clerk of the court for deposit into the clerk’s trust account.
As further discussed in Note 17 “Commitments and Contingencies”, on June 19, 2012, Elaine Wynn asserted a cross claim against Stephen A. Wynn and Aruze seeking a declaration that (1) any and all of Elaine Wynn’s duties under the Stockholders Agreement shall be discharged; (2) the Stockholders Agreement is subject to rescission and is rescinded; (3) the Stockholders Agreement is an unreasonable restraint on alienation in violation of public policy; and/or (4) the restrictions on sale of shares shall be construed as inapplicable to Elaine Wynn. The indenture for Wynn Las Vegas, LLC's 4 1/4% Senior Notes due 2023 (the "2023 Indenture") provides that if Stephen A. Wynn, together with certain related parties, in the aggregate beneficially owns a lesser percentage of the outstanding common stock of the Company than are beneficially owned by any other person, a change of control will have occurred. The indenture for Wynn Las Vegas, LLC's 5 1/2% Senior Notes due 2025 (the "2025 Indenture") provides that if any event constitutes a "change of control" under the 2023 Indenture, it will constitute a change of control under the 2025 Indenture. If Elaine Wynn prevails in her cross claim, Stephen A. Wynn would not beneficially own or control Elaine Wynn’s shares, which could increase the likelihood that a change in control may occur under the Wynn Las Vegas debt documents. Under the 2023 Indenture and the 2025 Indenture, if a change of control occurs and within
60 days
after that occurrence, the 4 1/4% Senior Notes due 2023 or the 5 1/2% Senior Notes due 2025, as applicable, are rated below investment grade by both rating agencies that rate such notes, the Company is required to make an offer to each applicable holder to repurchase all or any part of such holder’s notes at a purchase price equal to
101%
of the aggregate principal amount thereof plus accrued and unpaid interest on the notes purchased, if any, to the date of repurchase (unless the notes have been previously called for redemption). Mr. Wynn is opposing Ms. Wynn’s cross claim.
The Company will continue to vigorously pursue its claims against the Okada Parties, and the Company, each of the members of the Company’s Board of Directors (other than Mr. Okada) and Wynn Resorts’ General Counsel (collectively, the “Wynn Parties”) will continue to vigorously defend against the counterclaims asserted against them. The Company’s claims and
91
WYNN RESORTS, LIMITED AND SUBSIDIARIES
NOTES TO CONSOLIDATED FINANCIAL STATEMENTS (continued)
the Okada Parties’ counterclaims remain in an early stage and management has determined that based on proceedings to date, it is currently unable to determine the probability of the outcome of this matter or the range of reasonably possible loss, if any. An adverse judgment or settlement involving payment of a material amount could cause a material adverse effect on our financial condition.
Note Payable for Aircraft
In March 2007, World Travel, LLC, a subsidiary of Wynn Las Vegas, LLC, entered into a loan agreement with a principal balance of
$42 million
. The loan was guaranteed by Wynn Las Vegas, LLC and secured by a first priority security interest in one of the Company’s aircraft. Principal payments of
$350,000
plus interest were made quarterly with a balloon payment of
$28 million
due at maturity, April 1, 2017. Interest was calculated at
90
-day LIBOR plus
125
basis points.
In November 2014, the Company sold the aircraft and fully repaid the remaining principal amount of
$31.5 million
and all accrued interest on the note payable.
Debt Covenant Compliance
As of
December 31, 2014
, management believes the Company was in compliance with all debt covenants.
Fair Value of Long-Term Debt
The estimated fair value of the Company’s long-term debt, excluding the Redemption Note, as of
December 31, 2014
and 2013, was approximately
$5.4 billion
and
$4.8 billion
, respectively compared to its carrying value of
$5.4 billion
and
$4.7 billion
, respectively. The estimated fair value of the Company’s long-term debt, excluding the Redemption Note, is based on recent trades, if available, and indicative pricing from market information (Level 2 inputs). See Note 2 “Summary of Significant Accounting Policies” for discussion on the estimated fair value of the Redemption Note.
Scheduled Maturities of Long-Term Debt
Scheduled maturities of long-term debt, including the accretion of debt discounts of
$5.1 million
and amortization of debt premiums of
$5.1 million
, are as follows (in thousands):
|
Years Ending December 31,
|
|||
|
2017
|
$
|
508,922
|
|
|
2018
|
576,256
|
|
|
|
2019
|
—
|
|
|
|
Thereafter
|
6,260,052
|
|
|
|
$
|
7,345,230
|
|
|
The Company has entered into floating-for-fixed interest rate swap arrangements in order to manage interest rate risk relating to certain of its debt facilities. These interest rate swap agreements modify the Company’s exposure to interest rate risk by converting a portion of the Company’s floating-rate debt to a fixed rate. These interest rate swaps essentially fix the interest rate at the percentages noted below; however, changes in the fair value of the interest rate swaps for each reporting period have been recorded as an increase (decrease) in swap fair value in the accompanying Consolidated Statements of Income, as the interest rate swaps do not qualify for hedge accounting.
The Company utilized Level 2 inputs as described in Note 2 "Summary of Significant Accounting Policies” to determine fair value. The fair value approximates the amount the Company would pay if these contracts were settled at the respective valuation dates. Fair value is estimated based upon current, and predictions of future, interest rate levels along a yield curve, the remaining duration of the instruments and other market conditions, and therefore, is subject to significant estimation and a high degree of variability and fluctuation between periods. The fair value is adjusted, to reflect the impact of credit ratings of the counterparties or the Company, as applicable. These adjustments resulted in a reduction in the fair values as compared to their settlement values. As of
December 31, 2014
and 2013, the interest rate swaps were recorded as an asset of
$5.9 million
and
$10.3 million
, respectively, and included in deposits and other assets.
92
WYNN RESORTS, LIMITED AND SUBSIDIARIES
NOTES TO CONSOLIDATED FINANCIAL STATEMENTS (continued)
The Company currently has
three
interest rate swap agreements intended to hedge a portion of the underlying interest rate risk on borrowings under the Amended Wynn Macau Credit Facilities. Under
two
of the swap agreements, the Company pays a fixed interest rate (excluding the applicable interest margin) of
0.73%
on notional amounts corresponding to borrowings of HK
$3.95 billion
(approximately
$509.4 million
) incurred under the Amended Wynn Macau Credit Facilities in exchange for receipts on the same amount at a variable interest rate based on the applicable HIBOR at the time of payment. These interest rate swaps fix the all-in interest rate on such amounts at
2.48%
to
3.23%
. These interest rate swap agreements mature in
July 2017
.
Under the third swap agreement, the Company pays a fixed interest rate (excluding the applicable interest margin) of
0.68%
on notional amounts corresponding to borrowings of
$243.8 million
incurred under the Amended Wynn Macau Credit Facilities in exchange for receipts on the same amount at a variable rate based on the applicable LIBOR at the time of payment. This interest rate swap fixes the all-in interest rate on such amounts at
2.43%
to
3.18%
. This interest rate swap agreement matures in
July 2017
.
Related Party Share Redemption
Based on the Board of Directors’ finding of “unsuitability,” on February 18, 2012, the Company redeemed and canceled Aruze’s
24,549,222
shares of Wynn Resorts’ common stock. Following a finding of “unsuitability,” Wynn Resorts’ articles of incorporation authorize redemption of the shares held by unsuitable persons at a “fair value” redemption price. The Company engaged an independent financial advisor to assist in the fair value calculation and concluded that a discount to the then current trading price was appropriate because of, among other things, restrictions on most of the shares which were subject to the terms of an existing stockholder agreement. Pursuant to its articles of incorporation, the Company issued the Redemption Note to Aruze, a former stockholder and related party, in redemption of the shares. Aruze, Universal Entertainment Corporation and Kazuo Okada have challenged the redemption of Aruze’s shares and we are currently involved in litigation with those parties as well as related shareholder derivative litigation. The outcome of these various proceedings cannot be predicted. The Company’s claims and the Okada Parties’ counterclaims are in a preliminary stage and management has determined that based on proceedings to date, it is currently unable to determine the probability of the outcome of this matter or the range of reasonably possible loss, if any. An adverse judgment or settlement involving payment of a material amount could cause a material adverse effect on our financial condition.
Amounts Due to Officers
The Company periodically provides services to Stephen A. Wynn, Chairman of the Board of Directors and Chief Executive Officer (“Mr. Wynn”), and certain other officers and directors of the Company, including the personal use of employees, construction work and other personal services. Mr. Wynn and other officers and directors have deposits with the Company to prepay any such items, which are replenished on an ongoing basis as needed. As of December 31, 2014 and 2013, Mr. Wynn and the other officers and directors had a net deposit balance with the Company of
$0.6 million
and
$0.8 million
, respectively.
Villa Lease
On March 18, 2010, Mr. Wynn and Wynn Las Vegas, LLC entered into an Amended and Restated Agreement of Lease (the “Prior SW Lease”) for a villa to serve as Mr. Wynn’s personal residence. The Prior SW Lease amended and restated a previous lease. The Prior SW Lease was approved by the Audit Committee of the Board of Directors of the Company. The term of the Prior SW Lease commenced as of March 1, 2010 and ran concurrent with Mr. Wynn’s employment agreement with the Company; provided that either party could terminate on
90
days notice. Pursuant to the Prior SW Lease, the rental value of the villa was treated as imputed income to Mr. Wynn, and was equal to the fair market value of the accommodations provided. Effective March 1, 2010, and for the first two years of the term of the Prior SW Lease, the rental value was
$503,831
per year. Effective March 1, 2012, the rental value was
$440,000
per year.
On May 7, 2013, Wynn Las Vegas, LLC entered into a 2013 Amended and Restated Agreement of Lease (the “Existing SW Lease”), effective December 29, 2012, to include an expansion of the villa and to adjust the rental value accordingly to
$525,000
per year based on the current fair market value as established by the Audit Committee of the Company with the assistance of an independent third-party expert opinion of value.
93
WYNN RESORTS, LIMITED AND SUBSIDIARIES
NOTES TO CONSOLIDATED FINANCIAL STATEMENTS (continued)
On November 7, 2013, Mr. Wynn and Wynn Las Vegas, LLC entered into a 2013 Second Amended and Restated Agreement of Lease (the “New SW Lease”) amending and restating the Existing SW Lease, effective as of November 5, 2013. The New SW Lease was approved by the Audit Committee of the Board of Directors of Wynn Resorts. Pursuant to the New SW Lease, effective as of November 5, 2013, Mr. Wynn will pay Wynn Las Vegas, LLC annual rent for the villa of
$525,000
, which amount was determined to be the fair market value of the accommodations based on a third-party expert opinion of value and which is consistent with the rental value under the Existing SW Lease. In addition, pursuant to the New SW Lease, the Company pays for all capital improvements to the villa and will reimburse Mr. Wynn for all amounts he previously paid the Company for capital improvements to the villa in 2012 and 2013. The rental value for the villa will be re-determined every two years during the term of the New SW Lease by the Audit Committee. Certain services for, and maintenance of, the villa are included in the rental.
On February 25, 2015, Mr. Wynn and Wynn Las Vegas, LLC entered into the First Amendment to 2013 Second Amended and Restated Agreement of Lease, which increased the annual rent to
$559,295
per year, effective as of March 1, 2015 through February 28, 2017.
Home Purchase
In May 2010, the Company entered into an employment agreement with Linda Chen, who is the Chief Operating Officer of Wynn Macau. The term of the employment agreement is through February 24, 2020. Under the terms of the employment agreement, the Company purchased a home in Macau for use by Ms. Chen and has made renovations to the home with total costs of
$9.4 million
through
December 31, 2014
. Upon the occurrence of certain events set forth below, Ms. Chen has the option to purchase the home at the then fair market value of the home (as determined by an independent appraiser) less a discount equal to
ten
percentage points multiplied by each anniversary of the term of the agreement that has occurred (the “Discount Percentage”). The option is exercisable for (a) no consideration at the end of the term, (b)
$1.00
in the event of termination of Ms. Chen’s employment without “cause” or termination of Ms. Chen’s employment for “good reason” following a “change of control” and (c) at a price based on the applicable Discount Percentage in the event Ms. Chen terminates the agreement due to material breach by the Company. Upon Ms. Chen’s termination for “cause,” Ms. Chen will be deemed to have elected to purchase the Macau home based on the applicable Discount Percentage unless the Company determines to not require Ms. Chen to purchase the home. If Ms. Chen’s employment terminates for any other reason before the expiration of the term (e.g., because of her death or disability or due to revocation of gaming license), the option will terminate.
Plane Option Agreement
On January 3, 2013, the Company and Mr. Wynn entered into an agreement pursuant to which Mr. Wynn agreed to terminate a previously granted option to purchase an approximately
two
acre tract of land located on the Wynn Las Vegas golf course and, in return, the Company granted Mr. Wynn the right to purchase any or all of the aircraft owned by the Company or its direct wholly owned subsidiaries. The aircraft purchase option is exercisable upon
30 days
written notice and at a price equal to the book value of such aircraft, and will terminate on the date of termination of the employment agreement between the Company and Mr. Wynn, which expires in October 2022.
The “Wynn” Surname Rights Agreement
On August 6, 2004, the Company entered into agreements with Mr. Wynn that confirm and clarify the Company’s rights to use the “Wynn” surname and Mr. Wynn’s persona in connection with its casino resorts. Under the parties’ Surname Rights Agreement, Mr. Wynn granted the Company an exclusive, fully paid-up, perpetual, worldwide license to use, and to own and register trademarks and service marks incorporating the “Wynn” surname for casino resorts and related businesses, together with the right to sublicense the name and marks to its affiliates. Under the parties’ Rights of Publicity License, Mr. Wynn granted the Company the exclusive, royalty-free, worldwide right to use his full name, persona and related rights of publicity for casino resorts and related businesses, together with the ability to sublicense the persona and publicity rights to its affiliates, until
October 24, 2017
.
Property charges and other consisted of the following (in thousands):
94
WYNN RESORTS, LIMITED AND SUBSIDIARIES
NOTES TO CONSOLIDATED FINANCIAL STATEMENTS (continued)
|
Years Ended December 31,
|
|||||||||||
|
2014
|
2013
|
2012
|
|||||||||
|
Net loss on assets abandoned/retired for remodel or sold
|
$
|
6,975
|
|
$
|
7,358
|
|
$
|
29,524
|
|
||
|
Donation to University of Macau Foundation
|
3,462
|
|
3,780
|
|
4,083
|
|
|||||
|
Loss on contract termination
|
—
|
|
6,000
|
|
315
|
|
|||||
|
Loss on show cancellation
|
—
|
|
—
|
|
6,056
|
|
|||||
|
$
|
10,437
|
|
$
|
17,138
|
|
$
|
39,978
|
|
|||
Property charges and other generally include costs related to the retirement of assets for remodels and asset abandonments. Property charges and other for the year ended
December 31, 2014
include costs associated with the renovation of approximately
27,000
square feet of casino space at Wynn Macau for new VIP gaming rooms, partially offset for gain on sale of an aircraft. These new VIP gaming rooms opened in February 2015.
Property charges and other for the year ended
December 31, 2013
include fees paid in connection with the termination of a contract, miscellaneous renovations and abandonments at our resorts and entertainment development costs.
Property charges and other for the year ended December 31, 2012 include the remodel of a Las Vegas restaurant, charges associated with the termination of a Las Vegas show that ended its run in November 2012, and miscellaneous renovations and abandonments at our resorts.
Common Stock
The Company is authorized to issue up to
400,000,000
shares of its common stock,
$0.01
par value per share (the “Common Stock”). As of
December 31, 2014
and 2013,
101,439,297
shares and
101,192,408
shares, respectively, of the Company’s Common Stock were outstanding. Except as otherwise provided by the Company’s articles of incorporation or Nevada law, each holder of the Common Stock is entitled to
one vote
for each share held of record on each matter submitted to a vote of stockholders. Holders of the Common Stock have no cumulative voting, conversion, redemption or preemptive rights or other rights to subscribe for additional shares. Subject to any preferences that may be granted to the holders of the Company’s preferred stock, each holder of Common Stock is entitled to receive ratably such dividends as may be declared by the Board of Directors out of funds legally available therefore, as well as any distributions to the stockholders and, in the event of liquidation, dissolution or winding up of the Company, is entitled to share ratably in all assets of the Company remaining after payment of liabilities.
The Board of Directors of Wynn Resorts has authorized an equity repurchase program of up to
$1.7 billion
. The repurchase program may include repurchases from time to time through open market purchases or negotiated transactions, depending upon market conditions. As of
December 31, 2014
, the Company had repurchased a cumulative total of
12,804,954
shares of the Company’s Common Stock for a net cost of
$1.1 billion
under the program. Under the repurchase program, there were
no
repurchases made during the years ended
December 31, 2014
, 2013 and 2012.
During 2014, 2013 and 2012, the Company repurchased a total of
9,578
shares,
114,355
shares and
7,640
shares, respectively, in satisfaction of tax withholding obligations on vested restricted stock.
In February 2014, May 2014 and August 2014, the Company paid a dividend of
$1.25
per common share as part of a cash dividend program. In November 2014, the Company paid a dividend of
$1.50
per common share as part of a cash dividend program and an additional cash dividend of
$1.00
per share.
Preferred Stock
The Company is authorized to issue up to
40,000,000
shares of undesignated preferred stock,
$0.01
par value per share (the “Preferred Stock”). As of
December 31, 2014
, the Company had
not
issued any Preferred Stock. The Board of Directors, without further action by the holders of Common Stock, may designate and issue shares of Preferred Stock in one or more series and may fix or alter the rights, preferences, privileges and restrictions, including the voting rights, redemption provisions (including sinking fund provisions), dividend rights, dividend rates, liquidation rates, liquidation preferences, conversion rights
95
WYNN RESORTS, LIMITED AND SUBSIDIARIES
NOTES TO CONSOLIDATED FINANCIAL STATEMENTS (continued)
and the description and number of shares constituting any wholly unissued series of Preferred Stock. The issuance of such shares of Preferred Stock could adversely affect the rights of the holders of Common Stock. The issuance of shares of Preferred Stock under certain circumstances could also have the effect of delaying or preventing a change of control of the Company or other corporate action.
Redemption of Securities
Wynn Resorts’ articles of incorporation provide that, to the extent a gaming authority makes a determination of unsuitability or to the extent the Board of Directors determines, in its sole discretion, that a person is likely to jeopardize the Company or any affiliates application for, receipt of, approval for, right to the use of, or entitlement to, any gaming license, Wynn Resorts may redeem shares of its capital stock that are owned or controlled by an unsuitable person or its affiliates. The redemption price will be the amount, if any, required by the gaming authority or, if the gaming authority does not determine the price, the sum deemed by the Board of Directors to be the fair value of the securities to be redeemed. If Wynn Resorts determines the redemption price, the redemption price will be capped at the closing price of the shares on the principal national securities exchange on which the shares are listed on the trading day before the redemption notice is given. If the shares are not listed on a national securities exchange, the redemption price will be capped at the closing sale price of the shares as quoted on The NASDAQ Global Select Market or if the closing price is not reported, the mean between the bid and ask prices, as quoted by any other generally recognized reporting system. Wynn Resorts’ right of redemption is not exclusive of any other rights that it may have or later acquire under any agreement, its bylaws or otherwise. The redemption price may be paid in cash, by promissory note, or both, as required, and pursuant to the terms established by, the applicable Gaming Authority and, if not, as the Board of Directors of Wynn Resorts elects.
Based on the Board of Directors’ finding of “unsuitability,” on February 18, 2012, Wynn Resorts redeemed and canceled Aruze’s
24,549,222
shares of Wynn Resorts’ common stock. For more information, refer to Note 17 “Commitments and Contingencies”.
In October 2009, Wynn Macau, Limited, an indirect wholly owned subsidiary of the Company and the developer, owner and operator of Wynn Macau, listed its ordinary shares of common stock on The Stock Exchange of Hong Kong Limited. Through an initial public offering, including the over allotment, Wynn Macau, Limited sold
1,437,500,000
shares,
27.7%
of this subsidiary’s common stock (the “Wynn Macau Limited IPO”). The shares of Wynn Macau, Limited were not and will not be registered under the Securities Act and may not be offered or sold in the United States absent a registration under the Securities Act, or an applicable exception from such registration requirements. Net income attributable to noncontrolling interest was
$231.1 million
,
$275.5 million
and
$226.7 million
for the years ended
December 31, 2014
, 2013 and 2012, respectively.
On September 23, 2014, Wynn Macau, Limited paid a dividend of HK
$0.70
per share for a total of
$469.2 million
. The Company’s share of this dividend was
$338.7 million
with a reduction of
$130.6 million
to noncontrolling interest in the accompanying Consolidated Balance Sheets.
On June 6, 2014, Wynn Macau, Limited paid a dividend of HK
$0.98
per share for a total of
$655.8 million
. The Company’s share of this dividend was
$474.0 million
with a reduction of
$181.8 million
to noncontrolling interest in the accompanying Consolidated Balance Sheets.
On September 23, 2013, Wynn Macau, Limited paid a dividend of HK
$0.50
per share for a total of
$334.5 million
. The Company’s share of this dividend was
$241.8 million
with a reduction of
$92.7 million
to noncontrolling interest in the accompanying Consolidated Balance Sheets.
On June 6, 2013, Wynn Macau, Limited paid a dividend of HK
$1.24
per share for a total of
$828.6 million
. The Company's share of this dividend was
$599.1 million
with a reduction of
$229.6 million
to noncontrolling interest in the accompanying Consolidated Balance Sheets.
96
WYNN RESORTS, LIMITED AND SUBSIDIARIES
NOTES TO CONSOLIDATED FINANCIAL STATEMENTS (continued)
Defined contribution plans
The Company established a retirement savings plan under Section 401(k) of the Internal Revenue Code covering its U.S. non-union employees in July 2000. The plan allows employees to defer, within prescribed limits, a percentage of their income on a pre-tax basis through contributions to this plan. For the 2014 plan year, the Company matched
50%
of employee contributions, up to
6%
of employees’ eligible compensation, with a one-time annual matching cap of
$750
per employee. The company expensed
$2.0 million
related to this match for the year ended
December 31, 2014
. For the 2013 plan year, the Company matched
50%
of employee contributions, up to
6%
of employees’ eligible compensation, with a one-time annual matching cap of
$500
per employee. The company expensed
$1.2 million
related to this match for the year ended
December 31, 2013
. The Company suspended matching contributions to this plan effective March 2009 and did
not
record any expense for matching contributions for the year ended December 31, 2012.
Wynn Macau also operates a defined contribution retirement benefits plan (the “Wynn Macau Plan”). Eligible employees are allowed to contribute
5%
of their salary to the Wynn Macau Plan and the Company matches any contributions. The assets of the Wynn Macau Plan are held separately from those of the Company in an independently administered fund. The Company’s matching contributions vest to the employee at
10%
per year with full vesting in
ten years
. Forfeitures of unvested contributions are used to reduce the Company’s liability for its contributions payable. During the years ended December 31, 2014, 2013 and 2012, the Company recorded an expense for matching contributions of
$8.7 million
,
$7.5 million
and
$7.1 million
, respectively.
Multi-employer pension plan
Wynn Las Vegas contributes to a multi-employer defined benefit pension plan for certain of its union employees under the terms of the Southern Nevada Culinary and Bartenders Union collective-bargaining agreement. The collective-bargaining agreement that covers these union-represented employees expires in 2016. The legal name of the multi-employer pension plan is the Southern Nevada Culinary and Bartenders Pension Plan (the “Plan”) (EIN: 88-6016617 Plan Number: 1). The Company recorded an expense of
$9.2 million
,
$9.0 million
and
$8.6 million
for contributions to the Plan for the years ended
December 31, 2014
, 2013 and 2012, respectively. For the 2013 plan year, the most recent for which plan data is available, the Company’s contributions were identified by the Plan to exceed
5%
of total contributions for that year. Based on information the Company received from the Plan, it was certified to be in neither endangered nor critical status for the 2013 plan year. Risks of participating in a multi-employer plan differs from single-employer plans for the following reasons: (1) assets contributed to a multi-employer plan by one employer may be used to provide benefits to employees of other participating employers; (2) if a participating employer stops contributing to the plan, the unfunded obligations of the plan may be borne by the remaining participating employers; and (3) if a participating employer stops participating, it may be required to pay those plans an amount based on the underfunded status of the plan, referred to as a withdrawal liability.
Wynn Resorts, Limited
The Company's 2002 Stock Incentive Plan, as amended and restated (the "WRL 2002 Plan"), allowed it to grant stock options and nonvested shares of Wynn Resorts, Limited's common stock to eligible directors, officers, employees, and consultants of the Company. Under the WRL 2002 Plan, a maximum of
12,750,000
shares of the Company's common stock was reserved for issuance.
On May 16, 2014, the Company adopted the Wynn Resorts, Limited 2014 Omnibus Incentive Plan (the "Omnibus Plan") after approval from its stockholders. The Omnibus Plan allows for the grant of stock options, restricted stock, restricted stock units, stock appreciation rights, performance awards and other share-based awards to the same eligible participants as the WRL 2002 Plan. Under the approval of the Omnibus Plan, no new awards may be made under the WRL 2002 Plan. The outstanding awards under the WRL 2002 Plan were transferred to the Omnibus Plan and will remain pursuant to their existing terms and related award agreements. The Company reserved
4,409,390
shares of its common stock for issuance under the Omnibus Plan. These shares were transferred from the remaining available amount under the WRL 2002 Plan.
The Omnibus Plan is administered by the Compensation Committee (the "Committee") of the Wynn Resorts, Limited Board of Directors. The Committee has discretion under the Omnibus Plan regarding which type of awards to grant, the vesting and service requirements, exercise price and other conditions, in all cases subject to certain limits. For stock options,
97
WYNN RESORTS, LIMITED AND SUBSIDIARIES
NOTES TO CONSOLIDATED FINANCIAL STATEMENTS (continued)
the exercise price of stock options must be at least equal to the fair market value of the stock on the date of grant and the maximum term of such an award is
10 years
.
As of December 31, 2014, the Company had an aggregate of
4,407,390
shares of its common stock available for grant as share-based awards under the Omnibus Plan.
Stock Options
The summary of stock option activity under the plans for the year ended December 31, 2014 is presented below:
|
Options
|
Weighted
Average
Exercise
Price
|
Weighted
Average
Remaining
Contractual
Term
|
Aggregate
Intrinsic
Value
|
|||||||||
|
Outstanding at January 1, 2014
|
1,606,309
|
|
$
|
75.89
|
|
|||||||
|
Granted
|
25,800
|
|
$
|
201.22
|
|
|||||||
|
Exercised
|
(211,133
|
)
|
$
|
52.51
|
|
|||||||
|
Forfeited or expired
|
(40,000
|
)
|
$
|
140.36
|
|
|||||||
|
Outstanding at December 31, 2014
|
1,380,976
|
|
$
|
79.93
|
|
4.34
|
$
|
96,400,313
|
|
|||
|
Fully vested and expected to vest at December 31, 2014
|
1,260,693
|
|
$
|
78.98
|
|
4.39
|
$
|
89,241,158
|
|
|||
|
Exercisable at December 31, 2014
|
355,610
|
|
$
|
65.10
|
|
4.78
|
$
|
29,751,409
|
|
|||
The following is provided for stock option exercises from the plans (in thousands, except weighted average grant date fair value):
|
Years Ended December 31,
|
|||||||||||
|
2014
|
2013
|
2012
|
|||||||||
|
Weighted average grant date fair value
|
$
|
29.29
|
|
$
|
39.93
|
|
$
|
33.03
|
|
||
|
Intrinsic value
|
$
|
30,485
|
|
$
|
33,830
|
|
$
|
22,416
|
|
||
|
Cash received
|
$
|
11,086
|
|
$
|
20,436
|
|
$
|
15,583
|
|
||
|
Tax benefits realized
|
$
|
8,506
|
|
$
|
6,362
|
|
$
|
4,903
|
|
||
As of December 31, 2014, there was a total of
$24.4 million
of unamortized compensation related to stock options, which is expected to be recognized over a weighted-average period of
3.1
years.
Nonvested shares
The summary of nonvested share activity under the plans for the year ended December 31, 2014 is presented below:
|
Shares
|
Weighted
Average
Grant Date
Fair Value
|
|||||
|
Nonvested at January 1, 2014
|
397,500
|
|
$
|
113.13
|
|
|
|
Granted
|
54,500
|
|
209.92
|
|
||
|
Vested
|
(52,834
|
)
|
178.48
|
|
||
|
Forfeited
|
(9,166
|
)
|
104.79
|
|
||
|
Nonvested at December 31, 2014
|
390,000
|
|
$
|
118.00
|
|
|
98
WYNN RESORTS, LIMITED AND SUBSIDIARIES
NOTES TO CONSOLIDATED FINANCIAL STATEMENTS (continued)
The following is provided for the share award vesting from the plans (in thousands, except weighted average grant date fair value):
|
Years Ended December 31,
|
|||||||||||
|
2014
|
2013
|
2012
|
|||||||||
|
Weighted average grant date fair value
|
$
|
178.48
|
|
$
|
125.56
|
|
$
|
110.04
|
|
||
|
Fair value of shares vested
|
$
|
9,430
|
|
$
|
36,328
|
|
$
|
15,653
|
|
||
|
Tax benefits realized
|
$
|
870
|
|
$
|
4,112
|
|
$
|
634
|
|
||
As of December 31, 2014, there was a total of
$22.7 million
of unamortized compensation related to nonvested shares, which is expected to be recognized over a weighted-average period of
3.0
years.
Wynn Macau, Limited
The Company’s majority owned subsidiary Wynn Macau, Limited has two stock-based compensation plans which provide awards based on shares of Wynn Macau, Limited's common stock. The shares available for issuance under these plans are separate and distinct from the common stock of Wynn Resorts, Limited's share plan and are not available for issuance for any awards under the Wynn Resorts, Limited share plan.
Share Option Plan
Wynn Macau, Limited adopted a stock incentive plan effective September 16, 2009 for the grant of stock options to purchase shares of Wynn Macau, Limited to eligible directors and employees of its subsidiaries (the "Share Option Plan"). The Share Option Plan is administered by Wynn Macau, Limited's Board of Directors, which have the discretion on the vesting and service requirements, exercise price, performance targets to exercise if applicable and other conditions, subject to certain limits. A maximum of
518,750,000
shares have been reserved for issuance under the Share Option Plan.
The summary of stock option activity under the plan for the year ended December 31, 2014 is presented below:
|
Options
|
Weighted
Average
Exercise
Price
|
Weighted
Average
Remaining
Contractual
Term
|
Aggregate
Intrinsic
Value
|
|||||||||
|
Outstanding at January 1, 2014
|
2,910,000
|
|
$
|
2.44
|
|
|||||||
|
Granted
|
644,000
|
|
$
|
4.00
|
|
|||||||
|
Exercised
|
(464,000
|
)
|
$
|
1.66
|
|
|||||||
|
Outstanding at December 31, 2014
|
3,090,000
|
|
$
|
2.88
|
|
7.5
|
$
|
—
|
|
|||
|
Fully vested and expected to vest at December 31, 2014
|
3,090,000
|
|
$
|
2.88
|
|
7.5
|
$
|
—
|
|
|||
|
Exercisable at December 31, 2014
|
990,000
|
|
$
|
2.37
|
|
6.5
|
$
|
505,273
|
|
|||
The following is provided for stock option exercises from the Share Option Plan (in thousands, except weighted average grant date fair value):
|
Years Ended December 31,
|
|||||||||||
|
2014
|
2013
|
2012
|
|||||||||
|
Weighted average grant date fair value
|
$
|
1.66
|
|
$
|
0.78
|
|
$
|
0.78
|
|
||
|
Intrinsic value
|
$
|
1,134
|
|
$
|
—
|
|
$
|
—
|
|
||
|
Cash received
|
$
|
773
|
|
$
|
—
|
|
$
|
—
|
|
||
As of December 31, 2014, there was a total of
$1.3 million
of unamortized compensation related to stock options, which is expected to be recognized over a weighted-average period of
3.4
years.
99
WYNN RESORTS, LIMITED AND SUBSIDIARIES
NOTES TO CONSOLIDATED FINANCIAL STATEMENTS (continued)
Share Award Plan
On June 30, 2014, the Company's majority-owned subsidiary Wynn Macau, Limited approved and adopted the Wynn Macau, Limited Employee Ownership Scheme (the "Share Award Plan"). The Share Award Plan allows for the grant of nonvested shares of Wynn Macau, Limited's common stock to eligible employees. The Share Award Plan is administered by Wynn Macau, Limited's Board of Directors and has been mandated under the plan to allot, issue and procedure the transfer of a maximum of
50,000,000
shares. The Board of Directors have discretion on the vesting and service requirements, exercise price and other conditions, subject to certain limits.
The summary of nonvested share activity under the Share Award Plan for the year ended December 31, 2014 is presented below:
|
Shares
|
Weighted
Average
Grant Date
Fair Value
|
|||||
|
Nonvested at January 1, 2014
|
—
|
|
—
|
|
||
|
Granted
|
8,019,000
|
|
$
|
3.81
|
|
|
|
Vested
|
—
|
|
—
|
|
||
|
Forfeited
|
(276,000
|
)
|
$
|
3.81
|
|
|
|
Nonvested at December 31, 2014
|
7,743,000
|
|
$
|
3.81
|
|
|
As of December 31, 2014,
no
shares have vested under the Share Award Plan.
Compensation Cost
The total compensation cost for stock-based compensation plans are allocated as follows (in thousands):
|
Years Ended December 31,
|
|||||||||||
|
2014
|
2013
|
2012
|
|||||||||
|
Casino
|
$
|
8,360
|
|
$
|
4,791
|
|
$
|
4,794
|
|
||
|
Rooms
|
216
|
|
853
|
|
313
|
|
|||||
|
Food and beverage
|
753
|
|
1,202
|
|
178
|
|
|||||
|
Entertainment, retail and other
|
55
|
|
477
|
|
43
|
|
|||||
|
General and administrative
|
29,770
|
|
32,214
|
|
14,320
|
|
|||||
|
Pre-opening costs
|
42
|
|
—
|
|
—
|
|
|||||
|
Total stock-based compensation expense
|
39,196
|
|
39,537
|
|
19,648
|
|
|||||
|
Total stock-based compensation capitalized
|
5,710
|
|
195
|
|
195
|
|
|||||
|
Total stock-based compensation costs
|
$
|
44,906
|
|
$
|
39,732
|
|
$
|
19,843
|
|
||
During 2014, the Company recognized an incremental
$17.9 million
of stock-based compensation expense associated with the equity portion of 2014 annual performance awards for our executive management. These equity awards consist of immediately vested restricted stock granted in January 2015.
During the first quarter of 2014, the Company capitalized
$5.5 million
of stock-based compensation into construction for a restricted stock award granted which immediately vested. The restricted stock award was granted to an employee of the Company's design, development and construction subsidiary and will be amortized over the useful life of the related asset.
During the second quarter of 2013, the Company recognized
$23.0 million
of stock-based compensation expense due to the retirement of the Company's former chief operating officer and the related accelerated vesting of shares previously granted to him.
The Company uses the Black-Scholes valuation model to determine the estimated fair value for stock options with highly subjective assumptions, changes in which could materially affect the estimated fair value. Dividend yield is based on the estimate of annual dividends expected to be paid at the time of the grant. Expected volatility is based on implied and historical
100
WYNN RESORTS, LIMITED AND SUBSIDIARIES
NOTES TO CONSOLIDATED FINANCIAL STATEMENTS (continued)
factors related to the Company’s common stock. The risk-free interest rate used for each period presented is based on the U.S. Treasury yield curve for stock options issued under the Wynn Resorts, Limited's plans and the Hong Kong Exchange Fund rates for stock options issued under the Share Option Plan, both at the time of grant for the period equal to the expected term. Expected term represents the weighted average time between the option’s grant date and its exercise date. The Company used historical award exercise activity and termination activity in estimating the expected term for the Wynn Resorts, Limited plans. The Company uses the simplified method for estimating the expected term for Wynn Macau, Limited's Share Option Plan.
The fair value of stock options granted under Wynn Resorts, Limited's stock-based compensation plans were estimated on the date of grant using the following weighted-average assumptions:
|
Years Ended December 31,
|
||||||||
|
2014
|
2013
|
2012
|
||||||
|
Expected dividend yield
|
4.0
|
%
|
3.0
|
%
|
4.0
|
%
|
||
|
Expected volatility
|
43.3
|
%
|
39.4
|
%
|
48.8
|
%
|
||
|
Risk-free interest rate
|
1.6
|
%
|
1.1
|
%
|
1.2
|
%
|
||
|
Expected term (years)
|
6.5
|
|
6.7
|
|
7.0
|
|
||
The fair value of stock options granted under Wynn Macau, Limited's Share Option Plan was estimated on the date of grant using the following weighted-average assumptions:
|
Years Ended December 31,
|
||||||||
|
2014
|
2013
|
2012
|
||||||
|
Expected dividend yield
|
5.0
|
%
|
5.0
|
%
|
4.0
|
%
|
||
|
Expected stock price volatility
|
40.9
|
%
|
43.3
|
%
|
49.0
|
%
|
||
|
Risk-free interest rate
|
1.1
|
%
|
0.6
|
%
|
0.7
|
%
|
||
|
Expected term (years)
|
6.5
|
|
6.5
|
|
6.5
|
|
||
Consolidated income (loss) before taxes for domestic and foreign operations consisted of the following (in thousands):
|
Years Ended December 31,
|
|||||||||||
|
2014
|
2013
|
2012
|
|||||||||
|
Domestic
|
$
|
122,974
|
|
$
|
(9,935
|
)
|
$
|
(87,122
|
)
|
||
|
Foreign
|
835,888
|
|
996,458
|
|
820,120
|
|
|||||
|
Total
|
$
|
958,862
|
|
$
|
986,523
|
|
$
|
732,998
|
|
||
The income tax (benefit) provision attributable to income before income taxes is as follows (in thousands):
|
Years Ended December 31,
|
|||||||||||
|
2014
|
2013
|
2012
|
|||||||||
|
Current
|
|||||||||||
|
Federal
|
$
|
2,260
|
|
$
|
135
|
|
$
|
5,912
|
|
||
|
Foreign
|
2,043
|
|
2,057
|
|
2,042
|
|
|||||
|
$
|
4,303
|
|
$
|
2,192
|
|
$
|
7,954
|
|
|||
|
Deferred
|
|||||||||||
|
Federal
|
$
|
(13,286
|
)
|
$
|
(19,826
|
)
|
$
|
(3,655
|
)
|
||
|
State
|
4,094
|
|
—
|
|
—
|
|
|||||
|
Foreign
|
1,107
|
|
—
|
|
—
|
|
|||||
|
(8,085
|
)
|
(19,826
|
)
|
(3,655
|
)
|
||||||
|
Total
|
$
|
(3,782
|
)
|
$
|
(17,634
|
)
|
$
|
4,299
|
|
||
101
WYNN RESORTS, LIMITED AND SUBSIDIARIES
NOTES TO CONSOLIDATED FINANCIAL STATEMENTS (continued)
The income tax (benefit) provision differs from that computed at the federal statutory corporate tax rate as follows:
|
Years Ended December 31,
|
||||||||
|
2014
|
2013
|
2012
|
||||||
|
Federal statutory rate
|
35.0
|
%
|
35.0
|
%
|
35.0
|
%
|
||
|
Foreign tax rate differential
|
(19.1
|
)%
|
(23.1
|
)%
|
(25.6
|
)%
|
||
|
Non-taxable foreign income
|
(13.1
|
)%
|
(13.4
|
)%
|
(15.4
|
)%
|
||
|
Foreign tax credits, net of valuation allowance
|
(95.2
|
)%
|
(89.3
|
)%
|
1.7
|
%
|
||
|
Repatriation of foreign earnings
|
88.0
|
%
|
87.2
|
%
|
0.0
|
%
|
||
|
Other, net
|
2.9
|
%
|
1.9
|
%
|
3.6
|
%
|
||
|
Valuation allowance, other
|
1.1
|
%
|
(0.1
|
)%
|
1.3
|
%
|
||
|
Effective tax rate
|
(0.4
|
)%
|
(1.8
|
)%
|
0.6
|
%
|
||
On November 30, 2010, Wynn Macau SA received an exemption from Macau’s
12%
Complementary Tax on casino gaming profits, thereby exempting the casino gaming profits of Wynn Macau SA through December 31, 2015. Accordingly for the years ended December 31, 2014, 2013, and 2012, the Company was exempted from the payment of
$99.4 million
,
$107.3 million
and
$87.1 million
in such taxes or
$0.98
,
$1.06
and
$0.84
per share, respectively. The Company’s non-gaming profits remain subject to the Macau Complementary Tax and its casino winnings remain subject to the Macau Special Gaming tax and other levies in accordance with its concession agreement.
In July of 2011, Wynn Macau SA received an extension of its agreement with the Macau Special Administrative Region that provides for an annual payment of MOP
$15.5 million
(approximately
$1.9 million
U.S. dollars) as complementary tax otherwise due by shareholders of Wynn Macau SA on dividend distributions through 2015. As a result of the shareholder dividend tax agreements, income tax expense includes
$1.9 million
for each of the years ended December 31, 2014, 2013 and 2012, respectively.
The Macau special gaming tax is
35%
of gross gaming revenue. U.S. tax laws only allow a foreign tax credit up to
35%
of “net” foreign source income. In February 2010, the Company and the IRS entered into a Pre-Filing Agreement (“PFA”) providing that the Macau Special Gaming Tax qualifies as a tax paid in lieu of an income tax and could be claimed as a U.S. foreign tax credit.
During 2014 and 2013, the Company recognized tax benefits of
$895.0 million
and
$879.7 million
, respectively (net of valuation allowance and uncertain tax positions), for foreign tax credits generated applicable to the earnings of Wynn Macau SA. During 2012, the Company did
not
repatriate any earnings of Wynn Macau SA and consequently did not generate foreign tax credits in that year.
Accounting standards require recognition of a future tax benefit to the extent that realization of such benefit is more likely than not. Otherwise, a valuation allowance is applied. During 2014 and 2013, the aggregate valuation allowance for deferred tax assets increased by
$709.8 million
and
$755.5 million
, respectively. The 2014 and 2013 increases are primarily related to foreign tax credit carryforwards and other foreign deferred tax assets that are not considered more likely than not realizable.
The Company recorded tax benefits resulting from the exercise of nonqualified stock options and the value of vested restricted stock and accrued dividends of
$9.4 million
,
$10.5 million
and
$5.5 million
as of December 31, 2014, 2013 and 2012, respectively, in excess of the amounts reported for such items as compensation costs under accounting standards related to stock-based compensation. The Company uses a with-and-without approach to determine if the excess tax deductions associated with compensation costs have reduced income taxes payable.
102
WYNN RESORTS, LIMITED AND SUBSIDIARIES
NOTES TO CONSOLIDATED FINANCIAL STATEMENTS (continued)
The tax effects of significant temporary differences representing net deferred tax assets and liabilities consisted of the following (in thousands):
|
As of December 31,
|
|||||||
|
2014
|
2013
|
||||||
|
Deferred tax assets—U.S.:
|
|||||||
|
Current:
|
|||||||
|
Receivables, inventories, accrued liabilities and other
|
$
|
48,093
|
|
$
|
36,556
|
|
|
|
Less: valuation allowance
|
(45,992
|
)
|
(34,347
|
)
|
|||
|
2,101
|
|
2,209
|
|
||||
|
Long-term:
|
|||||||
|
Foreign tax credit carryforwards
|
3,283,669
|
|
2,614,665
|
|
|||
|
Intangibles and related other
|
27,201
|
|
26,324
|
|
|||
|
Stock based compensation
|
16,972
|
|
10,736
|
|
|||
|
Pre-opening costs
|
10,876
|
|
12,884
|
|
|||
|
Other
|
10,540
|
|
11,341
|
|
|||
|
3,349,258
|
|
2,675,950
|
|
||||
|
Less: valuation allowance
|
(3,202,971
|
)
|
(2,514,258
|
)
|
|||
|
146,287
|
|
161,692
|
|
||||
|
Deferred tax liabilities—U.S.:
|
|||||||
|
Current:
|
|||||||
|
Prepaid insurance, maintenance and taxes
|
(6,948
|
)
|
(6,243
|
)
|
|||
|
Long-term:
|
|||||||
|
Property and equipment
|
(170,405
|
)
|
(176,036
|
)
|
|||
|
Deferred tax assets—Foreign:
|
|||||||
|
Current:
|
|||||||
|
Accrued liabilities
|
173
|
|
164
|
|
|||
|
Less: valuation allowance
|
(173
|
)
|
(164
|
)
|
|||
|
—
|
|
—
|
|
||||
|
Long-term:
|
|||||||
|
Net operating loss carryforwards
|
16,797
|
|
13,701
|
|
|||
|
Property and equipment
|
22,740
|
|
17,441
|
|
|||
|
Pre-opening costs
|
7,396
|
|
3,040
|
|
|||
|
Other
|
1,930
|
|
4,074
|
|
|||
|
Less: valuation allowance
|
(47,653
|
)
|
(38,256
|
)
|
|||
|
1,210
|
|
—
|
|
||||
|
Deferred tax liabilities—Foreign:
|
|||||||
|
Long-term:
|
|||||||
|
Property and equipment
|
(2,317
|
)
|
—
|
|
|||
|
Net deferred tax liability
|
$
|
(30,072
|
)
|
$
|
(18,378
|
)
|
|
As of
December 31, 2014
, the Company had foreign tax credit carryforwards (net of uncertain tax positions) of
$3,283.7 million
. Of this amount,
$619.6 million
will expire in 2018,
$110.9 million
will expire in 2019,
$530.4 million
in 2020,
$540.3 million
in 2021,
$757.0 million
in 2023 and
$725.5 million
in 2024. The Company has
no
U.S. tax loss carryforwards. The Company incurred foreign tax losses of
$59.6 million
,
$75.0 million
and
$79.1 million
during the tax years ended December 31, 2014, 2013 and 2012, respectively. These foreign tax loss carryforwards expire in 2017,
2016
and
2015
, respectively. The Company incurred a U.S. capital loss of
$3.6 million
during the year ended December 31, 2011. The U.S. capital loss carryforward will expire in 2016.
In assessing the need for a valuation allowance, the Company does not currently consider forecasted future operating results when scheduling the realization of deferred tax assets and the required valuation allowance but instead relies on the
103
WYNN RESORTS, LIMITED AND SUBSIDIARIES
NOTES TO CONSOLIDATED FINANCIAL STATEMENTS (continued)
reversal of net taxable temporary differences. The valuation allowance for foreign tax credits was determined by scheduling the existing U.S. taxable temporary differences that are expected to reverse and result in “net” foreign source income during the
10
-year foreign tax credit carryover period.
As of December 31, 2014 and 2013, the Company had valuation allowances of
$3,242.1 million
and
$2,542.8 million
, respectively, provided on foreign tax credits expected to expire unutilized and valuation allowances of
$6.9 million
and
$5.8 million
provided on other U.S. deferred tax assets. As of December 31, 2014 and 2013, the Company had a valuation allowance of
$47.8 million
and
$38.4 million
, respectively, provided on its foreign deferred tax assets.
Except for
$198.6 million
of accumulated earnings which the Company plans on repatriating, the Company has not provided deferred U.S. income taxes or foreign withholding taxes on temporary differences of
$412.1 million
and
$388.1 million
as of December 31, 2014 and 2013, respectively, which are indefinitely reinvested and will be used to fund future operations or expansion. The amount of the unrecognized deferred tax liability associated with these temporary differences is approximately
$144.2 million
and
$135.8 million
for the years ended December 31, 2014 and 2013. Deferred income taxes, net of foreign tax credits, are provided for foreign earnings planned for repatriation. For the years ended December 31, 2014 and 2013, the Company repatriated
$1,125.3 million
and
$840.9 million
from Wynn Macau, Limited. The amounts repatriated were used to fund domestic operations, to provide additional U.S. liquidity, and to fund dividends to the Company’s shareholders.
A reconciliation of the beginning and ending amount of unrecognized tax benefits is as follows (in thousands):
|
As of December 31,
|
|||||||||||
|
2014
|
2013
|
2012
|
|||||||||
|
Balance—beginning of year
|
$
|
89,544
|
|
$
|
84,289
|
|
$
|
85,498
|
|
||
|
Increases based on tax positions of the current year
|
3,297
|
|
8,360
|
|
8,140
|
|
|||||
|
Increases based on tax positions of prior years
|
322
|
|
—
|
|
—
|
|
|||||
|
Decreases for tax positions of prior years
|
(867
|
)
|
—
|
|
—
|
|
|||||
|
Settlements with taxing authorities
|
(997
|
)
|
—
|
|
—
|
|
|||||
|
Lapses in statutes of limitations
|
(2,415
|
)
|
(3,105
|
)
|
(9,349
|
)
|
|||||
|
Balance—end of year
|
$
|
88,884
|
|
$
|
89,544
|
|
$
|
84,289
|
|
||
As of
December 31, 2014
, 2013, and 2012, unrecognized tax benefits of
$88.9 million
,
$60.3 million
and
$55.2 million
, respectively, were recorded as reductions in deferred income taxes, net. As of December 31, 2013 and 2012, unrecognized tax benefits of
$29.2 million
and
$29.1 million
, respectively, were recorded in other long-term liabilities. The Company had
no
unrecognized tax benefits recorded in other long-term liabilities as of December 31, 2014. As a result of the adoption of accounting guidance in 2014, the Company reclassified unrecognized tax benefits in other long-term liabilities to deferred income taxes, net. See Note 2 "Summary of Significant Accounting Policies" for further discussion on adoption of accounting guidance.
As of
December 31, 2014
, 2013 and 2012,
$20.7 million
,
$20.7 million
and
$18.8 million
, respectively, of unrecognized tax benefits would, if recognized, impact the effective tax rate.
The Company recognizes penalties and interest related to unrecognized tax benefits in the provision for income taxes. During the years ended December 31, 2014, 2013 and 2012, the Company recognized interest and penalties of
$0.0 million
,
$0.0 million
and
$0.3 million
, respectively.
The Company anticipates that the 2010 statute of limitations will expire in the next 12 months for certain foreign tax jurisdictions. Also, the Company’s unrecognized tax benefits include certain income tax accounting methods. These accounting methods govern the timing and deductibility of income tax deductions. As a result, the Company’s unrecognized tax benefits could decrease by a range of
$0.0 million
to
$0.6 million
over the next 12 months.
The Company files income tax returns in the U.S. federal jurisdiction, various states and foreign jurisdictions. The Company’s income tax returns are subject to examination by the IRS and other tax authorities in the locations where it operates. The Company’s 2002 to 2010 domestic income tax returns remain subject to examination by the IRS to the extent of tax attributes carryforwards to future years. The Company’s 2011 to 2013 domestic income tax returns also remain subject to examination by the IRS. The Company’s 2010 to 2013 Macau income tax returns remain subject to examination by the Macau Financial Services Bureau.
104
WYNN RESORTS, LIMITED AND SUBSIDIARIES
NOTES TO CONSOLIDATED FINANCIAL STATEMENTS (continued)
In April 2012, the Company reached an agreement with the Appellate division of the IRS regarding issues raised during the examination of the 2006 through 2009 U.S. income tax returns. The settlement with the Appellate division did not impact the Company’s unrecognized tax benefits. The settlement of the 2006 through 2009 examination issues resulted in a cash tax payment of
$1.3 million
and the utilization of
$3.1 million
and
$0.9 million
in foreign tax credit and general business credit carryforwards, respectively.
During December 2012, the IRS completed an examination of the Company’s 2010 U.S. income tax return and had no changes. In May 2013, the Company received notification that the IRS completed its examination of the Company’s 2011 U.S. income tax return and had no changes.
For tax year 2012, the Company participated in the IRS Compliance Assurance Program (“CAP”) which accelerates IRS examination of key transactions with the goal of resolving any issues before the taxpayer files its return. In February 2014, the Company received notification that the IRS completed its examination of the Company's 2012 U.S. income tax return and had no changes.
In March 2013 and in December 2013, the Company received notification that it had been selected for the Compliance Maintenance phase of CAP for the 2013 and 2014 tax years, respectively. In the Compliance Maintenance phase, the IRS, at its discretion, may reduce the level of review of the taxpayer’s tax positions based on the complexity and number of issues, and the taxpayer’s history of compliance, cooperation and transparency in the CAP. The Company does not expect a change in its unrecognized tax benefits as a result of the completion of these examinations.
In December 2014, the Company received notification that it was accepted into the Compliance Maintenance phase of CAP for the 2015 tax year.
In July 2012, the Macau Financial Services Bureau commenced an examination of the 2008 Macau income tax return of Wynn Macau SA. In November 2012, the Company received the results of the examination. While no additional tax was due, adjustments were made to the Company’s foreign net operating loss carryforwards.
In January 2013, the Macau Financial Services Bureau examined the 2009 and 2010 Macau income tax returns of Palo, which is a co-holder of the land concession for Wynn Palace. The exam resulted in no change to the tax returns.
In March 2013, the Macau Financial Services Bureau commenced an examination of the 2009, 2010, and 2011 Macau income tax returns of Wynn Macau SA. In December 2014, Wynn Macau SA reached an agreement with the Macau Financial Services Bureau regarding issues raised during its examination. While no additional tax was due as a result of the examination, adjustments were made to the Company's foreign net operating loss carryforwards.
On December 31, 2014, the statute of limitations for the 2009 Macau Complementary tax return expired. As a result of the exam settlement and the expiration of the statute of limitations for the Macau Complementary Tax return, the total amount of unrecognized tax benefits decreased by
$3.4 million
.
Cotai Development and Land Concession Contract
The Company is currently constructing Wynn Palace, an integrated resort containing a
1,700
-room hotel, performance lake, meeting space, casino, spa, retail offerings, and food and beverage outlets in the Cotai area of Macau.
In September 2011, Wynn Macau SA and Palo, formally accepted the terms and conditions of a land concession contract from the Macau government for approximately
51
acres of land in the Cotai area of Macau. On May 2, 2012, the land concession contract was gazetted by the government of Macau evidencing the final step in the granting of the land concession. The initial term of the land concession contract is
25
years from May 2, 2012, and it may be renewed with government approval for successive periods. The total land premium payable, including interest as required by the land concession contract, is
$193.4 million
. An initial payment of
$62.5 million
was paid in December 2011, with
eight
additional semi-annual payments of approximately
$16.4 million
each (which includes interest at
5%
) due beginning November 2012. As of December 31, 2014 and 2013, the Company has recorded this obligation with
$30.8 million
and
$29.3 million
included as a current liability, respectively, and
$16.0 million
and
$46.8 million
, respectively, included as a long-term liability. The Company is also required
105
WYNN RESORTS, LIMITED AND SUBSIDIARIES
NOTES TO CONSOLIDATED FINANCIAL STATEMENTS (continued)
to make annual lease payments of
$0.8 million
during the resort construction period and annual payments of approximately
$1.1 million
once the development is completed.
On July 29, 2013, Wynn Macau SA and Palo finalized and executed a guaranteed maximum price construction (“GMP”) contract with Leighton Contractors (Asia) Limited, acting as the general contractor. Under the GMP contract, the general contractor is responsible for both the construction and design of the Wynn Palace project. The general contractor is obligated to substantially complete the project in the first half of 2016 for a guaranteed maximum price of HK
$20.0 billion
(approximately
$2.6 billion
). An early completion bonus for achievement of substantial completion on or before January 25, 2016 will be paid to the general contractor if certain conditions are satisfied under the GMP contract. While the Company's general contractor has notified it that certain conditions will not be satisfied under the GMP contract by the early completion target, the contractor stated it was still on target to complete the project on time and the Company continues to expect to open the property in the first half of 2016. Both the contract time and guaranteed maximum price are subject to further adjustment under certain specified conditions. The performance of the general contractor is backed by a full completion guarantee given by Leighton Holdings Limited, the parent company of the general contractor, as well as a performance bond for
5%
of the guaranteed maximum price.
As of
December 31, 2014
, the Company incurred approximately $
1.8 billion
of the approximately
$4.1 billion
in total project budget costs. The total project budget includes all construction costs, capitalized interest, pre-opening expenses, land costs and financing fees. The Company expects to open Wynn Palace in the first half of 2016.
Leases and other arrangements
The Company is the lessor under several retail leases and has entered into license and distribution agreements for several additional retail outlets. The Company also is a party to joint venture agreements for the operation of one retail outlet and the Ferrari and Maserati automobile dealership at Wynn Las Vegas. The lease agreements include minimum base rents with contingent rental clauses.
The following table presents the future minimum rentals to be received under the operating leases (in thousands):
|
Years Ending December 31,
|
|||
|
2015
|
$
|
46,837
|
|
|
2016
|
63,065
|
|
|
|
2017
|
55,603
|
|
|
|
2018
|
34,546
|
|
|
|
2019
|
30,122
|
|
|
|
Thereafter
|
44,542
|
|
|
|
$
|
274,715
|
|
|
The total future minimum rentals do not include contingent rental. Contingent rentals were
$87.8 million
,
$101.0 million
and
$94.0 million
for the years ended
December 31, 2014
, 2013, and 2012, respectively.
In addition, the Company is the lessee under leases for office space in Las Vegas, Macau and certain other locations, warehouse facilities, the land underlying the Company’s aircraft hangar and certain office equipment.
At
December 31, 2014
, the Company was obligated under non-cancelable operating leases to make future minimum lease payments as follows (in thousands):
|
Years Ending December 31,
|
|||
|
2015
|
$
|
12,618
|
|
|
2016
|
12,684
|
|
|
|
2017
|
8,482
|
|
|
|
2018
|
8,359
|
|
|
|
2019
|
8,436
|
|
|
|
Thereafter
|
31,088
|
|
|
|
$
|
81,667
|
|
|
106
WYNN RESORTS, LIMITED AND SUBSIDIARIES
NOTES TO CONSOLIDATED FINANCIAL STATEMENTS (continued)
Rent expense for the years ended
December 31, 2014
, 2013 and 2012, was
$26.1 million
,
$21.9 million
and
$21.5 million
, respectively.
Employment Agreements
The Company has entered into employment agreements with several executive officers, other members of management and certain key employees. These agreements generally have
three
- to
five
-year terms and typically indicate a base salary and often contain provisions for discretionary bonuses. Certain of the executives are also entitled to a separation payment if terminated without “cause” or upon voluntary termination of employment for “good reason” following a “change of control” (as these terms are defined in the employment contracts).
Letters of Credit
As of December 31, 2014, the Company had outstanding letters of credit of
$8.9 million
.
Litigation
In addition to the actions noted below, the Company’s affiliates are involved in litigation arising in the normal course of business. In the opinion of management, such litigation is not expected to have a material effect on the Company’s financial condition, results of operations or cash flows.
Determination of Unsuitability and Redemption of Aruze and Affiliates
On February 18, 2012, Wynn Resorts’ Gaming Compliance Committee received an independent report by Freeh, Sporkin & Sullivan, LLP (the “Freeh Report”) detailing a pattern of misconduct by the Okada Parties. The factual record presented in the Freeh Report included evidence that the Okada Parties had provided valuable items to certain foreign gaming officials who were responsible for regulating gaming in a jurisdiction in which entities controlled by Mr. Okada were developing a gaming resort. Mr. Okada denied the impropriety of such conduct to members of the Board of Directors of Wynn Resorts and, while serving as one of the Company’s directors, Mr. Okada refused to acknowledge or abide by Wynn Resorts’ anti-bribery policies and refused to participate in the training all other directors received concerning these policies.
Based on the Freeh Report, the Board of Directors of Wynn Resorts determined that the Okada Parties are “unsuitable persons” under Article VII of the Company’s articles of incorporation. The Board of Directors was unanimous (other than Mr. Okada) in its determination. After authorizing the redemption of the Aruze shares, as discussed below, the Board of Directors took certain actions to protect the Company and its operations from any influence of an unsuitable person, including placing limitations on the provision of certain operating information to unsuitable persons and formation of an Executive Committee of the Board to manage the business and affairs of the Company during the period between each annual meeting. The Charter of the Executive Committee provides that “Unsuitable Persons” are not permitted to serve on the Committee. All members of the Board, other than Mr. Okada, were appointed to the Executive Committee on February 18, 2012. The Board of Directors also requested that Mr. Okada resign as a director of Wynn Resorts (under Nevada corporation law, a board of directors does not have the power to remove a director) and recommended that Mr. Okada be removed as a member of the Board of Directors of Wynn Macau, Limited. On February 18, 2012, Mr. Okada was removed from the Board of Directors of Wynn Las Vegas Capital Corp., an indirect wholly owned subsidiary of Wynn Resorts. On February 24, 2012, Mr. Okada was removed from the Board of Directors of Wynn Macau, Limited and on February 22, 2013, he was removed from the Board of Directors of Wynn Resorts by a stockholder vote in which
99.6%
of the over
86 million
shares voted were cast in favor of removal. Mr. Okada resigned from the Board of Directors of Wynn Resorts on February 21, 2013. Although the Company has retained the structure of the Executive Committee, the Board has resumed its past role in managing the business and affairs of the Company.
Based on the Board of Directors’ finding of “unsuitability,” on February 18, 2012, Wynn Resorts redeemed and canceled Aruze’s
24,549,222
shares of Wynn Resorts’ common stock. Following a finding of “unsuitability,” Article VII of Wynn Resorts’ articles of incorporation authorizes redemption at “fair value” of the shares held by unsuitable persons. The Company engaged an independent financial advisor to assist in the fair value calculation and concluded that a discount to the then current trading price was appropriate because of, among other things, restrictions on most of the shares held by Aruze under the terms of the Stockholders Agreement (as defined below). Pursuant to its articles of incorporation, Wynn Resorts issued the Redemption Note to Aruze in redemption of the shares. The Redemption Note has a principal amount of
$1.94 billion
, matures on
February 18, 2022
, and bears interest at the rate of
2%
per annum, payable annually in arrears on each anniversary of the date of the Redemption Note. The Company may, in its sole and absolute discretion, at any time and from time to time, and
107
WYNN RESORTS, LIMITED AND SUBSIDIARIES
NOTES TO CONSOLIDATED FINANCIAL STATEMENTS (continued)
without penalty or premium, prepay the whole or any portion of the principal or interest due under the Redemption Note. In no instance shall any payment obligation under the Redemption Note be accelerated except in the sole and absolute discretion of Wynn Resorts or as specifically mandated by law. The indebtedness evidenced by the Redemption Note is and shall be subordinated in right of payment, to the extent and in the manner provided in the Redemption Note, to the prior payment in full of all existing and future obligations of Wynn Resorts or any of its affiliates in respect of indebtedness for borrowed money of any kind or nature.
The Company provided the Freeh Report to appropriate regulators and law enforcement agencies and has been cooperating with related investigations that such regulators and agencies have undertaken. The conduct of the Okada Parties and any resulting regulatory investigations could have adverse consequences to the Company and its subsidiaries. A finding by regulatory authorities that Mr. Okada violated anti-corruption statutes and/or other laws or regulations applicable to persons affiliated with a gaming licensee on Company property and/or otherwise involved the Company in criminal or civil violations could result in actions by regulatory authorities against the Company and its subsidiaries.
Redemption Action and Counterclaim
On February 19, 2012, Wynn Resorts filed a complaint in the Eighth Judicial District Court, Clark County, Nevada against the Okada Parties (as amended, the “Complaint”), alleging breaches of fiduciary duty and related claims (the “Redemption Action”) arising from the activities addressed in the Freeh Report. The Company is seeking compensatory and special damages as well as a declaration that it acted lawfully and in full compliance with its articles of incorporation, bylaws and other governing documents in redeeming and canceling the shares of Aruze.
On March 12, 2012, the Okada Parties removed the action to the United States District Court for the District of Nevada (the action was subsequently remanded to Nevada state court). On that same date, the Okada Parties filed an answer denying the claims and a counterclaim (as amended, the “Counterclaim”) that purports to assert claims against the Company, each of the members of the Company’s Board of Directors (other than Mr. Okada) and Wynn Resorts’ General Counsel (the “Wynn Parties”). The Counterclaim alleges, among other things: (1) that the shares of Wynn Resorts common stock owned by Aruze were exempt from the redemption-for-unsuitability provisions in the Wynn Resorts articles of incorporation (the “Articles”) pursuant to certain agreements executed in 2002; (2) that the Wynn Resorts directors who authorized the redemption of Aruze’s shares acted at the direction of Stephen A. Wynn and did not independently and objectively evaluate the Okada Parties’ suitability, and by so doing, breached their fiduciary duties; (3) that the Wynn Resorts directors violated the terms of the Wynn Resorts Articles by failing to pay Aruze fair value for the redeemed shares; and (4) that the terms of the Redemption Note that Aruze received in exchange for the redeemed shares, including the Redemption Note’s principal amount, duration, interest rate, and subordinated status, were unconscionable. Among other relief, the Counterclaim seeks a declaration that the redemption of Aruze’s shares was void, an injunction restoring Aruze’s share ownership, damages in an unspecified amount and rescission of the Amended and Restated Stockholders Agreement, dated as of January 6, 2010, by and among Aruze, Stephen A. Wynn, and Elaine Wynn (the “Stockholders Agreement”).
On June 19, 2012, Elaine Wynn asserted a cross claim against Stephen A. Wynn and Aruze seeking a declaration that (1) any and all of Elaine Wynn’s duties under the Stockholders Agreement shall be discharged; (2) the Stockholders Agreement is subject to rescission and is rescinded; (3) the Stockholders Agreement is an unreasonable restraint on alienation in violation of public policy; and/or (4) the restrictions on sale of shares shall be construed as inapplicable to Elaine Wynn. The indenture for Wynn Las Vegas, LLC's 4 1/4% Senior Notes due 2023 (the "2023 Indenture") provides that if Stephen A. Wynn, together with certain related parties, in the aggregate beneficially owns a lesser percentage of the outstanding common stock of the Company than are beneficially owned by any other person, a change of control will have occurred. The indenture for Wynn Las Vegas, LLC's 5 1/2% Senior Notes due 2025 (the "2025 Indenture") provides that if any event constitutes a "change of control" under the 2023 Indenture, it will constitute a change of control under the 2025 Indenture. If Elaine Wynn prevails in her cross claim, Stephen A. Wynn would not beneficially own or control Elaine Wynn’s shares, which could increase the likelihood that a change in control may occur under the Wynn Las Vegas debt documents. Under the 2023 Indenture and the 2025 Indenture, if a change of control occurs and within 60 days after that occurrence, the 4 1/4% Senior Notes due 2023 or the 5 1/2% Senior Notes due 2025, as applicable, are rated below investment grade by both rating agencies that rate such notes, the Company is required to make an offer to each applicable holder to repurchase all or any part of such holder’s notes at a purchase price equal to 101% of the aggregate principal amount thereof plus accrued and unpaid interest on the notes purchased, if any, to the date of repurchase (unless the notes have been previously called for redemption). Mr. Wynn is opposing Ms. Wynn’s cross claim.
The Company’s Complaint and the Okada Parties’ Counterclaim have been, and continue to be, challenged through motion practice. At a hearing held on November 13, 2012, the Nevada state court granted the Wynn Parties’ motion to dismiss
108
WYNN RESORTS, LIMITED AND SUBSIDIARIES
NOTES TO CONSOLIDATED FINANCIAL STATEMENTS (continued)
the Counterclaim with respect to the Okada Parties’ claim under the Nevada Racketeer Influenced and Corrupt Organizations Act with respect to certain Company executives but otherwise denied the motion. At a hearing held on January 15, 2013, the court denied the Okada Parties’ motion to dismiss the Company’s Complaint. On April 22, 2013, the Company filed a second amended complaint. On August 30, 2013, the Okada Parties filed their third amended Counterclaim. On September 18, 2013, the Company filed a Partial Motion to Dismiss related to a claim in the third amended Counterclaim alleging civil extortion by Mr. Wynn and the Company’s General Counsel. On October 29, 2013, the court granted the motion and dismissed the claim. On November 26, 2013, the Okada Parties filed their fourth amended Counterclaim, and the Company filed an answer to that pleading on December 16, 2013.
On each of February 14, 2013 and February 13, 2014, the Company issued a check to Aruze in the amount of
$38.7 million
, representing the interest payments due on the Redemption Note at those times. However, those checks were not cashed. In February 2014, the Okada Parties advised of their intent to deposit any checks for interest and principal, past and future, due under the terms of the Redemption Note to the clerk of the court for deposit into the clerk’s trust account. On March 17, 2014, the parties stipulated that the checks be returned to the Company for reissue in the same amounts, payable to the clerk of the court for deposit into the clerk's trust account. Pursuant to the stipulation, on March 20, 2014, the Company delivered to the clerk of the court the reissued checks that were deposited into the clerk's trust account and filed a notice with the court with respect to the same. On February 13, 2015, the Company issued a check for the interest payment due at that time to the clerk of the court for deposit into the clerk’s trust account.
On April 8, 2013, the United States Attorney’s Office and the U.S. Department of Justice filed a Motion to Intervene and for Temporary and Partial Stay of Discovery in the Redemption Action. The parties had been engaged in discovery at the time of the filing. The motion stated that the federal government has been conducting a criminal investigation of the Okada Parties involving the “same underlying allegations of misconduct-that is, potential violations of the Foreign Corrupt Practice Act and related fraudulent conduct-that form the basis of” the Company’s complaint, as amended, in the Redemption Action. The motion sought to stay all discovery in the Redemption Action related to the Okada Parties’ allegedly unlawful activities in connection with their casino project in the Philippines until the conclusion of the criminal investigation and any resulting criminal prosecution, with an interim status update to the court in
six months
. At a hearing on May 2, 2013, the court granted the motion and ordered that all discovery in the Redemption Action be stayed for a period of
six months
(the “Stay”). On May 30, 2013, Elaine Wynn filed a motion for partial relief from the Stay, to allow her to conduct limited discovery related to her cross and counterclaims. The Wynn Parties opposed the motion so as to not interfere with the United States government’s investigation. At a hearing on August 1, 2013, the court denied the motion. On October 29, 2013, the United States Attorney’s Office and the U.S. Department of Justice filed a Motion to Extend the Stay for a further period of
six months
. At a hearing on October 31, 2013, the court granted the requested extension based upon an affidavit provided under seal that outlined, among other things, concerns for witness safety. The court did, however, order the parties to exchange written discovery propounded prior to May 2, 2013, including discovery related to the Elaine Wynn cross and counterclaims referred to above. The extended Stay expired on May 5, 2014. On April 29, 2014, the United States Attorney's Office and the U.S. Department of Justice filed a Motion for a Second Extension of Temporary Stay of Discovery for a further
six months
. At a hearing on May 1, 2014, the court denied the motion. On September 22, 2014, the court entered a new stipulation between the parties for discovery schedule with closing on August 1, 2016.
On September 16, 2014, Aruze filed a motion for partial summary judgment related to its counterclaim alleging the Company's directors violated the terms of the Articles by failing to pay Aruze fair value for the redeemed shares. At a hearing held on October 21, 2014, the court denied Aruze's motion.
On October 10, 2014, the Okada Parties filed a motion for partial judgment on the pleadings principally to seek dismissal of certain breach of fiduciary claims against Mr. Okada included in the Company's Complaint. On November 13, 2014, the court denied the motion and issued an order setting the trial and trial-related dates. The trial is scheduled to begin on February 6, 2017.
The Company will continue to vigorously pursue its claims against the Okada Parties, and the Company and the Wynn Parties will continue to vigorously defend against the counterclaims asserted against them. The Company’s claims and the Okada Parties’ counterclaims remain in an early stage and management has determined that based on proceedings to date, it is currently unable to determine the probability of the outcome of this matter or the range of reasonably possible loss, if any. An adverse judgment or settlement involving payment of a material amount could cause a material adverse effect on our financial condition.
109
WYNN RESORTS, LIMITED AND SUBSIDIARIES
NOTES TO CONSOLIDATED FINANCIAL STATEMENTS (continued)
Litigation Commenced by Kazuo Okada
Japan Action:
On August 28, 2012, Mr. Okada, Universal Entertainment Corporation and Okada Holdings (“Okada Japan Parties”) filed a complaint in Tokyo District Court against the Wynn Parties, alleging that the press release issued by the Company with respect to the redemption has damaged plaintiffs’ social evaluation and credibility. The Okada Japan Parties seek damages and legal fees from the Wynn Parties. After asking the Okada Japan Parties to clarify the allegations in their complaint, the Wynn Parties objected to the jurisdiction of the Japanese court. On April 30, 2013, the Wynn Parties filed a memorandum in support of their jurisdictional position. On October 21, 2013, the court dismissed the action on jurisdictional grounds. On November 1, 2013, the Okada Japan Parties filed an appeal moving the matter to the Tokyo High Court. On June 11, 2014, the Tokyo High Court ruled in favor of the Wynn Parties and upheld the motion for dismissal. On June 25, 2014, the Okada Japan Parties filed a notice of appeal to the Supreme Court of Japan. On October 28, 2014, the Wynn Parties received a copy of the brief that the Okada Japan Parties had filed to explain why they believe the Supreme Court of Japan should hear the case. The Wynn Parties filed a reply brief on February 16, 2015.
Indemnification Action:
On March 20, 2013, Mr. Okada filed a complaint against the Company in Nevada state court for indemnification under the Company’s Articles, bylaws and agreements with its directors. The complaint sought advancement of Mr. Okada’s costs and expenses (including attorney’s fees) incurred pursuant to the various legal proceedings and related regulatory investigations described above. The Company’s answer and counterclaim was filed on April 15, 2013. The counterclaim named each of the Okada Parties as defendants and sought indemnification under the Company’s Articles for costs and expenses (including attorney’s fees) incurred pursuant to the various legal proceedings and related regulatory investigations described above. On April 30, 2013, Mr. Okada filed his reply to the counterclaim. On February 4, 2014, the court entered an order on the parties’ stipulation that: (1) dismissed all claims Mr. Okada asserted against the Company; (2) reserved Mr. Okada’s right to assert, in the future, any claims for indemnity following the resolution of the Redemption Action; and (3) stayed the claims asserted by the Company against Mr. Okada pending the resolution of the Redemption Action.
Management has determined that based on proceedings to date, it is currently unable to determine the probability of the outcome of this action or the range of reasonably possible loss, if any.
Related Investigations and Derivative Litigation
Investigations:
In the U.S. Department of Justice’s Motion to Intervene and for Temporary and Partial Stay of Discovery in the Redemption Action, the Department of Justice states in a footnote that the government also has been conducting a criminal investigation into the Company’s previously disclosed donation to the University of Macau. The Company has not received any target letter or subpoena in connection with such an investigation. The Company intends to cooperate fully with the government in response to any inquiry related to the donation to the University of Macau.
Other regulators may pursue separate investigations into the Company’s compliance with applicable laws arising from the allegations in the matters described above and in response to the Counterclaim and other litigation filed by Mr. Okada suggesting improprieties in connection with the Company’s donation to the University of Macau. While the Company believes that it is in full compliance with all applicable laws, any such investigations could result in actions by regulators against the Company. Prior investigations by the Nevada Gaming Control Board and SEC were closed with no actions taken.
Derivative Claims:
Six
derivative actions were commenced against the Company and all members of its Board of Directors:
four
in the United States District Court, District of Nevada, and
two
in the Eighth Judicial District Court of Clark County, Nevada.
The four federal actions brought by the following plaintiffs have been consolidated: (1) The Louisiana Municipal Police Employees’ Retirement System, (2) Maryanne Solak, (3) Excavators Union Local 731 Welfare Fund, and (4) Boilermakers Lodge No. 154 Retirement Fund (collectively, the “Federal Plaintiffs”).
110
WYNN RESORTS, LIMITED AND SUBSIDIARIES
NOTES TO CONSOLIDATED FINANCIAL STATEMENTS (continued)
The Federal Plaintiffs filed a consolidated complaint on August 6, 2012, asserting claims for: (1) breach of fiduciary duty; (2) waste of corporate assets; (3) injunctive relief; and (4) unjust enrichment. The claims were against the Company and all Company directors, including Mr. Okada, however, the plaintiffs voluntarily dismissed Mr. Okada as a defendant in this consolidated action on September 27, 2012. The Federal Plaintiffs claimed that the individual defendants breached their fiduciary duties and wasted assets by: (a) failing to ensure the Company’s officers and directors complied with federal and state laws and the Company’s Code of Conduct; (b) voting to allow the Company’s subsidiary to make the donation to the University of Macau; and (c) redeeming Aruze’s stock such that the Company incurs the debt associated with the redemption. The Federal Plaintiffs seek unspecified compensatory damages, restitution in the form of disgorgement, reformation of corporate governance procedures, an injunction against all future payments related to the donation/pledge, and all fees (attorneys, accountants, and experts) and costs. The directors responded to the consolidated complaint by filing a motion to dismiss on September 14, 2012. On February 1, 2013, the federal court dismissed the complaint for failure to plead adequately the futility of a pre-suit demand on the Board. The dismissal was without prejudice to the Federal Plaintiffs’ ability to file a motion within
30 days
seeking leave to file an amended complaint. On April 9, 2013, the Federal Plaintiffs filed their amended complaint. The Company and the directors filed their motion to dismiss the amended complaint on May 23, 2013. On March 13, 2014, the federal court granted the motion to dismiss and entered judgment in favor of the Company and directors and against the Federal Plaintiffs without prejudice. On April 10, 2014, the Federal Plaintiffs filed a notice of appeal to the United States Court of Appeals for the Ninth Circuit. The Federal Plaintiffs' opening brief was filed on September 19, 2014. The Company filed a response on December 18, 2014 and the Federal Plaintiffs’ filed a reply brief on January 30, 2015.
The
two
state court actions brought by the following plaintiffs have also been consolidated: (1) IBEW Local 98 Pension Fund and (2) Danny Hinson (collectively, the “State Plaintiffs”). Through a coordination of efforts by all parties, the directors and the Company (a nominal defendant) have been served in all of the actions. The State Plaintiffs filed a consolidated complaint on July 20, 2012 asserting claims for (1) breach of fiduciary duty; (2) abuse of control; (3) gross mismanagement; and (4) unjust enrichment. The claims are against the Company and all Company directors during the applicable period, including Mr. Okada, as well as the Company’s Chief Financial Officer who signed financial disclosures filed with the SEC during the applicable periods. The State Plaintiffs claim that the individual defendants failed to disclose to the Company’s stockholders the investigation into, and the dispute with director Okada as well as the alleged potential violations of the FCPA related to, the University of Macau Development Foundation donation. The State Plaintiffs seek unspecified monetary damages (compensatory and punitive), disgorgement, reformation of corporate governance procedures, an order directing the Company to internally investigate the donation, as well as attorneys’ fees and costs. On October 13, 2012, the court entered the parties’ stipulation providing for a stay of the state derivative action for
90
days, subject to the parties’ obligation to monitor the progress of the pending litigation, discussed above, between Wynn Resorts (among others) and Mr. Okada (among others). Per the stipulation, the Company and the individual defendants were not required to respond to the consolidated complaint while the stay remained in effect. Following the expiration of the stay, the State Plaintiffs advised the Company and the individual defendants that they intended to resume the action by filing an amended complaint, which they did, on April 26, 2013. The Company and directors filed their motion to dismiss on June 10, 2013. However, on July 31, 2013, the parties agreed to a stipulation that was submitted to, and approved by the court. The stipulation contemplates a stay of the consolidated state court derivative action of equal duration as the Stay entered by the court in the Redemption Action. On June 18, 2014, the court entered a new stipulation between the parties that provides for further stay of the state derivative action and directs the parties, within
45 days
of the conclusion of the latter of the Redemption Action or the federal derivative action, to discuss how the state derivative action should proceed and to file a joint report with the court.
The individual defendants are vigorously defending against the claims pleaded against them in the state derivative action. Management has determined that based on proceedings to date, it is currently unable to determine the probability of the outcome of this action or the range of reasonably possible loss, if any.
Massachusetts Gaming License Related Actions
On September 17, 2014, the MGC designated Wynn MA, an indirect wholly owned subsidiary of the Company, the award winner of the Greater Boston (Region A) gaming license. On November 7, 2014, the gaming license awarded to us became effective.
On October 16, 2014, the City of Revere, the host community to the unsuccessful bidder for the same license, and the International Brotherhood of Electrical Workers, Local 103, filed a complaint against the MGC and each of the five gaming commissioners in Suffolk Superior Court. On December 4, 2014, the City of Somerville, a surrounding community to the proposed site which Wynn MA will develop and construct an integrated resort, filed a similar complaint against the MGC and each of the five gaming commissioners in Suffolk Superior Court. The complaints challenge the MGC's decision and allege
111
WYNN RESORTS, LIMITED AND SUBSIDIARIES
NOTES TO CONSOLIDATED FINANCIAL STATEMENTS (continued)
that the MGC failed to follow statutory requirements outlined in the Gaming Act. The complaints (1) seek to appeal the administrative decision, (2) assert that certiorari provides a remedy to correct errors in proceedings by an agency such as the MGC, (3) challenge the constitutionality of that section of the gaming law which bars judicial review of the Commission's decision to deny an applicant a gaming license, and (4) allege violations of the open meeting law requirements.
On January 5, 2015, the City of Boston, filed a complaint against the MGC and each of the five gaming commissioners in Suffolk Superior Court for certiorari and declaratory relief in connection with the MGC's award of the license to Wynn MA. The complaint seeks to contest the MGC's decision that Boston is a surrounding community, rather than a host community to the Wynn resort in Massachusetts.
Wynn MA is not named in the complaints. Wynn MA has been advised that the Attorney General for the Commonwealth of Massachusetts will be responding to the complaints.
The Company reviews the results of operations for each of its operating segments. Wynn Macau and Encore at Wynn Macau are managed as a single integrated resort and aggregated as one reportable segment ("Macau Operations"). Wynn Las Vegas and Encore at Wynn Las Vegas are managed as a single integrated resort and have been aggregated as one reportable segment ("Las Vegas Operations"). The Company identifies each integrated resort as a reportable segment considering operations within each integrated resort have similar economic characteristics, type of customers, types of services and products, the regulatory environment of the operations and the Company's organizational and management reporting structure. The Company also reviews construction and development activities for each of its projects under development, in addition to its reportable segments. The Company's projects under development are Wynn Palace and the Wynn resort in Massachusetts. In the following tables the assets and capital expenditures of the Wynn resort in Massachusetts are included in Corporate and Other. Other Macau primarily represents cash and investment securities held at the Company's Macau holding company.
112
WYNN RESORTS, LIMITED AND SUBSIDIARIES
NOTES TO CONSOLIDATED FINANCIAL STATEMENTS (continued)
The following tables present the Company's segment information (in thousands):
|
Years Ended December 31,
|
|||||||||||
|
2014
|
2013
|
2012
|
|||||||||
|
Net revenues
|
|||||||||||
|
Macau Operations
|
$
|
3,796,750
|
|
$
|
4,040,526
|
|
$
|
3,667,454
|
|
||
|
Las Vegas Operations
|
1,636,911
|
|
1,580,410
|
|
1,486,830
|
|
|||||
|
Total
|
$
|
5,433,661
|
|
$
|
5,620,936
|
|
$
|
5,154,284
|
|
||
|
Adjusted Property EBITDA
(1)
|
|||||||||||
|
Macau Operations
|
$
|
1,258,082
|
|
$
|
1,324,119
|
|
$
|
1,167,340
|
|
||
|
Las Vegas Operations
|
515,196
|
|
486,682
|
|
408,472
|
|
|||||
|
Total
|
1,773,278
|
|
1,810,801
|
|
1,575,812
|
|
|||||
|
Other operating costs and expenses
|
|||||||||||
|
Pre-opening costs
|
30,146
|
|
3,169
|
|
466
|
|
|||||
|
Depreciation and amortization
|
314,119
|
|
371,051
|
|
373,199
|
|
|||||
|
Property charges and other
|
10,437
|
|
17,138
|
|
39,978
|
|
|||||
|
Corporate expenses and other
|
111,795
|
|
88,729
|
|
112,159
|
|
|||||
|
Stock-based compensation
|
39,154
|
|
39,538
|
|
19,648
|
|
|||||
|
Equity in income from unconsolidated affiliates
|
1,349
|
|
1,085
|
|
1,086
|
|
|||||
|
Total other operating costs and expenses
|
507,000
|
|
520,710
|
|
546,536
|
|
|||||
|
Operating income
|
1,266,278
|
|
1,290,091
|
|
1,029,276
|
|
|||||
|
Non-operating costs and expenses
|
|||||||||||
|
Interest income
|
20,441
|
|
15,713
|
|
12,543
|
|
|||||
|
Interest expense, net of amounts capitalized
|
(315,062
|
)
|
(299,022
|
)
|
(288,759
|
)
|
|||||
|
(Decrease) increase in swap fair value
|
(4,393
|
)
|
14,235
|
|
991
|
|
|||||
|
Loss from extinguishment of debt
|
(9,569
|
)
|
(40,435
|
)
|
(25,151
|
)
|
|||||
|
Equity in income from unconsolidated affiliates
|
1,349
|
|
1,085
|
|
1,086
|
|
|||||
|
Other
|
(182
|
)
|
4,856
|
|
3,012
|
|
|||||
|
Total other non-operating costs and expenses
|
(307,416
|
)
|
(303,568
|
)
|
(296,278
|
)
|
|||||
|
Income before income taxes
|
958,862
|
|
986,523
|
|
732,998
|
|
|||||
|
Benefit (provision) for income taxes
|
3,782
|
|
17,634
|
|
(4,299
|
)
|
|||||
|
Net income
|
$
|
962,644
|
|
$
|
1,004,157
|
|
$
|
728,699
|
|
||
113
WYNN RESORTS, LIMITED AND SUBSIDIARIES
NOTES TO CONSOLIDATED FINANCIAL STATEMENTS (continued)
|
(1)
|
“Adjusted Property EBITDA” is earnings before interest, taxes, depreciation, amortization, pre-opening costs, property charges and other, corporate expenses, intercompany golf course and water rights leases, stock-based compensation, and other non-operating income and expenses and includes equity in income from unconsolidated affiliates. Adjusted Property EBITDA is presented exclusively as a supplemental disclosure because management believes that it is widely used to measure the performance, and as a basis for valuation, of gaming companies. Management uses Adjusted Property EBITDA as a measure of the operating performance of its segments and to compare the operating performance of its properties with those of its competitors. The Company also presents Adjusted Property EBITDA because it is used by some investors as a way to measure a company’s ability to incur and service debt, make capital expenditures and meet working capital requirements. Gaming companies have historically reported EBITDA as a supplement to financial measures in accordance with U.S. generally accepted accounting principles (“GAAP”). In order to view the operations of their casinos on a more stand-alone basis, gaming companies, including Wynn Resorts, Limited, have historically excluded from their EBITDA calculations pre-opening expenses, property charges, corporate expenses and stock-based compensation, which do not relate to the management of specific casino properties. However, Adjusted Property EBITDA should not be considered as an alternative to operating income as an indicator of the Company’s performance, as an alternative to cash flows from operating activities as a measure of liquidity, or as an alternative to any other measure determined in accordance with GAAP. Unlike net income, Adjusted Property EBITDA does not include depreciation or interest expense and therefore does not reflect current or future capital expenditures or the cost of capital. The Company has significant uses of cash flows, including capital expenditures, interest payments, debt principal repayments, taxes and other non-recurring charges, which are not reflected in Adjusted Property EBITDA. Also, Wynn Resorts’ calculation of Adjusted Property EBITDA may be different from the calculation methods used by other companies and, therefore, comparability may be limited.
|
The Company has reclassified the prior periods to conform with the current presentation of segment information.
|
Years ended December 31,
|
|||||||
|
2014
|
2013
|
||||||
|
Capital expenditures
|
|||||||
|
Macau
|
|||||||
|
Macau Operations
|
$
|
89,039
|
|
$
|
60,488
|
|
|
|
Wynn Palace
|
937,501
|
|
381,786
|
|
|||
|
Total Macau
|
1,026,540
|
|
442,274
|
|
|||
|
Las Vegas Operations
|
58,813
|
|
63,872
|
|
|||
|
Corporate and other
|
41,662
|
|
640
|
|
|||
|
$
|
1,127,015
|
|
$
|
506,786
|
|
||
|
As of December 31,
|
|||||||||||
|
2014
|
2013
|
2012
|
|||||||||
|
Assets
|
|||||||||||
|
Macau
|
|||||||||||
|
Macau Operations
|
$
|
1,520,098
|
|
$
|
2,510,444
|
|
$
|
2,439,886
|
|
||
|
Wynn Palace
|
1,854,521
|
|
755,452
|
|
320,158
|
|
|||||
|
Other Macau
|
974,170
|
|
652,267
|
|
244,614
|
|
|||||
|
Total Macau
|
4,348,789
|
|
3,918,163
|
|
3,004,658
|
|
|||||
|
Las Vegas Operations
|
3,472,931
|
|
3,576,649
|
|
3,669,881
|
|
|||||
|
Corporate and other
|
1,241,141
|
|
882,218
|
|
602,055
|
|
|||||
|
$
|
9,062,861
|
|
$
|
8,377,030
|
|
$
|
7,276,594
|
|
|||
114
WYNN RESORTS, LIMITED AND SUBSIDIARIES
NOTES TO CONSOLIDATED FINANCIAL STATEMENTS (continued)
|
As of December 31,
|
|||||||||||
|
2014
|
2013
|
2012
|
|||||||||
|
Long-lived assets
|
|||||||||||
|
Macau
|
$
|
2,799,781
|
|
$
|
1,732,485
|
|
$
|
1,343,381
|
|
||
|
United States
|
3,268,576
|
|
3,292,965
|
|
3,483,745
|
|
|||||
|
$
|
6,068,357
|
|
$
|
5,025,450
|
|
$
|
4,827,126
|
|
|||
The following tables (in thousands, except per share data) present selected quarterly financial information for
2014
and
2013
, as previously reported. Because income per share amounts are calculated using the weighted average number of common and dilutive common equivalent shares outstanding during each quarter, the sum of the per share amounts for the four quarters may not equal the total income per share amounts for the year.
|
Year Ended December 31, 2014
|
|||||||||||||||||||
|
First
|
Second
|
Third
|
Fourth
|
Year
|
|||||||||||||||
|
Net revenues
|
$
|
1,513,613
|
|
$
|
1,412,063
|
|
$
|
1,370,010
|
|
$
|
1,137,975
|
|
$
|
5,433,661
|
|
||||
|
Operating income
|
$
|
376,831
|
|
$
|
341,342
|
|
$
|
332,575
|
|
$
|
215,530
|
|
$
|
1,266,278
|
|
||||
|
Net income
|
$
|
303,043
|
|
$
|
258,402
|
|
$
|
253,006
|
|
$
|
148,193
|
|
$
|
962,644
|
|
||||
|
Net income attributable to Wynn Resorts, Limited
|
$
|
226,896
|
|
$
|
203,906
|
|
$
|
191,406
|
|
$
|
109,346
|
|
$
|
731,554
|
|
||||
|
Basic income per share
|
$
|
2.25
|
|
$
|
2.02
|
|
$
|
1.90
|
|
$
|
1.08
|
|
$
|
7.25
|
|
||||
|
Diluted income per share
|
$
|
2.22
|
|
$
|
2.00
|
|
$
|
1.88
|
|
$
|
1.07
|
|
$
|
7.18
|
|
||||
|
Year Ended December 31, 2013
|
|||||||||||||||||||
|
First
|
Second
|
Third
|
Fourth
|
Year
|
|||||||||||||||
|
Net revenues
|
$
|
1,378,654
|
|
$
|
1,332,273
|
|
$
|
1,390,112
|
|
$
|
1,519,897
|
|
$
|
5,620,936
|
|
||||
|
Operating income
|
$
|
333,648
|
|
$
|
274,024
|
|
$
|
313,978
|
|
$
|
368,441
|
|
$
|
1,290,091
|
|
||||
|
Net income
|
$
|
272,144
|
|
$
|
192,716
|
|
$
|
248,811
|
|
$
|
290,486
|
|
$
|
1,004,157
|
|
||||
|
Net income attributable to Wynn Resorts, Limited
|
$
|
202,963
|
|
$
|
129,785
|
|
$
|
182,020
|
|
$
|
213,884
|
|
$
|
728,652
|
|
||||
|
Basic income per share
|
$
|
2.02
|
|
$
|
1.29
|
|
$
|
1.81
|
|
$
|
2.12
|
|
$
|
7.25
|
|
||||
|
Diluted income per share
|
$
|
2.00
|
|
$
|
1.28
|
|
$
|
1.79
|
|
$
|
2.10
|
|
$
|
7.17
|
|
||||
Dividend
On
February 3, 2015
, the Company announced a cash dividend of
$1.50
per share, payable on
February 23, 2015
to stockholders of record as of
February 13, 2015
.
Cash Tender Offer and Senior Notes Issuance
On February 10, 2015, the Issuers commenced a cash tender offer for any and all of the outstanding aggregate principal amounts of the 7 3/4% 2020 Notes and 7 7/8% 2020 Notes (together the "2020 Notes"). Wynn Las Vegas, LLC accepted for purchase valid tenders with respect to approximately
$305.8 million
of the
$377.0 million
aggregate principal amount of the 7 3/4% 2020 Notes and approximately
$1,146.5 million
of the
$1,226.6 million
aggregate principal amount of the 7 7/8% 2020 Notes. The note holders who validly tendered their 2020 Notes received the total consideration of
$1,073.82
for each
$1,000
principal amount of 7 3/4% 2020 Notes and
$1,054.21
for each
$1,000
principal amount of 7 7/8% 2020 Notes. The premium portion of the aggregate total consideration was approximately
$101.2 million
and recorded as a loss on extinguishment of debt in the first quarter of 2015.
Separately, on February 18, 2015, the Issuers completed the issuance of
$1.8 billion
aggregate principal amount of
5 1/2%
senior notes due 2025 (the "2025 Notes") pursuant to an Indenture, dated as of February 18, 2015 (the "2025 Indenture"),
115
WYNN RESORTS, LIMITED AND SUBSIDIARIES
NOTES TO CONSOLIDATED FINANCIAL STATEMENTS (continued)
among the Issuers, all the Issuers' subsidiaries (other than Wynn Las Vegas Capital Corp., which was a co-issuer) and U.S. Bank National Association, as trustee. The 2025 Notes were issued at par. The Company used the net proceeds from the 2025 Notes to cover the cost of purchasing the 2020 Notes tendered in the tender offer. The Company also satisfied and discharged the indentures under which the 2020 Notes were issued and will use the remaining net proceeds to redeem the 2020 Notes not tendered and for general corporate purposes.
The 2025 Notes will mature on March 1, 2025 and bear interest at the rate of
5 1/2%
per annum. The Issuers may, at their option, redeem the 2025 Notes, in whole or in part, at any time or from time to time prior to their stated maturity. The redemption price for 2025 Notes that are redeemed before December 1, 2024 will be equal to the greater of (a)
100%
of the principal amount of the 2025 Notes to be redeemed and (b) a “make-whole” amount described in the 2025 Indenture, plus in either case accrued and unpaid interest, if any, to, but not including, the redemption date. The redemption price for the 2025 Notes that are redeemed on or after December 1, 2024 will be equal to
100%
of the principal amount of the 2025 Notes to be redeemed, plus accrued and unpaid interest, if any, to, but not including, the redemption date. In the event of a change of control triggering event, the Issuers will be required to offer to repurchase the 2025 Notes at
101%
of the principal amount, plus accrued and unpaid interest, if any, to, but not including. the repurchase date. The 2025 Notes are also subject to mandatory redemption requirements imposed by gaming laws and regulations of gaming authorities in Nevada.
The 2025 Notes are the Issuers’ senior unsecured obligations and rank pari passu in right of payment with the Issuers’ outstanding 7 7/8% 2020 Notes, 7 3/4% 2020 Notes, the 2022 Notes and the 2023 Notes (together, the "Existing Notes"). The 2025 Notes are secured by a first priority pledge of the Company’s equity interests, the effectiveness of which is subject to the prior approval of the Nevada gaming authorities. The equity interests of the Company also secure the Existing Notes. If Wynn Resorts, Limited receives an investment grade rating from one or more ratings agencies, the first priority pledge securing the 2025 Notes will be released.
The 2025 Notes are jointly and severally guaranteed by all of the Issuers’ subsidiaries. The guarantees are senior unsecured obligations and rank senior in right of payment to all of their existing and future subordinated debt. The guarantees rank equally in right of payment with all existing and future liabilities of the Issuers' subsidiaries that are not so subordinated and will be effectively subordinated in right of payment to all of such existing and future secured debt (to the extent of the collateral securing such debt).
The 2025 Indenture contains covenants limiting the Issuers’ and all of the Issuers' subsidiaries' (as guarantors), other than Wynn Capital, ability to create liens on assets to secure debt, enter into sale-leaseback transactions and merge or consolidate with another company. These covenants are subject to a number of important and significant limitations, qualifications and exceptions.
Events of default under the 2025 Indenture include, among others, the following: default for
30 days
in the payment when due of interest on the 2025 Notes; default in payment when due of the principal of, or premium, if any, on the 2025 Notes; failure to comply with certain covenants in the 2025 Indenture; and certain events of bankruptcy or insolvency. In the case of an event of default arising from certain events of bankruptcy or insolvency with respect to the Issuers or Issuers' subsidiaries (as guarantors), other than Wynn Capital, all 2025 Notes then outstanding will become due and payable immediately without further action or notice.
116
None.
(a)
Disclosure Controls and Procedures.
The Company’s management, with the participation of the Company’s Chief Executive Officer and Chief Financial Officer, has evaluated the effectiveness of the Company’s disclosure controls and procedures (as such term is defined in Rules 13a-15(e) and 15d-15(e) under the Securities Exchange Act of 1934, as amended (the “Exchange Act”)) as of the end of the period covered by this report. In designing and evaluating the disclosure controls and procedures, management recognized that any controls and procedures, no matter how well designed and operated, can only provide reasonable assurance of achieving the desired control objectives and management is required to apply its judgment in evaluating the cost-benefit relationship of possible controls and procedures. Based on such evaluation, the Company’s Chief Executive Officer and Chief Financial Officer have concluded that, as of
December 31, 2014
, the Company’s disclosure controls and procedures are effective, at the reasonable assurance level, in recording, processing, summarizing and reporting, on a timely basis, information required to be disclosed by the Company in the reports that it files or submits under the Exchange Act and in ensuring that information required to be disclosed by the Company in the reports that it files or submits under the Exchange Act is accumulated and communicated to the Company’s management, including the Chief Executive Officer and Chief Financial Officer, as appropriate to allow timely discussions regarding required disclosure.
(b)
Management Report on Internal Control Over Financial Reporting.
Management of the Company is responsible for establishing and maintaining adequate internal control over financial reporting, as defined in Rule 13a-15(f) and 15d-15(f) under the Exchange Act.
Because of its inherent limitations, internal control over financial reporting may not prevent or detect misstatements. Projections of any evaluation of effectiveness to future periods are subject to the risks that controls may become inadequate because of changes in conditions, or that the degree of compliance with the policies or procedures may deteriorate.
Management assessed the effectiveness of the Company’s internal control over financial reporting as of
December 31, 2014
. In making this assessment, management used the criteria set forth by the Committee of Sponsoring Organizations of the Treadway Commission (2013 framework) (“COSO”) in
Internal Control-Integrated Framework.
Based on our assessment, management believes that, as of
December 31, 2014
, the Company’s internal control over financial reporting was effective.
The Company’s independent registered public accounting firm has issued an audit report on our internal control over financial reporting. This report appears under “Report of Independent Registered Public Accounting Firm on Internal Controls Over Financial Reporting” on page 67.
(c)
Changes in Internal Control Over Financial Reporting.
There have not been any changes in the Company’s internal control over financial reporting (as such term is defined in Rules 13a-15(f) and 15d-15(f) under the Exchange Act) during our fourth fiscal quarter to which this report relates that have materially affected, or are reasonably likely to materially affect, the Company’s internal control over financial reporting.
On February 24, 2015, the Company entered into a second amendment (the “Amendment”) to the Employment Agreement, dated as of November 7, 2013, as amended, by and between the Company and Stephen Cootey, Chief Financial Officer, Senior Vice President and Treasurer. The Amendment, effective as of February 24, 2015, among other things, provides that the amount of any separation payment payable under his employment agreement shall equal the sum of his base salary through the end of the term of the agreement (but not less than 12 months), plus the amount of any bonus paid for the preceding bonus period, plus any accrued but unpaid vacation time.
The description of the Amendment is qualified by reference to the Amendment, a copy of which is filed herewith as Exhibit 10.1.6.2.
On February 26, 2015, the Company entered into (i) a Management Fee and Corporate Allocation Agreement, dated as of February 26, 2015, by and between the Company and Wynn Las Vegas (“Management Agreement”) and (ii) a 2015 Intellectual
117
Property License Agreement, dated as of February 26, 2015, by and among the Company, Wynn Resorts Holdings, LLC and Wynn Las Vegas (“2015 IP Agreement”). The Management Agreement provides that, among other things, Wynn Las Vegas will pay the Company a yearly management fee equal to 1.5% of net revenues and monthly corporate allocation charges for corporate support services provided by the Company in support of Wynn Las Vegas’ business. Pursuant to the 2015 IP Agreement, Wynn Las Vegas is granted a non-exclusive license to certain intellectual property at a monthly licensing fee of 3% of Wynn Las Vegas’ gross revenue, subject to a 1.5% reduction while the 2004 IP Agreement (defined below) is in place.
In connection with the foregoing, the Company terminated that certain Management Agreement, dated as of December 14, 2004, by and among the Company, Wynn Las Vegas, and certain Wynn Las Vegas-related entities. That certain Intellectual Property License Agreement, dated as of December 14, 2004 (“2004 IP Agreement”), by and among the Company, Wynn Resorts Holdings, LLC and Wynn Las Vegas remains in effect until otherwise terminated by the parties in accordance with the terms therein.
These descriptions of the Management Agreement and 2015 IP Agreement are qualified by reference to such agreements, copies of which are filed herewith as Exhibits 10.11.2 and 10.11.5, respectively.
118
The information required by this item will be contained in the Registrant’s definitive Proxy Statement for its 2015 Annual Stockholder Meeting to be filed with the Securities and Exchange Commission within 120 days after
December 31, 2014
(the “2015 Proxy Statement”) under the captions “Election of Directors”, “Executive Officers”, “Corporate Governance” and “Section 16(a) Beneficial Ownership Reporting Compliance,” and is incorporated herein by reference.
As part of the Company’s commitment to integrity, the Board of Directors has adopted a Code of Business Conduct and Ethics applicable to all directors, officers and employees of the Company and its subsidiaries. This Code is periodically reviewed by the Board of Directors. In the event we determine to amend or waive certain provisions of this code of ethics, we intend to disclose such amendments or waivers on our website at http://www.wynnresorts.com under the heading “Corporate Governance” within four business days following such amendment or waiver or as otherwise required by the NASDAQ listing standards.
The information required by this item will be contained in the 2015 Proxy Statement under the captions “Director Compensation”, “Compensation Discussion and Analysis” and “Executive Compensation Tables,” and is incorporated herein by reference.
Securities Authorized for Issuance Under Equity Compensation Plans
The following table summarizes compensation plans under which our equity securities are authorized for issuance, aggregated as to: (i) all compensation plans previously approved by stockholders, and (ii) all compensation plans not previously approved by stockholders. These plans are described in Item 8—“Financial Statements and Supplementary Data” of Part II (see Notes to Consolidated Financial Statements).
|
Plan Category
|
Number of
Securities to
be Issued
Upon
Exercise of
Outstanding
Options,
Warrants
and Rights
(a)
|
Weighted-
Average
Exercise
Price of
Outstanding
Options,
Warrants
and Rights
(b)
|
Number of
Securities
Remaining
Available for
Future
Issuance
Under Equity
Compensation
Plans
(excluding
securities
reflected in
column (a))
(c)
|
||||||
|
Equity compensation plans approved by security holders
|
1,380,976
|
|
$
|
79.93
|
|
4,407,390
|
|
||
|
Equity compensation plans not approved by security holders
|
—
|
|
—
|
|
—
|
|
|||
|
Total
|
1,380,976
|
|
$
|
79.93
|
|
4,407,390
|
|
||
Certain information required by this item will be contained in the 2015 Proxy Statement under the caption “Certain Beneficial Ownership and Management," and is incorporated herein by reference.
The information required by this item will be contained in the 2015 Proxy Statement under the caption “Certain Relationships and Related Transactions", and “Corporate Governance,” and is incorporated herein by reference.
The information required by this item will be contained in the 2015 Proxy Statement under the caption “Ratification of Appointment of Independent Auditors,” and is incorporated herein by reference.
119
(a)1. The following consolidated financial statements of the Company are filed as part of this report under Item 8—“Financial Statements and Supplementary Data.”
|
•
|
Reports of Independent Registered Public Accounting Firm
|
|
•
|
Consolidated Balance Sheets as of December 31, 2014 and 2013
|
|
•
|
Consolidated Statements of Income for the years ended December 31, 2014, 2013 and 2012
|
|
•
|
Consolidated Statements of Comprehensive Income for the years ended December 31, 2014, 2013 and 2012
|
|
•
|
Consolidated Statements of Stockholders’ Equity for the years ended December 31, 2014, 2013 and 2012
|
|
•
|
Consolidated Statements of Cash Flows for the years ended December 31, 2014, 2013 and 2012
|
|
•
|
Notes to Consolidated Financial Statements
|
(a)2. Financial Statement Schedules filed in Part IV of this report are listed below:
|
•
|
Schedule I—Condensed financial information of the registrant
|
|
•
|
Schedule II—Valuation and Qualifying Accounts
|
We have omitted all other financial statement schedules because they are not required or are not applicable, or the required information is shown in the financial statements or notes to the financial statements.
120
SCHEDULE 1—CONDENSED FINANCIAL INFORMATION OF THE REGISTRANT
WYNN RESORTS, LIMITED
(Parent Company Only)
CONDENSED BALANCE SHEETS
(in thousands, except share data)
|
December 31,
|
|||||||
|
2014
|
2013
|
||||||
|
ASSETS
|
|||||||
|
Current assets:
|
|||||||
|
Cash and cash equivalents
|
$
|
335,111
|
|
$
|
299,716
|
|
|
|
Investment securities
|
240,140
|
|
169,496
|
|
|||
|
Receivables
|
1,740
|
|
1,804
|
|
|||
|
Prepaid expenses
|
1,980
|
|
3,165
|
|
|||
|
Total current assets
|
578,971
|
|
474,181
|
|
|||
|
Property and equipment, net
|
11,296
|
|
11,314
|
|
|||
|
Investment securities
|
10,173
|
|
79,989
|
|
|||
|
Other assets
|
62,043
|
|
33,787
|
|
|||
|
Due from subsidiaries
|
369,917
|
|
298,410
|
|
|||
|
Investment in subsidiaries
|
1,217,442
|
|
1,269,696
|
|
|||
|
Total assets
|
$
|
2,249,842
|
|
$
|
2,167,377
|
|
|
|
LIABILITIES AND STOCKHOLDERS' EQUITY
|
|||||||
|
Current liabilities:
|
|||||||
|
Accounts payable
|
$
|
1,695
|
|
$
|
334
|
|
|
|
Accrued compensation and benefits
|
17,428
|
|
1,326
|
|
|||
|
Interest payable
|
33,636
|
|
33,636
|
|
|||
|
Other accrued liabilities
|
8,163
|
|
4,865
|
|
|||
|
Deferred income taxes, net
|
4,847
|
|
4,034
|
|
|||
|
Total current liabilities
|
65,769
|
|
44,195
|
|
|||
|
Long-term debt
|
1,936,443
|
|
1,936,443
|
|
|||
|
Other long-term liabilities
|
12,421
|
|
40,045
|
|
|||
|
Deferred income taxes, net
|
24,118
|
|
14,343
|
|
|||
|
Total liabilities
|
2,038,751
|
|
2,035,026
|
|
|||
|
Commitments and contingencies (Note 2)
|
|
|
|||||
|
Stockholders’ equity:
|
|||||||
|
Preferred stock, par value $0.01; 40,000,000 shares authorized; zero shares issued and outstanding
|
—
|
|
—
|
|
|||
|
Common stock, par value $0.01; 400,000,000 shares authorized; 114,426,960 and 114,170,493 shares issued; and, 101,439,297 and 101,192,408 shares outstanding
|
1,144
|
|
1,142
|
|
|||
|
Treasury stock, at cost; 12,987,663 and 12,978,085 shares
|
(1,145,481
|
)
|
(1,143,419
|
)
|
|||
|
Additional paid-in capital
|
948,566
|
|
888,727
|
|
|||
|
Accumulated other comprehensive income
|
2,505
|
|
2,913
|
|
|||
|
Retained earnings
|
164,487
|
|
66,130
|
|
|||
|
Total Wynn Resorts, Limited stockholders’ deficit
|
(28,779
|
)
|
(184,507
|
)
|
|||
|
Noncontrolling interest
|
239,870
|
|
316,858
|
|
|||
|
Total equity
|
211,091
|
|
132,351
|
|
|||
|
Total liabilities and stockholders' equity
|
$
|
2,249,842
|
|
$
|
2,167,377
|
|
|
The accompanying notes are an integral part of these condensed financial statements.
121
WYNN RESORTS, LIMITED
(Parent Company Only)
CONDENSED STATEMENTS OF INCOME
(in thousands, except per share data)
|
Years Ended December 31,
|
|||||||||||
|
2014
|
2013
|
2012
|
|||||||||
|
Operating revenues:
|
|||||||||||
|
Wynn Macau royalty fees
|
$
|
148,039
|
|
$
|
160,923
|
|
$
|
147,101
|
|
||
|
Wynn Las Vegas management fees
|
24,580
|
|
23,721
|
|
22,318
|
|
|||||
|
Other revenues
|
2,050
|
|
—
|
|
—
|
|
|||||
|
Net revenues
|
174,669
|
|
184,644
|
|
169,419
|
|
|||||
|
Operating costs and expenses:
|
|||||||||||
|
General and administrative
|
45,934
|
|
45,285
|
|
70,602
|
|
|||||
|
Depreciation and amortization
|
447
|
|
423
|
|
421
|
|
|||||
|
Property charges and other
|
—
|
|
—
|
|
33
|
|
|||||
|
Total operating costs and expenses
|
46,381
|
|
45,708
|
|
71,056
|
|
|||||
|
Operating income
|
128,288
|
|
138,936
|
|
98,363
|
|
|||||
|
Other income (expense):
|
|||||||||||
|
Interest and other income
|
1,997
|
|
1,486
|
|
1,116
|
|
|||||
|
Interest expense
|
(38,729
|
)
|
(38,715
|
)
|
(33,650
|
)
|
|||||
|
Equity in income of subsidiaries
|
864,156
|
|
882,760
|
|
665,127
|
|
|||||
|
Other income (expense), net
|
827,424
|
|
845,531
|
|
632,593
|
|
|||||
|
Income before income taxes
|
955,712
|
|
984,467
|
|
730,956
|
|
|||||
|
Benefit (provision) for income taxes
|
6,932
|
|
19,690
|
|
(2,257
|
)
|
|||||
|
Net income
|
962,644
|
|
1,004,157
|
|
728,699
|
|
|||||
|
Less: net income attributable to noncontrolling interests
|
(231,090
|
)
|
(275,505
|
)
|
(226,663
|
)
|
|||||
|
Net income attributable to Wynn Resorts, Limited
|
$
|
731,554
|
|
$
|
728,652
|
|
$
|
502,036
|
|
||
|
Basic and diluted earnings per common share:
|
|||||||||||
|
Net income attributable to Wynn Resorts, Limited:
|
|||||||||||
|
Basic
|
$
|
7.25
|
|
$
|
7.25
|
|
$
|
4.87
|
|
||
|
Diluted
|
$
|
7.18
|
|
$
|
7.17
|
|
$
|
4.82
|
|
||
|
Weighted average common shares outstanding:
|
|||||||||||
|
Basic
|
100,927
|
|
100,540
|
|
103,092
|
|
|||||
|
Diluted
|
101,931
|
|
101,641
|
|
104,249
|
|
|||||
The accompanying notes are an integral part of these condensed financial statements.
122
WYNN RESORTS, LIMITED
(Parent Company Only)
CONDENSED STATEMENTS OF CASH FLOWS
(in thousands)
|
Years Ended December 31,
|
|||||||||||
|
2014
|
2013
|
2012
|
|||||||||
|
Cash flows from operating activities:
|
|||||||||||
|
Net income
|
$
|
962,644
|
|
$
|
1,004,157
|
|
$
|
728,699
|
|
||
|
Adjustments to reconcile net income to net cash provided by operating activities:
|
|||||||||||
|
Depreciation and amortization
|
447
|
|
423
|
|
421
|
|
|||||
|
Deferred income taxes
|
(9,192
|
)
|
(19,826
|
)
|
(3,655
|
)
|
|||||
|
Stock-based compensation
|
21,888
|
|
26,964
|
|
11,894
|
|
|||||
|
Amortization of discount on investment securities and other
|
4,059
|
|
3,338
|
|
3,762
|
|
|||||
|
Dividends received from subsidiary
|
887,613
|
|
840,914
|
|
700,025
|
|
|||||
|
Equity in income of subsidiaries
|
(864,156
|
)
|
(882,760
|
)
|
(665,127
|
)
|
|||||
|
Increase (decrease) in cash from changes in:
|
|||||||||||
|
Receivables
|
68
|
|
(476
|
)
|
823
|
|
|||||
|
Prepaid expenses
|
1,185
|
|
(467
|
)
|
(1,695
|
)
|
|||||
|
Accounts payable, accrued expenses and other
|
21,540
|
|
1,515
|
|
38,337
|
|
|||||
|
Due from affiliates
|
(26,900
|
)
|
(23,721
|
)
|
(22,318
|
)
|
|||||
|
Net cash provided by operating activities
|
999,196
|
|
950,061
|
|
791,166
|
|
|||||
|
Cash flows from investing activities:
|
|||||||||||
|
Purchase of investment securities
|
(200,258
|
)
|
(222,856
|
)
|
(183,484
|
)
|
|||||
|
Proceeds from sales or maturities of investment securities
|
195,164
|
|
95,771
|
|
202,406
|
|
|||||
|
Purchase of other assets
|
(28,476
|
)
|
(105
|
)
|
(33,682
|
)
|
|||||
|
Due (from) to subsidiaries
|
(307,525
|
)
|
4,623
|
|
(34,132
|
)
|
|||||
|
Net cash used in investing activities
|
(341,095
|
)
|
(122,567
|
)
|
(48,892
|
)
|
|||||
|
Cash flows from financing activities:
|
|||||||||||
|
Cash distributions
|
(632,503
|
)
|
(712,681
|
)
|
(955,493
|
)
|
|||||
|
Exercise of stock options
|
11,859
|
|
20,436
|
|
15,583
|
|
|||||
|
Repurchase of common stock
|
(2,062
|
)
|
(15,472
|
)
|
(911
|
)
|
|||||
|
Net cash used in financing activities
|
(622,706
|
)
|
(707,717
|
)
|
(940,821
|
)
|
|||||
|
Cash and cash equivalents:
|
|||||||||||
|
Increase (decrease) in cash and cash equivalents
|
35,395
|
|
119,777
|
|
(198,547
|
)
|
|||||
|
Balance, beginning of year
|
299,716
|
|
179,939
|
|
378,486
|
|
|||||
|
Balance, end of year
|
$
|
335,111
|
|
$
|
299,716
|
|
$
|
179,939
|
|
||
The accompanying notes are an integral part of these condensed financial statements.
123
WYNN RESORTS, LIMITED
(Parent Company Only)
NOTES TO CONDENSED FINANCIAL STATEMENTS
The accompanying condensed financial statements include only the accounts of Wynn Resorts, Limited (the “Company”). Investments in the Company’s subsidiaries are accounted for under the equity method.
In October 2009, Wynn Macau, Limited, an indirect wholly owned subsidiary of the Company and the developer, owner and operator of Wynn Macau, listed its ordinary shares of common stock on The Stock Exchange of Hong Kong Limited. Wynn Macau, Limited sold through an initial public offering, including the over allotment,
1,437,500,000
shares,
27.7%
of this subsidiary’s common stock.
Certain information and footnote disclosures normally included in financial statements prepared in accordance with accounting principles generally accepted in the United States of America have been condensed or omitted since this information is included in the Company’s consolidated financial statements included elsewhere in this Form 10-K.
The Company is a holding company and, as a result, its ability to pay dividends is dependent on its subsidiaries’ ability to obtain funds and its subsidiaries' ability to provide funds to it. Restrictions are imposed by its subsidiaries' debt instruments significantly restrict certain key subsidiaries holding a majority of its assets, including Wynn Las Vegas, LLC, Wynn America, LLC, and Wynn Resorts (Macau), S.A., from making dividends or distributions to the Company. These restrictions are subject to certain exceptions for affiliated overhead expenses as defined in the agreements governing the debt instruments, unless certain financial and non-financial criteria have been satisfied. The Company received cash dividends of $
887.6 million
,
$840.9 million
and
$700.0 million
from its subsidiaries during the years ended
December 31, 2014
,
2013
and
2012
, respectively.
124
SCHEDULE II—VALUATION AND QUALIFYING ACCOUNTS
(in thousands)
|
Description
|
Balance at
Beginning of Year |
Provisions
for Doubtful Accounts |
Write-offs,
Net of Recoveries |
Balance at
End of Year |
|||||||||
|
Allowance for doubtful accounts:
|
|||||||||||||
|
2014
|
$
|
73,991
|
|
3,906
|
|
(3,219
|
)
|
$
|
74,678
|
|
|||
|
2013
|
$
|
102,213
|
|
11,877
|
|
(40,099
|
)
|
$
|
73,991
|
|
|||
|
2012
|
$
|
91,854
|
|
18,091
|
|
(7,732
|
)
|
$
|
102,213
|
|
|||
|
Description
|
Balance at
Beginning of Year |
Additions
|
Deductions
|
Balance at
End of Year |
|||||||||
|
Deferred income tax asset valuation allowance:
|
|||||||||||||
|
2014
|
$
|
2,587,025
|
|
745,112
|
|
(35,348
|
)
|
$
|
3,296,789
|
|
|||
|
2013
|
$
|
1,831,545
|
|
773,509
|
|
(18,029
|
)
|
$
|
2,587,025
|
|
|||
|
2012
|
$
|
1,812,482
|
|
29,132
|
|
(10,069
|
)
|
$
|
1,831,545
|
|
|||
125
(a)3. Exhibits
Exhibits that are not filed herewith have been previously filed with the SEC and are incorporated herein by reference.
|
Exhibit
No.
|
Description
|
|
|
3.1
|
Second Amended and Restated Articles of Incorporation of the Registrant. (Incorporated by reference from Amendment No. 4 to the Form S-1 filed by the Registrant on October 7, 2002 (File No. 333-90600).)
|
|
|
3.2
|
Seventh Amended and Restated Bylaws of the Registrant, as amended. (Incorporated by reference from the Quarterly Report on Form 10-Q filed by the Registrant on August 8, 2014.)
|
|
|
4.1
|
Specimen certificate for shares of Common Stock, $0.01 par value per share of the Registrant. (Incorporated by reference from Amendment No. 4 to the Form S-1 filed by the Registrant on October 7, 2002 (File No. 333-90600).)
|
|
|
4.2
|
Indenture, dated as of April 28, 2010, by and among Wynn Las Vegas, LLC, Wynn Las Vegas Capital Corp., the Guarantors set forth therein and U.S. Bank National Association, as trustee. (Incorporated by reference from the Current Report on Form 8-K filed by the Registrant on April 28, 2010.)
|
|
|
4.3
|
Indenture, dated as of August 4, 2010, among Wynn Las Vegas, LLC, Wynn Las Vegas Capital Corp., the Guarantors named therein and U.S. Bank National Association, as trustee. (Incorporated by reference from the Current Report on Form 8-K filed by the Registrant on August 5, 2010.)
|
|
|
4.4
|
Indenture, dated as of March 12, 2012, by and among Wynn Las Vegas, LLC, Wynn Las Vegas Capital Corp., the Guarantors named therein and U.S. Bank National Association, as trustee. (Incorporated by reference from the Current Report on Form 8-K filed by the Registrant on March 13, 2012.)
|
|
|
4.5
|
Indenture, dated May 22, 2013, among Wynn Las Vegas, LLC, Wynn Las Vegas Capital Corp., the Guarantors named therein and the U.S. Bank National Association, as trustee. (Incorporated by reference from the Current Report on Form 8-K filed by the Registrant on May 22, 2013.)
|
|
|
4.6
|
Indenture, dated February 18, 2015, among Wynn Las Vegas, LLC, Wynn Las Vegas Capital Corp., the Guarantors named therein and U.S. Bank National Association, as trustee. (Incorporated by reference from the Current Report on Form 8-K filed by the Registrant on February 18, 2015.)
|
|
|
*4.7
|
Supplemental Indenture, dated as of February 18, 2015, to Indenture, dated as of April 28, 2010, among Wynn Las Vegas, LLC, Wynn Las Vegas Capital Corp., the Guarantors named therein and U.S. Bank National Association, as trustee.
|
|
|
*4.8
|
Supplemental Indenture, dated as of February 18, 2015, to Indenture, dated as of August 4, 2010, among Wynn Las Vegas, LLC, Wynn Las Vegas Capital Corp., the Guarantors named therein and U.S. Bank National Association, as trustee.
|
|
|
*4.9
|
Supplemental Indenture, dated as of February 18, 2015, to Indenture, dated as of March 12, 2012, among Wynn Las Vegas, LLC, Wynn Las Vegas Capital Corp., the Guarantors named therein and U.S. Bank National Association, as trustee.
|
|
|
*4.10
|
Supplemental Indenture, dated as of February 18, 2015, to Indenture, dated as of May 22, 2013, among Wynn Las Vegas, LLC, Wynn Las Vegas Capital Corp., the Guarantors named therein and U.S. Bank National Association, as trustee.
|
|
|
+10.1.1.0
|
Employment Agreement, dated as of October 4, 2002, by and between Wynn Resorts, Limited and Stephen A. Wynn. (Incorporated by reference from Amendment No. 4 to the Form S-1 filed by the Registrant on October 7, 2002 (File No. 333-90600).)
|
|
|
+10.1.1.1
|
First Amendment to Employment Agreement, dated as of August 6, 2004, by and between Stephen A. Wynn and Wynn Resorts, Limited. (Incorporated by reference from the Quarterly Report on Form 10-Q filed by the Registrant on November 4, 2004.)
|
|
|
+10.1.1.2
|
Second Amendment to employment agreement between Wynn Resorts, Limited and Stephen A. Wynn dated January 31, 2007. (Incorporated by reference from the Annual Report on Form 10-K filed by the Registrant on March 1, 2007.)
|
|
|
+10.1.1.3
|
Third Amendment to Employment Agreement, dated as of September 11, 2008, between Wynn Resorts, Limited and Stephen A. Wynn. (Incorporated by reference from the Current Report on Form 8-K filed by the Registrant on September 15, 2008. )
|
|
|
+10.1.1.4
|
Fourth Amendment to Employment Agreement dated as of December 31, 2008, between Wynn Resorts, Limited and Stephen A. Wynn. (Incorporated by reference from the Annual Report on Form 10-K filed by the Registrant on March 2, 2009.)
|
|
|
+10.1.1.5
|
Amendment to Employment Agreement, dated as of February 16, 2009, by and between Wynn Resorts, Limited and Stephen A. Wynn. (Incorporated by reference from the Quarterly Report on Form 10-Q filed by the Registrant on May 11, 2009.)
|
|
126
|
+10.1.1.6
|
Sixth Amendment to Employment Agreement, dated as of February 24, 2011, between Wynn Resorts, Limited and Stephen A. Wynn. (Incorporated by reference from the Current Report on Form 8-K filed by the Registrant on February 28, 2011.)
|
|
|
*+10.1.1.7
|
Seventh Amendment to Employment Agreement, dated as of January 15, 2015, between Wynn Resorts, Limited and Stephen A. Wynn.
|
|
|
+10.1.2
|
Employment Agreement, dated November 18, 2013, by and between Wynn Resorts Limited and Matt Maddox (Incorporated by reference from the Annual Report on Form 10-K filed by the Registrant on February 28, 2014.)
|
|
|
+10.1.3.0
|
Employment Agreement, dated May 12, 2010, by and between Worldwide Wynn, LLC and Linda C. Chen. (Incorporated by reference from the Current Report on Form 8-K filed by the Registrant on May 18, 2010.)
|
|
|
+10.1.3.1
|
Retention Agreement, dated July 27, 2011, by and between Worldwide Wynn, LLC and Linda Chen. (Incorporated by reference from the Current Report on Form 8-K filed by the Registrant on August 18, 2011.)
|
|
|
+10.1.3.2
|
First Amendment to Employment Agreement, dated as of November 2, 2012, by and between Worldwide Wynn, LLC and Linda Chen. (Incorporated by reference from the Annual Report on Form 10-K filed by the Registrant on March 1, 2013.)
|
|
|
+10.1.3.3
|
Second Amendment to Employment Agreement, dated as of January 2, 2014, by and between Worldwide Wynn, LLC and Linda Chen. (Incorporated by reference from the Quarterly Report on Form 10-Q filed by the Registrant on May 9, 2014.)
|
|
|
+10.1.4.0
|
Employment Agreement, dated as of April 24, 2007, by and between Wynn Resorts, Limited and Kim Sinatra. (Incorporated by reference from the Annual Report on Form 10-K filed by the Registrant on March 1, 2010.)
|
|
|
+10.1.4.1
|
First Amendment to Employment Agreement, dated as of December 31, 2008 by and between Wynn Resorts, Limited and Kim Sinatra. (Incorporated by reference from the Annual Report on Form 10-K filed by the Registrant on March 1, 2010.)
|
|
|
+10.1.4.2
|
Amendment to Employment Agreement, dated as of February 12, 2009, by and between Wynn Resorts, Limited and Kim Sinatra. (Incorporated by reference from the Annual Report on Form 10-K filed by the Registrant on March 1, 2010.)
|
|
|
+10.1.4.3
|
Second Amendment to Employment Agreement, dated as of November 30, 2009, by and between Wynn Resorts, Limited and Kim Sinatra. (Incorporated by reference from the Annual Report on Form 10-K filed by the Registrant on March 1, 2010.)
|
|
|
+10.1.4.4
|
Third Amendment to Employment Agreement, dated as of May 5, 2014, by and between Wynn Resorts, Limited and Kim Sinatra. (Incorporated by reference from the Quarterly Report on Form 10-Q filed by the Registrant on August 8, 2014.)
|
|
|
+10.1.5.0
|
Employment Agreement, dated August 31, 2005, by and between Wynn Resorts, Limited and John Strzemp. (Incorporated by reference from the Annual Report on Form 10-K filed by the Registrant on February 28, 2014.)
|
|
|
+10.1.5.1
|
First Amendment to Employment Agreement, dated as of March 26, 2008, by and between Wynn Resorts, Limited and John Strzemp. (Incorporated by reference from the Annual Report on Form 10-K filed by the Registrant on February 28, 2014.)
|
|
|
+10.1.5.2
|
Second Amendment to Employment Agreement, dated as of December 31, 2008, by and between Wynn Resorts, Limited and John Strzemp. (Incorporated by reference from the Annual Report on Form 10-K filed by the Registrant on February 28, 2014.)
|
|
|
+10.1.5.3
|
Amendment to Employment Agreement, dated as of February 12, 2009, by and between Wynn Resorts, Limited and John Strzemp. (Incorporated by reference from the Annual Report on Form 10-K filed by the Registrant on February 28, 2014.)
|
|
|
+10.1.5.4
|
Fourth Amendment to Employment Agreement, dated as of March 23, 2009, by and between Wynn Resorts, Limited and John Strzemp. (Incorporated by reference from the Annual Report on Form 10-K filed by the Registrant on February 28, 2014.)
|
|
|
+10.1.5.5
|
Fifth Amendment to Employment Agreement, dated as of February 25, 2013, by and between Wynn Resorts, Limited and John Strzemp. (Incorporated by reference from the Annual Report on Form 10-K filed by the Registrant on February 28, 2014.)
|
|
|
+10.1.5.6
|
Sixth Amendment to Employment Agreement, dated as of September 10, 2013, by and between Wynn Resorts, Limited and John Strzemp. (Incorporated by reference from the Annual Report on Form 10-K filed by the Registrant on February 28, 2014.)
|
|
|
+10.1.6.0
|
Employment Agreement, dated as of November 7, 2013, by and between Wynn Resorts, Limited and Stephen Cootey (Incorporated by reference from the Quarterly Report on Form 10-Q filed by the Registrant on August 8, 2014.)
|
|
127
|
+10.1.6.1
|
First Amendment to Employment Agreement, dated as of January 6, 2014, by and between Wynn Resorts, Limited and Stephen Cootey. (Incorporated by reference from the Quarterly Report on Form 10-Q filed by the Registrant on August 8, 2014.)
|
|
|
*+10.1.6.2
|
Second Amendment to Employment Agreement, dated as of February 24, 2015, by and between Wynn Resorts, Limited and Stephen Cootey.
|
|
|
+10.2.0
|
2002 Stock Incentive Plan as Amended and Restated effective May 12, 2010. (Incorporated by reference from the Form S-8 Registration Statement filed by the Registrant on July 27, 2010 (File No. 333-168323).)
|
|
|
+10.2.1
|
2002 Stock Incentive Plan as Amended and Restated effective May 17, 2011. (Incorporated by reference from the Annual Report on Form 10-K filed by the Registrant on February 29, 2012.)
|
|
|
+10.2.2
|
Form of Stock Option Agreement pursuant to 2002 Stock Incentive Plan. (Incorporated by reference from the Annual Report on Form 10-K filed by the Registrant on February 29, 2012.)
|
|
|
+10.2.3
|
Form of Stock Option Grant Notice. (Incorporated by reference from the Annual Report on Form 10-K filed by the Registrant on February 29, 2012.)
|
|
|
+10.2.4
|
Form of Restricted Stock Agreement pursuant to 2002 Stock Incentive Plan. (Incorporated by reference from the Annual Report on Form 10-K filed by the Registrant on February 29, 2012.)
|
|
|
+10.2.5
|
2014 Omnibus Incentive Plan effective May 16, 2014. (Incorporated by reference from the Form S-8 Registration Statement filed by the Registrant on May 20, 2014 (File No. 333-196113).)
|
|
|
10.3.1.0
|
Amended and Restated Stockholder Agreement, dated January 6, 2010, by and among Stephen A. Wynn, Elaine P. Wynn and Aruze USA, Inc. (Incorporated by reference from the Current Report on Form 8-K filed by the Registrant on January 6, 2010.)
|
|
|
10.3.1.1
|
Waiver and Consent, dated November 24, 2010, by and among Aruze USA, Inc., Stephen A. Wynn and Elaine P. Wynn. (Incorporated by reference from the Current Report on Form 8-K filed by the Registrant on November 26, 2010.)
|
|
|
10.3.1.2
|
Waiver and Consent, dated December 15, 2010, by and among Aruze USA, Inc., Stephen A. Wynn and Elaine P. Wynn. (Incorporated by reference from the Current Report on Form 8-K filed by the Registrant on December 15, 2010.)
|
|
|
10.3.2
|
Amended and Restated Shareholders Agreement, dated as of September 16, 2004 by and among Wynn Resorts (Macau), Ltd., Wong Chi Seng and Wynn Resorts (Macau), S.A. (Incorporated by reference from the Quarterly Report on Form 10-Q filed by the Registrant on November 4, 2004.)
|
|
|
10.4.1.0
|
Concession Contract for the Operation of Games of Chance or Other Games in Casinos in the Macau Special Administrative Region, dated June 24, 2002, between the Macau Special Administrative Region and Wynn Resorts (Macau), S.A. (English translation of Portuguese version of Concession Agreement). (Incorporated by reference from Amendment No. 1 to the Form S-1 filed by the Registrant on August 20, 2002 (File No. 333-90600).)
|
|
|
10.4.1.1
|
Concession Contract for Operating Casino Gaming or Other Forms of Gaming in the Macao Special Administrative Region, dated June 24, 2002, between the Macau Special Administrative Region and Wynn Resorts (Macau) S.A. (English translation of Chinese version of Concession Agreement). (Incorporated by reference from Amendment No. 3 to the Form S-1 filed by the Registrant on September 18, 2002 (File No. 333-90600).)
|
|
|
10.4.1.2
|
Unofficial English translation of Land Concession Contract between the Macau Special Administrative Region and Wynn Resorts (Macau) S.A. (Incorporated by reference from the Quarterly Report on Form 10-Q filed by the Registrant on August 3, 2004.)
|
|
|
10.4.1.3
|
Land Concession Contract, published on May 2, 2012, by and among Palo Real Estate Company Limited, Wynn Resorts (Macau) S.A. and the Macau Special Administration of the People’s Republic of China (translated to English from traditional Chinese and Portuguese. (Incorporated by reference from the Current Report on Form 8-K filed by the Registrant on May 2, 2012.)
|
|
|
10.5.1.0
|
Surname Rights Agreement, dated as of August 6, 2004, by and between Stephen A. Wynn and Wynn Resorts Holdings, LLC. (Incorporated by reference from the Quarterly Report on Form 10-Q filed by the Registrant on November 4, 2004.)
|
|
|
10.5.1.1
|
Rights of Publicity License, dated as of August 6, 2004, by and between Stephen A. Wynn and Wynn Resorts Holdings, LLC. (Incorporated by reference from the Quarterly Report on Form 10-Q filed by the Registrant on November 4, 2004.)
|
|
|
10.5.1.2
|
Trademark Assignment, dated as of August 6, 2004, by and between Stephen A. Wynn and Wynn Resorts Holdings, LLC. (Incorporated by reference from the Quarterly Report on Form 10-Q filed by the Registrant on November 4, 2004.)
|
|
|
10.5.2
|
Intellectual Property License Agreement dated as of December 14, 2004, by and among Wynn Resorts Holdings, Wynn Resorts, Limited and Wynn Las Vegas, LLC. (Incorporated by reference from the Annual Report on Form 10-K filed by the Registrant on March 15, 2005.)
|
|
128
|
10.6.1.0
|
Common Terms Agreement, dated as of September 14, 2004, among Wynn Resorts (Macau), S.A., certain financial institutions as Hotel Facility Lenders, Project Facility Lenders and Revolving Credit Facility Lenders, Deutsche Bank AG, Hong Kong Branch and Societe Generale Asia Limited as Global Coordinating Lead Arrangers and Societe Generale Asia Limited as Hotel Facility Agent, Project Facility Agent, Intercreditor Agent and Security Agent. (Incorporated by reference from the Quarterly Report on Form 10-Q filed by the Registrant on November 4, 2004.)
|
|
|
10.6.1.1
|
Common Terms Agreement Amendment Agreement, dated as of September 14, 2005, between Wynn Resorts (Macau), S.A. as the Company, Certain Financial Institutions as Hotel Facility Lenders, Project Facility Lenders, Revolving Credit Facility Lenders and Hedging Counterparties, Bank of America Securities Asia Limited, Deutsche Bank AG, Hong Kong Branch and Societe Generale Asia Limited as Global Coordinating Lead Arrangers, Societe Generale Asia Limited as Hotel Facility Agent and Project Facility Agent, Societe Generale Asia Limited as Intercreditor Agent, and Societe Generale, Hong Kong Branch as Security Agent. (Incorporated by reference from the Quarterly Report on Form 10-Q filed by the Registrant on November 8, 2005.)
|
|
|
10.6.1.2
|
Second Amendment Agreement to the Common Terms Agreement dated June 27, 2007 among Wynn Resorts (Macau), S.A., certain financial institutions as Hotel Facility Lenders, Project Facility Lenders, and Revolving Credit Facility Lenders, Banc of America Securities Asia Limited, Deutsche Bank A.G. Hong Kong Branch, and Societe Generale Asia Limited as Global Lead Arrangers and Societe Generale Asia Limited as Hotel Facility Agent and Project Facility Agent and Societe Generale Hong Kong Branch as Intercreditor Agent. (Incorporated by reference from the Quarterly Report on Form 10-Q filed by the Registrant on August 9, 2007.)
|
|
|
10.6.1.3
|
Common Terms Agreement Third Amendment Agreement dated September 8, 2009 between, among others, Wynn Resorts (Macau) S.A. as the company and Société Générale, Hong King Branch as security agent. (Incorporated by reference from the Annual Report on Form 10-K filed by the Registrant on March 1, 2010.)
|
|
|
10.6.1.4
|
Common Terms Agreement Fourth Amendment Agreement, dated as of July 31, 2012 between, among others, Wynn Resorts (Macau) S.A. as the company and Bank of China Limited Macau Branch as security agent. (Incorporated by reference from the Quarterly Report on Form 10-Q filed by the Registrant on November 9, 2012.)
|
|
|
10.6.2.0
|
Hotel Facility Agreement, dated as of September 14, 2004, among Wynn Resorts (Macau), S.A., Societe Generale Asia Limited as Hotel Facility Agent and the several Hotel Facility Lenders named therein. (Incorporated by reference from the Quarterly Report on Form 10-Q filed by the Registrant on November 4, 2004.)
|
|
|
10.6.2.1
|
Hotel Facility Agreement Amendment Agreement, dated as of September 14, 2005, between Wynn Resorts (Macau), S.A. as Company, Societe Generale Asia Limited, as Hotel Facility Agent and Certain Financial Institutions as Hotel Facility Lenders. (Incorporated by reference from the Quarterly Report on Form 10-Q filed by the Registrant on November 8, 2005.)
|
|
|
10.6.2.2
|
Second Amendment Agreement to the Hotel Facility Agreement dated June 27, 2007 among Wynn Resorts (Macau), S.A., Societe Generale Asia Limited as Hotel Facility Agent, and certain financial institutions as Hotel Facility Lenders. (Incorporated by reference from the Quarterly Report on Form 10-Q filed by the Registrant on August 9, 2007.)
|
|
|
10.6.2.3
|
Third Amendment Agreement to the Hotel Facility Agreement dated July 31, 2012 among Wynn Resorts, (Macau), S.A., Bank of China Limited Macau Branch, and certain financial institutions as Hotel Facility Lenders. (Incorporated by reference from the Quarterly Report on Form 10-Q filed by the Registrant on November 9, 2012.)
|
|
|
10.6.3.0
|
Project Facility Agreement, dated as of September 14, 2004, among Wynn Resorts (Macau), S.A., Societe Generale Asia Limited as Project Facility Agent and the several Project Facility Lenders named therein. (Incorporated by reference from the Quarterly Report on Form 10-Q filed by the Registrant on November 4, 2004.)
|
|
|
10.6.3.1
|
Project Facility Agreement Amendment Agreement, dated as of September 14, 2005, between Wynn Resorts (Macau), S.A. as Company, Societe Generale Asia Limited, as Project Facility Agent and Certain Financial Institutions as Project Facility Lenders. (Incorporated by reference from the Quarterly Report on Form 10-Q filed by the Registrant on November 8, 2005.)
|
|
|
10.6.3.2
|
Second Amendment Agreement to the Project Facility Agreement dated June 27, 2007 among Wynn Resorts (Macau), S.A., Societe Generale Asia Limited as Project Facility Agent, and certain financial institutions as Project Facility Lenders. (Incorporated by reference from the Quarterly Report on Form 10-Q filed by the Registrant on August 9, 2007.)
|
|
|
10.6.4.0
|
Revolving Credit Facility Agreement, dated as of September 14, 2004, among Wynn Resorts (Macau), S.A. and the several Revolving Credit Facility Lenders named therein. (Incorporated by reference from the Quarterly Report on Form 10-Q filed by the Registrant on November 4, 2004.)
|
|
129
|
10.6.4.1
|
Revolving Credit Facility Agreement Amendment Agreement, dated as of September 14, 2005, between Wynn Resorts (Macau), S.A. as Company and Certain Financial Institutions as Revolving Credit Facility Lenders. (Incorporated by reference from the Quarterly Report on Form 10-Q filed by the Registrant on November 8, 2005.)
|
|
|
10.6.4.2
|
Revolving Credit Facility Second Amendment Agreement dated June 27, 2007, among Wynn Resorts (Macau), S.A. and Societe Generale, Hong Kong Branch, as Revolving Credit Facility Agent and certain financial institutions as revolving credit facility lenders. (Incorporated by reference from the Quarterly Report on Form 10-Q filed by the Registrant on August 9, 2007.)
|
|
|
10.6.4.3
|
Revolving Credit Facility Agreement, dated July 31, 2012, among Wynn Resorts (Macau), S.A., Bank of China, Limited Macau Branch, and certain financial institutions as Project Facility Lenders. (Incorporated by reference from the Quarterly Report on Form 10-Q filed by the Registrant on November 9, 2012.)
|
|
|
10.6.5.0
|
Deed of Appointment and Priority, dated as of September 14, 2004, among Wynn Resorts (Macau), S.A., certain financial institutions as Original First Ranking Lenders, Banco Nacional Ultramarino, S.A. as Second Ranking Finance Party, Wynn Group Asia, Inc. as Third Ranking Finance Party, Societe Generale -Hong Kong Branch as Security Agent, Societe Generale Asia Limited as Intercreditor Agent and Hotel Facility Agent and Project Facility Agent and others. (Incorporated by reference from the Quarterly Report on Form 10-Q filed by the Registrant on November 4, 2004.)
|
|
|
10.6.5.1
|
Deed of Appointment and Priority Deed of Amendment, dated as of September 14, 2005, between Wynn Resorts (Macau), S.A. as Company, Certain Financial Institutions as Original First Ranking Lenders, Certain Financial Institutions as Original Hedging Counterparties, Banco Nacional Ultramarino, S.A. as Second Ranking Finance Party, Wynn Group Asia, Inc. as Third Ranking Finance Party, Societe Generale Asia Limited as Security Agent, Societe Generale Asia Limited as Intercreditor Agent , Societe Generale Asia Limited as Hotel Facility Agent and Project Facility Agent, and Others. (Incorporated by reference from the Quarterly Report on Form 10-Q filed by the Registrant on November 8, 2005.)
|
|
|
10.6.6
|
Floating Charge (unofficial English Translation), dated September 14, 2004, between Wynn Resorts (Macau), S.A. and Societe Generale, Hong Kong Branch as the Security Agent. (Incorporated by reference from the Quarterly Report on Form 10-Q filed by the Registrant on November 4, 2004.)
|
|
|
10.6.7
|
Debenture, dated September 14, 2004, between Wynn Resorts (Macau), S.A. and Societe Generale, Hong Kong Branch as the Security Agent. (Incorporated by reference from the Quarterly Report on Form 10-Q filed by the Registrant on November 4, 2004.)
|
|
|
10.6.8.0
|
Wynn Resorts Support Agreement, dated September 14, 2004, between Wynn Resorts, Limited, Wynn Resorts (Macau), S.A. and Societe Generale, Hong Kong Branch as the Security Agent. (Incorporated by reference from the Quarterly Report on Form 10-Q filed by the Registrant on November 4, 2004.)
|
|
|
10.6.8.1
|
Wynn Resorts Support Agreement Deed of Amendment, dated as of September 14, 2005, between Wynn Resorts (Macau), S.A. and Societe Generale, Hong Kong Branch as Security Agent. (Incorporated by reference from the Quarterly Report on Form 10-Q filed by the Registrant on November 8, 2005.)
|
|
|
10.6.9
|
Wynn Pledgors’ Guarantee, dated September 14, 2004, between Wynn Group Asia, Inc., Wynn Resorts International, Ltd., Wynn Resorts (Macau) Holdings, Ltd. and Wynn Resorts (Macau), Ltd. as Guarantors; and Societe Generale, Hong Kong Branch as the Security Agent. (Incorporated by reference from the Quarterly Report on Form 10-Q filed by the Registrant on November 4, 2004.)
|
|
|
10.6.10
|
Bank Guarantee Reimbursement Agreement, dated September 14, 2004, between Wynn Resorts (Macau), S.A. and Banco Nacional Ultramarino. (Incorporated by reference from the Quarterly Report on Form 10-Q filed by the Registrant on November 4, 2004.)
|
|
|
10.6.11
|
Sponsors’ Subordination Deed, dated September 14, 2004, between Wynn Resorts (Macau), S.A., Wynn Group Asia, Inc., Wynn Resorts International, Ltd., Wynn Resorts (Macau) Holdings, Ltd. and Wynn Resorts (Macau), Ltd. as the Wynn Companies and Societe Generale, Hong Kong Branch as the Security Agent. (Incorporated by reference from the Quarterly Report on Form 10-Q filed by the Registrant on November 4, 2004.)
|
|
|
10.7.0
|
Amended and Restated Master Disbursement Agreement, dated as of October 25, 2007, by and among Wynn Las Vegas, LLC, Deutsche Bank Trust Company Americas, as the initial Bank Agent, and Deutsche Bank Trust Company America, as the initial Disbursement Agent. (Incorporated by reference from the Current Report on Form 8-K filed by the Registrant on October 31, 2007.)
|
|
|
10.7.1
|
First Amendment to Amended and Restated Master Disbursement Agreement, dated as of October 31, 2007, by and among Wynn Las Vegas, LLC, Deutsche Bank Trust Company Americas, as the initial Bank Agent, and Deutsche Bank Trust Company America, as the initial Disbursement Agent. (Incorporated by reference from the Current Report on Form 8-K filed by the Registrant on November 1, 2007.)
|
|
|
10.7.2
|
Second Amendment to Amended and Restated Master Disbursement Agreement, dated as of November 6, 2007, by and among Wynn Las Vegas, LLC, Deutsche Bank Trust Company Americas, as the Bank Agent, and Deutsche Bank Trust Company Americas, as the Disbursement Agent. (Incorporated by reference from the Current Report on Form 8-K filed by the Registrant on November 13, 2007.)
|
|
130
|
10.7.3
|
Third Amendment to Amended and Restated Master Disbursement Agreement, dated October 19, 2009, by and among Wynn Las Vegas, LLC, Deutsche Bank Trust Company Americas, as the Bank Agent, and Deutsche Bank Trust Company Americas, as the Disbursement Agent. (Incorporated by reference from the Current Report on Form 8-K filed by the Registrant on October 20, 2009.)
|
|
|
10.7.4
|
Fourth Amendment to Amended and Restated Master Disbursement Agreement, dated April 28, 2010, by and among Wynn Las Vegas, LLC, Deutsche Bank Trust Company Americas, as the Bank Agent, and Deutsche Bank Trust Company Americas, as the Disbursement Agent. (Incorporated by reference from the Current Report on Form 8-K filed by the Registrant on April 28, 2010.)
|
|
|
10.7.5
|
Fifth Amendment to the Amended and Restated Master Disbursement Agreement, dated August 4, 2012, by and among Wynn Las Vegas, LLC, Deutsche Bank Trust Company Americas, as the Bank Agent, and Deutsche Bank Trust Company Americas, as the Disbursement Agent. (Incorporated by reference from the Annual Report on Form 10-K filed by the Registrant on March 1, 2013.)
|
|
|
10.7.6
|
Sixth Amendment to Amended and Restated Master Disbursement Agreement, dated March 12, 2012, by and among Wynn Las Vegas, LLC, Deutsche Bank Trust Company Americas, as the Bank Agent, and Deutsche Bank Trust Company Americas, as the Disbursement Agent. (Incorporated by reference from the Current Report on Form 8-K filed by the Registrant on March 13, 2012.)
|
|
|
10.8.1
|
2013 Second Amended and Restated Agreement of Lease, dated as of November 7, 2013, by and between Wynn Las Vegas, LLC and Stephen A. Wynn. (Incorporated by reference from the Current Report on Form 8-K filed by the Registrant on November 14, 2013.)
|
|
|
*10.8.2
|
First Amendment to 2013 Second Amended and Restated Agreement of Lease, dated as of February 25, 2015, by and between Wynn Las Vegas, LLC and Stephen A. Wynn.
|
|
|
10.8.3
|
Sixth Amended and Restated Art Rental and Licensing Agreement, dated as of July 1, 2012, between Stephen A. Wynn, as lessor, Wynn Las Vegas, LLC, as lessee. (Incorporated by reference from the Quarterly Report on Form 10-Q filed by the Registrant on November 9, 2012.)
|
|
|
10.9.1.0
|
Aircraft Time Sharing Agreement, dated as of November 25, 2002, by and between Las Vegas Jet, LLC and Stephen A. Wynn. (Incorporated by reference from the Annual Report on Form 10-K filed by the Registrant on March 1, 2010.)
|
|
|
10.9.1.1
|
Amendment No. 1 to Aircraft Time Sharing Agreement, entered into as of January 1, 2004, by and between Las Vegas Jet, LLC and Stephen A. Wynn. (Incorporated by reference from the Annual Report on Form 10-K filed by the Registrant on March 1, 2010.)
|
|
|
10.9.1.2
|
Amendment No. 2 to Aircraft Time Sharing Agreement, entered into as of October 31, 2009, by and between Las Vegas Jet, LLC and Stephen A. Wynn. (Incorporated by reference from the Annual Report on Form 10-K filed by the Registrant on March 1, 2010.)
|
|
|
*10.9.1.3
|
Termination Agreement to the Aircraft Time Sharing Agreement, dated as of January 15, 2015, by and between Las Vegas Jet, LLC and Stephen A. Wynn.
|
|
|
*10.9.1.4
|
Aircraft Time Sharing Agreement, dated January 15, 2015, by and between Wynn Resorts, Limited and Stephen A. Wynn.
|
|
|
10.9.2.0
|
Aircraft Purchase Option Agreement, dated January 3, 2013, between Wynn Resorts, Limited and Stephen A. Wynn. (Incorporated by reference from the Annual Report on Form 10-K filed by the Registrant on March 1, 2013.)
|
|
|
10.10.0
|
Form of Indemnity Agreement. (Incorporated by reference from Amendment No. 3 to the Form S-1 filed by the Registrant on September 18, 2002 (File No. 333-90600).)
|
|
|
10.10.1
|
Management Agreement, made as of December 14, 2004, by and among Wynn Las Vegas, LLC, Wynn Show Performers, LLC, Wynn Las Vegas Capital Corp., Wynn Golf, LLC, World Travel, LLC, Las Vegas Jet, LLC, Wynn Sunrise, LLC, and Wynn Resorts, Limited. (Incorporated by reference from the Annual Report on Form 10-K filed by the Registrant on March 15, 2005.)
|
|
|
10.10.2
|
First Amendment to Management Agreement, dated as of December 12, 2014, by and among Wynn Las Vegas, LLC, Wynn Show Performers, LLC, Wynn Las Vegas Capital Corp., Wynn Golf, LLC, World Travel, LLC, Las Vegas Jet, LLC, Wynn Sunrise, LLC, and Wynn Resorts, Limited. (Incorporated by reference from the Current Report on Form 8-K filed by the Registrant on December 12, 2012.)
|
|
|
10.10.3
|
Management Fees Subordination Agreement, dated as of December 14, 2004, by Wynn Resorts, Limited, Wynn Las Vegas, LLC, Wynn Las Vegas Capital Corp., and those subsidiaries of Wynn Las Vegas, LLC listed on Exhibit A hereto in favor of Deutsche Bank Trust Company Americas, as administrative agent, and U.S. Bank National Association, as trustee. (Incorporated by reference from the Annual Report on Form 10-K filed by the Registrant on March 15, 2005.)
|
|
|
*10.10.4
|
Termination Agreement, dated February 26, 2015, to Management Agreement, dated as of December 14, 2004, by and among Wynn Las Vegas, LLC, certain Wynn Las Vegas-related entities named therein, and Wynn Resorts, Limited.
|
|
131
|
10.10.5
|
Redemption Price Promissory Note, dated February 18, 2012, made by Wynn Resorts, Limited to Aruze USA, Inc. (Incorporated by reference from the Current Report on Form 8-K filed by the Registrant on February 21, 2012.)
|
|
|
10.10.6
|
Registration Rights Agreement, dated as of March 12, 2012, by and among Wynn Las Vegas, LLC, Wynn Las Vegas Capital Corp, Wynn Show Performers, LLC, Wynn Golf, LLC, Las Vegas Jet, LLC, World Travel, LLC, Wynn Sunrise, LLC, Kevyn, LLC, Deutsche Bank Securities Inc., Merrill Lynch, Pierce, Fenner & Smith Incorporated and J.P. Morgan Securities LLC. (Incorporated by reference from the Current Report on Form 8-K filed by the Registrant on March 13, 2012.)
|
|
|
*10.11.0
|
Corporate Allocation Agreement, dated as of September 19, 2009, by Wynn Macau, Limited and Wynn Resorts, Limited.
|
|
|
*10.11.1
|
Amended and Restated Corporate Allocation Agreement, dated as of September 19, 2009, by Wynn Resorts (Macau) S.A., and Wynn Resorts, Limited.
|
|
|
*10.11.2
|
Management Fee and Corporate Allocation Agreement, dated as of February 26, 2015, by and between Wynn Las Vegas, LLC and Wynn Resorts, Limited.
|
|
|
*10.11.3
|
Intellectual Property License Agreement, dated as of September 19, 2009, by and among Wynn Resorts Holdings, LLC, Wynn Resorts, Limited and Wynn Macau, Limited.
|
|
|
*10.11.4
|
Amended and Restated Intellectual Property License Agreement, dated as of September 19, 2009, by and among Wynn Resorts Holdings, LLC, Wynn Resorts, Limited and Wynn Resorts (Macau) S.A.
|
|
|
*10.11.5
|
2015 Intellectual Property License Agreement, dated as of February 26, 2015, by and between Wynn Resorts Holdings, LLC, Wynn Resorts, Limited and Wynn Las Vegas, LLC.
|
|
|
*10.12.0
|
Credit Agreement, dated as of November 20, 2014, by and among Wynn America, LLC, as borrower, Wynn Las Vegas Holdings, LLC, Everett Property, LLC and Wynn MA, LLC, as guarantors, Deutsche Bank AG New York Branch, as administrative agent and collateral agent, Deutsche Bank Securities Inc., Merrill Lynch, Pierce, Fenner & Smith Incorporated, Credit Agricole Corporate and Investment Bank, Fifth Third Bank, SunTrust Robinson Humphrey, Inc., The Bank of Nova Scotia, BNP Paribas Securities Corp., Sumitomo Mitsui Banking Corporation and UBS Securities LLC, as joint lead arrangers and joint bookrunners, Morgan Stanley Senior Funding, Inc. and Bank of China, Los Angeles Branch, as arrangers, and Merrill Lynch, Pierce, Fenner & Smith Incorporated, as documentation agent, and the other lenders party thereto.
|
|
|
*10.12.1
|
Completion Guaranty, dated as of November 20, 2014, by and between Wynn Resorts, Limited, and Deutsche Bank AG New York Branch, as administrative agent.
|
|
|
*10.12.2
|
Security Agreement, dated as of November 20, 2014, by and among Wynn America, LLC, Wynn Las Vegas Holdings, LLC, Everett Property, LLC and Wynn MA, LLC, as pledgors, and Deutsche Bank AG New York Branch, as collateral agent.
|
|
|
*21.1
|
Subsidiaries of the Registrant.
|
|
|
*23.1
|
Consent of Ernst & Young LLP.
|
|
|
*31.1
|
Certification of Chief Executive Officer pursuant to Section 302 of the Sarbanes-Oxley Act of 2002.
|
|
|
*31.2
|
Certification of Chief Financial Officer pursuant to Section 302 of the Sarbanes-Oxley Act of 2002.
|
|
|
*32.1
|
Certification of CEO and CFO pursuant to 18 U.S.C. Section 1350.
|
|
|
*101
|
The following financial information from the Company’s Annual Report on Form 10-K for the year ended December 31, 2014, filed with the SEC on February 27, 2015 formatted in Extensible Business Reporting Language (XBRL): (i) the Consolidated Statements of Income for the years ended December 31, 2014, 2013 and 2012, (ii) the Consolidated Balance Sheets at December 31, 2014 and December 31 2013, (iii) the Consolidated Statements of Cash Flows for the years ended December 31, 2014, 2013 and 2012, (iv) the Consolidated Statements of Stockholders’ Equity at December 31, 2014, 2013 and 2012, (v) the Consolidated Statements of Comprehensive Income and (vi) Notes to Consolidated Financial Statements.
|
|
|
*
|
Filed herein
|
|
+
|
Denotes management contract or compensatory plan or arrangement.
|
132
SIGNATURES
Pursuant to the requirements of Section 13 or 15(d) of the Securities Exchange Act of 1934, the Registrant has duly caused this report to be signed on its behalf by the undersigned, thereunto duly authorized.
|
WYNN RESORTS, LIMITED
|
|||
|
Dated: February 27, 2015
|
By:
|
/s/ Stephen A. Wynn
|
|
|
Stephen A. Wynn
|
|||
|
Chairman of the Board and Chief Executive Officer (Principal Executive Officer)
|
|||
Pursuant to the requirements of the Securities Exchange Act of 1934, this report has been signed below by the following persons on behalf of the Registrant and in the capacities and on the dates indicated.
|
Signature
|
Title
|
Date
|
||
|
/s/ Stephen A. Wynn
|
Chairman of the Board and Chief Executive Officer (Principal Executive Officer)
|
February 27, 2015
|
||
|
Stephen A. Wynn
|
||||
|
/s/ John Hagenbuch
|
Director
|
February 27, 2015
|
||
|
John Hagenbuch
|
||||
|
/s/ Dr. Ray R. Irani
|
Director
|
February 27, 2015
|
||
|
Dr. Ray R. Irani
|
||||
|
/s/ Robert J. Miller
|
Director
|
February 27, 2015
|
||
|
Robert J. Miller
|
||||
|
/s/ Alvin V. Shoemaker
|
Director
|
February 27, 2015
|
||
|
Alvin V. Shoemaker
|
||||
|
/s/ Edward J Virtue
|
Director
|
February 27, 2015
|
||
|
Edward J Virtue
|
||||
|
/s/ D. Boone Wayson
|
Director
|
February 27, 2015
|
||
|
D. Boone Wayson
|
||||
|
/s/ Elaine P. Wynn
|
Director
|
February 27, 2015
|
||
|
Elaine P. Wynn
|
||||
|
/s/ Stephen Cootey
|
Chief Financial Officer and Treasurer (Principal Financial and Accounting Officer)
|
February 27, 2015
|
||
|
Stephen Cootey
|
||||
133
TABLE OF CONTENTS
Part IItem 1. BusinessItem 1A. Risk FactorsItem 1B. Unresolved Staff CommentsItem 2. PropertiesItem 3. Legal ProceedingsItem 4. Mine Safety DisclosuresPart IIItem 5. Market For Registrant S Common Equity, Related Stockholder Matters and Issuer Purchases Of Equity SecuritiesItem 6. Selected Financial DataItem 7. Management S Discussion and Analysis Of Financial Condition and Results Of OperationsItem 7A. Quantitative and Qualitative Disclosures About Market RiskItem 8. Financial Statements and Supplementary DataNote 1 - OrganizationNote 2 - Summary Of Significant Accounting PoliciesNote 3 - Accumulated Other Comprehensive IncomeNote 4 - Investment SecuritiesNote 5 - Receivables, NetNote 6 - Property and Equipment, NetNote 7 - Intangible Assets, NetNote 8 - Long-term DebtNote 9 - Interest Rate SwapsNote 10 - Related Party TransactionsNote 11 - Property Charges and OtherNote 12 - Stockholders EquityNote 13 - Noncontrolling InterestNote 14 - Benefit PlansNote 15 - Stock-based CompensationNote 16 - Income TaxesNote 17 - Commitments and ContingenciesNote 18 - Segment InformationNote 19 - Quarterly Financial Information (unaudited)Note 20 - Subsequent EventsItem 9. Changes in and Disagreements with Accountants on Accounting and Financial DisclosureItem 9A. Controls and ProceduresItem 9B. Other InformationPart IIIItem 10. Directors, Executive Officers and Corporate GovernanceItem 11. Executive CompensationItem 12. Security Ownership Of Certain Beneficial Owners and Management and Related Stockholder MattersItem 13. Certain Relationships and Related Transactions, and Director IndependenceItem 14. Principal Accountant Fees and ServicesPart IVItem 15. Exhibits and Financial Statement SchedulesNote 1 - Basis Of PresentationNote 2 - Commitments and Contingencies