WYNN RESORTS LTD
10-Ks and 10-Qs
|
|
|
|
|
|
|
|
|
|
|
|
|
|
|
|
|
|
|
|
|
|
|
|
|
|
|
|
|
|
|
|
|
|
|
|
|
|
|
|
|
|
|
|
|
|
|
|
|
|
|
|
|
|
|
|
UNITED STATES
SECURITIES AND EXCHANGE COMMISSION
Washington, D.C. 20549
FORM 10-K
|
ý
|
ANNUAL REPORT PURSUANT TO SECTION 13 OR 15(d) OF THE SECURITIES EXCHANGE ACT OF 1934
|
|
For the fiscal year ended December 31, 2018
|
|
OR
|
¨
|
TRANSITION REPORT PURSUANT TO SECTION 13 OR 15(d) OF THE SECURITIES EXCHANGE ACT OF 1934
|
|
For the transition period
to
|
|
Commission File No. 000-50028
WYNN RESORTS, LIMITED
(Exact name of registrant as specified in its charter)
|
N
EVADA
|
46-0484987
|
|
|
(State or other jurisdiction of
incorporation or organization)
|
(I.R.S. Employer
Identification Number)
|
|
3131 Las Vegas Boulevard South—Las Vegas, Nevada 89109
(Address of principal executive offices) (Zip Code)
(702) 770-7555
(Registrant's telephone number, including area code)
Securities registered pursuant to Section 12(b) of the Act:
|
Title of Each Class
|
Name of Each Exchange on Which Registered
|
|
|
Common Stock, $0.01 par value
|
Nasdaq Global Select Market
|
|
Securities registered pursuant to Section 12(g) of the Act:
None
Indicate by check mark if the registrant is a well-known seasoned issuer, as defined in Rule 405 of the Securities Act. Yes
ý
No
¨
Indicate by check mark if the registrant is not required to file reports pursuant to Section 13 or Section 15(d) of the Act. Yes
¨
No
ý
Indicate by check mark whether the registrant (1) has filed all reports required to be filed by Section 13 or 15(d) of the Securities Exchange Act of 1934 during the preceding 12 months (or for such shorter period that the registrant was required to file such reports), and (2) has been subject to such filing requirements for the past 90 days. Yes
ý
No
¨
Indicate by check mark whether the registrant has submitted electronically every Interactive Data File required to be submitted pursuant to Rule 405 of Regulation S-T (§ 232.405 of this chapter) during the preceding 12 months (or for such shorter period that the registrant was required to submit such files). Yes
ý
No
¨
Indicate by check mark if disclosure of delinquent filers pursuant to Item 405 of Regulation S-K (§ 229.405 of this chapter) is not contained herein, and will not be contained, to the best of registrant's knowledge, in definitive proxy or information statements incorporated by reference in Part III of this Form 10-K or any amendment to this Form 10-K.
ý
Indicate by check mark whether the registrant is a large accelerated filer, an accelerated filer, a non-accelerated filer, a smaller reporting company, or an emerging growth company. See the definitions of "large accelerated filer," "accelerated filer," "smaller reporting company," and "emerging growth company" in Rule 12b-2 of the Exchange Act.
|
Large accelerated filer
|
ý
|
Accelerated filer
|
¨
|
|||
|
Non-accelerated filer
|
¨
|
Smaller reporting company
|
¨
|
|||
|
Emerging growth company
|
¨
|
|||||
If an emerging growth company, indicate by check mark if the registrant has elected not to use the extended transition period for complying with any new or revised financial accounting standards provided pursuant to Section 13(a) of the Exchange Act.
¨
Indicate by check mark whether the registrant is a shell company (as defined in Rule 12b-2 of the Exchange Act). Yes
¨
No
ý
The aggregate market value of the registrant's voting and non-voting common stock held by non-affiliates based on the closing price as reported on the Nasdaq Global Select Market on June 29,
2018
was approximately
$16.34 billion
.
As of February 15,
2019
, 107,635,436 shares of the registrant's Common Stock, $0.01 par value, were outstanding.
DOCUMENTS INCORPORATED BY REFERENCE
Portions of the registrant's Proxy Statement for its
2019
Annual Meeting of Stockholders to be filed not later than 120 days after the end of the fiscal year covered by this report are incorporated by reference into Part III of this Form 10-K.
WYNN RESORTS, LIMITED AND SUBSIDIARIES
FORM 10-K
TABLE OF CONTENTS
|
Item 1.
|
||
|
Item 1A.
|
||
|
Item 1B.
|
||
|
Item 2.
|
||
|
Item 3.
|
||
|
Item 4.
|
||
|
Item 5.
|
||
|
Item 6.
|
||
|
Item 7.
|
||
|
Item 7A.
|
||
|
Item 8.
|
||
|
Item 9.
|
||
|
Item 9A.
|
||
|
Item 9B.
|
||
|
Item 10.
|
||
|
Item 11.
|
||
|
Item 12.
|
||
|
Item 13.
|
||
|
Item 14.
|
||
|
Item 15.
|
||
|
Item 16.
|
||
2
PART I
Item 1. Business
Overview
Wynn Resorts, Limited ("Wynn Resorts," or together with its subsidiaries, "we" or the "Company") is a leading developer, owner and operator of destination casino resorts (integrated resorts) that integrate hotel accommodations and a wide range of amenities, including fine dining outlets, premium retail offerings, distinctive entertainment theaters and large meeting complexes.
We currently own approximately
72%
of Wynn Macau, Limited ("WML") and operate two integrated resorts in the Macau Special Administrative Region of the People's Republic of China ("Macau"), Wynn Palace and Wynn Macau (collectively, our "Macau Operations"). In Las Vegas, Nevada, we operate and, with the exception of certain retail space, own 100% of Wynn Las Vegas, which we also refer to as our Las Vegas Operations. We are also currently constructing Encore Boston Harbor, an integrated resort in Everett, Massachusetts, adjacent to Boston, which we expect to open in mid-2019.
We present the operating results of our three resorts in the following segments: Wynn Palace, Wynn Macau, and Las Vegas Operations.
Wynn Resorts, a Nevada corporation, was formed in 2002. Wynn Resorts files annual reports on Form 10-K, quarterly reports on Form 10-Q, current reports on Form 8-K and amendments of such reports with the Securities and Exchange Commission ("SEC"). Any document Wynn Resorts files may be inspected, without charge, at the SEC's internet site address at
http://www.sec.gov
. Information related to the operation of the SEC's public reference room may be obtained by calling the SEC at 1-800-SEC-0330. In addition, through our own internet address at
www.wynnresorts.com
, Wynn Resorts provides a hyperlink to a third-party SEC filing website which posts these filings as soon as reasonably practicable, where they can be reviewed without charge. The information found on our website is not a part of this Annual Report on Form 10-K or any other report we file or furnish to the SEC.
Our Resorts
Macau Operations
We opened Wynn Macau on September 6, 2006, Encore, an expansion of Wynn Macau, on April 21, 2010, and Wynn Palace on August 22, 2016. We operate our Macau Operations under a 20-year casino concession agreement granted by the Macau government in June 2002. We lease from the Macau government approximately 51 acres of land in the Cotai area of Macau where Wynn Palace is located and 16 acres of land in downtown Macau's inner harbor where Wynn Macau is located. See "Regulation and Licensing—Macau" for details on the casino concession agreement, and see "Item 2—Properties" for details on the land concession agreement.
Wynn Palace features the following as of
February 20, 2019
:
|
•
|
Approximately
424,000
square feet of casino space, offering 24-hour gaming and a full range of games with
320
table games and
1,041
slot machines, private gaming salons and sky casinos;
|
|
•
|
A luxury hotel tower with a total of
1,706
guest rooms, suites and villas;
|
|
•
|
13
food and beverage outlets;
|
|
•
|
Approximately
106,000
square feet of high-end, brand-name retail space;
|
|
•
|
Approximately
37,000
square feet of meeting and convention space;
|
|
•
|
Recreation and leisure facilities, including a gondola ride, health club, spa, salon and pool; and
|
|
•
|
Public attractions including a performance lake and floral art displays.
|
Wynn Macau features the following as of
February 20, 2019
:
|
•
|
Approximately
273,000
square feet of casino space, offering 24-hour gaming and a full range of games with
317
table games and
810
slot machines, private gaming salons, sky casinos and a poker pit;
|
|
•
|
Two luxury hotel towers with a total of
1,008
guest rooms and suites;
|
|
•
|
11
food and beverage outlets;
|
3
|
•
|
Approximately
59,000
square feet of high-end, brand-name retail space;
|
|
•
|
Approximately
31,000
square feet of meeting and convention space;
|
|
•
|
Recreation and leisure facilities, including
two
health clubs and full service spas, a salon and a pool; and
|
|
•
|
A rotunda show featuring a Chinese zodiac-inspired ceiling along with gold "prosperity tree" and "dragon of fortune" attractions.
|
In response to our evaluation of our Macau Operations and our commitment to creating a unique customer experience, we have made and expect to continue to make enhancements and refinements to these resorts.
Las Vegas Operations
We opened Wynn Las Vegas on April 28, 2005 and Encore, an expansion of Wynn Las Vegas, on December 22, 2008. Wynn Las Vegas is located at the intersection of the Las Vegas Strip and Sands Avenue, and occupies approximately 215 acres of land fronting the Las Vegas Strip. In addition, we own approximately 18 acres across Sands Avenue, a portion of which is utilized for employee parking and an office building, and approximately five acres adjacent to the golf course land upon which an office building is located.
Wynn Las Vegas features the following as of
February 20, 2019
:
|
•
|
Approximately
192,000
square feet of casino space, offering 24-hour gaming and a full range of games with
243
table games and
1,811
slot machines, private gaming salons, a sky casino, a poker room, and a race and sports book;
|
|
•
|
Two luxury hotel towers with a total of
4,748
guest rooms, suites and villas;
|
|
•
|
33
food and beverage outlets;
|
|
•
|
Approximately
160,000
square feet of high-end, brand-name retail space (the majority of which is owned and operated under a joint venture of which we own 50.1%);
|
|
•
|
Approximately
290,000
square feet of meeting and convention space;
|
|
•
|
Three
nightclubs and a beach club;
|
|
•
|
Recreation and leisure facilities, including swimming pools, private cabanas, two full service spas and salons, and a wedding chapel; and
|
|
•
|
A specially designed theater presenting "Le Rêve—The Dream," a water-based theatrical production and a theater presenting entertainment productions and various headliner entertainment acts.
|
In December 2016, we entered into a joint venture arrangement (the "Retail Joint Venture") with Crown Acquisitions Inc. ("Crown") to own and operate approximately
88,000
square feet of existing retail space. In November 2017, we contributed approximately
74,000
square feet of additional retail space to the Retail Joint Venture, which opened in November 2018. For more information on the Retail Joint Venture, see Item 8—"Financial Statements and Supplementary Data,"
Note 14
, "Retail Joint Venture."
In response to our evaluation of our Las Vegas Operations and our commitment to creating a unique customer experience, we have made and expect to continue to make enhancements and refinements to this resort.
Construction and Development Opportunities
We are currently constructing Encore Boston Harbor, an integrated resort in Everett, Massachusetts, adjacent to Boston along the Mystic River. The resort will contain a hotel, a waterfront boardwalk, meeting and convention space, casino space, a spa, retail offerings and food and beverage outlets. The total project budget, including gaming license fees, construction costs, capitalized interest, pre-opening expenses and land costs, is estimated to be approximately
$2.6 billion
. As of
December 31, 2018
, we have incurred approximately
$2.03 billion
in total project costs. We expect to open Encore Boston Harbor in mid-2019.
We are currently constructing approximately 430,000 square feet of additional meeting and convention space at Wynn Las Vegas and have begun design and site preparation for the reconfiguration of the Wynn Las Vegas golf course, which we closed in the fourth quarter of 2017. Based on current designs, we estimate the total project budget to be approximately
$425 million
. We
4
expect to reopen the golf course in the fourth quarter of 2019 and open the additional meeting and convention space in the first quarter of 2020.
We have begun a reconfiguration of the current Wynn Club gaming area at Wynn Macau. When completed, the enhanced space will consist of approximately 40 mass market table games, a refurbished high-limit slot area, two new restaurants and approximately
7,400
square feet of retail space, and will provide for improved pedestrian access. We estimate the total project budget to be approximately
$62 million
. We expect to complete the gaming enhancements and open the new restaurants in the third quarter of 2019, and we expect to open the new retail space at the end of 2019.
We are exploring various development opportunities with respect to the approximately 38 acres of land located on the Las Vegas Strip directly across from Wynn Las Vegas.
We continually seek out new opportunities for additional gaming or related businesses, in the United States, and worldwide.
Our Strategy
We believe that Wynn Resorts is the world's preeminent designer, developer, and operator of integrated resorts. The Company's integrated resort business model integrates luxury hotel rooms, high-end retail, an array of dining and entertainment options, meeting and convention space, and gaming, all supported by superior levels of customer service. We believe that our resorts and management continue to benefit from our extensive design and operational experience across numerous gaming jurisdictions, providing a distinct advantage over other gaming enterprises.
Wynn Resorts and its experienced management team have a demonstrated track record in developing and operating successful integrated resort projects around the world. In addition, we have a design, development and construction subsidiary, in which senior management has significant experience across all major construction disciplines.
We aim to build appropriately scaled integrated resorts that attract a wide range of customer segments (including premium international customers) and generate strong financial results. We design and continually refresh our integrated resorts to create unique customer experiences across a wide range of gaming and non-gaming amenities. Our business is dependent upon repeat visitation from our guests. We believe superior customer experience and service is the best marketing strategy to attract and retain our customers. Human resources and staff training are essential to our strategy to ensure our employees are prepared to provide the luxury service that our guests expect.
Our integrated resorts are conceptualized, designed, built and operated in major metropolitan markets to service all customers with an emphasis on providing superior levels of premium customer service. In Las Vegas and Macau, we have been successful in attracting not only a wide range of domestic guests, but also extending our customer market areas into international markets. We leverage our international marketing team across branch offices located in Hong Kong SAR, Singapore, Japan, Taiwan and Canada to attract international customers.
Reflecting our commitment to customer service globally, the Company has received the following recognition:
|
•
|
Collectively, Wynn Resorts earned more Five-Star awards than any other independent hotel company in the world in the official 2019 Forbes Travel Guide Star Rating list.
|
|
•
|
Wynn Palace garnered six individual Five-Star awards in the 2019 Forbes Travel Guide Star Rating list.
|
|
•
|
In 2019, Wynn Macau continues to be the only resort in the world with eight individual Forbes Five-Star awards.
|
|
•
|
With fourteen Forbes Five-Star awards combined, Wynn Macau and Wynn Palace are the most decorated integrated resort brands in Asia.
|
|
•
|
Wynn Resorts owns two of the largest Forbes Five-Star hotels in the United States: Wynn Tower Suites (Las Vegas) and Encore Tower Suites (Las Vegas).
|
|
•
|
Wynn Resorts was once again honored as the highest ranking casino resort on FORTUNE Magazine's 2019 World's Most Admired Companies list in the hotel, casino and resort category.
|
5
We plan to continue to seek out new opportunities to develop and operate integrated resorts, including related businesses, around the world. Overall, we believe Wynn Resorts has a demonstrated track record of developing integrated resorts that stimulate city- and region-wide economic activity, which we believe includes:
|
•
|
attracting a wide range of customers to the region, including high-net-worth international tourists;
|
|
•
|
driving international tourism for the region;
|
|
•
|
raising average hotel room rates in the region;
|
|
•
|
extending the average length of stay per visitor;
|
|
•
|
complementing existing convention and meeting business with five-star accommodations and appropriately scaled meeting amenities;
|
|
•
|
elevating service levels with the execution of five-star customer service; and
|
|
•
|
helping stimulate city-wide investment and employment.
|
Market and Competition
The casino resort industry is highly competitive. Both our Macau Operations and Las Vegas Operations compete with other high-quality casino resorts. Resorts located near our properties compete on the basis of the range of amenities, level of service, price, location, entertainment, themes and size, among other factors. We seek to differentiate our Macau and Las Vegas integrated resorts from other major resorts by delivering superior design and customer service.
Macau
Macau is governed as a special administrative region of China and is located approximately 37 miles southwest of Hong Kong. The journey between Macau and Hong Kong takes approximately 15 minutes by helicopter, 30 minutes by road since the opening of the Hong Kong-Zhuhai-Macau Bridge in October 2018 and one hour by jetfoil ferry. Macau, which has been a casino destination for more than 50 years, consists principally of a peninsula on mainland China and two neighboring islands, Taipa and Coloane, between which the Cotai area is located. In 2002, the government of Macau ended a 40-year monopoly on the conduct of gaming operations by conducting a competitive process that resulted in the issuance of gaming concessions to three concessionaires (including Wynn Resorts (Macau) S.A., ("Wynn Macau SA")) who in turn were permitted, subject to the approval of the government of Macau, to each grant one subconcession, resulting in a total of six gaming concessionaires and subconcessionaires. In addition to Wynn Macau SA, each of Sociedade de Jogos de Macau ("SJM") and Galaxy Entertainment Group Limited ("Galaxy") are primary concessionaires with Sands China Ltd. ("Sands"), Melco International Development Limited ("Melco") and MGM China Holdings Limited ("MGM China") operating under subconcessions. There is no limit to the number of casinos each concessionaire or subconcessionaire is permitted to operate, but each facility is subject to government approval. Currently, there are
41
casinos operating in Macau.
We believe that the Macau region hosts one of the world's largest concentrations of potential gaming customers. Since the introduction of new casinos starting in 2004, the Macau market has experienced a significant increase in annual gaming revenue and has become the largest gaming market in the world. According to Macau Statistical Information, annual gaming revenues have grown from
$2.9 billion
in
2002
to
$37.5 billion
in
2018
.
Macau's gaming market is primarily dependent on tourists. Gaming customers traveling to Macau typically come from nearby destinations in Asia. According to the Macau Statistics and Census Service Monthly Bulletin of Statistics, approximately
90%
of the visitors to Macau in
2018
came from mainland China, Hong Kong, and Taiwan. Travel to Macau by citizens of mainland China requires a visa.
According to
2018
government statistics, Macau tourist arrivals
increase
d
9.8%
, to
35.8 million
, from
32.6 million
in
2017
. The
increase
in tourist arrivals contributed to a
13.3%
increase
in annual gaming revenues to
$37.5 billion
in
2018
, from
$33.1 billion
in
2017
.
The Macau market has experienced tremendous growth in capacity since the opening of Wynn Macau in
2006
. As of December 31,
2018
, there were
38,800
hotel rooms
,
6,588
table games
and
16,059
slot machines
in Macau, compared to
12,978
hotel rooms
,
2,762
table games
and
6,546
slot machines
as of December 31,
2006
. During 2016, we contributed to the new capacity in the market with the opening of Wynn Palace in the Cotai area. Several of the current concessionaires and subconcessionaires
6
also opened additional facilities from 2016 through 2018 in the Cotai area and will open additional facilities over the next few years, which will further increase other gaming and non-gaming offerings in the Macau market.
Our Macau Operations face competition primarily from the
39
other casinos located throughout Macau in addition to casinos located throughout the world, including Singapore, South Korea, the Philippines, Malaysia, Australia, Las Vegas, cruise ships in Asia that offer gaming, and other casinos throughout Asia. Additionally, certain other Asian countries have legalized or in the future may legalize gaming, such as Japan, Taiwan and Thailand, which could increase competition for our Macau Operations.
Las Vegas
Las Vegas is the largest gaming market in the United States. During
2018
, the economic environment in the gaming and hotel markets improved in Las Vegas. Las Vegas Strip gaming revenues
increased
to
$6.6 billion
from
$6.5 billion
in
2017
. Overall Las Vegas visitor volume was 42.1 million in 2018. Passenger traffic at McCarran International Airport
increased
2.5%
in
2018
, following year-over-year
increase
s of
5.8%
,
4.5%
, and
2.2%
from
2015
to
2017
, respectively. During
2018
, the average daily room rate and revenue per available room on the Las Vegas Strip
increased
1.2%
and
0.6%
, respectively. Occupancy on the Las Vegas Strip slightly
decreased
0.5%
to
89.5%
, from
90.0%
in
2017
. Convention attendees
decreased
2.2%
in
2018
, following year-over-year
increase
s of
5.3%
,
7.1%
, and
13.4%
from
2015
to
2017
, respectively.
Wynn Las Vegas is located on the Las Vegas Strip and competes with other high-quality resorts and hotel casinos in Las Vegas. Wynn Las Vegas also competes, to some extent, with other casino resorts throughout the United States and elsewhere in the world.
Regulation and Licensing
Macau
As a casino concessionaire, Wynn Macau SA is subject to the regulatory control of the government of Macau. The government has adopted Laws and Administrative Regulations governing the operation of casinos in Macau. Only concessionaires or subconcessionaires are permitted to operate casinos. Subconcessions may be awarded subject to the approval of the Macau government and each concessionaire has issued one subconcession. Each concessionaire was required to enter into a concession agreement with the Macau government which, together with the Law and Administrative Regulations, form the framework for the regulation of the activities of the concessionaire.
Under the Law and Administrative Regulations, concessionaires are subject to suitability requirements relating to background, associations and reputation, as are stockholders of 5% or more of a concessionaire's equity securities, officers, directors and key employees. The same requirements apply to any entity engaged by a concessionaire to manage casino operations. Concessionaires are required to satisfy minimum capitalization requirements, demonstrate and maintain adequate financial capacity to operate the concession and submit to continuous monitoring of their casino operations by the Macau government. Concessionaires also are subject to periodic financial reporting requirements and reporting obligations with respect to, among other things, certain contracts, financing activities and transactions with directors, financiers and key employees. Transfers or the encumbering of interests in concessionaires must be reported to the Macau government and are ineffective without government approval.
Each concessionaire is required to engage an executive director who must be a permanent resident of Macau and the holder of at least 10% of the capital stock of the concessionaire. The appointment of the executive director and of any successor is ineffective without the approval of the Macau government. All contracts placing the management of a concessionaire's casino operations with a third party also are ineffective without the approval of the Macau government.
Concessionaires are subject to a special gaming tax of 35% of gross gaming revenue, and must also make an annual contribution of up to 4% of gross gaming revenue for the promotion of public interests, social security, infrastructure and tourism. Concessionaires are obligated to withhold applicable taxes, according to the rate in effect as set by the government, from any commissions paid to gaming promoters. The withholding rate may be adjusted from time to time.
The concession agreement between Wynn Macau SA and the Macau government required Wynn Macau SA to construct and operate one or more casino gaming properties in Macau, including, at a minimum, one full-service casino resort by the end of December 2006, and to invest not less than a total of 4 billion Macau patacas (approximately $500.0 million) in Macau-related projects by June 2009. These obligations were satisfied upon the opening of Wynn Macau in 2006.
7
Wynn Macau SA was also obligated to obtain, and did obtain, a 700.0 million Macau pataca (approximately $87.0 million) bank guarantee from Banco National Ultramarino, S.A. ("BNU") that was effective until March 31, 2007. The amount of this guarantee was reduced to 300 million Macau patacas (approximately $37.3 million) for the period from April 1, 2007 until 180 days after the end of the term of the concession agreement. This guarantee, which is for the benefit of the Macau government, assures Wynn Macau SA's performance under the casino concession agreement, including the payment of premiums, fines and indemnity for any material failure to perform the concession agreement. Wynn Macau SA is obligated, upon demand by BNU, to promptly repay any claim made on the guarantee by the Macau government. BNU is currently paid an annual fee by Wynn Macau SA for the guarantee of approximately 2.3 million patacas (approximately $0.3 million).
Effective June 24, 2017, the government of Macau may redeem the concession and in such event, Wynn Macau SA will be entitled to fair compensation or indemnity. The amount of such compensation or indemnity will be determined based on the amount of gaming and non-gaming revenue generated during the tax year prior to the redemption multiplied by the remaining years before expiration of the concession.
The government of Macau may unilaterally rescind the concession if Wynn Macau SA fails to fulfill its fundamental obligations under the concession agreement. The concession agreement expressly provides that the government of Macau may unilaterally rescind the concession agreement if Wynn Macau SA:
|
•
|
conducts unauthorized games or activities that are excluded from its corporate purpose;
|
|
•
|
abandons or suspends gaming operations in Macau for more than seven consecutive days (or more than 14 days in a civil year) without justification;
|
|
•
|
defaults in payment of taxes, premiums, contributions or other required amounts;
|
|
•
|
does not comply with government inspections or supervision;
|
|
•
|
systematically fails to observe its obligations under the concession system;
|
|
•
|
fails to maintain bank guarantees or bonds satisfactory to the government;
|
|
•
|
is the subject of bankruptcy proceedings or becomes insolvent;
|
|
•
|
engages in serious fraudulent activity, damaging to the public interest; or
|
|
•
|
repeatedly and seriously violates applicable gaming laws.
|
If the government of Macau unilaterally rescinds the concession agreement for one of the reasons stated above, Wynn Macau SA will be required to compensate the government in accordance with applicable law, and the areas defined as casino under Macau law and all of the gaming equipment pertaining to the gaming operations of Wynn Macau SA will be transferred to the government without compensation. In addition, the government of Macau may, in the public interest, unilaterally terminate the concession at any time, in which case Wynn Macau SA would be entitled to reasonable compensation.
The government of Macau may assume temporary custody and control over the operation of a concession in certain circumstances. During any such period, the costs of operations must be borne by the concessionaire. The government of Macau also may redeem a concession starting at an established date after the entering into effect of a concession.
The Macau government has publicly commented that it is studying the process by which gaming concessions and subconcessions may be extended, renewed or issued. The current term of our gaming concession ends on June 26, 2022. The gaming concession or subconcession held by each of Galaxy, Sands and Melco also end on June 26, 2022. The gaming concession or subconcession held by each of SJM and MGM China ends on March 31, 2020.
A gaming promoter, also known as a junket representative, is a person or entity who, for the purpose of promoting casino gaming activity, arranges customer transportation and accommodations, and provides credit in their sole discretion, food and beverage services and entertainment in exchange for commissions or other compensation from a concessionaire. Macau law provides that gaming promoters must be licensed by the Macau government in order to do business with and receive compensation from concessionaires. For a license to be obtained, direct and indirect owners of 5% or more of a gaming promoter (regardless of its corporate form or sole proprietor status), its directors and its key employees must be found suitable. Applicants are required to pay the cost of license investigations, and are required to maintain suitability standards during the period of licensure. The term of a gaming promoter's license is one calendar year, and licenses can be renewed for additional periods upon the submission of renewal applications. Natural person junket representative licensees are subject to a suitability verification process every three years and business entity licensees are subject to the same requirement every six years. Macau's Gaming Inspection and Coordination Bureau (the "DICJ") implemented certain instructions in 2009, which have the force of law, relating to commissions paid to, and by, gaming promoters. Such instructions also impose certain financial reporting and audit requirements on gaming promoters.
8
Under Macau law, licensed gaming promoters must identify outside contractors who assist them in their promotion activities, and these contractors are subject to approval of the Macau government. Changes in the management structure of business entity gaming promoters' licensees must be reported to the Macau government and any transfer or the encumbering of interests in such licensees is ineffective without prior government approval. To conduct gaming promotion activities, licensees must be registered with one or more concessionaires and must have written contracts with such concessionaires, copies of which must be submitted to the Macau government.
Macau law further provides that concessionaires are jointly responsible with their gaming promoters for the gaming activities of such representatives and their directors and contractors in the concessionaire's casinos, and for their compliance with applicable laws and regulations. Concessionaires must submit annual lists of their gaming promoters, and must update such lists on a quarterly basis. The Macau government may designate a maximum number of gaming promoters and specify the number of gaming promoters a concessionaire is permitted to engage. Concessionaires are subject to periodic reporting requirements with respect to commissions paid to their gaming promoters' representatives and are required to oversee their activities and report instances of unlawful activity.
In late 2015, the Macau government implemented enhanced accounting and financial procedures and requirements to be followed by gaming promoters. These enhanced procedures require gaming promoters to disclose more detailed financial and accounting information to the DICJ, including the disclosure of certain financial information on a monthly basis. Gaming promoters also must identify and nominate senior financial or accounting representatives to be available to the DICJ for any follow-up matters the DICJ may require. Local Macau media has reported that the DICJ is finalizing its proposal for additional regulations and enhanced requirements on gaming promoters that may come into effect in 2019.
Nevada
The ownership and operation of casino gaming facilities in the State of Nevada are subject to the Nevada Gaming Control Act and the regulations made thereunder, as well as to various local ordinances. Our Las Vegas Operations are subject to the licensing and regulatory control of the Nevada Gaming Commission ("NGC"), the Nevada Gaming Control Board (“NGCB”) and the Clark County Liquor and Gaming Licensing Board ("CCLGLB"). The NGC and NGCB are referred to herein collectively as the "Nevada Gaming Authorities."
The laws, regulations and supervisory procedures of the Nevada Gaming Authorities are based upon declarations of public policy. Such public policy concerns include, among other things:
|
•
|
preventing unsavory or unsuitable persons from being directly or indirectly involved with gaming at any time or in any capacity;
|
|
•
|
establishing and maintaining responsible accounting practices and procedures;
|
|
•
|
maintaining effective controls over the financial practices of licensees, including establishing minimum procedures for internal fiscal affairs and safeguarding assets and revenue, providing reliable recordkeeping and requiring the filing of periodic reports with the Nevada Gaming Authorities;
|
|
•
|
preventing cheating and fraudulent practices; and
|
|
•
|
providing a source of state and local revenue through taxation and licensing fees.
|
Changes in applicable laws, regulations and procedures could have significant negative effects on our Las Vegas gaming operations and our financial condition and results of operations.
Our subsidiary, Wynn Las Vegas, LLC, the owner and operator of Wynn Las Vegas, is licensed by the Nevada Gaming Authorities to conduct casino gaming operations, including a race book and sports pool, pari-mutuel wagering and the operation of gaming salons. These gaming licenses are not transferable.
Wynn Resorts was found suitable by the NGC to own the equity interests of Wynn Resorts Holdings, LLC ("Wynn Resorts Holdings"), a wholly owned subsidiary of Wynn Resorts, and to be registered by the NGC as a publicly traded corporation, referred to as a registered company, for the purposes of the Nevada Gaming Control Act. Wynn Resorts Holdings was found suitable by the NGC to own the equity interests of Wynn America, LLC ("Wynn America") and to be registered by the NGC as an intermediary company. Wynn America was found suitable by the NGC to own the equity interests of Wynn Las Vegas Holdings, LLC and to be registered by the NGC as an intermediary company. Wynn Las Vegas Holdings, LLC was found suitable by the NGC to own the equity interests of Wynn Las Vegas, LLC and to be registered by the NGC as an intermediary company.
9
Periodically, we are required to submit detailed financial and operating reports to the NGC and provide any other information that the NGC may require. Substantially all of our material loans, leases, sales of securities and similar financing transactions must be reported to, and/or approved by, the NGC.
No person may become a more than 5% stockholder or member of, or receive any percentage of the profits of, an intermediary company or company licensee without first obtaining licenses and approvals from the Nevada Gaming Authorities. The Nevada Gaming Authorities may investigate any individual who has a material relationship to or material involvement with us to determine whether the individual is suitable or should be licensed as a business associate of a gaming licensee. Certain of our officers, directors and key employees have been or may be required to file applications with the Nevada Gaming Authorities and are or may be required to be licensed or found suitable by the Nevada Gaming Authorities. The Nevada Gaming Authorities may require additional applications and may also deny an application for licensing for any reason which they deem appropriate. A finding of suitability is comparable to licensing, and both require submission of detailed personal and financial information followed by a thorough investigation. An applicant for licensing or an applicant for a finding of suitability must pay or must cause to be paid all the costs of the investigation. Changes in licensed positions must be reported to the Nevada Gaming Authorities and, in addition to their authority to deny an application for a finding of suitability or licensing, the Nevada Gaming Authorities have the jurisdiction to disapprove a change in a corporate position.
If the NGC determines that we or a licensed or registered subsidiary have violated the Nevada Gaming Control Act or any of its regulations, it could limit, condition, suspend or revoke our registrations and gaming license. In addition, we and the persons involved could be subject to substantial fines for each separate violation of the Nevada Gaming Control Act, or of the regulations of the NGC, at the discretion of the NGC. Further, the NGC could appoint a supervisor to operate our Las Vegas Operations and, under specified circumstances, earnings generated during the supervisor's appointment (except for the reasonable rental value of the premises) could be forfeited to the State of Nevada. The limitation, conditioning or suspension of any of our gaming licenses and the appointment of a supervisor could, and revocation of any gaming license would, have a significant negative effect on our gaming operations.
Any beneficial owner of Wynn Resorts' voting or nonvoting securities, regardless of the number of shares owned, may be required to file an application, be investigated and have that person's suitability as a beneficial owner of voting securities determined if the NGC has reason to believe that the ownership would be inconsistent with the declared policies of the State of Nevada. If the beneficial owner of the voting or nonvoting securities of Wynn Resorts who must be found suitable is a corporation, partnership, limited partnership, limited liability company or trust, it must submit detailed business and financial information, including a list of its beneficial owners. The applicant must pay all costs of the investigation incurred by the Nevada Gaming Authorities in conducting any investigation.
The Nevada Gaming Control Act requires any person who acquires more than 5% of our voting securities to report the acquisition to the NGC. The Nevada Gaming Control Act requires beneficial owners of more than 10% of a registered company's voting securities to apply to the NGC for a finding of suitability within 30 days after the Chairman of the NGCB mails the written notice requiring such filing. An “institutional investor” as defined in the Nevada Gaming Control Act which acquires more than 10%, but not more than 25%, of a registered company's voting securities may apply to the NGC for a waiver of a finding of suitability if the institutional investor holds the voting securities for investment purposes only. An institutional investor that has obtained a waiver may hold more than 25% but not more than 29% of a registered company's voting securities and maintain its waiver where the additional ownership results from a stock repurchase by the registered company. An institutional investor which beneficially owns more than 10% but not more than 11% of a registered company's voting securities as a result of a stock repurchase by the registered company may not be required to file such an application. An institutional investor will not be deemed to hold voting securities for investment purposes unless the voting securities were acquired and are held in the ordinary course of business as an institutional investor and not for the purpose of causing, directly or indirectly, the election of a majority of the members of the Board of Directors of the registered company, a change in the corporate charter, bylaws, management, policies or operations of the registered company, or any of its gaming affiliates, or any other action which the NGC finds to be inconsistent with holding the registered company's voting securities for investment purposes only. Activities which are not deemed to be inconsistent with holding voting securities for investment purposes only include:
|
•
|
voting on all matters voted on by stockholders or interest holders;
|
|
•
|
making financial and other inquiries of management of the type normally made by securities analysts for informational purposes and not to cause a change in management, policies or operations; and
|
|
•
|
other activities that the NGC may determine to be consistent with such investment intent.
|
The articles of incorporation of Wynn Resorts include provisions intended to assist its implementation of the above restrictions.
10
Wynn Resorts is required to maintain a current stock ledger in Nevada which may be examined by the Nevada Gaming Authorities at any time. If any securities are held in trust by an agent or by a nominee, the record holder may be required to disclose the identity of the beneficial owner to the Nevada Gaming Authorities. A failure to make the disclosure may be grounds for finding the record holder unsuitable. We are required to provide maximum assistance in determining the identity of the beneficial owner of any of Wynn Resorts' voting securities. The NGC has the power to require the stock certificates of any registered company to bear a legend indicating that the securities are subject to the Nevada Gaming Control Act. The certificates representing shares of Wynn Resorts' common stock note that the shares are subject to a right of redemption and other restrictions set forth in Wynn Resorts' articles of incorporation and bylaws and that the shares are, or may become, subject to restrictions imposed by applicable gaming laws.
Any person who fails or refuses to apply for a finding of suitability or a license within 30 days after being ordered to do so by the NGC or by the Chairman of the NGCB, or who refuses or fails to pay the investigative costs incurred by the Nevada Gaming Authorities in connection with the investigation of its application may be found unsuitable. The same restrictions apply to a record owner if the record owner, after request, fails to identify the beneficial owner. Any person found unsuitable and who holds, directly or indirectly, any beneficial ownership of any voting security or debt security of a registered company beyond the period of time as may be prescribed by the NGC may be guilty of a criminal offense. We will be subject to disciplinary action if, after we receive notice that a person is unsuitable to hold an equity interest or to have any other relationship with us, we:
|
•
|
pay that person any dividend or interest upon any voting securities;
|
|
•
|
allow that person to exercise, directly or indirectly, any voting right held by that person relating to Wynn Resorts;
|
|
•
|
pay remuneration in any form to that person for services rendered or otherwise; or
|
|
•
|
fail to pursue all lawful efforts to require the unsuitable person to relinquish such person's voting securities, including, if necessary, the immediate purchase of the voting securities for cash at fair market value.
|
If the Nevada Gaming Authorities were to find an officer, director or key employee unsuitable for licensing or unsuitable to continue having a relationship with us, we would have to sever all relationships with that person. In addition, the NGC may require us to terminate the employment of any person who refuses to file appropriate applications. Determinations of suitability or questions pertaining to licensing are not subject to judicial review in Nevada.
The NGC may, in its discretion, require the owner of any debt or similar securities of a registered company, to file applications, be investigated and be found suitable to own the debt or other securities of the registered company if the NGC has reason to believe that such ownership would otherwise be inconsistent with the declared policies of the State of Nevada. If the NGC decides that a person is unsuitable to own the securities, then under the Nevada Gaming Control Act, the registered company can be sanctioned, including the loss of its approvals if, without the prior approval of the NGC, it
|
•
|
pays to the unsuitable person any dividend, interest or any distribution whatsoever;
|
|
•
|
recognizes any voting right by the unsuitable person in connection with the securities;
|
|
•
|
pays the unsuitable person remuneration in any form; or
|
|
•
|
makes any payment to the unsuitable person by way of principal, redemption, conversion, exchange, liquidation or similar transaction.
|
We may not make a public offering (debt or equity) without the prior approval of the NGC if the proceeds from the offering are intended to be used to construct, acquire or finance gaming facilities in Nevada, or to retire or extend obligations incurred for those purposes or for similar transactions. On March 17, 2016, the NGC granted Wynn Resorts prior approval, subject to certain conditions, to make public offerings for a period of three years (the "Shelf Approval"). We have applied for a new Shelf Approval. The Shelf Approval may be rescinded for good cause without prior notice upon the issuance of an interlocutory stop order by the Chairman of the NGCB.
A registered company must obtain the prior approval of the NGC with respect to a change in control through merger; consolidation; stock or asset acquisitions; management or consulting agreements; or any act or conduct by a person by which the person obtains control of the registered company.
Entities seeking to acquire control of a registered company must satisfy the NGCB and NGC with respect to a variety of stringent standards before assuming control of the registered company. The NGC may also require controlling stockholders, officers,
11
directors and other persons having a material relationship or involvement with the entity proposing to acquire control to be investigated and licensed as part of the approval process relating to the transaction.
The Nevada legislature has declared that some corporate acquisitions opposed by management, repurchases of voting securities and corporate defense tactics affecting Nevada corporate gaming licensees or affecting registered companies that are affiliated with the operations of Nevada gaming licensees may be harmful to stable and productive corporate gaming. The NGC has established a regulatory scheme to reduce the potential adverse effects of these business practices upon Nevada's gaming industry and to further Nevada's policy in order to:
|
•
|
assure the financial stability of corporate gaming licensees and their affiliated companies;
|
|
•
|
preserve the beneficial aspects of conducting business in the corporate form; and
|
|
•
|
promote a neutral environment for the orderly governance of corporate affairs.
|
Approvals may be required from the NGC before a registered company can make exceptional repurchases of voting securities above its current market price and before a corporate acquisition opposed by management can be consummated. The Nevada Gaming Control Act also requires prior approval of a plan of recapitalization proposed by a registered company's board of directors in response to a tender offer made directly to its stockholders for the purpose of acquiring control.
License fees and taxes, computed in various ways depending on the type of gaming or activity involved, are payable to the State of Nevada and to the counties and cities in which the licensed subsidiaries' respective operations are conducted. Depending upon the particular fee or tax involved, these fees and taxes are payable monthly, quarterly or annually and are based upon a percentage of the gross revenue received; the number of gaming devices operated; or the number of table games operated. A live entertainment tax also is imposed on admission charges where live entertainment is furnished.
Any person who is licensed, required to be licensed, registered, required to be registered in Nevada, or is under common control with such persons (collectively, "licensees"), and who proposes to become involved in a gaming venture outside of Nevada, is required to deposit with the NGCB, and thereafter maintain, a revolving fund in the amount of $10,000 to pay the expenses of investigation of the NGCB of the licensee's or registrant's participation in such foreign gaming. The revolving fund is subject to increase or decrease at the discretion of the NGC. Licensees and registrants are required to comply with the foreign gaming reporting requirements imposed by the Nevada Gaming Control Act. A licensee or registrant is also subject to disciplinary action by the NGC if it:
|
•
|
knowingly violates any laws of the foreign jurisdiction pertaining to the foreign gaming operation;
|
|
•
|
fails to conduct the foreign gaming operation in accordance with the standards of honesty and integrity required of Nevada gaming operations;
|
|
•
|
engages in any activity or enters into any association that is unsuitable because it poses an unreasonable threat to the control of gaming in Nevada, reflects or tends to reflect, discredit or disrepute upon the State of Nevada or gaming in Nevada, or is contrary to the gaming policies of Nevada;
|
|
•
|
engages in activities or enters into associations that are harmful to the State of Nevada or its ability to collect gaming taxes and fees; or
|
|
•
|
employs, contracts with or associates with a person in the foreign operation who has been denied a license or finding of suitability in Nevada on the ground of unsuitability.
|
The conduct of gaming activities and the service and sale of alcoholic beverages at Wynn Las Vegas are subject to licensing, control and regulation by the CCLGLB, which has granted Wynn Las Vegas, LLC licenses for such purposes. In addition to approving Wynn Las Vegas, LLC, the CCLGLB has the authority to approve all persons owning or controlling the stock of any corporation controlling a gaming license. Certain of our officers, directors and key employees have been or may be required to file applications with the CCLGLB. Clark County gaming and liquor licenses are not transferable. The County has full power to limit, condition, suspend or revoke any license. Any disciplinary action could, and revocation would, have a substantial negative impact on our operations.
Massachusetts
The Massachusetts Expanded Gaming Act and the regulations promulgated thereunder (collectively the “Massachusetts Act”) subjects the owners and operators of gaming establishments to extensive state licensing and regulatory requirements. We are subject to the Massachusetts Act through our ownership interest in Wynn MA, LLC, (“Wynn MA”) which is expected to operate Encore Boston Harbor currently scheduled for completion and opening in mid-2019.
12
The Massachusetts Act is designed to provide significant benefits to the Commonwealth of Massachusetts by advancing job creation and economic development. The Massachusetts Act allows for up to three destination resort casinos (“Category 1 license”) located in three geographically diverse regions across the Commonwealth and a single slots facility, not pegged to any particular region. The licensing fee for each resort casino is $85 million and requires a capital investment, to include a hotel facility, of at least $500 million. The Commonwealth will receive 25% of gross gaming revenues.
The Massachusetts Gaming Commission (“MGC”) is responsible for issuing licenses under the Massachusetts Act and assuring that licenses are not issued or held by unqualified, disqualified or unsuitable persons. The MGC, in particular its Investigations and Enforcement Bureau (“IEB”), has extensive authority to conduct background investigations and to determine whether applicants for Category 1 licenses, affiliated holding or intermediary companies, subsidiaries, directors, managers, officers, financiers and debt holders, associates, key gaming executives and employees, other gaming related employees, and other persons or entities holding a five percent or greater direct or indirect interest in the applicant, are qualified under the Massachusetts Act (with certain exemptions for institutional investors in the discretion of the Massachusetts Commission).
On December 27, 2013, the MGC determined that Wynn MA and all applicable principal individuals and entities were qualified and on September 17, 2014, designated Wynn MA the award winner of the Greater Boston (Region A) gaming license effective November 7, 2014. Wynn Resorts, its relevant subsidiaries, and individual qualifiers required to be qualified were found suitable by the MGC. Additional entities and key employees have been and will be required to file applications with the MGC and are or may be required to be licensed or found suitable by the MGC. A finding of suitability is comparable to licensing, and both require submission of detailed personal and financial information followed by a thorough investigation. Changes in licensed positions must be reported to the MGC.
If the MGC were to find an officer, director or key employee unsuitable for licensing or unsuitable to continue having a relationship with us, we would have to sever all relationships with that person. In addition, the MGC may require us to terminate the employment of any person who refuses to file appropriate applications.
While a Category 1 license has been awarded to Wynn MA, Wynn MA may not conduct gaming activities until an operations certificate has been issued by the MGC, which will be issued upon compliance with applicable provisions of the Massachusetts Act, receipt of all required permits and approvals, compliance with the conditions of Wynn MA’s Category 1 license, and Wynn MA continuing to meet applicable licensing, registration, qualification and other regulatory requirements.
The MGC has responsibility for the continuing regulation and licensing of the licensee and its officers, directors, employees and other designated persons. The MGC retains the authority to suspend, revoke or condition a Category 1 license, or any other license issued under the Massachusetts Act, and the IEB may levy civil penalties for regulatory and other violations. All licenses issued under the Massachusetts Act are expressly deemed a revocable privilege, conditioned on the licensee’s fulfillment of all conditions of licensure, compliance with applicable laws and regulations, and the licensee’s continuing qualification and suitability. Among other things, the MGC is also responsible for the collection of application, license and other fees, conducting investigations of and monitoring applicants and licensees, and reviewing and ruling on complaints, and may conduct inspections of the gaming establishment premises or the licensee’s records and equipment.
Pursuant to the Massachusetts Act, the MGC may grant a gaming beverage license for the sale and distribution of alcoholic beverages for a gaming establishment. The division of gaming liquor enforcement of the Alcoholic Beverage Control Commission has the authority to enforce, regulate and control the distribution of alcoholic beverages in a gaming establishment. The MGC may revoke, suspend, refuse to renew or refuse to transfer a gaming beverage license for violations of the Massachusetts Act that pertain to the sale and distribution of alcohol consumed on the premises and the regulations adopted by the MGC. The MGC has adopted regulations for the issuance of gaming beverage licenses. These regulations and any changes in applicable laws, regulations and procedures could have significant negative effects on our future Massachusetts gaming operations and results of operations.
13
Other Regulations
In addition to gaming regulations, we are subject to extensive local, state, federal and foreign laws and regulations in the jurisdictions in which we operate. These include, but are not limited to, laws and regulations relating to alcoholic beverages, environmental matters, employment and immigration, currency and other transactions, taxation, zoning and building codes, marketing and advertising, lending, debt collection, privacy, telemarketing, money laundering, laws and regulations administered by the Office of Foreign Assets Control, and anti-bribery laws, including the Foreign Corrupt Practices Act (the "FCPA"). Such laws and regulations could change or could be interpreted differently in the future, or new laws and regulations could be enacted. Any material changes, new laws or regulations, or material differences in interpretations by courts or governmental authorities could adversely affect our business and operating results.
Seasonality
We may experience fluctuations in revenues and cash flows from month to month; however, we do not believe that our business is materially impacted by seasonality.
Employees
As of
December 31, 2018
, we had approximately
26,000
employees (including approximately
13,700
in Macau and
12,300
in the United States).
Our collective bargaining agreement with the Culinary and Bartenders Union, which covers approximately
5,700
employees at Wynn Las Vegas, expires in July 2021. Our collective bargaining agreement with the Transportation Workers Union, Local 721, which covers approximately
410
of our table games dealers at the Wynn Las Vegas casino, expires in November 2020. On February 19, 2019, the United Auto Workers Union filed a petition with the National Labor Relations Board seeking to replace the Transportation Workers Union as the bargaining representative for the table games dealers. An election will be held in March 2019 to make that determination. In December 2018, employees in the horticulture and transportation departments at Wynn Las Vegas voted to be represented by the International Brotherhood of Teamsters, and the Company is in the process of negotiating a collective bargaining agreement which would cover approximately
190
employees.
Intellectual Property
Among our most important marks are our trademarks and service marks that use the name "WYNN." Wynn Resorts has registered with the U.S. Patent and Trademark Office ("PTO") a variety of WYNN-related trademarks and service marks in connection with a variety of goods and services.
We have also filed applications with various foreign patent and trademark registries, including in Macau, China, Singapore, Hong Kong, Taiwan, Japan, certain European countries and various other jurisdictions throughout the world, to register a variety of WYNN-related trademarks and service marks in connection with a variety of goods and services.
We recognize that our intellectual property assets, including the word and logo version of "WYNN," are among our most valuable assets. As a result, and in connection with expansion of our resorts and gaming activities outside the United States, we have undertaken a program to register our trademarks and other intellectual property rights in relevant jurisdictions. We have retained counsel and intend to take all steps necessary to protect our intellectual property rights against unauthorized use throughout the world.
Pursuant to the Surname Rights Agreement, dated August 6, 2004, Stephen A. Wynn ("Mr. Wynn") granted us our exclusive, fully paid-up, perpetual, worldwide license to use, and to own and register trademarks and service marks incorporating the "Wynn" surname for casino resorts and related businesses, together with the right to sublicense the name and marks to its affiliates. Pursuant to a separation agreement, dated February 15, 2018, by and between Mr. Wynn and the Company, if we cease to use the "Wynn" surname and trademark, we will assign all of our right, title, and interest in the "Wynn" trademark to Mr. Wynn
and terminate the Surname Rights Agreement.
We have also registered various domain names with various domain registrars around the world. Our domain registrations extend to various foreign jurisdictions such as ".com.cn" and ".com.hk." We pursue domain related infringement on a case by case basis depending on the infringing domain in question. The information found on these websites is not a part of this Annual Report on Form 10-K or any other report we file or furnish to the SEC.
14
For more information regarding the Company's intellectual property matters, see
Item 1A
—"Risk Factors."
Forward-Looking Statements
We make forward-looking statements in this Annual Report on Form 10-K based upon the beliefs and assumptions of our management and on information currently available to us. Forward-looking statements include, but are not limited to, information about our business strategy, development activities, competition and possible or assumed future results of operations, throughout this report and are often preceded by, followed by or include the words "may," "will," "should," "would," "could," "believe," "expect," "anticipate," "estimate," "intend," "plan," "continue" or the negative of these terms or similar expressions.
Forward-looking statements are subject to a number of risks and uncertainties that could cause actual results to differ materially from those we express in these forward-looking statements, including the risks and uncertainties in
Item 1A
—"
Risk Factors
" and other factors we describe from time to time in our periodic filings with the SEC, such as:
|
•
|
controversy, regulatory action, litigation and investigations related to Mr. Wynn and his separation from the Company;
|
|
•
|
extensive regulation of our business (including the Chinese government's ongoing anti-corruption campaign) and the cost of compliance or failure to comply with applicable laws and regulations;
|
|
•
|
pending or future legal proceedings, regulatory or enforcement actions or probity investigations (including those related to the former Chairman and CEO of the Company);
|
|
•
|
our ability to maintain our gaming licenses and concessions;
|
|
•
|
our dependence on key employees;
|
|
•
|
general global political and economic conditions, in the U.S. and China, which may impact levels of travel, leisure and consumer spending;
|
|
•
|
restrictions or conditions on visitation by citizens of mainland China to Macau;
|
|
•
|
the impact on the travel and leisure industry from factors such as an outbreak of an infectious disease, extreme weather patterns or natural disasters, military conflicts and any future security alerts and/or terrorist attacks;
|
|
•
|
doing business in foreign locations such as Macau;
|
|
•
|
our ability to maintain our customer relationships and collect and enforce gaming receivables;
|
|
•
|
our relationships with Macau gaming promoters;
|
|
•
|
outcome of any ongoing and future litigation;
|
|
•
|
our dependence on a limited number of resorts and locations for all of our cash flow and our subsidiaries' ability to pay us dividends and distributions;
|
|
•
|
competition in the casino/hotel and resort industries and actions taken by our competitors, including new development and construction activities of competitors;
|
|
•
|
factors affecting the development and success of new gaming and resort properties (including limited labor resources, government labor and gaming policies and transportation infrastructure in Macau; and cost increases, environmental regulation, and our ability to secure necessary permits and approvals in Everett, Massachusetts);
|
|
•
|
construction risks (including disputes with and defaults by contractors and subcontractors; construction, equipment or staffing problems; shortages of materials or skilled labor; environment, health and safety issues; and unanticipated cost increases);
|
|
•
|
legalization of gaming in other jurisdictions;
|
|
•
|
any violations by us of the anti-money laundering laws or Foreign Corrupt Practices Act;
|
|
•
|
changes in gaming laws or regulations;
|
|
•
|
changes in federal, foreign, or state tax laws or the administration of such laws;
|
|
•
|
continued compliance with all provisions in our debt agreements;
|
|
•
|
conditions precedent to funding under our credit facilities;
|
|
•
|
leverage and debt service (including sensitivity to fluctuations in interest rates);
|
|
•
|
cybersecurity risk, including misappropriation of customer information or other breaches of information security;
|
|
•
|
data privacy risk, including reputational harm from mishandling private data and penalties for non-compliance with data collection and privacy laws;
|
|
•
|
our ability to protect our intellectual property rights; and
|
|
•
|
our current and future insurance coverage levels.
|
Further information on potential factors that could affect our financial condition, results of operations and business are included in this report and our other filings with the SEC. You should not place undue reliance on any forward-looking statements,
15
which are based only on information available to us at the time this statement is made. We undertake no obligation to update or revise any forward-looking statement, whether as a result of new information, future developments or otherwise.
Item 1A. Risk Factors
You should carefully consider the risk factors set forth below, as well as the other information contained in this Annual Report on Form 10-K, regarding matters that could have an adverse effect, including a material one, on our business, financial condition, results of operations and cash flows. Additional risks and uncertainties not currently known to us or that we currently deem to be immaterial may also have a material adverse effect on our business, financial condition, results of operations and cash flows.
Risks Related to our Business
The controversy, regulatory action, litigation and investigations related to Stephen A. Wynn and his separation from the Company could significantly harm our business.
On February 6, 2018, Mr. Wynn resigned as CEO and Chairman of the Board of Directors after allegations of inappropriate personal conduct by Mr. Wynn in the workplace were reported in a January 26, 2018 Wall Street Journal article. The resulting controversy related to Mr. Wynn and his separation from the Company could significantly harm our business in numerous ways, including in ways that we cannot predict.
As discussed elsewhere in this Form 10-K, our gaming regulators in Massachusetts and Nevada have investigated the situation. Our Nevada gaming regulators have completed their investigation and, on February 26, 2019, fined the Company $20.0 million. Each of our regulatory authorities has extensive power to license and oversee the operations of our casino resorts and could take action against the Company and its related licensees, including actions that could affect the ability or terms upon which our subsidiaries hold their gaming licenses and concessions, and the suitability of the Company to continue as a stockholder of those subsidiaries. As discussed in Item 3—"Legal Proceedings" and
Item 8
—"Financial Statements and Supplementary Data,"
Note 15
, "Commitments and Contingencies," lawsuits have been filed against the Company and our Board of Directors arising out of the allegations against Mr. Wynn, and such claims present a number of risks, including distraction of management, assertions that could affect our reputation, and potential legal liabilities. Additional allegations have been and may in the future be asserted against the Company, and additional regulatory or legal proceedings involving the Company may be commenced in the future. In addition, the Company's integrated resort business model was pioneered by Mr. Wynn. Our business, reputation, and competitive position may now suffer as a result of our prior association with Mr. Wynn, or as a result of his separation from the Company and the loss of his skills and experience.
We are subject to extensive state and local regulation, and licensing and gaming authorities have significant control over our operations. The cost of compliance or failure to comply with such regulations and authorities could have a negative effect on our business.
The operations of our resorts are contingent upon our obtaining and maintaining all necessary licenses, permits, approvals, registrations, findings of suitability, orders and authorizations in the jurisdictions in which our resorts are located. The laws, regulations and ordinances requiring these licenses, permits and other approvals generally relate to the responsibility, financial stability and character of the owners and managers of gaming operations, as well as persons financially interested or involved in gaming operations. The NGC may require the holder of any debt or securities that we or Wynn Las Vegas, LLC issue to file applications, be investigated and be found suitable to own Wynn Resorts' securities if it has reason to believe that the security ownership would be inconsistent with the declared policies of the State of Nevada.
The Company's articles of incorporation provide that, to the extent required by the gaming authority making the determination of unsuitability or to the extent the Board of Directors determines, in its sole discretion, that a person is likely to jeopardize the Company's or any affiliate's application for, receipt of, approval for, right to the use of, or entitlement to, any gaming license, shares of Wynn Resorts' capital stock that are owned or controlled by such unsuitable person or its affiliates are subject to redemption by Wynn Resorts. The redemption price may be paid in cash, by promissory note, or both, as required, and pursuant to the terms established by the applicable gaming authority and, if not, as Wynn Resorts elects.
Nevada and Massachusetts regulatory authorities have broad powers to request detailed financial and other information, to limit, condition, suspend or revoke a registration, gaming license or related approvals; approve changes in our operations; and levy fines or require forfeiture of assets for violations of gaming laws or regulations. Complying with gaming laws, regulations and license requirements is costly. Any change in the Nevada and Massachusetts laws, regulations or licenses applicable to our business or a violation of any current or future laws or regulations applicable to our business or gaming licenses could require us to make substantial expenditures and forfeit assets, and would negatively affect our gaming operations.
16
Our Macau Operations are subject to unique risks. Failure to adhere to the regulatory and gaming environment in Macau could result in the revocation of our Macau Operations' concession or otherwise negatively affect its operations in Macau. Moreover, we are subject to the risk that U.S. regulators could determine that Macau's gaming regulatory framework has not developed in a way that would permit us to conduct operations in Macau in a manner consistent with the way in which we intend, or the applicable U.S. gaming authorities require us, to conduct our operations in the United States.
As discussed in Item 8—"Financial Statements and Supplementary Data," Note 15, "Commitments and Contingencies," in connection with the allegations of inappropriate personal conduct by Mr. Wynn in the workplace reported in a January 26, 2018 Wall Street Journal article, gaming regulators in Massachusetts and Nevada conducted investigations. Our Nevada gaming regulators have completed their investigation and, on February 26, 2019, fined the Company $20.0 million. Each of these regulatory authorities has extensive power to license and oversee the operations of our casino resorts and has taken action and could take action against the Company and its related licensees, including actions that could affect the ability or terms upon which our subsidiaries hold their gaming licenses and concessions, and the suitability of the Company to continue as a stockholder of those affiliates.
Ongoing investigations, litigation and other disputes could distract management and result in negative publicity and additional scrutiny from regulators.
On January 26, 2018, the Company's Board of Directors formed a Special Committee comprised solely of independent directors to investigate allegations of inappropriate personal conduct by Mr. Wynn in the workplace. On February 12, 2018, the Special Committee amended and restated its charter to provide for a review of various governance issues regarding knowledge of the allegations and a comprehensive review of the Company's internal policies and procedures with the goal of employing best practices to maintain a safe and respectful workplace for all employees. On August 3, 2018, the Board received the final oral presentation from the Special Committee. The Special Committee provided a written memorialization to the Company's gaming regulators in Massachusetts and Nevada to cooperate with their respective investigations. Our Nevada gaming regulators have completed their investigation and, on February 26, 2019, fined the Company $20.0 million.
As discussed in Item 3—"Legal Proceedings" and Item 8—"Financial Statements and Supplementary Data,"
Note 15
, "Commitments and Contingencies," lawsuits have been filed against the Company and our Board of Directors arising out of the allegations against Mr. Wynn, and such claims present a number of risks, including distraction of management, assertions that could affect our reputation, and potential legal liabilities. Additional allegations have been and may in the future be asserted against Mr. Wynn and/or the Company, and additional regulatory or legal proceedings involving the Company may be commenced in the future.
The foregoing investigations, litigation and other disputes and any additional such matters that may arise in the future, can be expensive and may divert management's attention from the operations of our businesses. The investigations, litigation and other disputes may also lead to additional scrutiny from regulators, which could lead to investigations relating to, and possibly a negative impact on, the Company's gaming licenses and the Company's ability to bid successfully for new gaming market opportunities. In addition, the actions, litigation and publicity could negatively impact our business, reputation and competitive position and could reduce demand for shares of Wynn Resorts and WML and thereby have a negative impact on the trading prices of their respective shares.
We depend on the continued services of key managers and employees. If we do not retain our key personnel or attract and retain other highly skilled employees, our business will suffer.
Our ability to maintain our competitive position is dependent to a large degree on the services of our senior management team. The loss of services of our senior managers or the inability to attract and retain additional senior management personnel could have a material adverse effect on our business.
Our business is particularly sensitive to reductions in discretionary consumer and corporate spending as a result of global economic conditions.
Consumer demand for casino/hotel resorts, trade shows and conventions and for the type of luxury amenities that we offer is particularly sensitive to changes in the global economy, which adversely impact discretionary spending on leisure activities. Changes in discretionary consumer spending or consumer preferences brought about by factors such as perceived or actual general global economic conditions, high unemployment, weakness in housing or oil markets, perceived or actual changes in disposable
17
consumer income and wealth, an economic recession and changes in consumer confidence in the global economy, or fears of war and future acts of terrorism have in the past and could in the future reduce customer demand for the luxury amenities and leisure activities we offer, and may have a significant negative impact on our operating results.
Also, consumer demographics and preferences may evolve over time, which, for example, has resulted in growth in consumer demand for non-gaming offerings. Our success depends in part on our ability to anticipate the preferences of consumers and react to those trends and any failure to do so may negatively impact our operating results.
Demand for our products and services in Macau and Las Vegas may be negatively impacted by international relations, economic disruptions in mainland China, visa restrictions placed on citizens of mainland China, the anti-corruption campaign, restrictions on international money transfers or similar campaigns.
A significant amount of our gaming revenues in Macau and Las Vegas come from customers from mainland China. Economic disruption, international relations, contraction and uncertainty in China could impact the number of patrons visiting our Macau and Las Vegas properties or the amount they spend. In addition, policies adopted from time to time by governments, including any travel restrictions imposed on Chinese citizens such as restrictions imposed on exit visas or restrictions on United States visitor visas, could disrupt the number of visitors from mainland China to our properties. It is not known when, or if, policies restricting visitation by mainland Chinese citizens will be put in place and such policies may be adjusted, without notice, in the future. Furthermore, the Chinese government's continuing anti-corruption campaign has influenced the behavior of Chinese consumers and their spending patterns both domestically and abroad. That campaign, as well as mainland Chinese and Macau monetary outflow policies have specifically led to tighter monetary transfer regulations, real-time monitoring of certain financial channels, limitations on cash withdrawals from ATM machines by mainland China citizens, reduction of annual withdrawal limits from bank accounts while the account holder is outside of mainland China, and "know your client" protocols implemented on ATM machines. These policies may affect and impact the number of visitors and the amount of money they spend. The overall effect of the campaign and monetary transfer restrictions may negatively affect our revenues and results of operations.
Our business is particularly sensitive to the willingness of our customers to travel to and spend time at our resorts. Acts or the threat of acts of terrorism, regional political events and developments in certain countries could cause severe disruptions in air and other travel and may otherwise negatively impact tourists' willingness to visit our resorts. Such events or developments could reduce the number of visitors to our facilities, resulting in a material adverse effect on our business and financial condition, results of operations or cash flows.
We are dependent on the willingness of our customers to travel. Only a small amount of our business is and will be generated by local residents. Most of our customers travel to reach our Las Vegas and Macau properties. Acts of terrorism or concerns over the possibility of such acts may severely disrupt domestic and international travel, which would result in a decrease in customer visits to Las Vegas and Macau, including our properties. Regional conflicts could have a similar effect on domestic and international travel. Disruptions in air or other forms of travel as a result of any terrorist act, outbreak of hostilities, escalation of war or worldwide infectious disease outbreak would have an adverse effect on our business and financial condition, results of operations and cash flows.
Furthermore, the attack in Las Vegas on October 1, 2017 underscores the possibility that large public facilities could become the target of mass shootings or other attacks in the future. The occurrence or the possibility of attacks could cause all or portions of affected properties to be shut down for prolonged periods, resulting in a loss of income; generally reduce travel to affected areas for tourism and business or adversely affect the willingness of customers to stay in or avail themselves of the services of the affected properties; expose us to a risk of monetary claims arising from death, injury or damage to property caused by any such attack; and result in higher costs for security and insurance premiums, all of which could adversely affect our results.
Our continued success depends on our ability to maintain the reputation of our resorts.
Our strategy and integrated resort business model rely on positive perceptions of our resorts and the level of service we provide. Any deterioration in our reputation could have a material adverse effect on our business, results of operations and cash flows. Our reputation could be negatively impacted by our failure to deliver the superior design and customer service for which we are known or by events that are beyond our control. Our reputation may also suffer as a result of negative publicity regarding the Company or our resorts, including as a result of social media reports, regardless of the accuracy of such publicity. The continued expansion of media and social media formats has compounded the potential scope of negative publicity and has made it more difficult to control and effectively manage negative publicity.
18
We are entirely dependent on a limited number of resorts for all of our cash flow, which subjects us to greater risks than a gaming company with more operating properties.
We are currently entirely dependent upon our Macau Operations and Las Vegas Operations for all of our operating cash flow. As a result, we are subject to a greater degree of risk than a gaming company with more operating properties or greater geographic diversification. The risks to which we have a greater degree of exposure include the following:
|
•
|
changes in local economic and competitive conditions;
|
|
•
|
changes in local and state governmental laws and regulations, including gaming laws and regulations, and the way in which those laws and regulations are applied;
|
|
•
|
natural and other disasters, including the outbreak of infectious diseases;
|
|
•
|
an increase in the cost of maintaining our properties;
|
|
•
|
a decline in the number of visitors to Las Vegas or Macau; and
|
|
•
|
a decrease in gaming and non-casino activities at our resorts.
|
Any of the factors outlined above could negatively affect our results of operations and our ability to generate sufficient cash flow to make payments or maintain our covenants with respect to our debt.
We are a parent company and our primary source of cash is and will be distributions from our subsidiaries.
We are a parent company with limited business operations of our own. Our main asset is the capital stock of our subsidiaries. We conduct most of our business operations through our direct and indirect subsidiaries. Accordingly, our primary sources of cash are dividends and distributions with respect to our ownership interests in our subsidiaries that are derived from the earnings and cash flow generated by our operating properties. Our subsidiaries might not generate sufficient earnings and cash flow to pay dividends or distributions in the future.
Our subsidiaries' payments to us will be contingent upon their earnings and upon other business considerations. In addition, our subsidiaries' debt instruments and other agreements limit or prohibit certain payments of dividends or other distributions to us. We expect that future debt instruments for the financing of our other developments will contain similar restrictions. An inability of our subsidiaries to pay us dividends and distributions would have a significant negative effect on our liquidity.
Our casino, hotel, convention and other facilities face intense competition, which may increase in the future.
The casino/hotel industry is highly competitive. We hold a concession under one of only three gaming concessions and three subconcessions authorized by the Macau government to operate casinos in Macau. The Macau government has had the ability to grant additional gaming concessions since April 2009. If the Macau government were to allow additional competitors to operate in Macau through the grant of additional concessions or subconcessions, we would face additional competition, which could have a material adverse effect on our business, financial condition, results of operations and cash flows. Several of the current concessionaires and subconcessionaires have opened facilities in the Cotai area over the past few years, which has significantly increased gaming and non-gaming offerings in Macau, with continued development and further openings in Cotai expected in the near future.
Our Macau Operations face competition from casinos located in Singapore, the Philippines and Malaysia. We also encounter competition from other major gaming centers located around the world, including Australia and Las Vegas, cruise ships in Asia that offer gaming, and other casinos throughout Asia. Further, if current efforts to legalize gaming in other Asian countries, such as Japan, are successful, we will face additional regional competition.
Our Las Vegas Operations compete with other Las Vegas Strip hotels and with other hotel casinos in Las Vegas on the basis of overall atmosphere, range of amenities, level of service, price, location, entertainment, theme and size, among other factors. Wynn Las Vegas also competes with other casino/hotel facilities in other cities. The proliferation of gaming activities in other areas could significantly harm our business as well. In particular, the legalization or expansion of casino gaming in or near metropolitan areas from which we attract customers could have a negative effect on our business. In addition, new or renovated casinos in Macau or elsewhere in Asia could draw Asian gaming customers away from Wynn Las Vegas.
Increased competition could result in a loss of customers, which may negatively affect our cash flows and results of operations.
19
Our business relies on premium, international customers. We often extend credit, and we may not be able to collect gaming receivables from our credit players or credit play may decrease.
General.
A significant portion of our table games revenue at our resorts is attributable to the play of a limited number of premium international customers. The loss or a reduction in the play of the most significant of these customers could have a material adverse effect on our business, financial condition, results of operations and cash flows. A downturn in economic conditions in the countries in which these customers reside could cause a reduction in the frequency of visits by and revenue generated from these customers.
We conduct our gaming activities on a credit as well as a cash basis. The casino credit we extend is generally unsecured and due on demand. We will extend casino credit to those customers whose level of play and financial resources, in the opinion of management, warrant such an extension. The collectability of receivables from international customers could be negatively affected by future business or economic trends or by significant events in the countries in which these customers reside.
Macau Operations.
Although the law in Macau permits casino operators to extend credit to gaming customers, our Macau Operations may not be able to collect all of its gaming receivables from its credit players. We expect that our Macau Operations will be able to enforce these obligations only in a limited number of jurisdictions, including Macau. To the extent our gaming customers are visitors from other jurisdictions, we may not have access to a forum in which we will be able to collect all of our gaming receivables because, among other reasons, courts of many jurisdictions do not enforce gaming debts and we may encounter forums that will refuse to enforce such debts. Our inability to collect gaming debts could have a significant negative impact on our operating results.
Currently, the gaming tax in Macau is calculated as a percentage of gross gaming revenue, including the face value of credit instruments issued. As a result, if we extend credit to our customers in Macau and are unable to collect on the related receivables from them, we remain obligated to pay taxes on the full amount of the credit instrument.
Las Vegas Operations.
While gaming debts evidenced by a credit instrument, including what is commonly referred to as a "marker," are enforceable under the current laws of Nevada, and judgments on gaming debts are enforceable in all states of the United States under the Full Faith and Credit Clause of the United States Constitution, other jurisdictions may determine that direct or indirect enforcement of gaming debts is against public policy. Although courts of some foreign nations will enforce gaming debts directly and the assets in the United States of foreign debtors may be used to satisfy a judgment, judgments on gaming debts from U.S. courts are not binding on the courts of many foreign nations. We cannot assure that we will be able to collect the full amount of gaming debts owed to us, even in jurisdictions that enforce them. Changes in economic conditions may make it more difficult to assess creditworthiness and more difficult to collect the full amount of any gaming debt owed to us. Our inability to collect gaming debts could have a significant negative impact on our operating results.
Win rates for our gaming operations depend on a variety of factors, some of which are beyond our control.
The gaming industry is characterized by an element of chance. In addition to the element of chance, win rates are also affected by other factors, including players' skill and experience, the mix of games played, the financial resources of players, the spread of table limits, the volume of bets played, the amount of time played and undiscovered acts of fraud or cheating. Our gross gaming revenues are mainly derived from the difference between our casino winnings and the casino winnings of our gaming customers. Since there is an inherent element of chance in the gaming industry, we do not have full control over our winnings or the winnings of our gaming customers.
Acts of fraud or cheating through the use of counterfeit chips, covert schemes and other tactics, possibly in collusion with our employees, may be attempted or committed by our gaming customers with the aim of increasing their winnings. Our gaming customers, visitors and employees may also commit crimes such as theft in order to obtain chips not belonging to them. We have taken measures to safeguard our interests including the implementation of systems, processes and technologies to mitigate against these risks, extensive employee training, surveillance, security and investigation operations and adoption of appropriate security features on our chips such as embedded radio frequency identification tags. Despite our efforts, we may not be successful in preventing or detecting such culpable behavior and schemes in a timely manner and the relevant insurance we have obtained may not be sufficient to cover our losses depending on the incident, which could result in losses to our gaming operations and generate negative publicity, both of which could have an adverse effect on our reputation, business, results of operations and cash flows.
In addition, premium gaming is more volatile than other forms of gaming, and variances in win-loss results attributable to high-end gaming may have a positive or negative impact on cash flow and earnings in a particular quarter.
20
Our new projects may not be successful.
In addition to the construction and regulatory risks associated with our current and future construction projects, we cannot assure you that the level of consumer demand for our casino resorts or for the type of luxury amenities that we will offer will meet our expectations. The operating results of our new projects may be materially different than the operating results of our current integrated resorts due to, among other reasons, differences in consumer and corporate spending and preferences in new geographic areas, increased competition from other markets or other developments that may be beyond our control. In addition, our new projects may be more sensitive to certain risks, including risks associated with downturns in the economy, than the resorts we currently operate. The demands imposed by new developments on our managerial, operational and other resources may impact our operation of our existing resorts. If any of these issues were to occur, it could adversely affect our prospects, financial condition, or results of operations.
We could encounter higher than expected cost increases in the development of our projects.
We are currently constructing Encore Boston Harbor in Everett, Massachusetts. The total project budget for Encore Boston Harbor, including gaming license fees, construction costs, capitalized interest, pre-opening expenses and land costs, is estimated to be approximately
$2.6 billion
. Additionally, the Company is currently constructing approximately 430,000 square feet of additional meeting and convention space at Wynn Las Vegas and has begun design and site preparation for the reconfiguration of the Wynn Las Vegas golf course, which the Company closed in the fourth quarter of 2017. Based on current designs, we estimate the total project budget for the additional meeting and convention space and reconfiguration of the golf course to be approximately
$425 million
. We also have other capital expenditure projects, including in Macau, as discussed in
Item 1
—"
Business
- Construction and Development Opportunities” for additional details.
The projected development costs for our projects reflect our best estimates and the actual development costs may be higher than expected. Contingencies that have been set aside by us to cover potential cost overruns or potential delays may be insufficient to cover the full amount of such overruns or delays. If these contingencies are not sufficient to cover these costs, or if we are not able to recover damages for these delays and contingencies, we may not have the funds required to pay the excess costs and this project may not be completed. Failure to complete this project may negatively affect our financial condition, our results of operations and our ability to pay our debt.
Construction projects will be subject to development and construction risks, which could have an adverse effect on our financial condition, results of operations or cash flows.
Major construction projects of the scope and scale of Encore Boston Harbor and the redevelopment of the Wynn Las Vegas golf course land entail significant risks, including:
|
•
|
unanticipated cost increases;
|
|
•
|
shortages of, and price increases in, materials or skilled labor;
|
|
•
|
changes to plans and specifications;
|
|
•
|
delays in obtaining or inability to obtain requisite licenses, permits and authorizations from regulatory authorities;
|
|
•
|
changes in laws and regulations, or in the interpretation and enforcement of laws and regulations, applicable to gaming, leisure, real estate development or construction projects;
|
|
•
|
unforeseen engineering, environmental and/or geological problems;
|
|
•
|
labor disputes or work stoppages;
|
|
•
|
disputes with and defaults by contractors and subcontractors;
|
|
•
|
personal injuries to workers and other persons;
|
|
•
|
environment, health and safety issues, including site accidents;
|
|
•
|
delays or interference from severe weather or natural disasters;
|
|
•
|
geological, construction, excavation, regulatory and equipment problems; and
|
|
•
|
unavailability of construction equipment.
|
Construction, equipment or staffing problems or difficulties in obtaining any of the requisite licenses, permits and authorizations from regulatory authorities could increase the total cost, delay or prevent the construction or opening or otherwise affect the design and features of our projects.
21
We anticipate that only some of the subcontractors engaged for these projects will post bonds guaranteeing timely completion of the subcontractor's work and payment for all of that subcontractor's labor and materials. These bonds may not be adequate to ensure completion of the work.
Our facilities currently under development may not commence operations on schedule and construction costs for the projects may exceed budgeted amounts. Failure to complete the projects on schedule or within budget may have a significant negative effect on us and on our ability to make payments on our debt.
We are currently required to commence gaming operations at Encore Boston Harbor by June 2020. If we are unable to meet this deadline, the Massachusetts Gaming Commission may suspend or revoke our gaming license.
Pursuant to the Gaming Act, the Company is required to commence gaming operations at Encore Boston Harbor approximately one year from our projected opening date of mid-2019. If the Company is unable to meet the June 2020 deadline and is unable to obtain an extension of the deadline from the MGC, the MGC may suspend or revoke our gaming license and, if we are found by the MGC after a hearing to have acted in bad faith, we will be assessed a fine of up to $50,000,000. Failure to meet the deadline could have an adverse effect on our financial condition, results of operations and cash flows from this planned facility.
Any violation of applicable Anti-Money Laundering laws or regulations or the Foreign Corrupt Practices Act could adversely affect our business, performance, prospects, value, financial condition, and results of operations.
We deal with significant amounts of cash in our operations and are subject to various jurisdictions' reporting and anti-money laundering laws and regulations. Both U.S. and Macau governmental authorities focus heavily on the gaming industry and compliance with anti-money laundering laws and regulations. From time to time, the Company receives governmental and regulatory inquiries about compliance with such laws and regulations. The Company cooperates with all such inquiries. Any violation of anti-money laundering laws or regulations could adversely affect our business, performance, prospects, value, financial condition, and results of operations.
Further, we have operations, and a significant portion of our revenue is derived outside of the United States. We are therefore subject to regulations imposed by the FCPA and other anti-corruption laws that generally prohibit U.S. companies and their intermediaries from offering, promising, authorizing or making improper payments to foreign government officials for the purpose of obtaining or retaining business. Violations of the FCPA and other anti-corruption laws may result in severe criminal and civil sanctions as well as other penalties, and the SEC and U.S. Department of Justice have increased their enforcement activities with respect to such laws and regulations.
Internal control policies and procedures and employee training and compliance programs that we have implemented to deter prohibited practices may not be effective in prohibiting our directors, employees, contractors or agents from violating or circumventing our policies and the law. If we or our directors, employees or agents fail to comply with applicable laws or Company policies governing our operations, the Company may face investigations, prosecutions and other legal proceedings and actions, which could result in civil penalties, administrative remedies and criminal sanctions. Any such government investigations, prosecutions or other legal proceedings or actions could adversely affect our business, performance, prospects, value, financial condition, and results of operations.
In February 2012, the Company received a report detailing instances of conduct constituting prima facie violations of the Foreign Corrupt Practices Act (the "FCPA") by Kazuo Okada (formerly the largest beneficial owner of Wynn Resorts' shares) and certain of his affiliates. While the Company’s regulators have not taken any action against the Company in connection with the allegations in such report, a finding by regulatory authorities that Mr. Okada violated the FCPA on Company property could result in actions by regulatory authorities against the Company, which could negatively affect the Company's financial condition and results of operations.
Because we own real property, we are subject to extensive environmental regulation, which creates uncertainty regarding future environmental expenditures and liabilities.
We have incurred costs to comply with environmental requirements, such as those relating to discharges into the air, water and land, the handling and disposal of solid and hazardous waste and the cleanup of properties affected by hazardous substances. Under these and other environmental requirements we may be required to investigate and clean up hazardous or toxic substances or chemical releases at our property. As an owner or operator, we could also be held responsible to a governmental entity or third
22
parties for property damage, personal injury and investigation and cleanup costs incurred by them in connection with any contamination.
These laws typically impose cleanup responsibility and liability without regard to whether the owner or operator knew of or caused the presence of the contaminants. The liability under those laws has been interpreted to be joint and several unless the harm is divisible and there is a reasonable basis for allocation of the responsibility. The costs of investigation, remediation or removal of those substances may be substantial, and the presence of those substances, or the failure to remediate a property properly, may impair our ability to use our property.
Contamination has been identified at and in the vicinity of our site in Everett, Massachusetts. The ultimate cost of remediating contaminated sites is difficult to accurately predict and we exceeded our initial estimates. We may be required to conduct additional investigations and remediation with respect to this site. As a result, we also could incur material costs in excess of our estimates as a result of additional cleanup obligations imposed or contamination identified in the future. However, the environmental laws under which we operate are complicated and often increasingly more stringent, and may be applied retroactively. Although our proposed expenditures related to environmental matters are not currently expected to have a material adverse effect on our business, financial condition or results of operations, we may be required to make additional expenditures to remain in, or to achieve compliance with, environmental laws in the future.
Compliance with changing laws and regulations may result in additional expenses and compliance risks.
Changing laws and regulations are creating uncertainty for gaming companies. These changing laws and regulations are subject to varying interpretations in many cases due to their lack of specificity, recent issuance and/or lack of guidance. As a result, their application in practice may evolve over time as new guidance is provided by regulatory and governing bodies. In addition, further regulation of casinos, financial institutions and public companies is possible. This could result in continuing uncertainty and higher costs regarding compliance matters. Due to our commitment to maintain high standards of compliance with laws and public disclosure, our efforts to comply with evolving laws, regulations and standards have resulted in and are likely to continue to result in increased general and administrative expense. In addition, we are subject to different parties' interpretation of our compliance with these new and changing laws and regulations.
We are subject to taxation by various governments and agencies. The rate of taxation could change.
We are subject to taxation by various governments and agencies, both in the U.S. and in Macau. Changes in the laws and regulations related to taxation, including changes in the rates of taxation, the amount of taxes we owe and the time when income is subject to taxation, our ability to claim U.S. foreign tax credits, failure to renew our Macau dividend agreement and Macau income tax exemption on gaming profits and the imposition of foreign withholding taxes could change our overall effective rate of taxation.
System failure, information leakage and the cost of maintaining sufficient cybersecurity could adversely affect our business.
We rely on information technology and other systems (including those maintained by third parties with whom we contract to provide data services) to maintain and transmit large volumes of customer financial information, credit card settlements, credit card funds transmissions, mailing lists and reservations information and other personally identifiable information. We also maintain important internal company data such as personally identifiable information about our employees and information relating to our operations. The systems and processes we have implemented to protect customers, employees and company information are subject to the ever-changing risk of compromised security. These risks include cyber and physical security breaches, system failure, computer viruses, and negligent or intentional misuse by customers, company employees, or employees of third-party vendors. The steps we take to deter and mitigate these risks may not be successful and our insurance coverage for protecting against cybersecurity risks may not be sufficient. Our third-party information system service providers face risks relating to cybersecurity similar to ours, and we do not directly control any of such parties' information security operations.
Despite the security measures we currently have in place, our facilities and systems and those of our third-party service providers may be vulnerable to security breaches, acts of vandalism, phishing attacks, computer viruses, misplaced or lost data, programming or human errors and other events. Cyber-attacks are becoming increasingly more difficult to anticipate and prevent due to their rapidly evolving nature and, as a result, the technology we use to protect our systems from being breached or compromised could become outdated due to advances in computer capabilities or other technological developments.
23
Any perceived or actual electronic or physical security breach involving the misappropriation, loss, or other unauthorized disclosure of confidential or personally identifiable information, including penetration of our network security, whether by us or by a third party, could disrupt our business, damage our reputation and our relationships with our customers or employees, expose us to risks of litigation, significant fines and penalties and liability, result in the deterioration of our customers' and employees' confidence in us, and adversely affect our business, results of operations and financial condition. Since we do not control third-party service providers and cannot guarantee that no electronic or physical computer break-ins and security breaches will occur in the future, any perceived or actual unauthorized disclosure of personally identifiable information regarding our employees, customers or website visitors could harm our reputation and credibility and reduce our ability to attract and retain employees and customers. As these threats develop and grow, we may find it necessary to make significant further investments to protect data and our infrastructure, including the implementation of new computer systems or upgrades to existing systems, deployment of additional personnel and protection-related technologies, engagement of third-party consultants, and training of employees. The occurrence of any of the cyber incidents described above could have a material adverse effect on our business, results of operations and cash flows.
The failure to protect the integrity and security of company employee and customer information could result in damage to reputation and/or subject us to fines, payment of damages, lawsuits or restrictions on our use or transfer of data.
Our business uses and transmits large volumes of employee and customer data, including credit card numbers and other personal information in various information systems that we maintain in areas such as human resources outsourcing, website hosting, and various forms of electronic communications. Our customers and employees have a high expectation that we will adequately protect their personal information. Our collection and use of personal data are governed by privacy laws and regulations, and privacy law is an area that changes often and varies significantly by jurisdiction. For example, the European Union (EU)’s General Data Protection Regulation (“GDPR”), which became effective in May 2018 and replaced the old data protection laws of each EU member state, requires companies to meet new and more stringent requirements regarding the handling of personal data. The GDPR captures data processing by non-EU firms with no EU establishment as long as firms’ processing relates to “offering goods or services” or the “monitoring” of individuals in the EU. In addition to governmental regulations, there are credit card industry standards or other applicable data security standards we must comply with as well. Compliance with applicable privacy regulations may increase our operating costs and/or adversely impact our ability to market our products, properties and services to our guests. In addition, non-compliance with applicable privacy regulations by us (or in some circumstances non-compliance by third parties engaged by us) or a breach of security on systems storing our data may result in damage of reputation and/or subject us to fines, payment of damages, lawsuits or restrictions on our use or transfer of data. For example, failure to meet the GDPR requirements could result in penalties of up to four percent of worldwide revenue. Any misappropriation of confidential or personally identifiable information gathered, stored or used by us, be it intentional or accidental, could have a material impact on the operation of our business, including severely damaging our reputation and our relationships with our customers, employees and investors.
Our business could suffer if our computer systems and websites are disrupted or cease to operate effectively.
We are dependent on our computer systems to record and process transactions and manage and operate our business, including processing payments, accounting for and reporting financial results, and managing our employees and employee benefit programs. Given the complexity of our business, it is imperative that we maintain uninterrupted operation of our computer hardware and software systems. Despite our preventative efforts, our systems are vulnerable to damage or interruption from, among other things, security breaches, computer viruses, technical malfunctions, inadequate system capacity, power outages, natural disasters, and usage errors by our employees or third-party consultants. If our information technology systems become damaged or otherwise cease to function properly, we may have to make significant investments to repair or replace them. Additionally, confidential or sensitive data related to our customers or employees could be lost or compromised. Any material disruptions in our information technology systems could have a material adverse effect on our business, results of operations, and financial condition.
If a third party successfully challenges our ownership of, or right to use, the Wynn-related trademarks and/or service marks, our business or results of operations could be harmed.
Our intellectual property assets, especially the logo version of "Wynn," are among our most valuable assets. We have filed applications with the PTO and with various foreign patent and trademark registries including registries in Macau, China, Hong Kong, Singapore, Taiwan, Japan, certain European countries and various other jurisdictions throughout the world, to register a variety of WYNN-related trademarks and service marks in connection with a variety of goods and services. These marks include "WYNN RESORTS," "WYNN DESIGN AND DEVELOPMENT," "WYNN LAS VEGAS," "WYNN MACAU," "WYNN PALACE" and "ENCORE." Some of the applications are based upon ongoing use and others are based upon a bona fide intent to use the marks in the future.
24
A common element of most of these marks is the use of the surname "WYNN." As a general rule, a surname (or the portion of a mark primarily constituting a surname) is not eligible for registration unless the surname has acquired "secondary meaning." To date, we have been successful in demonstrating to the PTO such secondary meaning for the Wynn name, in certain of the applications, based upon factors including Mr. Wynn's historical prominence as a resort developer, but we cannot assure you that we will be successful with the other pending applications.
Federal registrations are not completely dispositive of the right to such marks. Third parties who claim prior rights with respect to similar marks may nonetheless challenge our right to obtain registrations or our use of the marks and seek to overcome the presumptions afforded by such registrations.
Furthermore, due to the increased use of technology in computerized gaming machines and in business operations generally, other forms of intellectual property rights (such as patents and copyrights) are becoming of increased relevance. It is possible that, in the future, third parties might assert superior intellectual property rights or allege that their intellectual property rights cover some aspect of our operations. The defense of such allegations may result in substantial expenses, and, if such claims are successfully prosecuted, may have a material impact on our business. There has been an increase in the international operation of fraudulent online gambling and investment websites attempting to scam and defraud members of the public. We do not offer online gambling or investment accounts. Websites offering these or similar activities and opportunities that use our names or similar names or images in likeness to ours, are doing so without our authorization and possibly unlawfully and with criminal intent. If our efforts to cause these sites to be shut down through civil action and by reporting these sites to the appropriate authorities (where applicable) are unsuccessful or not timely completed, these unauthorized activities may continue and harm our reputation and negatively affect our business. Efforts we take to acquire and protect our intellectual property rights against unauthorized use throughout the world, which may include retaining counsel and commencing litigation in various jurisdictions, may be costly and may not be successful in protecting and preserving the status and value of our intellectual property assets.
Labor actions and other labor problems could negatively impact our operations.
Some of our employees are represented by labor unions. From time to time, we have experienced attempts by labor organizations to organize certain of our non-union employees. These efforts have achieved some success to date. We cannot provide any assurance that we will not experience additional and successful union activity in the future. The impact of any union activity is undetermined and could have a material adverse effect on our business, financial condition, results of operations and cash flows.
Our insurance coverage may not be adequate to cover all possible losses that we could suffer, including losses resulting from terrorism, and our insurance costs may increase.
We have comprehensive property and liability insurance policies for our properties with coverage features and insured limits that we believe are customary in their breadth and scope. However, in the event of a substantial loss, the insurance coverage we carry may not be sufficient to pay the full market value or replacement cost of our lost investment or could result in certain losses being totally uninsured. As a result, we could lose some or all of the capital we have invested in a property, as well as the anticipated future revenue from the property, and we could remain obligated for debt or other financial obligations related to the property.
Market forces beyond our control may limit the scope of the insurance coverage we can obtain in the future or our ability to obtain coverage at reasonable rates. Certain catastrophic losses may be uninsurable or too expensive to justify obtaining insurance. As a result, if we suffer such a catastrophic loss, we may not be successful in obtaining future insurance without increases in cost or decreases in coverage levels. Furthermore, our debt instruments and other material agreements require us to maintain a certain minimum level of insurance. Failure to satisfy these requirements could result in an event of default under these debt instruments or material agreements, which would negatively affect our business and financial condition.
25
Risks Associated with our Macau Operations
Our Macau Operations may be affected by adverse political and economic conditions.
Our Macau Operations are subject to significant political, economic and social risks inherent in doing business in an emerging market. The future success of our Macau Operations will depend on political and economic conditions in Macau and mainland China. For example, fiscal decline, international relations, and civil, domestic or international unrest in Macau, China or the surrounding region could significantly harm our business, not only by reducing customer demand for casino resorts, but also by increasing the risk of imposition of taxes and exchange controls or other governmental restrictions, laws or regulations that might impede our Macau Operations or our ability to repatriate funds.
Revenues from our Macau gaming operations will end if we cannot secure an extension or renewal of our concession, or a new concession, by June 26, 2022, or if the Macau government exercises its redemption right.
The term of our concession agreement with the Macau government ends on June 26, 2022. Unless the term of our concession agreement is extended or our concession is renewed, subject to any separate arrangement with the Macau government, all of our gaming operations and related equipment in Macau will be automatically transferred to the Macau government without compensation to us and we will cease to generate any revenues from these operations at the end of the term of our concession agreement. The Macau government has publicly commented that it is studying the process by which concessions and subconcessions may be renewed, extended or issued. Effective June 2017, the Macau government may redeem our concession agreement by providing us at least one year's prior notice. In the event the Macau government exercises this redemption right, we are entitled to fair compensation or indemnity. The amount of such compensation or indemnity will be determined based on the amount of revenue generated during the tax year prior to the redemption multiplied by the remaining years under our concession. We are considering various options to place us in a good position for the renewal, extension or application process; however, we may not be able to extend our concession agreement or renew our concession or obtain a new concession on terms favorable to us or at all. If our concession is redeemed, the compensation paid to us may not be adequate to compensate us for the loss of future revenues. The redemption of or failure to extend or renew our concession or obtain a new concession would have a material adverse effect on our results of operations.
We compete for limited labor resources in Macau and Macau government policies may also affect our ability to employ imported labor.
The success of our operations in Macau will be affected by our success in hiring and retaining employees. We compete with a large number of casino resorts in Macau for a limited number of qualified employees. In addition, the Macau government requires that we only hire Macau residents as dealers in our casinos. Competition for these individuals in Macau has increased and will continue to increase as other competitors expand their operations. We have to seek employees from other countries to adequately staff our resorts and certain Macau government policies affect our ability to import labor in certain job classifications. Despite our coordination with the Macau labor and immigration authorities to assure that our labor needs are satisfied, we may not be able to recruit and retain a sufficient number of qualified employees for our operations or obtain required work permits for those employees. If we are unable to obtain, attract, retain and train skilled employees, our ability to adequately manage and staff our existing and planned casino and resort properties in Macau could be impaired, which could have a material adverse effect on our business, financial condition, results of operations and cash flows.
The smoking control legislation in Macau could have an adverse effect on our business, financial condition, results of operations and cash flows.
In 2014, the Macau government approved additional smoking control legislation, which prohibited smoking in casinos starting on October 6, 2014. The legislation, however, permitted casinos to maintain certain limited smoking areas open to VIP patrons if certain stringent conditions were met, as enhanced from time to time. Smoking was also permitted in approved smoking lounges if certain stringent technical standards were met. In 2017, the Macau government approved additional smoking control legislation that came into effect on January 1, 2018 banning smoking in all casino areas other than in approved smoking lounges by December 31, 2018. The new smoking control legislation also requires casinos to upgrade any existing smoking lounges in mass gaming areas and construct new smoking lounges in VIP gaming areas for inspection and approval in accordance with further enhanced technical standards by December 31, 2018. Although we have approved smoking lounges at both Wynn Macau and Wynn Palace, the smoking ban may deter potential gaming customers who are smokers from frequenting casinos in Macau and disrupt the number of patrons visiting or the amount of time visiting patrons spend gaming at our properties, which could have a material adverse effect on our business, financial condition, results of operations and cash flows.
26
Macau may not have adequate transportation services, infrastructure and related facilities to accommodate the demand of visitors to Macau.
Transportation services, infrastructure and related facilities within Macau and between Macau, Hong Kong and mainland China may need to be expanded to accommodate the increased visitation to Macau driven by additional casino projects and attractions that are under construction and to be developed in the future as well as the opening of the Hong Kong-Zhuhai-Macau Bridge which may further strain existing transportation infrastructure. If transportation facilities to and from Macau are inadequate to meet the demands of an increased volume of gaming customers visiting Macau, the desirability of Macau as a gaming destination, as well as the results of operations of our Macau Operations, could be negatively impacted. Furthermore, construction of current and future casino and infrastructure projects, adjacent to our properties could impede access to our properties during construction and development. This may negatively impact the results of our Macau Operations.
Extreme weather conditions may have an adverse impact on our Macau Operations.
Macau's subtropical climate and location on the South China Sea are subject to extreme weather conditions including typhoons and heavy rainstorms, such as Typhoon Hato in 2017. Unfavorable weather conditions could negatively affect the profitability of our resorts and prevent or discourage guests from traveling to Macau.
If our Macau Operations fail to comply with the concession agreement, the Macau government can terminate our concession without compensation to us, which would have a material adverse effect on our business and financial condition.
The Macau government has the right to unilaterally terminate our concession in the event of our material non-compliance with the basic obligations under the concession and applicable Macau laws. The concession agreement expressly provides that the government of Macau may unilaterally rescind the concession agreement of our Macau Operations if it:
|
•
|
conducts unauthorized games or activities that are excluded from its corporate purpose;
|
|
•
|
suspends gaming operations in Macau for more than seven consecutive days (or more than 14 days in a civil year) without justification;
|
|
•
|
defaults in payment of taxes, premiums, contributions or other required amounts;
|
|
•
|
does not comply with government inspections or supervision;
|
|
•
|
systematically fails to observe its obligations under the concession system;
|
|
•
|
fails to maintain bank guarantees or bonds satisfactory to the government;
|
|
•
|
is the subject of bankruptcy proceedings or becomes insolvent;
|
|
•
|
engages in serious fraudulent activity, damaging to the public interest; or
|
|
•
|
repeatedly violates applicable gaming laws.
|
If the government of Macau unilaterally rescinds the concession agreement, our Macau Operations will be required to compensate the government in accordance with applicable law, and the areas defined as casino space under Macau law and all of the gaming equipment pertaining to our gaming operations will be transferred to the government without compensation. The loss of our concession would prohibit us from conducting gaming operations in Macau, which would have a material adverse effect on our business and financial condition.
Certain Nevada gaming laws apply to our Macau Operations' gaming activities and associations.
Certain Nevada gaming laws also apply to gaming activities and associations in jurisdictions outside the State of Nevada. With respect to our Macau Operations, we and our subsidiaries that must be licensed to conduct gaming operations in Nevada are required to comply with certain reporting requirements concerning gaming activities and associations in Macau conducted by our Macau-related subsidiaries. We and our licensed Nevada subsidiaries also will be subject to disciplinary action by the NGC if our Macau-related subsidiaries:
|
•
|
knowingly violate any Macau laws relating to their Macau gaming operations;
|
|
•
|
fail to conduct our Macau Operations in accordance with the standards of honesty and integrity required of Nevada gaming operations;
|
|
•
|
engage in any activity or enter into any association that is unsuitable for us because it poses an unreasonable threat to the control of gaming in Nevada, reflects or tends to reflect discredit or disrepute upon the State of Nevada or gaming in Nevada, or is contrary to Nevada gaming policies;
|
27
|
•
|
engage in any activity or enter into any association that interferes with the ability of the State of Nevada to collect gaming taxes and fees; or
|
|
•
|
employ, contract with or associate with any person in the foreign gaming operation who has been denied a license or a finding of suitability in Nevada on the ground of unsuitability, or who has been found guilty of cheating at gambling.
|
Such disciplinary action could include suspension, conditioning, limitation or revocation of the registration, licenses or approvals held by us and our licensed Nevada subsidiaries, including Wynn Las Vegas, LLC, and the imposition of substantial fines.
In addition, if the Nevada Gaming Control Board determines that any actual or intended activities or associations of our Macau-related subsidiaries may be prohibited pursuant to one or more of the standards described above, the Nevada Gaming Control Board can require us and our licensed Nevada subsidiaries to file an application with the NGC for a finding of suitability of the activity or association. If the NGC finds that the activity or association in Macau is unsuitable or prohibited, our Macau-related subsidiaries will either be required to terminate the activity or association, or will be prohibited from undertaking the activity or association. Consequently, should the NGC find that our Macau-related subsidiary's gaming activities or associations in Macau are unsuitable, those subsidiaries may be prohibited from undertaking their planned gaming activities or associations in Macau, or be required to divest their investment in Macau, possibly on unfavorable terms.
We depend upon gaming promoters for a significant portion of our gaming revenue. If we are unable to maintain, or develop additional, successful relationships with reputable gaming promoters, our ability to maintain or grow our gaming revenues could be adversely affected.
We may lose the clientele of our gaming promoters, who generate a significant portion of our gaming revenue. There is intense competition among casino operators in Macau for services provided by gaming promoters, which has intensified as additional casinos open in Macau. If we are unable to maintain, or develop additional, successful relationships with reputable gaming promoters, or lose a significant number of our gaming promoters to our competitors, our ability to maintain or grow our gaming revenues will be adversely affected and we will have to seek alternative ways of developing relationships with VIP customers. In addition, if our gaming promoters are unable to develop or maintain relationships with our VIP customers, our ability to maintain or grow our gaming revenues will be hampered.
The financial resources of our gaming promoters may be insufficient to allow them to continue doing business in Macau which could adversely affect our business and financial condition. Our gaming promoters may experience difficulty in attracting patrons.
Economic and political factors in the region may cause our gaming promoters to experience difficulties in their Macau operations, including intensified competition in attracting patrons to come to Macau. Further, gaming promoters may face a decrease in liquidity, limiting their ability to grant credit to their patrons, and difficulties in collecting credit they extended previously. The inability to attract sufficient patrons, grant credit and collect amounts due in a timely manner may negatively affect our gaming promoters' operations, causing gaming promoters to wind up or liquidate their operations or resulting in some of our gaming promoters leaving Macau. Current and any future difficulties could have an adverse impact on our results of operations.
Increased competition for the services of gaming promoters may require us to pay increased commission rates to gaming promoters.
Certain gaming promoters have significant leverage and bargaining strength in negotiating operational agreements with casino operators. This leverage could result in gaming promoters negotiating changes to our operational agreements, including higher commissions, or the loss of business to a competitor or the loss of certain relationships with gaming promoters. If we need to increase our commission rates or otherwise change our practices with respect to gaming promoters due to competitive forces, our results of operations could be adversely affected.
28
Failure by the gaming promoters with whom we work to comply with Macau gaming laws and high standards of probity and integrity might affect our reputation and ability to comply with the requirements of our concession, Macau gaming laws and other gaming licenses.
The reputations and probity of the gaming promoters with whom we work are important to our own reputation and to our ability to operate in compliance with our concession, Macau gaming laws and other gaming licenses. We conduct periodic reviews of the probity and compliance programs of our gaming promoters. However, we are not able to control our gaming promoters' compliance with these high standards of probity and integrity, and our gaming promoters may violate provisions in their contracts with us designed to ensure such compliance. In addition, if we enter into a new business relationship with a gaming promoter whose probity is in doubt, this may be considered by regulators or investors to reflect negatively on our own probity. If our gaming promoters are unable to maintain required standards of probity and integrity, we may face consequences from gaming regulators with authority over our operations. Furthermore, if any of our gaming promoters violate the Macau gaming laws while on our premises, the Macau government may, in its discretion, take enforcement action against us, the gaming promoter, or each concurrently, and we may be sanctioned and our reputation could be harmed.
Unfavorable changes in currency exchange rates may increase our Macau Operations' obligations under the concession agreement and cause fluctuations in the value of our investment in Macau.
The currency delineated in our Macau Operations' concession agreement with the government of Macau is the Macau pataca. The Macau pataca is linked to the Hong Kong dollar, and the two are often used interchangeably in Macau. The Hong Kong dollar is linked to the U.S. dollar and the exchange rate between these two currencies has remained relatively stable over the past several years. However, the exchange linkages of the Hong Kong dollar and the Macau pataca, and the Hong Kong dollar and the U.S. dollar, are subject to potential changes due to changes in Chinese governmental policies and international economic and political developments.
If the Hong Kong dollar and the Macau pataca are no longer linked to the U.S. dollar, the exchange rate for these currencies may severely fluctuate. The current rate of exchange fixed by the applicable monetary authorities for these currencies may also change.
Because many of our Macau Operations' payment and expenditure obligations are in Macau patacas, in the event of unfavorable Macau pataca or Hong Kong dollar rate changes, our Macau Operations' obligations, as denominated in U.S. dollars, would increase. In addition, because we expect that most of the revenues for any casino that we operate in Macau will be in Hong Kong dollars, we are subject to foreign exchange risk with respect to the exchange rate between the Hong Kong dollar and the U.S. dollar. Also, if any of our Macau-related entities incur U.S. dollar-denominated debt, fluctuations in the exchange rates of the Macau pataca or the Hong Kong dollar, in relation to the U.S. dollar, could have adverse effects on our results of operations, financial condition and ability to service our debt.
Currency exchange controls and currency export restrictions could negatively impact our Macau Operations.
Currency exchange controls and restrictions on the export of currency by certain countries may negatively impact the success of our Macau Operations. For example, there are currently existing currency exchange controls and restrictions on the export of the renminbi, the currency of China. Restrictions on the export of the renminbi may impede the flow of gaming customers from China to Macau, inhibit the growth of gaming in Macau and negatively impact our Macau Operations.
Our Macau subsidiaries' indebtedness is secured by a substantial portion of their assets.
Subject to applicable laws, including gaming laws, and certain agreed upon exceptions, our Macau subsidiaries' debt is secured by liens on substantially all of their assets. In the event of a default by such subsidiaries under their financing documents, or if such subsidiaries experience insolvency, liquidation, dissolution or reorganization, the holders of such secured debt would first be entitled to payment from their collateral security, and then would the holders of our Macau subsidiaries' unsecured debt be entitled to payment from their remaining assets, and only then would we, as a holder of capital stock, be entitled to distribution of any remaining assets.
29
Conflicts of interest may arise because certain of our directors and officers are also directors of Wynn Macau, Limited.
Wynn Macau, Limited, an indirect majority owned subsidiary of Wynn Resorts and the developer, owner and operator of Wynn Macau and Wynn Palace, listed its ordinary shares of common stock on The Stock Exchange of Hong Kong Limited in October 2009. As of
December 31, 2018
, Wynn Resorts owns approximately 72% of Wynn Macau, Limited's ordinary shares of common stock. As a result of Wynn Macau, Limited having stockholders who are not affiliated with us, we and certain of our officers and directors who also serve as officers and/or directors of Wynn Macau, Limited may have conflicting fiduciary obligations to our stockholders and to the minority stockholders of Wynn Macau, Limited. Decisions that could have different implications for Wynn Resorts and Wynn Macau, Limited, including contractual arrangements that we have entered into or may in the future enter into with Wynn Macau, Limited, may give rise to the appearance of a potential conflict of interest.
The Macau government has established a maximum number of gaming tables that can be operated in Macau and has limited the number of new gaming tables at new gaming areas in Macau.
In connection with the opening of Wynn Palace, the DICJ authorized 100 new table games for operation at Wynn Palace, with 25 additional table games authorized for operation on January 1, 2017, and a further 25 new table games for operation on January 1, 2018, for a total of 150 new table games in the aggregate. In addition, we have and will continue to transfer table games between Wynn Palace and Wynn Macau, subject to the aggregate cap. As of
February 20, 2019
, we had a total of
320
table games at Wynn Palace and
317
at Wynn Macau. The mix of table games in operation at Wynn Palace and Wynn Macau changes from time to time as a result of marketing and operating strategies in response to changing market demand and industry competition. Failure to shift the mix of our table games in anticipation of market demands and industry trends may negatively impact our operating results.
Risks Related to Share Ownership and Stockholder Matters
Our largest stockholders are able to exert significant influence over our operations and future direction.
As of
December 31, 2018
, Elaine P. Wynn was our second largest shareholder and owned 9,539,077 shares, or approximately 9%, of our outstanding common stock. As a result, Elaine P. Wynn may be able to exert significant influence over all matters requiring our stockholders' approval, including the approval of significant corporate transactions.
On August 3, 2018, we entered into a Cooperation Agreement (the "Cooperation Agreement") with Elaine P. Wynn regarding the composition of the Company’s Board of Directors and certain other matters, including, among other things, the appointment of Mr. Philip G. Satre to the Company's Board of Directors, standstill restrictions, releases, non-disparagement and reimbursement of expenses. The term of the Cooperation Agreement expires on the day after the conclusion of the 2020 annual meeting of the Company’s stockholders, unless earlier terminated pursuant to the circumstances described in the Cooperation Agreement.
Our stock price may be volatile.
The trading price of our common stock has been and may continue to be subject to wide fluctuations. Our stock price may fluctuate in response to a number of events and factors, such as general United States, China, and world economic and financial conditions, our own quarterly variations in operating results, increased competition, changes in financial estimates and recommendations by securities analysts, changes in applicable laws or regulations, and changes affecting the travel industry, and other events impacting our business. The stock market in general, and prices for companies in our industry in particular, has experienced extreme volatility that may be unrelated to the operating performance of a particular company. These broad market and industry fluctuations may adversely affect the price of our common stock, regardless of our operating performance.
30
Risks Related to our Indebtedness
We are highly leveraged and future cash flow may not be sufficient for us to meet our obligations, and we might have difficulty obtaining more financing.
We have a substantial amount of consolidated debt in relation to our equity. As of
December 31, 2018
, we had total outstanding debt of approximately
$9.42 billion
, which includes a portion of the funds we expect to need for the development and construction of our current projects. We may, however, incur additional indebtedness in connection with the construction of these projects. See
Item 1
—Business "Construction and Development Opportunities." In addition, we are permitted to incur additional indebtedness if certain conditions are met, including conditions under our Wynn Macau Credit Facilities, our Wynn America Credit Facilities and our Wynn Las Vegas, LLC indentures in connection with other future potential development plans.
Our indebtedness could have important consequences. For example:
|
•
|
failure to meet our payment obligations or other obligations could result in acceleration of our indebtedness, foreclosure upon our assets that serve as collateral or bankruptcy and trigger cross defaults under other agreements;
|
|
•
|
servicing our indebtedness requires a substantial portion of our cash flow from the operations of our Las Vegas and Macau Operations and reduces the amount of available cash, if any, to fund working capital and other cash requirements or pay for other capital expenditures;
|
|
•
|
we may not be able to obtain additional financing, if needed; and
|
|
•
|
rates with respect to a portion of the interest we pay will fluctuate with market rates and, accordingly, our interest expense will increase if market interest rates increase.
|
The interest rates of certain of our credit agreements are tied to the London Interbank Offered Rate, or LIBOR. In July 2017, the head of the United Kingdom Financial Conduct Authority announced the desire to phase out the use of LIBOR by the end of 2021. In addition, the U.S. Federal Reserve, in conjunction with the Alternative Reference Rates Committee, a steering committee comprised of large US financial institutions, is considering replacing U.S. dollar LIBOR with the Secured Overnight Financing Rate, or SOFR, a new index calculated by short-term repurchase agreements, backed by Treasury securities. Although there have been a few issuances utilizing SOFR or the Sterling Over Night Index Average, an alternative reference rate that is based on transactions, it is unknown whether these alternative reference rates will attain market acceptance as replacements for LIBOR. If LIBOR ceases to exist, we may need to renegotiate any of our credit agreements extending beyond 2021 that utilize LIBOR as a factor in determining the interest rate to replace LIBOR with the new standard that is established. There is currently no definitive information regarding the future utilization of LIBOR or of any particular replacement rate. As such, the potential effect of any such event could have on our business and financial condition cannot yet be determined.
Under the terms of the documents governing our debt facilities, subject to certain limitations, we are permitted to incur indebtedness. If we incur additional indebtedness, the risks described above will be exacerbated.
The agreements governing our debt facilities contain certain covenants that restrict our ability to engage in certain transactions and may impair our ability to respond to changing business and economic conditions.
Some of our debt facilities require us to satisfy various financial covenants, which include requirements for minimum interest coverage ratios and leverage ratios pertaining to total debt to earnings before interest, tax, depreciation and amortization and a minimum earnings before interest, tax, depreciation and amortization. For more information on financial covenants we are subject to under our debt facilities, see
Item 8
—"Financial Statements and Supplementary Data,"
Note 6
, "Long-Term Debt." Future indebtedness or other contracts could contain covenants more restrictive than those contained in our existing debt facilities.
The agreements governing our debt facilities also contain restrictions on our ability to engage in certain transactions and may limit our ability to respond to changing business and economic conditions. These restrictions include, among other things, limitations on our ability and the ability of our restricted subsidiaries to:
|
•
|
pay dividends or distributions or repurchase equity;
|
|
•
|
incur additional debt;
|
|
•
|
make investments;
|
|
•
|
create liens on assets to secure debt;
|
|
•
|
enter into transactions with affiliates;
|
31
|
•
|
issue stock of, or member's interests in, subsidiaries;
|
|
•
|
enter into sale-leaseback transactions;
|
|
•
|
engage in other businesses;
|
|
•
|
merge or consolidate with another company;
|
|
•
|
undergo a change of control;
|
|
•
|
transfer, sell or otherwise dispose of assets;
|
|
•
|
issue disqualified stock;
|
|
•
|
create dividend and other payment restrictions affecting subsidiaries; and
|
|
•
|
designate restricted and unrestricted subsidiaries.
|
Our ability to comply with the terms of our outstanding facilities may be affected by general economic conditions, industry conditions and other events outside of our control. As a result, we may not be able to maintain compliance with these covenants. If our properties' operations fail to generate adequate cash flow, we may violate those covenants, causing a default under our agreements, which would materially and adversely affect our operating results and our financial condition or result in our lenders or holders of our debt taking action to enforce their security interests in our various assets or cause all outstanding amounts to be due and payable immediately.
Item 1B. Unresolved Staff Comments
None.
32
Item 2. Properties
The following table presents our significant land holdings. We own or have obtained the right to use these properties. We also own or lease various other improved and unimproved properties associated with our development projects.
|
Property
|
Approximate Acres
|
Location
|
||
|
Macau Operations
(1)
|
||||
|
Wynn Palace
|
51
|
Located in the Cotai area of Macau.
|
||
|
Wynn Macau
|
16
|
Located in downtown Macau's inner harbor.
|
||
|
67
|
||||
|
Las Vegas Operations
|
||||
|
Wynn Las Vegas (main parcel)
|
75
|
Located at the intersection of Las Vegas Boulevard and Sands Avenue.
|
||
|
Golf course land
(2)
|
140
|
Located adjacent to Wynn Las Vegas.
|
||
|
Employee parking lot and office building
|
18
|
Located across Sands Avenue.
|
||
|
Office building
|
5
|
Located adjacent to golf course land.
|
||
|
238
|
||||
|
Encore Boston Harbor
(3)
|
33
|
Located in Everett, Massachusetts, adjacent to Boston along the Mystic River.
|
||
|
Other
(4)
|
38
|
Located on the Las Vegas Strip directly across from Wynn Las Vegas.
|
||
(1) The government of Macau owns most of the land in Macau. In most cases, private interests in real property located in Macau are obtained through long-term leases known as concessions and other grants of rights to use land from the government. Wynn Palace and Wynn Macau are built on land leased under land concession contracts each with terms of 25 years from May 2012 and August 2004, respectively, which may be renewed with government approval for successive periods.
(2) We own approximately 834 acre-feet of permitted and certificated water rights, which we will use to irrigate the golf course upon opening in the fourth quarter of 2019. We also own approximately 151.5 acre-feet of permitted and certificated water rights for commercial use. There are significant cost savings and conservation benefits associated with using water supplied pursuant to our water rights.
(3) This integrated resort is currently under construction and is expected to open in mid-2019.
(4) During the first quarter of 2018, we acquired approximately 38 acres of land, of which approximately 16 acres are subject to a ground lease that expires in July 2097. As part of this acquisition, we acquired approximately 24 acre-feet of permitted and certificated water rights. We expect to use this land for future development.
Item 3. Legal Proceedings
We are occasionally party to lawsuits. As with all litigation, no assurance can be provided as to the outcome of such matters and we note that litigation inherently involves significant costs. For information regarding the Company's legal proceedings see Item 8—"Financial Statements and Supplementary Data,"
Note 15
, "Commitments and Contingencies—Litigation" in this Annual Report on Form 10-K, which is incorporated herein by reference, and Item 1A—"Risk Factors" in this Annual Report on Form 10-K.
CCAC Information Request
In July 2014, Wynn Macau SA was contacted by the Commission Against Corruption of Macau ("CCAC") requesting certain information related to its land in the Cotai area of Macau. Wynn Macau SA has cooperated with CCAC's request.
Item 4. Mine Safety Disclosures
Not applicable.
33
PART II
Item 5. Market for Registrant's Common Equity, Related Stockholder Matters and Issuer Purchases of Equity Securities
Market Information
Our outstanding common stock trades on the Nasdaq Global Select Market under the symbol "WYNN."
Holders
There were approximately 152 holders of record of our common stock as of
February 15, 2019
.
Issuer Purchases of Equity Securities
The following table provides information about share repurchases we made of our common stock as part of our equity repurchase program during the quarter ended
December 31, 2018
:
|
For the Month Ended
|
Number of Shares Repurchased
|
Weighted Average Price Paid Per Share
|
Shares Repurchased as Part of a Publicly Announced Program
|
Approximate Dollar Value Remaining Under the Program
(in thousands) (1)
|
||||||||||
|
October 31, 2018
|
—
|
|
$
|
—
|
|
—
|
|
$
|
1,000,000
|
|
||||
|
November 30, 2018
|
937,651
|
|
$
|
104.74
|
|
937,651
|
|
901,787
|
|
|||||
|
December 31, 2018
|
540,901
|
|
$
|
108.07
|
|
540,901
|
|
843,332
|
|
|||||
(1) The Company's Board of Directors authorized an equity repurchase program in April of 2016 of up to $1 billion of our common stock. Repurchases may be made at the discretion of the Company from time to time on the open market or in privately negotiated transactions. The Company is not obligated to make any repurchases, and the repurchase program may be discontinued at any time. Any shares acquired are available for general corporate purposes. Any shares repurchased during the periods presented are recorded in Treasury Stock.
For more information on the Company's publicly announced repurchase program, see Item 8—"Financial Statements and Supplementary Data,"
Note 7
, "Stockholders' Equity." In November 2018, we repurchased 630 shares in satisfaction of tax withholding obligations on vested restricted stock at an average price of $111.69 per share, for a total amount of approximately $0.1 million. None of the 630 repurchases that occurred in November 2018 were part of the Company's publicly announced share repurchase program.
34
Stock Performance Graph
The graph below compares the five-year cumulative total return on our common stock to the cumulative total return of the Standard & Poor's 500 Stock Index ("S&P 500") and the Dow Jones US Gambling Index. The performance graph assumes that $100 was invested on December 31, 2013 in each of the Company's common stock, the S&P 500 and the Dow Jones US Gambling Index, and that all dividends were reinvested. The stock price performance shown in this graph is neither necessarily indicative of, nor intended to suggest, future stock price performance.
COMPARISON OF 5 YEAR CUMULATIVE TOTAL RETURN*
Among Wynn Resorts Ltd., the S&P 500 Index,
and the Dow Jones US Gambling Index
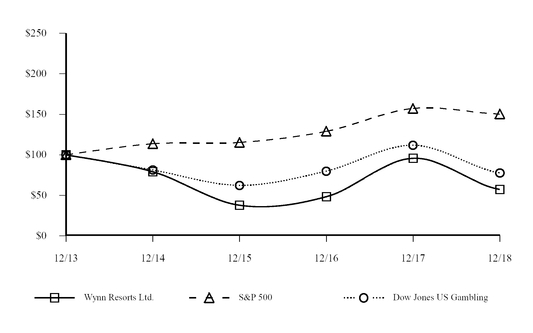
|
*$100 invested on 12/31/13 in stock or index, including reinvestment of dividends. Fiscal year ending December 31.
|
|
Copyright © 2019 S&P, a division of McGraw Hill Financial. All rights reserved.
|
|
Copyright © 2019 Dow Jones & Co. All rights reserved.
|
35
Item 6. Selected Financial Data
The following financial information for each of the five years ended
December 31, 2018
,
2017
,
2016
,
2015
and
2014
has been derived from our consolidated financial statements. This selected consolidated financial data should be read together with Item 7—"Management's Discussion and Analysis of Financial Condition and Results of Operations," our consolidated financial statements and related notes and other information contained in this Annual Report on Form 10-K. Operating results for the periods presented are not necessarily indicative of the results that may be expected for future years.
|
Years Ended December 31,
|
|||||||||||||||||||
|
2018 (1) (4)
|
2017 (2) (4)
|
2016 (3) (4)
|
2015 (4)
|
2014 (4)
|
|||||||||||||||
|
(in thousands, except per share amounts)
|
|||||||||||||||||||
|
Consolidated Statements of Income Data:
|
|||||||||||||||||||
|
Operating revenues
|
$
|
6,717,660
|
|
$
|
6,070,160
|
|
$
|
4,345,797
|
|
$
|
4,075,883
|
|
$
|
5,433,661
|
|
||||
|
Pre-opening
|
53,490
|
|
26,692
|
|
154,717
|
|
77,623
|
|
30,146
|
|
|||||||||
|
Operating income
|
735,544
|
|
1,055,565
|
|
521,662
|
|
658,814
|
|
1,266,278
|
|
|||||||||
|
Net income
|
803,084
|
|
889,254
|
|
302,469
|
|
281,524
|
|
962,644
|
|
|||||||||
|
Less: net income attributable to noncontrolling interests
|
(230,654
|
)
|
(142,073
|
)
|
(60,494
|
)
|
(86,234
|
)
|
(231,090
|
)
|
|||||||||
|
Net income attributable to Wynn Resorts, Limited
|
572,430
|
|
747,181
|
|
241,975
|
|
195,290
|
|
731,554
|
|
|||||||||
|
Basic income per share
|
$
|
5.37
|
|
$
|
7.32
|
|
$
|
2.39
|
|
$
|
1.93
|
|
$
|
7.25
|
|
||||
|
Diluted income per share
|
$
|
5.35
|
|
$
|
7.28
|
|
$
|
2.38
|
|
$
|
1.92
|
|
$
|
7.17
|
|
||||
|
December 31,
|
|||||||||||||||||||
|
2018
|
2017
|
2016
|
2015
|
2014
|
|||||||||||||||
|
(in thousands, except per share amounts)
|
|||||||||||||||||||
|
Consolidated Balance Sheets Data:
|
|||||||||||||||||||
|
Cash and cash equivalents
|
$
|
2,215,001
|
|
$
|
2,804,474
|
|
$
|
2,453,122
|
|
$
|
2,080,089
|
|
$
|
2,182,164
|
|
||||
|
Construction in progress
|
1,912,801
|
|
1,016,207
|
|
299,686
|
|
3,217,117
|
|
1,666,326
|
|
|||||||||
|
Total assets
|
13,216,269
|
|
12,681,739
|
|
11,953,557
|
|
10,459,159
|
|
9,001,919
|
|
|||||||||
|
Total long-term obligations
(5)
|
9,519,417
|
|
9,673,099
|
|
10,279,375
|
|
9,327,143
|
|
7,482,510
|
|
|||||||||
|
Stockholders' equity
|
1,814,789
|
|
1,078,350
|
|
257,881
|
|
21,845
|
|
211,091
|
|
|||||||||
|
Cash dividends declared per common share
|
$
|
2.75
|
|
$
|
2.00
|
|
$
|
2.00
|
|
$
|
3.00
|
|
$
|
6.25
|
|
||||
|
(1)
|
During the fourth quarter of 2018, we recorded a tax benefit of $390.9 million related to clarified U.S. tax reform guidance issued by the Internal Revenue Service in the fourth quarter of 2018, which was incremental to the provisional tax benefit recorded during the fourth quarter of 2017. See Item 8—"Financial Statements and Supplementary Data,"
Note 12
, "Income Taxes." Additionally, the Company incurred a litigation settlement expense totaling $463.6 million in 2018. See Item 8—"Financial Statements and Supplementary Data,"
Note 15
, "
Commitments and Contingencies
."
|
|
(2)
|
During the fourth quarter of 2017, we recorded a provisional income tax benefit of $339.9 million related to the enactment of U.S. tax reform. See Item 8—"Financial Statements and Supplementary Data,"
Note 12
, "Income Taxes."
|
|
(3)
|
Wynn Palace opened on August 22, 2016.
|
|
(4)
|
The results presented reflect the Company's adoption of ASU 2014-09,
Revenue from Contracts with Customers (Topic 606)
("ASC 606"), effective January 1, 2018. 2017 and 2016 operating revenues have been adjusted to reflect the full retrospective adoption of ASC 606, with no impact to operating income or net income. 2015 and 2014 operating revenues were not recast for the adoption of ASC 606 and, as a result, are not comparable to 2016, 2017 and 2018 operating revenues. See Item 8—"Financial Statements and Supplementary Data," Note 2, "Summary of Significant Accounting Policies."
|
|
(5)
|
Includes long-term debt, other long-term liabilities, deferred income tax liabilities, net and the required contract premium payments under our land concession contracts at Wynn Palace.
|
36
Item 7. Management's Discussion and Analysis of Financial Condition and Results of Operations
The following discussion should be read in conjunction with, and is qualified in its entirety by, the consolidated financial statements and the notes thereto included elsewhere in this Annual Report on Form 10-K. The results presented reflect the Company's adoption of the new accounting guidance for revenue recognition ("ASC 606"), effective January 1, 2018. Certain prior period amounts have been adjusted to reflect the full retrospective adoption of ASC 606, with no impact to operating income, net income or Adjusted Property EBITDA.
Overview
We are a developer, owner and operator of destination casino resorts (integrated resorts). In Macau, we own approximately
72%
of WML, which includes the operations of the Wynn Palace and Wynn Macau resorts. In Las Vegas, Nevada, we operate and, with the exception of certain retail space, own 100% of Wynn Las Vegas. We are currently constructing Encore Boston Harbor, an integrated casino resort in Everett, Massachusetts.
Key Operating Measures
Certain key operating measures specific to the gaming industry are included in our discussion of our operational performance for the periods for which the Consolidated Statements of Income are presented. These key operating measures are defined below:
|
•
|
Table drop in mass market for our Macau Operations is the amount of cash that is deposited in a gaming table's drop box plus cash chips purchased at the casino cage.
|
|
•
|
Table drop for our Las Vegas Operations is the amount of cash and net markers issued that are deposited in a gaming table's drop box.
|
|
•
|
Rolling chips are non-negotiable identifiable chips that are used to track turnover for purposes of calculating incentives within our Macau Operations' VIP program.
|
|
•
|
Turnover is the sum of all losing rolling chip wagers within our Macau Operations' VIP program.
|
|
•
|
Table games win is the amount of table drop or turnover that is retained and recorded as casino revenues. Table games win is before discounts, commissions and the allocation of casino revenues to rooms, food and beverage and other revenues for services provided to casino customers on a complimentary basis.
|
|
•
|
Slot machine win is the amount of handle (representing the total amount wagered) that is retained by us and is recorded as casino revenues. Slot machine win is after adjustment for progressive accruals and free play, but before discounts and the allocation of casino revenues to rooms, food and beverage and other revenues for services provided to casino customers on a complimentary basis.
|
|
•
|
Average daily rate ("ADR") is calculated by dividing total room revenues, including complimentaries (less service charges, if any), by total rooms occupied.
|
|
•
|
Revenue per available room ("REVPAR") is calculated by dividing total room revenues, including complimentaries (less service charges, if any), by total rooms available.
|
|
•
|
Occupancy is calculated by dividing total occupied rooms, including complimentary rooms, by the total rooms available.
|
Below is a discussion of the methodologies used to calculate win percentages at our resorts.
In our VIP operations in Macau, customers primarily purchase rolling chips from the casino cage and can only use them to make wagers. Winning wagers are paid in cash chips. The loss of the rolling chips in the VIP operations is recorded as turnover and provides a base for calculating VIP win percentage. It is customary in Macau to measure VIP play using this rolling chip method. We expect our win as a percentage of turnover from these operations to be within the range of 2.7% to 3.0%. In our mass market operations in Macau, customers may purchase cash chips at either the gaming tables or at the casino cage. The measurements from our VIP and mass market operations are not comparable as the measurement method used in our mass market operations tracks the initial purchase of chips at the table and at the casino cage, while the measurement method from our VIP operations tracks the sum of all losing wagers. Accordingly, the base measurement from the VIP operations is much larger than the base measurement from the mass market operations. As a result, the expected win percentage with the same amount of gaming win is lower in the VIP operations when compared to the mass market operations.
In Las Vegas, customers purchase chips at the gaming tables. The cash and net markers used to purchase chips are deposited in the gaming table's drop box. This is the base of measurement that we use for calculating win percentage in Las Vegas. Each type of table game has its own theoretical win percentage. Our expected table games win percentage in Las Vegas is 22% to 26%.
37
Results of Operations
Summary annual results
The following table summarizes our financial results for the periods presented (in thousands, except per share data):
|
Years Ended December 31,
|
|||||||||||
|
2018
|
2017
|
2016
|
|||||||||
|
Operating revenues
|
$
|
6,717,660
|
|
$
|
6,070,160
|
|
$
|
4,345,797
|
|
||
|
Net income attributable to Wynn Resorts, Limited
|
572,430
|
|
747,181
|
|
241,975
|
|
|||||
|
Diluted net income per share
|
5.35
|
|
7.28
|
|
2.38
|
|
|||||
|
Adjusted Property EBITDA
(1)
|
2,044,413
|
|
1,810,732
|
|
1,259,327
|
|
|||||
(1) See Item 8—"Financial Statements and Supplemental Data," Note 16, "Segment Information," for a reconciliation of Adjusted Property EBITDA to net income attributable to Wynn Resorts, Limited.
For the year ended December 31,
2018
, net income attributable to Wynn Resorts, Limited was
$572.4 million
, or
$5.35
per diluted share, a
decrease
of
23.4%
, or
$174.8 million
, compared to
$747.2 million
, or
$7.28
per diluted share, for the same period of
2017
. The
decrease
in net income attributable to Wynn Resorts, Limited was primarily the result of a litigation settlement expense of
$463.6 million
, partially offset by an increase in operating income from Wynn Palace. Results for the years ended December 31, 2018 and 2017 results included net tax benefits of $390.9 million and $339.9 million, respectively, recorded in connection with U.S. tax reform.
For the year ended December 31,
2018
, Adjusted Property EBITDA was
$2.04 billion
, an increase of
12.9%
, or
$233.7 million
, from
$1.81 billion
for the same period of 2017. The increase in Adjusted Property EBITDA was the result of an
increase
of
$316.3 million
from Wynn Palace, partially offset by
decrease
s of
$27.5 million
and
$55.1 million
from Wynn Macau and our Las Vegas Operations, respectively.
For the year ended December 31, 2017, net income attributable to Wynn Resorts, Limited was $747.2 million, or $7.28 per diluted share, an increase of 208.8%, or $505.2 million, compared to $242.0 million, or $2.38 per diluted share, for the same period of 2016. The increase in net income attributable to Wynn Resorts, Limited was primarily the result of the provisional income tax benefit of $339.9 million from U.S. tax reform and increases in operating income from Wynn Palace, Wynn Macau and our Las Vegas Operations, partially offset by increases in the Redemption Note fair value and interest expense as we are no longer capitalizing interest on Wynn Palace. Wynn Palace opened on August 22, 2016, with our results for 2016 including 132 days of operations.
For the year ended December 31, 2017, Adjusted Property EBITDA was $1.81 billion, an increase of 43.8%, or $551.4 million, from $1.26 billion for the same period of 2016. The increase in Adjusted Property EBITDA was the result of increases of $424.5 million, $79.2 million, and $47.7 million from Wynn Palace, Wynn Macau and our Las Vegas Operations, respectively.
Financial results for the year ended
December 31, 2018
compared to the year ended
December 31, 2017
.
Operating revenues
The following table presents operating revenues from our Macau and Las Vegas Operations (dollars in thousands):
|
|
Years Ended December 31,
|
|||||||||||||
|
|
2018
|
2017
|
Increase / (Decrease)
|
Percent Change
|
||||||||||
|
Operating Revenues
|
||||||||||||||
|
Macau Operations:
|
||||||||||||||
|
Wynn Palace
|
$
|
2,757,566
|
|
$
|
2,030,287
|
|
$
|
727,279
|
|
35.8
|
|
|||
|
Wynn Macau
|
2,294,525
|
|
2,336,910
|
|
(42,385
|
)
|
(1.8
|
)
|
||||||
|
Total Macau Operations
|
5,052,091
|
|
4,367,197
|
|
684,894
|
|
15.7
|
|
||||||
|
Las Vegas Operations
|
1,665,569
|
|
1,702,963
|
|
(37,394
|
)
|
(2.2
|
)
|
||||||
|
$
|
6,717,660
|
|
$
|
6,070,160
|
|
$
|
647,500
|
|
10.7
|
|
||||
38
The
increase
in operating revenues was primarily driven by
increase
s in VIP turnover and table drop at Wynn Palace. The increase at Wynn Palace was partially offset by
decrease
s at Wynn Macau and our Las Vegas Operations. The decrease at Wynn Macau was primarily driven by a lower VIP table games win percentage. The decrease at our Las Vegas Operations was primarily driven by a conversion of wholly owned retail outlets to leased retail outlets in December 2017 and lower table games win percentage. The following table presents operating revenues from our casino and non-casino revenues (dollars in thousands):
|
|
Years Ended December 31,
|
||||||||||||
|
|
2018
|
2017
|
Increase / (Decrease)
|
Percent Change
|
|||||||||
|
Operating revenues
|
|||||||||||||
|
Casino revenues
|
$
|
4,784,990
|
|
$
|
4,244,303
|
|
$
|
540,687
|
|
12.7
|
|||
|
Non-casino revenues:
|
|||||||||||||
|
Rooms
|
751,800
|
|
670,957
|
|
80,843
|
|
12.0
|
||||||
|
Food and beverage
|
754,128
|
|
732,115
|
|
22,013
|
|
3.0
|
||||||
|
Entertainment, retail and other
|
426,742
|
|
422,785
|
|
3,957
|
|
0.9
|
||||||
|
Total non-casino revenues
|
1,932,670
|
|
1,825,857
|
|
106,813
|
|
5.9
|
||||||
|
$
|
6,717,660
|
|
$
|
6,070,160
|
|
$
|
647,500
|
|
10.7
|
||||
Casino revenues for the year ended December 31, 2018 were
71.2%
of operating revenues, compared to
69.9%
for the same period of
2017
. Non-casino revenues for the year ended December 31, 2018 were
28.8%
of operating revenues, compared to
30.1%
for the same period of
2017
.
Casino revenues
Casino revenues
increase
d primarily due to
increase
s in VIP turnover and table drop at Wynn Palace, partially offset by
decrease
s at Wynn Macau and our Las Vegas Operations. The table below sets forth our casino revenues and associated key operating measures for our Macau and Las Vegas Operations (dollars in thousands, except for win per unit per day):
39
|
|
Years Ended December 31,
|
|||||||||||||
|
|
2018
|
2017
|
Increase/
(Decrease) |
Percent
Change |
||||||||||
|
Macau Operations:
|
||||||||||||||
|
Wynn Palace:
|
||||||||||||||
|
Total casino revenues
|
$
|
2,356,022
|
|
$
|
1,714,417
|
|
$
|
641,605
|
|
37.4
|
|
|||
|
VIP:
|
||||||||||||||
|
Average number of table games
|
114
|
|
104
|
|
10
|
|
9.6
|
|
||||||
|
VIP turnover
|
$
|
61,097,527
|
|
$
|
52,573,258
|
|
$
|
8,524,269
|
|
16.2
|
|
|||
|
Table games win
|
$
|
1,874,189
|
|
$
|
1,486,674
|
|
$
|
387,515
|
|
26.1
|
|
|||
|
VIP win as a % of turnover
|
3.07
|
%
|
2.83
|
%
|
0.24
|
|
||||||||
|
Table games win per unit per day
|
$
|
45,006
|
|
$
|
39,325
|
|
$
|
5,681
|
|
14.4
|
|
|||
|
Mass market:
|
||||||||||||||
|
Average number of table games
|
209
|
|
202
|
|
7
|
|
3.5
|
|
||||||
|
Table drop
|
$
|
4,926,347
|
|
$
|
3,490,363
|
|
$
|
1,435,984
|
|
41.1
|
|
|||
|
Table games win
|
$
|
1,206,244
|
|
$
|
795,159
|
|
$
|
411,085
|
|
51.7
|
|
|||
|
Table games win %
|
24.5
|
%
|
22.8
|
%
|
1.7
|
|
||||||||
|
Table games win per unit per day
|
$
|
15,834
|
|
$
|
10,759
|
|
$
|
5,075
|
|
47.2
|
|
|||
|
Average number of slot machines
|
1,065
|
|
1,026
|
|
39
|
|
3.8
|
|
||||||
|
Slot machine handle
|
$
|
3,933,064
|
|
$
|
3,053,614
|
|
$
|
879,450
|
|
28.8
|
|
|||
|
Slot machine win
|
$
|
203,568
|
|
$
|
165,754
|
|
$
|
37,814
|
|
22.8
|
|
|||
|
Slot machine win per unit per day
|
$
|
524
|
|
$
|
443
|
|
$
|
81
|
|
18.3
|
|
|||
|
Wynn Macau:
|
||||||||||||||
|
Total casino revenues
|
$
|
1,994,885
|
|
$
|
2,073,793
|
|
$
|
(78,908
|
)
|
(3.8
|
)
|
|||
|
VIP:
|
||||||||||||||
|
Average number of table games
|
111
|
|
96
|
|
15
|
|
15.6
|
|
||||||
|
VIP turnover
|
$
|
57,759,607
|
|
$
|
58,303,836
|
|
$
|
(544,229
|
)
|
(0.9
|
)
|
|||
|
Table games win
|
$
|
1,588,002
|
|
$
|
1,907,625
|
|
$
|
(319,623
|
)
|
(16.8
|
)
|
|||
|
VIP win as a % of turnover
|
2.75
|
%
|
3.27
|
%
|
(0.52
|
)
|
||||||||
|
Table games win per unit per day
|
$
|
39,113
|
|
$
|
54,726
|
|
$
|
(15,613
|
)
|
(28.5
|
)
|
|||
|
Mass market:
|
||||||||||||||
|
Average number of table games
|
203
|
|
204
|
|
(1
|
)
|
(0.5
|
)
|
||||||
|
Table drop
|
$
|
5,058,332
|
|
$
|
4,525,727
|
|
$
|
532,605
|
|
11.8
|
|
|||
|
Table games win
|
$
|
1,014,484
|
|
$
|
880,964
|
|
$
|
133,520
|
|
15.2
|
|
|||
|
Table games win %
|
20.1
|
%
|
19.5
|
%
|
0.6
|
|
||||||||
|
Table games win per unit per day
|
$
|
13,698
|
|
$
|
11,820
|
|
$
|
1,878
|
|
15.9
|
|
|||
|
Average number of slot machines
|
877
|
|
914
|
|
(37
|
)
|
(4.0
|
)
|
||||||
|
Slot machine handle
|
$
|
3,740,096
|
|
$
|
3,526,747
|
|
$
|
213,349
|
|
6.0
|
|
|||
|
Slot machine win
|
$
|
161,384
|
|
$
|
154,425
|
|
$
|
6,959
|
|
4.5
|
|
|||
|
Slot machine win per unit per day
|
$
|
504
|
|
$
|
463
|
|
$
|
41
|
|
8.9
|
|
|||
40
|
|
Years Ended December 31,
|
|||||||||||||
|
|
2018
|
2017
|
Increase/
(Decrease) |
Percent
Change |
||||||||||
|
Las Vegas Operations:
|
||||||||||||||
|
Total casino revenues
|
$
|
434,083
|
|
$
|
456,093
|
|
$
|
(22,010
|
)
|
(4.8
|
)
|
|||
|
Average number of table games
|
237
|
|
236
|
|
1
|
|
0.4
|
|
||||||
|
Table drop
|
$
|
1,852,816
|
|
$
|
1,804,988
|
|
$
|
47,828
|
|
2.6
|
|
|||
|
Table games win
|
$
|
456,021
|
|
$
|
465,664
|
|
$
|
(9,643
|
)
|
(2.1
|
)
|
|||
|
Table games win %
|
24.6
|
%
|
25.8
|
%
|
(1.2
|
)
|
||||||||
|
Table games win per unit per day
|
$
|
5,282
|
|
$
|
5,415
|
|
$
|
(133
|
)
|
(2.5
|
)
|
|||
|
Average number of slot machines
|
1,822
|
|
1,856
|
|
(34
|
)
|
(1.8
|
)
|
||||||
|
Slot machine handle
|
$
|
3,237,085
|
|
$
|
3,183,369
|
|
$
|
53,716
|
|
1.7
|
|
|||
|
Slot machine win
|
$
|
213,025
|
|
$
|
218,897
|
|
$
|
(5,872
|
)
|
(2.7
|
)
|
|||
|
Slot machine win per unit per day
|
$
|
320
|
|
$
|
323
|
|
$
|
(3
|
)
|
(0.9
|
)
|
|||
Non-casino revenues
Non-casino revenues
increase
d
$85.7 million
and
$36.5 million
at
Wynn Palace
and
Wynn Macau
, partially offset by a decrease of
$15.4 million
at our
Las Vegas Operations
.
Room revenues
increase
d
$80.8 million
, primarily driven by increased ADR. The table below sets forth our room revenues and associated key operating measures for our Macau and Las Vegas Operations.
|
Years Ended December 31,
|
|||||||||||||
|
2018
|
2017
|
Increase/
(Decrease) |
Percent
Change
|
||||||||||
|
Macau Operations:
|
|||||||||||||
|
Wynn Palace:
|
|||||||||||||
|
Total room revenues (dollars in thousands)
|
$
|
170,067
|
|
$
|
121,710
|
|
$
|
48,357
|
|
39.7
|
|||
|
Occupancy
|
96.5
|
%
|
96.2
|
%
|
0.3
|
|
|||||||
|
ADR
|
$
|
265
|
|
$
|
199
|
|
$
|
66
|
|
33.2
|
|||
|
REVPAR
|
$
|
255
|
|
$
|
191
|
|
$
|
64
|
|
33.5
|
|||
|
Wynn Macau:
|
|||||||||||||
|
Total room revenues (dollars in thousands)
|
$
|
113,495
|
|
$
|
95,871
|
|
$
|
17,624
|
|
18.4
|
|||
|
Occupancy
|
99.2
|
%
|
97.5
|
%
|
1.7
|
|
|||||||
|
ADR
|
$
|
283
|
|
$
|
243
|
|
$
|
40
|
|
16.5
|
|||
|
REVPAR
|
$
|
281
|
|
$
|
237
|
|
$
|
44
|
|
18.6
|
|||
|
Las Vegas Operations:
|
|||||||||||||
|
Total room revenues (dollars in thousands)
|
$
|
468,238
|
|
$
|
453,376
|
|
$
|
14,862
|
|
3.3
|
|||
|
Occupancy
|
87.5
|
%
|
86.9
|
%
|
0.6
|
|
|||||||
|
ADR
|
$
|
314
|
|
$
|
303
|
|
$
|
11
|
|
3.6
|
|||
|
REVPAR
|
$
|
274
|
|
$
|
264
|
|
$
|
10
|
|
3.8
|
|||
Food and beverage revenues
increase
d
$14.6 million
and
$8.3 million
at Wynn Palace and Wynn Macau, respectively, driven by increased covers at our restaurants. Food and beverage revenues were relatively flat at our Las Vegas Operations.
Entertainment, retail and other revenues
increase
d
$22.8 million
and
$10.6 million
at Wynn Palace and Wynn Macau, primarily due to an increase in retail revenues. Additionally, Wynn Palace and Wynn Macau recorded business interruption insurance proceeds of $5.4 million and $5.3 million, respectively, related to the full settlement of claims from Typhoon Hato in 2017. Our Las Vegas Operations
decrease
d
$29.4 million
, primarily due to a conversion of wholly owned retail outlets to leased retail outlets, and the closure of the golf course in December 2017. We expect to reopen the golf course in the fourth quarter of 2019.
41
Operating expenses
|
|
Years Ended December 31,
|
|||||||||||||
|
|
2018
|
2017
|
Increase / (Decrease)
|
Percent Change
|
||||||||||
|
Operating expenses:
|
||||||||||||||
|
Casino
|
$
|
3,036,907
|
|
$
|
2,718,120
|
|
$
|
318,787
|
|
11.7
|
|
|||
|
Rooms
|
254,549
|
|
244,828
|
|
9,721
|
|
4.0
|
|
||||||
|
Food and beverage
|
611,706
|
|
567,690
|
|
44,016
|
|
7.8
|
|
||||||
|
Entertainment, retail and other
|
183,113
|
|
196,547
|
|
(13,434
|
)
|
(6.8
|
)
|
||||||
|
General and administrative
|
761,415
|
|
685,485
|
|
75,930
|
|
11.1
|
|
||||||
|
Litigation settlement
|
463,557
|
|
—
|
|
463,557
|
|
NM
|
|
||||||
|
Provision (benefit) for doubtful accounts
|
6,527
|
|
(6,711
|
)
|
13,238
|
|
NM
|
|
||||||
|
Pre-opening
|
53,490
|
|
26,692
|
|
26,798
|
|
100.4
|
|
||||||
|
Depreciation and amortization
|
550,596
|
|
552,368
|
|
(1,772
|
)
|
(0.3
|
)
|
||||||
|
Property charges and other
|
60,256
|
|
29,576
|
|
30,680
|
|
103.7
|
|
||||||
|
Total operating expenses
|
$
|
5,982,116
|
|
$
|
5,014,595
|
|
$
|
967,521
|
|
19.3
|
|
|||
NM - Not meaningful.
Total operating expenses
increase
d primarily due to a litigation settlement expense of
$463.6 million
, and an
increase
of
$408.7 million
at Wynn Palace, which primarily related to
increase
d gaming taxes commensurate with
increase
d casino revenues.
Casino expenses
increase
d
$363.0 million
at Wynn Palace, partially offset by a
decrease
of
$45.0 million
at Wynn Macau. Our Las Vegas Operations were relatively flat. The increase in casino expenses was primarily driven by gaming taxes commensurate with an increase in casino revenue at Wynn Palace.
Rooms expenses
increase
d
$8.9 million
at our Las Vegas Operations and were relatively flat at Wynn Palace and Wynn Macau. The
increase
at our Las Vegas Operations primarily related to repairs and maintenance expenses and increased payroll costs.
Food and beverage expenses
increase
d
$20.1 million
,
$7.8 million
and
$16.1 million
at Wynn Palace, Wynn Macau, and at our Las Vegas Operations, respectively. The
increase
s at Wynn Palace and Wynn Macau were commensurate with food and beverage revenue increases. The
increase
at our Las Vegas Operations was primarily driven by increased payroll costs and higher costs for entertainment at Wynn Las Vegas nightclubs.
Entertainment, retail and other expenses
increase
d
$6.9 million
and
$1.6 million
at Wynn Palace and Wynn Macau, offset by a
decrease
of
$21.9 million
at our Las Vegas Operations. The
decrease
at our Las Vegas Operations was primarily driven by a conversion of wholly owned retail outlets to leased retail outlets and the closure of the golf course in December of 2017. The
increase
in expenses at Wynn Palace and Wynn Macau was commensurate with the
increase
in entertainment, retail and other revenues.
General and administrative expenses
increase
d
$18.8 million
,
$9.5 million
, and
$12.2 million
, at
Wynn Palace
,
Wynn Macau
and our Las Vegas Operations, respectively. These increases were attributable to increased payroll costs at our Macau Operations and increased payroll and advertising costs at our Las Vegas Operations. Corporate and other general and administrative expenses increased $35.4 million, primarily as a result of increased legal expenses and a fine of $20.0 million assessed by the NGC on February 26, 2019, in connection with the conclusion of an NGCB investigation which had commenced in 2018.
Litigation settlement expense of
$463.6 million
was incurred in connection with the repayment of the Redemption Note for claims related to the allegedly below-market interest rate of the Redemption Note. For more information, see
Item 8
—"
Financial Statements and Supplementary Data
,"
Note 15
, "Commitments and Contingencies."
The provision for doubtful accounts was
$6.5 million
for the year ended
December 31, 2018
, compared with a benefit of
$6.7 million
for the year ended December 31, 2017. The benefit in the prior year was due to the collection of certain casino accounts receivable resulting in the reversal of previously recorded allowance for doubtful accounts. The balance can fluctuate due to the
42
impact of historical collection patterns and current collection trends, as well as the specific review of customer accounts, on our estimated allowance for the respective periods.
For the year ended December 31,
2018
, pre-opening expenses totaled
$53.5 million
, including approximately $51.6 million related to the development of Encore Boston Harbor. For the year ended December 31, 2017, we incurred pre-opening expenses of $25.9 million related to the development of Encore Boston Harbor.
The table below sets forth our property charges and other expenses (dollars in thousands):
|
|
Years Ended December 31,
|
||||||
|
|
2018
|
2017
|
|||||
|
Macau Operations
|
|||||||
|
Wynn Palace asset abandonment and retirements
|
$
|
9,830
|
|
$
|
12,663
|
|
|
|
Wynn Macau asset abandonment and retirements
|
11,574
|
|
6,688
|
|
|||
|
Total Macau Operations property charges and other expenses
|
21,404
|
|
19,351
|
|
|||
|
Las Vegas Operations
|
|||||||
|
Asset abandonment and retirements
|
4,412
|
|
1,598
|
|
|||
|
Contract termination
|
2,194
|
|
3,000
|
|
|||
|
Employee severance
|
8,280
|
|
—
|
|
|||
|
Total Las Vegas Operations property charges and other expenses
|
14,886
|
|
4,598
|
|
|||
|
Corporate and Other
|
|||||||
|
Asset abandonment and retirements
|
9,294
|
|
5,627
|
|
|||
|
Loss on disposal of aircraft
|
14,672
|
|
—
|
|
|||
|
Total Corporate and Other property charges and other expenses
|
23,966
|
|
5,627
|
|
|||
|
Total property charges and other expenses
|
$
|
60,256
|
|
$
|
29,576
|
|
|
Interest expense, net of capitalized interest
The following table summarizes information related to interest expense (dollars in thousands):
|
|
Years Ended December 31,
|
||||||||||||||
|
|
2018
|
2017
|
Increase / (Decrease)
|
Percent Change
|
|||||||||||
|
Interest expense
|
|||||||||||||||
|
Interest cost, including amortization of debt issuance costs and original issue discount and premium
|
$
|
439,157
|
|
$
|
407,098
|
|
$
|
32,059
|
|
7.9
|
|
||||
|
Capitalized interest
|
(57,308
|
)
|
(18,434
|
)
|
(38,874
|
)
|
210.9
|
|
|||||||
|
$
|
381,849
|
|
$
|
388,664
|
|
$
|
(6,815
|
)
|
(1.8
|
)
|
|||||
|
Weighted average total debt balance
|
$
|
9,155,978
|
|
$
|
10,031,005
|
|
|||||||||
|
Weighted average interest rate
|
4.80
|
%
|
4.06
|
%
|
|||||||||||
Interest costs
increase
d due to an increase in the weighted average interest rate, partially offset by a
decrease
in the weighted average debt balance. Capitalized interest
increase
d due to Encore Boston Harbor construction activities.
Other non-operating income and expenses
We incurred losses of
$69.3 million
and
$59.7 million
for the years ended
December 31, 2018
and
2017
, respectively, from the change in fair value of the Redemption Note prior to its repayment in March 2018. For more information on the methodology
43
and assumptions used in determining the fair value of the Redemption Note, see Item 8—"Financial Statements and Supplementary Data,"
Note 2
, "Summary of Significant Accounting Policies." During the first quarter of 2018, we repaid the $1.94 billion principal amount of the Redemption Note.
We recorded a
$0.1 million
net gain on extinguishment of debt for the year ended
December 31, 2018
related to the repayment of the Redemption Note, offset by a loss on debt extinguishment associated with the amendment of the Wynn Macau Credit Facilities. We incurred a loss of $55.4 million on the extinguishment of debt for the year ended December 31, 2017. During the year ended December 31, 2017, we completed a cash tender offer and subsequent redemption of our 5 3/8% First Mortgage Notes due 2022 (the "2022 Notes") and issued our 5 1/4% Senior Notes due 2027 (the "2027 WLV Notes"). We also completed a cash tender offer and subsequent redemption of our 5 1/4% Senior Notes ("2021 Notes") and issued our 4 7/8% Senior Notes due 2024 (the "2024 WML Notes") and 5 1/2% Senior Notes due 2027 (the "2027 WML Notes"), together (the "WML Notes"). We recorded losses on extinguishment of debt of $20.8 million in connection with the 2022 Notes and 2027 WLV Notes transactions and $33.1 million in connection with the WML Notes transactions. Additionally, in connection with an amendment of our Wynn America credit facilities, we recorded a loss on extinguishment of debt of $1.5 million.
We incurred losses of
$4.1 million
and
$21.7 million
for the years ended December 31,
2018
and
2017
, respectively, from foreign currency remeasurements. The losses were primarily due to the impact of the exchange rate fluctuation of the Macau pataca, in relation to the U.S. dollar, on the remeasurements of U.S. dollar denominated debt and other obligations from our Macau-related entities.
Income Taxes
For the years ended
December 31, 2018
and
2017
, we recorded tax benefits of
$497.3 million
and
$329.0 million
, respectively. During the fourth quarter of 2018, the Company finalized its analysis of U.S. tax reform, which was enacted in the fourth quarter of 2017 and further clarified by guidance issued by the Internal Revenue Service in the fourth quarter of 2018. The guidance addressed the treatment of foreign-sourced royalties and the allocation of interest expense and other expenses to foreign source income. As a result, the Company adjusted its valuation allowance for FTC carryovers in the fourth quarter of 2018 and recorded a net tax benefit of
$390.9 million
, which is incremental to the
$339.9 million
provisional net tax benefit recorded in 2017 associated with U.S. tax reform.
Wynn Macau SA received a five-year exemption from the Macau Complementary Tax on casino gaming profits through December 31, 2020. For the years ended
December 31, 2018
and
2017
, we were exempt from the payment of
$96.8 million
and
$63.0 million
, respectively, in such taxes. Our non-gaming profits remain subject to the Macau Complementary Tax and casino winnings remain subject to the Macau special gaming tax and other levies together totaling 39% in accordance with our concession agreement.
In August 2016, Wynn Macau SA received an extension of its agreement with the Macau government that provides for an annual payment of 12.8 million Macau patacas (approximately $1.6 million) as complementary tax due by stockholders on dividend distributions through December 31, 2020.
We have participated in the Internal Revenue Service ("IRS") Compliance Assurance Program ("CAP") for the 2012 through
2018
tax years and will continue to participate in the IRS CAP for the
2019
tax year.
In February 2017 and 2018, the IRS completed an examination of our 2015 and 2016 U.S. tax return, respectively, and had no changes.
In March 2017, the Financial Services Bureau commenced an examination of the 2013 and 2014 Macau income tax returns of Wynn Macau SA. In July 2018, the Financial Services Bureau issued final tax assessments for the Company for the years 2013 and 2014. While no additional tax was due, adjustments were made to the Company’s tax loss carryforwards.
In July 2017, the Financial Services Bureau commenced an examination of the 2013 and 2014 Macau income tax returns of Palo Real Estate Company Limited ("Palo"), a subsidiary of Wynn Macau SA. In February 2018, the Financial Services Bureau concluded its examination with no changes.
Net income attributable to noncontrolling interests
Net income attributable to noncontrolling interests was
$230.7 million
, compared to
$142.1 million
for the year ended
December 31, 2017
. These amounts are primarily related to the noncontrolling interests' share of net income from WML.
44
Financial results for the year ended
December 31, 2017
compared to the year ended
December 31, 2016
.
Operating Revenues
The following table presents operating revenues from our Macau and Las Vegas Operations (dollars in thousands):
|
|
Years Ended December 31,
|
||||||||||||
|
|
2017
|
2016
|
Increase / (Decrease)
|
Percent Change
|
|||||||||
|
Operating revenues
|
|||||||||||||
|
Macau Operations:
|
|||||||||||||
|
Wynn Palace
(1)
|
$
|
2,030,287
|
|
$
|
555,574
|
|
$
|
1,474,713
|
|
265.4
|
|||
|
Wynn Macau
|
2,336,910
|
|
2,150,721
|
|
186,189
|
|
8.7
|
||||||
|
Total Macau Operations
|
4,367,197
|
|
2,706,295
|
|
1,660,902
|
|
61.4
|
||||||
|
Las Vegas Operations
|
1,702,963
|
|
1,639,502
|
|
63,461
|
|
3.9
|
||||||
|
$
|
6,070,160
|
|
$
|
4,345,797
|
|
$
|
1,724,363
|
|
39.7
|
||||
(1)
Wynn Palace opened on August 22, 2016.
The
increase
in operating revenues was primarily attributable to a full year of operations at Wynn Palace for year ended December 31,
2017
, compared to 132 days of operations in the year ended December 31,
2016
. The following table presents operating revenues from our casino revenues and non-casino revenues (dollars in thousands):
|
|
Years Ended December 31,
|
||||||||||||
|
|
2017
|
2016
|
Increase / (Decrease)
|
Percent Change
|
|||||||||
|
Operating revenues
|
|||||||||||||
|
Casino revenues
|
$
|
4,244,303
|
|
$
|
2,750,890
|
|
$
|
1,493,413
|
|
54.3
|
|||
|
Non-casino revenues:
|
|||||||||||||
|
Rooms
|
670,957
|
|
595,610
|
|
75,347
|
|
12.7
|
||||||
|
Food and beverage
|
732,115
|
|
635,411
|
|
96,704
|
|
15.2
|
||||||
|
Entertainment, retail and other
|
422,785
|
|
363,886
|
|
58,899
|
|
16.2
|
||||||
|
Total non-casino revenues
|
1,825,857
|
|
1,594,907
|
|
230,950
|
|
14.5
|
||||||
|
$
|
6,070,160
|
|
$
|
4,345,797
|
|
$
|
1,724,363
|
|
39.7
|
||||
Casino revenues for the year ended December 31, 2017 were
69.9%
of total operating revenues, compared to
63.3%
for the year ended December 31,
2016
. Non-casino revenues for the year ended December 31, 2017 were
30.1%
of total operating revenues, compared to
36.7%
for the year ended December 31,
2016
.
Casino Revenues
The
increase
in casino revenues was primarily attributable to the contribution of a full year of operations at Wynn Palace, compared to 132 days of operations in the year ended December 31, 2016. Wynn Macau casino revenues
increase
d primarily due to a
23.9%
increase
in VIP turnover. Casino revenues at our Las Vegas Operations
increase
d
$18.7 million
, driven by
increase
s in table games win percentage and slot machine win. The table below sets forth our casino revenues and associated key operating measures for our Macau and Las Vegas Operations (dollars in thousands, except for win per unit per day).
45
|
|
Years Ended December 31,
|
|||||||||||||
|
|
2017
|
2016
|
Increase/
(Decrease) |
Percent
Change |
||||||||||
|
Macau Operations:
|
||||||||||||||
|
Wynn Palace
(1)
:
|
||||||||||||||
|
Total casino revenues
|
$
|
1,714,417
|
|
$
|
448,006
|
|
$
|
1,266,411
|
|
282.7
|
|
|||
|
VIP:
|
||||||||||||||
|
Average number of table games
|
104
|
|
81
|
|
23
|
|
28.4
|
|
||||||
|
VIP turnover
|
$
|
52,573,258
|
|
$
|
14,480,023
|
|
$
|
38,093,235
|
|
263.1
|
|
|||
|
Table games win
|
$
|
1,486,674
|
|
$
|
396,954
|
|
$
|
1,089,720
|
|
274.5
|
|
|||
|
VIP win as a % of turnover
|
2.83
|
%
|
2.74
|
%
|
0.09
|
|
||||||||
|
Table games win per unit per day
|
$
|
39,325
|
|
$
|
37,009
|
|
$
|
2,316
|
|
6.3
|
|
|||
|
Mass market:
|
||||||||||||||
|
Average number of table games
|
202
|
|
245
|
|
(43
|
)
|
(17.6
|
)
|
||||||
|
Table drop
|
$
|
3,490,363
|
|
$
|
1,000,881
|
|
$
|
2,489,482
|
|
248.7
|
|
|||
|
Table games win
|
$
|
795,159
|
|
$
|
211,146
|
|
$
|
584,013
|
|
276.6
|
|
|||
|
Table games win %
|
22.8
|
%
|
21.1
|
%
|
1.7
|
|
||||||||
|
Table games win per unit per day
|
$
|
10,759
|
|
$
|
6,527
|
|
$
|
4,232
|
|
64.8
|
|
|||
|
Average number of slot machines
|
1,026
|
|
962
|
|
64
|
|
6.7
|
|
||||||
|
Slot machine handle
|
$
|
3,053,614
|
|
$
|
738,907
|
|
$
|
2,314,707
|
|
313.3
|
|
|||
|
Slot machine win
|
$
|
165,754
|
|
$
|
40,664
|
|
$
|
125,090
|
|
307.6
|
|
|||
|
Slot machine win per unit per day
|
$
|
443
|
|
$
|
320
|
|
$
|
123
|
|
38.4
|
|
|||
|
Wynn Macau:
|
||||||||||||||
|
Total casino revenues
|
$
|
2,073,793
|
|
$
|
1,865,512
|
|
$
|
208,281
|
|
11.2
|
|
|||
|
VIP:
|
||||||||||||||
|
Average number of table games
|
96
|
|
149
|
|
(53
|
)
|
(35.6
|
)
|
||||||
|
VIP turnover
|
$
|
58,303,836
|
|
$
|
47,048,754
|
|
$
|
11,255,082
|
|
23.9
|
|
|||
|
Table games win
|
$
|
1,907,625
|
|
$
|
1,547,261
|
|
$
|
360,364
|
|
23.3
|
|
|||
|
VIP win as a % of turnover
|
3.27
|
%
|
3.29
|
%
|
(0.02
|
)
|
||||||||
|
Table games win per unit per day
|
$
|
54,726
|
|
$
|
28,332
|
|
$
|
26,394
|
|
93.2
|
|
|||
|
Mass market:
|
||||||||||||||
|
Average number of table games
|
204
|
|
216
|
|
(12
|
)
|
(5.6
|
)
|
||||||
|
Table drop
|
$
|
4,525,727
|
|
$
|
4,585,476
|
|
$
|
(59,749
|
)
|
(1.3
|
)
|
|||
|
Table games win
|
$
|
880,964
|
|
$
|
881,797
|
|
$
|
(833
|
)
|
(0.1
|
)
|
|||
|
Table games win %
|
19.5
|
%
|
19.2
|
%
|
0.3
|
|
||||||||
|
Table games win per unit per day
|
$
|
11,820
|
|
$
|
11,131
|
|
$
|
689
|
|
6.2
|
|
|||
|
Average number of slot machines
|
914
|
|
802
|
|
112
|
|
14.0
|
|
||||||
|
Slot machine handle
|
$
|
3,526,747
|
|
$
|
3,386,973
|
|
$
|
139,774
|
|
4.1
|
|
|||
|
Slot machine win
|
$
|
154,425
|
|
$
|
145,680
|
|
$
|
8,745
|
|
6.0
|
|
|||
|
Slot machine win per unit per day
|
$
|
463
|
|
$
|
497
|
|
$
|
(34
|
)
|
(6.8
|
)
|
|||
(1)
Wynn Palace opened on August 22, 2016.
46
|
|
Years Ended December 31,
|
|||||||||||||
|
|
2017
|
2016
|
Increase/
(Decrease) |
Percent
Change |
||||||||||
|
Las Vegas Operations:
|
||||||||||||||
|
Total casino revenues
|
$
|
456,093
|
|
$
|
437,372
|
|
$
|
18,721
|
|
4.3
|
|
|||
|
Average number of table games
|
236
|
|
235
|
|
1
|
|
0.4
|
|
||||||
|
Table drop
|
$
|
1,804,988
|
|
$
|
1,838,479
|
|
$
|
(33,491
|
)
|
(1.8
|
)
|
|||
|
Table games win
|
$
|
465,664
|
|
$
|
465,041
|
|
$
|
623
|
|
0.1
|
|
|||
|
Table games win %
|
25.8
|
%
|
25.3
|
%
|
0.5
|
|
||||||||
|
Table games win per unit per day
|
$
|
5,415
|
|
$
|
5,406
|
|
$
|
9
|
|
0.2
|
|
|||
|
Average number of slot machines
|
1,856
|
|
1,893
|
|
(37
|
)
|
(2.0
|
)
|
||||||
|
Slot machine handle
|
$
|
3,183,369
|
|
$
|
3,148,610
|
|
$
|
34,759
|
|
1.1
|
|
|||
|
Slot machine win
|
$
|
218,897
|
|
$
|
208,024
|
|
$
|
10,873
|
|
5.2
|
|
|||
|
Slot machine win per unit per day
|
$
|
323
|
|
$
|
300
|
|
$
|
23
|
|
7.7
|
|
|||
Non-casino revenues
Non-casino revenues
increase
d
$208.3 million
and
$44.7 million
at Wynn Palace and our Las Vegas Operations, offset by a
decrease
of
$22.1 million
at Wynn Macau.
Room revenues
increase
d
$75.3 million
, primarily due to a full year of operations at Wynn Palace. The table below sets forth our rooms revenue and associated key operating measures for our Macau and Las Vegas Operations:
|
Years Ended December 31,
|
||||||||||||||
|
2017
|
2016
|
Increase/
(Decrease) |
Percent
Change |
|||||||||||
|
Macau Operations:
|
||||||||||||||
|
Wynn Palace
(1)
:
|
||||||||||||||
|
Total room revenues (dollars in thousands)
|
$
|
121,710
|
|
$
|
45,112
|
|
$
|
76,598
|
|
169.8
|
|
|||
|
Occupancy
|
96.2
|
%
|
83.2
|
%
|
13.0
|
|
||||||||
|
ADR
|
$
|
199
|
|
$
|
232
|
|
$
|
(33
|
)
|
(14.2
|
)
|
|||
|
REVPAR
|
$
|
191
|
|
$
|
193
|
|
$
|
(2
|
)
|
(1.0
|
)
|
|||
|
Wynn Macau:
|
|
|||||||||||||
|
Total room revenues (dollars in thousands)
|
$
|
95,871
|
|
$
|
113,014
|
|
$
|
(17,143
|
)
|
(15.2
|
)
|
|||
|
Occupancy
|
97.5
|
%
|
94.4
|
%
|
3.1
|
|
||||||||
|
ADR
|
$
|
243
|
|
$
|
277
|
|
$
|
(34
|
)
|
(12.3
|
)
|
|||
|
REVPAR
|
$
|
237
|
|
$
|
262
|
|
$
|
(25
|
)
|
(9.5
|
)
|
|||
|
Las Vegas Operations:
|
|
|||||||||||||
|
Total room revenues (dollars in thousands)
|
$
|
453,376
|
|
$
|
437,484
|
|
$
|
15,892
|
|
3.6
|
|
|||
|
Occupancy
|
86.9
|
%
|
85.3
|
%
|
1.6
|
|
||||||||
|
ADR
|
$
|
303
|
|
$
|
297
|
|
$
|
6
|
|
2.0
|
|
|||
|
REVPAR
|
$
|
264
|
|
$
|
253
|
|
$
|
11
|
|
4.3
|
|
|||
(1) Wynn Palace opened on August 22, 2016.
Food and beverage revenues
increase
d
$68.3 million
and
$32.2 million
at Wynn Palace and our Las Vegas Operations, partially offset by a
decrease
of
$3.8 million
at Wynn Macau. The
increase
at Wynn Palace was the result of its first full year of operations, while the
increase
at our Las Vegas Operations was primarily driven by
increase
d revenues at our nightclubs.
47
Entertainment, retail and other revenues
increase
d
$63.4 million
at Wynn Palace, driven by a full year of operations. Wynn Macau and our Las Vegas Operations
decrease
d
$1.2 million
and
$3.4 million
, respectively.
Operating expenses
|
|
Years Ended December 31,
|
|||||||||||||
|
|
2017
|
2016
|
Increase / (Decrease)
|
Percent Change
|
||||||||||
|
Operating expenses:
|
||||||||||||||
|
Casino
|
$
|
2,718,120
|
|
$
|
1,768,320
|
|
$
|
949,800
|
|
53.7
|
|
|||
|
Rooms
|
244,828
|
|
206,848
|
|
37,980
|
|
18.4
|
|
||||||
|
Food and beverage
|
567,690
|
|
499,202
|
|
68,488
|
|
13.7
|
|
||||||
|
Entertainment, retail and other
|
196,547
|
|
179,150
|
|
17,397
|
|
9.7
|
|
||||||
|
General and administrative
|
685,485
|
|
548,143
|
|
137,342
|
|
25.1
|
|
||||||
|
(Benefit) provision for doubtful accounts
|
(6,711
|
)
|
8,203
|
|
(14,914
|
)
|
(181.8
|
)
|
||||||
|
Pre-opening
|
26,692
|
|
154,717
|
|
(128,025
|
)
|
(82.7
|
)
|
||||||
|
Depreciation and amortization
|
552,368
|
|
404,730
|
|
147,638
|
|
36.5
|
|
||||||
|
Property charges and other
|
29,576
|
|
54,822
|
|
(25,246
|
)
|
(46.1
|
)
|
||||||
|
Total operating expenses
|
$
|
5,014,595
|
|
$
|
3,824,135
|
|
$
|
1,190,460
|
|
31.1
|
|
|||
Total operating expenses
increase
d primarily due to increased casino, general and administrative and depreciation and amortization expenses, offset by decreased pre-opening expenses, all primarily related to the opening of Wynn Palace.
Casino expenses
increase
d
$835.7 million
and
$116.5 million
at Wynn Palace and Wynn Macau, partially offset by a
decrease
of
$2.5 million
at our Las Vegas Operations. The increase at Wynn Macau was driven by gaming taxes, which increased commensurate with the increase in casino revenues.
Rooms expenses
increase
d
$29.6 million
and
$8.3 million
at Wynn Palace and our Las Vegas Operations, primarily attributable to expenses associated with the increase in occupancy and an increase in labor costs.
Food and beverage expenses
increase
d
$57.9 million
and
$16.2 million
at Wynn Palace and our Las Vegas Operations, partially offset by Wynn Macau, which
decrease
d
$5.6 million
. The
increase
from our Las Vegas Operations was primarily driven by an increase in labor costs.
Entertainment, retail and other expenses
increase
d primarily due to a full year of operations at Wynn Palace.
General and administrative expenses
increase
d primarily due to a full year of operations at Wynn Palace.
The provision for doubtful accounts was a benefit of
$6.7 million
for the year ended December 31, 2017, compared to an expense of
$8.2 million
for the year ended December 31,
2016
. The change was due to the collection of certain casino accounts receivable that resulted in the reversal of previously recorded allowance for doubtful accounts.
For the year ended December 31,
2017
, we incurred pre-opening expenses of $25.9 million related to Encore Boston Harbor and $0.2 million related to our Las Vegas Operations. For the year ended December 31,
2016
, we incurred $129.8 million related to Wynn Palace, $22.7 million related to Encore Boston Harbor, and $2.3 million related to our Las Vegas Operations.
Depreciation and amortization expense
increase
d primarily due to a full year of depreciation for Wynn Palace, which was placed in service in August 2016.
For the year ended December 31, 2017, we incurred property charges and other expenses of $12.6 million and $6.7 million at Wynn Palace and Wynn Macau, respectively, primarily due to abandonment charges and asset retirements associated with various renovation projects and estimated costs related to property damage caused by a typhoon that impacted Macau. In addition, we incurred $10.6 million in charges from our Las Vegas Operations primarily related to miscellaneous renovations. For the year ended December 31, 2016, we incurred a $15.5 million exit fee for the right to procure energy for our Las Vegas Operations from
48
the wholesale energy markets instead of from the local public electric utility, $14.1 million for the write-down of the carrying value to the purchase price of an aircraft we sold in January 2017, $10.1 million in abandonment charges related to current construction of additional retail space at our Las Vegas Operations and $5.5 million for the write-off of show production costs due to the closing of Steve Wynn's ShowStoppers in December 2016.
Interest expense, net of capitalized interest
The following table summarizes information related to interest expense (dollars in thousands):
|
|
Years Ended December 31,
|
||||||||||||||
|
|
2017
|
2016
|
Increase / (Decrease)
|
Percent Change
|
|||||||||||
|
Interest expense
|
|||||||||||||||
|
Interest cost, including amortization of debt issuance costs and original issue discount and premium
|
$
|
407,098
|
|
$
|
383,497
|
|
$
|
23,601
|
|
6.2
|
|
||||
|
Capitalized interest
|
(18,434
|
)
|
(94,132
|
)
|
75,698
|
|
(80.4
|
)
|
|||||||
|
$
|
388,664
|
|
$
|
289,365
|
|
$
|
99,299
|
|
34.3
|
|
|||||
|
Weighted average total debt balance
|
$
|
10,031,005
|
|
$
|
9,564,845
|
|
|||||||||
|
Weighted average interest rate
|
4.06
|
%
|
4.00
|
%
|
|||||||||||
For the year ended December 31,
2017
, interest costs increased primarily due to an increase in the weighted average total debt balance. The increase in the weighted average total debt balance was primarily driven by borrowings under the Wynn America credit facilities. Capitalized interest decreased primarily due to the completion of Wynn Palace construction activities in August of 2016, and a $25.6 million out-of-period adjustment recorded in the first quarter of 2016. During the first quarter of 2016, we corrected immaterial amounts of additional interest that should have been capitalized instead of being expensed during the years ended December 31, 2015 and 2014.
Other non-operating income and expenses
We recorded a loss of
$59.7 million
and a gain of
$65.0 million
for the years ended
December 31, 2017
and
2016
, respectively, from the change in fair value of the Redemption Note. The change in fair value was a result of changes in certain variables used to calculate its estimated fair value.
We recorded a gain of
$1.1 million
and a loss of
$0.4 million
from the change in the fair value of derivatives for the years ended
December 31, 2017
and
2016
, respectively.
Interest income was
$31.2 million
for the year ended
December 31, 2017
, compared to
$13.5 million
for the same period of
2016
. During the years ended
December 31, 2017
and
2016
, our short-term investment strategy was to preserve capital while retaining sufficient liquidity. The majority of our short-term investment amounts were in fixed deposits and money market accounts with a maturity of three months or less.
Income Taxes
For the years ended
December 31, 2017
and
2016
, we recorded a tax expense of
$329.0 million
and
$8.1 million
, respectively. Our income tax benefit for the year ended
December 31, 2017
primarily related to a provisional tax benefit of $339.9 million resulting from the impact of U.S. tax reform on the Company's deferred taxes. Our income tax expense for the year ended December 31, 2016 primarily related to an increase in our deferred tax liabilities.
Wynn Macau SA received a five-year exemption from the Macau Complementary Tax on casino gaming profits through December 31, 2020. For the years ended
December 31, 2017
and
2016
, we were exempt from the payment of
$63.0 million
and $27.3 million, respectively, in such taxes. Our non-gaming profits remain subject to the Macau Complementary Tax and casino winnings remain subject to the Macau special gaming tax and other levies together totaling 39% in accordance with our concession agreement.
49
In August 2016, Wynn Macau SA received an extension of its agreement with the Macau government that provides for an annual payment of 12.8 million Macau patacas (approximately $1.6 million) as complementary tax due by stockholders on dividend distributions. This agreement on dividends is effective through December 31, 2020.
We have participated in the Internal Revenue Service ("IRS") Compliance Assurance Program ("CAP") for the 2012 through
2018
tax years and will continue to participate in the IRS CAP for the
2019
tax year. In February 2017 and 2018, the IRS completed an examination of our 2015 and 2016 U.S. tax return, respectively, and had no changes.
In March 2017, the Financial Services Bureau commenced an examination of the 2013 and 2014 Macau income tax returns of Wynn Macau SA. As of December 31, 2017, we believed no changes to the unrecognized tax benefits were required.
In July 2017, the Financial Services Bureau commenced an examination of the 2013 and 2014 Macau income tax returns of Palo Real Estate Company Limited ("Palo"), a subsidiary of Wynn Macau SA. In February 2018, the Financial Services Bureau concluded its examination with no changes.
Net income attributable to noncontrolling interests
Net income attributable to noncontrolling interests was
$142.1 million
for the year ended
December 31, 2017
, compared to
$60.5 million
for the year ended
December 31, 2016
. These amounts are primarily related to the noncontrolling interests' share of net income from WML.
Adjusted Property EBITDA
We use Adjusted Property EBITDA to manage the operating results of our segments. Adjusted Property EBITDA is net income before interest, income taxes, depreciation and amortization, litigation settlement expense, pre-opening expenses, property charges and other, management and license fees, corporate expenses and other (including intercompany golf course and water rights leases), stock-based compensation, (loss) gain on extinguishment of debt, change in derivatives fair value, change in Redemption Note fair value and other non-operating income and expenses. Adjusted Property EBITDA is presented exclusively as a supplemental disclosure because we believe that it is widely used to measure the performance, and as a basis for valuation, of gaming companies. We use Adjusted Property EBITDA as a measure of the operating performance of our segments and to compare the operating performance of our properties with those of our competitors, as well as a basis for determining certain incentive compensation. We also present Adjusted Property EBITDA because it is used by some investors as a way to measure a company's ability to incur and service debt, make capital expenditures and meet working capital requirements. Gaming companies have historically reported EBITDA as a supplement to financial measures in accordance with U.S. generally accepted accounting principles ("GAAP"). In order to view the operations of their casinos on a more stand-alone basis, gaming companies, including us, have historically excluded from their EBITDA calculations pre-opening expenses, property charges, corporate expenses and stock-based compensation that do not relate to the management of specific casino properties. However, Adjusted Property EBITDA should not be considered as an alternative to operating income as an indicator of our performance, as an alternative to cash flows from operating activities as a measure of liquidity, or as an alternative to any other measure determined in accordance with GAAP. Unlike net income, Adjusted Property EBITDA does not include depreciation or interest expense and therefore does not reflect current or future capital expenditures or the cost of capital. We have significant uses of cash flows, including capital expenditures, interest payments, debt principal repayments, income taxes and other non-recurring charges, which are not reflected in Adjusted Property EBITDA. Also, our calculation of Adjusted Property EBITDA may be different from the calculation methods used by other companies and, therefore, comparability may be limited.
The following table summarizes Adjusted Property EBITDA (in thousands) for our Macau and Las Vegas Operations as reviewed by management and summarized in Item 8—"Financial Statements and Supplementary Data,"
Note 16
, "Segment Information." That footnote also presents a reconciliation of Adjusted Property EBITDA to net income attributable to Wynn Resorts, Limited.
|
Years Ended December 31,
|
|||||||||||
|
2018
|
2017
|
2016
|
|||||||||
|
Wynn Palace
(1)
|
$
|
843,902
|
|
$
|
527,583
|
|
$
|
103,036
|
|
||
|
Wynn Macau
|
$
|
733,238
|
|
$
|
760,752
|
|
$
|
681,509
|
|
||
|
Las Vegas Operations
|
$
|
467,273
|
|
$
|
522,397
|
|
$
|
474,766
|
|
||
(1) Wynn Palace opened on August 22, 2016
.
50
Adjusted Property EBITDA at Wynn Palace
increase
d
60.0%
for the year ended December 31, 2018, compared to the same period of 2017. Since opening in August 2016, Wynn Palace has experienced significant business volume increases in both VIP and mass market operations during its first two full years of operations. Wynn Palace operated for the final 132 days of
2016
, which does not compare meaningfully to
2017
.
Adjusted Property EBITDA at Wynn Macau
decrease
d
3.6%
for the year ended December 31, 2018, compared to the same period of 2017, primarily due to a decrease in VIP win as a percentage of turnover, partially offset by increases in mass market table games win and slot machine win. Adjusted Property EBITDA at Wynn Macau increased 11.6% for the year ended December 31, 2017, compared to the same period of 2016, primarily due to improved VIP operations driven by a year-over-year increase in VIP turnover.
Adjusted Property EBITDA at our Las Vegas Operations
decrease
d
10.6%
for the year ended December 31, 2018, compared to the same period of 2017, primarily due to decreased table and slot win and increased operating expenses. Adjusted Property EBITDA at our Las Vegas Operations increased 10.0% for the year ended December 31, 2017, compared to the same period of 2016, primarily due to improved casino operations and food and beverage operations.
Refer to the discussions above regarding the specific details of our results of operations.
Liquidity and Capital Resources
Cash Flows - Summary
Our cash flows were as follows (in thousands):
|
Years Ended December 31,
|
|||||||||||
|
2018
|
2017
|
2016
|
|||||||||
|
Net cash provided by operating activities
|
$
|
961,489
|
|
$
|
1,876,577
|
|
$
|
970,546
|
|
||
|
Net cash used in investing activities
|
(1,222,810
|
)
|
(957,633
|
)
|
(1,288,250
|
)
|
|||||
|
Net cash (used in) provided by financing activities
|
(324,257
|
)
|
(754,355
|
)
|
882,629
|
|
|||||
|
Effect of exchange rate on cash, cash equivalents and restricted cash
|
(1,733
|
)
|
(3,900
|
)
|
(1,129
|
)
|
|||||
|
Increase (decrease) in cash, cash equivalents and restricted cash
|
$
|
(587,311
|
)
|
$
|
160,689
|
|
$
|
563,796
|
|
||
Operating Activities
Our operating cash flows primarily consist of the operating income generated by our Macau and Las Vegas Operations (excluding depreciation and amortization and other non-cash charges), interest paid and earned, and changes in working capital accounts such as receivables, inventories, prepaid expenses and payables. Our table games play both in Macau and Las Vegas is a mix of cash play and credit play, while our slot machine play is conducted primarily on a cash basis. A significant portion of our table games revenue is attributable to the play of a limited number of premium international customers who gamble on credit. The ability to collect these gaming receivables may impact our operating cash flow for the period. Our rooms, food and beverage, and entertainment, retail, and other revenue is conducted on a cash and credit basis. Accordingly, operating cash flows will be impacted by changes in operating income and accounts receivable.
Net cash provided by operations for the year ended
December 31, 2018
was
$961.5 million
, compared to
$1.88 billion
for the same period of
2017
. The decrease was primarily driven by a litigation settlement expense and a reduction in customer deposits at our Macau Operations.
Net cash provided by operations for the year ended
December 31, 2017
was
$1.88 billion
, compared to
$970.5 million
for the same period of
2016
. The increase was primarily due to the operations of Wynn Palace, which generated $424.5 million of additional Adjusted Property EBITDA, and a $292.8 million increase in customer deposits at Wynn Palace.
Investing Activities
Net cash used in investing activities for the year ended
December 31, 2018
was
$1.22 billion
, primarily attributable to
$1.48 billion
in capital expenditures, net of construction payables and retention, driven by capital expenditures of
$791.3 million
related
51
to Encore Boston Harbor and $247.0 million for the acquisition of land on the Las Vegas Strip directly across from Wynn Las Vegas. Capital expenditures were offset by net proceeds from sale or maturity of investment securities of $325.4 million.
Net cash used in investing activities for the year ended
December 31, 2017
was
$957.6 million
, which was primarily attributable to $935.5 million in capital expenditures, net of construction payables and retention, with $572.8 million related to Encore Boston Harbor and $150.9 million related to our Macau Operations.
Net cash used in investing activities for the year ended December 31,
2016
was
$1.29 billion
, which was primarily attributable to $1.23 billion in capital expenditures, net of construction payables and retention, with $838.3 million related to Wynn Palace and $212.2 million related to Encore Boston Harbor.
Financing Activities
Net cash used in financing activities for the year ended
December 31, 2018
was
$324.3 million
. In March 2018, we repaid the Redemption Note principal amount of $1.94 billion using cash on hand and amounts borrowed under the Bridge Facility and the WA Senior Revolving Credit Facility. In April 2018, we repaid all amounts borrowed under the Bridge Facility and the WA Senior Revolving Credit Facility using net proceeds of $915.2 million from a registered public equity offering. In addition, we borrowed
$623.9 million
under the Macau Senior Revolving Credit Facility, $615.0 million under the Retail Term Loan, $500.0 million under the Wynn Resorts Term Loan, and we used cash of $569.8 million for the payment of dividends and $305.4 million for distributions to noncontrolling interest holders of the Retail Joint Venture. In the fourth quarter, the Company repurchased 1,478,552 shares of its common stock for approximately $156.7 million.
Net cash used in financing activities for the year ended
December 31, 2017
was
$754.4 million
, which was primarily attributable to net repayments of $340.2 million under our Wynn Macau Credit Facilities, $320.8 million for dividend payments and $91.2 million for the payment of financing costs, partially offset by $180.0 million in proceeds received from Crown for assets contributed to the Retail Joint Venture.
Net cash provided by financing activities for the year ended December 31,
2016
was
$882.6 million
, which was primarily attributable to borrowings of $930.0 million under our Wynn America Credit Facilities and proceeds of $217.0 million from the sale of a 49.9% ownership interest in a subsidiary, partially offset by dividend payments of $325.2 million.
Capital Resources
As of
December 31, 2018
, we had approximately
$2.22 billion
of cash and cash equivalents. Cash and cash equivalents include cash on hand, cash in bank and fixed deposits, investments in money market funds, domestic and foreign bank time deposits, all with original maturities of less than 90 days. Of these amounts, WML and its subsidiaries (of which we own approximately
72%
) held
$1.22 billion
in cash and cash equivalents. If our portion of this cash and cash equivalents were repatriated to the U.S. on
December 31, 2018
, it would be subject to minimal U.S. taxes in the year of repatriation. Wynn America, Wynn Las Vegas, LLC and the Retail Joint Venture held cash balances of
$36.2 million
,
$124.8 million
and
$16.4 million
, respectively. Wynn Resorts, Limited (including its subsidiaries other than WML, Wynn America, Wynn Las Vegas, LLC and the Retail Joint Venture), which is not a guarantor of the debt of its subsidiaries but has certain indemnification obligations in connection with the Retail Term Loan, held
$821.1 million
of cash and cash equivalents.
52
The following table summarizes our outstanding borrowings and available borrowing capacity under our credit facilities and Commitment Letter as of
December 31, 2018
(in thousands):
|
Facility Borrowing Capacity
|
Borrowings Outstanding
|
Letters of Credit Outstanding
|
Facility Availability
|
|||||||||||||
|
Macau Related:
|
||||||||||||||||
|
Wynn Macau Credit Facilities
(1)
:
|
||||||||||||||||
|
Senior Term Loan Facility
|
$
|
2,296,999
|
|
$
|
2,296,999
|
|
$
|
—
|
|
$
|
—
|
|
||||
|
Senior Revolving Credit Facility
|
747,707
|
|
623,921
|
|
—
|
|
123,786
|
|
||||||||
|
U.S. Related:
|
||||||||||||||||
|
Commitment Letter
(2)
|
250,000
|
|
—
|
|
—
|
|
250,000
|
|
||||||||
|
Wynn America Credit Facilities
(3)
:
|
||||||||||||||||
|
Senior Term Loan Facility
|
994,780
|
|
994,780
|
|
—
|
|
—
|
|
||||||||
|
Senior Revolving Credit Facility
|
375,000
|
|
—
|
|
17,689
|
|
357,311
|
|
||||||||
|
Total
|
$
|
4,664,486
|
|
$
|
3,915,700
|
|
$
|
17,689
|
|
$
|
731,097
|
|
||||
|
(1)
|
Our Macau related credit facilities include a $2.30 billion equivalent fully funded senior secured term loan facility (the "Wynn Macau Senior Term Loan Facility") and a $750 million equivalent senior secured revolving credit facility (the "Wynn Macau Senior Revolving Credit Facility," and together with the Wynn Macau Senior Term Loan Facility, the "Wynn Macau Credit Facilities"). The borrower is Wynn Macau SA, an indirect wholly owned subsidiary of WML, and borrowings consist of both United States dollar and Hong Kong dollar tranches. Wynn Macau SA has the ability to upsize the Wynn Macau Credit Facilities by an additional $1 billion in equivalent senior secured loans upon its satisfaction of various conditions.
|
|
(2)
|
On September 19, 2018, the Company entered into a commitment letter (as subsequently amended and restated to add additional lenders, the “Commitment Letter”) to provide for a 364-day term loan facility to the Company in an aggregate principal amount of up to $750 million. On October 24, 2018, the Company agreed to terminate $500 million of the lenders’ commitments under the Commitment Letter. The remaining commitments of $250 million expire on April 5, 2019.
|
|
(3)
|
Our U.S. related credit facilities consist of an $875 million fully funded senior secured term loan facility (the "WA Senior Term Loan Facility I"), a $125 million fully funded senior term loan facility (the "WA Senior Term Loan Facility II") and a $375 million senior secured revolving credit facility (the "WA Senior Revolving Credit Facility," and collectively, the "Wynn America Credit Facilities"), under which Wynn America, an indirect wholly owned subsidiary of the Company, is the borrower.
|
We expect that our future cash needs will relate primarily to operations, funding of development projects and enhancements to our operating resorts, debt service and retirement and general corporate purposes. We expect to meet our cash needs including our contractual obligations with future anticipated cash flow from operations, availability under our bank credit facilities and our existing cash balances. We intend to fund our current development projects, including Encore Boston Harbor, primarily with the available borrowing capacity under our Wynn America Credit Facilities and operating cash flows.
Macau Related Debt
2024 WML Notes
. On September 20, 2017, WML issued the $600 million 2024 WML Notes pursuant to an indenture, dated as of September 20, 2017, between WML and Deutsche Bank Trust Company Americas, as trustee (the "2024 WML Indenture"). The 2024 WML Notes will mature on October 1, 2024 and bear interest at the rate of 4 7/8% per annum. At any time prior to October 1, 2020, WML may redeem the 2024 WML Notes, in whole or in part, at a redemption price equal to the greater of (a) 100% of the principal amount of the WML 2024 Notes or (b) a "make-whole" amount as determined by an independent investment banker in accordance with the terms of the 2024 WML Indenture. In either case, the redemption price would include accrued and unpaid interest. In addition, at any time prior to October 1, 2020, WML may use the net cash proceeds from certain equity offerings to redeem up to 35% of the aggregate principal amount of the 2024 WML Notes at a redemption price equal to 104.875% of the aggregate principal amount of the 2024 WML Notes. On or after October 1, 2020, WML may redeem the 2024 WML Notes, in whole or in part, at a premium decreasing annually from 102.438% of the principal amount to 100% of the principal amount, plus accrued and unpaid interest.
2027 WML Notes
. On September 20, 2017, WML issued the $750 million 2027 WML Notes pursuant to an indenture, dated as of September 20, 2017, between WML and Deutsche Bank Trust Company Americas, as trustee (the "2027 WML Indenture" and together with the 2024 WML Indenture, the "WML Indentures"). The 2027 WML Notes bear interest at the rate of 5 1/2% per annum and mature on October 1, 2027. At any time prior to October 1, 2022, WML may redeem the 2027 WML Notes, in whole
53
or in part, at a redemption price equal to the greater of (a) 100% of the principal amount of the 2027 WML Notes or (b) a "make-whole" amount as determined by an independent investment banker in accordance with the terms of the 2027 WML Indenture. In either case, the redemption price would include accrued and unpaid interest. In addition, at any time prior to October 1, 2020, WML may use the net cash proceeds from certain equity offerings to redeem up to 35% of the aggregate principal amount of the 2027 WML Notes, at a redemption price equal to 105.5% of the aggregate principal amount of the 2027 WML Notes. On or after October 1, 2022, WML may redeem the 2027 WML Notes, in whole or in part, at a premium decreasing annually from 102.75% of the principal amount to 100% of the principal amount, plus accrued and unpaid interest.
If WML undergoes a change of control (as defined in the WML Indentures), it must offer to repurchase the WML Notes at a price equal to 101% of the aggregate principal amount thereof, plus accrued and unpaid interest. In addition, WML may redeem the WML Notes, in whole but not in part, at a redemption price equal to 100% of the principal amount, plus accrued and unpaid interest, in response to any change in or amendment to certain tax laws or tax positions. Further if a holder or beneficial owner of the WML Notes fails to meet certain requirements imposed by any Gaming Authority (as defined in the WML Indentures), WML may require the holder or beneficial owner to dispose of or redeem its WML Notes.
Upon the occurrence of (1) any event after which none of WML or any of its subsidiaries have such licenses, concessions, subconcessions or other permits or authorizations as necessary to conduct gaming activities in substantially the same scope as it does on the date of the WML Notes issuance, for a period of ten consecutive days or more, and such event has a material adverse effect on the financial condition, business, properties, or results of operations of WML and its subsidiaries, taken as a whole, or (2) the termination, rescission, revocation or modification of any such licenses, concessions, subconcessions or other permits or authorizations which has had a material adverse effect on the financial condition, business, properties, or results of operations of WML and its subsidiaries, taken as a whole, each holder of the WML Notes will have the right to require WML to repurchase all or any part of such holders' WML Notes at a purchase price in cash equal to 100% of the principal amount thereof, plus accrued and unpaid interest.
The WML Notes are WML's general unsecured obligations and rank pari passu in right of payment with all of WML's existing and future senior unsecured indebtedness; will rank senior to all of WML's future subordinated indebtedness, if any; will be effectively subordinated to all of WML's future secured indebtedness to the extent of the value of the assets securing such debt; and will be structurally subordinated to all existing and future obligations of WML's subsidiaries, including the Wynn Macau Credit Facilities and the WML Finance Credit Facility. The WML Notes are not registered under the Securities Act of 1933, as amended (the "Securities Act"), and the WML Notes are subject to restrictions on transferability and resale.
The WML Indentures contain covenants limiting WML's (and certain of its subsidiaries') ability to, among other things: merge or consolidate with another company; transfer or sell all or substantially all of its properties or assets; and lease all or substantially all of its properties or assets. The terms of the WML Indentures contain customary events of default, including, but not limited to: default for 30 days in the payment of interest when due on the WML Notes; default in the payment of the principal, or premium, if any, when due on the WML Notes; failure to comply with any payment obligations relating to the repurchase by WML of the WML Notes upon a change of control; failure to comply with certain covenants in the WML Indentures; certain defaults on certain other indebtedness; failure to pay judgments against WML or certain subsidiaries that, in the aggregate, exceed $50.0 million; and certain events of bankruptcy or insolvency. In the case of an event of default arising from certain events of bankruptcy or insolvency, all WML Notes then outstanding will become due and payable immediately without further action or notice.
Wynn Macau Credit Facilities
. In December 2018, Wynn Macau SA amended the Wynn Macau Credit Facilities by entering into the Amended Common Terms Agreement. The Wynn Macau Senior Term Loan Facility was previously repayable in graduating installments of between
2.50%
to
7.33%
of the principal amount on a quarterly basis commencing December 2018, with a final installment of 50% of the principal amount repayable in September 2021; and the final maturity of any outstanding borrowings from the Wynn Macau Senior Revolving Credit Facility was previously repayable by September 2020. Following the execution of the Amended Common Terms Agreement, the Wynn Macau Senior Term Loan Facility is repayable in graduating installments of between
2.875%
to
4.50%
of the principal amount on a quarterly basis commencing September 30, 2020, with a final installment of 75% of the principal amount repayable in June 2022. The final maturity of any outstanding borrowings from the Wynn Macau Senior Revolving Credit Facility is in June 2022. The Wynn Macau Credit Facilities bear interest at LIBOR or HIBOR plus a margin of 1.50% to 2.25% per annum based on Wynn Macau SA's Leverage Ratio (as defined in the Wynn Macau Credit Facilities). The commitment fee required to be paid for unborrowed amounts under the Wynn Macau Senior Revolving Credit Facility, if any, is between 0.52% and 0.79%, per annum, based on Wynn Macau SA's Leverage Ratio. The annual commitment fee is payable quarterly in arrears and is calculated based on the daily average of the unborrowed amounts.
54
The Wynn Macau Credit Facilities contain a requirement that Wynn Macau SA must make mandatory repayments of indebtedness from specified percentages of excess cash flow. If Wynn Macau SA's Leverage Ratio is greater than 4.5 to 1, then 25% of Excess Cash Flow (as defined in the Wynn Macau Credit Facilities) must be used for prepayment of indebtedness and cancellation of available borrowings under the Wynn Macau Credit Facilities. There is no mandatory prepayment in respect of Excess Cash Flow if Wynn Macau SA's Leverage Ratio is equal to or less than 4.5 to 1.
The Wynn Macau Credit Facilities contain customary covenants restricting certain activities including, but not limited to: the incurrence of additional indebtedness, the incurrence or creation of liens on any of its property, sale and leaseback transactions, the ability to dispose of assets, and making loans or other investments. In addition, Wynn Macau SA is required by the financial covenants to maintain a Leverage Ratio of not greater than
4.75
to 1 for the fiscal year ended December 31,
2018
, and an Interest Coverage Ratio (as defined in the Wynn Macau Credit Facilities) of not less than
2.00
to 1 at any time.
Borrowings under the Wynn Macau Credit Facilities will continue to be guaranteed by Palo, and by certain subsidiaries of the Company that own equity interests in Wynn Macau SA, and are secured by substantially all of the assets of Wynn Macau SA and Palo, and the equity interests in Wynn Macau SA. Borrowings under the Wynn Macau Credit Facilities are not guaranteed by the Company or WML.
In connection with the gaming concession contract of Wynn Macau SA, Wynn Macau SA entered into a Bank Guarantee Reimbursement Agreement with BNU for the benefit of the Macau government. This guarantee assures Wynn Macau SA's performance under the casino concession agreement, including the payment of premiums, fines and indemnity for any material failure to perform under the terms of the concession agreement and the payment of any gaming taxes. As of December 31, 2018, the guarantee was in the amount of MOP
300 million
(approximately
$37.3 million
) and will remain at such amount until 180 days after the end of the term of the concession agreement (2022). BNU, as issuer of the guarantee, is currently secured by a second priority security interest in the senior lender collateral package. From and after repayment of all indebtedness under the Wynn Macau Credit Facilities, Wynn Macau SA is obligated to promptly, upon demand by BNU, repay any claim made on the guarantee by the Macau government. BNU is paid an annual fee for the guarantee of MOP
2.3 million
(approximately
$0.3 million
).
U.S. and Corporate Related Debt
Wynn Resorts Term Loan
. On October 30, 2018, the Company and certain subsidiaries of the Company entered into a credit agreement (the "Credit Agreement") to provide for a $500 million six-year term loan facility (the “Term Loan”). The Term Loan matures on October 30, 2024 and bears interest at a rate of LIBOR plus 2.25% per year.
The Credit Agreement contains customary representations and warranties, events of default and negative and affirmative covenants, including, among other things, limitations on: indebtedness; investments; restricted payments; mergers and acquisitions; payment of indebtedness; negative pledges; liens; transactions with affiliates and sales of assets. In addition, the Credit Agreement contains a requirement that the Company must make mandatory prepayments of indebtedness equal to 50.0% of excess cash flow if the Consolidated First Lien Secured Leverage Ratio, as defined, as of the last day of the applicable fiscal year is greater than 4.5 to 1 prior to the year of opening of Encore Boston Harbor or is greater than 4 to 1 thereafter. There is no mandatory prepayment in respect of excess cash flow if the Company's Consolidated First Lien Secured Leverage Ratio is equal to or less than 4.5 to 1.
Wynn Group Asia, Inc. and Wynn Resorts Holdings, LLC, each a direct, wholly owned subsidiary of the Company (collectively, the “Guarantors”), guarantee the obligations of the Company under the Credit Agreement. The Company will pledge all of the equity interests in the Guarantors to the extent permitted by applicable law.
Retail Term Loan
. On July 25, 2018, Wynn/CA Plaza Property Owner, LLC and Wynn/CA Property Owner, LLC (collectively, the "Retail Borrowers"), subsidiaries of the Retail Joint Venture, entered into a term loan agreement (the "Retail Term Loan Agreement") to provide for a term loan facility to the Retail Borrowers of
$615.0 million
(the "Retail Term Loan"). The Retail Term Loan is secured by substantially all of the assets of the Retail Borrowers. The Retail Term Loan matures on July 24, 2025 and bears interest at a rate of LIBOR plus 1.70% per annum. In accordance with the Retail Term Loan Agreement, the Retail Borrowers entered into an interest rate collar agreement with a LIBOR floor of 1.00% and a ceiling of 3.75%.
The Retail Term Loan Agreement contains customary representations and warranties, events of default and affirmative and negative covenants for debt facilities of this type, including, among other things, limitations on leasing matters, incurrence of indebtedness, distributions and transactions with affiliates. The Retail Term Loan Agreement also provides for customary sweeps of the Retail Borrowers' excess cash in the event of a default or in the event the Retail Borrowers fail to maintain certain financial ratios as defined in the Retail Term Loan Agreement. In addition, the Company will indemnify the lenders under the Retail Term
55
Loan and be liable, in each case, for certain customary environmental and non-recourse carve out matters pursuant to a hazardous materials indemnity agreement and a recourse indemnity agreement, each entered into concurrently with the execution of the Retail Term Loan Agreement.
Commitment Letter
. On September 19, 2018, the Company entered into the Commitment Letter to provide for a
364
-day term loan facility to the Company in an aggregate principal amount of up to
$750 million
. On October 24, 2018, the Company agreed to terminate
$500 million
of the lenders’ commitments under the Commitment Letter, in anticipation of entering into the Credit Agreement discussed below. Accordingly, the lenders' remaining commitments under the Commitment Letter are $250 million. The remaining commitments expire on April 5, 2019 and remained fully available as of December 31, 2018.
Notes
. Our senior notes rank pari passu in right of payment.
2023 Notes
. In May 2013, Wynn Las Vegas, LLC and Wynn Las Vegas Capital Corp., an indirect wholly owned subsidiary of Wynn Resorts ("Capital Corp." and, together with Wynn Las Vegas, LLC, the "Issuers"), issued the $500 million 4 1/4% Senior Notes due 2023 (the "2023 Notes") pursuant to an indenture, dated as of May 22, 2013 (the "2023 Indenture"), among the Issuers, the Guarantors (as defined below), and the U.S. Bank National Association, as trustee (the "Trustee"). The 2023 Notes will mature on May 30, 2023 and bear interest at the rate of 4 1/4% per annum. The Issuers may, at their option, redeem the 2023 Notes, in whole or in part, at any time or from time to time prior to their stated maturity. The redemption price for the 2023 Notes that are redeemed before February 28, 2023 will include a "make-whole" premium, plus accrued and unpaid interest. In the event of a change of control triggering event (as defined in the 2023 Indenture), the Issuers will be required to offer to repurchase the 2023 Notes at 101% of the principal amount, plus accrued and unpaid interest.
On February 16, 2018, the Issuers commenced a solicitation of consents (the "Consent Solicitation") for a proposed amendment (the "Proposed Amendment") to the 2023 Indenture. The Proposed Amendment would conform the definition of change of control relating to ownership of equity interests in the Company to the terms of the indentures governing the 2025 Notes and 2027 WLV Notes. Adoption of the Proposed Amendment requires the consent of holders of a majority in aggregate principal amount of the 2023 Notes. The Consent Solicitation will expire on March 6, 2018.
2025 Notes
. In February 2015, the Issuers issued the $1.8 billion 2025 Notes pursuant to an indenture, dated as of February 18, 2015 (the "2025 Indenture"), among the Issuers, Guarantors (as defined below) and the Trustee. The 2025 Notes will mature on March 1, 2025 and bear interest at the rate of 5 1/2% per annum. The Issuers may, at their option, redeem the 2025 Notes, in whole or in part, at any time or from time to time prior to their stated maturity. The redemption price for the 2025 Notes that are redeemed before December 1, 2024 will include a "make-whole" premium, plus accrued and unpaid interest. In the event of a change of control triggering event (as defined in the 2025 Indenture), the Issuers will be required to offer to repurchase the 2025 Notes at 101% of the principal amount, plus accrued and unpaid interest.
During the first quarter of 2018, Wynn Resorts purchased $20 million principal amount of the 2025 Notes through open market purchases. As of December 31, 2018, Wynn Resorts holds this debt and has not contributed it to its wholly owned subsidiary, Wynn Las Vegas, LLC.
2027 WLV Notes
. In May 2017, the Issuers issued the $900 million 2027 WLV Notes pursuant to an indenture, dated as of May 11, 2017 (the "2027 Indenture"), among the Issuers, the Guarantors (as defined below) and the Trustee. The 2027 WLV Notes will mature on May 15, 2027 and bear interest at the rate of 5 1/4% per annum. The Issuers may, at their option, redeem the 2027 WLV Notes, in whole or in part, at any time or from time to time prior to their stated maturity. The redemption price for the 2027 WLV Notes that are redeemed before February 15, 2027 will include a "make-whole" premium, plus accrued and unpaid interest. In the event of a change of control triggering event (as defined in the 2027 Indenture), the Issuers will be required to offer to repurchase the 2027 WLV Notes at 101% of the principal amount, plus accrued and unpaid interest.
During the first quarter of 2018, Wynn Resorts purchased $20 million principal amount of the 2027 WLV Notes through open market purchases. As of December 31, 2018, Wynn Resorts holds this debt and has not contributed it to its wholly owned subsidiary, Wynn Las Vegas, LLC.
Each of the 2023 Notes, 2025 Notes and 2027 WLV Notes (collectively, the "WLV Notes") are senior obligations of the Issuers and are unsecured, except for the first priority pledge by Wynn Las Vegas Holdings, LLC of its equity interests in Wynn Las Vegas, LLC. If Wynn Resorts receives an investment grade rating from one or more ratings agencies, the first priority pledge securing the WLV Notes will be released.
56
The WLV Notes are jointly and severally guaranteed by all of the Issuers' subsidiaries, other than Capital Corp., which was a co-issuer (the "Guarantors"). The guarantees are senior unsecured obligations and rank senior in right of payment to all of their existing and future subordinated debt. The guarantees rank equally in right of payment with all existing and future liabilities of the Issuers' subsidiaries that are not so subordinated and will be effectively subordinated in right of payment to all of such existing and future secured debt (to the extent of the collateral securing such debt).
Each of the WLV Notes' indentures contain negative covenants and financial covenants, including, but not limited to, covenants limiting the Issuers' and the Guarantors' ability to create liens on assets to secure debt; enter into sale-leaseback transactions; and merge or consolidate with another company. These covenants are subject to a number of important and significant limitations, qualifications and exceptions. The 2027 Indenture also provides that Wynn America may assume all of Wynn Las Vegas, LLC's obligations under the 2027 Indenture and the 2027 WLV Notes if certain conditions set forth in the 2027 Indenture are met.
Events of default under each of the WLV Notes' indentures include, among others, the following: default for 30 days in the payment of interest when due on the applicable notes; default in payment of the principal, or premium, if any, when due on the applicable notes; failure to comply with certain covenants in the applicable indenture; and certain events of bankruptcy or insolvency. In the case of an event of default arising from certain events of bankruptcy or insolvency with respect to the Issuers or Guarantors, all notes then outstanding will become due and payable immediately without further action or notice.
The WLV Notes are also subject to mandatory redemption requirements imposed by gaming laws and regulations of gaming authorities in Nevada.
Wynn America Credit Facilities
. On April 24, 2017, we amended the Wynn America Credit Facilities to, among other things, extend the maturity of portions of the credit facilities. Of the $875 million WA Senior Term Loan Facility I, $69.6 million matures in November 2020 with repayments in quarterly installments of $1.7 million commencing in June 2018 and a final installment of $52.2 million in November 2020, and $805.4 million matures in December 2021 with repayment in quarterly installments of $20.1 million commencing in March 2020 and a final installment of $664.5 million in December 2021. The WA Senior Term Loan Facility II matures in December 2021 with no required repayments until maturity in December 2021. Of the $375 million WA Senior Revolving Credit Facility, $42 million matures in November 2019 and $333 million matures in December 2021.
Subject to certain exceptions, the Wynn America Credit Facilities bear interest at either base rate plus 0.75% per annum or the reserve adjusted Eurodollar rate plus 1.75% per annum. The annual fee required to pay for unborrowed amounts, if any, is 0.30% per annum, payable quarterly in arrears, calculated based on the daily average of the unborrowed amounts under such credit facilities.
The Wynn America Credit Facilities contain customary representations and warranties, events of default and negative and affirmative covenants, including, among other things, limitations on: indebtedness; investments; restricted payments; mergers and acquisitions; payment of indebtedness; negative pledges; liens; transactions with affiliates and sales of assets. In addition, Wynn America is subject to financial covenants, including maintaining a Maximum Consolidated Senior Secured Net Leverage Ratio and a Minimum Consolidated EBITDA, each as defined in the Wynn America Credit Facilities. Commencing with the second full fiscal quarter ending after the fiscal quarter in which Encore Boston Harbor opens, the Maximum Consolidated Senior Secured Net Leverage Ratio is not to exceed 2.75 to 1. Commencing with the fiscal quarter ending December 31, 2015, the Minimum Consolidated EBITDA is not to be less than $200.0 million.
We provided a completion guaranty in favor of the lenders under the Wynn America Credit Facilities to support the development and opening of Encore Boston Harbor. Wynn America and the guarantors have entered into a security agreement (as amended from time to time) in favor of the lenders under the Wynn America Credit Facilities pursuant to which, subject to certain exceptions, Wynn America and the guarantors have pledged all equity interests in the guarantors to the extent permitted by applicable law and granted a first priority security interest in substantially all of the other existing and future assets of the guarantors.
Other Factors Affecting Liquidity
Wynn Resorts, Limited is a holding company and, as a result, our ability to pay dividends is highly dependent on our ability to obtain funds and our subsidiaries' ability to provide funds to us. Wynn America, LLC and Wynn Macau SA debt instruments and the Retail Term Loan contain customary negative covenants and financial covenants, including, but not limited to, covenants that restrict our ability to pay dividends or distributions to any direct or indirect subsidiaries.
57
We expect that our Las Vegas Operations will fund Wynn Las Vegas, LLC's and the Retail Borrowers' operations, capital requirements and debt service obligations with existing cash and operating cash flows. However, we cannot assure you that our Las Vegas Operations' operating cash flows will be sufficient to do so. Similarly, we expect that our Macau Operations will fund Wynn Macau SA and WML's debt service obligations with existing cash, operating cash flows and availability under the Wynn Macau Credit Facilities. However, we cannot assure you that our Macau Operations' operating cash flows will be sufficient to do so. We may refinance all or a portion of our indebtedness on or before maturity. We cannot assure you that we will be able to refinance any of the indebtedness on acceptable terms or at all.
Legal proceedings in which we are involved also may impact our liquidity. No assurance can be provided as to the outcome of such proceedings. In addition, litigation inherently involves significant costs. For information regarding legal proceedings, see Item 8—"Financial Statements and Supplementary Data,"
Note 15
, "Commitments and Contingencies."
Our Board of Directors has authorized an equity repurchase program of up to $1.0 billion. Under the equity repurchase program, we may repurchase the Company's outstanding shares from time to time through open market purchases, in privately negotiated transactions, and under plans complying with Rules 10b5-1 and 10b-18 under the Exchange Act. As of
December 31, 2018
, we had
$843.3 million
in repurchase authority remaining under the program.
We have in the past repurchased, and in the future, we may periodically consider repurchasing our outstanding notes for cash. The amount of any notes to be repurchased, as well as the timing of any repurchases, will be based on business, market and other conditions and factors, including price, contractual requirements or consents, and capital availability.
New business developments or other unforeseen events may occur, resulting in the need to raise additional funds. We continue to explore opportunities to develop additional gaming or related businesses in domestic and international markets. There can be no assurances regarding the business prospects with respect to any other opportunity. Any new development would require us to obtain additional financing. We may decide to conduct any such development through Wynn Resorts, Limited or through subsidiaries separate from the Las Vegas or Macau-related entities.
Off Balance Sheet Arrangements
We have not entered into any transactions with special purpose entities nor do we engage in any derivatives except for an interest rate collar. We do not have any retained or contingent interest in assets transferred to an unconsolidated entity. As of
December 31, 2018
, we had outstanding letters of credit totaling
$17.7 million
.
Contractual Commitments
The following table summarizes our scheduled contractual commitments as of
December 31, 2018
(in thousands):
|
Payments Due By Period
|
|||||||||||||||||||
|
Less
Than 1 Year |
1 to 3
Years |
4 to 5
Years |
After
5 Years |
Total
|
|||||||||||||||
|
Long-term debt obligations
|
$
|
11,960
|
|
$
|
1,468,703
|
|
$
|
2,960,037
|
|
$
|
5,100,000
|
|
$
|
9,540,700
|
|
||||
|
Fixed interest payments
|
235,850
|
|
471,700
|
|
459,304
|
|
467,163
|
|
1,634,017
|
|
|||||||||
|
Estimated variable interest payments
(1)
|
214,146
|
|
407,920
|
|
147,907
|
|
59,927
|
|
829,900
|
|
|||||||||
|
Construction contracts and commitments
|
575,062
|
|
25,000
|
|
—
|
|
—
|
|
600,062
|
|
|||||||||
|
Operating leases
|
29,126
|
|
37,379
|
|
32,334
|
|
464,838
|
|
563,677
|
|
|||||||||
|
Capital leases
|
989
|
|
1,978
|
|
1,978
|
|
66,743
|
|
71,688
|
|
|||||||||
|
Employment agreements
|
72,893
|
|
68,040
|
|
3,454
|
|
—
|
|
144,387
|
|
|||||||||
|
Other
(2) (3)
|
168,646
|
|
136,941
|
|
32,068
|
|
—
|
|
337,655
|
|
|||||||||
|
Total contractual commitments
|
$
|
1,308,672
|
|
$
|
2,617,661
|
|
$
|
3,637,082
|
|
$
|
6,158,671
|
|
$
|
13,722,086
|
|
||||
|
(1)
|
Amounts for all periods represent our estimated future interest payments on our debt facilities based upon amounts outstanding and LIBOR or HIBOR rates as of
December 31, 2018
. Actual rates will vary.
|
|
(2)
|
Other includes open purchase orders, future charitable contributions, fixed gaming tax payments in Macau, performance contracts and other contracts. As further discussed in Item 8—"Financial Statements and Supplementary Data,"
Note 12
, "Income Taxes," we had
$99.5 million
of unrecognized tax benefits as of
December 31, 2018
. Due to the inherent uncertainty of the underlying tax positions, it is not practicable to assign this liability to any particular year and therefore it is not included in the table above as of
December 31, 2018
.
|
|
(3)
|
Other excludes community payments associated with the continuing operations of Encore Boston Harbor, which commence upon the opening of the resort. These amounts are approximately
$10.6 million
per year with minimal annual increases.
|
58
Critical Accounting Policies and Estimates
The preparation of our consolidated financial statements in conformity with GAAP involves the use of estimates and assumptions that affect the amounts reported in the consolidated financial statements. Certain of our accounting policies require management to apply significant judgment in defining the appropriate assumptions integral to financial estimates and on an ongoing basis, management evaluates those estimates. Judgments are based on historical experience, terms of existing contracts, industry trends and information available from outside sources, as appropriate. However, by their nature, judgments are subject to an inherent degree of uncertainty, and therefore actual results could differ from our estimates.
Development, Construction and Property and Equipment Estimates
During the construction and development of a resort, pre-opening or start-up costs are expensed when incurred. In connection with the construction and development of our resorts, significant start-up costs are incurred and charged to pre-opening costs through their respective openings. Once our resorts open, expenses associated with the opening of the resorts are no longer charged as pre-opening costs.
During the construction and development stage, direct costs such as those incurred for the design and construction of our resorts, including applicable portions of interest, are capitalized. Accordingly, the recorded amounts of property and equipment increase significantly during construction periods. Depreciation is provided over the estimated useful lives of the assets using the straight-line method. We determine the estimated useful lives based on our experience with similar assets, estimates of the usage of the asset and other factors specific to the asset. Depreciation expense related to capitalized construction costs and fixed assets commence when the related assets are placed in service. The remaining estimated useful lives of assets are periodically reviewed and adjusted as necessary.
Costs of repairs and maintenance are charged to expense when incurred. The cost and accumulated depreciation of property and equipment retired or otherwise disposed of are eliminated from the respective accounts and any resulting gain or loss is included in property charges and other.
We also evaluate our property and equipment and other long-lived assets for impairment in accordance with applicable accounting standards. For assets to be disposed of we recognize the asset at the lower of carrying value or fair market value less costs of disposal, as estimated based on comparable asset sales, solicited offers, or a discounted cash flow model. For assets to be held and used, we review for impairment whenever indicators of impairment exist. In reviewing for impairment, we compare the estimated future cash flows of the asset, on an undiscounted basis, to the carrying value of the asset. If the undiscounted cash flows exceed the carrying value, no impairment is indicated. If the undiscounted cash flows do not exceed the carrying value, an impairment is recorded based on the fair value of the asset, typically measured using a discounted cash flow model. If an asset is still under development, future cash flows include remaining construction costs. All recognized impairment losses, whether for assets to be disposed of or assets to be held and used, are recorded as operating expenses.
Redemption Price Promissory Note
We recorded the Redemption Note at its fair value in accordance with applicable accounting guidance. As of December 31, 2017, the fair value of the Redemption Note was
$1.88 billion
. We utilized an independent third party valuation to assist in the determination of this fair value. In determining this fair value, we estimated the Redemption Note's present value using discounted cash flows with a probability-weighted expected return for redemption assumptions and a discount rate, which included time value and non-performance risk adjustments commensurate with the risk of the Redemption Note. In determining the appropriate discount rate to be used in the estimated present value, the Redemption Note's subordinated position and credit risk relative to all other debt in our capital structure and credit ratings associated with our traded debt were considered. Observable inputs for the risk-free rate based on Federal Reserve rates for U.S. Treasury securities and credit risk spread based on a yield curve index of similarly rated debt were used. The Company repaid the principal amount in full on March 30, 2018.
59
Allowance for Estimated Doubtful Accounts Receivable
A substantial portion of our outstanding receivables relates to casino credit play. Credit play, through the issuance of markers, represents a significant portion of the table games volume at our Las Vegas Operations. While offered, the issuance of credit at our Macau Operations is less significant when compared to Las Vegas. Our goal is to maintain strict controls over the issuance of credit and aggressively pursue collection from those customers who fail to pay their balances in a timely fashion. These collection efforts may include the mailing of statements and delinquency notices, personal contacts, the use of outside collection agencies and litigation. Markers issued at our Las Vegas Operations are generally legally enforceable instruments in the United States, and United States assets of foreign customers may be used to satisfy judgments entered in the United States.
The enforceability of markers and other forms of credit related to gaming debt outside of the United States varies from country to country. Some foreign countries do not recognize the enforceability of gaming related debt, or make enforcement burdensome. We closely consider the likelihood and difficulty of enforceability, among other factors, when issuing credit to customers who are not residents of the United States. In addition to our internal credit and collection departments, located in both Las Vegas and Macau, we have a network of legal, accounting and collection professionals to assist us in our determinations regarding enforceability and our overall collection efforts.
As of
December 31, 2018
and
2017
,
85.0%
and
81.7%
, respectively, of our casino accounts receivable were owed by customers from foreign countries, primarily in Asia. In addition to enforceability issues, the collectability of markers given to foreign customers is affected by a number of factors, including changes in currency exchange rates and economic conditions in the customers' home countries.
We regularly evaluate our reserve for bad debts based on a specific review of customer accounts and outstanding gaming promoter accounts as well as management's prior experience with collection trends in the casino industry and current economic and business conditions. In determining our allowance for estimated doubtful accounts receivable, we apply loss factors based on historical marker collection history to aged account balances and we specifically analyze the collectability of each account with a balance over a specified dollar amount, based upon the age, the customer's financial condition, collection history and any other known information.
The following table presents key statistics related to our casino accounts receivable (dollars in thousands):
|
December 31,
|
|||||||
|
2018
|
2017
|
||||||
|
Casino accounts receivable
|
$
|
229,594
|
|
$
|
173,664
|
|
|
|
Allowance for doubtful casino accounts receivable
|
31,263
|
|
28,841
|
|
|||
|
Allowance as a percentage of casino accounts receivable
|
13.6
|
%
|
16.6
|
%
|
|||
Our reserve for doubtful casino accounts receivable is based on our estimates of amounts collectible and depends on the risk assessments and judgments by management regarding realizability, the state of the economy and our credit policy. Our reserve methodology is applied similarly to credit extended at each of our resorts. As of
December 31, 2018
and
2017
,
57.9%
and
42.4%
, respectively, of our outstanding casino accounts receivable balance originated at our Macau Operations.
As of
December 31, 2018
, a 100 basis point change in the allowance for doubtful accounts as a percentage of casino accounts receivable would change the provision for doubtful accounts by approximately
$2.3 million
.
As our customer payment experience evolves, we will continue to refine our estimated reserve for bad debts. Accordingly, the associated provision for doubtful accounts may fluctuate. Because individual customer account balances can be significant, the reserve and the provision can change significantly between periods as we become aware of additional information about a customer or changes occur in a region's economy or legal system.
Litigation and Contingency Estimates
We are subject to various claims, legal actions and other contingencies, and we accrue for these matters when they are both probable and estimable. For matters that arose on or prior to the balance sheet date, we estimate any accruals based on the relevant facts and circumstances available through the date of issuance of the financial statements. We include the accruals associated with any contingent matters in other accrued liabilities on the consolidated balance sheets.
60
Income Taxes
We are subject to income taxes in the United States and other foreign jurisdictions where we operate. Accounting standards require the recognition of deferred tax assets, net of applicable reserves, and liabilities for the estimated future tax consequences attributable to differences between financial statement carrying amounts of existing assets and liabilities and their respective tax bases and operating loss and tax credit carryforwards. Deferred tax assets and liabilities are measured using enacted tax rates in effect for the year in which those temporary differences are expected to be recovered or settled. The effect of a change in tax rates on the income tax provision and deferred tax assets and liabilities generally is recognized in the results of operations in the period that includes the enactment date. Accounting standards require recognition of a future tax benefit to the extent that realization of such benefit is more likely than not. Otherwise, a valuation allowance is applied.
As of
December 31, 2018
, we have a foreign tax credit ("FTC") carryover of
$3.19 billion
and we have recorded a valuation allowance of
$2.49 billion
against this asset based on our estimate of future realization. The FTCs are attributable to the Macau special gaming tax, which is 35% of gross gaming revenue in Macau. In the assessment of the valuation allowance, appropriate consideration was given to all positive and negative evidence including recent operating profitability, forecasts of future earnings and the duration of statutory carryforward periods.
Our income tax returns are subject to examination by the IRS and other tax authorities in the locations where we operate. We assess potentially unfavorable outcomes of such examinations based on accounting standards for uncertain income taxes. The accounting standards prescribe a minimum recognition threshold a tax position is required to meet before being recognized in the financial statements.
Uncertain tax position accounting standards apply to all tax positions related to income taxes. These accounting standards utilize a two-step approach for evaluating tax positions. The tax benefit is measured as the largest amount of benefit that is more likely than not to be realized upon settlement.
As applicable, we recognize accrued penalties and interest related to unrecognized tax benefits in the provision for income taxes.
Recently Adopted Accounting Standards and Accounting Standards Issued But Not Yet Adopted
See Item 8—"Financial Statements and Supplementary Data,"
Note 2
, "Summary of Significant Accounting Policies."
Item 7A. Quantitative and Qualitative Disclosures About Market Risk
In the normal course of business, our financial position is subject to market risk, including, but not limited to, potential losses due to changes in the value of financial instruments including those resulting from adverse changes in interest rates, foreign currency exchange rates and market valuation.
Interest Rate Risks
One of our primary exposures to market risk is interest rate risk associated with our debt facilities that bear interest based on floating rates. We attempt to manage interest rate risk by managing the mix of long-term fixed rate borrowings and variable rate borrowings, supplemented by hedging activities as believed by us to be appropriate. We cannot assure you that these risk management strategies have had the desired effect, and interest rate fluctuations could have a negative impact on our results of operations.
The following table provides estimated future cash flow information derived from our best estimates of repayments as of
December 31, 2018
, of our expected long-term indebtedness and related weighted average interest rates by expected maturity dates. However, we cannot predict the LIBOR or HIBOR rates that will be in effect in the future. Actual rates will vary. The one-month LIBOR and HIBOR rates as of
December 31, 2018
of 2.52% and 2.27%, respectively, were used for all variable rate calculations in the table below.
61
The information is presented in U.S. dollar equivalents as applicable.
|
Years Ending December 31,
|
||||||||||||||||||||||||||||
|
Expected Maturity Date
|
||||||||||||||||||||||||||||
|
2019
|
2020
|
2021
|
2022
|
2023
|
Thereafter
|
Total
|
||||||||||||||||||||||
|
(dollars in millions)
|
||||||||||||||||||||||||||||
|
Long-term debt:
|
||||||||||||||||||||||||||||
|
Fixed rate
|
$
|
—
|
|
$
|
—
|
|
$
|
—
|
|
$
|
—
|
|
$
|
500.0
|
|
$
|
4,010.0
|
|
$
|
4,510.0
|
|
|||||||
|
Average interest rate
|
—
|
%
|
—
|
%
|
—
|
%
|
—
|
%
|
4.3
|
%
|
5.4
|
%
|
5.2
|
%
|
||||||||||||||
|
Variable rate
|
$
|
12.0
|
|
$
|
275.0
|
|
$
|
1,193.7
|
|
$
|
2,455.0
|
|
$
|
5.0
|
|
$
|
1,090.0
|
|
$
|
5,030.7
|
|
|||||||
|
Average interest rate
|
5.5
|
%
|
4.2
|
%
|
4.4
|
%
|
4.2
|
%
|
4.8
|
%
|
4.5
|
%
|
4.3
|
%
|
||||||||||||||
Interest Rate Sensitivity
As of
December 31, 2018
, approximately
47.3%
of the principal amount of our long-term debt was based on fixed rates. Based on our borrowings as of
December 31, 2018
, an assumed 100 basis point change in the variable rates would cause our annual interest cost to change by
$50.3 million
.
Foreign Currency Risks
The currency delineated in Wynn Macau SA's concession agreement with the government of Macau is the Macau pataca. The Macau pataca, which is not a freely convertible currency, is linked to the Hong Kong dollar, and in many cases the two are used interchangeably in Macau. The Hong Kong dollar is linked to the U.S. dollar and the exchange rate between these two currencies has remained relatively stable over the past several years. However, the exchange linkages of the Hong Kong dollar and the Macau pataca, and the Hong Kong dollar and the U.S. dollar, are subject to potential changes due to, among other things, changes in Chinese governmental policies and international economic and political developments.
If the Hong Kong dollar and the Macau pataca are not linked to the U.S. dollar in the future, severe fluctuations in the exchange rate for these currencies may result. We also cannot assure you that the current rate of exchange fixed by the applicable monetary authorities for these currencies will remain at the same level.
We expect most of the revenues and expenses for any casino that we operate in Macau will be in Hong Kong dollars or Macau patacas. For any U.S. dollar-denominated debt or other obligations incurred by our Macau-related entities, fluctuations in the exchange rates of the Macau pataca or the Hong Kong dollar, in relation to the U.S. dollar, could have adverse effects on our results of operations, financial condition and ability to service debt. Based on our balances as of
December 31, 2018
, an assumed 100 basis point change in the US dollar/Hong Kong dollar exchange rate would cause a foreign currency transaction gain/loss of
$28.1 million
.
62
Item 8. Financial Statements and Supplementary Data
INDEX TO CONSOLIDATED FINANCIAL STATEMENTS
|
Page
|
|
63
REPORT OF INDEPENDENT REGISTERED PUBLIC ACCOUNTING FIRM
The Board of Directors and Stockholders of Wynn Resorts, Limited and subsidiaries:
Opinion on Internal Control over Financial Reporting
We have audited Wynn Resorts, Limited and subsidiaries' internal control over financial reporting as of December 31, 2018, based on criteria established in Internal Control-Integrated Framework issued by the Committee of Sponsoring Organizations of the Treadway Commission (2013 framework) (the COSO criteria). In our opinion, Wynn Resorts, Limited and subsidiaries (the Company) maintained, in all material respects, effective internal control over financial reporting as of December 31, 2018, based on the COSO criteria.
We also have audited, in accordance with the standards of the Public Company Accounting Oversight Board (United States) (PCAOB), the consolidated balance sheets of the Company as of December 31, 2018 and 2017, the related consolidated statements of income, comprehensive income, stockholders' equity and cash flows for each of the three years in the period ended December 31, 2018, and the related notes and financial statement schedule listed in the Index at Item 15(a) and our report dated February 28, 2019 expressed an unqualified opinion thereon.
Basis for Opinion
The Company's management is responsible for maintaining effective internal control over financial reporting and for its assessment of the effectiveness of internal control over financial reporting included in the accompanying Management Report on Internal Control Over Financial Reporting. Our responsibility is to express an opinion on the Company's internal control over financial reporting based on our audit. We are a public accounting firm registered with the PCAOB and are required to be independent with respect to the Company in accordance with the U.S. federal securities laws and the applicable rules and regulations of the Securities and Exchange Commission and the PCAOB.
We conducted our audit in accordance with the standards of the PCAOB. Those standards require that we plan and perform the audit to obtain reasonable assurance about whether effective internal control over financial reporting was maintained in all material respects.
Our audit included obtaining an understanding of internal control over financial reporting, assessing the risk that a material weakness exists, testing and evaluating the design and operating effectiveness of internal control based on the assessed risk, and performing such other procedures as we considered necessary in the circumstances. We believe that our audit provides a reasonable basis for our opinion.
Definition and Limitations of Internal Control Over Financial Reporting
A company's internal control over financial reporting is a process designed to provide reasonable assurance regarding the reliability of financial reporting and the preparation of financial statements for external purposes in accordance with generally accepted accounting principles. A company's internal control over financial reporting includes those policies and procedures that (1) pertain to the maintenance of records that, in reasonable detail, accurately and fairly reflect the transactions and dispositions of the assets of the company; (2) provide reasonable assurance that transactions are recorded as necessary to permit preparation of financial statements in accordance with generally accepted accounting principles, and that receipts and expenditures of the company are being made only in accordance with authorizations of management and directors of the company; and (3) provide reasonable assurance regarding prevention or timely detection of unauthorized acquisition, use, or disposition of the company's assets that could have a material effect on the financial statements.
Because of its inherent limitations, internal control over financial reporting may not prevent or detect misstatements. Also, projections of any evaluation of effectiveness to future periods are subject to the risk that controls may become inadequate because of changes in conditions, or that the degree of compliance with the policies or procedures may deteriorate.
/s/ Ernst & Young LLP
Las Vegas, Nevada
February 28, 2019
64
REPORT OF INDEPENDENT REGISTERED PUBLIC ACCOUNTING FIRM
The Board of Directors and Stockholders of Wynn Resorts, Limited and subsidiaries:
Opinion on the Financial Statements
We have audited the accompanying consolidated balance sheets of Wynn Resorts, Limited and subsidiaries (the Company) as of December 31, 2018 and 2017, the related consolidated statements of income, comprehensive income, stockholders' equity and cash flows for each of the three years in the period ended December 31, 2018, and the related notes and financial statement schedule listed in the Index at Item 15(a)2 (collectively referred to as the “consolidated financial statements”). In our opinion, the consolidated financial statements present fairly, in all material respects, the financial position of the Company at December 31, 2018 and 2017, and the results of its operations and its cash flows for each of the three years in the period ended December 31, 2018, in conformity with U.S. generally accepted accounting principles.
We also have audited, in accordance with the standards of the Public Company Accounting Oversight Board (United States) (PCAOB), the Company's internal control over financial reporting as of December 31, 2018, based on criteria established in Internal Control-Integrated Framework issued by the Committee of Sponsoring Organizations of the Treadway Commission (2013 framework), and our report dated February 28, 2019 expressed an unqualified opinion thereon.
Change in Accounting Principles
As discussed in Note 2 to the consolidated financial statements, the Company has changed its method for recognizing revenue and the presentation of restricted cash and restricted cash equivalents on the statement of cash flows due to the adoption of new accounting standards. These changes have been applied retrospectively to all periods presented.
Basis for Opinion
These financial statements are the responsibility of the Company's management. Our responsibility is to express an opinion on the Company’s financial statements based on our audits. We are a public accounting firm registered with the PCAOB and are required to be independent with respect to the Company in accordance with the U.S. federal securities laws and the applicable rules and regulations of the Securities and Exchange Commission and the PCAOB.
We conducted our audits in accordance with the standards of the PCAOB. Those standards require that we plan and perform the audit to obtain reasonable assurance about whether the financial statements are free of material misstatement, whether due to error or fraud. Our audits included performing procedures to assess the risks of material misstatement of the financial statements, whether due to error or fraud, and performing procedures that respond to those risks. Such procedures included examining, on a test basis, evidence regarding the amounts and disclosures in the financial statements. Our audits also included evaluating the accounting principles used and significant estimates made by management, as well as evaluating the overall presentation of the financial statements. We believe that our audits provide a reasonable basis for our opinion.
/s/ Ernst & Young LLP
We have served as the Company's auditor since 2006.
Las Vegas, Nevada
February 28, 2019
65
WYNN RESORTS, LIMITED AND SUBSIDIARIES
CONSOLIDATED BALANCE SHEETS
(in thousands, except share data)
|
December 31,
|
|||||||
|
2018
|
2017
|
||||||
|
ASSETS
|
|||||||
|
Current assets:
|
|||||||
|
Cash and cash equivalents
|
$
|
2,215,001
|
|
$
|
2,804,474
|
|
|
|
Investment securities
|
—
|
|
166,773
|
|
|||
|
Receivables, net
|
276,644
|
|
224,128
|
|
|||
|
Inventories
|
66,627
|
|
71,636
|
|
|||
|
Prepaid expenses and other
|
83,104
|
|
156,773
|
|
|||
|
Total current assets
|
2,641,376
|
|
3,423,784
|
|
|||
|
Property and equipment, net
|
9,385,920
|
|
8,498,756
|
|
|||
|
Restricted cash
|
4,322
|
|
2,160
|
|
|||
|
Investment securities
|
—
|
|
160,682
|
|
|||
|
Intangible assets, net
|
222,506
|
|
123,705
|
|
|||
|
Deferred income taxes, net
|
736,452
|
|
240,533
|
|
|||
|
Other assets
|
225,693
|
|
232,119
|
|
|||
|
Total assets
|
$
|
13,216,269
|
|
$
|
12,681,739
|
|
|
|
LIABILITIES AND STOCKHOLDERS' EQUITY
|
|||||||
|
Current liabilities:
|
|||||||
|
Accounts and construction payables
|
$
|
321,796
|
|
$
|
285,437
|
|
|
|
Customer deposits
|
955,450
|
|
1,049,629
|
|
|||
|
Gaming taxes payable
|
247,341
|
|
211,600
|
|
|||
|
Accrued compensation and benefits
|
163,966
|
|
140,450
|
|
|||
|
Accrued interest
|
61,595
|
|
94,695
|
|
|||
|
Current portion of long-term debt
|
11,960
|
|
62,690
|
|
|||
|
Other accrued liabilities
|
119,955
|
|
85,789
|
|
|||
|
Total current liabilities
|
1,882,063
|
|
1,930,290
|
|
|||
|
Long-term debt
|
9,411,140
|
|
9,565,936
|
|
|||
|
Other long-term liabilities
|
108,277
|
|
107,163
|
|
|||
|
Total liabilities
|
11,401,480
|
|
11,603,389
|
|
|||
|
Commitments and contingencies (Note 15)
|
|
|
|||||
|
Stockholders' equity:
|
|||||||
|
Preferred stock, par value $0.01; 40,000,000 shares authorized; zero shares issued and outstanding
|
—
|
|
—
|
|
|||
|
Common stock, par value $0.01; 400,000,000 shares authorized; 122,115,585 and 116,391,753 shares issued; 107,232,026 and 103,005,866 shares outstanding, respectively
|
1,221
|
|
1,164
|
|
|||
|
Treasury stock, at cost; 14,883,559 and 13,385,887 shares, respectively
|
(1,344,012
|
)
|
(1,184,468
|
)
|
|||
|
Additional paid-in capital
|
2,457,079
|
|
1,497,928
|
|
|||
|
Accumulated other comprehensive loss
|
(1,950
|
)
|
(1,845
|
)
|
|||
|
Retained earnings
|
921,785
|
|
635,067
|
|
|||
|
Total Wynn Resorts, Limited stockholders' equity
|
2,034,123
|
|
947,846
|
|
|||
|
Noncontrolling interests
|
(219,334
|
)
|
130,504
|
|
|||
|
Total stockholders' equity
|
1,814,789
|
|
1,078,350
|
|
|||
|
Total liabilities and stockholders' equity
|
$
|
13,216,269
|
|
$
|
12,681,739
|
|
|
The accompanying notes are an integral part of these consolidated financial statements.
66
WYNN RESORTS, LIMITED AND SUBSIDIARIES
CONSOLIDATED STATEMENTS OF INCOME
(in thousands, except per share data)
|
Years Ended December 31,
|
|||||||||||
|
2018
|
2017
|
2016
|
|||||||||
|
(as adjusted)
|
(as adjusted)
|
||||||||||
|
Operating revenues:
|
|||||||||||
|
Casino
|
$
|
4,784,990
|
|
$
|
4,244,303
|
|
$
|
2,750,890
|
|
||
|
Rooms
|
751,800
|
|
670,957
|
|
595,610
|
|
|||||
|
Food and beverage
|
754,128
|
|
732,115
|
|
635,411
|
|
|||||
|
Entertainment, retail and other
|
426,742
|
|
422,785
|
|
363,886
|
|
|||||
|
Total operating revenues
|
6,717,660
|
|
6,070,160
|
|
4,345,797
|
|
|||||
|
Operating expenses:
|
|||||||||||
|
Casino
|
3,036,907
|
|
2,718,120
|
|
1,768,320
|
|
|||||
|
Rooms
|
254,549
|
|
244,828
|
|
206,848
|
|
|||||
|
Food and beverage
|
611,706
|
|
567,690
|
|
499,202
|
|
|||||
|
Entertainment, retail and other
|
183,113
|
|
196,547
|
|
179,150
|
|
|||||
|
General and administrative
|
761,415
|
|
685,485
|
|
548,143
|
|
|||||
|
Litigation settlement
|
463,557
|
|
—
|
|
—
|
|
|||||
|
Provision (benefit) for doubtful accounts
|
6,527
|
|
(6,711
|
)
|
8,203
|
|
|||||
|
Pre-opening
|
53,490
|
|
26,692
|
|
154,717
|
|
|||||
|
Depreciation and amortization
|
550,596
|
|
552,368
|
|
404,730
|
|
|||||
|
Property charges and other
|
60,256
|
|
29,576
|
|
54,822
|
|
|||||
|
Total operating expenses
|
5,982,116
|
|
5,014,595
|
|
3,824,135
|
|
|||||
|
Operating income
|
735,544
|
|
1,055,565
|
|
521,662
|
|
|||||
|
Other income (expense):
|
|||||||||||
|
Interest income
|
29,866
|
|
31,193
|
|
13,536
|
|
|||||
|
Interest expense, net of amounts capitalized
|
(381,849
|
)
|
(388,664
|
)
|
(289,365
|
)
|
|||||
|
Change in derivatives fair value
|
(4,520
|
)
|
(1,056
|
)
|
433
|
|
|||||
|
Change in Redemption Note fair value
|
(69,331
|
)
|
(59,700
|
)
|
65,043
|
|
|||||
|
Gain (loss) on extinguishment of debt
|
104
|
|
(55,360
|
)
|
—
|
|
|||||
|
Other
|
(4,074
|
)
|
(21,709
|
)
|
(712
|
)
|
|||||
|
Other income (expense), net
|
(429,804
|
)
|
(495,296
|
)
|
(211,065
|
)
|
|||||
|
Income before income taxes
|
305,740
|
|
560,269
|
|
310,597
|
|
|||||
|
Benefit (provision) for income taxes
|
497,344
|
|
328,985
|
|
(8,128
|
)
|
|||||
|
Net income
|
803,084
|
|
889,254
|
|
302,469
|
|
|||||
|
Less: net income attributable to noncontrolling interests
|
(230,654
|
)
|
(142,073
|
)
|
(60,494
|
)
|
|||||
|
Net income attributable to Wynn Resorts, Limited
|
$
|
572,430
|
|
$
|
747,181
|
|
$
|
241,975
|
|
||
|
Basic and diluted income per common share:
|
|||||||||||
|
Net income attributable to Wynn Resorts, Limited:
|
|||||||||||
|
Basic
|
$
|
5.37
|
|
$
|
7.32
|
|
$
|
2.39
|
|
||
|
Diluted
|
$
|
5.35
|
|
$
|
7.28
|
|
$
|
2.38
|
|
||
|
Weighted average common shares outstanding:
|
|||||||||||
|
Basic
|
106,529
|
|
102,071
|
|
101,445
|
|
|||||
|
Diluted
|
107,032
|
|
102,598
|
|
101,855
|
|
|||||
The accompanying notes are an integral part of these consolidated financial statements.
67
WYNN RESORTS, LIMITED AND SUBSIDIARIES
CONSOLIDATED STATEMENTS OF COMPREHENSIVE INCOME
(in thousands)
|
Years Ended December 31,
|
|||||||||||
|
2018
|
2017
|
2016
|
|||||||||
|
Net income
|
$
|
803,084
|
|
$
|
889,254
|
|
$
|
302,469
|
|
||
|
Other comprehensive income (loss):
|
|||||||||||
|
Foreign currency translation adjustments, before and after tax
|
(1,936
|
)
|
(3,832
|
)
|
(180
|
)
|
|||||
|
Change in net unrealized loss (gain) on investment securities, before and after tax
|
1,292
|
|
(563
|
)
|
522
|
|
|||||
|
Redemption Note credit risk adjustment, net of tax of $2,735
|
9,211
|
|
—
|
|
—
|
|
|||||
|
Total comprehensive income
|
811,651
|
|
884,859
|
|
302,811
|
|
|||||
|
Less: comprehensive income attributable to noncontrolling interests
|
(230,115
|
)
|
(141,007
|
)
|
(60,444
|
)
|
|||||
|
Comprehensive income attributable to Wynn Resorts, Limited
|
$
|
581,536
|
|
$
|
743,852
|
|
$
|
242,367
|
|
||
The accompanying notes are an integral part of these consolidated financial statements.
68
WYNN RESORTS, LIMITED AND SUBSIDIARIES
CONSOLIDATED STATEMENTS OF STOCKHOLDERS' EQUITY
(in thousands, except share data)
|
Common stock
|
||||||||||||||||||||||||||||||||||
|
Shares
outstanding
|
Par
value
|
Treasury
stock
|
Additional
paid-in
capital
|
Accumulated
other
comprehensive
income (loss)
|
Retained
earnings
|
Total
Wynn Resorts, Limited
stockholders'
equity (deficit)
|
Noncontrolling
interests
|
Total stockholders'
equity
|
||||||||||||||||||||||||||
|
Balances, January 1, 2016
|
101,571,909
|
|
$
|
1,146
|
|
$
|
(1,152,680
|
)
|
$
|
983,131
|
|
$
|
1,092
|
|
$
|
55,332
|
|
$
|
(111,979
|
)
|
$
|
133,824
|
|
$
|
21,845
|
|
||||||||
|
Net income
|
—
|
|
—
|
|
—
|
|
—
|
|
—
|
|
241,975
|
|
241,975
|
|
60,494
|
|
302,469
|
|
||||||||||||||||
|
Currency translation adjustment
|
—
|
|
—
|
|
—
|
|
—
|
|
(130
|
)
|
—
|
|
(130
|
)
|
(50
|
)
|
(180
|
)
|
||||||||||||||||
|
Change in net unrealized gain on investment securities
|
—
|
|
—
|
|
—
|
|
—
|
|
522
|
|
—
|
|
522
|
|
—
|
|
522
|
|
||||||||||||||||
|
Exercise of stock options
|
74,000
|
|
1
|
|
—
|
|
3,486
|
|
—
|
|
—
|
|
3,487
|
|
—
|
|
3,487
|
|
||||||||||||||||
|
Issuance of restricted stock
|
412,504
|
|
4
|
|
—
|
|
(4
|
)
|
—
|
|
—
|
|
—
|
|
—
|
|
—
|
|
||||||||||||||||
|
Cancellation of restricted stock
|
(60,000
|
)
|
(1
|
)
|
—
|
|
1
|
|
—
|
|
—
|
|
—
|
|
—
|
|
—
|
|
||||||||||||||||
|
Shares repurchased by the company and held as treasury shares
|
(198,942
|
)
|
—
|
|
(14,017
|
)
|
—
|
|
—
|
|
—
|
|
(14,017
|
)
|
—
|
|
(14,017
|
)
|
||||||||||||||||
|
Shares of subsidiary purchased for share award plan
|
—
|
|
—
|
|
—
|
|
(5,471
|
)
|
—
|
|
—
|
|
(5,471
|
)
|
(2,109
|
)
|
(7,580
|
)
|
||||||||||||||||
|
Sale of ownership interest in subsidiary, net of income tax of $49.8 million
|
—
|
|
—
|
|
—
|
|
224,013
|
|
—
|
|
—
|
|
224,013
|
|
15,890
|
|
239,903
|
|
||||||||||||||||
|
Cash dividends declared
|
—
|
|
—
|
|
—
|
|
—
|
|
—
|
|
(202,210
|
)
|
(202,210
|
)
|
(111,716
|
)
|
(313,926
|
)
|
||||||||||||||||
|
Distributions to noncontrolling interest
|
—
|
|
—
|
|
—
|
|
—
|
|
—
|
|
—
|
|
—
|
|
(33
|
)
|
(33
|
)
|
||||||||||||||||
|
Excess tax benefits from stock-based compensation
|
—
|
|
—
|
|
—
|
|
802
|
|
—
|
|
—
|
|
802
|
|
—
|
|
802
|
|
||||||||||||||||
|
Stock-based compensation
|
—
|
|
—
|
|
—
|
|
20,957
|
|
—
|
|
—
|
|
20,957
|
|
3,632
|
|
24,589
|
|
||||||||||||||||
|
Balances, December 31, 2016
|
101,799,471
|
|
1,150
|
|
(1,166,697
|
)
|
1,226,915
|
|
1,484
|
|
95,097
|
|
157,949
|
|
99,932
|
|
257,881
|
|
||||||||||||||||
|
Cumulative effect, change in accounting for stock-based compensation
|
—
|
|
—
|
|
—
|
|
2,807
|
|
—
|
|
(2,696
|
)
|
111
|
|
—
|
|
111
|
|
||||||||||||||||
|
Net income
|
—
|
|
—
|
|
—
|
|
—
|
|
—
|
|
747,181
|
|
747,181
|
|
142,073
|
|
889,254
|
|
||||||||||||||||
|
Currency translation adjustment
|
—
|
|
—
|
|
—
|
|
—
|
|
(2,766
|
)
|
—
|
|
(2,766
|
)
|
(1,066
|
)
|
(3,832
|
)
|
||||||||||||||||
|
Change in net unrealized loss on investment securities
|
—
|
|
—
|
|
—
|
|
—
|
|
(563
|
)
|
—
|
|
(563
|
)
|
—
|
|
(563
|
)
|
||||||||||||||||
|
Exercise of stock options
|
661,800
|
|
7
|
|
—
|
|
61,988
|
|
—
|
|
—
|
|
61,995
|
|
214
|
|
62,209
|
|
||||||||||||||||
|
Issuance of restricted stock
|
706,341
|
|
7
|
|
—
|
|
18,565
|
|
—
|
|
—
|
|
18,572
|
|
653
|
|
19,225
|
|
||||||||||||||||
|
Cancellation of restricted stock
|
(13,333
|
)
|
—
|
|
—
|
|
—
|
|
—
|
|
—
|
|
—
|
|
—
|
|
—
|
|
||||||||||||||||
|
Shares repurchased by the company and held as treasury shares
|
(148,413
|
)
|
—
|
|
(17,771
|
)
|
—
|
|
—
|
|
—
|
|
(17,771
|
)
|
—
|
|
(17,771
|
)
|
||||||||||||||||
|
Shares of subsidiary repurchased for share award plan
|
—
|
|
—
|
|
—
|
|
(283
|
)
|
—
|
|
—
|
|
(283
|
)
|
(109
|
)
|
(392
|
)
|
||||||||||||||||
|
Sale of ownership interest in subsidiary, net of income tax of $17.8 million
|
—
|
|
—
|
|
—
|
|
149,259
|
|
—
|
|
—
|
|
149,259
|
|
13,238
|
|
162,497
|
|
||||||||||||||||
|
Cash dividends declared
|
—
|
|
—
|
|
—
|
|
—
|
|
—
|
|
(204,515
|
)
|
(204,515
|
)
|
(116,568
|
)
|
(321,083
|
)
|
||||||||||||||||
|
Distributions to noncontrolling interest
|
—
|
|
—
|
|
—
|
|
—
|
|
—
|
|
—
|
|
—
|
|
(11,436
|
)
|
(11,436
|
)
|
||||||||||||||||
|
Stock-based compensation
|
—
|
|
—
|
|
—
|
|
38,677
|
|
—
|
|
—
|
|
38,677
|
|
3,573
|
|
42,250
|
|
||||||||||||||||
|
Balances, December 31, 2017
|
103,005,866
|
|
1,164
|
|
(1,184,468
|
)
|
1,497,928
|
|
(1,845
|
)
|
635,067
|
|
947,846
|
|
130,504
|
|
1,078,350
|
|
||||||||||||||||
|
Cumulative effect, change in accounting for credit risk, net of tax of $2,735
|
—
|
|
—
|
|
—
|
|
—
|
|
(9,211
|
)
|
9,211
|
|
—
|
|
—
|
|
—
|
|
||||||||||||||||
|
Net income
|
—
|
|
—
|
|
—
|
|
—
|
|
—
|
|
572,430
|
|
572,430
|
|
230,654
|
|
803,084
|
|
||||||||||||||||
|
Currency translation adjustment
|
—
|
|
—
|
|
—
|
|
—
|
|
(1,397
|
)
|
—
|
|
(1,397
|
)
|
(539
|
)
|
(1,936
|
)
|
||||||||||||||||
|
Change in net unrealized loss on investment securities
|
—
|
|
—
|
|
—
|
|
—
|
|
1,292
|
|
—
|
|
1,292
|
|
—
|
|
1,292
|
|
||||||||||||||||
|
Redemption Note settlement
|
—
|
|
—
|
|
—
|
|
—
|
|
9,211
|
|
—
|
|
9,211
|
|
—
|
|
9,211
|
|
||||||||||||||||
|
Exercise of stock options
|
261,470
|
|
2
|
|
—
|
|
21,463
|
|
—
|
|
—
|
|
21,465
|
|
506
|
|
21,971
|
|
||||||||||||||||
|
Issuance of common stock
|
5,300,000
|
|
53
|
|
—
|
|
915,187
|
|
—
|
|
—
|
|
915,240
|
|
—
|
|
915,240
|
|
||||||||||||||||
|
Issuance of restricted stock
|
288,270
|
|
3
|
|
—
|
|
1,295
|
|
—
|
|
—
|
|
1,298
|
|
501
|
|
1,799
|
|
||||||||||||||||
|
Cancellation of restricted stock
|
(125,908
|
)
|
(1
|
)
|
—
|
|
1
|
|
—
|
|
—
|
|
—
|
|
—
|
|
—
|
|
||||||||||||||||
|
Shares repurchased by the Company and held as treasury shares
|
(1,497,672
|
)
|
—
|
|
(159,544
|
)
|
—
|
|
—
|
|
—
|
|
(159,544
|
)
|
—
|
|
(159,544
|
)
|
||||||||||||||||
|
Shares of subsidiary repurchased for share award plan
|
—
|
|
—
|
|
—
|
|
(4,497
|
)
|
—
|
|
—
|
|
(4,497
|
)
|
(1,735
|
)
|
(6,232
|
)
|
||||||||||||||||
|
Cash dividends declared
|
—
|
|
—
|
|
—
|
|
—
|
|
—
|
|
(294,923
|
)
|
(294,923
|
)
|
(276,528
|
)
|
(571,451
|
)
|
||||||||||||||||
|
Distributions to noncontrolling interest
|
—
|
|
—
|
|
—
|
|
—
|
|
—
|
|
—
|
|
—
|
|
(305,372
|
)
|
(305,372
|
)
|
||||||||||||||||
|
Stock-based compensation
|
—
|
|
—
|
|
—
|
|
25,702
|
|
—
|
|
—
|
|
25,702
|
|
2,675
|
|
28,377
|
|
||||||||||||||||
|
Balances, December 31, 2018
|
107,232,026
|
|
$
|
1,221
|
|
$
|
(1,344,012
|
)
|
$
|
2,457,079
|
|
$
|
(1,950
|
)
|
$
|
921,785
|
|
$
|
2,034,123
|
|
$
|
(219,334
|
)
|
$
|
1,814,789
|
|
||||||||
The accompanying notes are an integral part of these consolidated financial statements.
69
WYNN RESORTS, LIMITED AND SUBSIDIARIES
CONSOLIDATED STATEMENTS OF CASH FLOWS
(in thousands)
|
Years Ended December 31,
|
|||||||||||
|
2018
|
2017
|
2016
|
|||||||||
|
(as adjusted)
|
(as adjusted)
|
||||||||||
|
Cash flows from operating activities:
|
|||||||||||
|
Net income
|
$
|
803,084
|
|
$
|
889,254
|
|
$
|
302,469
|
|
||
|
Adjustments to reconcile net income to net cash provided by operating activities:
|
|||||||||||
|
Depreciation and amortization
|
550,596
|
|
552,368
|
|
404,730
|
|
|||||
|
Deferred income taxes
|
(498,654
|
)
|
(310,854
|
)
|
6,356
|
|
|||||
|
Change in Redemption Note fair value
|
69,331
|
|
59,700
|
|
(65,043
|
)
|
|||||
|
Property charges and other
|
56,974
|
|
44,004
|
|
42,670
|
|
|||||
|
Amortization of debt issuance costs
|
36,917
|
|
25,013
|
|
24,326
|
|
|||||
|
Stock-based compensation expense
|
35,040
|
|
43,971
|
|
43,722
|
|
|||||
|
Provision (benefit) for doubtful accounts
|
6,527
|
|
(6,711
|
)
|
8,203
|
|
|||||
|
Change in derivatives fair value
|
4,520
|
|
1,056
|
|
(433
|
)
|
|||||
|
Loss on extinguishment of debt
|
4,391
|
|
55,360
|
|
—
|
|
|||||
|
Excess tax benefits from stock-based compensation
|
—
|
|
—
|
|
(742
|
)
|
|||||
|
Increase (decrease) in cash from changes in:
|
|||||||||||
|
Receivables, net
|
(59,157
|
)
|
829
|
|
(39,272
|
)
|
|||||
|
Inventories and prepaid expenses and other
|
(5,212
|
)
|
(4,372
|
)
|
(36,642
|
)
|
|||||
|
Customer deposits
|
(92,395
|
)
|
456,005
|
|
163,217
|
|
|||||
|
Accounts payable and accrued expenses
|
49,527
|
|
70,954
|
|
116,985
|
|
|||||
|
Net cash provided by operating activities
|
961,489
|
|
1,876,577
|
|
970,546
|
|
|||||
|
Cash flows from investing activities:
|
|||||||||||
|
Capital expenditures, net of construction payables and retention
|
(1,475,972
|
)
|
(935,474
|
)
|
(1,225,943
|
)
|
|||||
|
Purchase of intangible and other assets
|
(126,414
|
)
|
(13,571
|
)
|
(14,985
|
)
|
|||||
|
Proceeds from sale of assets
|
54,213
|
|
20,374
|
|
3,872
|
|
|||||
|
Proceeds from the sale or maturity of investment securities
|
359,461
|
|
200,366
|
|
144,829
|
|
|||||
|
Purchase of investment securities
|
(34,098
|
)
|
(229,328
|
)
|
(196,750
|
)
|
|||||
|
Return of investment in unconsolidated affiliates
|
—
|
|
—
|
|
727
|
|
|||||
|
Net cash used in investing activities
|
(1,222,810
|
)
|
(957,633
|
)
|
(1,288,250
|
)
|
|||||
|
Cash flows from financing activities:
|
|||||||||||
|
Repayments of long-term debt
|
(3,032,267
|
)
|
(2,959,843
|
)
|
(400,707
|
)
|
|||||
|
Proceeds from issuance of long-term debt
|
2,788,925
|
|
2,429,988
|
|
1,430,313
|
|
|||||
|
Payments for financing costs
|
(48,297
|
)
|
(91,174
|
)
|
(5,381
|
)
|
|||||
|
Payment to acquire derivatives
|
(3,900
|
)
|
—
|
|
—
|
|
|||||
|
Proceeds from issuance of common stock, net of issuance costs
|
915,240
|
|
—
|
|
—
|
|
|||||
|
Dividends paid
|
(569,781
|
)
|
(320,760
|
)
|
(325,217
|
)
|
|||||
|
Distribution to noncontrolling interest
|
(305,372
|
)
|
(11,436
|
)
|
(33
|
)
|
|||||
|
Repurchase of common stock
|
(159,544
|
)
|
(17,771
|
)
|
(14,017
|
)
|
|||||
|
Proceeds from exercise of stock options
|
21,971
|
|
62,209
|
|
3,487
|
|
|||||
|
Shares of subsidiary repurchased for share award plan
|
(6,232
|
)
|
(392
|
)
|
(7,580
|
)
|
|||||
|
Sale of ownership interest in subsidiaries
|
75,000
|
|
180,000
|
|
217,000
|
|
|||||
|
Income taxes paid from sale of ownership interest of subsidiary
|
—
|
|
(25,176
|
)
|
—
|
|
|||||
|
Payments on long-term land concession obligation
|
—
|
|
—
|
|
(15,978
|
)
|
|||||
|
Excess tax benefits from stock-based compensation
|
—
|
|
—
|
|
742
|
|
|||||
|
Net cash (used in) provided by financing activities
|
(324,257
|
)
|
(754,355
|
)
|
882,629
|
|
|||||
|
Effect of exchange rate on cash
|
(1,733
|
)
|
(3,900
|
)
|
(1,129
|
)
|
|||||
|
Cash, cash equivalents and restricted cash:
|
|||||||||||
|
Increase (decrease) in cash, cash equivalents and restricted cash
|
(587,311
|
)
|
160,689
|
|
563,796
|
|
|||||
|
Balance, beginning of period
|
2,806,634
|
|
2,645,945
|
|
2,082,149
|
|
|||||
|
Balance, end of period
|
$
|
2,219,323
|
|
$
|
2,806,634
|
|
$
|
2,645,945
|
|
||
|
Supplemental cash flow disclosures
|
|||||||||||
|
Cash paid for interest, net of amounts capitalized
|
$
|
378,023
|
|
$
|
367,074
|
|
$
|
265,076
|
|
||
|
Cash paid for income taxes
|
$
|
1,885
|
|
$
|
37,089
|
|
$
|
2,040
|
|
||
|
Property and equipment acquired under capital lease
|
$
|
—
|
|
$
|
16,593
|
|
$
|
—
|
|
||
|
Stock-based compensation capitalized into construction
|
$
|
11
|
|
$
|
80
|
|
$
|
92
|
|
||
|
Liability settled with shares of common stock
|
$
|
1,800
|
|
$
|
19,225
|
|
$
|
—
|
|
||
|
Change in accounts and construction payables related to property and equipment
|
$
|
35,934
|
|
$
|
(35,447
|
)
|
$
|
(34,049
|
)
|
||
|
Change in dividends payable on unvested restricted stock included in other accrued liabilities
|
$
|
1,669
|
|
$
|
323
|
|
$
|
(11,291
|
)
|
||
|
Note receivable acquired from sale of ownership interest in subsidiary
|
$
|
—
|
|
$
|
—
|
|
$
|
72,464
|
|
||
The accompanying notes are an integral part of these consolidated financial statements.
70
WYNN RESORTS, LIMITED AND SUBSIDIARIES
NOTES TO CONSOLIDATED FINANCIAL STATEMENTS
Note 1 - Organization
Wynn Resorts, Limited, a Nevada corporation (together with its subsidiaries, "Wynn Resorts" or the "Company") is a developer, owner and operator of destination casino resorts (integrated resorts). In the Macau Special Administrative Region of the People's Republic of China ("Macau"), the Company owns approximately
72%
of Wynn Macau, Limited ("WML"), which includes the operations of the Wynn Palace and Wynn Macau resorts (collectively, the "Macau Operations"). In Las Vegas, Nevada, the Company operates and, with the exception of the retail space described below, owns
100%
of Wynn Las Vegas, which it also refers to as its Las Vegas Operations.
Macau Operations
Wynn Palace, which opened on August 22, 2016, features a luxury hotel tower with
1,706
guest rooms, suites and villas, approximately
424,000
square feet of casino space,
13
food and beverage outlets, approximately
37,000
square feet of meeting and convention space, approximately
106,000
square feet of retail space, public attractions, including a performance lake and floral art displays and recreation and leisure facilities.
Wynn Macau features
two
luxury hotel towers with a total of
1,008
guest rooms and suites, approximately
273,000
square feet of casino space,
11
food and beverage outlets, approximately
31,000
square feet of meeting and convention space, approximately
59,000
square feet of retail space, a rotunda show and recreation and leisure facilities.
Las Vegas Operations
Wynn Las Vegas features
two
luxury hotel towers with a total of
4,748
guest rooms, suites and villas, approximately
192,000
square feet of casino space,
33
food and beverage outlets, approximately
290,000
square feet of meeting and convention space, approximately
160,000
square feet of retail space (the majority of which is owned and operated under a joint venture of which the Company owns
50.1%
), as well as
two
theaters,
three
nightclubs and a beach club and recreation and leisure facilities.
In December 2016, the Company entered into a joint venture arrangement (the "Retail Joint Venture") with Crown Acquisitions Inc. ("Crown") to own and operate approximately
88,000
square feet of existing retail space. In November 2017, the Company contributed approximately
74,000
square feet of additional retail space to the Retail Joint Venture. The Company opened the additional retail space during the fourth quarter of 2018. For more information on the Retail Joint Venture, see
Note 14
, "Retail Joint Venture."
Development Projects
The Company is currently constructing Encore Boston Harbor, an integrated resort in Everett, Massachusetts, adjacent to Boston along the Mystic River. The resort will contain a hotel, a waterfront boardwalk, meeting and convention space, casino space, a spa, retail offerings and food and beverage outlets. The Company expects to open Encore Boston Harbor in mid-2019.
The Company is currently constructing approximately
430,000
square feet of additional meeting and convention space at Wynn Las Vegas and has begun design and site preparation for the reconfiguration of the Wynn Las Vegas golf course, which the Company closed in the fourth quarter of 2017. The Company expects to reopen the golf course in the fourth quarter of 2019 and open the additional meeting and convention space in the first quarter of 2020.
Note 2 - Summary of Significant Accounting Policies
Basis of Presentation and Principles of Consolidation
The accompanying consolidated financial statements have been prepared in accordance with U.S. generally accepted accounting principles ("GAAP"). The accompanying consolidated financial statements include the accounts of the Company, its majority-owned subsidiaries and entities the Company identifies as a variable interest entity ("VIE") and of which the Company is determined to be the primary beneficiary. For information on the Company's VIEs, see
Note 14
, "
Retail Joint Venture
." All significant intercompany accounts and transactions have been eliminated. Certain amounts in the consolidated financial statements for the previous years have been reclassified to be consistent with current year presentation, including reclassifications related to the adoption of ASU No. 2014-09,
Revenue from Contracts with Customers (Topic 606)
and ASU No. 2016-18,
Statement of Cash
71
WYNN RESORTS, LIMITED AND SUBSIDIARIES
NOTES TO CONSOLIDATED FINANCIAL STATEMENTS (continued)
Flows - Restricted Cash (Topic 230)
, as further discussed in
Recently Adopted Accounting Standards
. These reclassifications had no effect on previously reported net income.
Use of Estimates
The preparation of consolidated financial statements in conformity with GAAP requires management to make estimates and assumptions that affect the reported amounts of assets and liabilities and disclosure of contingent assets and liabilities at the date of the financial statements and the reported amounts of revenues and expenses during the reporting period. Actual results could differ from those estimates.
Cash, Cash Equivalents and Restricted Cash
Cash and cash equivalents consist of cash and highly liquid investments with original maturities of three months or less and include both U.S. dollar-denominated and foreign currency-denominated securities. Cash equivalents are carried at cost, which approximates fair value.
Cash, cash equivalents and restricted cash consisted of the following (in thousands):
|
December 31,
2018 |
December 31,
2017 |
||||||
|
Cash and cash equivalents:
|
|||||||
|
Cash
(1)
|
$
|
1,455,744
|
|
$
|
2,354,244
|
|
|
|
Cash equivalents
(2)
|
759,257
|
|
450,230
|
|
|||
|
Total cash and cash equivalents
|
2,215,001
|
|
2,804,474
|
|
|||
|
Restricted cash
(3)
|
4,322
|
|
2,160
|
|
|||
|
Total cash, cash equivalents and restricted cash
|
$
|
2,219,323
|
|
$
|
2,806,634
|
|
|
(1) Cash consists of cash on hand and bank deposits.
(2) Cash equivalents consist of bank time deposits and money market funds.
(3) Restricted cash consists of cash collateral associated with an obligation and cash held in a trust in accordance with WML's share award plan.
Investment Securities
Investment securities consist of domestic and foreign short-term and long-term investments in corporate bonds, commercial paper and U.S. government agency bonds reported at fair value, with unrealized gains and losses, net of tax, reported in other comprehensive income (loss). Short-term investments have a maturity date of less than one year and long-term investments are those with a maturity date greater than one year. The Company limits the amount of exposure to any one issuer with the objective of minimizing the potential risk of principal loss. Management determines the appropriate classification of its securities at the time of purchase and reevaluates such designation as of each balance sheet date. Adjustments are made for amortization of premiums and accretion of discounts to maturity computed under the effective interest method. Such amortization is included in interest income together with realized gains and losses and the stated interest on such securities.
The Company obtains pricing information in determining the fair value of its available-for-sale securities from independent pricing vendors. Based on management's inquiries, the pricing vendors use various pricing models consistent with what other market participants would use. The assumptions and inputs used by the pricing vendors are derived from market observable sources including: reported trades, broker/dealer quotes, issuer spreads, benchmark curves, bids, offers and other market-related data. The Company has not made adjustments to such prices. Each quarter, the Company validates the fair value pricing methodology to determine if the fair value is consistent with applicable accounting guidance and to confirm that the securities are classified properly in the fair value hierarchy. The Company compares the pricing received from its vendors to independent sources for the same or similar securities.
Accounts Receivable and Credit Risk
Financial instruments that potentially subject the Company to concentrations of credit risk consist principally of casino accounts receivable. The Company issues credit in the form of "markers" to approved casino customers following investigations of creditworthiness. As of
December 31, 2018
and
2017
, approximately
85.0%
and
81.7%
, respectively, of the Company's markers
72
WYNN RESORTS, LIMITED AND SUBSIDIARIES
NOTES TO CONSOLIDATED FINANCIAL STATEMENTS (continued)
were due from customers residing outside the United States, primarily in Asia. Business or economic conditions or other significant events in these countries could affect the collectability of such receivables.
Accounts receivable, including casino and hotel receivables, are typically non-interest bearing and are initially recorded at cost. An estimated allowance for doubtful accounts is maintained to reduce the Company's receivables to their carrying amount, which approximates fair value. The allowance estimate reflects specific review of customer accounts and outstanding gaming promoter accounts as well as management's experience with historical and current collection trends and current economic and business conditions. Accounts are written off when management deems them to be uncollectible. Recoveries of accounts previously written off are recorded when received.
Receivables, net consisted of the following (in thousands):
|
December 31,
|
|||||||
|
2018
|
2017
|
||||||
|
Casino
|
$
|
229,594
|
|
$
|
173,664
|
|
|
|
Hotel
|
22,086
|
|
22,487
|
|
|||
|
Other
|
57,658
|
|
58,577
|
|
|||
|
309,338
|
|
254,728
|
|
||||
|
Less: allowance for doubtful accounts
|
(32,694
|
)
|
(30,600
|
)
|
|||
|
$
|
276,644
|
|
$
|
224,128
|
|
||
Inventories
Inventories consist of retail merchandise and food and beverage items, which are stated at the lower of cost or market value and certain operating supplies. Cost is determined by the first-in, first-out, weighted average and specific identification methods.
Property and Equipment
Purchases of property and equipment are stated at cost, and when placed into service, are depreciated over the estimated useful lives of the assets using the straight-line method as follows:
|
Estimated Useful Life in Years
|
|
|
Buildings and improvements
|
10 - 45
|
|
Land improvements
|
10 - 45
|
|
Furniture, fixtures and equipment
|
3 - 20
|
|
Leasehold interest in land
|
25
|
|
Airplanes
|
20
|
Costs related to improvements are capitalized, while costs of repairs and maintenance are charged to expense as incurred. The cost and accumulated depreciation of property and equipment retired or otherwise disposed of are eliminated from the respective accounts and any resulting gain or loss is included in property charges and other.
Capitalized Interest
The interest cost associated with major development and construction projects is capitalized and included in the cost of the project. Interest capitalization ceases once a project is substantially complete or no longer undergoing construction activities to prepare it for its intended use. When no debt is specifically identified as being incurred in connection with a construction project, the Company capitalizes interest on amounts expended on the project using the weighted average cost of the Company's outstanding borrowings. Interest of
$57.3 million
,
$18.4 million
and
$94.1 million
was capitalized for the years ended
December 31, 2018
,
2017
and
2016
, respectively.
73
WYNN RESORTS, LIMITED AND SUBSIDIARIES
NOTES TO CONSOLIDATED FINANCIAL STATEMENTS (continued)
Intangible Assets
The Company's indefinite-lived intangible assets consist primarily of water rights acquired as part of the original purchase price of the property on which Wynn Las Vegas is located, and trademarks. Indefinite-lived intangible assets are not amortized, but are reviewed for impairment annually. The Company's finite-lived intangible assets consist primarily of its Macau gaming concession, Massachusetts gaming license and an intangible asset associated with its undeveloped land in Las Vegas. Finite-lived intangible assets are amortized over the shorter of their contractual terms or estimated useful lives.
Long-Lived Assets
Long-lived assets, which are to be held and used, including intangible assets and property and equipment, are periodically reviewed by management for impairment whenever events or changes in circumstances indicate that the carrying value of the asset may not be recoverable. If an indicator of impairment exists, the Company compares the estimated future cash flows of the asset, on an undiscounted basis, to the carrying value of the asset. If the undiscounted cash flows exceed the carrying value, no impairment is indicated. If the undiscounted cash flows do not exceed the carrying value, then impairment is measured as the difference between fair value and carrying value, with fair value typically based on a discounted cash flow model. If an asset is still under development, future cash flows include remaining construction costs.
Debt Issuance Costs
Direct and incremental costs and original issue discounts and premiums incurred in connection with the issuance of long-term debt are deferred and amortized to interest expense using the effective interest method or, if the amounts approximate the effective interest method, on a straight-line basis. Debt issuance costs incurred in connection with the issuance of the Company's revolving credit facilities are presented in noncurrent assets on the Consolidated Balance Sheets. All other debt issuance costs are presented as a direct reduction of long-term debt on the Consolidated Balance Sheets. Approximately
$36.9 million
,
$25.0 million
, and
$24.3 million
was amortized to interest expense during the years ended
December 31, 2018
,
2017
and
2016
, respectively.
Redemption Price Promissory Note
On February 18, 2012, pursuant to its articles of incorporation, the Company redeemed and canceled all Aruze USA, Inc.’s ("Aruze")
24,549,222
shares of Wynn Resorts’ common stock. In connection with the redemption of the shares, the Company issued a promissory note (the "Redemption Note") with a principal amount of
$1.94 billion
, a maturity date of February 18, 2022 and an interest rate of
2%
per annum, payable annually in arrears on each anniversary of the date of the Redemption Note. The Redemption Note was recorded at fair value in accordance with applicable accounting guidance. The Company repaid the principal amount in full on March 30, 2018. As of December 31, 2017, the fair value of the Redemption Note was
$1.88 billion
.
In determining this fair value, the Company estimated the Redemption Note's present value using discounted cash flows with a probability weighted expected return for redemption assumptions and a discount rate, which included time value and non-performance risk adjustments commensurate with the risk of the Redemption Note.
In determining the appropriate discount rate to be used to calculate the estimated present value, the Company considered the Redemption Note's subordinated position and credit risk relative to all other debt in the Company's capital structure and credit ratings associated with the Company's traded debt. Observable inputs for the risk free rate were based on Federal Reserve rates for U.S. Treasury securities and the credit risk spread was based on a yield curve index of similarly rated debt.
Derivative Financial Instruments
The Company uses derivative financial instruments to manage interest rate exposure. The fair value of derivative financial instruments is recognized as an asset or liability at each balance sheet date, with changes in fair value recorded in earnings as the Company's derivative financial instruments do not qualify for hedge accounting. The fair value approximates the amount the Company would pay if these contracts were settled at the respective valuation dates.
In accordance with the terms of the Retail Term Loan Agreement (as defined in
Note 6
, "
Long-Term Debt
"), the Retail Borrowers (as defined in
Note 6
, "Long-Term Debt") entered into a
five
-year interest rate collar with a notional value of
$615 million
for a cash payment of
$3.9 million
in July 2018. The interest rate collar establishes a range whereby the Retail Borrowers will pay the counterparty if one-month LIBOR falls below the established floor rate of
1.00%
, and the counterparty will pay the Retail Borrowers if one-month LIBOR exceeds the ceiling rate of
3.75%
. The interest rate collar settles monthly commencing in
74
WYNN RESORTS, LIMITED AND SUBSIDIARIES
NOTES TO CONSOLIDATED FINANCIAL STATEMENTS (continued)
August 2019 through the termination date in August 2024. No payments or receipts are exchanged on interest rate collar contracts unless interest rates rise above or fall below the pre-determined ceiling or floor rate, respectively. The Company measures the fair value of the interest rate collar at each balance sheet date based on a Black-Scholes option pricing model, which incorporates observable market inputs such as market volatility and interest rates, with changes in fair value recorded in earnings. As of
December 31, 2018
, the fair value of the interest rate collar was a liability of
$0.6 million
and was recorded in other long-term liabilities in the accompanying Consolidated Balance Sheet.
Gaming Taxes
The Company is subject to taxes based on gross gaming revenues in the jurisdictions in which it operates, subject to applicable jurisdictional adjustments. These gaming taxes are recorded as casino expenses in the accompanying Consolidated Statements of Income. These taxes totaled
$2.44 billion
,
$2.17 billion
and
$1.32 billion
for the years ended
December 31, 2018
,
2017
and
2016
, respectively.
Advertising Costs
The cost of advertising is expensed as incurred, and totaled
$40.6 million
,
$37.8 million
and
$37.0 million
for the years ended
December 31, 2018
,
2017
and
2016
, respectively.
Pre-Opening Expenses
Pre-opening expenses represent personnel, advertising, and other costs incurred prior to the opening of new ventures and are expensed as incurred. During the years ended
December 31, 2018
and
2017
, the Company incurred pre-opening expenses primarily in connection with the development of Encore Boston Harbor. During the year ended December 31,
2016
the Company incurred pre-opening expenses primarily in connection with the development of Wynn Palace.
Income Taxes
The Company is subject to income taxes in the U.S. and foreign jurisdictions where it operates. Accounting standards require the recognition of deferred tax assets, net of applicable reserves, and liabilities for the estimated future tax consequences attributable to differences between financial statement carrying amounts of existing assets and liabilities and their respective tax bases and operating loss and tax credit carryforwards. Deferred tax assets and liabilities are measured using enacted tax rates in effect for the year in which those temporary differences are expected to be recovered or settled. The effect of a change in tax rates on the income tax provision and deferred tax assets and liabilities generally is recognized in the results of operations in the period that includes the enactment date. Accounting standards also require recognition of a future tax benefit to the extent that realization of such benefit is more likely than not; otherwise, a valuation allowance is applied.
The Company's income tax returns are subject to examination by the Internal Revenue Service ("IRS") and other tax authorities in the locations where it operates. The Company assesses potentially unfavorable outcomes of such examinations based on accounting standards for uncertain income taxes. The accounting standards prescribe a minimum recognition threshold a tax position is required to meet before being recognized in the financial statements.
Uncertain tax position accounting standards apply to all tax positions related to income taxes. These accounting standards utilize a two-step approach for evaluating tax positions. If a tax position, based on its technical merits, is deemed more likely than not to be sustained, then the tax benefit is measured as the largest amount of benefit that is more likely than not to be realized upon settlement.
As applicable, the Company will recognize accrued penalties and interest related to unrecognized tax benefits in the provision for income taxes.
Foreign Currency
Gains or losses from foreign currency remeasurements are included in other income (expense) in the accompanying Consolidated Statements of Income. Balance sheet accounts are translated at the exchange rate in effect at each balance sheet date and income statement accounts are translated at the average rate of exchange prevailing during the year. Translation adjustments resulting from this process are charged or credited to other comprehensive income (loss).
75
WYNN RESORTS, LIMITED AND SUBSIDIARIES
NOTES TO CONSOLIDATED FINANCIAL STATEMENTS (continued)
Comprehensive Income and Accumulated Other Comprehensive Income (Loss)
Comprehensive income includes net income and all other non-stockholder changes in equity or other comprehensive income (loss). Components of the Company's comprehensive income are reported in the accompanying Consolidated Statements of Stockholders' Equity and Consolidated Statements of Comprehensive Income.
The following table presents the changes by component, net of tax and noncontrolling interests, in accumulated other comprehensive loss of the Company (in thousands):
|
Foreign
currency translation |
Unrealized
loss on investment securities |
Redemption Note
|
Accumulated
other comprehensive loss |
||||||||||||
|
January 1, 2018
|
$
|
(553
|
)
|
$
|
(1,292
|
)
|
$
|
—
|
|
$
|
(1,845
|
)
|
|||
|
Cumulative credit risk adjustment
(1)
|
—
|
|
—
|
|
(9,211
|
)
|
(9,211
|
)
|
|||||||
|
Change in net unrealized gain (loss)
|
(1,397
|
)
|
(1,510
|
)
|
7,690
|
|
4,783
|
|
|||||||
|
Amounts reclassified to net income
(2)
|
—
|
|
2,802
|
|
1,521
|
|
4,323
|
|
|||||||
|
Other comprehensive income (loss)
|
(1,397
|
)
|
1,292
|
|
9,211
|
|
9,106
|
|
|||||||
|
December 31, 2018
|
$
|
(1,950
|
)
|
$
|
—
|
|
$
|
—
|
|
$
|
(1,950
|
)
|
|||
(1) On January 1, 2018, the Company adopted Accounting Standards Update ("ASU") No. 2016-01,
Financial Instruments
. The adjustment to the beginning balance represents the cumulative effect of the change in instrument-specific credit risk on the Redemption Note. See "Recently Adopted Accounting Standards—Financial Instruments" below for additional information.
(2) The amounts reclassified to net income include
$1.8 million
for other-than-temporary impairment losses and
$1.0 million
in realized losses, both related to investment securities, and a
$1.5 million
realized gain related to the repayment of the Redemption Note.
Fair Value Measurements
The Company measures certain of its financial assets and liabilities, at fair value on a recurring basis pursuant to accounting standards for fair value measurements. Fair value is the price that would be received to sell an asset or paid to transfer a liability in an orderly transaction between market participants at the measurement date. These accounting standards establish a three-tier fair value hierarchy, which prioritizes the inputs used to measure fair value. These tiers include:
|
•
|
Level 1
- Observable inputs such as quoted prices in active markets.
|
|
•
|
Level 2
- Inputs other than quoted prices in active markets that are either directly or indirectly observable.
|
|
•
|
Level 3
- Unobservable inputs in which little or no market data exists, therefore requiring an entity to develop its own assumptions.
|
76
WYNN RESORTS, LIMITED AND SUBSIDIARIES
NOTES TO CONSOLIDATED FINANCIAL STATEMENTS (continued)
The following table presents assets and liabilities carried at fair value (in thousands):
|
Fair Value Measurements Using:
|
|||||||||||||||
|
December 31, 2018
|
Quoted
Market Prices in Active Markets (Level 1) |
Other
Observable Inputs (Level 2) |
Unobservable
Inputs (Level 3) |
||||||||||||
|
Assets:
|
|||||||||||||||
|
Cash equivalents
|
$
|
759,257
|
|
$
|
—
|
|
$
|
759,257
|
|
$
|
—
|
|
|||
|
Restricted cash
|
$
|
4,322
|
|
$
|
2,015
|
|
$
|
2,307
|
|
$
|
—
|
|
|||
|
Liabilities:
|
|||||||||||||||
|
Interest rate collar
|
$
|
619
|
|
$
|
—
|
|
$
|
619
|
|
$
|
—
|
|
|||
|
Fair Value Measurements Using:
|
|||||||||||||||
|
December 31, 2017
|
Quoted
Market Prices in Active Markets (Level 1) |
Other
Observable Inputs (Level 2) |
Unobservable
Inputs (Level 3) |
||||||||||||
|
Assets:
|
|||||||||||||||
|
Cash equivalents
|
$
|
450,230
|
|
$
|
11,200
|
|
$
|
439,030
|
|
$
|
—
|
|
|||
|
Available-for-sale securities
|
$
|
327,455
|
|
$
|
—
|
|
$
|
327,455
|
|
$
|
—
|
|
|||
|
Restricted cash
|
$
|
2,160
|
|
$
|
—
|
|
$
|
2,160
|
|
$
|
—
|
|
|||
|
Liabilities:
|
|||||||||||||||
|
Redemption Note
|
$
|
1,879,058
|
|
$
|
—
|
|
$
|
1,879,058
|
|
$
|
—
|
|
|||
Earnings Per Share
Basic earnings per share ("EPS") is computed by dividing net income attributable to Wynn Resorts by the weighted average number of shares outstanding during the year. Diluted EPS is computed by dividing net income attributable to Wynn Resorts by the weighted average number of common shares outstanding during the period increased to include the number of additional shares of common stock that would have been outstanding if the potential dilutive securities had been issued. Potentially dilutive securities include outstanding stock options and unvested restricted stock.
77
WYNN RESORTS, LIMITED AND SUBSIDIARIES
NOTES TO CONSOLIDATED FINANCIAL STATEMENTS (continued)
The weighted average number of common and common equivalent shares used in the calculation of basic and diluted EPS consisted of the following (in thousands, except per share amounts):
|
Years Ended December 31,
|
|||||||||||
|
2018
|
2017
|
2016
|
|||||||||
|
Numerator:
|
|||||||||||
|
Net income attributable to Wynn Resorts, Limited
|
$
|
572,430
|
|
$
|
747,181
|
|
$
|
241,975
|
|
||
|
Denominator:
|
|||||||||||
|
Weighted average common shares outstanding
|
106,529
|
|
102,071
|
|
101,445
|
|
|||||
|
Potential dilutive effect of stock options and restricted stock
|
503
|
|
527
|
|
410
|
|
|||||
|
Weighted average common and common equivalent shares outstanding
|
107,032
|
|
102,598
|
|
101,855
|
|
|||||
|
Net income attributable to Wynn Resorts, Limited per common share, basic
|
$
|
5.37
|
|
$
|
7.32
|
|
$
|
2.39
|
|
||
|
Net income attributable to Wynn Resorts, Limited per common share, diluted
|
$
|
5.35
|
|
$
|
7.28
|
|
$
|
2.38
|
|
||
|
Anti-dilutive stock options and restricted stock excluded from the calculation of diluted earnings per share
|
102
|
|
106
|
|
758
|
|
|||||
Stock-Based Compensation
The Company accounts for stock-based compensation in accordance with accounting standards, which require the compensation cost relating to share-based payment transactions be recognized in the Company's Consolidated Statements of Income. The cost is measured at the grant date, based on the estimated fair value of the award using the Black-Scholes option pricing model for stock options, and based on the closing share price of the Company's stock on the grant date for nonvested share awards. The cost is recognized as an expense on a straight-line basis over the employee's requisite service period (the vesting period of the award), and forfeitures are recognized as they occur. The Company's stock-based employee compensation arrangements are more fully discussed in
Note 11
, "
Stock-Based Compensation
."
Recently Adopted Accounting Standards
Revenue Recognition Standard
In May 2014, the Financial Accounting Standards Board ("FASB") issued ASU No. 2014-09,
Revenue from Contracts with Customers (Topic 606)
, which amends the existing revenue recognition guidance and creates a new topic for Revenue from Contracts with Customers. The guidance provides that an entity should recognize revenue to depict the transfer of promised goods or services to customers in an amount that reflects the consideration to which the entity expects to be entitled in exchange for those goods and services. This guidance also substantially revises required interim and annual disclosures. The Company adopted the guidance on January 1, 2018, which resulted in the following significant impacts on its Consolidated Financial Statements:
|
•
|
The promotional allowances line item was eliminated from the Consolidated Statements of Income with the majority of the amount being netted against casino revenues.
|
|
•
|
The estimated cost of providing complimentary goods or services will no longer be allocated primarily to casino expenses from other operating departments as the new guidance requires revenues and expenses associated with providing complimentary goods or services to be classified based on the goods or services provided.
|
|
•
|
The portion of junket commissions previously recorded as a casino expense is now recorded as a reduction of casino revenue.
|
|
•
|
Mandatory service charges on food and beverage are now recorded on a gross basis with the amount received from the customer recorded as food and beverage revenue and the corresponding amount paid to employees recorded as food and beverage expense.
|
Certain prior period amounts have been adjusted to reflect the full retrospective adoption of the guidance. There was no impact on the Company’s financial condition, operating income or net income.
78
WYNN RESORTS, LIMITED AND SUBSIDIARIES
NOTES TO CONSOLIDATED FINANCIAL STATEMENTS (continued)
The tables below provides a reconciliation of amounts previously reported and the resulting impacts from the adoption of the new revenue recognition guidance (in thousands):
|
December 31, 2017
|
|||||||||||
|
As Previously Reported
|
Adoption of ASC 606
|
As Adjusted
|
|||||||||
|
Gross revenues
|
$
|
6,768,246
|
|
$
|
(698,086
|
)
|
$
|
6,070,160
|
|
||
|
Promotional allowances
|
(461,878
|
)
|
461,878
|
|
—
|
|
|||||
|
Operating revenues
|
6,306,368
|
|
(236,208
|
)
|
6,070,160
|
|
|||||
|
Operating expenses
|
5,250,803
|
|
(236,208
|
)
|
5,014,595
|
|
|||||
|
Operating income
|
$
|
1,055,565
|
|
$
|
—
|
|
$
|
1,055,565
|
|
||
|
December 31, 2016
|
|||||||||||
|
As Previously Reported
|
Adoption of ASC 606
|
As Adjusted
|
|||||||||
|
Gross revenues
|
$
|
4,836,355
|
|
$
|
(490,558
|
)
|
$
|
4,345,797
|
|
||
|
Promotional allowances
|
(370,058
|
)
|
370,058
|
|
—
|
|
|||||
|
Operating revenues
|
4,466,297
|
|
(120,500
|
)
|
4,345,797
|
|
|||||
|
Operating expenses
|
3,944,635
|
|
(120,500
|
)
|
3,824,135
|
|
|||||
|
Operating income
|
$
|
521,662
|
|
$
|
—
|
|
$
|
521,662
|
|
||
Financial Instruments
In January 2016, the FASB issued ASU No. 2016-01,
Financial Instruments - Overall (Subtopic 824-10): Recognition and Measurement of Financial Assets and Financial Liabilities
, which requires equity investments to be measured at fair value with changes in fair value recognized through net income (other than those accounted for under the equity method of accounting or those that result in consolidation of the investee). The update also requires an entity to present separately in other comprehensive income the portion of the total change in the fair value of a liability resulting from a change in the instrument-specific credit risk when the entity has elected to measure the liability at fair value in accordance with the fair value option for financial instruments. This update eliminates the requirement to disclose the methods and significant assumptions used to estimate the fair value that is required to be disclosed for financial instruments measured at amortized cost on the balance sheet for public business entities. The Company adopted this guidance on January 1, 2018, which resulted in a
$9.2 million
cumulative unrealized loss, net of tax, being recorded to accumulated other comprehensive loss with a corresponding increase to retained earnings. The adjustment represents the portion of the cumulative change in the Redemption Note fair value resulting from the change in the instrument-specific credit risk previously included in other income (expense) on the Consolidated Statements of Income.
Restricted Cash
In November 2016, the FASB issued ASU No. 2016-18,
Statement of Cash Flows - Restricted Cash (Topic 230)
, which amends the existing guidance relating to the disclosure of restricted cash and restricted cash equivalents on the statement of cash flows. The ASU requires that amounts generally described as restricted cash or restricted cash equivalents should be included with cash and cash equivalents when reconciling the beginning-of-period and end-of-period total amounts shown on the statement of cash flows. The Company adopted this guidance on January 1, 2018 on a retrospective basis and the updated disclosures are reflected for the periods presented in the Consolidated Statements of Cash Flows. For the years ended December 31,
2017
and
2016
,
$190.6 million
of cash inflows and
$190.8 million
of cash outflows, respectively, were previously reported within cash flows from financing activities.
Income Taxes
In October 2016, the FASB issued ASU No. 2016-16,
Income Taxes - Intra-Entity Transfers of Assets Other than Inventory (Topic 740),
which requires the recognition of the income tax consequences of an intra-entity transfer of an asset, other than inventory, when the transfer occurs, rather than deferring such recognition until the asset is sold to an outside party. The Company adopted the guidance effective January 1, 2018, and this adoption did not have a material effect on its Consolidated Financial Statements.
79
WYNN RESORTS, LIMITED AND SUBSIDIARIES
NOTES TO CONSOLIDATED FINANCIAL STATEMENTS (continued)
Statement of Cash Flows
In August 2016, the FASB issued ASU No. 2016-15,
Statement of Cash Flows - Classification of Certain Cash Receipts and Cash Payments (Topic 230),
which clarifies the classification of certain cash receipts and cash payments on the statement of cash flows. In particular, the new guidance clarifies the classification related to several types of cash flows, including items such as debt extinguishment costs and distributions received from equity method investees. The new guidance also provides a three-step approach for classifying cash receipts and payments that have aspects of more than one class of cash flows. The Company adopted this guidance on January 1, 2018, and this adoption did not have a material effect on its Consolidated Statements of Cash Flows.
Accounting Standards Issued But Not Yet Adopted
Leases
In February 2016, the FASB issued ASU No. 2016-02,
Leases (Topic 842)
, and subsequent amendments to the initial guidance: ASU No. 2017-13, ASU No. 2018-10, and ASU No. 2018-11 (collectively, "Topic 842"). Topic 842 amends the existing guidance relating to the definition of a lease, recognition of lease assets and lease liabilities on the balance sheet and the disclosure of key information about leasing activities. Under the new guidance, lessees will be required to recognize a right-of-use asset and lease liability on the balance sheet, measured on a discounted basis. Operating leases are currently not recognized on the balance sheet. Lessor accounting will remain largely unchanged, other than certain targeted improvements intended to align lessor accounting with the lessee accounting model and with the updated revenue recognition guidance. Entities are required to adopt Topic 842 using a modified retrospective transition method at one of the following application dates: (1) the later of the beginning of the earliest period presented in the financial statements and the lease commencement date or (2) on the effective date of adoption. The Company will adopt Topic 842 on January 1, 2019 using the effective date transition approach, which will result in a balance sheet presentation that is not comparable to the prior period in the first year of adoption.
Topic 842 provides for transition relief by permitting the election of certain practical expedients. The Company is electing the reassessment package of practical expedients, which permits the Company not to reassess whether (1) any expired or existing contracts as of the adoption date are or contain a lease, (2) lease classification remains appropriate for any expired or existing leases as of the adoption date and (3) previously capitalized costs continue to qualify as initial direct costs on expired or existing leases as of the adoption date. The Company is not electing the hindsight practical expedient, which requires an entity to use hindsight in determining the lease term and in assessing impairment of right-of-use assets.
While the Company is currently assessing the quantitative impact the guidance will have on its Consolidated Financial Statements and related disclosures, the Company expects the most significant changes will be related to the recognition of right-of-use assets and lease liabilities for operating leases on the Company's Consolidated Balance Sheet, with no material impact to net income or cash flows.
Financial Instruments - Credit Losses
The FASB issued ASU No. 2016-13,
Financial Instruments - Credit Losses (Topic 326)
in 2016. The new guidance replaces the incurred loss impairment methodology in current U.S. GAAP with a methodology that reflects expected credit losses and requires consideration of a broader range of reasonable and supportable information to inform credit loss estimates. For trade and other receivables, loans and other financial instruments, the Company will be required to use a forward-looking expected loss model rather than the incurred loss model for recognizing credit losses which reflects losses that are probable. The new guidance will be effective beginning January 1, 2020, with early adoption permitted beginning January 1, 2018. Application of the amendments is through a cumulative-effect adjustment to retained earnings as of the effective date. The Company does not plan to early adopt this ASU, and is currently evaluating the impact of adopting this guidance.
Cloud Computing Arrangement Implementation Costs
In August 2018, the FASB issued ASU No. 2018-15,
Customer's Accounting for Implementation Costs Incurred in a Cloud Computing Arrangement That Is a Service Contract
. The ASU is intended to eliminate potential diversity in practice in accounting for costs incurred to implement cloud computing arrangements that are service contracts by requiring customers in such arrangements to follow internal-use software guidance with respect to such costs, with any resulting deferred implementation costs recognized over the term of the contract in the same income statement line item as the fees associated with the hosting element of the arrangement. The ASU will be effective for the Company on January 1, 2020, with early adoption permitted. The Company is
80
WYNN RESORTS, LIMITED AND SUBSIDIARIES
NOTES TO CONSOLIDATED FINANCIAL STATEMENTS (continued)
currently assessing whether to early adopt and the impact the guidance will have on its Consolidated Financial Statements and related disclosures.
Changes to the Disclosure Requirements for Fair Value Measurement
In August 2018, the FASB issued ASU No. 2018-13,
Fair Value Measurement (Topic 820): Disclosure Framework—Changes to the Disclosure Requirements for Fair Value Measurement
. The new guidance amends the disclosure requirements for recurring and nonrecurring fair value measurements by removing, modifying, and adding certain disclosures on fair value measurements in ASC 820. The amendments on changes in unrealized gains and losses, the range and weighted average of significant unobservable inputs used to develop Level 3 fair value measurements, and the narrative description of measurement uncertainty should be applied prospectively for only the most recent interim or annual period presented in the initial fiscal year of adoption. All other amendments should be applied retrospectively to all periods presented upon their effective date. The new guidance will be effective beginning January 1, 2020, with early adoption permitted upon issuance of this updated guidance. The Company does not plan to early adopt this ASU, and is currently evaluating the impact of adopting this guidance.
Note 3 - Investment Securities
During the year ended
December 31, 2018
, the Company sold its investment securities for net proceeds of
$325.4 million
, and as of
December 31, 2018
, had no investment securities.
As of
December 31, 2017
, investment securities consisted of the following (in thousands):
|
|
Amortized
cost |
Gross
unrealized gains |
Gross
unrealized losses |
Fair value
(net carrying amount) |
|||||||||||
|
As of December 31, 2017
|
|||||||||||||||
|
Domestic and foreign corporate bonds
|
$
|
328,747
|
|
$
|
6
|
|
$
|
(1,298
|
)
|
$
|
327,455
|
|
|||
The Company assesses for indicators of other-than-temporary impairment on a quarterly basis. The Company determines whether (i) it does not have the intent to sell any of these investments, and (ii) it will not likely be required to sell these investments prior to the recovery of the amortized cost. During the year ended
December 31, 2018
, the Company determined it had an other-than-temporary impairment and recorded a loss of
$1.8 million
.
Note 4 - Property and Equipment, net
Property and equipment, net consisted of the following (in thousands):
|
December 31,
|
|||||||
|
2018
|
2017
|
||||||
|
Buildings and improvements
|
$
|
7,707,467
|
|
$
|
7,582,611
|
|
|
|
Land and improvements
|
1,141,032
|
|
853,738
|
|
|||
|
Furniture, fixtures and equipment
|
2,288,370
|
|
2,211,974
|
|
|||
|
Leasehold interests in land
|
313,516
|
|
314,068
|
|
|||
|
Airplanes
|
110,623
|
|
158,840
|
|
|||
|
Construction in progress
|
1,912,801
|
|
1,016,207
|
|
|||
|
13,473,809
|
|
12,137,438
|
|
||||
|
Less: accumulated depreciation
|
(4,087,889
|
)
|
(3,638,682
|
)
|
|||
|
$
|
9,385,920
|
|
$
|
8,498,756
|
|
||
Depreciation expense for the years ended
December 31, 2018
,
2017
and
2016
was
$546.1 million
,
$547.9 million
and
$398.2 million
, respectively.
As of
December 31, 2018
and
2017
, construction in progress consisted primarily of costs capitalized, including interest, for the construction of Encore Boston Harbor.
81
WYNN RESORTS, LIMITED AND SUBSIDIARIES
NOTES TO CONSOLIDATED FINANCIAL STATEMENTS (continued)
In 2018, the Company sold
two
airplanes with a total net book value of
$65.3 million
for proceeds of
$50.6 million
. As a result, the Company recorded the
$14.7 million
loss on disposal in Property Charges and Other on the Consolidated Income Statement.
Land Acquisition
During the first quarter of 2018, the Company acquired approximately
38
acres of land on the Las Vegas Strip directly across from Wynn Las Vegas for
$336.2 million
, approximately
16
acres of which are subject to a ground lease that expires in 2097. The Company expects to use this land for future development.
In accordance with asset acquisition accounting standards, the Company allocated the purchase price to the identifiable assets acquired based on the relative fair value of each component. As a result, the Company recorded
$247.0 million
of the purchase price as land and
$89.1 million
of the purchase price as a definite-lived intangible asset. For more information regarding the intangible asset and lease, see
Note 5
,"Intangible Assets, net."
Note 5 - Intangible Assets, net
Intangible assets, net consisted of the following (in thousands):
|
December 31,
|
|||||||
|
2018
|
2017
|
||||||
|
Indefinite-lived intangible assets:
|
|||||||
|
Water rights
|
$
|
6,760
|
|
$
|
6,400
|
|
|
|
Trademarks and other
|
1,637
|
|
1,387
|
|
|||
|
Total indefinite-lived intangible assets
|
8,397
|
|
7,787
|
|
|||
|
Finite-lived intangible assets:
|
|||||||
|
Macau gaming concession
|
42,300
|
|
42,300
|
|
|||
|
Less: accumulated amortization
|
(33,965
|
)
|
(31,582
|
)
|
|||
|
8,335
|
|
10,718
|
|
||||
|
Massachusetts gaming license
|
117,700
|
|
105,200
|
|
|||
|
Less: accumulated amortization
|
—
|
|
—
|
|
|||
|
117,700
|
|
105,200
|
|
||||
|
Undeveloped land - Las Vegas
|
89,101
|
|
—
|
|
|||
|
Less: accumulated amortization
|
(1,027
|
)
|
—
|
|
|||
|
88,074
|
|
—
|
|
||||
|
Total finite-lived intangible assets
|
214,109
|
|
115,918
|
|
|||
|
Total intangible assets, net
|
$
|
222,506
|
|
$
|
123,705
|
|
|
Water rights and trademarks are indefinite-lived assets and, accordingly, are not amortized. Water rights primarily reflect the fair value allocation determined in the purchase of the property on which Wynn Las Vegas is located in April 2000. The value of the trademarks and other primarily represents the costs to acquire the "Le Rêve" name.
The Macau gaming concession is a finite-lived intangible asset that is being amortized over the
20
-year life of the concession. The Company expects that amortization of the Macau gaming concession will be
$2.4 million
each year from 2019 through 2021, and
$1.2 million
in 2022.
82
WYNN RESORTS, LIMITED AND SUBSIDIARIES
NOTES TO CONSOLIDATED FINANCIAL STATEMENTS (continued)
The Massachusetts gaming license cost reflects consideration paid to the Commonwealth of Massachusetts for the license fee and certain costs incurred in connection with and contractually related to obtaining the license. The Company identifies the license as a finite-lived intangible asset and will amortize it over a period of
15
years beginning upon the opening of the resort.
During the first quarter of 2018, the Company acquired approximately
38
acres of land, of which approximately
16
acres are subject to an assumed ground lease that expires in 2097. The assumed ground lease agreement provides for certain minimum lease payments, determined at the time of original lease inception, which the Company determined to be below market when assumed. The ground lease payments are
$3.8 million
until 2023 and total payments of
$370.7 million
thereafter. In accordance with asset acquisition accounting standards, the Company allocated the purchase price to the identifiable assets acquired based on the relative fair value of each component. As a result, the Company recorded
$89.1 million
of the purchase price as a definite-lived intangible asset, which represents the favorable terms of the assumed ground lease relative to the market, to be amortized on a straight-line basis over the remaining term of the lease. The Company expects that amortization of the associated intangible asset will be
$1.1 million
each year from 2019 through 2096, and
$0.7 million
in 2097.
Note 6 - Long-Term Debt
Long-term debt consisted of the following (in thousands):
|
December 31,
|
|||||||
|
2018
|
2017
|
||||||
|
Macau Related:
|
|||||||
|
Wynn Macau Credit Facilities:
|
|||||||
|
Senior Term Loan Facility, due 2022
|
$
|
2,296,999
|
|
$
|
2,298,798
|
|
|
|
Senior Revolving Credit Facility, due 2022
|
623,921
|
|
—
|
|
|||
|
4 7/8% Senior Notes, due 2024
|
600,000
|
|
600,000
|
|
|||
|
5 1/2% Senior Notes, due 2027
|
750,000
|
|
750,000
|
|
|||
|
U.S. and Corporate Related:
|
|||||||
|
Wynn America Credit Facilities:
|
|||||||
|
Senior Term Loan Facility, due 2021
|
994,780
|
|
1,000,000
|
|
|||
|
4 1/4% Senior Notes, due 2023
|
500,000
|
|
500,000
|
|
|||
|
5 1/2% Senior Notes, due 2025
|
1,780,000
|
|
1,800,000
|
|
|||
|
5 1/4% Senior Notes, due 2027
|
880,000
|
|
900,000
|
|
|||
|
Retail Term Loan, due 2025
|
615,000
|
|
—
|
|
|||
|
Wynn Resorts Term Loan, due 2024
|
500,000
|
|
—
|
|
|||
|
Redemption Price Promissory Note, due 2022
|
—
|
|
1,936,443
|
|
|||
|
9,540,700
|
|
9,785,241
|
|
||||
|
Less: Unamortized debt issuance costs and original issue discounts and premium, net
|
(117,600
|
)
|
(99,231
|
)
|
|||
|
Less: Redemption Note fair value adjustment
|
—
|
|
(57,384
|
)
|
|||
|
9,423,100
|
|
9,628,626
|
|
||||
|
Less: Current portion of long-term debt
|
(11,960
|
)
|
(62,690
|
)
|
|||
|
Total long-term debt, net of current portion
|
$
|
9,411,140
|
|
$
|
9,565,936
|
|
|
83
WYNN RESORTS, LIMITED AND SUBSIDIARIES
NOTES TO CONSOLIDATED FINANCIAL STATEMENTS (continued)
Macau Related Debt
Wynn Macau Credit Facilities
The Company's credit facilities consist of an approximately
$2.30 billion
equivalent senior secured term loan facility (the "Wynn Macau Senior Term Loan Facility") and an approximately
$750 million
equivalent senior secured revolving credit facility (the "Wynn Macau Senior Revolving Credit Facility" and together with the Wynn Macau Senior Term Loan Facility, the "Wynn Macau Credit Facilities"). The borrower is Wynn Resorts (Macau) S.A. ("Wynn Macau SA"), an indirect subsidiary of WML. Wynn Macau SA has the ability to upsize the Wynn Macau Credit Facilities by an additional
$1 billion
in equivalent senior secured loans upon satisfaction of various conditions.
As of December 31, 2018, the Company had available borrowing capacity under the Wynn Macau Senior Revolving Credit Facility of $123.8 million. Wynn Macau SA borrows and repays its revolving credit facility from time to time as cash needs permit.
In December 2018, Wynn Macau SA amended the Wynn Macau Credit Facilities by entering into the Amended Common Terms Agreement. The Wynn Macau Senior Term Loan Facility was previously repayable in graduating installments of between
2.50%
to
7.33%
of the principal amount on a quarterly basis commencing December 2018, with a final installment of
50%
of the principal amount repayable in September 2021; and the final maturity of any outstanding borrowings from the Wynn Macau Senior Revolving Credit Facility was previously repayable by September 2020. Following the execution of the Amended Common Terms Agreement, the Wynn Macau Senior Term Loan Facility is repayable in graduating installments of between
2.875%
to
4.50%
of the principal amount on a quarterly basis commencing September 30, 2020, with a final installment of
75%
of the principal amount repayable in June 2022; and the final maturity of any outstanding borrowings from the Wynn Macau Senior Revolving Credit Facility is in June 2022. As of December 31,
2018
and
2017
, the weighted average interest rate was
4.17%
and
3.16%
, respectively. The commitment fee required to be paid for unborrowed amounts under the Wynn Macau Senior Revolving Credit Facility, if any, is between
0.52%
and
0.79%
, per annum, based on Wynn Macau SA's Leverage Ratio. The annual commitment fee is payable quarterly in arrears and is calculated based on the daily average of the unborrowed amounts.
The Wynn Macau Credit Facilities contain a requirement that Wynn Macau SA must make mandatory repayments of indebtedness from specified percentages of excess cash flow. If Wynn Macau SA's Leverage Ratio is greater than
4.5
to 1, then
25%
of Excess Cash Flow (as defined in the Wynn Macau Credit Facilities) must be used for prepayment of indebtedness and cancellation of available borrowings under the Wynn Macau Credit Facilities. There is no mandatory prepayment in respect of Excess Cash Flow if Wynn Macau SA's Leverage Ratio is equal to or less than
4.5
to 1. The Wynn Macau Credit Facilities contain customary covenants restricting certain activities including, but not limited to: the incurrence of additional indebtedness, the incurrence or creation of liens on any of its property, sale and leaseback transactions, the ability to dispose of assets, and making loans or other investments. In addition, Wynn Macau SA is required by the financial covenants to maintain a Leverage Ratio of not greater than
4.75
to 1 for the fiscal year ending December 31,
2018
, and an Interest Coverage Ratio (as defined in the Wynn Macau Credit Facilities) of not less than
2.00
to 1 at any time.
Borrowings under the Wynn Macau Credit Facilities are guaranteed by Palo Real Estate Company Limited ("Palo"), a subsidiary of Wynn Macau SA, and by certain subsidiaries of the Company that own equity interests in Wynn Macau SA, and are secured by substantially all of the assets of Wynn Macau SA and Palo, and the equity interests in Wynn Macau SA. Borrowings under the Wynn Macau Credit Facilities are not guaranteed by the Company or WML.
In connection with the gaming concession contract of Wynn Macau SA, Wynn Macau SA entered into a Bank Guarantee Reimbursement Agreement with Banco Nacional Ultramarino, S.A. ("BNU") for the benefit of the Macau government. This guarantee assures Wynn Macau SA's performance under the casino concession agreement, including the payment of premiums, fines and indemnity for any material failure to perform under the terms of the concession agreement and the payment of any gaming taxes. As of
December 31, 2018
, the guarantee was in the amount of
300 million
Macau patacas ("MOP") (approximately
$37.3 million
) and will remain at such amount until
180 days
after the end of the term of the concession agreement in 2022. BNU, as issuer of the guarantee, is currently secured by a second priority security interest in the senior lender collateral package. From and after repayment of all indebtedness under the Wynn Macau Credit Facilities, Wynn Macau SA is obligated to promptly, upon demand by BNU, repay any claim made on the guarantee by the Macau government. BNU is paid an annual fee for the guarantee of MOP
2.3 million
(approximately
$0.3 million
).
84
WYNN RESORTS, LIMITED AND SUBSIDIARIES
NOTES TO CONSOLIDATED FINANCIAL STATEMENTS (continued)
WML Finance Revolving Credit Facility
The Company's credit facilities included a HK
$3.87 billion
(approximately
$495.2 million
) cash-collateralized revolving credit facility ("WML Finance Credit Facility") under which WML Finance I, Limited, an indirect wholly owned subsidiary of WML, was the borrower. The WML Finance Credit Facility bore interest initially at
1.50%
per annum, such rate calculated as the interest rate paid by the lender as the deposit bank for the cash collateral deposited and pledged with the lender plus a margin of
0.40%
. On July 18, 2018, the WML Finance Credit Facility matured with no outstanding borrowings.
4 7/8% Senior Notes due 2024 and 5 1/2% Senior Notes due 2027
On September 20, 2017, WML issued the
$600 million
4 7/8% Senior Notes due 2024 (the "2024 WML Notes") and the
$750 million
of 5 1/2% Senior Notes due 2027 (the "2027 WML Notes" and together with the 2024 WML Notes, the "WML Notes"). WML used the net proceeds from the WML Notes and cash on hand to fund the cost of extinguishing the 5 1/4% Senior Notes due 2021 (the "2021 Notes").
The 2024 WML Notes bear interest at the rate of 4 7/8% per annum and mature on October 1, 2024. The 2027 WML Notes bear interest at the rate of 5 1/2% per annum and mature on October 1, 2027. Interest on the WML Notes is payable semi-annually in arrears on April 1 and October 1 of each year, beginning on April 1, 2018.
At any time prior to October 1, 2020 and October 1, 2022, WML may redeem the 2024 WML Notes and 2027 WML Notes, respectively, in whole or in part, at a redemption price equal to the greater of (a)
100%
of the principal amount of the WML Notes or (b) a "make-whole" amount as determined by an independent investment banker in accordance with the terms of the indentures for the WML Notes, dated as of September 20, 2017 (the "WML Indentures"). In either case, the redemption price would include accrued and unpaid interest. In addition, at any time prior to October 1, 2020, WML may use the net cash proceeds from certain equity offerings to redeem up to
35%
of the aggregate principal amount of the 2024 WML Notes and the 2027 WML Notes, at a redemption price equal to
104.875%
of the aggregate principal amount of the 2024 WML Notes and
105.5%
of the aggregate principal amount of the 2027 WML Notes, as applicable.
On or after October 1, 2020 and October 1, 2022, WML may redeem the 2024 WML Notes and 2027 WML Notes, respectively, in whole or in part, at a premium decreasing annually from
102.438%
and
102.75%
, respectively, of the applicable principal amount to
100%
of the applicable principal amount, plus accrued and unpaid interest. If WML undergoes a change of control (as defined in the WML Indentures), it must offer to repurchase the WML Notes at a price equal to
101%
of the aggregate principal amount thereof, plus accrued and unpaid interest. In addition, WML may redeem the WML Notes, in whole but not in part, at a redemption price equal to
100%
of the principal amount, plus accrued and unpaid interest, in response to any change in or amendment to certain tax laws or tax positions. Further, if a holder or beneficial owner of the WML Notes fails to meet certain requirements imposed by any Gaming Authority (as defined in the WML Indentures), WML may require the holder or beneficial owner to dispose of or redeem its WML Notes.
Upon the occurrence of (1) any event after which none of WML or any of its subsidiaries have such licenses, concessions, subconcessions or other permits or authorizations as necessary to conduct gaming activities in substantially the same scope as it does on the date of the WML Notes issuance, for a period of ten consecutive days or more, and such event has a material adverse effect on the financial condition, business, properties, or results of operations of WML and its subsidiaries, taken as a whole, or (2) the termination, rescission, revocation or modification of any such licenses, concessions, subconcessions or other permits or authorizations which has had a material adverse effect on the financial condition, business, properties, or results of operations of WML and its subsidiaries, taken as a whole, each holder of the WML Notes will have the right to require WML to repurchase all or any part of such holders' WML Notes at a purchase price in cash equal to
100%
of the principal amount thereof, plus accrued and unpaid interest.
The WML Notes are WML's general unsecured obligations and rank pari passu in right of payment with all of WML's existing and future senior unsecured indebtedness, will rank senior to all of WML's future subordinated indebtedness, if any; will be effectively subordinated to all of WML's future secured indebtedness to the extent of the value of the assets securing such debt; and will be structurally subordinated to all existing and future obligations of WML's subsidiaries, including the Wynn Macau Credit Facilities and the WML Finance Credit Facility. The WML Notes are not registered under the Securities Act of 1933, as amended (the "Securities Act") and the WML Notes are subject to restrictions on transferability and resale.
85
WYNN RESORTS, LIMITED AND SUBSIDIARIES
NOTES TO CONSOLIDATED FINANCIAL STATEMENTS (continued)
U.S. and Corporate Related Debt
Bridge Facility
On March 28, 2018, the Company entered into a credit agreement to provide for an
$800 million
364
-day term loan (the "Bridge Facility"). On April 3, 2018, the Company repaid all amounts borrowed under the Bridge Facility using net proceeds from the issuance of its common stock. See
Note 7
, "Stockholders' Equity" for additional information on the Company's issuance of common stock. The Bridge Facility bore interest at either LIBOR plus
2.75%
per annum or base rate plus
1.75%
per annum.
Redemption Price Promissory Note
On March 30, 2018, the Company used the net proceeds from the Bridge Facility, along with cash on hand and borrowings under its WA Senior Revolving Credit Facility (defined below) to repay the Redemption Note principal amount of
$1.94 billion
pursuant to the Settlement Agreement and Mutual Release ("Settlement Agreement"). See
Note 15
, "Commitments and Contingencies" for additional information on the Settlement Agreement.
Commitment Letter
On September 19, 2018, the Company entered into a commitment letter (the “Commitment Letter”) to provide for a
364
-day term loan facility to the Company of up to
$750 million
. On October 24, 2018, the Company agreed to terminate
$500 million
of the lenders’ commitments under the Commitment Letter, in anticipation of entering into the Credit Agreement discussed below. Accordingly, the lenders' remaining commitments under the Commitment Letter are
$250 million
. The remaining commitments expire on April 5, 2019 and remained fully available as of December 31, 2018.
Wynn Resorts Term Loan
On October 30, 2018, the Company and certain subsidiaries of the Company entered into a credit agreement (the "Credit Agreement") to provide for a
$500.0 million
six
-year term loan facility (the “Term Loan”). The Term Loan bears interest at a rate of LIBOR plus
2.25%
per year. As of
December 31, 2018
, the interest rate was
4.78%
. The Company is required to begin making quarterly principal repayments of
$1.3 million
beginning in March 2019, with a final installment of
$471.3 million
due upon maturity on October 30, 2024. The Company intends to use the net proceeds of the Term Loan for general corporate purposes, including, without limitation, repurchases of the Company’s common stock, investments in subsidiaries and/or capital expenditures.
The Credit Agreement contains customary representations and warranties, events of default and negative and affirmative covenants, including, among other things, limitations on: indebtedness; investments; restricted payments; mergers and acquisitions; payment of indebtedness; negative pledges; liens; transactions with affiliates and sales of assets. In addition, the Credit Agreement contains a requirement that the Company must make mandatory prepayments of indebtedness equal to
50.0%
of excess cash flow if the Consolidated First Lien Secured Leverage Ratio, as defined, as of the last day of the applicable fiscal year is greater than
4.5
to 1 prior to the year of opening of Encore Boston Harbor or is greater than
4.0
to 1 thereafter. There is
no
mandatory prepayment in respect of excess cash flow if the Company's Consolidated First Lien Secured Leverage Ratio is equal to or less than
4.5
to 1.
Wynn Group Asia, Inc. and Wynn Resorts Holdings, LLC, each a direct, wholly owned subsidiary of the Company (collectively, the “Guarantors”), guarantee the obligations of the Company under the Credit Agreement. The Company will pledge all of the equity interests in the Guarantors to the extent permitted by applicable law.
Wynn America Credit Facilities
The Company's credit facilities include an
$875 million
fully funded senior secured term loan facility (the "WA Senior Term Loan Facility I"), a
$125 million
fully funded senior term loan facility (the "WA Senior Term Loan Facility II") and a
$375 million
senior secured revolving credit facility (the "WA Senior Revolving Credit Facility," and collectively, the "Wynn America Credit Facilities"). The borrower is Wynn America, LLC ("Wynn America"), an indirect wholly owned subsidiary of Wynn Resorts, Limited.
On April 24, 2017, the Company amended the Wynn America Credit Facilities to, among other things, extend the maturity of portions of the credit facilities. Of the
$875 million
WA Senior Term Loan Facility I,
$69.6 million
matures in November 2020 with repayments in quarterly installments of
$1.7 million
commencing in June 2018 and a final installment of
$52.2 million
in November 2020, and
$805.4 million
matures in December 2021 with repayments in quarterly installments of
$20.1 million
86
WYNN RESORTS, LIMITED AND SUBSIDIARIES
NOTES TO CONSOLIDATED FINANCIAL STATEMENTS (continued)
commencing in March 2020 and a final installment of
$664.5 million
in December 2021. The WA Senior Term Loan Facility II matures in December 2021 with no required repayments until maturity in December 2021. Of the
$375 million
WA Senior Revolving Credit Facility,
$42 million
matures in November 2019 and
$333 million
matures in December 2021. In connection with the amendment, the Company recorded a loss on extinguishment of debt of
$1.5 million
.
As of December 31,
2018
, the Company had available borrowing capacity of
$357.3 million
, net of
$17.7 million
in outstanding letters of credit, under the WA Senior Revolving Credit Facility.
Subject to certain exceptions, the Wynn America Credit Facilities bear interest at either base rate plus
0.75%
per annum or LIBOR plus
1.75%
per annum. As of December 31,
2018
and
2017
, the interest rate was
4.10%
and
3.32%
, respectively. The annual fee required to pay for unborrowed amounts, if any, is
0.30%
per annum, payable quarterly in arrears, calculated based on the daily average of the unborrowed amounts under such credit facilities.
The Wynn America Credit Facilities contain customary representations and warranties, events of default and negative and affirmative covenants, including, among other things, limitations on: indebtedness; investments; restricted payments; mergers and acquisitions; payment of indebtedness; negative pledges; liens; transactions with affiliates and sales of assets. In addition, Wynn America is subject to financial covenants, including maintaining a Maximum Consolidated Senior Secured Net Leverage Ratio and a Minimum Consolidated EBITDA, each as defined in the Wynn America Credit Facilities. Commencing with the second full fiscal quarter ending after the fiscal quarter in which Encore Boston Harbor opens, the Maximum Consolidated Senior Secured Net Leverage Ratio is not to exceed
2.75
to 1. Commencing with the fiscal quarter ending December 31, 2015, the Minimum Consolidated EBITDA is not to be less than
$200.0 million
.
The Company has provided a completion guaranty in favor of the lenders under the Wynn America Credit Facilities to support the development of Encore Boston Harbor.
Wynn America and the guarantors have entered into a security agreement (as amended from time to time) in favor of the lenders under the Wynn America Credit Facilities pursuant to which, subject to certain exceptions, Wynn America and the guarantors have pledged all equity interests in the guarantors to the extent permitted by applicable law and granted a first priority security interest in substantially all of the other existing and future assets of the guarantors.
4 1/4% Senior Notes due 2023
In May 2013, Wynn Las Vegas, LLC and Wynn Las Vegas Capital Corp. ("Capital Corp." and together with Wynn Las Vegas, LLC, the "Issuers") issued the
$500 million
4 1/4% Senior Notes due 2023 (the "2023 Notes") pursuant to an indenture, dated as of May 22, 2013 (the "2023 Indenture"), among the Issuers, the Guarantors (as defined below) and U.S. Bank National Association, as trustee (the "Trustee"). The 2023 Notes were issued at par. The Issuers used the net proceeds from the 2023 Notes to cover the cost of extinguishing the 7 7/8% First Mortgage Notes due November 2017.
The 2023 Notes will mature on
May 30, 2023
and bear interest at the rate of 4 1/4% per annum. The Issuers may, at their option, redeem the 2023 Notes, in whole or in part, at any time or from time to time prior to their stated maturity. The redemption price for the 2023 Notes that are redeemed before
February 28, 2023
will be equal to the greater of (a)
100%
of the principal amount of the 2023 Notes to be redeemed or (b) a "make-whole" amount described in the 2023 Indenture, plus in either case accrued and unpaid interest to, but not including, the redemption date. The redemption price for the 2023 Notes that are redeemed on or after
February 28, 2023
will be equal to
100%
of the principal amount of the 2023 Notes to be redeemed, plus accrued and unpaid interest to, but not including, the redemption date. In the event of a change of control triggering event, the Issuers will be required to offer to repurchase the 2023 Notes at
101%
of the principal amount, plus accrued and unpaid interest to but not including the repurchase date. The 2023 Notes are also subject to mandatory redemption requirements imposed by gaming laws and regulations of gaming authorities in Nevada.
The 2023 Notes are the Issuers' senior unsecured obligations and rank pari passu in right of payment with the Issuers' 2025 Notes and 2027 WLV Notes (both defined below). The 2023 Notes are unsecured, except by the first priority pledge by Wynn Las Vegas Holdings, LLC ("WLVH"), a direct wholly owned subsidiary of Wynn America, of its equity interests in Wynn Las Vegas, LLC. Such equity interests in Wynn Las Vegas, LLC also secure the Issuers' 2025 Notes and 2027 WLV Notes. If Wynn Resorts receives an investment grade rating from one or more ratings agencies, the first priority pledge securing the 2023 Notes will be released.
87
WYNN RESORTS, LIMITED AND SUBSIDIARIES
NOTES TO CONSOLIDATED FINANCIAL STATEMENTS (continued)
The 2023 Notes are jointly and severally guaranteed by all of the Issuers' subsidiaries, other than Capital Corp., which was a co-issuer (the "Guarantors"). The guarantees are senior unsecured obligations of the Guarantors and rank senior in right of payment to all of their existing and future subordinated debt. The guarantees rank equally in right of payment with all existing and future liabilities of the Guarantors that are not so subordinated and will be effectively subordinated in right of payment to all of such Guarantors' existing and future secured debt (to the extent of the collateral securing such debt).
The 2023 Indenture contains covenants limiting the Issuers' and the Guarantors' ability to create liens on assets to secure debt; enter into sale-leaseback transactions; and merge or consolidate with another company. These covenants are subject to a number of important and significant limitations, qualifications and exceptions.
Events of default under the 2023 Indenture include, among others, the following: default for
30
days in the payment of interest when due on the 2023 Notes; default in payment of the principal, or premium, if any, when due on the 2023 Notes; failure to comply with certain covenants in the 2023 Indenture; and certain events of bankruptcy or insolvency. In the case of an event of default arising from certain events of bankruptcy or insolvency with respect to the Issuers or any Guarantor, all 2023 Notes then outstanding will become due and payable immediately without further action or notice.
On March 20, 2018, the Issuers executed a second supplemental indenture (the "Supplemental Indenture") to the 2023 Indenture, as supplemented by the 2025 Indenture, relating to the Issuers’ 2023 Notes. The Supplemental Indenture amended the 2023 Indenture by conforming the definition of "Change of Control" relating to ownership of equity interests in the Company in the Indenture to the terms of the indentures governing the Issuers’ other outstanding notes. As part of executing the Supplemental Indenture, the Issuers paid
$25 million
to consenting holders of the 2023 Notes. The Company accounted for this transaction as a modification and recorded the
$25 million
as debt issuance costs on the Consolidated Balance Sheet.
5 1/2% Senior Notes due 2025
In February 2015, the Issuers issued the
$1.8 billion
5 1/2% Senior Notes due 2025 (the "2025 Notes") pursuant to an indenture, dated as of February 18, 2015 (the "2025 Indenture"), among the Issuers, the Guarantors and the Trustee. The 2025 Notes were issued at par. The Company used the net proceeds from the 2025 Notes to cover the cost of extinguishing the 7 7/8% First Mortgage Notes due May 1, 2020 (the "7 7/8% 2020 Notes") and the 7 3/4% First Mortgage Notes due August 15, 2020 (the "7 3/4% 2020 Notes" and together with the 7 7/8% 2020 Notes, the "2020 Notes") and for general corporate purposes.
The 2025 Notes will mature on March 1, 2025 and bear interest at the rate of 5 1/2% per annum. The Issuers may, at their option, redeem the 2025 Notes, in whole or in part, at any time or from time to time prior to their stated maturity. The redemption price for the 2025 Notes that are redeemed before December 1, 2024 will be equal to the greater of (a)
100%
of the principal amount of the 2025 Notes to be redeemed and (b) a "make-whole" amount described in the 2025 Indenture, plus in either case accrued and unpaid interest, if any, to, but not including, the redemption date. The redemption price for the 2025 Notes that are redeemed on or after December 1, 2024 will be equal to
100%
of the principal amount of the 2025 Notes to be redeemed, plus accrued and unpaid interest, if any, to, but not including, the redemption date. In the event of a change of control triggering event, the Issuers will be required to offer to repurchase the 2025 Notes at
101%
of the principal amount, plus accrued and unpaid interest, if any, to, but not including, the repurchase date. The 2025 Notes also are subject to mandatory redemption requirements imposed by gaming laws and regulations of gaming authorities in Nevada.
The 2025 Notes are the Issuers' senior unsecured obligations and rank pari passu in right of payment with the Issuers' 2023 Notes and 2027 WLV Notes. The 2025 Notes are unsecured, except by the first priority pledge by WLVH of its equity interests in Wynn Las Vegas, LLC. Such equity interests in Wynn Las Vegas, LLC also secure the 2023 Notes and 2027 WLV Notes. If Wynn Resorts receives an investment grade rating from one or more ratings agencies, the first priority pledge securing the 2025 Notes will be released.
The 2025 Notes are jointly and severally guaranteed by all of the Guarantors. The guarantees are senior unsecured obligations and rank senior in right of payment to all of their existing and future subordinated debt. The guarantees rank equally in right of payment with all existing and future liabilities of the Issuers' subsidiaries that are not so subordinated and will be effectively subordinated in right of payment to all of such existing and future secured debt (to the extent of the collateral securing such debt).
The 2025 Indenture contains covenants limiting the Issuers' and the Guarantors' ability to create liens on assets to secure debt, enter into sale-leaseback transactions and merge or consolidate with another company. These covenants are subject to a number of important and significant limitations, qualifications and exceptions.
88
WYNN RESORTS, LIMITED AND SUBSIDIARIES
NOTES TO CONSOLIDATED FINANCIAL STATEMENTS (continued)
Events of default under the 2025 Indenture include, among others, the following: default for
30
days in the payment of interest when due on the 2025 Notes; default in payment of the principal, or premium, if any, when due on the 2025 Notes; failure to comply with certain covenants in the 2025 Indenture; and certain events of bankruptcy or insolvency. In the case of an event of default arising from certain events of bankruptcy or insolvency with respect to the Issuers or any Guarantor, all 2025 Notes then outstanding will become due and payable immediately without further action or notice.
During the first quarter of 2018, Wynn Resorts purchased
$20 million
principal amount of the 2025 Notes through open market purchases. As of December 31, 2018, Wynn Resorts holds this debt and has not contributed it to its wholly owned subsidiary, Wynn Las Vegas, LLC.
5 1/4% Senior Notes due 2027
In May 2017, the Issuers issued the
$900 million
5 1/4% Senior Notes due 2027 (the "2027 WLV Notes") pursuant to an indenture, dated as of May 11, 2017 (the "2027 Indenture"), among the Issuers, the Guarantors and the Trustee. The 2027 WLV Notes were issued at par. The Issuers used the net proceeds from the 2027 WLV Notes and cash on hand to fund the cost of extinguishing the 5 3/8% First Mortgage Notes due 2022 (the "2022 Notes").
The 2027 WLV Notes will mature on May 15, 2027 and bear interest at the rate of 5 1/4% per annum. The Issuers may, at their option, redeem the 2027 WLV Notes, in whole or in part, at any time or from time to time prior to their stated maturity. The redemption price for 2027 WLV Notes that are redeemed before February 15, 2027 will be equal to the greater of (a)
100%
of the principal amount of the 2027 WLV Notes to be redeemed and (b) a "make-whole" amount described in the 2027 Indenture, plus in either case accrued and unpaid interest, if any, to, but not including, the redemption date. The redemption price for the 2027 WLV Notes that are redeemed on or after February 15, 2027 will be equal to
100%
of the principal amount of the 2027 WLV Notes to be redeemed, plus accrued and unpaid interest, if any, to, but not including, the redemption date. In the event of a change of control triggering event, the Issuers will be required to offer to repurchase the 2027 WLV Notes at
101%
of the principal amount, plus accrued and unpaid interest, if any, to, but not including, the repurchase date. The 2027 WLV Notes are also subject to mandatory redemption requirements imposed by gaming laws and regulations of gaming authorities in Nevada.
The 2027 WLV Notes are the Issuers' senior unsecured obligations and rank pari passu in right of payment with the Issuers' 2023 Notes and 2025 Notes and rank equally in right of payment with the Issuers' guarantee of the Wynn America Credit Facilities, and rank senior in right of payment to all of the Issuers' existing and future subordinated debt. The 2027 WLV Notes are effectively subordinated in right of payment to all of the Issuers' existing and future secured debt (to the extent of the value of the collateral securing such debt), and structurally subordinated to all of the liabilities of any of the Issuers' subsidiaries that do not guarantee the 2027 WLV Notes.
The 2027 WLV Notes are unsecured, except for the first priority pledge by WLVH of its equity interests in Wynn Las Vegas, LLC. Such equity interests in Wynn Las Vegas, LLC also secure the 2023 Notes and 2025 Notes. If Wynn Resorts, Limited receives an investment grade rating from one or more ratings agencies, the first priority pledge securing the 2027 WLV Notes will be released.
The 2027 WLV Notes are jointly and severally guaranteed by all of the Guarantors. The guarantees are senior unsecured obligations of the Guarantors and rank senior in right of payment to all of their existing and future subordinated debt. The guarantees rank equally in right of payment with all existing and future liabilities of the Guarantors that are not so subordinated and will be effectively subordinated in right of payment to all of such Guarantors' existing and future secured debt (to the extent of the collateral securing such debt).
The 2027 Indenture contains covenants limiting the Issuers' and the Guarantors' ability to: create liens on assets to secure debt; enter into sale-leaseback transactions; and merge or consolidate with another company. These covenants are subject to a number of important and significant limitations, qualifications and exceptions. The 2027 Indenture also provides that Wynn America may assume all of Wynn Las Vegas, LLC's obligations under the 2027 Indenture and the 2027 WLV Notes if certain conditions set forth in the 2027 Indenture are met.
Events of default under the 2027 Indenture include, among others, the following: default for 30 days in the payment of interest when due on the 2027 WLV Notes; default in payment of the principal, or premium, if any, when due on the 2027 WLV Notes; failure to comply with certain covenants in the 2027 Indenture; and certain events of bankruptcy or insolvency. In the case of an event of default arising from certain events of bankruptcy or insolvency with respect to the Issuers or any Guarantor, all 2027 WLV Notes then outstanding will become due and payable immediately without further action or notice.
89
WYNN RESORTS, LIMITED AND SUBSIDIARIES
NOTES TO CONSOLIDATED FINANCIAL STATEMENTS (continued)
During the first quarter of 2018, Wynn Resorts purchased
$20 million
principal amount of the 2027 WLV Notes through open market purchases. As of December 31, 2018, Wynn Resorts holds this debt and has not contributed it to its wholly owned subsidiary, Wynn Las Vegas, LLC.
The Issuers and certain of their subsidiaries will guarantee and secure their obligations under the Wynn America Credit Facilities with liens on substantially all of their assets, with such liens limiting the amount of such obligations secured to
15%
of their Total Assets (as defined in the indenture for the 2025 Notes).
The 2023 Notes, 2025 Notes and 2027 WLV Notes were offered pursuant to an exemption under the Securities Act. The 2023 Notes, 2025 Notes and 2027 WLV Notes were offered only to qualified institutional buyers in reliance on Rule 144A under the Securities Act or outside the United States to certain persons in reliance on Regulation S under the Securities Act. The 2023 Notes, 2025 Notes and 2027 WLV Notes have not been and will not be registered under the Securities Act or under any state securities laws. Therefore, the 2023 Notes, 2025 Notes and 2027 WLV Notes may not be offered or sold within the United States to, or for the account or benefit of, any United States person unless the offer or sale would qualify for a registration exemption from the Securities Act and applicable state securities laws.
5 3/8%
First Mortgage Notes due 2022
On May 4, 2017, the Issuers commenced a cash tender offer for any and all of the outstanding 2022 Notes. The Company accepted for purchase valid tenders with respect to
$498.0 million
and paid a tender premium of
$14.6 million
.
On June 12, 2017, the Issuers redeemed the remaining
$402.0 million
of the untendered 2022 Notes and discharged the indenture under which the 2022 Notes were issued. The Company paid a premium of
$10.8 million
related to this redemption.
In connection with the 2027 WLV Notes issuance and the 2022 Notes cash tender offer and subsequent redemption, the Company recorded a loss on extinguishment of debt of
$20.8 million
.
Retail Term Loan
On July 25, 2018, Wynn/CA Plaza Property Owner, LLC and Wynn/CA Property Owner, LLC (collectively, the "Retail Borrowers"), subsidiaries of the Retail Joint Venture, entered into a term loan agreement (the "Retail Term Loan Agreement").
The Retail Term Loan Agreement provides for a term loan facility to the Retail Borrowers of
$615.0 million
(the "Retail Term Loan"). The Retail Term Loan is secured by substantially all of the assets of the Retail Borrowers. The Retail Term Loan matures on July 24, 2025 and bears interest at a rate of LIBOR plus
1.70%
per annum. As of
December 31, 2018
, the interest rate was
4.05%
. In accordance with the Retail Term Loan Agreement, the Retail Borrowers entered into an interest rate collar agreement with a LIBOR floor of
1.00%
and a ceiling of
3.75%
. See
Note 2
, “Summary of Significant Accounting Policies”, for additional information on the interest rate collar. The Retail Borrowers distributed approximately
$589 million
of the net proceeds of the Retail Term Loan to their members on a proportionate basis to each member’s ownership percentage.
The Retail Borrowers may prepay the Retail Term Loan, in whole but not in part, with a premium of
1.70%
of the principal amount prorated for the number of days between the prepayment date and July 25, 2019. Any time subsequent to July 25, 2019, the Retail Borrowers may prepay the Retail Term Loan, in whole or in part, with no premium above the principal amount.
The Retail Term Loan Agreement contains customary representations and warranties, events of default and affirmative and negative covenants for debt facilities of this type, including, among other things, limitations on leasing matters, incurrence of indebtedness, distributions and transactions with affiliates. The Retail Term Loan Agreement also provides for customary sweeps of the Retail Borrowers' excess cash in the event of a default or in the event the Retail Borrowers fail to maintain certain financial ratios as defined in the Retail Term Loan Agreement. In addition, the Company will indemnify the lenders under the Retail Term Loan and be liable, in each case, for certain customary environmental and non-recourse carve out matters pursuant to a hazardous materials indemnity agreement and a recourse indemnity agreement, each entered into concurrently with the execution of the Retail Term Loan Agreement.
90
WYNN RESORTS, LIMITED AND SUBSIDIARIES
NOTES TO CONSOLIDATED FINANCIAL STATEMENTS (continued)
Debt Covenant Compliance
As of
December 31, 2018
, management believes the Company was in compliance with all debt covenants.
Scheduled Maturities of Long-Term Debt
Scheduled maturities of long-term debt as of
December 31, 2018
were as follows (in thousands):
|
Years Ending December 31,
|
|||
|
2019
|
$
|
11,960
|
|
|
2020
|
275,040
|
|
|
|
2021
|
1,193,663
|
|
|
|
2022
|
2,455,037
|
|
|
|
2023
|
505,000
|
|
|
|
Thereafter
|
5,100,000
|
|
|
|
9,540,700
|
|
||
|
Unamortized debt issuance costs and original issue discounts and premium, net
|
(117,600
|
)
|
|
|
$
|
9,423,100
|
|
|
Fair Value of Long-Term Debt
The estimated fair value of the Company's long-term debt as of
December 31, 2018
and
2017
, was approximately
$8.97 billion
and
$7.95 billion
, respectively, compared to its carrying value, excluding debt issuance costs and original issue discount and premium, of
$9.54 billion
and
$7.85 billion
, respectively. The estimated fair value as of December 31, 2017 excludes the Redemption Note. See
Note 2
, "Summary of Significant Accounting Policies" for discussion of the estimated fair value of the Redemption Note. The estimated fair value of the Company's long-term debt is based on recent trades, if available, and indicative pricing from market information (Level 2 inputs).
Note 7 - Stockholders' Equity
Equity Offering
On April 3, 2018, the Company completed a registered public offering (the "Equity Offering") of
5,300,000
newly issued shares of its common stock, par value
$0.01
per share, at a price of
$175
per share for proceeds of
$915.2 million
, net of
$11.7 million
in underwriting discounts and
$0.6 million
in offering expenses. The Company used the net proceeds from the Equity Offering to repay all amounts borrowed under the Bridge Facility, together with all interest accrued thereon, and used the remaining net proceeds to repay certain other indebtedness of the Company in April 2018.
Common Stock
The Company's Board of Directors has authorized an equity repurchase program. As of December 31,
2018
, the Company had
$1.0 billion
in repurchase authority under the program, which may include repurchases from time to time through open market purchases or negotiated transactions, depending on market conditions. During the year ended
December 31, 2018
, the Company repurchased
1,478,552
shares at a net cost of
$156.7 million
. During the years ended December 31,
2017
and
2016
,
no
repurchases were made under the equity repurchase program. As of
December 31, 2018
, the Company had
$843.3 million
in repurchase authority under the program.
During the years ended December 31,
2018
,
2017
and
2016
, the Company withheld a total of
19,120
shares,
148,413
shares and
198,942
shares, respectively, in satisfaction of tax withholding obligations on vested restricted stock.
Dividends
During the first quarter of 2018, the Company paid a cash dividend of
$0.50
per share and
$0.75
per share for the three subsequent quarters, for annual cash dividends of
$2.75
per share. In each quarter of 2017 and 2016, the Company paid a cash
91
WYNN RESORTS, LIMITED AND SUBSIDIARIES
NOTES TO CONSOLIDATED FINANCIAL STATEMENTS (continued)
dividend of
$0.50
per share. During the years ended
December 31, 2018
,
2017
and 2016, the Company recorded
$294.9 million
,
$204.5 million
and
$202.2 million
as a reduction of retained earnings from cash dividends declared.
On
January 30, 2019
, the Company announced a cash dividend of
$0.75
per share, payable on February 26, 2019, to stockholders of record as of February 15, 2019.
Redemption of Securities
Wynn Resorts' articles of incorporation provide that, to the extent a gaming authority makes a determination of unsuitability or to the extent the Board of Directors determines, in its sole discretion, that a person is likely to jeopardize the Company or any affiliates application for, receipt of, approval for, right to the use of, or entitlement to, any gaming license, Wynn Resorts may redeem shares of its capital stock that are owned or controlled by an unsuitable person or its affiliates. The redemption price will be the amount, if any, required by the gaming authority or, if the gaming authority does not determine the price, the sum deemed by the Board of Directors to be the fair value of the securities to be redeemed. If Wynn Resorts determines the redemption price, the redemption price will be capped at the closing price of the shares on the principal national securities exchange on which the shares are listed on the trading day before the redemption notice is given. If the shares are not listed on a national securities exchange, the redemption price will be capped at the closing sale price of the shares as quoted on The Nasdaq Global Select Market or if the closing price is not reported, the mean between the bid and ask prices, as quoted by any other generally recognized reporting system. Wynn Resorts' right of redemption is not exclusive of any other rights that it may have or later acquire under any agreement, its bylaws or otherwise. The redemption price may be paid in cash, by promissory note, or both, as required, and pursuant to the terms established by, the applicable Gaming Authority and, if not, as the Board of Directors of Wynn Resorts elects.
Based on the Board of Directors' finding of "unsuitability," on February 18, 2012, Wynn Resorts redeemed and canceled Aruze's
24,549,222
shares of Wynn Resorts' common stock. For more information, see
Note 15
, "Commitments and Contingencies."
Note 8 - Noncontrolling Interests
Wynn Macau, Limited
In October 2009, WML, an indirect wholly owned subsidiary of the Company and the developer, owner and operator of Wynn Macau and Wynn Palace, listed its ordinary shares of common stock on The Stock Exchange of Hong Kong Limited through an initial public offering. The Company currently owns approximately
72%
of this subsidiary's common stock. The shares of WML were not and will not be registered under the Securities Act and may not be offered or sold in the United States absent a registration under the Securities Act, or an applicable exception from such registration requirements.
On October 5, 2018, WML paid a cash dividend of HK
$0.75
per share, consisting of an interim dividend of HK
$0.32
per share for the six months ended June 30, 2018 and a special dividend of HK
$0.43
per share, for a total of
$496.6 million
. The Company's share of this dividend was
$358.3 million
with a reduction of
$138.2 million
to noncontrolling interests in the accompanying Consolidated Balance Sheet.
On April 25, 2018, WML paid a cash dividend of HK
$0.75
per share for a total of
$497.1 million
. The Company's share of this dividend was
$358.8 million
with a reduction of
$138.3 million
to noncontrolling interests in the accompanying Consolidated Balance Sheet.
On September 15, 2017, WML paid a dividend of HK
$0.21
per share for a total of
$139.4 million
. The Company's share of this dividend was
$100.6 million
with a reduction of
$38.8 million
to noncontrolling interests in the accompanying Consolidated Balance Sheets.
On June 20, 2017, WML paid a dividend of HK
$0.42
per share for a total of
$279.9 million
. The Company's share of this dividend was
$202.0 million
with a reduction of
$77.9 million
to noncontrolling interests in the accompanying Consolidated Balance Sheets.
On April 27, 2016, WML paid a dividend of HK
$0.60
per share for a total of
$401.9 million
. The Company's share of this dividend was
$290.1 million
with a reduction of
$111.8 million
to noncontrolling interests in the accompanying Consolidated Balance Sheets.
92
WYNN RESORTS, LIMITED AND SUBSIDIARIES
NOTES TO CONSOLIDATED FINANCIAL STATEMENTS (continued)
Retail Joint Venture
During the year ended
December 31, 2018
the Retail Joint Venture made aggregate distributions of
$305.4 million
to its non-controlling interest holder in connection with the distribution of the net proceeds of the Retail Term Loan and distributions made in the normal course of business. For more information on the Retail Term Loan and on the Retail Joint Venture, see
Note 6
, "
Long-Term Debt
," and
Note 14
, "
Retail Joint Venture
," respectively.
Note 9 - Benefit Plans
Defined contribution plans
The Company established a retirement savings plan under Section 401(k) of the Internal Revenue Code covering its U.S. non-union employees in July 2000. The plan allows employees to defer, within prescribed limits, a percentage of their income on a pre-tax basis through contributions to this plan. The Company matches
50%
of employee contributions, up to
6%
of employees' eligible compensation. During the years ended
December 31, 2018
,
2017
and
2016
, the Company recorded matching contribution expenses of
$6.4 million
,
$6.1 million
and
$6.1 million
, respectively.
Wynn Macau also operates a defined contribution retirement benefits plan (the "Wynn Macau Plan"). Eligible employees are allowed to contribute
5%
of their salary to the Wynn Macau Plan and the Company matches any contributions. The assets of the Wynn Macau Plan are held separately from those of the Company in an independently administered fund. The Company's matching contributions vest to the employee at
10%
per year with full vesting in
ten years
. Forfeitures of unvested contributions are used to reduce the Company's liability for its contributions payable. During the years ended
December 31, 2018
,
2017
and
2016
, the Company recorded matching contribution expenses of
$16.6 million
,
$15.8 million
and
$12.9 million
, respectively.
Multi-employer pension plan
Wynn Las Vegas, LLC contributes to a multi-employer defined benefit pension plan for certain of its union employees under the terms of the Southern Nevada Culinary and Bartenders Union collective-bargaining agreement, which expires in July 2021. The legal name of the multi-employer pension plan is the Southern Nevada Culinary and Bartenders Pension Plan (the "Plan") (EIN: 88-6016617 Plan Number: 1). The Company recorded expenses of
$11.9 million
,
$11.5 million
and
$9.3 million
for contributions to the Plan for the years ended
December 31, 2018
,
2017
and
2016
, respectively. For the
2017
plan year, the most recent for which plan data is available, the Company's contributions were identified by the Plan to exceed
5%
of total contributions for that year. Based on information the Company received from the Plan, it was certified to be in neither endangered nor critical status for the
2017
plan year. Risks of participating in a multi-employer plan differ from single-employer plans for the following reasons: (1) assets contributed to a multi-employer plan by one employer may be used to provide benefits to employees of other participating employers; (2) if a participating employer stops contributing to the plan, the unfunded obligations of the plan may be borne by the remaining participating employers; (3) if a participating employer stops participating, it may be required to pay those plans an amount based on the underfunded status of the plan, referred to as a withdrawal liability; and (4) if the plan is terminated by withdrawal of all employers and if the value of the nonforfeitable benefits exceeds plan assets and withdrawal liability payments, employers are required by law to make up the insufficient difference.
Note 10 - Revenue
The Company’s revenue from contracts with customers primarily consists of casino wagers and sales of rooms, food and beverage, entertainment, retail and other goods and services.
Gross casino revenues are measured by the aggregate net difference between gaming wins and losses. The Company applies a practical expedient by accounting for its casino wagering transactions on a portfolio basis versus an individual basis as all wagers have similar characteristics. Commissions rebated to customers either directly or indirectly through games promoters and cash discounts and other cash incentives earned by customers are recorded as a reduction of casino revenues. In addition to the wager, casino transactions typically include performance obligations related to complimentary goods or services provided to incentivize future gaming or in exchange for points earned under the Company’s loyalty programs.
For casino transactions that include complimentary goods or services provided by the Company to incentivize future gaming, the Company allocates the standalone selling price of each good or service to the appropriate revenue type based on the good or service provided. Complimentary goods or services that are provided under the Company’s control and discretion and supplied by third parties are recorded as an operating expense.
93
WYNN RESORTS, LIMITED AND SUBSIDIARIES
NOTES TO CONSOLIDATED FINANCIAL STATEMENTS (continued)
The Company offers loyalty programs at both its Macau Operations and its Las Vegas Operations. Under the program at its Macau Operations, customers earn points based on their level of table games and slots play, which can be redeemed for free play, gifts and complimentary goods or services provided by the Company. Under the program at its Las Vegas Operations, customers earn points based on their level of slots play, which can be redeemed for free play. For casino transactions that include points earned under the Company’s loyalty programs, the Company defers a portion of the revenue by recording the estimated standalone selling price of the earned points that are expected to be redeemed as a liability.
Upon redemption of the points for Company-owned goods or services, the standalone selling price of each good or service is allocated to the appropriate revenue type based on the good or service provided. Upon the redemption of the points with third parties, the redemption amount is deducted from the liability and paid directly to the third party.
After allocating amounts to the complimentary goods or services provided and to the points earned under the Company’s loyalty programs, the residual amount is recorded as casino revenue when the wager is settled.
The transaction price for rooms, food and beverage, entertainment, retail and other transactions is the net amount collected from the customer for such goods and services and is recorded as revenue when the goods are provided, services are performed or events are held. Sales tax and other applicable taxes collected by the Company are excluded from revenues. Advance deposits on rooms and advance ticket sales are performance obligations that are recorded as customer deposits until services are provided to the customer. Revenues from contracts with multiple goods or services are allocated to each good or service based on its relative standalone selling price. Entertainment, retail and other revenue also includes lease revenue, which is recognized on a time proportion basis over the lease term. Contingent lease revenue is recognized when the right to receive such revenue is established according to the lease agreements.
Disaggregation of Revenues
The Company operates integrated resorts in Macau and Las Vegas and generates revenues at its properties by providing the following types of services and products: gaming, rooms, food and beverage and entertainment, retail and other. Revenues disaggregated by type of revenue and geographic location are as follows (in thousands):
|
Year Ended December 31, 2018
|
Macau Operations
|
Las Vegas Operations
|
Total
|
|||||||||
|
Casino
|
$
|
4,350,907
|
|
$
|
434,083
|
|
$
|
4,784,990
|
|
|||
|
Rooms
|
283,562
|
|
468,238
|
|
751,800
|
|
||||||
|
Food and beverage
|
187,006
|
|
567,122
|
|
754,128
|
|
||||||
|
Entertainment, retail and other
(1)
|
230,616
|
|
196,126
|
|
426,742
|
|
||||||
|
Total operating revenues
|
$
|
5,052,091
|
|
$
|
1,665,569
|
|
$
|
6,717,660
|
|
|||
|
Year Ended December 31, 2017
|
||||||||||||
|
Casino
|
$
|
3,788,210
|
|
$
|
456,093
|
|
$
|
4,244,303
|
|
|||
|
Rooms
|
217,581
|
|
453,376
|
|
670,957
|
|
||||||
|
Food and beverage
|
164,189
|
|
567,926
|
|
732,115
|
|
||||||
|
Entertainment, retail and other
(1)
|
197,217
|
|
225,568
|
|
422,785
|
|
||||||
|
Total operating revenues
|
$
|
4,367,197
|
|
$
|
1,702,963
|
|
$
|
6,070,160
|
|
|||
|
Year Ended December 31, 2016
|
||||||||||||
|
Casino
|
$
|
2,313,518
|
|
$
|
437,372
|
|
$
|
2,750,890
|
|
|||
|
Rooms
|
158,126
|
|
437,484
|
|
595,610
|
|
||||||
|
Food and beverage
|
99,703
|
|
535,708
|
|
635,411
|
|
||||||
|
Entertainment, retail and other
(1)
|
134,948
|
|
228,938
|
|
363,886
|
|
||||||
|
Total operating revenues
|
$
|
2,706,295
|
|
$
|
1,639,502
|
|
$
|
4,345,797
|
|
|||
(1) Includes lease revenue accounted for under lease accounting guidance.
94
WYNN RESORTS, LIMITED AND SUBSIDIARIES
NOTES TO CONSOLIDATED FINANCIAL STATEMENTS (continued)
Customer Contract Liabilities
In providing goods and services to its customers, there is often a timing difference between the Company receiving cash and the Company recording revenue for providing services or holding events.
The Company’s primary liabilities associated with customer contracts are as follows (in thousands):
|
December 31, 2018
|
December 31, 2017
|
Increase (decrease)
|
December 31, 2017
|
December 31, 2016
|
Increase (decrease)
|
||||||||||||||||||
|
Casino outstanding chips and front money deposits
(1)
|
$
|
905,561
|
|
$
|
991,957
|
|
$
|
(86,396
|
)
|
$
|
991,957
|
|
$
|
546,487
|
|
$
|
445,470
|
|
|||||
|
Advance room deposits and ticket sales
(2)
|
42,197
|
|
48,065
|
|
(5,868
|
)
|
48,065
|
|
41,583
|
|
6,482
|
|
|||||||||||
|
Other gaming-related liabilities
(3)
|
12,694
|
|
12,765
|
|
(71
|
)
|
12,765
|
|
12,033
|
|
732
|
|
|||||||||||
|
Loyalty program and related liabilities
(4)
|
18,148
|
|
18,421
|
|
(273
|
)
|
18,421
|
|
7,942
|
|
10,479
|
|
|||||||||||
|
$
|
978,600
|
|
$
|
1,071,208
|
|
$
|
(92,608
|
)
|
$
|
1,071,208
|
|
$
|
608,045
|
|
$
|
463,163
|
|
||||||
(1) Casino outstanding chips represent amounts owed to junkets and customers for chips in their possession, and casino front money deposits represent funds deposited by customers before gaming play occurs. These amounts are included in customer deposits on the Consolidated Balance Sheets and may be recognized as revenue or will be redeemed for cash in the future.
(2) Advance room deposits and ticket sales represent cash received in advance for goods or services to be provided in the future. These amounts are included in customer deposits on the Consolidated Balance Sheets and will be recognized as revenue when the goods or services are provided or the events are held. Decreases in this balance generally represent the recognition of revenue and increases in the balance represent additional deposits made by customers. The deposits are expected to primarily be recognized as revenue within one year.
(3) Other gaming-related liabilities generally represent unpaid wagers primarily in the form of unredeemed slot, race and sportsbook tickets or wagers for future sporting events. The amounts are included in other accrued liabilities on the Consolidated Balance Sheets.
(4) Loyalty program and related liabilities represent the deferral of revenue until the loyalty points or other complimentaries are redeemed. The amounts are included in other accrued liabilities on the Consolidated Balance Sheets and are expected to be recognized as revenue within one year of being earned by customers.
Note 11 - Stock-Based Compensation
Wynn Resorts, Limited
The Company's 2002 Stock Incentive Plan, as amended and restated (the "WRL 2002 Plan"), allowed it to grant stock options and nonvested shares of Wynn Resorts' common stock to eligible directors, officers, employees, and consultants of the Company. Under the WRL 2002 Plan, a maximum of
12,750,000
shares of the Company's common stock was reserved for issuance.
On May 16, 2014, the Company adopted the Wynn Resorts, Limited 2014 Omnibus Incentive Plan (the "Omnibus Plan") after approval from its stockholders. The Omnibus Plan allows for the grant of stock options, restricted stock, restricted stock units, stock appreciation rights, performance awards and other share-based awards to the same eligible participants as the WRL 2002 Plan. Under the approval of the Omnibus Plan, no new awards may be made under the WRL 2002 Plan. The outstanding awards under the WRL 2002 Plan were transferred to the Omnibus Plan and will remain pursuant to their existing terms and related award agreements. The Company reserved
4,409,390
shares of its common stock for issuance under the Omnibus Plan. These shares were transferred from the remaining available amount under the WRL 2002 Plan.
The Omnibus Plan is administered by the Compensation Committee (the "Committee") of the Wynn Resorts, Limited Board of Directors. The Committee has discretion under the Omnibus Plan regarding which type of awards to grant, the vesting and service requirements, exercise price and other conditions, in all cases subject to certain limits. For stock options, the exercise price of stock options must be at least equal to the fair market value of the stock on the date of grant and the maximum term of such an award is
10 years
.
As of
December 31, 2018
, the Company had an aggregate of
3,041,051
shares of its common stock available for grant as share-based awards under the Omnibus Plan.
95
WYNN RESORTS, LIMITED AND SUBSIDIARIES
NOTES TO CONSOLIDATED FINANCIAL STATEMENTS (continued)
Stock Options
The summary of stock option activity under the Omnibus Plan for the year ended
December 31, 2018
is presented below:
|
Options
|
Weighted
Average
Exercise
Price
|
Weighted
Average
Remaining
Contractual
Term
|
Aggregate
Intrinsic
Value
|
|||||||||
|
Outstanding as of January 1, 2018
|
644,460
|
|
$
|
73.93
|
|
|||||||
|
Granted
|
—
|
|
$
|
—
|
|
|||||||
|
Exercised
|
(261,470
|
)
|
$
|
77.07
|
|
|||||||
|
Forfeited or expired
|
(37,200
|
)
|
$
|
172.07
|
|
|||||||
|
Outstanding as of December 31, 2018
|
345,790
|
|
$
|
60.99
|
|
1.25
|
$
|
14,796,122
|
|
|||
|
Fully vested and expected to vest as of December 31, 2018
|
345,790
|
|
$
|
60.99
|
|
1.25
|
$
|
14,796,122
|
|
|||
|
Exercisable as of December 31, 2018
|
285,790
|
|
$
|
63.91
|
|
1.44
|
$
|
11,688,722
|
|
|||
The following is provided for stock options under the Omnibus Plan (in thousands, except weighted average grant date fair value):
|
Years Ended December 31,
|
|||||||||||
|
2018
|
2017
|
2016
|
|||||||||
|
Weighted average grant date fair value
|
$
|
—
|
|
$
|
—
|
|
$
|
34.90
|
|
||
|
Intrinsic value of stock options exercised
|
$
|
22,387
|
|
$
|
29,716
|
|
$
|
3,657
|
|
||
|
Cash received from the exercise of stock options
|
$
|
20,148
|
|
$
|
61,506
|
|
$
|
3,487
|
|
||
As of
December 31, 2018
, there was
$0.6 million
of unamortized compensation expense related to stock options, which is expected to be recognized over a weighted average period of
0.34
years.
Nonvested shares
The summary of nonvested share activity under the Omnibus Plan for the year ended
December 31, 2018
is presented below:
|
Shares
|
Weighted
Average
Grant Date
Fair Value
|
|||||
|
Nonvested as of January 1, 2018
|
460,584
|
|
$
|
98.21
|
|
|
|
Granted
|
288,270
|
|
170.13
|
|
||
|
Vested
|
(96,559
|
)
|
121.51
|
|
||
|
Forfeited
|
(125,908
|
)
|
133.76
|
|
||
|
Nonvested as of December 31, 2018
|
526,387
|
|
$
|
127.84
|
|
|
The following is provided for the share awards under the Omnibus Plan (in thousands, except weighted average grant date fair value):
|
Years Ended December 31,
|
|||||||||||
|
2018
|
2017
|
2016
|
|||||||||
|
Weighted average grant date fair value
|
$
|
170.13
|
|
$
|
109.28
|
|
$
|
63.56
|
|
||
|
Fair value of shares vested
|
$
|
13,024
|
|
$
|
45,801
|
|
$
|
39,380
|
|
||
As of
December 31, 2018
, there was
$49.6 million
of unamortized compensation expense related to nonvested shares, which is expected to be recognized over a weighted average period of
3.66
years.
96
WYNN RESORTS, LIMITED AND SUBSIDIARIES
NOTES TO CONSOLIDATED FINANCIAL STATEMENTS (continued)
Wynn Macau, Limited
The Company's majority-owned subsidiary, WML, has two stock-based compensation plans that provide awards based on shares of WML's common stock. The shares available for issuance under these plans are separate and distinct from the common stock of Wynn Resorts' share plan and are not available for issuance for any awards under the Wynn Resorts share plan.
Share Option Plan
WML adopted a stock incentive plan, effective September 16, 2009, for the grant of stock options to purchase shares of WML to eligible directors and employees of its subsidiaries (the "Share Option Plan"). The Share Option Plan is administered by WML's Board of Directors, which has the discretion on the vesting and service requirements, exercise price, performance targets to exercise if applicable and other conditions, subject to certain limits. A maximum of
518,750,000
shares have been reserved for issuance under the Share Option Plan. As of
December 31, 2018
, there were
507,244,000
shares available for issuance under the Share Option Plan.
The summary of stock option activity under the Share Option Plan for the year ended
December 31, 2018
is presented below:
|
Options
|
Weighted
Average
Exercise
Price
|
Weighted
Average
Remaining
Contractual
Term
|
Aggregate
Intrinsic
Value
|
|||||||||
|
Outstanding as of January 1, 2018
|
7,006,000
|
|
$
|
2.32
|
|
|||||||
|
Granted
|
4,494,000
|
|
$
|
2.65
|
|
|||||||
|
Exercised
|
(941,600
|
)
|
$
|
1.94
|
|
|||||||
|
Outstanding as of December 31, 2018
|
10,558,400
|
|
$
|
2.49
|
|
7.80
|
$
|
1,403,732
|
|
|||
|
Fully vested and expected to vest as of December 31, 2018
|
10,558,400
|
|
$
|
2.49
|
|
7.80
|
$
|
1,403,732
|
|
|||
|
Exercisable as of December 31, 2018
|
3,302,800
|
|
$
|
2.72
|
|
5.20
|
$
|
484,717
|
|
|||
The following is provided for stock options under the Share Option Plan (in thousands, except weighted average grant date fair value):
|
Years Ended December 31,
|
|||||||||||
|
2018
|
2017
|
2016
|
|||||||||
|
Weighted average grant date fair value
|
$
|
0.57
|
|
$
|
0.56
|
|
$
|
0.31
|
|
||
|
Intrinsic value of stock options exercised
|
$
|
1,715
|
|
$
|
369
|
|
$
|
—
|
|
||
|
Cash received from the exercise of stock options
|
$
|
1,823
|
|
$
|
703
|
|
$
|
—
|
|
||
As of
December 31, 2018
, there was
$3.4 million
of unamortized compensation expense related to stock options, which is expected to be recognized over a weighted average period of
4.30
years.
Share Award Plan
On June 30, 2014, the Company's majority-owned subsidiary, WML, approved and adopted the WML Employee Ownership Scheme (the "Share Award Plan"). The Share Award Plan allows for the grant of nonvested shares of WML's common stock to eligible employees. The Share Award Plan is administered by WML's Board of Directors and has been mandated under the plan to allot, issue and process the transfer of a maximum of
50,000,000
shares. The Board of Directors has discretion on the vesting and service requirements, exercise price and other conditions, subject to certain limits. As of
December 31, 2018
, there were
33,362,988
shares available for issuance under the Share Award Plan.
97
WYNN RESORTS, LIMITED AND SUBSIDIARIES
NOTES TO CONSOLIDATED FINANCIAL STATEMENTS (continued)
The summary of nonvested share activity under the Share Award Plan for the year ended
December 31, 2018
is presented below:
|
Shares
|
Weighted
Average
Grant Date
Fair Value
|
|||||
|
Nonvested as of January 1, 2018
|
11,842,707
|
|
$
|
2.24
|
|
|
|
Granted
|
3,256,630
|
|
$
|
3.07
|
|
|
|
Vested
|
(3,565,245
|
)
|
$
|
3.56
|
|
|
|
Forfeited
|
(1,780,825
|
)
|
$
|
2.03
|
|
|
|
Nonvested as of December 31, 2018
|
9,753,267
|
|
$
|
2.07
|
|
|
The weighted average grant date fair value for shares granted during the year and the total fair value of shares vested under the Share Award Plan is presented below (in thousands, except weighted average grant date fair value):
|
Years Ended December 31,
|
|||||||||||
|
2018
|
2017
|
2016
|
|||||||||
|
Weighted average grant date fair value
|
$
|
3.07
|
|
$
|
2.22
|
|
$
|
1.38
|
|
||
|
Fair value of shares vested
|
$
|
1,309
|
|
$
|
6,884
|
|
$
|
—
|
|
||
As of
December 31, 2018
, there was
$12.7 million
of unamortized compensation expense, which is expected to be recognized over a weighted average period of
2.82 years
.
Compensation Cost
The total compensation cost for stock-based compensation plans was recorded as follows (in thousands):
|
Years Ended December 31,
|
|||||||||||
|
2018
|
2017
|
2016
|
|||||||||
|
Casino
|
$
|
5,946
|
|
$
|
6,954
|
|
$
|
11,304
|
|
||
|
Rooms
|
437
|
|
655
|
|
374
|
|
|||||
|
Food and beverage
|
1,125
|
|
1,466
|
|
1,060
|
|
|||||
|
Entertainment, retail and other
|
111
|
|
147
|
|
82
|
|
|||||
|
General and administrative
|
28,872
|
|
34,749
|
|
30,398
|
|
|||||
|
Pre-opening
|
750
|
|
—
|
|
504
|
|
|||||
|
Property charges and other
(1)
|
(2,201
|
)
|
—
|
|
—
|
|
|||||
|
Total stock-based compensation expense
|
35,040
|
|
43,971
|
|
43,722
|
|
|||||
|
Total stock-based compensation capitalized
|
11
|
|
80
|
|
92
|
|
|||||
|
Total stock-based compensation costs
|
$
|
35,051
|
|
$
|
44,051
|
|
$
|
43,814
|
|
||
(1) In 2018, reflects the reversal of compensation cost previously recognized for awards forfeited in connection with the departure of an employee.
For the year ended
December 31, 2018
, the Company recorded an expense of approximately
$5.8 million
in connection with the departure of the Company's general counsel and the related accelerated vesting of previously granted share-based awards and a
$1.8 million
one-time cash payment.
Certain members of the Company's executive management team receive a portion of their annual incentive bonus in shares of the Company's stock. The number of shares is determined based on the closing stock price on the date the annual incentive bonus is settled. As the number of shares is variable, the Company records a liability for the fixed monetary amount over the service period. The Company recorded stock-based compensation expense associated with these awards of
$6.7 million
,
$23.7 million
and
$19.2 million
, for the year ended
December 31, 2018
,
2017
and
2016
, respectively. The Company settled the obligation for the 2018 annual incentive bonus by issuing vested shares in January 2019. The Company settled the obligation for the
2017
annual incentive bonus by issuing vested shares in December 2017 and January 2018.
98
WYNN RESORTS, LIMITED AND SUBSIDIARIES
NOTES TO CONSOLIDATED FINANCIAL STATEMENTS (continued)
During the years ended
December 31,
2018
,
2017
and
2016
, the Company recognized income tax benefits in the Consolidated Statements of Income of
$5.7 million
,
$10.8 million
and
$10.4 million
, respectively, related to stock-based compensation expense. Additionally, during the years ended
December 31,
2018
,
2017
and
2016
, the Company realized tax benefits of
$4.6 million
,
$25.4 million
and
$6.7 million
, respectively, related to stock option exercises and restricted stock vesting that occurred in those years.
The Company uses the Black-Scholes option pricing model to determine the estimated fair value for stock options. Dividend yield is based on the estimate of annual dividends expected to be paid at the time of the grant. Expected volatility is based on implied and historical factors related to the Company's common stock. The risk-free interest rate used for each period presented is based on the U.S. Treasury yield curve for stock options issued under the Omnibus Plan and the Hong Kong Exchange Fund rates for stock options issued under the Share Option Plan, both at the time of grant for the period equal to the expected term. Expected term represents the weighted average time between the option's grant date and its exercise date. The Company uses historical award exercise activity and termination activity in estimating the expected term for the Omnibus Plan and Share Option Plan.
There were
no
stock options granted under the Omnibus Plan during the years ended December 31, 2018 and 2017. The fair value of stock options granted under the Omnibus Plan during the year ended December 31, 2016 was estimated on the date of grant using an expected dividend yield of
2.0%
, expected volatility of
45.4%
, a risk-free interest rate of
1.1%
and an expected term of
6.0
years.
The fair value of stock options granted under WML's Share Option Plan was estimated on the date of grant using the following weighted average assumptions:
|
Years Ended December 31,
|
||||||||
|
2018
|
2017
|
2016
|
||||||
|
Expected dividend yield
|
5.7
|
%
|
5.7
|
%
|
6.3
|
%
|
||
|
Expected volatility
|
40.2
|
%
|
41.5
|
%
|
42.6
|
%
|
||
|
Risk-free interest rate
|
2.3
|
%
|
1.1
|
%
|
1.0
|
%
|
||
|
Expected term (years)
|
6.5
|
|
6.5
|
|
6.5
|
|
||
Note 12 - Income Taxes
Consolidated income (loss) before taxes for United States ("U.S.") and foreign operations consisted of the following (in thousands):
|
Years Ended December 31,
|
|||||||||||
|
2018
|
2017
|
2016
|
|||||||||
|
United States
|
$
|
(491,523
|
)
|
$
|
90,206
|
|
$
|
90,900
|
|
||
|
Foreign
|
797,263
|
|
470,063
|
|
219,697
|
|
|||||
|
Total
|
$
|
305,740
|
|
$
|
560,269
|
|
$
|
310,597
|
|
||
The income tax (benefit) provision attributable to income before income taxes is as follows (in thousands):
|
December 31,
|
|||||||||||
|
2018
|
2017
|
2016
|
|||||||||
|
Current
|
|||||||||||
|
U.S. Federal
|
$
|
(637
|
)
|
$
|
(19,856
|
)
|
$
|
60
|
|
||
|
U.S. State
|
198
|
|
51
|
|
79
|
|
|||||
|
Foreign
|
1,749
|
|
1,674
|
|
1,633
|
|
|||||
|
Total
|
1,310
|
|
(18,131
|
)
|
1,772
|
|
|||||
|
Deferred
|
|||||||||||
|
U.S. Federal
|
(483,681
|
)
|
(309,423
|
)
|
5,081
|
|
|||||
|
U.S. State
|
(14,973
|
)
|
(1,431
|
)
|
1,275
|
|
|||||
|
Total
|
(498,654
|
)
|
(310,854
|
)
|
6,356
|
|
|||||
|
Total income tax benefit
|
$
|
(497,344
|
)
|
$
|
(328,985
|
)
|
$
|
8,128
|
|
||
99
WYNN RESORTS, LIMITED AND SUBSIDIARIES
NOTES TO CONSOLIDATED FINANCIAL STATEMENTS (continued)
The reconciliation of the U.S. federal statutory tax rate to the actual tax rate is as follows:
|
December 31,
|
||||||||
|
2018
|
2017
|
2016
|
||||||
|
U.S. Federal statutory rate
|
21.0
|
%
|
35.0
|
%
|
35.0
|
%
|
||
|
Foreign tax credits, net of valuation allowance
|
(154.9
|
)%
|
(136.1
|
)%
|
(61.5
|
)%
|
||
|
Non-taxable foreign income
|
(48.8
|
)%
|
(20.1
|
)%
|
(20.7
|
)%
|
||
|
Foreign tax rate differential
|
(20.8
|
)%
|
(17.0
|
)%
|
(14.5
|
)%
|
||
|
Global intangible low-taxed income
|
28.3
|
%
|
—
|
%
|
—
|
%
|
||
|
Change in tax rate
|
—
|
%
|
(11.8
|
)%
|
—
|
%
|
||
|
Repatriation of foreign earnings
|
—
|
%
|
81.0
|
%
|
51.6
|
%
|
||
|
Valuation allowance, other
|
9.3
|
%
|
5.9
|
%
|
7.5
|
%
|
||
|
Other, net
|
3.2
|
%
|
4.4
|
%
|
5.2
|
%
|
||
|
Effective income tax rate
|
(162.7
|
)%
|
(58.7
|
)%
|
2.6
|
%
|
||
Wynn Macau SA received a five-year exemption from Macau's
12%
Complementary Tax on casino gaming profits through December 31, 2020. Accordingly, for the years ended December 31,
2018
,
2017
and
2016
, the Company was exempt from the payment of such taxes totaling
$96.8 million
,
$63.0 million
and
$27.3 million
or
$0.90
,
$0.61
and
$0.27
per diluted share, respectively. The Company's non-gaming profits remain subject to the Macau Complementary Tax and its casino winnings remain subject to the Macau special gaming tax and other levies in accordance with its concession agreement.
Wynn Macau SA also entered into an agreement with the Macau government that provides for an annual payment of MOP
12.8 million
(approximately
$1.6 million
) as complementary tax otherwise due by stockholders of Wynn Macau SA on dividend distributions through 2020. As a result of the stockholder dividend tax agreements, income tax expense includes
$1.6 million
for each of the years ended December 31, 2018,
2017
and 2016.
The Macau special gaming tax is
35%
of gross gaming revenue. U.S. tax laws only allow a foreign tax credit ("FTC") up to
21%
of foreign source income. In February 2010, the Company and the IRS entered into a Pre-Filing Agreement ("PFA") providing that the Macau special gaming tax qualifies as a tax paid in lieu of an income tax and could be claimed as a U.S. FTC.
In December 2017, the U.S. Tax Cuts and Jobs Act ("U.S. tax reform") was enacted. Also in December 2017, the SEC staff issued Staff Accounting Bulletin No. 118, Income Tax Accounting Implications of the Tax Cuts and Jobs Act, which allowed the Company to record provisional amounts during a measurement period not to extend beyond one year from the enactment date. For the year ended
December 31, 2017
, the Company recorded a provisional net tax benefit of
$339.9 million
based on the Company's initial analysis of the U.S. tax reform. During the fourth quarter of 2018, the Company finalized its analysis of U.S. tax reform, which was further clarified by guidance issued by the Internal Revenue Service in the fourth quarter of 2018. The guidance addressed the treatment of foreign-sourced royalties and the allocation of interest expense and other expenses to foreign source income. As a result, the Company adjusted its valuation allowance for FTC carryovers and recorded a net tax benefit of
$390.9 million
, which is incremental to the
$339.9 million
provisional net tax benefit recorded in 2017.
During the years ended December 31,
2018
,
2017
and
2016
, the Company recognized tax benefits of
$82.8 million
,
$746.6 million
and
$170.5 million
, respectively (net of valuation allowance and uncertain tax positions), for FTCs generated from the earnings of Wynn Macau SA.
Accounting standards require recognition of a future tax benefit to the extent that realization of such benefit is more likely than not; otherwise, a valuation allowance is applied. During the years ended
December 31, 2018
and
2017
, the aggregate valuation allowance for deferred tax assets decreased by
$746.6 million
and increased by
$103.7 million
, respectively. The 2018 decrease is primarily related to the expiration of FTCs. The 2017 increase is primarily related to FTC carryforwards and other foreign deferred tax assets that are not considered more likely than not realizable.
The Company recorded tax benefits resulting from the exercise of nonqualified stock options and the value of vested restricted stock and accrued dividends of
$2.0 million
,
$2.6 million
and
$0.8 million
for the years ended
December 31, 2018
,
2017
and
2016
, respectively, in excess of the amounts reported for such items as compensation costs under accounting standards related to stock-based compensation.
100
WYNN RESORTS, LIMITED AND SUBSIDIARIES
NOTES TO CONSOLIDATED FINANCIAL STATEMENTS (continued)
The tax effects of significant temporary differences representing net deferred tax assets and liabilities consisted of the following (in thousands):
|
December 31,
|
|||||||
|
2018
|
2017
|
||||||
|
Deferred tax assets—U.S.:
|
|||||||
|
Foreign tax credit carryforwards
|
$
|
3,187,797
|
|
$
|
3,616,872
|
|
|
|
Disallowed interest expense carryforward
|
67,368
|
|
—
|
|
|||
|
Construction in progress
|
42,528
|
|
5,009
|
|
|||
|
Receivables, inventories, accrued liabilities and other
|
10,878
|
|
19,356
|
|
|||
|
Stock-based compensation
|
5,477
|
|
5,084
|
|
|||
|
Other tax credit carryforwards
|
4,946
|
|
1,999
|
|
|||
|
Intangibles and related other
|
489
|
|
3,486
|
|
|||
|
Other
|
2,279
|
|
86
|
|
|||
|
3,321,762
|
|
3,651,892
|
|
||||
|
Less: valuation allowance
|
(2,500,027
|
)
|
(3,273,292
|
)
|
|||
|
821,735
|
|
378,600
|
|
||||
|
Deferred tax liabilities—U.S.:
|
|||||||
|
Property and equipment
|
(70,560
|
)
|
(111,988
|
)
|
|||
|
Redemption Note fair value
|
—
|
|
(13,139
|
)
|
|||
|
Prepaid insurance, maintenance and taxes
|
(12,430
|
)
|
(10,391
|
)
|
|||
|
Other
|
(2,293
|
)
|
(2,549
|
)
|
|||
|
(85,283
|
)
|
(138,067
|
)
|
||||
|
Deferred tax assets—Foreign:
|
|||||||
|
Net operating loss carryforwards
|
94,244
|
|
74,345
|
|
|||
|
Property and equipment
|
41,520
|
|
36,299
|
|
|||
|
Pre-opening expenses
|
8,421
|
|
10,717
|
|
|||
|
Other
|
651
|
|
1,493
|
|
|||
|
144,836
|
|
122,854
|
|
||||
|
Less: valuation allowance
|
(143,872
|
)
|
(117,175
|
)
|
|||
|
964
|
|
5,679
|
|
||||
|
Deferred tax liabilities—Foreign:
|
|||||||
|
Property and equipment
|
(964
|
)
|
(5,679
|
)
|
|||
|
Net deferred tax asset
|
$
|
736,452
|
|
$
|
240,533
|
|
|
FTC carryforwards of
$545.7 million
expired as of
December 31, 2018
. As of
December 31, 2018
, the Company had FTC carryforwards (net of uncertain tax positions) of
$3.19 billion
. Of this amount,
$110.9 million
will expire in 2019,
$530.4 million
in 2020,
$540.3 million
in 2021,
$756.0 million
in 2023,
$710.7 million
in 2024,
$47.2 million
in 2025 and
$492.4 million
in 2027. The Company has a disallowed interest carryforward of
$294.2 million
which does not expire. The Company has
no
U.S. tax loss carryforwards. The Company incurred foreign tax losses of
$340.0 million
,
$319.1 million
and
$317.3 million
during the tax years ended
December 31, 2018
,
2017
and
2016
, respectively. These foreign tax loss carryforwards expire in 2021, 2020 and 2019, respectively.
In assessing the need for a valuation allowance, the Company considered whether it is more likely than not that the deferred tax assets will be realized. The ultimate realization of deferred tax assets is dependent upon the generation of future taxable income. In the assessment of the valuation allowance, appropriate consideration was given to all positive and negative evidence including recent operating profitability, forecast of future earnings and the duration of statutory carryforward periods.
As of
December 31, 2018
and
2017
, the Company had valuation allowances of
$2.49 billion
and
$3.27 billion
, respectively, provided on FTCs expected to expire unutilized and valuation allowances of
$5.3 million
and
$3.5 million
provided on other U.S.
101
WYNN RESORTS, LIMITED AND SUBSIDIARIES
NOTES TO CONSOLIDATED FINANCIAL STATEMENTS (continued)
deferred tax assets. As of
December 31, 2018
and
2017
, the Company had valuation allowances of
$143.9 million
and
$117.2 million
, respectively, provided on its foreign deferred tax assets.
The Company had the following activity for unrecognized tax benefits as follows (in thousands):
|
December 31,
|
|||||||||||
|
2018
|
2017
|
2016
|
|||||||||
|
Balance at beginning of period
|
$
|
95,236
|
|
$
|
90,523
|
|
$
|
88,314
|
|
||
|
Increases based on tax positions of the current year
|
8,926
|
|
8,520
|
|
5,930
|
|
|||||
|
Reductions due to lapse in statutes of limitations
|
(4,692
|
)
|
(3,807
|
)
|
(3,721
|
)
|
|||||
|
Balance at end of period
|
$
|
99,470
|
|
$
|
95,236
|
|
$
|
90,523
|
|
||
As of
December 31, 2018
,
2017
and
2016
, unrecognized tax benefits of
$99.5 million
,
$95.2 million
and
$90.3 million
, respectively, were recorded as reductions in deferred income taxes, net. As of December 31, 2016,
$0.2 million
of unrecognized tax benefits were recorded in other long-term liabilities. The Company had no unrecognized tax benefits recorded in other long-term liabilities as of
December 31, 2018
and
2017
.
As of
December 31, 2018
,
2017
and
2016
,
$31.0 million
,
$26.9 million
and
$22.6 million
, respectively, of unrecognized tax benefits would, if recognized, impact the effective tax rate.
The Company recognizes penalties and interest related to unrecognized tax benefits in the provision for income taxes. During the year ended
December 31, 2018
, the Company recognized no interest and penalties. During each of the years ended December 31,
2017
and
2016
, the Company recognized
$0.9 million
in interest in the provision for income taxes.
The Company anticipates that the
2014
statute of limitations will expire in the next 12 months for certain foreign tax jurisdictions. Also, the Company's unrecognized tax benefits include certain income tax accounting methods, which govern the timing and deductibility of income tax deductions. As a result, the Company's unrecognized tax benefits could increase up to
$5.1 million
over the next 12 months.
The Company files income tax returns in the U.S. federal jurisdiction, various states and foreign jurisdictions. The Company's income tax returns are subject to examination by the IRS and other tax authorities in the locations where it operates. The Company's 2002 to 2014 domestic income tax returns remain subject to examination by the IRS to the extent tax attributes carryforward to future years. The Company's 2015 to 2017 domestic income tax returns also remain subject to examination by the IRS. The Company's 2014 to 2017 Macau income tax returns remain subject to examination by the Financial Services Bureau.
The Company has participated in the IRS Compliance Assurance Program ("CAP") for the 2012 through
2018
tax years and will continue to participate in the IRS CAP for the
2019
tax year.
In February 2017 and 2018, the Company received notification that the IRS completed its examination of the Company's 2015 and 2016 U.S. income tax returns, respectively. There were no changes in its unrecognized tax benefits as a result of the completion of these examinations.
On December 31, 2016, the statute of limitations for the 2011 Macau Complementary tax return expired. As a result of the expiration of the statute of limitations for the Macau Complementary Tax return, the total amount of unrecognized tax benefits decreased by
$3.7 million
.
In April 2016, the Financial Services Bureau commenced an examination of the 2011 and 2012 Macau income tax returns of Palo. In June 2016, the Financial Services Bureau concluded its examination with no changes.
On December 31, 2017, the statute of limitations for the 2012 Macau Complementary tax return expired. As a result of the expiration of the statute of limitations for the Macau Complementary Tax return, the total amount of unrecognized tax benefits decreased by
$3.8 million
.
On December 31, 2018, the statute of limitations for the 2013 Macau Complementary tax return expired. As a result of the expiration of the statute of limitations for the Macau Complementary Tax return, the total amount of unrecognized tax benefits decreased by
$4.7 million
.
102
WYNN RESORTS, LIMITED AND SUBSIDIARIES
NOTES TO CONSOLIDATED FINANCIAL STATEMENTS (continued)
In March 2017, the Financial Services Bureau commenced an examination of the 2013 and 2014 Macau income tax returns of Wynn Macau SA. In July 2018, the Financial Services Bureau issued final tax assessments for the Company for the years 2013 and 2014. While no additional tax was due, adjustments were made to the Company’s tax loss carryforwards
In July 2017, the Financial Services Bureau commenced an examination of the 2013 and 2014 Macau income tax returns of Palo. In February 2018, the Financial Services Bureau concluded its examination with no changes.
Note 13 - Related Party Transactions
Agreements with Stephen A. Wynn
On February 6, 2018, Stephen A. Wynn ("Mr. Wynn"), resigned as Chairman of the Board of Directors and Chief Executive Officer of Wynn Resorts and on February 15, 2018, Mr. Wynn entered into a separation agreement with the Company specifying the terms of his termination of service with the Company (the "Separation Agreement"). The Separation Agreement terminated Mr. Wynn’s employment agreement with the Company and confirmed that Mr. Wynn is not entitled to any severance payment or other compensation from the Company under his employment agreement.
Under the Separation Agreement, Mr. Wynn agreed not to compete against the Company for a period of two years and to provide reasonable cooperation and assistance to the Company in connection with any private litigation or arbitration and to the Board of Directors of the Company or any committee of the Board of Directors in connection with any investigation by the Company related to his service with the Company. The Separation Agreement provided that (i) Mr. Wynn’s lease of his personal residence at Wynn Las Vegas would terminate not later than June 1, 2018 and until such date Mr. Wynn would continue to pay rent at its fair market value, unless Mr. Wynn elected to terminate the lease before such date, (ii) Mr. Wynn’s current healthcare coverage would terminate on December 31, 2018, and (iii) administrative support for Mr. Wynn would terminate on May 31, 2018. Additionally, in order to conduct sales of Company shares in an orderly fashion, the Company agreed to enter into a registration rights agreement with Mr. Wynn, with Mr. Wynn to reimburse the Company for its reasonable expenses.
As a result of Mr. Wynn’s resignation and the Separation Agreement, an aircraft purchase option that gave Mr. Wynn the right to purchase any or all of the aircraft owned by the Company or its direct wholly owned subsidiaries terminated on February 6, 2018. Further, under the parties' Surname Rights Agreement, Mr. Wynn granted the Company an exclusive, fully paid-up, perpetual, worldwide license to use, and to own and register trademarks and service marks incorporating the "Wynn" surname for casino resorts and related businesses, together with the right to sublicense the name and marks to its affiliates. Pursuant to the Separation Agreement, if the Company ceases to use the "Wynn" surname and trademark, the Company will assign all of its right, title, and interest in the "Wynn" trademark to Mr. Wynn and terminate the Surname Rights Agreement. The lease of Mr. Wynn’s residence was terminated by agreement of the parties on April 10, 2018.
On March 20, 2018, the Company entered into a registration rights agreement with Mr. Wynn, the Wynn Family Limited Partnership, a Delaware limited partnership (together with Mr. Wynn, the "Selling Stockholder") and each holder from time to time a party thereto (the "Registration Rights Agreement"), pursuant to the Separation Agreement. The Selling Stockholder subsequently sold all of its holdings of the Company's common stock through open market transactions pursuant to Rule 144 under the Securities Act of 1933, as amended, and certain privately negotiated transactions. Pursuant to the Registration Rights Agreement, without the Company's prior written consent, the Selling Stockholder was not permitted to sell more than an aggregate of
4,043,903
shares of Common Stock in any quarter. The Company provided written consent permitting the Selling Stockholder to undertake the registered sales.
Home Purchase
In May 2010, the Company entered into an employment agreement with Linda Chen ("Ms. Chen"), who is the President and Chief Operating Officer of Wynn Macau SA. The term of the employment agreement is through February 24, 2020. Under the terms of the employment agreement, the Company purchased a home in Macau for use by Ms. Chen and has made renovations to the home with total costs of
$10.0 million
through
December 31, 2018
. Upon the occurrence of certain events set forth below, Ms. Chen has the option to purchase the home at the then fair market value of the home (as determined by an independent appraiser) less a discount equal to
ten
percentage points multiplied by each anniversary of the term of the agreement that has occurred (the "Discount Percentage"). The option is exercisable for (a) no consideration at the end of the term, (b)
$1.00
in the event of termination of Ms. Chen's employment without "cause" or termination of Ms. Chen's employment for "good reason" following a "change of control" or (c) at a price based on the applicable Discount Percentage in the event Ms. Chen terminates the agreement due to
103
WYNN RESORTS, LIMITED AND SUBSIDIARIES
NOTES TO CONSOLIDATED FINANCIAL STATEMENTS (continued)
material breach by the Company. Upon Ms. Chen's termination for "cause," Ms. Chen will be deemed to have elected to purchase the Macau home based on the applicable Discount Percentage unless the Company determines to not require Ms. Chen to purchase the home. If Ms. Chen's employment terminates for any other reason before the expiration of the term (e.g., because of her death or disability or due to revocation of her gaming license), the option will terminate.
Cooperation Agreement
On August 3, 2018, the Company entered into a Cooperation Agreement (the "Cooperation Agreement") with Elaine P. Wynn regarding the composition of the Company’s Board of Directors and certain other matters, including, among other things, the appointment of Mr. Philip G. Satre to the Company's Board of Directors, standstill restrictions, releases, non-disparagement, reimbursement of expenses and the grant of certain complimentary privileges. The term of the Cooperation Agreement expires on the day after the conclusion of the 2020 annual meeting of the Company’s stockholders, unless earlier terminated pursuant to the circumstances described in the Cooperation Agreement.
Amounts Due to Officers, Directors and Former Directors
The Company periodically provides services to certain executive officers, directors or former directors of the Company, including the personal use of employees, construction work and other personal services, for which the officers, directors or former directors reimburse the Company. The Company requires prepayment for any such services, which amounts are replenished on an ongoing basis as needed. As of
December 31, 2018
, these net deposit balances with the Company were immaterial, as were the services provided. As of December 31, 2017, the officers and directors had a net deposit balance with the Company of
$0.4 million
.
Note 14 - Retail Joint Venture
In December 2016, the Company entered into the Retail Joint Venture with Crown to own and operate approximately
88,000
square feet of existing retail space at Wynn Las Vegas. In connection with the transaction, the Company transferred certain assets and liabilities with a net book value of
$31.8 million
associated with the existing Wynn Las Vegas retail stores from Wynn Las Vegas, LLC, to the Retail Joint Venture. The Company sold Crown a
49.9%
ownership interest in the Retail Joint Venture for consideration of
$292.0 million
, which consisted of
$217.0 million
in cash and a
$75.0 million
interest-free note that matured in full on January 3, 2018. As of December 31, 2017 and 2016, the present value of the note was
$75.0 million
included in prepaid expenses and other and
$72.5 million
included in other assets, respectively, on the Consolidated Balance Sheets. Wynn Las Vegas, LLC transferred all interests as lessor in third-party retail store leases to the Retail Joint Venture as part of the transaction and the majority of the retail stores previously operated by Wynn Las Vegas, LLC are now operated under a master lease agreement between a newly formed retail entity owned by Wynn Resorts, as lessee, and the Retail Joint Venture, as lessor. The Company maintains a
50.1%
ownership in the Retail Joint Venture and is the managing member.
In November 2017, the Company contributed approximately
74,000
square feet of additional retail space to the Retail Joint Venture. The Company opened the additional retail space during the fourth quarter of 2018. In connection with this transaction, the Company contributed certain assets with a net book value of
$25.4 million
, consisting primarily of construction in progress for the additional retail space, to the Retail Joint Venture, and received cash of
$180.0 million
from Crown. After this additional transaction, the Company maintains a
50.1%
ownership in the Retail Joint Venture and remains the managing member. The Company's responsibilities with respect to the Retail Joint Venture include day-to-day business operations, property management services and a role in the leasing decisions of the retail space.
The Company assessed its ownership in the Retail Joint Venture based on consolidation accounting guidance with an evaluation being performed to determine if the Retail Joint Venture is a VIE, if the Company has a variable interest in the Retail Joint Venture and if the Company is the primary beneficiary of the Retail Joint Venture. The primary beneficiary is the party who has the power to direct the activities of a VIE that most significantly impact the entity's economic performance and who has an obligation to absorb losses of the entity or a right to receive benefits from the entity that could potentially be significant to the entity.
The Company concluded that the Retail Joint Venture is a VIE and the Company is the primary beneficiary based on its involvement in the leasing activities of the Retail Joint Venture. As a result, the Company consolidates all of the Retail Joint Venture's assets, liabilities and results of operations. The Company will evaluate its primary beneficiary designation on an ongoing basis and will assess the appropriateness of the Retail Joint Venture's VIE status when changes occur.
As of
December 31, 2018
and
2017
, the Retail Joint Venture had total assets of
$85.0 million
and
$59.7 million
, respectively, and total liabilities of
$619.6 million
and
$0.9 million
, respectively. The Retail Joint Venture's total liabilities as of
December 31,
104
WYNN RESORTS, LIMITED AND SUBSIDIARIES
NOTES TO CONSOLIDATED FINANCIAL STATEMENTS (continued)
2018
included long-term debt of
$611.1 million
, net of debt issuance costs, related to the outstanding borrowings under the Retail Term Loan.
Note 15
- Commitments and Contingencies
Encore Boston Harbor Development
On April 28, 2017, Wynn MA, LLC ("Wynn MA"), an indirect wholly owned subsidiary of the Company, entered into an agreement concerning the construction of Encore Boston Harbor, which, among other things, confirmed the guaranteed maximum price for the construction work undertaken by the general contractor. The general contractor is obligated to substantially complete the project by
June 24, 2019
for a guaranteed maximum price of
$1.32 billion
. Both the contract time and guaranteed maximum price are subject to further adjustment under certain conditions. The performance of the general contractor is backed by a payment and performance bond in the amount of
$350.0 million
.
Wynn Las Vegas Meeting and Convention Expansion
Wynn Golf, LLC, a direct wholly owned subsidiary of the Company, entered into an agreement concerning the construction of approximately
430,000
square feet of additional meeting and convention space at Wynn Las Vegas, which, among other things, confirmed the guaranteed maximum price for the construction work undertaken by the general contractor. The general contractor is obligated to substantially complete the project by
December 19, 2019
for a guaranteed maximum price of
$286.8 million
. Both the contract time and guaranteed maximum price are subject to further adjustment under certain conditions.
Leases
Lessor Arrangements
The Company is the lessor under leases for retail space at its resorts. The lease agreements include minimum base rents with contingent rental clauses primarily based on percentage of net sales exceeding minimum base rents.
The following table presents the future minimum rentals to be received under the operating leases (in thousands):
|
Years Ending December 31,
|
|||
|
2019
|
$
|
132,249
|
|
|
2020
|
130,731
|
|
|
|
2021
|
69,272
|
|
|
|
2022
|
48,024
|
|
|
|
2023
|
29,784
|
|
|
|
Thereafter
|
79,868
|
|
|
|
Total future minimum rentals
|
$
|
489,928
|
|
The total future minimum rentals do not include contingent rentals. Contingent rentals were
$53.8 million
,
$38.6 million
and
$34.6 million
for the years ended
December 31, 2018
,
2017
and
2016
, respectively.
Lessee Arrangements
The Company is the lessee under leases for office space, warehouse facilities, certain office equipment and various parcels of land, including the land that Wynn Macau and Wynn Palace are built on. As of
December 31, 2018
, capital leases reflected in property and equipment, net on the Consolidated Balance Sheet were
$16.5 million
. The future minimum lease payments for capital leases are discounted to their present value in the table below and are included in other long-term liabilities on the Consolidated Balance Sheet.
105
WYNN RESORTS, LIMITED AND SUBSIDIARIES
NOTES TO CONSOLIDATED FINANCIAL STATEMENTS (continued)
As of
December 31, 2018
, the Company was obligated under non-cancelable leases to make future minimum lease payments as follows (in thousands):
|
Years Ending December 31,
|
Operating Leases
|
Capital Leases
|
|||||
|
2019
|
$
|
29,126
|
|
$
|
989
|
|
|
|
2020
|
20,153
|
|
989
|
|
|||
|
2021
|
17,226
|
|
989
|
|
|||
|
2022
|
16,466
|
|
989
|
|
|||
|
2023
|
15,868
|
|
989
|
|
|||
|
Thereafter
|
464,838
|
|
66,743
|
|
|||
|
Total minimum lease payments
|
563,677
|
|
71,688
|
|
|||
|
Less: Amount representing interest
|
—
|
|
(55,140
|
)
|
|||
|
$
|
563,677
|
|
$
|
16,548
|
|
||
Rent expense for the years ended
December 31, 2018
,
2017
and
2016
was
$27.1 million
,
$18.3 million
and
$17.9 million
, respectively.
Employment Agreements
The Company has entered into employment agreements with several executive officers, other members of management and certain key employees. These agreements generally have
three
to
five
year terms and typically indicate a base salary and often contain provisions for discretionary bonuses. Certain of the executives are also entitled to a separation payment if terminated without "cause" or upon voluntary termination of employment for "good reason" following a "change of control" (as these terms are defined in the employment contracts). As of
December 31, 2018
, the Company was obligated to make future payments of
$72.9 million
,
$49.0 million
,
$19.1 million
,
$2.9 million
and
$0.5 million
during the years ending December 31,
2019
,
2020
,
2021
,
2022
and
2023
, respectively.
Other Commitments
The Company has additional commitments for gaming tax payments in Macau and performance and other miscellaneous contracts. As of
December 31, 2018
, the Company was obligated under these arrangements, to make future minimum payments as follows (in thousands):
|
Years Ending December 31,
|
|||
|
2019
|
$
|
168,646
|
|
|
2020
|
80,548
|
|
|
|
2021
|
56,393
|
|
|
|
2022
|
27,088
|
|
|
|
2023
|
4,980
|
|
|
|
Thereafter
|
—
|
|
|
|
Total minimum payments
|
$
|
337,655
|
|
The above table does not include community payments associated with the continuing operations of Encore Boston Harbor, which commence upon the opening of the resort. These amounts are approximately
$10.6 million
per year with minimal annual increases.
Letters of Credit
As of
December 31, 2018
, the Company had outstanding letters of credit of
$17.7 million
.
106
WYNN RESORTS, LIMITED AND SUBSIDIARIES
NOTES TO CONSOLIDATED FINANCIAL STATEMENTS (continued)
Litigation
In addition to the actions noted below, the Company and its affiliates are involved in litigation arising in the normal course of business. In the opinion of management, such litigation is not expected to have a material effect on the Company's financial condition, results of operations and cash flows.
Determination of Unsuitability and Redemption of Aruze and Affiliates
On February 18, 2012, Wynn Resorts' Gaming Compliance Committee received an independent report by Freeh, Sporkin & Sullivan, LLP (the "Freeh Report") detailing a pattern of misconduct by the Okada Parties. Based on the findings in the Freeh Report, the Board of Directors of Wynn Resorts determined that the Okada Parties were "unsuitable persons" under Article VII of the Company's articles of incorporation. On that same day, Wynn Resorts redeemed and canceled Aruze's
24,549,222
shares of Wynn Resorts' common stock, and, pursuant to its articles of incorporation, Wynn Resorts issued the Redemption Note to Aruze in redemption of the shares.
Redemption Action and Counterclaim
On February 19, 2012, Wynn Resorts filed a complaint in the Eighth Judicial District Court, Clark County, Nevada against the Okada Parties, alleging breaches of fiduciary duty and related claims (the "Redemption Action") arising from the activities addressed in the Freeh Report. The Company sought compensatory and special damages as well as a declaration that it acted lawfully and in full compliance with its articles of incorporation, bylaws and other governing documents in redeeming and canceling the shares of Aruze.
On March 12, 2012, the Okada Parties filed an answer denying the claims and a counterclaim purporting to assert claims against the Company, certain individuals who were members of the Company's Board of Directors (other than Mr. Okada) and Wynn Resorts' former General Counsel, Kimmarie Sinatra ("Ms. Sinatra"), related to the redemption, the determination of fair value of the redeemed shares and rescission of the Amended and Restated Stockholders Agreement, dated as of January 6, 2010, by and among Aruze, Mr. Wynn, and Elaine P. Wynn (the "Stockholders Agreement").
On March 8, 2018, the Company entered into the Settlement Agreement by and between the Company, Mr. Wynn, Linda Chen, Russell Goldsmith, Ray R. Irani, Robert J. Miller, John A. Moran, Marc D. Schorr, Alvin V. Shoemaker, D. Boone Wayson, Allan Zeman, and Ms. Sinatra (collectively, the "Wynn Parties"), and Universal Entertainment Corp. and Aruze (collectively with Universal Entertainment Corp., the "Universal Parties"). The Settlement Agreement resolved legal proceedings pending between the settling parties in the Redemption Action as well as other claims. Pursuant to the Settlement Agreement, the Company paid the principal amount of the
$1.94 billion
Redemption Note on March 30, 2018. On March 30, 2018, the Company also paid an additional
$463.6 million
with respect to the Universal Parties’ claims related to the allegedly below-market interest rate of the Redemption Note and stipulated to the release to Aruze of
$232.4 million
in accrued interest held in escrow. The Company recorded the
$463.6 million
as a litigation settlement expense on the Consolidated Statements of Income. Under the Settlement Agreement, the Wynn Parties and the Universal Parties mutually agreed to unconditionally release all claims against each other relating to or arising out of the Redemption Action, as well as any claims which relate to or arise out of any other litigation or claims in any other jurisdiction. As a result, the Universal Parties will not claim that Aruze remains a party to the Stockholders Agreement. The Universal Parties further released any claims against the Wynn Parties and their affiliates in any other jurisdiction, including but not limited to the proceeding pending in Macau against Wynn Resorts (Macau) S.A. and certain related individuals ("Macau Litigation"). As a result of the Settlement Agreement, the parties to the agreement dismissed all litigation between the Universal Parties and the Company and its then-directors and executives with respect to the redemption, including the Redemption Action and the Macau Litigation, but the Settlement Agreement did not release claims against any parties to such litigation who are not parties to the Settlement Agreement, including but not limited to Kazuo Okada and Elaine P. Wynn.
On March 12, 2018, the Company voluntarily dismissed its claim for breach of fiduciary duty against Kazuo Okada, which was the last and only remaining claim between Wynn Resorts, Kazuo Okada, and the Universal Parties in the Redemption Action.
On June 19, 2012, Elaine P. Wynn asserted in the Redemption Action a cross claim against Mr. Wynn and a counterclaim against Aruze seeking a declaration that, among other things, the Stockholders Agreement should be rescinded given the redemption of Aruze’s shares. On March 28, 2016, Elaine P Wynn filed an amended cross claim against Mr. Wynn, as well as Wynn Resorts and Wynn Resorts' former General Counsel (together with Mr. Wynn, the "Wynn Cross Defendants") as cross defendants, which repeated her earlier allegations and further alleged that Mr. Wynn engaged in acts of misconduct that, with the Wynn Cross
107
WYNN RESORTS, LIMITED AND SUBSIDIARIES
NOTES TO CONSOLIDATED FINANCIAL STATEMENTS (continued)
Defendants, resulted in Mr. Wynn allegedly breaching the Stockholders Agreement and violating alleged duties under the Stockholders Agreement by preventing Elaine P. Wynn from being nominated and elected to serve as one of Wynn Resorts' directors.
On March 14, 2018, Mr. Wynn and Elaine P. Wynn entered into a stipulation declaring the Stockholders Agreement invalid and unenforceable, and on April 16, 2018, the Company entered into a Settlement Agreement and Mutual Release by and between the Company, Mr. Wynn, Elaine P. Wynn, and the Company’s former General Counsel, which, among other things, resolved and unconditionally released the parties from all claims and cross claims asserted among the parties in a legal proceeding involving the Stockholders Agreement. Neither the Company nor the Company’s former General Counsel made any payment under the terms of such settlement agreement.
Litigation Commenced by Kazuo Okada
On July 3, 2015, WML announced that the Okada Parties filed a complaint in the Court of First Instance of Macau ("Macau Court") against Wynn Macau SA and certain individuals who are or were directors of Wynn Macau SA and or WML (collectively, the "Wynn Macau Parties"). The principal allegations in the lawsuit are that the redemption of the Okada Parties' shares in Wynn Resorts was improper and undervalued, that the previously disclosed payment by Wynn Macau SA to an unrelated third party in consideration of relinquishment by that party of certain rights in and to any future development on the land in Cotai where Wynn Palace is located was unlawful and that the previously disclosed donation by Wynn Resorts to the University of Macau Development Foundation was unlawful. The plaintiffs sought dissolution of Wynn Macau SA and compensatory damages. On July 11, 2017, the Macau Court dismissed all claims by the Okada Parties as unfounded, fined the Okada Parties, and ordered the Okada Parties to pay for court costs and the Wynn Macau Parties' attorney's fees. On or about October 16, 2017, the Okada Parties filed formal appeal papers in Macau, which Wynn Macau SA received on November 21, 2017. Wynn Macau SA filed its response on December 21, 2017. In March 2018, pursuant to the Settlement Agreement, the Universal Parties voluntarily withdrew from the Macau Litigation, leaving Mr. Okada as the sole claimant. On February 21, 2019, the Macau Appellate Panel rejected Mr. Okada's appeal.
Derivative Litigation Related to Redemption Action
Two
state derivative actions were commenced against the Company and all members of its Board of Directors in the Eighth Judicial District Court of Clark County, Nevada. These state court actions brought by the following plaintiffs have been consolidated: (1) IBEW Local 98 Pension Fund and (2) Danny Hinson (collectively, the "Derivative Plaintiffs"). The Derivative Plaintiffs filed a consolidated complaint on July 20, 2012 asserting claims for (1) breach of fiduciary duty; (2) abuse of control; (3) gross mismanagement; and (4) unjust enrichment. The claims are against the Company and all Company directors during the applicable period, including Mr. Okada, as well as the Company's Chief Financial Officer who signed financial disclosures filed with the SEC during the applicable periods. The Derivative Plaintiffs claim that the individual defendants failed to disclose to the Company's stockholders the investigation into, and the dispute with director Okada as well as the alleged potential violations of the FCPA related to, the University of Macau Development Foundation donation. The Derivative Plaintiffs seek unspecified monetary damages (compensatory and punitive), disgorgement, reformation of corporate governance procedures, an order directing the Company to internally investigate the donation, as well as attorney's fees and costs. On June 18, 2014, the court entered a stipulation between the parties that provides for a stay of the action and directs the parties, within 45 days of the conclusion of the Redemption Action, to discuss how the derivative action should proceed and to file a joint report with the court. In May 2018, the parties (except Elaine P. Wynn) filed a joint report given the conclusion of the Redemption Action. On May 14, 2018, the court extended the stay of the case due to plaintiff Danny Hinson’s claim that he intended to send a demand letter to the Company. On May 30, 2018, plaintiff Danny Hinson sent a demand letter to the Company requesting the Board to investigate the University of Macau Development Foundation donation, the removal of Mr. Okada from the Board and the terms of the Redemption Note. On January 3, 2019, the Company responded to Mr. Hinson, explaining that after investigating the allegations contained in his demand letter, which were previously investigated in response to a prior separate demand the Company received in December 2014, the Board determined that pursuing any such litigation would not be in the best interests of the Company or its shareholders.
Management has determined that based on proceedings to date, it is currently unable to determine the probability of the outcome of these actions or the range of reasonably possible loss, if any.
Massachusetts Gaming License Related Actions
On September 17, 2014, the Massachusetts Gaming Commission ("MGC") designated Wynn MA the award winner of the Greater Boston (Region A) gaming license. On November 7, 2014, the gaming license became effective.
108
WYNN RESORTS, LIMITED AND SUBSIDIARIES
NOTES TO CONSOLIDATED FINANCIAL STATEMENTS (continued)
Suffolk Action:
On September 17, 2018, Sterling Suffolk Racecourse, LLC, owner of the property proposed for location of a casino by an unsuccessful bidder for the Greater Boston (Region) A gaming license filed a complaint in the United States District Court, District of Massachusetts, against Wynn Resorts, Wynn MA, certain current and former officers of Wynn Resorts, FBT Everett Realty, LLC, former owner of the land on which Encore Boston Harbor is located (“FBT”) and Paul Lohnes, a member of FBT. The complaint alleges, among other things, the defendants engaged in conduct in violation of the Racketeer Influenced Corrupt Organizations Act (“RICO”), conspired to circumvent the application process for the Greater Boston (Region A) gaming license and violated Massachusetts law with respect to unfair methods of competition. The plaintiff seeks
$1 billion
in compensatory damages and treble damages pursuant to applicable law. All defendants filed motions to dismiss the complaint, and several separately filed special motions to dismiss pursuant to the Massachusetts Anti-SLAPP statute. In response to the various dispositive motions, on February 15, 2019, the plaintiff filed an amended complaint that substantially repeats its earlier allegations and adds new allegations in support of its existing claims against the defendants.
The Company will vigorously defend against the claims asserted. This action is in preliminary stages and management has determined that based on proceedings to date, it is currently unable to determine the probability of the outcome of this action or the range of reasonably possible loss, if any.
Revere Action:
On October 16, 2014, the City of Revere, the host community to the unsuccessful bidder for the same license, and the International Brotherhood of Electrical Workers, Local 103 ("IBEW") filed a complaint against the MGC and each of the five gaming commissioners in Suffolk Superior Court in Boston, Massachusetts (the "Revere Action"). The complaint challenges the MGC's decision and alleges that the MGC failed to follow statutory requirements outlined in the Gaming Act. The complaint (1) seeks to appeal the administrative decision, (2) asserts that certiorari provides a remedy to correct errors in proceedings by an agency such as the MGC, (3) challenges the constitutionality of that section of the gaming law which bars judicial review of the MGC's decision to deny an applicant a gaming license, and (4) alleges violations of the open meeting law requirements. The court allowed Mohegan Sun ("Mohegan"), the other applicant for the Greater Boston (Region A) gaming license, to intervene in the Revere Action, and on February 23, 2015, Mohegan filed its complaint. The Mohegan complaint challenges the license award to Wynn MA, seeks judicial review of the MGC's decision, and seeks to vacate the MGC's license award to Wynn MA.
On July 1, 2015, the MGC filed motions to dismiss Mohegan's and the City of Revere's complaints. On December 3, 2015, the court granted the motion to dismiss the claims asserted in the Revere Action. Also on December 3, 2015, the court granted the motion to dismiss three of the four counts asserted by Mohegan but denied the motion as to Mohegan's certiorari claim. The City of Revere and IBEW sought immediate appellate review of the dismissal of their claims and the MGC requested immediate appellate review of the court's denial of the MGC's motion to dismiss Mohegan's certiorari claim. All three petitions for interlocutory review were denied. The parties then appealed to the Massachusetts Supreme Judicial Court ("SJC"). On March 10, 2017, the SJC affirmed the trial court's dismissal of the City of Revere's claims and IBEW's claims. The SJC affirmed the court's dismissal of Mohegan's claims except for the certiorari claim, which the SJC remanded to the Suffolk Superior Court. Mohegan filed a motion for judgment on the pleadings on November 3, 2017, and oral argument will be re-scheduled from its originally scheduled date of April 5, 2018.
The SJC reversed the trial court's dismissal of the individual plaintiffs' open meeting law claim and remanded that claim to the Suffolk Superior Court. The parties are currently in the discovery phase. The MGC has filed a motion for summary judgment and oral argument is scheduled for March 29, 2019.
Wynn MA was not named in the Revere Action. The MGC retained private legal representation at its own nontaxpayer-funded expense.
Actions Related to Mr. Wynn
Investigations:
On January 26, 2018, the Company's Board of Directors formed a Special Committee comprised solely of independent directors to investigate allegations of inappropriate personal conduct by Mr. Wynn in the workplace. On February 12, 2018, the Special Committee amended and restated its charter to provide for a review of various governance issues regarding knowledge of the allegations and a comprehensive review of the Company's internal policies and procedures with the goal of employing best practices to maintain a safe and respectful workplace for all employees. On August 3, 2018, the Board received an oral final
109
WYNN RESORTS, LIMITED AND SUBSIDIARIES
NOTES TO CONSOLIDATED FINANCIAL STATEMENTS (continued)
presentation from the Special Committee. The Special Committee provided a written memorialization of its investigation to the Company's gaming regulators in Massachusetts and Nevada, which have been investigating these matters, including suitability with respect to the Company and its related licensees, and the Company is cooperating with these regulatory reviews.
On January 25, 2019, the Nevada Gaming Control Board completed its investigation which commenced in 2018 and filed a complaint against the Company and its indirect subsidiary, Wynn Las Vegas, LLC (“NGCB Respondents”). Also on January 25, 2019, the NGCB Respondents entered into a Stipulation for Settlement with the Nevada Gaming Control Board in connection with its complaint, under which, among other things, the NGCB Respondents agreed to pay a fine in an amount to be determined by the Nevada Gaming Commission, and the Nevada Gaming Control Board agreed not to seek to revoke or limit the NGCB Respondents’ licenses, findings of suitability or any other approvals of the Nevada Gaming Commission. On February 26, 2019, the Nevada Gaming Commission approved the Stipulation for Settlement and fined the Company
$20.0 million
, which is included in other accrued liabilities as of December 31, 2018 on the accompanying Consolidated Balance Sheet.
On January 31, 2018, the Investigations & Enforcement Bureau (“IEB”) of the Massachusetts Gaming Commission announced it had commenced an investigation into the Company’s ongoing suitability as a gaming licensee in that jurisdiction. The Company has fully cooperated with the IEB’s investigation, and is awaiting the completion of the IEB’s investigation and scheduling of an adjudicatory hearing before the Massachusetts Gaming Commission.
Derivative Litigation:
A number of stockholder derivative actions have been filed purportedly on behalf of the Company in state and federal court located in Clark County, Nevada against certain current and former members of the Company’s Board of Directors and, in some cases, the Company’s current and former officers. Each of the complaints alleges, among other things, breach of fiduciary duties in failing to detect, prevent and remedy alleged inappropriate personal conduct by Mr. Wynn in the workplace. On September 19, 2018, the Board established a Special Litigation Committee (the “SLC”) to investigate the allegations in the State Derivative Case (as defined below).
The actions filed in the Eighth Judicial District Court of Clark County, Nevada have been consolidated as
In re Wynn Resorts, Ltd. Derivative Litigation
(“State Derivative Case”). In September 2018, the court denied the Company’s motion to dismiss, and the Company filed a writ petition appealing the denial to the Nevada Supreme Court. In October 2018, the Nevada Supreme Court denied the Company’s writ petition. On October 26, 2018, the SLC filed a motion to intervene and stay the case pending completion of its investigation. On November 14, 2018, the court granted the SLC’s motion and stayed the case, with the exception of limited document requests, for a period of 120 days. The SLC’s investigation is ongoing.
The actions filed in the United States District Court, District of Nevada have been consolidated as
In re Wynn Resorts, Ltd. Derivative Litigation
(“Federal Derivative Case”), which also claim corporate waste and violation of Section 14(a) of the Exchange Act. In June 2018, the Company filed a motion to dismiss and a motion to stay pending resolution of the Securities Action. The motions are fully-briefed and awaiting a decision from the court.
Each of the actions seeks to recover for the Company unspecified damages, including restitution and disgorgement of profits, and also seeks to recover attorneys’ fees, costs and related expenses for the plaintiff. Additional demands have been made to the Company that it commence similar actions and additional lawsuits may be filed in the future.
Securities Action:
On February 20, 2018, a putative securities class action was filed against the Company and certain current and former officers of the Company in the United States District Court, Southern District of New York (which was subsequently transferred to the United States District Court, District of Nevada) by John V. Ferris and Joann M. Ferris on behalf of all persons who purchased the Company's common stock between February 28, 2014 and January 25, 2018. The complaint alleges, among other things, certain violations of federal securities laws and seeks to recover unspecified damages as well as attorneys' fees, costs and related expenses for the plaintiffs. The Company is awaiting the lead plaintiffs’ filing of an amended complaint.
The defendants in these actions will vigorously defend against the claims pleaded against them. These actions are in preliminary stages and management has determined that based on proceedings to date, it is currently unable to determine the probability of the outcome of these actions or the range of reasonably possible loss, if any.
110
WYNN RESORTS, LIMITED AND SUBSIDIARIES
NOTES TO CONSOLIDATED FINANCIAL STATEMENTS (continued)
Note 16
- Segment Information
The Company reviews the results of operations for each of its operating segments. Wynn Macau and Encore, an expansion at Wynn Macau, are managed as a single integrated resort and have been aggregated as
one
reportable segment ("Wynn Macau"). Wynn Palace is presented as a separate reportable segment and is combined with Wynn Macau for geographical presentation. Wynn Las Vegas, Encore, an expansion at Wynn Las Vegas, and the Retail Joint Venture are managed as a single integrated resort and have been aggregated as
one
reportable segment ("Las Vegas Operations"). The Company identifies each resort as a reportable segment considering operations within each resort have similar economic characteristics, type of customers, types of services and products, the regulatory environment of the operations and the Company's organizational and management reporting structure.
The Company also reviews construction and development activities for each of its projects under development, in addition to its reportable segments. The Company separately identifies capital expenditures and assets for its Encore Boston Harbor development project. Other Macau primarily represents the Company's Macau holding company.
111
WYNN RESORTS, LIMITED AND SUBSIDIARIES
NOTES TO CONSOLIDATED FINANCIAL STATEMENTS (continued)
The following tables present the Company's segment information (in thousands):
|
Years Ended December 31,
|
|||||||||||
|
2018
|
2017
|
2016
|
|||||||||
|
Operating revenues
|
|||||||||||
|
Macau Operations:
|
|||||||||||
|
Wynn Palace
|
$
|
2,757,566
|
|
$
|
2,030,287
|
|
$
|
555,574
|
|
||
|
Wynn Macau
|
2,294,525
|
|
2,336,910
|
|
2,150,721
|
|
|||||
|
Total Macau Operations
|
5,052,091
|
|
4,367,197
|
|
2,706,295
|
|
|||||
|
Las Vegas Operations
|
1,665,569
|
|
1,702,963
|
|
1,639,502
|
|
|||||
|
Total
|
$
|
6,717,660
|
|
$
|
6,070,160
|
|
$
|
4,345,797
|
|
||
|
Adjusted Property EBITDA
(1)
|
|||||||||||
|
Macau Operations:
|
|||||||||||
|
Wynn Palace
|
$
|
843,902
|
|
$
|
527,583
|
|
$
|
103,036
|
|
||
|
Wynn Macau
|
733,238
|
|
760,752
|
|
681,509
|
|
|||||
|
Total Macau Operations
|
1,577,140
|
|
1,288,335
|
|
784,545
|
|
|||||
|
Las Vegas Operations
|
467,273
|
|
522,397
|
|
474,782
|
|
|||||
|
Total
|
2,044,413
|
|
1,810,732
|
|
1,259,327
|
|
|||||
|
Other operating expenses
|
|||||||||||
|
Litigation settlement
|
463,557
|
|
—
|
|
—
|
|
|||||
|
Pre-opening
|
53,490
|
|
26,692
|
|
154,717
|
|
|||||
|
Depreciation and amortization
|
550,596
|
|
552,368
|
|
404,730
|
|
|||||
|
Property charges and other
|
60,256
|
|
29,576
|
|
54,822
|
|
|||||
|
Corporate expenses and other
|
144,479
|
|
102,560
|
|
80,178
|
|
|||||
|
Stock-based compensation
(2)
|
36,491
|
|
43,971
|
|
43,218
|
|
|||||
|
Total other operating expenses
|
1,308,869
|
|
755,167
|
|
737,665
|
|
|||||
|
Operating income
|
735,544
|
|
1,055,565
|
|
521,662
|
|
|||||
|
Other non-operating income and expenses
|
|||||||||||
|
Interest income
|
29,866
|
|
31,193
|
|
13,536
|
|
|||||
|
Interest expense, net of amounts capitalized
|
(381,849
|
)
|
(388,664
|
)
|
(289,365
|
)
|
|||||
|
Change in derivatives fair value
|
(4,520
|
)
|
(1,056
|
)
|
433
|
|
|||||
|
Change in Redemption Note fair value
|
(69,331
|
)
|
(59,700
|
)
|
65,043
|
|
|||||
|
Gain (loss) on extinguishment of debt
|
104
|
|
(55,360
|
)
|
—
|
|
|||||
|
Other
|
(4,074
|
)
|
(21,709
|
)
|
(712
|
)
|
|||||
|
Total other non-operating income and expenses
|
(429,804
|
)
|
(495,296
|
)
|
(211,065
|
)
|
|||||
|
Income before income taxes
|
305,740
|
|
560,269
|
|
310,597
|
|
|||||
|
Benefit (provision) for income taxes
|
497,344
|
|
328,985
|
|
(8,128
|
)
|
|||||
|
Net income
|
803,084
|
|
889,254
|
|
302,469
|
|
|||||
|
Net income attributable to noncontrolling interests
|
(230,654
|
)
|
(142,073
|
)
|
(60,494
|
)
|
|||||
|
Net income attributable to Wynn Resorts, Limited
|
$
|
572,430
|
|
$
|
747,181
|
|
$
|
241,975
|
|
||
112
WYNN RESORTS, LIMITED AND SUBSIDIARIES
NOTES TO CONSOLIDATED FINANCIAL STATEMENTS (continued)
|
(1)
|
"Adjusted Property EBITDA" is net income before interest, income taxes, depreciation and amortization, litigation settlement expense, pre-opening expenses, property charges and other, management and license fees, corporate expenses and other (including intercompany golf course and water rights leases), stock-based compensation, gain (loss) on extinguishment of debt, change in derivatives fair value, change in Redemption Note fair value and other non-operating income and expenses. Adjusted Property EBITDA is presented exclusively as a supplemental disclosure because management believes that it is widely used to measure the performance, and as a basis for valuation, of gaming companies. Management uses Adjusted Property EBITDA as a measure of the operating performance of its segments and to compare the operating performance of its properties with those of its competitors, as well as a basis for determining certain incentive compensation. The Company also presents Adjusted Property EBITDA because it is used by some investors as a way to measure a company's ability to incur and service debt, make capital expenditures and meet working capital requirements. Gaming companies have historically reported EBITDA as a supplement to GAAP. In order to view the operations of their casinos on a more stand-alone basis, gaming companies, including us, have historically excluded from their EBITDA calculations pre-opening expenses, property charges, corporate expenses and stock-based compensation, that do not relate to the management of specific casino properties. However, Adjusted Property EBITDA should not be considered as an alternative to operating income as an indicator of the Company's performance, as an alternative to cash flows from operating activities as a measure of liquidity, or as an alternative to any other measure determined in accordance with GAAP. Unlike net income, Adjusted Property EBITDA does not include depreciation or interest expense and therefore does not reflect current or future capital expenditures or the cost of capital. The Company has significant uses of cash flows, including capital expenditures, interest payments, debt principal repayments, income taxes and other non-recurring charges, which are not reflected in Adjusted Property EBITDA. Also, Wynn Resorts' calculation of Adjusted Property EBITDA may be different from the calculation methods used by other companies and, therefore, comparability may be limited.
|
|
(2)
|
Excludes
$0.7 million
and
$0.5 million
included in pre-opening expenses, respectively, for the year ended December 31, 2018 and 2016. Pre-opening expenses did
no
t include any stock-based compensation during 2017. Excludes a credit of
$2.2 million
included in property charges and other expenses in 2018.
|
113
WYNN RESORTS, LIMITED AND SUBSIDIARIES
NOTES TO CONSOLIDATED FINANCIAL STATEMENTS (continued)
|
Years ended December 31,
|
|||||||||||
|
2018
|
2017
|
2016
|
|||||||||
|
Capital expenditures
|
|||||||||||
|
Macau Operations:
|
|||||||||||
|
Wynn Palace
|
$
|
89,617
|
|
$
|
107,405
|
|
$
|
838,271
|
|
||
|
Wynn Macau
|
62,542
|
|
43,510
|
|
43,548
|
|
|||||
|
Total Macau Operations
|
152,159
|
|
150,915
|
|
881,819
|
|
|||||
|
Las Vegas Operations
|
73,029
|
|
139,893
|
|
106,373
|
|
|||||
|
Encore Boston Harbor
|
791,250
|
|
572,825
|
|
212,197
|
|
|||||
|
Corporate and other
|
459,534
|
|
71,841
|
|
25,554
|
|
|||||
|
$
|
1,475,972
|
|
$
|
935,474
|
|
$
|
1,225,943
|
|
|||
|
December 31,
|
|||||||||||
|
2018
|
2017
|
2016
|
|||||||||
|
Assets
|
|||||||||||
|
Macau Operations:
|
|||||||||||
|
Wynn Palace
|
$
|
3,858,904
|
|
$
|
4,017,494
|
|
$
|
4,317,458
|
|
||
|
Wynn Macau
|
1,903,921
|
|
1,271,544
|
|
1,161,670
|
|
|||||
|
Other Macau
|
68,487
|
|
174,769
|
|
28,927
|
|
|||||
|
Total Macau Operations
|
5,831,312
|
|
5,463,807
|
|
5,508,055
|
|
|||||
|
Las Vegas Operations
|
2,792,508
|
|
3,266,390
|
|
3,275,780
|
|
|||||
|
Encore Boston Harbor
|
1,865,286
|
|
1,060,530
|
|
419,001
|
|
|||||
|
Corporate and other
|
2,727,163
|
|
2,891,012
|
|
2,750,721
|
|
|||||
|
$
|
13,216,269
|
|
$
|
12,681,739
|
|
$
|
11,953,557
|
|
|||
|
December 31,
|
|||||||||||
|
2018
|
2017
|
2016
|
|||||||||
|
Long-lived assets
|
|||||||||||
|
Macau
|
$
|
4,387,051
|
|
$
|
4,613,950
|
|
$
|
4,973,854
|
|
||
|
United States
|
5,166,537
|
|
4,083,555
|
|
3,442,842
|
|
|||||
|
$
|
9,553,588
|
|
$
|
8,697,505
|
|
$
|
8,416,696
|
|
|||
114
WYNN RESORTS, LIMITED AND SUBSIDIARIES
NOTES TO CONSOLIDATED FINANCIAL STATEMENTS (continued)
Quarterly Consolidated Financial Information (Unaudited)
The following tables (in thousands, except per share data) present selected quarterly financial information for
2018
and
2017
, as previously reported. Because income (loss) per share amounts are calculated using the weighted average number of common and dilutive common equivalent shares outstanding during each quarter, the sum of the per share amounts for the four quarters may not equal the total income per share amounts for the year.
|
Year Ended December 31, 2018
|
|||||||||||||||||||
|
First (1)
|
Second
|
Third
|
Fourth (2)
|
Year
|
|||||||||||||||
|
Operating revenues
|
$
|
1,715,578
|
|
$
|
1,605,424
|
|
$
|
1,709,072
|
|
$
|
1,687,586
|
|
$
|
6,717,660
|
|
||||
|
Operating income (loss)
|
$
|
(81,294
|
)
|
$
|
279,572
|
|
$
|
290,983
|
|
$
|
246,283
|
|
$
|
735,544
|
|
||||
|
Net income (loss)
|
$
|
(137,478
|
)
|
$
|
205,280
|
|
$
|
219,772
|
|
$
|
515,510
|
|
$
|
803,084
|
|
||||
|
Net income (loss) attributable to Wynn Resorts, Limited
|
$
|
(204,307
|
)
|
$
|
155,756
|
|
$
|
156,115
|
|
$
|
464,866
|
|
$
|
572,430
|
|
||||
|
Basic income (loss) per share
|
$
|
(1.99
|
)
|
$
|
1.44
|
|
$
|
1.44
|
|
$
|
4.32
|
|
$
|
5.37
|
|
||||
|
Diluted income (loss) per share
|
$
|
(1.99
|
)
|
$
|
1.44
|
|
$
|
1.44
|
|
$
|
4.31
|
|
$
|
5.35
|
|
||||
|
Year Ended December 31, 2017
|
|||||||||||||||||||
|
First
|
Second
|
Third
|
Fourth (3)
|
Year
|
|||||||||||||||
|
(as adjusted)
|
(as adjusted)
|
(as adjusted)
|
(as adjusted)
|
(as adjusted)
|
|||||||||||||||
|
Operating revenues
|
$
|
1,423,757
|
|
$
|
1,472,892
|
|
$
|
1,551,347
|
|
$
|
1,622,164
|
|
$
|
6,070,160
|
|
||||
|
Operating income
|
$
|
249,930
|
|
$
|
246,889
|
|
$
|
257,327
|
|
$
|
301,419
|
|
$
|
1,055,565
|
|
||||
|
Net income
|
$
|
132,525
|
|
$
|
106,796
|
|
$
|
105,969
|
|
$
|
543,964
|
|
$
|
889,254
|
|
||||
|
Net income attributable to Wynn Resorts, Limited
|
$
|
100,816
|
|
$
|
74,916
|
|
$
|
79,767
|
|
$
|
491,682
|
|
$
|
747,181
|
|
||||
|
Basic income per share
|
$
|
0.99
|
|
$
|
0.73
|
|
$
|
0.78
|
|
$
|
4.80
|
|
$
|
7.32
|
|
||||
|
Diluted income per share
|
$
|
0.99
|
|
$
|
0.73
|
|
$
|
0.78
|
|
$
|
4.77
|
|
$
|
7.28
|
|
||||
(1) During the first quarter of 2018, the Company incurred a litigation settlement expense totaling $463.6 million. See Item 8—"Financial Statements and Supplementary Data,"
Note 15
, "
Commitments and Contingencies
."
(2) During the fourth quarter of 2018, the Company finalized its analysis of U.S. tax reform and recorded an income tax benefit of $390.9 million, incremental to the provisional income tax benefit recorded during the fourth quarter of 2017. See Item 8—"Financial Statements and Supplementary Data,"
Note 12
, "Income Taxes."
(3) During the fourth quarter of 2017, the Company recorded a provisional income tax benefit of
$339.9 million
related to the enactment of U.S. tax reform. See Item 8—"Financial Statements and Supplementary Data,"
Note 12
, "Income Taxes."
115
Item 9. Changes in and Disagreements with Accountants on Accounting and Financial Disclosure
None.
Item 9A. Controls and Procedures
Disclosure Controls and Procedures
The Company's management, with the participation of the Company's Chief Executive Officer ("CEO") and Chief Financial Officer ("CFO"), has evaluated the effectiveness of the Company's disclosure controls and procedures (as such term is defined in Rules 13a-15(e) and 15d-15(e) under the Securities Exchange Act of 1934, as amended (the "Exchange Act")) as of the end of the period covered by this annual report. Based on such evaluation, the CEO and CFO have concluded that, as of
December 31, 2018
, the Company's disclosure controls and procedures are effective as of the end of the period covered by this annual report.
Management's Report on Internal Control Over Financial Reporting
Management of the Company is responsible for establishing and maintaining adequate internal control over financial reporting, as defined in Rule 13a-15(f) and 15d-15(f) under the Exchange Act.
Because of its inherent limitations, internal control over financial reporting may not prevent or detect misstatements. Also, projections of any evaluation of effectiveness to future periods are subject to the risks that controls may become inadequate because of changes in conditions, or that the degree of compliance with the policies or procedures may deteriorate. Management assessed the effectiveness of the Company's internal control over financial reporting as of
December 31, 2018
. In making this assessment, management used the criteria set forth by the Committee of Sponsoring Organizations of the Treadway Commission ("COSO") in
Internal Control-Integrated Framework
(2013). Based on our assessment, management believes that, as of
December 31, 2018
, our internal control over financial reporting was effective based on those criteria.
The effectiveness of our internal control over financial reporting as of
December 31, 2018
has been audited by Ernst & Young, LLP, an independent registered public accounting firm. Their report appears under "Report of Independent Registered Public Accounting Firm on Internal Control Over Financial Reporting."
Changes in Internal Control Over Financial Reporting
There were no changes in our internal control over financial reporting during the quarter ended
December 31, 2018
that have materially affected, or are reasonably likely to materially affect, our internal control over financial reporting.
Item 9B. Other Information
None.
116
PART III
Item 10. Directors, Executive Officers and Corporate Governance
The information required by this item will be contained in the Registrant's definitive Proxy Statement for its
2019
Annual Stockholder Meeting to be filed with the Securities and Exchange Commission within 120 days after
December 31, 2018
(the "
2019
Proxy Statement") under the captions "Election of Directors," "Executive Officers," "Board Governance" and "Section 16(a) Beneficial Ownership Reporting Compliance," and is incorporated herein by reference.
As part of the Company's commitment to integrity, the Board of Directors has adopted a Code of Business Conduct and Ethics applicable to all directors, officers and employees of the Company and its subsidiaries. This Code is periodically reviewed by the Board of Directors. In the event we determine to amend or waive certain provisions of this code of ethics, we intend to disclose such amendments or waivers on our website at https://wynnresortslimited.gcs-web.com/corporate-governance/code-business-conduct-and-ethics within four business days following such amendment or waiver or as otherwise required by the Nasdaq listing standards.
Item 11. Executive Compensation
The information called for by this item is incorporated herein by reference to our definitive
2019
Proxy Statement under the captions "Board Compensation," "Compensation Discussion and Analysis" and "Executive Compensation Tables", which will be filed with the SEC.
Item 12. Security Ownership of Certain Beneficial Owners and Management and Related Stockholder Matters
Securities Authorized for Issuance Under Equity Compensation Plans
The following table summarizes compensation plans under which our equity securities are authorized for issuance, aggregated as to: (i) all compensation plans previously approved by stockholders, and (ii) all compensation plans not previously approved by stockholders. These plans are described in
Item 8
—"
Financial Statements and Supplementary Data
" of Part II (see Notes to Consolidated Financial Statements).
|
Plan Category
|
Number of
Securities to
be Issued
Upon
Exercise of
Outstanding
Options,
Warrants
and Rights
(a)
|
Weighted-
Average
Exercise
Price of
Outstanding
Options,
Warrants
and Rights
(b)
|
Number of
Securities
Remaining
Available for
Future
Issuance
Under Equity
Compensation
Plans
(excluding
securities
reflected in
column (a))
(c)
|
||||||
|
Equity compensation plans approved by security holders
|
345,790
|
|
$
|
60.99
|
|
3,041,051
|
|
||
|
Equity compensation plans not approved by security holders
|
—
|
|
—
|
|
—
|
|
|||
|
Total
|
345,790
|
|
$
|
60.99
|
|
3,041,051
|
|
||
Certain information required by this item will be contained in the
2019
Proxy Statement under the caption "Certain Beneficial Ownership and Management," and is incorporated herein by reference.
Item 13. Certain Relationships and Related Transactions, and Director Independence
The information called for by this item is incorporated herein by reference to our definitive
2019
Proxy Statement under the caption "Certain Relationships and Related Transactions," and "Board Governance," which will be filed with the SEC.
Item 14. Principal Accountant Fees and Services
The information called for by this item is incorporated herein by reference to our definitive
2019
Proxy Statement under the caption "Ratification of Appointment of Independent Auditors," which will be filed with the SEC.
117
PART IV
Item 15. Exhibits, Financial Statement Schedules
(a)1. The following consolidated financial statements of the Company are filed as part of this report under
Item 8
—"
Financial Statements and Supplementary Data
."
|
•
|
Reports of Independent Registered Public Accounting Firm
|
|
•
|
Consolidated Balance Sheets as of
December 31, 2018
and
2017
|
|
•
|
Consolidated Statements of Income for the years ended
December 31, 2018
,
2017
and
2016
|
|
•
|
Consolidated Statements of Comprehensive Income for the years ended
December 31, 2018
,
2017
and
2016
|
|
•
|
Consolidated Statements of Stockholders' Equity for the years ended
December 31, 2018
,
2017
and
2016
|
|
•
|
Consolidated Statements of Cash Flows for the years ended
December 31, 2018
,
2017
and
2016
|
|
•
|
Notes to Consolidated Financial Statements
|
|
•
|
Quarterly Consolidated Financial Information (Unaudited)
|
(a)2. Financial Statement Schedule filed in Part IV of this report:
|
•
|
Schedule II—Valuation and Qualifying Accounts
|
We have omitted all other financial statement schedules because they are not required or are not applicable, or the required information is shown in the consolidated financial statements or notes to the consolidated financial statements.
SCHEDULE II
—
VALUATION AND QUALIFYING ACCOUNTS
(in thousands)
|
Description
|
Balance at
Beginning of
Year
|
Provision (Benefit)
for
Doubtful
Accounts
|
Write-offs,
Net of
Recoveries
|
Balance at
End of Year
|
|||||||||
|
Allowance for doubtful accounts:
|
|||||||||||||
|
2018
|
$
|
30,600
|
|
6,527
|
|
(4,433
|
)
|
$
|
32,694
|
|
|||
|
2017
|
$
|
54,742
|
|
(6,711
|
)
|
(17,431
|
)
|
$
|
30,600
|
|
|||
|
2016
|
$
|
67,057
|
|
8,203
|
|
(20,518
|
)
|
$
|
54,742
|
|
|||
|
Description
|
Balance at
Beginning of
Year
|
Additions
|
Deductions
|
Balance at
End of Year
|
|||||||||
|
Deferred income tax asset valuation allowance:
|
|||||||||||||
|
2018
|
$
|
3,390,467
|
|
201,282
|
|
(947,850
|
)
|
$
|
2,643,899
|
|
|||
|
2017
|
$
|
3,286,723
|
|
112,543
|
|
(8,799
|
)
|
$
|
3,390,467
|
|
|||
|
2016
|
$
|
3,330,878
|
|
32,130
|
|
(76,285
|
)
|
$
|
3,286,723
|
|
|||
118
(a)3. Exhibits
Exhibits that are not filed herewith have been previously filed with the SEC and are incorporated herein by reference.
|
Incorporated by Reference
|
||||
|
Exhibit
No.
|
Description
|
Form
|
Filing Date
|
|
|
3.1
|
10-Q
|
5/8/2015
|
||
|
3.2
|
10-Q
|
11/6/2015
|
||
|
4.1
|
S-1
|
10/7/2002
|
||
|
4.2
|
8-K
|
5/22/2013
|
||
|
4.3
|
10-K
|
3/2/2015
|
||
|
4.4
|
8-K
|
3/21/2018
|
||
|
4.5
|
8-K
|
2/18/2015
|
||
|
4.6
|
8-K
|
5/11/2017
|
||
|
4.7
|
10-Q
|
11/8/2017
|
||
|
4.8
|
10-Q
|
11/8/2017
|
||
|
4.9
|
8-K
|
3/23/2018
|
||
|
4.10
|
8-K
|
3/23/2018
|
||
|
10.1.0
|
10-Q
|
11/7/2018
|
||
|
10.2.1
|
10-K
|
*
|
||
|
10.2.2
|
10-K
|
*
|
||
|
10.2.3
|
10-K
|
*
|
||
|
10.2.4
|
10-Q
|
11/6/2015
|
||
|
10.2.5
|
10-Q
|
11/6/2015
|
||
119
|
10.2.6
|
10-Q
|
11/6/2015
|
||
|
10.2.7
|
10-Q
|
11/4/2004
|
||
|
10.3.1
|
10-K
|
3/2/2015
|
||
|
10.3.2
|
10-Q
|
11/6/2015
|
||
|
10.3.3
|
10-K
|
2/29/2016
|
||
|
10.3.4
|
10-Q
|
8/9/2016
|
||
|
10.3.5
|
10-Q
|
8/9/2016
|
||
|
10.3.6
|
10-Q
|
5/4/2017
|
||
|
10.3.7
|
10-Q
|
11/8/2017
|
||
|
10.3.8
|
10-K
|
3/2/2015
|
||
|
10.3.9
|
10-Q
|
11/8/2017
|
||
|
10.3.10
|
10-K
|
3/2/2015
|
||
|
10.4.0
|
8-K
|
7/30/2018
|
||
120
|
10.5.0
|
8-K
|
4/3/2018
|
||
|
10.6.0
|
8-K
|
2/21/2012
|
||
|
10.7.1
|
S-1
|
8/20/2002
|
||
|
10.7.2
|
S-1
|
9/18/2002
|
||
|
10.7.3
|
10-Q
|
8/3/2004
|
||
|
10.7.4
|
8-K
|
5/2/2012
|
||
|
10.7.5
|
10-Q
|
11/4/2004
|
||
|
10.8.1
|
10-K
|
3/2/2015
|
||
|
10.8.2
|
10-K
|
3/2/2015
|
||
|
10.8.3
|
10-K
|
3/2/2015
|
||
|
10.8.4
|
10-K
|
2/29/2016
|
||
|
10.9.1
|
10-K
|
3/2/2015
|
||
|
10.9.2
|
10-K
|
3/2/2015
|
||
|
10.9.3
|
10-Q
|
5/8/2015
|
||
|
10.9.4
|
10-K
|
2/29/2016
|
||
|
10.9.5
|
10-Q
|
11/4/2004
|
||
|
10.9.6
|
10-Q
|
11/4/2004
|
||
|
+10.10.1.0
|
10-Q
|
5/4/2017
|
||
|
+10.10.1.1
|
10-Q
|
5/9/2018
|
||
|
+10.10.2.0
|
10-Q
|
5/4/2017
|
||
|
+10.10.2.1
|
10-Q
|
5/9/2018
|
||
|
+10.10.3.0
|
10-Q
|
8/8/2018
|
||
121
|
+10.10.4.0
|
S-1
|
10/7/2002
|
||
|
+10.10.4.1
|
10-Q
|
11/4/2004
|
||
|
+10.10.4.2
|
10-K
|
3/1/2007
|
||
|
+10.10.4.3
|
8-K
|
9/15/2008
|
||
|
+10.10.4.4
|
10-K
|
3/2/2009
|
||
|
+10.10.4.5
|
10-Q
|
5/11/2009
|
||
|
+10.10.4.6
|
8-K
|
2/28/2011
|
||
|
+10.10.4.7
|
10-K
|
3/2/2015
|
||
|
+10.10.4.8
|
8-K
|
2/16/2018
|
||
|
+10.10.5.0
|
10-Q
|
5/4/2017
|
||
|
+10.10.5.1
|
10-Q
|
5/9/2018
|
||
|
+10.10.5.2
|
10-Q
|
8/8/2018
|
||
|
+10.11.0
|
10-K
|
2/24/2017
|
||
|
10.12.1
|
8-K
|
1/6/2010
|
||
|
10.12.2
|
8-K
|
11/26/2010
|
||
|
10.12.3
|
8-K
|
12/15/2010
|
||
|
10.12.4
|
8-K
|
3/9/2018
|
||
|
10.12.5
|
8-K
|
4/18/2018
|
||
|
10.12.6
|
8-K
|
8/6/2018
|
||
|
10.13
|
10-K
|
2/28/2018
|
||
|
10.14.1
|
10-K
|
2/24/2017
|
||
|
10.14.2
|
10-Q
|
11/9/2012
|
||
|
10.14.3
|
10-K
|
3/2/2015
|
||
|
10.14.4
|
10-K
|
3/1/2013
|
||
|
10.15
|
S-1
|
9/18/2002
|
||
|
21.1
|
10-K
|
*
|
||
|
23.1
|
10-K
|
*
|
||
122
|
31.1
|
10-K
|
*
|
||
|
31.2
|
10-K
|
*
|
||
|
32
|
10-K
|
*
|
||
|
101
|
The following financial information from the Company's Annual Report on Form 10-K for the year ended December 31, 2018, filed with the SEC on February 28, 2019 formatted in Extensible Business Reporting Language (XBRL): (i) the Consolidated Balance Sheets as of December 31, 2018 and December 31 2017, (ii) the Consolidated Statements of Income for the years ended December 31, 2018, 2017 and 2016, (iii) the Consolidated Statements of Cash Flows for the years ended December 31, 2018, 2017 and 2016, (iv) the Consolidated Statements of Stockholders' Equity as of December 31, 2018, 2017 and 2016, (v) the Consolidated Statements of Comprehensive Income for the years ended December 31, 2018, 2017 and 2016 and (vi) Notes to Consolidated Financial Statements.
|
10-K
|
*
|
|
|
*
|
Filed herein
|
|
+
|
Denotes management contract or compensatory plan or arrangement.
|
Item 16. Form 10-K Summary
Not applicable.
123
SIGNATURES
Pursuant to the requirements of Section 13 or 15(d) of the Securities Exchange Act of 1934, the Registrant has duly caused this report to be signed on its behalf by the undersigned, thereunto duly authorized.
|
WYNN RESORTS, LIMITED
|
|||
|
Dated: February 28, 2019
|
By:
|
/s/ Matt Maddox
|
|
|
Matt Maddox
|
|||
|
Director, Chief Executive Officer and President (Principal Executive Officer)
|
|||
Pursuant to the requirements of the Securities Exchange Act of 1934, this report has been signed below by the following persons on behalf of the Registrant and in the capacities and on the dates indicated.
|
Signature
|
Title
|
Date
|
||
|
/s/ Matt Maddox
|
Director, Chief Executive Officer and President (Principal Executive Officer)
|
February 28, 2019
|
||
|
Matt Maddox
|
||||
|
/s/ Philip G. Satre
|
Non-Executive Chairman of the Board and Director
|
February 28, 2019
|
||
|
Philip G. Satre
|
||||
|
/s/ Betsy S. Atkins
|
Director
|
February 28, 2019
|
||
|
Betsy S. Atkins
|
||||
|
/s/ Richard J. Byrne
|
Director
|
February 28, 2019
|
||
|
Richard J. Byrne
|
||||
|
/s/ Jay L. Johnson
|
Director
|
February 28, 2019
|
||
|
Jay L. Johnson
|
||||
|
/s/ Patricia Mulroy
|
Director
|
February 28, 2019
|
||
|
Patricia Mulroy
|
||||
|
/s/ Margaret J. Myers
|
Director
|
February 28, 2019
|
||
|
Margaret J. Myers
|
||||
|
/s/ Clark T. Randt, Jr.
|
Director
|
February 28, 2019
|
||
|
Clark T. Randt, Jr.
|
||||
|
/s/ Winifred Webb
|
Director
|
February 28, 2019
|
||
|
Winifred Webb
|
||||
|
/s/ Craig S. Billings
|
Chief Financial Officer and Treasurer (Principal Financial and Accounting Officer)
|
February 28, 2019
|
||
|
Craig S. Billings
|
||||
124
TABLE OF CONTENTS
Part IItem 1. BusinessItem 1A. Risk FactorsItem 1B. Unresolved Staff CommentsItem 2. PropertiesItem 3. Legal ProceedingsItem 4. Mine Safety DisclosuresPart IIItem 5. Market For Registrant's Common Equity, Related Stockholder Matters and Issuer Purchases Of Equity SecuritiesItem 6. Selected Financial DataItem 7. Management's Discussion and Analysis Of Financial Condition and Results Of OperationsItem 7A. Quantitative and Qualitative Disclosures About Market RiskItem 8. Financial Statements and Supplementary DataNote 1 - OrganizationNote 2 - Summary Of Significant Accounting PoliciesNote 3 - Investment SecuritiesNote 4 - Property and Equipment, NetNote 5 - Intangible Assets, NetNote 6 - Long-term DebtNote 7 - Stockholders' EquityNote 8 - Noncontrolling InterestsNote 9 - Benefit PlansNote 10 - RevenueNote 11 - Stock-based CompensationNote 12 - Income TaxesNote 13 - Related Party TransactionsNote 14 - Retail Joint VentureNote 15 - Commitments and ContingenciesNote 16 - Segment InformationItem 9. Changes in and Disagreements with Accountants on Accounting and Financial DisclosureItem 9A. Controls and ProceduresItem 9B. Other InformationPart IIIItem 10. Directors, Executive Officers and Corporate GovernanceItem 11. Executive CompensationItem 12. Security Ownership Of Certain Beneficial Owners and Management and Related Stockholder MattersItem 13. Certain Relationships and Related Transactions, and Director IndependenceItem 14. Principal Accountant Fees and ServicesPart IVItem 15. Exhibits, Financial Statement SchedulesItem 16. Form 10-k Summary