WIDEPOINT CORP
10-Ks and 10-Qs
|
|
|
|
|
|
|
|
|
|
|
|
|
|
|
|
|
|
|
|
|
|
|
|
|
|
|
|
|
|
|
|
|
|
|
|
|
|
|
|
|
|
|
|
|
|
|
|
|
|
|
|
|
|
|
|
|
|
|
UNITED
STATES SECURITIES AND EXCHANGE COMMISSION
Washington,
D.C. 20549
Form
10-K
|
☑
|
ANNUAL
REPORT PURSUANT TO SECTION 13 OR 15(d) OF THE SECURITIES EXCHANGE
ACT OF 1934
|
|
|
For
the Fiscal Year Ended December 31, 2019
|
|
or
|
|
|
☐
|
TRANSITION
REPORT PURSUANT TO SECTION 13 OR 15(d) OF THE SECURITIES EXCHANGE
ACT OF 1934
|
|
|
For
the transition period from __________________ to
___________________
|
Commission
File Number: 001-33035
|
WidePoint
Corporation
|
|
(Exact name of Registrant as specified in its charter)
|
|
Delaware
|
|
52-2040275
|
|
(State or other jurisdiction of
|
|
(I.R.S. Employer
|
|
incorporation or organization)
|
|
Identification No.)
|
|
11250
Waples Mill Road, South Tower, Suite 210, Fairfax, Virginia
22030
|
|
(Address of principal executive offices) (Zip Code)
|
|
(703)
349-2577
|
|
(Registrant’s telephone number, including area
code)
|
Securities
registered pursuant to Section 12(b) of the act:
|
Title of each class
|
Trading Symbol(s)
|
Name of each exchange
on which registered
|
|
Common
Stock, $0.001 par value per share
|
WYY
|
NYSE
AMERICAN
|
|
Securities
registered pursuant to Section 12(g) of the act:
|
|
None
|
Indicate by check
mark if the registrant is a well-known seasoned issuer, as defined
in Rule 405 of the Securities Act. Yes ☐ No
☑
Indicate by check
mark if the registrant is not required to file reports pursuant to
Section 13 or Section 15(d) of the Act. Yes ☐ No
☑
Indicate by check mark whether the registrant (1)
has filed all reports required to be filed by Section 13 or 15(d)
of the Securities Exchange Act of 1934 during the preceding 12
months (or for such shorter period that the registrant was required
to file such reports), and (2) has been subject to such filing
requirements for the past 90 days: Yes
☑
No
☐
Indicate by check
mark whether the registrant has submitted electronically every
Interactive Data File required to be submitted pursuant to Rule 405
of Regulation S-T (§ 232.405 of this chapter) during the
preceding 12 months (or for such shorter period that the registrant
was required to submit such files): Yes ☑ No
☐
Indicate by check
mark whether the registrant is a large accelerated filer, an
accelerated filer, a non-accelerated filer, a smaller reporting
company, or an emerging growth company. See the definitions of
“large accelerated filer,” “accelerated
filer,” “smaller reporting company,” and
“emerging growth company” in Rule 12b-2 of the Exchange
Act.
|
Large
accelerated filer ☐
|
|
Accelerated filer
☐
|
|
Non-accelerated
filer ☐
|
|
Smaller
reporting company ☑
Emerging growth
company ☐
|
If an emerging
growth company, indicate by check mark if the registrant has
elected not to use the extended transition period for complying
with any new or revised financial accounting standards provided
pursuant to Section 13(a) of the Exchange Act. Yes ☐ No
☐
Indicate by check
mark whether the registrant is a shell company (as defined in Rule
12b-2 of the Act). Yes ☐ No ☑
The aggregate
market value of the registrant’s Common Stock held by
non-affiliates of the registrant, computed by reference to the
closing price of the Common Stock on the NYSE American on the last
business day of the registrant’s most recently completed
second fiscal quarter, was approximately $33.4
million.
As of March 20,
2020, there were 83,837,279 shares of the registrant’s Common
Stock issued and outstanding.
DOCUMENTS INCORPORATED BY REFERENCE
Portions
of WidePoint Corporation's proxy statement in connection with its
2020 Annual Meeting of Stockholders are incorporated by reference
in Part III.
Cautionary Note Regarding Forward Looking Statements
This Annual Report
on Form 10-K contains forward-looking statements concerning our
business, operations and financial performance and condition as
well as our plans, objectives and expectations for our business
operations and financial performance and condition that are subject
to risks and uncertainties. All statements other than statements of
historical fact included in this Annual Report on Form 10-K are
forward-looking statements. You can identify these statements by
words such as “aim,” “anticipate,”
“assume,” “believe,” “could,”
“due,” “estimate,” “expect,”
“goal,” “intend,” “may,”
“objective,” “plan,”
“potential,” “positioned,”
“predict,” “should,” “target,”
“will,” “would” and other similar
expressions that are predictions of or indicate future events and
future trends. These forward-looking statements are based on
current expectations, estimates, forecasts and projections about
our business and the industry in which we operate and our
management's beliefs and assumptions. These statements are not
guarantees of future performance or development and involve known
and unknown risks, uncertainties and other factors that are in some
cases beyond our control. All forward-looking statements are
subject to risks and uncertainties that may cause actual results to
differ materially from those that we expected,
including:
●
Our ability to
successfully execute our strategy;
●
Our ability to
sustain profitability and positive cash flows;
●
Our ability to gain
market acceptance for our products;
●
Our
ability to win new contracts, execute contract extensions and
expansion of services of existing contracts;
●
Our
ability to re-win our Blanket Purchase Agreement with the
Department of Homeland Security;
●
Our ability to
compete with companies that have greater resources than
us;
●
Our ability to
penetrate the commercial sector to expand our
business;
●
Our
ability to borrow funds against our credit facility and renew or
replace our credit facility on favorable terms or at
all;
●
Our ability to
raise additional capital on favorable terms or at all;
and
●
Our ability to
retain key personnel.
For the discussion
of these risks and uncertainties and others that could cause actual
results to differ materially from those contained in our
forward-looking statements, please refer to “Risk
Factors” in this Annual Report on Form 10-K. The
forward-looking statements included in this Annual Report on Form
10-K are made only as of the date hereof. We undertake no
obligation to publicly update or revise any forward-looking
statement as a result of new information, future events or
otherwise, except as otherwise required by law.
In this Annual
Report on Form 10-K, unless the context indicates otherwise, the
terms “Company” and “WidePoint,” as well as
the words “we,” “our,” “ours”
and “us,” refer collectively to WidePoint Corporation
and its consolidated subsidiaries.
PART
I
ITEM
1. BUSINESS
Company
Overview
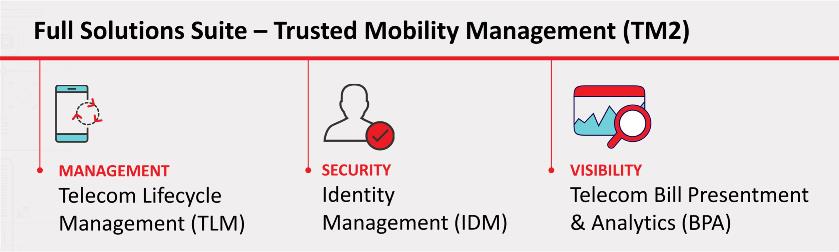
We are a leading
provider of Trusted Mobility Management (TM2) that consists of
federally certified communications management, identity management,
and interactive bill presentment and analytics solutions. We help
our clients achieve their organizational missions for mobility
management and security objectives in this challenging and complex
business environment.
3
We offer our TM2
solutions through a flexible managed services model which includes
both a scalable and comprehensive set of functional capabilities
that can be used by any customer to meet the most common
functional, technical and security requirements for mobility
management. Our TM2 solutions were designed and implemented with
flexibility in mind such that it can accommodate a large variety of
customer requirements through simple configuration settings rather
than through costly software development. The flexibility of our
TM2 solutions enables our customers to be able to quickly expand or
contract their mobility management requirements. Our TM2 solutions
are hosted and accessible on-demand through a secure federal
government certified proprietary portal that provides our customers
with the ability to manage, analyze and protect their valuable
communications assets, and deploy identity management solutions
that provide secured virtual and physical access to restricted
environments.
Our
Solutions
Telecom
Lifecycle Management
We offer
comprehensive telecom lifecycle management solutions to
corporations, governments, and not-for-profit organizations. Our
solutions are delivered in a hosted and secure multi-modal delivery
environment. Our solutions provide full visibility of telecom
assets for our clients thereby enabling our clients to securely and
efficiently manage all aspects of telecom assets, while reducing
the overall cost of ownership. We offer state-of-the-art call
centers that are available 24/7 to help our users stay
productive.
Mobile and Identity Management
As one of two
DoD designated External Certificate Authorities, we offer several
different federally certified digital certificates and credentials
that enable our customers to conduct business through secure
portals owned and managed by the U.S. federal government, access
government facilities and secure mobile devices that are used to
access corporation networks, databases and other IT assets. We also
offer comprehensive mobile security solutions that protect users,
devices, and corporate resources, including establishing effective
policies to create a scalable, adaptable, successful mobile
program.
Digital Billing Communications solutions
We offer innovative
and interactive billing communications and analytics solutions to
large communications service provides (CSPs). Our customized
solutions give their end customers the ability to view and analyze
their bills online via our advanced self-serve user portal
24/7.
Our
solutions are delivered in a hosted and secure environment and
provide our CSPs with full visibility into their revenue model
which drives a stronger customer experience and reduces their
operating costs and improves profitability
We sell service
solutions to government and business enterprises. Our ability to
successfully sell our services depends upon the relationships we
build and maintain with key decisions makers at existing customers
and prospective customer organizations. Our sales cycle is long and
is often affected by many factors outside of our control including
but not limited to customer specific proposal and acquisition
processes, unique customer service requirements, the
customer’s timetable and urgency, changes in key leadership
and/or personnel that slows down the proposal or project, an
evaluation by different functional groups within the prospective
customers organization before a purchase decision is made by the
organization, budgetary funding delays, intermittent U.S. federal
government shutdowns, competitive bidding processes and other
policy constraints, as well as additional factors that may lengthen
the sales cycle. Many of these variables are outside our control
and we attempt to manage the financial impact on us by building a
large pipeline with opportunities that have overlapping sales
cycles.
4
It could take more
than 12 months to enter into a contract with a customer from the
time we first actively engage a prospective customer and then a
full implementation could range from mere weeks to several months
depending on the complexity of the customers statement of work and
level of engagement by us and the customer to get the deployment
completed. Contract closing and implementation timelines vary as a
result of these factors, many of which are outside our
control.
Sales
Approaches
We approach selling
our services under either a direct sales model under which we
control the contract and key relationships or we partner with a
large systems integrator subcontractor to provide our TM2 solution
as part of their overall total solution offering to the end
customer. We have historically grown our business under the direct
sales model; however, during fiscal 2019 we closed a significant
portion of our new sales through our partnerships with large
systems integrators. While we believe we can continue to be
successful growing our sales through both models, larger scale
opportunities likely exist when we partner with large systems
integrators.
Our sales
approaches are summarized below:
Systems
Integrators.
We partner with large systems integrators to
collectively pursue and win large market opportunities that include
our TM2 solution within the scope of the solicitations. In these
types of arrangements, we generally operate as a subcontractor and
manage the customer relationship closely with the prime contractor.
We do not utilize any channel partners or third-party firms in this
sales approach.
Strategic
Partnerships.
We partner with vendors who are leaders in
their industries such as Healthcare, Telecommunication,
Transportation, etc. to leverage their channels or reseller
networks to sell our TM2 solution. This approach allows us to sell
into markets that would be otherwise be costly and difficult to
reach. By leveraging these partners’ existing customer
relationships, we can shorten the sale cycle and have a higher
success rate
Internal Sales
Force.
We have a team of sales professionals account
managers and project managers that are responsible for identifying
and pursuing commercial and government opportunities for our TM2
offerings. We take a team approach for engaging with a potential
customer. Our sales teams consists of sales lead, account managers,
solution experts and other subject matter experts to assist with
execution of product demonstrations, proposal creation and
submission, contract negotiation, relationship management, sales
closing and final transition of closed deals to the operations
team. Sales commissions are calculated and paid based on net
collected gross managed service revenues times a fixed commission
rate that declines over the base term of the contract. There are no
commissions paid after the base term expires. We plan to add
resources for this effort to help manage our system integrator and
strategic partnership efforts as well as increasing the number of
qualified leads in our sales pipeline to further spur
growth.
Upselling and
Cross Selling.
After a customer is on boarded, we focus on
delivering our service promise and then upsell and cross sell our
TM2 solution offerings. We may enter into preferred supplier
network programs agreements with our customers and offer our TM2
solutions on similar terms and conditions to their suppliers and
customer which in turn could increase our potential sales
opportunities. We also directly ask our customers for referrals
into their professional network, customer and supplier groups to
drive additional sales opportunities.
5
Indirect Sales
Approach.
We may use an indirect sales approach to reach new
target markets by outsourcing our lead generation and certain
business development activities through a third-party channel
partner. We do not use this sales approach very often due to the
high cost of commissions charged by these channel partners as their
commission terms often span the entire life of the customer
relationship which may not be financially viable to the customer or
us. We do not anticipate using this sales approach extensively to
drive sales opportunities.
Our sales team has
a wide variety of skills and expertise to cultivate qualified leads
and guide our prospective customers towards finding a solution that
meets their organization’s goals and objectives.
Marketing
and Branding
Our marketing
strategy is to build our brand and increase market awareness of our
solutions in our target markets that will allow us to successfully
build strong relationships with key decision markers involved in
the sales process on the customer side. Key decisions makers
typically consist of information technology executives, finance
executives and managers of communications assets and
networks.
We engage in a wide
variety of broad-based and targeted marketing campaigns designed to
broaden market awareness of our solutions and expertise.
Broad-based marketing campaigns include attending and speaking at
industry and tradeshows, website marketing, publishing technical
whitepapers and use case studies, topical webcasts, public
relations campaigns, subject matter expert forums and industry
visibility initiatives. Targeted marketing campaigns including
internet search engine optimization, directed e-mail and direct
mail, co-marketing strategies designed to leverage existing
customer and network relationships.
Customer
Concentrations
We derive a
significant amount of our revenues from contracts funded by federal
government agencies for which we act in capacity as the prime
contractor, or as a subcontractor. We believe that contracts with
federal government agencies in particular, will be the primary
source of our revenues for the foreseeable future although we are
working to increase our footprint with commercial customers through
our relationships with large systems integrators and strategic
partners. Accordingly, negative changes in federal government
fiscal or spending policies (including continuing budget
resolutions and government shutdowns) that impact the spending
budgets of our key government customers, including Department of
Homeland Security, will directly affect our financial
performance.
We expect all of
our customers to be motivated to meet their organizational needs
for mobile management and security objectives in this challenging
mobile environment. As a result of delivering our TM2 service
solution we can often save our customers up to 35% of their total
spend on mobility and security management which translates into
real cash savings. While most of our customers use their savings to
purchase and upgrade their managed services, our customers could
potentially negatively impact our billable revenue base and result
in lower profit margins if they decide to retain the savings and
not purchase additional higher margin services. We believe we have
an attractive set of solutions and we also believe that government
spending for mobility management and for cybersecurity services and
solutions will increase for the foreseeable future.
Our government
customer base is located predominantly in the Mid-Atlantic region
of the U.S. while our commercial customer base is located
throughout the continental U.S., Canada, Europe and the Middle
East. Historically, we have derived, and may continue to derive in
the future, a significant percentage of our total revenues from
federal government contracts.
Due to the nature
of our business and the relative size of certain contracts which
are entered into in the ordinary course of business, the loss of
any single significant customer would have a material adverse
effect on our results of operations. In future periods, we will
continue to focus on diversifying our revenue by increasing the
size and number of customer contracts both in public and private
sectors.
6
Government
Contracts
We have numerous
government contracts and contract vehicles. Our contracts with the
federal government, and many contracts with other entities, permit
the government customer to modify, curtail or terminate the
contract at any time for the convenience of the government, or for
default by the contractor. If a contract is terminated for
convenience, we are generally reimbursed for our allowable costs
through the date of termination and are paid a proportionate amount
of the stipulated profit or fee attributable to the work actually
performed.
Contract vehicles
include Government Wide Acquisition Contracts
(“GWACs”), and Blanket Purchase Agreements
(“BPAs”) based upon GSA Schedule 70, and customer
specific contracts. We also hold a number of Indefinite
Delivery/Indefinite Quantity (“ID/IQ”) contracts,
including, but not limited to:
■
Department of
Homeland Security Blanket Purchase Agreement (DHS BPA) for Cellular
Wireless Managed Services.
■
Department of
Health and Human Services Telecommunications Inventory and Expense
Management Solutions contract.
■
Subsidiaries of
WidePoint are approved subcontractors for the following ID/IQ
contracts:
o
NASA End-User
Services and Technologies (NEST)
o
Defense Logistics
Agency J6 Enterprise Technology Services (JETS)
o
GSA Alliant
2
o
GSA Enterprise
Infrastructure Solutions (EIS)
o
GSA Connections
II
o
National Institutes
of Health Chief Information Officer Solutions and Partners
(CIO-SP3)
o
NASA Solutions for
Enterprise-Wide Procurement (SEWP)
We will continue to
build on our partnerships with key systems integrators and
strategic partners to compete for public and private sector
opportunities.
Product
Development and Technology Solution Enhancements
We believe that our
existing technology platforms are adequate and meet our operational
obligations to our customers. We may fund certain product
development initiatives to enhance or customize existing client
facing platforms and software solutions. These initiatives are
aimed at improving the efficiency and effectiveness of our software
solutions and meet our customer’s changing organizational
requirements, as necessary. We determine which enhancements to
further develop after assessing the market capabilities sought by
potential customers, considering technological advances, feedback
on enhancements from our current customer user groups and other
factors. Our current development activities are focused on the
integration of our heterogeneous services delivery platforms, and
improving the security posture and delivery of our information
technology services.
We utilize a
standard architecture to ensure enhancements are subject to
appropriate oversight and scrutiny and follow a consistent and
efficient process. Our development team is comprised of
professionals with hands-on technical and practical customer-side
development experience. We believe this allows us to design and
deploy enhancements that can resolve real-world problems in a
timely manner.
7
We funded and
expensed strategic product development initiatives as well as
platform and portal integrations and other product and portal
enhancements during the year. For the years ended December 31, 2019
and 2018, we incurred product development costs associated with our
next generation TDI Optimiser™ application of approximately
$146,000 and $229,000, respectively, which were capitalized. In
2020, we will continue to work with our strategic partners to
continue and focus our product development efforts as well as with
customer integrations.
Security
Certification and Accreditation
Our TM2 solution
framework has received multiple security certifications and
accreditations from the federal government. As a result we have
multiple authorizations to operate (ATOs) from the Department of
Homeland Security, the General Services Administration, and the
Department of Commerce. The ATOs attest to the fact that we meet
all of the cybersecurity requirements for processing sensitive data
as ascribed by the Federal Information Management Act at the
Moderate and High levels. These ATOs are difficult, time consuming,
and costly to attain. Our security certification and accreditation
represents a significant reduction of security risk for our
customers both in public and private sectors.
Data
Centers
We host our
proprietary solutions and operate all servers, systems and networks
at five (5) data centers located in Ireland, Ohio, and Virginia,
which we may consolidate in the future. Our agreements with our
customers contain guarantees regarding specified levels of system
availability, and we regularly provide our customers with
performance reports against those standards. We utilize monitoring
technology software tools that continuously checks our servers and
key underlying components at regular intervals for issues with
system availability and performance, server and application
security and penetration vulnerabilities, and other factors that
may impact the availability of our systems to our customers. Each
data center provides security measures, redundant environmental
controls, fire suppression systems and redundant electrical
generators to meet our service level agreements. To facilitate data
loss recovery, we operate a multi-tiered system configuration with
load-balanced web server tools, replicated database servers and
fault-tolerant storage devices. The architecture is designed to
ensure near real-time data recovery in the event of a malfunction
of a primary server. Based on customer requirements, we can also
provide near real-time asynchronous data replication between
operational and disaster recovery backup sites.
Intellectual
Property
Our intellectual
property rights are important to our business. We rely on a
combination of patent, copyright, trademark, service mark, trade
secret and other rights in the United States and other
jurisdictions, as well as confidentiality procedures and
contractual provisions to protect our proprietary service as a
solution, technology, operational processes and other intellectual
property. We protect our intellectual property rights in a number
of ways including entering into confidentiality and other written
agreements with our employees, customers, consultants and partners
in an attempt to control access to and distribution of our
software, documentation and other proprietary technology and other
information. Despite our efforts to protect our proprietary rights,
third parties may, in an unauthorized manner, attempt to use, copy
or otherwise obtain and market or distribute our intellectual
property rights or technology or otherwise develop software or
services with the same functionality as our software and
services.
U.S. patent filings
are intended to provide the holder with a right to exclude others
from making, using, selling or importing in the United States the
inventions covered by the claims of granted patents. Our patents,
including our pending patents, if granted, may be contested,
circumvented or invalidated. Moreover, the rights that may be
granted in those issued and pending patents may not provide us with
proprietary protection or competitive advantages, and we may not be
able to prevent third parties from infringing those patents.
Therefore, the exact benefits of our issued patents and, if issued,
our pending patents and the other steps that we have taken to
protect our intellectual property cannot be predicted with
certainty.
8
Market Competition
Our TM2 market is
centered around mobile management and security as shown
below:
Target Markets.
Our target
market is highly fragmented and we compete with small and large
companies that offer different components of TM2. We believe that
we are presently the only provider of all three of these critical
services offerings. We believe that our TM2 solution offering gives
us a strong competitive advantage over our competitors due to our
distinctive technical competencies, long-standing client
relationships, successful past contract performance with large
commercial and government organizations, governmental
certifications and authorization to operate (ATO) within this
space, price and value of services delivered, reputation for
quality, and key management personnel with subject matter
expertise.
Market Pricing.
Pricing for
services in our market lack of transparency due to the way in which
our competitors price their services. Our competitors take
advantage of this lack of pricing transparency and prospective
customer’s lack of understanding and awareness of market
pricing for services. Our competitors often take advantage of a
prospective customer and will often heavily discount their prices
to unprofitable levels thereby creating a commodity pricing
environment that affects the value of the solution perceived by
prospective customers, severely limits profitability for other
service providers that provide better solutions, discourages
further innovation and harms the customer in the end. The
costs to switch solutions can be high for a prospective customer
even if they know their current solution is not
working.
Our pricing for
services are transparent and we attempt to match our customers need
with the right level of services for a single inclusive fee
whenever practical. We practice transparent pricing strategies that
allow our customers to purchase our entire full-service solution or
select only the services they require to meet their needs. We do
not use introductory teaser rates to attract new customers or
conduct bait and switch pricing tactics with our customers as is
often practiced by our competitors. Pricing for our TM2 offering
will vary depending on our prospective customer’s technology
infrastructure, scale of their operations, workflow requirements
and many other factors that can affect pricing.
We do not view our
services as a commodity, and comparability of our TM2 offering
against other competitors’ service offerings is not practical
due to differences in pricing models described above and overall
capabilities among competitors. As a result of this pricing
differences between us and our competitors it can be difficult to
compare to pricing models in our market.
All prospective
customers tend to initially have price sensitivity and that often
changes after we are able to demonstrate that our solutions will
save them time and money. We believe our TM2 solution pricing is
competitive and reflects the value of the solutions provide to our
customers. Our goal is providing the best solution for our
customers that meets their needs.
9
Competition.
Our TM2 solution
crosses into several different market segments and as a result we
do not have competitors that compete in all of the market segments
in which we conduct business. The following table outlines
what areas of TM2 our competitors provide:

Our larger
competitors often have more size and financial resources than us
and they may be able to provide a wider array of technology
solutions outside of our core capabilities. Due to our
significant federal government contract concentrations we also
experience competition from a variety of both large and small
companies, including divisions of large federal government
integrators such as Lockheed Martin Corporation, Northrop Grumman
Corporation, and other large and mid-sized federal contractors, as
well as a limited number of small to mid-sized subject matter
expert organizations offering specialized capabilities within the
identity management space.
If we are unable to
keep pace with the intense competition in our marketplace, deliver
cost-effective and relevant solutions to our target market, our
business, financial condition and results of operations will
suffer.
Contracting
We prefer to serve
as the prime contractor when we win contract awards; however, we
will often serve as a subcontractor and partner with a large
systems integrator to win a larger market opportunity. We also may
enter into strategic teaming agreements with another competitor or
a vertical supplier to capture a market opportunity. Prospective
customers in our target market use a wide array of contract
vehicles to purchase technology services ranging from individual
purchase orders, awards or consolidated service contracts
(including blanket purchase agreements and similar indefinite
delivery indefinite quantity contracts) that cover a range of
technology services, of which we may or may not be able to provide
all of the services to serve as the prime contractor.
Seasonality
Our business is not
seasonal. However, our revenues and operating results may vary
significantly from quarter to quarter, due to revenues earned on
contracts, the number of billable days in a quarter, the timing of
the carrier services revenues and other direct costs, the
commencement and completion of contracts during any particular
quarter; as well as the schedule of the government agencies for
awarding contracts, the term of each contract that we have been
awarded and general economic conditions. Because a significant
portion of our expenses, such as personnel and facilities costs,
are fixed in the short term, successful contract performance and
variation in the volume of activity as well as in the number of
contracts commenced or completed during any quarter may cause
significant variations in operating results from quarter to
quarter.
10
Employees
As of December 31,
2019, we had approximately 249 full-time employees (212 in the U.S.
and 37 in Europe). We periodically engage additional consultants
and employ temporary employees. None of our employees are subject
to a collective bargaining agreement. We believe that our relations
with our employees are good.
Corporate
Information
We were
incorporated on May 30, 1997 under the laws of the State of
Delaware under the name WidePoint Corporation. Our principal
executive offices are located at 11250 Waples Mill Rd., South
Tower, Suite 210, Fairfax, Virginia 22030. Our internet address is
www.widepoint.com. Information on our website is not incorporated
into this Form 10-K. We make available free of charge through our
website our Annual Report on Form 10-K, Quarterly Reports on Form
10-Q, current reports on Form 8-K, and amendments to those reports
filed or furnished pursuant to Section 13(a) or 15(d) of the
Securities Exchange Act of 1934 as soon as reasonably practicable
after we electronically file such material with, or furnish it to,
the United States Securities and Exchange Commission (the
“SEC”). The SEC maintains an Internet site that
contains reports, proxy and information statements, and other
information regarding issuers that file electronically with the SEC
at http://www.sec.gov.
ITEM
1A. RISK FACTORS
You should carefully consider the risk factors set forth below and
in other reports that we file from time to time with the Securities
and Exchange Commission and the other information in this Annual
Report on Form 10-K. The matters discussed in the risk factors, and
additional risks and uncertainties not currently known to us or
that we currently deem immaterial, could have a material adverse
effect on our business, financial condition, results of operation
and future growth prospects and could cause the trading price of
our common stock to decline.
Risks
Related to our Business and our Industry
Our inability to successfully recompete and re-win our expiring DHS
BPA contract, and on terms that do not materially affect our profit
margins, could have a material adverse impact on our results of
operations.
Our DHS BPA expired
on December 16, 2018 and was extended through June 16, 2019.
Department of Homeland Security has released the final request for
proposal in January of 2020 with a March 17, 2020 deadline to
submit a proposal. Subsequently this RFP was canceled on February
28
th
and
is expected to be replaced with an updated new RFP. The acquisition
is expected to be changed to an “Open Market”
solicitation from a GSA Schedule 70 Blanket Purchase Agreement.
While we believe we have a strong relationship and past performance
under this expiring contract that may provide us with a competitive
advantage in the re-compete process, there is no guarantee that we
will be successful in our efforts. If we are unable to retain this
contract the DHS may not be able to continue to use our services
beyond fiscal year 2020, unless they separately create and fund a
different contract vehicle, which is unlikely. Various agencies of
DHS have executed contingency plans (some in form of interim
contracts) to ensure that they have continued services from
WidePoint while the recompete of the DHS CWMS contract is being
conducted. Revenue generated under this single DHS BPA for fiscal
year ended December 31, 2019 was approximately $65.7 million
(representing 65% of total revenue of which 13% related to managed
service revenue). Our inability to successfully re-win this
contract would have a material adverse effect on our future
revenue, profitability and cash flows.
11
Changes in the spending policies or budget priorities of the
federal government could cause us to lose revenues.
We derive a
significant amount of our annual revenues from contracts funded by
federal government agencies. We believe that contracts with federal
government agencies will be a significant source of our revenues
for the foreseeable future. Accordingly, changes in federal
government fiscal or spending policies or the U.S. federal budget
could directly affect our financial performance. Among the factors
that could harm our business are:
■
curtailment of the
federal government’s use of technology services
firms;
■
a significant
decline in spending by the federal government, in general, or by
specific agencies such as the Department of Homeland
Security;
■
reductions in
federal government programs or requirements, including government
agency shutdowns and/or reductions in connection with
sequestration;
■
any failure to
raise the debt ceiling;
■
government
inability to approve a budget and operate under a “Continuing
Resolution”;
■
a shift in spending
to federal programs and agencies that we do not support or where we
currently do not have contracts;
■
delays in the
payment of our invoices by government payment offices;
■
federal
governmental shutdowns, and other potential delays in the
government appropriations process;
■
issues associated
with global health pandemics, such as the coronavirus;
and
■
general economic
and political conditions, including any event, such as the
coronavirus, that results in a change in spending priorities of the
federal government.
These or other
factors could cause federal government agencies and departments to
delay payments owed for our services, to reduce their purchases
under contracts, to exercise their right to terminate contracts, or
not to exercise options to renew contracts, any of which could
cause us to lose revenues. In addition, any limitations imposed on
spending by U.S. government agencies that result from efforts to
reduce the federal deficit, including as a result of sequestration
or otherwise, may limit both the continued funding of our existing
contracts and our ability to obtain additional
contracts.
We have had a history of losses; and we may be unable to achieve
and sustain profitability.
Although we have
net income of $0.2 million in 2019, we have a long history of net
losses over the last six (6) years, including net losses of $1.5
million in 2018 and $3.5 million in 2017. Prior to fiscal 2018, a
significant contributing factor driving our significant net
operating losses were investments in sales and marketing and
product development projects that did not produce the expected
return on investment; and as a result placed a significant
cumulative strain on our networking capital and overall financial
position. There is no guarantee that we will be able to sustain
improvements in financial performance realized over the last ten
(10) calendar quarters and ultimately meet our financial goals of
growing top line revenue and positive net income without closing
significant new business and incremental contract expansions. An
inability to successfully grow our sales pipeline and close on new
business that is profitable could affect our long-term viability
and ultimately limit the financial resources we have available to
grow our business and achieve our desired financial
results.
12
We currently have access to a credit facility agreement, which
requires us to maintain financial covenants and failure to maintain
such covenants could limit our access to debt capital and
simultaneously require immediate repayment of borrowings by our
lender.
W
e have access to a credit facility, which consists
of a variable line of credit primarily to meet short term working
capital requirements and to partially fund acquisition growth. Our
credit facility agreement requires us to maintain certain financial
covenants on a quarterly and annual basis. If we are unable to meet
future covenants, our lender could take adverse actions that might
include raising our variable interest rate, accelerating in part or
in full payment of all unpaid principal and interest, reducing the
amount of our credit facility, or offering renewal terms that are
unfavorable, all of which could have a material adverse impact on
our ability to meet periodic short term operational cash flow
requirements and manage through prolonged government shutdowns.
Similarly, if we are unable to renew the credit facility with our
current lender or any other lender in the future, our business and
operating results will suffer and we may need to obtain additional
funding or raise capital, which may not be available on favorable
terms or at all.
The loss of significant customer contracts, could also have an
adverse impact on our financial results.
While we believe
that our business relationships with key decision makers are strong
and represent a strong competitive advantage for us; however, it is
possible that the strength of our relationship could diminish if
our primary customer contacts leave their firm or the customer is
acquired by another firm that uses a competitor to deliver the same
services. We estimate that the loss of any large contract with
annual managed service revenues of more than $1 million, without
any offsetting aggregate contract wins, could have a significant
adverse impact on our operating cash flow and financial results;
and we would likely be faced with a decision to initiate additional
cost reduction actions that would largely include reductions in
force for personnel and assets affected by the contract
loss.
Also, the loss of a
significant customer contract could also cause the Company to defer
potentially advantageous strategic options. In the case of the loss
of a material customer contract, the Company may be required to
rapidly consider other strategic alternatives including selling a
portion or all of our assets if our financial performance
deteriorates as a result of key customer contract losses.
Accordingly, the loss of a significant customer would have a
material adverse effect on our operations.
Our sales cycles can be long, unpredictable and require
considerable time and expense, which may cause our operating
results to fluctuate.
Our sales cycle,
which is the time between initial contact with a potential customer
and the ultimate sale, is often lengthy and unpredictable. Some of
our potential customers may already have partial managed mobility
solutions in place under fixed-term contracts, which may limit
their ability to commit to purchase our solution in a timely
fashion. In addition, our potential customers typically undertake a
significant evaluation process that can last up to a year or more,
and which requires us to expend substantial time, effort and money
educating them about the capabilities of our offerings and the
potential cost savings they can bring to an organization.
Furthermore, the purchase of our solution typically also requires
coordination and agreement across many departments within a
potential customer’s organization, which further contributes
to our lengthy sales cycle. As a result, we have limited ability to
forecast the timing and size of specific sales. Any delay in
completing, or failure to complete, sales in a particular quarter
or year could harm our business and could cause our operating
results to vary significantly.
Our market is highly competitive and we may not be able to compete
effectively or gain market acceptance of our products and
service.
Our service
business operates in a market that is highly fragmented, price
sensitive and subject to fierce competition. Additionally, rapid
changes in technology affect our ability to respond timely with new
and innovative product offerings to address new market needs. We
have a significant presence in the U.S federal marketplace and we
expect the intensity of competition for government contracts, as
well as commercial contracts to increase in the future as existing
competitors develop additional capabilities that better align with
our core competencies and those of our target customer
segment.
13
While we believe
our customer service, strong customer retention and integrated
technology solution sets are among our key differentiators, our
competitors may offer introductory pricing and significantly
discount their services to gain market share and/or in exchange for
revenues with higher margin services in other areas or at later
dates. Increased competition could result in additional pricing
pressure, reduced sales, shorter term lengths for customer
contracts, lower margins or the failure of our solution to achieve
or maintain broad market acceptance. If we are unable to compete
effectively, it will be difficult for us to maintain our pricing
rates and add and retain customers, have adequate financial
resources to pay for and retain key personnel, and our business,
financial condition and results of operations will be
harmed.
Our financial resources are limited and the failure of one or more
new product or service offerings could materially harm our
financial results.
Product research
and development can be time consuming and costly, without any
guarantee of a return on our investment. The failure of one of our
products or services to gain market acceptance could cause us
financial harm due to the costs involved in developing or acquiring
new products and services and , thereafter, marketing such new
products and services. Any failure to gain market acceptances of
our products and services could have a material adverse impact on
our financial results. In addition, many of our competitors have
greater resources than us and we if we cannot keep pace with the
intense competition in our marketplace, our business, financial
condition and results of operations will suffer.
We have significant fixed operating costs, which may be difficult
to adjust in response to unanticipated fluctuations in
revenues.
A high percentage
of our operating expenses, particularly personnel, rent and
communications costs, are fixed in advance of any particular
quarter. As a result, an unanticipated or prolonged decrease in the
number or average size of, or an unanticipated delay in the
scheduling for our projects may cause significant variations in
operating results in any particular quarter and could have a
material adverse effect on operations and cash flow for that
quarter. An unanticipated termination, decrease or delay in the
implementation of a significant anticipated customer contract could
require us to maintain underutilized employees and that could have
a material adverse effect on our cash flow, financial condition and
results of operations. Other factors that may negatively affect our
earnings from quarter to quarter include changes in:
■
the contractual
terms and timing of completion of projects, including achievement
of certain business results;
■
acceptance of our
products to commercial or government customers;
■
budgets for
government customers;
■
the implementation
of new projects ;
■
the adequacy of
provisions for losses and bad debts;
■
the accuracy of our
estimates of resources required to complete ongoing
projects;
■
personnel,
including the loss of key highly skilled personnel necessary to
complete projects;
■
global pandemics,
such as the coronavirus; and
■
general economic
conditions.
We may not be able to respond to rapid technological changes with
new software products and services, which could harm our sales and
profitability.
Our portfolio of
products, services, and solutions could become obsolete due to
rapid technological changes and frequent new product and service
introductions by our competitors in the mobile world. Additionally,
frequent changes in mobile computing hardware and software
technology, and resulting inconsistencies between the billing
platforms utilized by major communications carriers and the
changing demands of customers regarding the means of delivery of
communications management solutions could affect our ability to
efficiently deliver our services and harm our profit
margins.
14
To achieve and
maintain market acceptance for our solution, we must effectively
anticipate these changes and offer software products and services
that respond to them in a timely manner. Customers may require
customized transactional and reporting capabilities that our
current solution does not have and/or may be cost prohibitive to
develop to meet the customer’s requirements and ensure our
contract is profitable. In addition, the development of new
products and services comes with a high degree of uncertainty with
regard to return on investment and involves significant time and
financial resources to action, as there is no guarantee that the
funds and time spent on developing such products will ever generate
a return. If we fail to develop software products and services that
satisfy customer preferences in a timely and cost-effective manner,
our ability to renew our agreements with existing customers and our
ability to create or increase demand for our solution will be
harmed.
Our inability to accurately price and sell our product offerings at
an acceptable profit margin that customers are willing to pay will
have a negative impact on our business that could extend for a
number of years.
Most of our
contracts with customers have terms of three (3) to five (5) years,
with optional additional renewal periods. Our government contracts
generally consist of a base period award with 4 option periods
depending on the needs of the agency issuing the contract award.
Our commercial contracts have contractual terms of 3 or more years
with automatic annual renewals in most cases. Most of our contracts
are offered at firm fixed price per performance obligation such as
price per unit managed. Due to the long-term nature of our firm
fixed price contracts, any failure on our part to accurately define
the scope of work and properly manage scope creep, properly price
our products to match the customer’s operating environment,
or to effectively manage our costs to deliver against these
performance obligations could have an adverse negative impact to
our financial position and results of operations over a number of
years. Additionally, our failure to complete our contractual
performance obligations in a manner consistent with the contract
could adversely affect our overall profitability and could have a
material adverse effect on our business, financial condition and
results of operations.
Our largest customers could unexpectedly terminate their
contracts.
All of our
government contracts contain a standard clause which allows the
government to cancel our contract for convenience without penalty.
Some of our commercial contracts with large enterprises contain
contract clauses that include the ability to cancel a contract for
convenience by the customer for convenience with limited advance
notice and without significant penalty. In addition, our contracts
with the federal government permit the governmental agency to
modify, curtail or terminate the contract at any time for the
convenience of the government. Termination, delay or modification
of a contract by any large government or commercial customer could
result in a loss of expected revenues and additional expenses for
staff that were allocated to that customer’s project. We
could be required to maintain underutilized employees who were
assigned to the terminated contract or we could ultimately lose the
subject matter expertise for that contract and be required to
retain more expensive staffing resources to perform the contract
when it resumes. The unexpected cancellation or significant
reduction in the scope of any of our large projects could have an
immediate material adverse effect on our business, financial
condition and results of operations.
15
We may be unable to successfully acquire complementary businesses,
services or technologies to support our growth
strategy.
We may in the
future acquire or invest in complementary and supplementary
businesses, services or technologies. Demand for businesses with
credible business relationships and capabilities to provide
services to large commercial enterprises and/or governmental
agencies at the federal, state and local level is very competitive.
To the extent that the price of such acquisitions may rise beyond
reasonable levels where funding for such acquisitions is no longer
available, we may not be able to acquire strategic assets. Further,
these acquisitions, investments or new business relationships may
result in unforeseen difficulties and expenditures. We may
encounter difficulties assimilating or integrating the businesses,
technologies, products, services, personnel or operations of
companies we have acquired or companies that we may in the future
acquire. These difficulties may arise if the key personnel of the
acquired company choose not to work for us, the company’s
technology or services do not easily integrate with ours or we have
difficulty retaining the acquired company’s customers due to
changes in its management or for other reasons. These acquisitions
may also disrupt our business, divert our resources and require
significant management attention that would otherwise be available
for development of our business. Moreover, the anticipated benefits
of any acquisition, investment or business relationship may not be
realized or we may be exposed to unknown liabilities. In addition,
any future acquisition may require us to:
■
issue additional
equity securities that would dilute our stockholders;
■
use cash that we
may need in the future to operate our business;
■
incur debt on terms
unfavorable to us or that we are unable to repay;
■
incur large charges
or substantial liabilities; or
■
become subject to
adverse tax consequences, substantial depreciation or deferred
compensation charges.
If any of these
risks materializes, our business and operating results would be
harmed.
We may be liable to our customers for damages caused by our
services or by our failure to remedy system failures.
Many of our
projects involve technology applications or systems that are
critical to the operations of our customers’ businesses. If
we fail to perform our services correctly, we may be unable to
deliver applications or systems to our customers with the promised
functionality or within the promised time frame, or to satisfy the
required service levels for support and maintenance. While we have
created redundancy and back-up systems, any such failures by us
could result in claims by our customers for substantial damages
against us. Additionally, in the event we manage third party
services on behalf of our customers and fail to execute in approved
changes requested by our customers it could result in claims
asserted by our customers for substantial damages against
us.
Although we attempt
to limit the amount and type of our contractual liability for
defects in the applications or systems we provide, and carry
insurance coverage that mitigates this liability in certain
instances, we cannot be assured that these limitations and
insurance coverages will be applicable and enforceable in all
cases. Even if these limitations and insurance coverages are found
to be applicable and enforceable, our liability to our customers
for these types of claims could still exceed our insurance coverage
and be material in amount and affect our business, financial
condition and results of operations.
We may be unable to protect our proprietary software and
methodology.
Our success
depends, in part, upon our proprietary software, methodology and
other intellectual property rights. We rely upon a combination of
trade secrets, nondisclosure and other contractual arrangements,
and copyright and trademark laws to protect our proprietary rights.
We generally enter into nondisclosure and confidentiality
agreements with our employees, partners, consultants, independent
sales agents and customers, and limit access to and distribution of
our proprietary information. We cannot be certain that the steps we
take in this regard will be adequate to deter misappropriation of
our proprietary information or that we will be able to detect
unauthorized use and take appropriate steps to enforce our
intellectual property rights. Furthermore, statutory contracting
regulations protect the rights of federal agencies to retain access
to, and utilization of, proprietary intellectual property utilized
in the delivery of contracted services to such agencies. We have
attempted to put in place certain safeguards in our policies and
procedures to protect intellectual property developed by employees.
Our policies and procedures stipulate that intellectual property
created by employees and its consultants remain our property. If we
are unable to protect our proprietary software and methodology, the
value of our business may decrease and we may face increased
competition.
16
Assertions by a third party that our software products or
technology infringes its intellectual property, whether or not
correct, could subject us to costly and time-consuming litigation
or expensive licenses.
Although we believe
that our services and products do not infringe on the intellectual
property rights of others, infringement claims may be asserted
against us in the future. There is frequent litigation in the
communications and technology industries based on allegations of
infringement or other violations of intellectual property rights.
As we face increasing competition, the possibility of intellectual
property rights claims against us may increase. These claims,
whether or not successful, could:
■
divert
management’s attention;
■
result in costly
and time-consuming litigation;
■
require us to enter
into royalty or licensing agreements, which may not be available on
acceptable terms, or at all; or
■
require us to
redesign our software products to avoid infringement.
As a result, any
third-party intellectual property claims against us could increase
our expenses and impair our business. In addition, although we have
licensed proprietary technology, we cannot be certain that the
owners’ rights in such technology will not be challenged,
invalidated or circumvented. Furthermore, many of our customer
agreements require us to indemnify our customers for certain
third-party intellectual property infringement claims, which could
increase our costs as a result of defending such claims and may
require that we pay damages if there were an adverse ruling related
to any such claims. These types of claims could harm our
relationships with our customers, may deter future customers from
purchasing our software products or could expose us to litigation
for these claims. Even if we are not a party to any litigation
between a customer and a third party, an adverse outcome in any
such litigation could make it more difficult for us to defend our
intellectual property in any subsequent litigation in which we are
a named party.
Our net operating loss carry-forwards are subject to a valuation
adjustment if we do not maintain and increase our
profitability.
As of December 31,
2019, we had aggregate federal net operating loss carry-forwards of
approximately $37.5 million and state net operating loss
carry-forwards of approximately $39.5 million. Our ability to
utilize our net operating loss carry-forwards and related deferred
tax assets is based upon our ability to generate future taxable
income. Our ability to generate future taxable income can be
impacted by many circumstances. If we fail to generate taxable
income our existing net operating loss carry-forwards and related
deferred tax assets may expire unused. In addition, net operating
loss carry-forwards may become subject to an annual limitation if
there is a cumulative change in the ownership interest of
significant stockholders (or certain stockholder groups) over a
three-year period in excess of 50%, in accordance with rules
established under Section 382 of the Internal Revenue Code of 1986,
as amended, or the Code, and similar state rules (we refer to each
as an ownership change). Such an ownership change could limit the
amount of historic net operating loss carry-forwards that can be
utilized annually to offset future taxable income.
The loss of key personnel or an inability to attract and retain
additional personnel may impair our ability to grow our
business.
We are highly
dependent upon the continued service and performance of our key
executives, operational managers and subject matter experts to run
our core operations. The replacement of these individuals likely
would involve expenditure of significant time and financial
resources, and their loss might significantly delay or prevent the
achievement of our business objectives. We do not maintain key man
life insurance with respect to any of our key executives and
subject matter experts.
17
We plan to continue
to replenish our ranks with the best available talent to optimize
our workforce to do more with less resources. We face intense
competition for qualified individuals from numerous consulting,
technology, software and communications companies. Our ability to
achieve significant revenue growth will depend, in large part, on
our success in recruiting, training and retaining sufficient
numbers of qualified personnel to support our growth. New hires may
require significant training and may take significant time before
they achieve full productivity. If our recruiting, training and
retention efforts are not successful or do not generate a
corresponding increase in revenue, our business will be
harmed.
In addition, if our
key employees resign from us or our subsidiaries to join a
competitor or to form a competing company, the loss of such
personnel and any resulting loss of existing or potential customers
to any such competitor could have a material adverse effect on our
business, financial condition and results of operations. Although
we require certain of our employees to sign agreements prohibiting
them from joining a competitor, forming a competing company or
soliciting our customers or employees for certain periods of time,
we cannot be certain that these agreements will be effective in
preventing our key employees from engaging in these actions or that
courts or other adjudicative entities will substantially enforce
these agreements.
We may incur substantial costs in connection with contracts awarded
through a competitive procurement process, which could negatively
impact our operating results.
Most if not all
federal, state and local governments, as well as commercial
contracts are awarded through a competitive procurement process
that could be a year or more from the initial solicitation to final
contract award. We expect that much of the business we seek in the
foreseeable future will be awarded through competitive procedures
and similar lengthy sales cycle. Competitive procurements impose
substantial upfront costs and present a number of risks,
including:
■
the substantial
cost and managerial time and effort that we spend to prepare bids
and proposals for contracts that may not be awarded to
us;
■
requirements to
register to conduct business in another state or country could
increase our compliance costs;
■
requirements to
post a bid guarantee or similar performance guarantee as part of a
bid submission; and
■
the expense and
delay that we may face if our competitors protest or challenge
contract awards made to us pursuant to competitive procedures, and
the risk that any such protest or challenge could result in the
resubmission of offers, or in termination, reduction, or
modification of the awarded contract.
The costs we incur
in the competitive procurement process may be substantial and, to
the extent we participate in competitive procurements and are
unable to win particular contracts, these costs could negatively
affect our operating results. In addition, the General Services
Administration multiple award schedule contracts, government-wide
acquisitions contracts, blanket purchase agreements, and other
indefinite delivery/indefinite quantity contracts do not guarantee
more than a minimal amount of work for us, but instead provide us
access to work generally through further competitive procedures.
This competitive process may result in increased competition and
pricing pressure, requiring that we make sustained post-award
efforts to realize revenues under the relevant
contract.
18
Unfavorable government audit results could subject us to a variety
of penalties and sanctions, and could harm our reputation and
relationships with our customers.
The federal
government audits and reviews our performance on contracts, pricing
practices, cost structure, and compliance with applicable laws,
regulations, and standards. Like most large government contractors,
our contracts are audited and reviewed on a regular basis by
federal agencies, including the Defense Contract Audit Agency. An
unfavorable audit of us, or of our subcontractors, could have a
substantial adverse effect on our operating results. For example,
any costs that were originally reimbursed could subsequently be
disallowed. In this case, cash we have already collected may need
to be refunded.
If a government
audit uncovers improper or illegal activities, we may be subject to
civil and criminal penalties and administrative sanctions,
including termination of contracts, forfeiture of profits,
suspension of payments, fines, and suspension or debarment from
doing business with U.S. government agencies. In addition, we could
suffer serious harm to our reputation if allegations of impropriety
were made against us, whether true or not true.
Security breaches or cybersecurity events in sensitive government
systems could result in the loss of customers and negative
publicity.
Many of the
services we provide involve managing and protecting information
involved in sensitive or classified government functions. A
security breach or cybersecurity event in one of these systems
could cause serious harm to our business, damage our reputation,
and prevent us from being eligible for further work on sensitive or
classified systems for federal government customers. In addition,
sensitive personal data could be illegally accessed and/or stolen
through a cybersecurity event. We could incur losses from such a
security breach that could exceed the policy limits under our
insurance. Damage to our reputation or limitations on our
eligibility for additional work resulting from a security breach in
one of the systems we develop, install, and maintain could
materially reduce our revenues.
Many states have
enacted laws requiring companies to notify consumers of data
security breaches involving their personal data. These mandatory
disclosures regarding a security breach often lead to widespread
negative publicity, which may cause our customers to lose
confidence in the effectiveness of our data security measures. Any
security breach or cybersecurity event, whether successful or not,
would harm our reputation and could cause the loss of customers.
Any of these events could have material adverse effects on our
business, financial condition, and operating results.
Our ability to provide services to our customers depends on our
customers’ continued high-speed access to the internet and
the continued reliability of the internet
infrastructure.
Our business
depends on our customers’ continued high-speed access to the
internet, as well as the continued maintenance and development of
the internet infrastructure. The future delivery of our solutions
will depend on third-party internet service providers to expand
high-speed internet access, to maintain a reliable network with the
necessary speed, data capacity and security, and to develop
complementary solutions and services, including high-speed modems,
for providing reliable and timely internet access and services. All
of these factors are out of our control. To the extent that the
internet continues to experience an increased number of users,
frequency of use, or bandwidth requirements, the internet may
become congested and be unable to support the demands placed on it,
and its performance or reliability may decline. Any internet
outages or delays could adversely affect our ability to provide
services to our customers.
19
Currently, internet
access is provided by telecommunications companies and internet
access service providers that have significant and increasing
market power in the broadband and internet access marketplace. On
December 14, 2017, the Federal Communications Commission classified
broadband internet access service as an unregulated information
service and repealed the specific rules against blocking,
throttling or “paid prioritization” of content or
services. In the absence of government regulation, these providers
could take measures that affect their customers’ ability to
use our products and services, such attempting to charge their
customers more for using our products and services. To the extent
that internet service providers implement usage-based pricing,
including meaningful bandwidth caps, or otherwise try to monetize
access to their networks, we could incur greater operating expenses
and customer acquisition and retention could be negatively
impacted. Furthermore, to the extent network operators were to
create tiers of internet access service and either charge us for or
prohibit our services from being available to our customers through
these tiers, our business could be negatively impacted. Some of
these providers may also offer products and services that directly
compete with our own offerings, which could potentially give them a
competitive advantage.
Our failure to obtain and maintain security certifications and
necessary security clearances may limit our ability to perform
classified work directly for government customers as a prime
contractor or subcontractor, which could cause us to lose
business.
Some government
contracts require us to maintain both federal and industry
recognized security certifications of our systems, facility
security clearances, and require some of our employees to maintain
individual security clearances. If we are unable to maintain
security certifications of our systems, or our employees lose or
are unable to timely obtain security clearances, or we lose a
facility clearance, our customer may have the right to terminate
the contract or decide not to renew it upon its expiration. As a
result, to the extent we cannot obtain or maintain the required
security certifications and clearances for a particular contract,
or we fail to obtain them on a timely basis, we may not derive the
revenues anticipated from the contract, which, if not replaced with
revenues from other contracts, could harm our operating results. To
the extent we are not able to obtain facility security clearances
or engage employees with the required security clearances for a
particular contract, we will be unable to perform that contract and
we may not be able to compete for or win new contracts for similar
work.
Federal government contracts contain provisions giving government
customers a variety of rights that are unfavorable to us, including
the ability to terminate a contract at any time for
convenience.
Federal government
contracts contain provisions and are subject to laws and
regulations that provide government customers with rights and
remedies not typically found in commercial contracts. These rights
and remedies allow government customers, among other things,
to:
■
terminate existing
contracts, with short notice, for convenience, as well as for
default;
■
reduce orders under
or otherwise modify contracts;
■
for larger
contracts subject to the Truth in Negotiations Act, reduce the
contract price or cost where it was increased because a contractor
or subcontractor during negotiations furnished cost or pricing data
that was not complete, accurate, and current;
■
for GSA multiple
award schedule contracts, government-wide acquisition agreements,
and blanket purchase agreements, demand a refund, make a forward
price adjustment, or terminate a contract for default if a
contractor provided inaccurate or incomplete data during the
contract negotiation process, or reduce the contract price under
certain triggering circumstances, including the revision of
pricelists or other documents
20
■
upon which the
contract award was predicated, the granting of more favorable
discounts or terms and conditions than those contained in such
documents, and the granting of certain special discounts to certain
customers;
■
terminate our
facility security clearances and thereby prevent us from receiving
classified contracts;
■
cancel multi-year
contracts and related orders if funds for contract performance for
any subsequent year become unavailable;
■
decline to exercise
an option to renew a multi-year contract or issue task orders in
connection with indefinite delivery/indefinite quantity
contracts;
■
claim rights in
solutions, systems, and technology produced by us;
■
prohibit future
procurement awards with a particular agency due to a finding of
organizational conflict of interest based upon prior related work
performed for the agency that would give a contractor an unfair
advantage over competing contractors or the existence of
conflicting roles that might bias a contractor’s
judgment;
■
subject the award
of contracts to protest by competitors, which may require the
contracting federal agency or department to suspend our performance
pending the outcome of the protest and may also result in a
requirement to resubmit offers for the contract or in the
termination, reduction, or modification of the awarded contract;
and
■
suspend or debar us
from doing business with the federal government.
If a federal
government customer terminates one of our contracts for
convenience, we may recover only our incurred or committed costs,
settlement expenses, and profit on work completed prior to the
termination. If a federal government customer were to unexpectedly
terminate, cancel, or decline to exercise an option to renew with
respect to one or more of our significant contracts or suspend or
debar us from doing business with the federal government, our
revenues and operating results would be materially
harmed.
Our failure to comply with complex procurement laws and regulations
could cause us to lose business and subject us to a variety of
penalties.
We must comply with
laws and regulations relating to the formation, administration, and
performance of federal government contracts, which affect how we do
business with our federal government customers and may impose added
costs on our business. Among the most significant laws and
regulations are:
■
the Federal
Acquisition Regulation, and agency regulations analogous or
supplemental to the Federal Acquisition Regulation, which
comprehensively regulate the formation, administration, and
performance of government contracts;
■
the Truth in
Negotiations Act, which requires certification and disclosure of
all cost or pricing data in connection with some contract
negotiations;
■
the Cost Accounting
Standards, which impose cost accounting requirements that govern
our right to reimbursement under some cost-based government
contracts; and
■
laws, regulations,
and executive orders restricting the use and dissemination of
information classified for national security purposes and the
exportation of specified solutions and technical data.
If a government
review or investigation uncovers improper or illegal activities, we
may be subject to civil and criminal penalties and administrative
sanctions, including the termination of our contracts, the
forfeiture of profits, the suspension of payments owed to us,
fines, and our suspension or debarment from doing business with
federal government agencies. In particular, the civil False Claims
Act provides for treble damages and potentially substantial civil
penalties where, for example, a contractor presents a false or
fraudulent claim to the government for payment or approval, or
makes a false statement in order to get a false or fraudulent claim
paid or approved by the government. Actions under the civil False
Claims Act may be brought by the government or by other persons on
behalf of the government. These provisions of the civil False
Claims Act permit parties, such as our employees, to sue us on
behalf of the government and share a portion of any recovery. Any
failure to comply with applicable laws and regulations could result
in contract termination, price or fee reductions, or suspension or
debarment from contracting with the government, each of which could
lead to a material reduction in our revenues.
21
The adoption of new procurement laws or regulations could reduce
the amount of services that are outsourced by the federal
government and cause us to experience reduced
revenues.
New legislation,
procurement regulations, or labor organization pressure could cause
federal agencies to adopt restrictive procurement practices
regarding the use of outside service providers. The American
Federation of Government Employees, the largest federal employee
union, strongly endorses legislation that may restrict the
procedure by which services are outsourced to government
contractors. One such proposal, the Truthfulness, Responsibility,
and Accountability in Contracting Act, would have effectively
reduced the volume of services that is outsourced by the federal
government by requiring agencies to give in-house government
employees expanded opportunities to compete against contractors for
work that could be outsourced. If such legislation, or similar
legislation, were to be enacted, it would likely reduce the amount
of IT services that could be outsourced by the federal government,
which could materially reduce our revenues.
If a communications carrier prohibits customer disclosure of
communications billing and usage data to us, the value of our
solution to customers of that carrier would be impaired, which may
limit our ability to compete for their business.
Certain of our
information technology based solutions software functionality and
services that we offer depend on our ability to access a
customer’s communications billing and usage data. For
example, our ability to offer outsourced or automated
communications bill auditing, billing dispute resolution, bill
payment, cost allocation and expense optimization depends on our
ability to access this data. If a communications carrier were to
prohibit its customers from disclosing this information to us,
those enterprises would only be able to use these billing-related
aspects of our solution on a self-serve basis, which would impair
some of the value of our solution to those enterprises. This in
turn could limit our ability to compete with the internally
developed communications management solutions of those enterprises,
require us to incur additional expenses to license access to that
billing and usage data from the communications carrier, if such a
license is made available to us at all, or put us at a competitive
disadvantage against any third-party communications management
solutions service provider that licenses access to that
data.
22
Our long-term success in our industry depends, in part, on our
ability to expand the sales of our solutions to customers located
outside of the United States, and thus our business is susceptible
to risks associated with international sales and
operations.
We are currently
seeking to expand the international sales and operations of our
portfolio of solutions. This international expansion will subject
us to new risks that we have not faced in the United States. These
risks include:
■
geographic
localization of our software products, including translation into
foreign languages and adaptation for local practices and regulatory
requirements;
■
lack of familiarity
with and unexpected changes in foreign regulatory
requirements;
■
longer accounts
receivable payment cycles and difficulties in collecting accounts
receivable;
■
difficulties in
managing, staffing and overseeing international implementations and
operations, including increased reliance on foreign
subcontractors;
■
challenges in
integrating our software with multiple country-specific billing or
communications support systems for international
customers;
■
challenges in
providing procurement, help desk and fulfillment capabilities for
our international customers;
■
fluctuations in
currency exchange rates;
■
potentially adverse
tax consequences, including the complexities of foreign value added
or other tax systems and restrictions on the repatriation of
earnings;
■
the burdens of
complying with a wide variety of foreign laws and legal
standards;
■
increased financial
accounting and reporting burdens and complexities;
■
potentially slower
adoption rates of communications management solutions services
internationally;
■
political, social
and economic instability abroad, terrorist attacks and security
concerns in general; and
■
reduced or varied
protection for intellectual property rights in some
countries.
Operating in
international markets also requires significant management
attention and financial resources. The investment and additional
resources required to establish operations and manage growth in
other countries may not produce desired levels of revenue or
profitability.
Expansion into international markets could require us to comply
with additional billing, invoicing, communications, data privacy
and similar regulations, which could make it costly or difficult to
operate in these markets.
Many international
regulatory agencies have adopted regulations related to where and
how communications bills may be sent and how the data on such bills
must be handled and protected. For instance, certain countries
restrict communications bills from being sent outside of the
country, either physically or electronically, while other countries
require that certain information be encrypted or redacted before
bills may be transmitted electronically. These regulations vary
from jurisdiction to jurisdiction and international expansion of
our business could subject us to additional similar regulations.
Failure to comply with these regulations could result in
significant monetary penalties and compliance with these
regulations could require expenditure of significant financial and
administrative resources.
In addition,
personally identifiable information is increasingly subject to
legislation and regulations in numerous jurisdictions around the
world, the intent of which is to protect the privacy of personal
information that is collected, processed and transmitted in or from
the governing jurisdiction. Our failure to comply with applicable
safe harbor, privacy laws and international security regulations or
any security breakdown that results in the unauthorized release of
personally identifiable information or other customer data could
result in fines or proceedings by governmental agencies or private
individuals, which could harm our results of
operations.
23
If we fail to effectively manage and develop our strategic
relationships with key systems integrators, or if those third
parties choose not to market and sell our TM2 offering, our
operating results would suffer.
The successful
implementation of our strategic goals is dependent in part on
strategic relationships with key systems integrators and other
strategic partners. While our relationships with key systems
integrators and other strategic partners is relatively a new
strategy, we believe that our business relationship is strong and
continuing to grow and we believe that our key systems integrators
and other strategic partners will continue to support the inclusion
of our TM2 offering as part of their overall technology solution
offering.
Some of our
strategic relationships are relatively new and, therefore, it is
uncertain whether these third parties will be able to market and
sell our solution successfully or provide the volume and quality of
customers that we believe may exist. If we are unable to manage and
develop our strategic relationships, the growth of our customer
base may be harmed and we may have to devote substantially more
resources to the distribution, sales and marketing of our solution,
which would increase our costs and decrease our
earnings.
The emergence of one or more widely used, standardized
communications devices or billing or operational support systems
could limit the value and operability of our TM2 solution and our
ability to compete with the manufacturers of such devices or the
carriers using such systems in providing similar
services.
Our TM2 solution
derives its value in significant part from our communications
management software’s ability to interface with and support
the interoperation of diverse communications devices, billing
systems and operational support systems. The emergence of a single
or a small number of widely used communications devices, billing
systems or operational support systems using consolidated,
consistent sets of standardized interfaces for the interaction
between communications service providers and their enterprise
customers could significantly reduce the value of our solution to
our customers and potential customers. Furthermore, any such
communications device, billing system or operational support system
could make use of proprietary software or technology standards that
our software might not be able to support. In addition, the
manufacturer of such device, or the carrier using such billing
system or operational support system, might actively seek to limit
the interoperability of such device, billing system or operational
support system with our software products for competitive or other
reasons. The resulting lack of compatibility of our software
products would put us at a significant competitive disadvantage, or
entirely prevent us from competing, in that segment of the
potential market if such manufacturer or carrier, or its authorized
licensees, were to develop one or more communications management
solutions competitive with our solution.
A continued proliferation and diversification of communications
technologies or devices could increase the costs of providing our
software products or limit our ability to provide our TM2 offering
to potential customers.
Our ability to
provide our TM2 offering is dependent on the technological
compatibility of our products with the communications
infrastructures and devices of our customers and their
communications service providers. The development and introduction
of new communications technologies and devices requires us to
expend significant personnel and financial resources to develop and
maintain interoperability of our software products with these
technologies and devices. Continued proliferation of communications
products and services could significantly increase our research and
development costs and increase the lag time between the initial
release of new technologies and products and our ability to provide
support for them in our software products, which would limit the
potential market of customers that we have the ability to serve and
the financial feasibility of our TM2 offering.
24
Actual or perceived breaches of our security measures, or
governmental required disclosure of customer information could
diminish demand for our solution and subject us to substantial
liability.
In the processing
of communications transactions, we receive, transmit and store a
large volume of sensitive customer information, including call
records, billing records, contractual terms, and financial and
payment information, including credit card information, and we have
entered into contractual obligations to maintain the
confidentiality of certain of this information. Any person who
circumvents our security measures could steal proprietary or
confidential customer information or cause interruptions in our
operations and any such lapse in security could expose us to
litigation, substantial contractual liabilities, loss of customers
or damage to our reputation or could otherwise harm our business.
We incur significant costs to protect against security breaches and
may incur significant additional costs to alleviate problems caused
by any breaches. In addition, if we are required to disclose any of
this sensitive customer information to governmental authorities,
that disclosure could expose us to a risk of losing customers or
could otherwise harm our business.
If customers
believe that we may be subject to requirements to disclose
sensitive customer information to governmental authorities, or that
our systems and software products do not provide adequate security
for the storage of confidential information or its transmission
over the Internet or corporate extranets, or are otherwise
inadequate for Internet or extranet use, our business will be
harmed. Customers’ concerns about security could deter them
from using the Internet to conduct transactions that involve
confidential information, including transactions of the types
included in our solution, so our failure to prevent security
breaches, or the occurrence of well-publicized security breaches
affecting the Internet in general, could significantly harm our
business and financial results.
Defects or errors in our TM2 platform and/or processes could harm
our reputation, impair our ability to sell our products and result
in significant costs to us.
A key part of our
service delivery involves the use of internally developed software
solutions. If our software solutions contain undetected defects or
errors that affect our ability to process customer transactions,
prepare reports and/or deliver our services in general it may
result in a failure to perform in accordance with customer
expectations and could result in monetary damages against us.
Because our customers use our software products for important
aspects of their businesses, any defects or errors in, or other
performance problems with, our software products could hurt our
reputation and may damage our customers’ businesses. If that
occurs, we could be required to issue substantial service credits
that reduce amounts invoiced to our customers, lose out on future
sales or our existing customers could elect to not renew their
customer agreements with us. Product performance problems could
result in loss of market share, failure to achieve market
acceptance and the diversion of development resources from software
enhancements. If our software products fail to perform or contain a
technical defect, a customer might assert a claim against us for
damages. Whether or not we are responsible for our software’s
failure or defect, we could be required to spend significant time
and money in litigation, arbitration or other dispute resolution,
and potentially pay significant settlements or
damages.
We provide minimum service-level commitments to many of our
customers, and our inability to meet those commitments could result
in significant loss of customers, harm to our reputation and costs
to us.
Many of our
customer agreements currently, or may in the future, require that
we meet minimum service level commitments regarding items such as
platform availability, invoice processing speed and order
processing speed. If we are unable to meet the stated service level
commitments under these agreements many of our customers will have
the right to terminate their agreements with us and we may be
contractually obligated to provide our customers with credits or
pay other penalties. If our software products are unavailable for
significant periods of time we may lose a substantial number of our
customers as a result of these contractual rights, we may suffer
harm to our reputation and we may be required to provide our
customers with significant credits or pay our customers significant
contractual penalties, any of which could harm our business,
financial condition, results of operations.
25
Risks
Related To Our Common Stock
Our common stock price has been volatile and trading in a narrow
range.
The stock market
has, from time to time, experienced extreme price and volume
fluctuations. The market prices of the securities of companies in
our industry have been especially volatile. Broad market
fluctuations of this type may adversely affect the market price of
our common stock. The market price of our common stock has
experienced, and may continue to be subject to volatility due to a
variety of factors, including:
■
public
announcements concerning us, our competitors or our
industry;
■
externally
published articles and analyses about us by retail investors and
non-analysts;
■
changes in
analysts’ earnings estimates;
■
the failure the
meet the expectations of analysts;
■
fluctuations in
operating results;
■
additional
financings or capital raises;
■
introductions of
new products or services by us or our competitors;
■
announcements of
technological innovations;
■
additional sales of
our common stock or other securities;
■
trading by
individual investors that causes our stock prices to straddle at a
low price for prolonged periods of time;
■
our inability to
gain market acceptance of our products and services;
and
■
general economic
conditions and events, including adverse changes in the financial
markets or health pandemics such as the coronavirus.
In the past, some
companies that have experienced volatility in the market price of
their stock have been the object of securities class action
litigation. If we were the object of securities class action
litigation, we could incur substantial costs and experience a
diversion of our management’s attention and resources and
such securities class action litigation could have a material
adverse effect on our business, financial condition and results of
operations.
The future sale of shares of our common stock may negatively affect
our common stock price and/or be dilutive to current
stockholders.
If we or our
stockholders sell substantial amounts of our common stock, the
market price of our common stock could fall. Such stock issuances
may be made at a price that reflects a discount from the
then-current trading price of our common stock. In addition, in
order to raise capital for acquisitions or other general corporate
purposes, we would likely need to issue securities that are
convertible into or exercisable for a significant number of shares
of our common stock. These issuances would dilute our stockholders
percentage ownership interest, which would have the effect of
reducing our stockholders’ influence on matters on which our
stockholders vote, and might dilute the book value of our common
stock. There is no assurance that we will not seek to sell
additional shares of our common stock in order to meet our working
capital or other needs in a transaction that would be dilutive to
current stockholders.
26
A third party could be prevented from acquiring shares of our
common stock at a premium to the market price because of our
anti-takeover provisions.
Various provisions
of our certificate of incorporation, by-laws and Delaware law could
make it more difficult for a third party to acquire us, even if
doing so might be beneficial to you and our other stockholders. We
are subject to the provisions of Section 203 of the General
Corporation Law of Delaware. Section 203 prohibits a publicly held
Delaware corporation from engaging in a “business
combination” with any interested stockholder for a period of
three years after the date of the transaction in which the person
became an interested stockholder, unless the business combination
is approved in a prescribed manner. A “business
combination” includes mergers, asset sales and other
transactions resulting in a financial benefit to the interested
stockholder. Subject to certain exceptions, an “interested
stockholder” is (i) a person who, together with affiliates
and associates, owns 15% or more of our voting stock or (ii) an
affiliate or associate of ours who was the owner, together with
affiliates and associates, of 15% or more of our outstanding voting
stock at any time within the 3-year period prior to the date for
determining whether such person is
“interested.”
Our certificate of
incorporation also provides that any action required or permitted
to be taken by our stockholders at an annual meeting or special
meeting of stockholders may be taken without such meeting only by
the unanimous consent of all stockholders entitled to vote on the
particular action. In order for any matter to be considered
properly brought before a meeting, a stockholder must comply with
certain requirements regarding advance notice to us. The foregoing
provisions could have the effect of delaying until the next
stockholders’ meeting stockholder actions, which are favored
by the holders of a majority of our outstanding voting securities.
These provisions may also discourage another person or entity from
making a tender offer for our common stock, because such person or
entity, even if it acquired a majority of our outstanding voting
securities, would be able to take action as a stockholder (such as
electing new directors or approving a merger) only at a duly called
stockholders’ meeting, and not by written
consent.
The General
Corporation Law of Delaware provides generally that the affirmative
vote of a majority of the shares entitled to vote on any matter is
required to amend a corporation’s certificate of
incorporation or bylaws, unless a corporation’s certificate
of incorporation or bylaws, as the case may be, requires a greater
percentage. Our certificate of incorporation and bylaws do not
require a greater percentage vote. Our board of directors is
classified into three classes of directors, with approximately
one-third of the directors serving in each such class of directors
and with one class of directors being elected at each annual
meeting of stockholders to serve for a term of three years or until
their successors are elected and take office. Our bylaws provide
that the board of directors will determine the number of directors
to serve on the board. Our board of directors presently consists of
five members.
Our certificate of
incorporation and bylaws contain certain provisions permitted under
the General Corporation Law of Delaware relating to the liability
of directors. The provisions eliminate, to the fullest extent
permitted by the General Corporation Law of Delaware, a
director’s personal liability to us or our stockholders with
respect to any act or omission in the performance of his or her
duties as a director. Our certificate of incorporation and bylaws
also allow us to indemnify our directors, to the fullest extent
permitted by the General Corporation Law of Delaware. Our bylaws
also provide that we may grant indemnification to any officer,
employee, agent or other individual as our Board may approve from
time to time. We believe that these provisions will assist us in
attracting and retaining qualified individuals to serve as
directors.
We do not expect to declare any dividends in the foreseeable
future.
We do not
anticipate declaring any cash dividends to holders of our common
stock in the foreseeable future. Consequently, investors must rely
on sales of their common stock after price appreciation, which may
never occur, as the only way to realize any future gains on their
investment. Investors seeking cash dividends should not purchase
our common stock.
27
ITEM
1B. UNRESOLVED STAFF COMMENTS
Not
applicable.
ITEM
2. PROPERTIES
All of our property
locations are leased. We believe we can obtain additional
facilities required to accommodate projected needs without
difficulty and at commercially reasonable prices, although no
assurance can be given that we will be able to do so. The following
table presents our property locations at December 31, 2019 for our
U.S. locations:
|
|
|
|
|
|
|
Base
|
Base
|
|
|
|
|
|
Lease
|
Approx.
|
Cost per
|
Annual
|
|
Physical Street Address
|
|
City, State Zip Code
|
|
Expiration
|
Sqft
|
Sqft
|
Cost
|
|
|
|
|
|
|
|
|
|
|
11250
Waples Mill Rd S. Tower, Suite 210
|
|
Fairfax,
VA 22030
|
|
March
2029
|
11,852
|
$
28
|
$
337,000
|
|
8351
N High Street, Suite 200
|
|
Columbus,
OH 43235
|
|
September
2027
|
14,382
|
$
9
|
$
131,000
|
|
2101
Executive Drive, Suite 400
|
|
Hampton,
VA 23669
|
|
December
2024
|
6,440
|
$
16
|
$
103,000
|
The following table
presents our property locations at December 31, 2019 for our
international locations:
|
|
|
|
|
|
|
Base
|
Base
|
|
|
|
|
|
Lease
|
Approx.
|
Cost per
|
Annual
|
|
Physical Street Address
|
|
Country Postal Code
|
|
Expiration
|
Sqft
|
Sqft
|
Cost
|
|
|
|
|
|
|
|
|
|
|
South
County Business Park
|
|
Dublin
18, Ireland
|
|
March
2026
|
6,000
|
$
30
|
$
182,000
|
ITEM
3. LEGAL PROCEEDINGS
From
time to time we may be involved in claims arising in the ordinary
course of business. We are not currently involved in legal
proceedings, governmental actions, investigations or claims
currently pending against us or involve us that, in the opinion of
our management, could reasonably be expected to have a material
adverse effect on our business and financial
condition.
ITEM
4. MINE SAFETY DISCLOSURES
None.
28
PART
II
ITEM
5.
MARKET
FOR REGISTRANT'S COMMON EQUITY, RELATED STOCKHOLDER MATTERS AND
ISSUER PURCHASES OF EQUITY SECURITIES
Market Information
Our common stock
trades on the NYSE American under the symbol
“WYY”.
Holders
As of
the close of business on March 20, 2020, there were 105 registered
holders of record of our common stock.
Transfer Agent and Registrar
The transfer agent
and registrar for our common stock is American Stock Transfer &
Trust Company.
Dividend Policy
We have never paid
dividends on our Common Stock and intend to continue this policy
for the foreseeable future. We plan to retain earnings for use in
growing our business base. Any future determination to pay
dividends will be at the discretion of our Board of Directors and
will be dependent on our results of operations, financial
condition, contractual and legal restrictions and any other factors
deemed by the management and the Board to be a priority requirement
of the business.
Recent Sales of Unregistered Securities
None.
Repurchases of Equity Securities
As approved by the
Board of Directors on October 7, 2019, we entered into a stock
repurchase plan (the “2019 Repurchase Plan”) to
purchase up to $2.5 million of our common stock. Under this
program, we are authorized to repurchase our issued and outstanding
common shares from time to time in open-market and privately
negotiated transactions and block trades in accordance with federal
securities laws, including Rule 10b-18 promulgated under the
Securities Exchange Act of 1934 as amended. During the year
ended December 31, 2019, we repurchased 863,733 shares of
our common stock for a total of approximately $366,000.
Subsequent to December 31, 2019, we repurchased 24,174 shares of
our common stock for a total of approximately $10,100.
|
|
Total Number of
|
Average Price
|
Purchased as Part of Publicly Announced
|
Approximate Dollar Value of Shares that May Yet Be Purchased under
the
|
|
|
Shares
Purchased
|
Paid
Per Share
|
Plans or
Programs
(1)
|
Plan or
Programs
|
|
October
|
-
|
$
-
|
-
|
$
2,500,000
|
|
|
|
|
|
|
|
November
|
346,157
|
$
0.39
|
346,157
|
$
2,364,515
|
|
|
|
|
|
|
|
December
|
517,576
|
$
0.39
|
517,576
|
$
2,154,037
|
|
|
|
|
|
|
|
Total
|
863,733
|
$
0.39
|
863,733
|
|
(1)
Shares were repurchased pursuant to the $2.5 million
repurchase program announced on October 7, 2019
29
ITEM
6. SELECTED FINANCIAL DATA
Not
Applicable
ITEM
7. MANAGEMENT'S DISCUSSION AND ANALYSIS OF FINANCIAL
CONDITION AND RESULTS OF OPERATIONS
This discussion should be read in conjunction with the other
sections of this Form 10-K, including “Risk Factors,”
and the Financial Statements and notes thereto. The various
sections of this discussion contain a number of forward-looking
statements, all of which are based on our current expectations and
could be affected by the uncertainties and risk factors described
throughout this Annual Report on Form 10-K. See
“Forward-Looking Statements.” Our actual results may
differ materially.
Organizational
Overview
We were
incorporated on May 30, 1997 under the laws of the state of
Delaware. We are a leading provider of federally certified secure
identity management and communications solutions to the government
and commercial sectors. Our on-demand solutions offer a suite of
advanced and federally certified proprietary software solutions
designed to enable secure identity management and manage the
complex processes and expenses associated with complex
communication assets and services of any enterprise.
Strategic
Focus
We successfully
executed on our key initiatives for 2019 by increasing our customer
base and our sales pipeline. We were able to leverage our strategic
relationships with key system integrators and strategic partners to
capture additional market share. We were also able attain
Authorization to Operate (ATO) in the GovCloud which represents a
major milestone for our delivery platform, ITMS
TM
. Additionally, we
were able to improve our topline growth and bottom line
profitability. Looking forward to fiscal 2020, we will be focusing
more of our attention on the following key goals:
■
continued focus on
selling high margin managed services,
■
growing our sales
pipeline by investing in our business development and sales team
assets,
■
pursuing additional
opportunities with our key systems integrator and strategic
partners,
■
improving our
proprietary platform and products, which includes pursuing a
FedRAMP certification for ITMS™, and maintaining our ATOs
with our federal government agencies,
■
expanding our
solution set to deliver additional capabilities, and
■
increasing our
government and commercial base.
Our longer-term
strategic focus and goals are driven by our need to expand our
critical mass so that we have more flexibility to fund investments
in technology solutions and introduce new sales and marketing
initiatives in order to expand our marketplace share and increase
the breadth of our offerings in order to improve company
sustainability and growth. Our next steps towards achieving our
longer-term goals include:
■
pursuing accretive
and strategic acquisitions to expand our solutions and our customer
base,
■
delivering new
incremental offerings to add to our existing TM2
offering,
■
developing and
testing innovative new offerings that enhance our TM2 offering,
and
■
transitioning our
data center and support infrastructure into a more cost-effective
and federally approved cloud environment to comply with perceived
future contract requirements.
We believe these
actions could drive a strategic repositioning our TM2 offering and
may include the sale of non-aligned offerings coupled with
acquisitions of complementary and supplementary offerings that
could result in a more focused core set of TM2
offerings.
30
Critical
Accounting Policies and Estimates
Refer to Note 2 to
the consolidated financial statements for a summary of our
significant accounting policies referenced, as applicable, to other
notes. In many cases, the accounting treatment of a particular
transaction is specifically dictated by U.S. GAAP and does not
require management’s judgment in its application. Our senior
management has reviewed these critical accounting policies and
related disclosures with its Audit Committee. See Note 2 to
consolidated financial statements, which contain additional
information regarding accounting policies and other disclosures
required by U.S. GAAP. The following section below provides
information about certain critical accounting policies that are
important to the consolidated financial statements and that require
significant management assumptions and judgments.
Segments
Segments are
defined by authoritative guidance as components of a company in
which separate financial information is available and is evaluated
by the chief operating decision maker (CODM), or a decision-making
group, in deciding how to allocate resources and in assessing
performance. Our CODM is our chief executive officer.
Our customers view
our market as a singular business and demand an integrated and
scalable suite of enterprise-wide solutions. Our TM2 offerings are
substantially managed service driven solutions that use our
proprietary technology platform to deliver our services. The amount
of labor required to perform our contract obligations may vary
significantly contract to contract depending on the
customer’s specific requirements; however, the way in which
we perform these services is consistent across the company and
requires a connected group of internal subject matter experts and
support personnel.
In order to
evaluate a managed service business model our CODM and the
executive management team measure financial performance based on
our overall mixture of managed and carrier services and related
margins. These financial metrics provide a stronger indication of
how we are managing our key customer relationships; and it also
determines our overall profitability.
We present a single
segment for purposes of financial reporting and prepared
consolidated financial statements upon that basis.
Revenue
Recognition
Our managed
services solutions may require a combination of labor, third party
products and services. Our managed services are generally not
interdependent and our contract performance obligations are
delivered consistently on a monthly basis. We do not typically have
undelivered performance obligations in these arrangements which
would require us to spread our revenue over a longer period of
time. In the event there are undelivered performance obligations
our practice is to defer such revenue and recognize when the
performance obligation has been satisfied.
.
A substantial
portion of our revenues are derived from firm fixed price contracts
with the U.S. federal government that are fixed fee arrangements
tied to the number of devices managed. Our actual reported revenue
may fluctuate month to month depending on the hours worked, number
of users, number of devices managed, actual or prospective proven
expense savings, actual technology spend, or any other metrics as
contractually agreed to with our customers.
31
Our revenue
recognition policies for our billable managed services is
summarized and shown below:
■
Managed services
are delivered on a
monthly basis based on a standard fixed pricing scale and sensitive
to significant changes in per user or device counts which form the
basis for monthly charges. Revenue is recognized upon the
completion of the delivery of monthly managed services based on
user or device counts or other metrics. Managed services are not
interdependent and there are no undelivered elements in these
arrangements.
■
Identity service
s are delivered as an
on-demand managed service through the cloud to an individual or
organization or sold in bulk to an organization capable of
self-issuing credentials. There are two aspects to issuing an
identity credential to an individual that consists of identity
proofing which is a significant part of the service and monthly
credential valuation services which enable the credential holder to
access third party systems. Identity proofing services are not
bundled and do not generally include other performance obligations
to deliver. Revenue is recognized from the sales of identity
credentials to an individual or organization upon issuance less a
portion deferred for monthly credential validation support
services. In the case of bulk sales or consoles revenue is
recognized upon issue or availability to the customer for issuance.
There is generally no significant performance obligation to provide
post contract services in relation to identity consoles delivered.
Identity certificates issued have a fixed life and cannot be
modified once issued.
Our
revenue recognition policies for our billable labor services is
summarized and shown below:
■
Billable services
are managed and
professional ervices provided
on a project basis determined by our customers’ specific
requirements. These fees are billed based on fixed billable rates
and time incurred. We recognize revenues based on actual hours
worked and actual costs incurred.
Our
revenue recognition policies for our billable reselling services is
summarized and shown below:
■
Reselling services
require the Company
to acquire third party products and services to satisfy customer
contractual obligations. We recognize revenues and related costs on
a gross basis for such arrangements whenever we have primary
economic risk. We have economic risk in these transactions as we
are seen as the primary creditor, we carry inventory risk for
undelivered products and services, we directly issue purchase
orders third party suppliers, and we have discretion in sourcing
among many different suppliers. For those transactions in which we
procure and deliver products and services for our customers’
on their own account we do not recognize revenues and related costs
on a gross basis for these arrangements. We only recognize revenues
earned for arranging the transaction and any related
costs.
Our revenue
recognition policies for our billable carrier services is
summarized and shown below:
■
Carrier services
are delivered on a
monthly basis and consist of phone, data and satellite and related
mobile services for a connected device or end point. These services
require us to procure, process and pay communications carrier
invoices. We recognize revenues and related costs on a gross basis
for such arrangements whenever we have primary economic risk. We
have economic risk in these transactions when we are seen as the
primary creditor, we directly issue purchase orders directly to
communications carriers for wireline and wireless services, and/or
we have discretion in choosing optimal providers and rate plans.
For arrangements in which we do not have such economic risk we
recognize revenues and related costs on a net basis.
32
Goodwill
Goodwill represents
the excess of acquisition cost of an acquired company over the fair
value of assets acquired and liabilities assumed. In accordance
with U. S. GAAP, goodwill is not amortized but is tested for
impairment at the reporting unit level annually at December 31 and
between annual tests if events or circumstances arise, such as
adverse changes in the business climate, that would more likely
than not reduce the fair value of the reporting unit below its
carrying value.
A reporting unit is
defined as either an operating segment or a business one level
below an operating segment for which discrete financial information
is available that management regularly reviews. The Company has a
single reporting unit for the purpose of impairment
testing.
The goodwill
impairment test utilizes a two-step approach. The first step
identifies whether there is potential impairment by comparing the
fair value of a reporting unit to its carrying amount, including
goodwill. If the fair value of a reporting unit is less than its
carrying amount, the second step of the impairment test is required
to measure the amount of any impairment loss. We have the option to
bypass the qualitative assessment for any reporting period and
proceed to performing the first step of the two-step goodwill
impairment test and then subsequently resume performing a
qualitative assessment in any subsequent period. We bypassed using
a qualitative assessment for 2019.
Goodwill impairment
testing involves management judgment, requiring an assessment of
whether the carrying value of the reporting unit can be supported
by its fair value using widely accepted valuation techniques, such
as the market approach (earnings multiples or transaction multiples
for the industry in which the reporting unit operates) or the
income approach discounted cash flow methods). The fair values of
the reporting units were determined using a combination of
valuation techniques consistent with the market approach and the
income approach.
When preparing
discounted cash flow models under the income approach, we estimate
future cash flows using the reporting unit’s internal
five-year forecast and a terminal value calculated using a growth
rate that management believes is appropriate in light of current
and expected future economic conditions. We then apply a discount
rate to discount these future cash flows to arrive at a net present
value amount, which represents the estimated fair value of the
reporting unit. The discount rate applied approximates the expected
cost of equity financing, determined using a capital asset pricing
model. The model generates an appropriate discount rate using
internal and external inputs to value future cash flows based on
the time value of money and the price for bearing the uncertainty
inherent in an investment.
We had
approximately $18.5 million of goodwill as of December 31, 2019.
The fair value of our single reporting unit was above carrying
value; accordingly, we have concluded that goodwill is not impaired
at December 31, 2019. The Company could be exposed to increased
risk of goodwill impairment if future operating results or
macroeconomic conditions differ significantly from our current
assumptions.
Allowance
for Doubtful Accounts
We have not
historically maintained an allowance for doubtful accounts for our
federal government customers as we have not experienced material or
recurring losses. Allowances for doubtful accounts relate to
commercial accounts receivable and such an allowance represents
management’s best estimate of the losses inherent in the
Company’s outstanding trade accounts receivable. We determine
the allowance for doubtful accounts by considering a number of
factors, including the length of time accounts receivable are past
due, the customers’ previous payment history and current
ability to pay its obligation, and the condition of the general
economy and the industry as a whole. Customer account balances
outstanding longer than 120 days that have not been settled in
accordance with contract terms or for which no firm payment
commitments exist are placed with a third party collection agency
and a reserve is established. We write off the reserved accounts
receivable against the existing allowance after it is determined
that such accounts are ultimately uncollectible. Payments
subsequently received on such receivables are credited to the
allowance for doubtful accounts. If the accounts receivable has
been written off and no allowance for doubtful accounts exist
subsequent payments received are credited to bad debt
expense.
33
To the extent
historical credit experience, updated for emerging market trends in
credit is not indicative of future performance, actual losses could
differ significantly from management’s judgments and
expectations, resulting in either higher or lower future provisions
for losses, as applicable. The process of determining the allowance
for doubtful accounts requires a high degree of judgment. It is
possible that others, given the same information, may at any point
in time reach different reasonable conclusions.
During the year
ended December 31, 2019, the Company recorded net provisions for
bad debt expense totaling approximately $22,000 related to
commercial contracts.
Share-Based
Compensation
We issue
share-based compensation awards to employees, directors, an on
occasion to non-employees upon which the fair value of awards is
subject to significant estimates made by management. The fair value
of each option award is estimated on the date of grant using a
Black-Scholes option pricing model (“Black-Scholes
model”), which uses the assumptions of no dividend yield,
risk free interest rates and expected life (in years) of
approximately two (2) to ten (10) years.
Expected
volatilities are based on the historical volatility of our common
stock. The expected term of options granted is based on analyses of
historical employee termination rates and option exercises. The
risk-free interest rates are based on the U.S. Treasury yield for a
period consistent with the expected term of the option in effect at
the time of the grant. To the extent historical volatility
estimates, risk free interest rates, option terms and forfeiture
rates updated for emerging market trends are not indicative of
future performance it could differ significantly from
management’s judgments and expectations on the fair value of
similar share-based awards, resulting in either higher or lower
future compensation expense, as applicable. The process of
determining fair value of share-based compensation requires a high
degree of judgment. It is possible that others, given the same
information, may at any point in time reach different reasonable
conclusions.
Accounting
for Income Taxes
Deferred tax assets
and liabilities are determined based on the differences between the
financial statement and tax bases of assets and liabilities using
the enacted tax rates expected to be in effect for the years in
which the differences are expected to reverse. A valuation
allowance is established when management determines that it is more
likely than not that all or some portion of the benefit of the
deferred tax asset will not be realized.
Since deferred
taxes measure the future tax effects of items recognized in the
financial statements, certain estimates and assumptions are
required to determine whether it is more likely than not that all
or some portion of the benefit of a deferred tax asset will not be
realized. In making this assessment, management analyzes and
estimates the impact of future taxable income, reversing temporary
differences and available tax planning strategies. These
assessments are performed quarterly, taking into account any new
information.
The Company’s
significant deferred tax assets consist of net operating loss
carryforwards, share-based compensation and intangible asset
amortization related to prior business acquisitions. Should a
change in facts or circumstances lead to a change in judgment about
the ultimate ability to realize a deferred tax asset (including our
utilization of historical net operating losses and share-based
compensation expense), the Company records or adjusts the related
valuation allowance in the period that the change in facts or
circumstances occurs, along with a corresponding increase or
decrease to the income tax provision.
34
2019
Results of Operations
Year Ended December 31, 2019 Compared to the Year ended December
31, 2018
Revenues
Revenues for the
year ended December 31, 2019 were approximately $101.7 million, an
increase of approximately $18.0 million (or 22%), as compared to
approximately $83.7 million in 2018. Our mix of revenues for the
periods presented is set forth below:
|
|
YEARS
ENDED
|
|
|
|
|
DECEMBER
31,
|
Dollar
|
|
|
|
2019
|
2018
|
Variance
|
|
|
|
|
|
|
Carrier
Services
|
$
68,739,090
|
$
50,050,000
|
$
18,689,090
|
|
Managed
Services:
|
|
|
|
|
Managed
Service Fees
|
25,830,928
|
25,232,019
|
598,909
|
|
Billable
Service Fees
|
4,304,616
|
1,838,018
|
2,466,598
|
|
Reselling
and Other Services
|
2,845,613
|
6,558,859
|
(3,713,246
)
|
|
|
|
|
|
|
|
$
101,720,247
|
$
83,678,896
|
$
18,041,351
|
■
Our carrier
services
increased primarily
due to activities of the U.S. Department of Commerce contract
supporting the 2020 Census. Additionally, the carrier services
increased in lesser extent due to the implementation of the U.S.
Coast Guard contract and the expansion of our Customs & Border
Protection task order (CBP).
■
Our managed service
fees
increased slightly
due to expansion of managed services for existing government and
commercial customers, as well as increases in sales of accessories
to our government customers as compared to last year.
■
Billable service
fees increased
as compared to last
year due to ramp up of services delivered through our partnerships
with large systems integrators as we complete a government project,
partially offset by the impact of discontinuation of lower margin
commercial billable projects. Billable service fees are project
based and customized to customers’ requirements and the
services extend beyond the core managed
services
.
■
Reselling and other
services
decreased as
compared to last year due to timing of large product resale.
Reselling and other services are transactional in nature and as a
result the amount and timing of revenue will vary significantly
from quarter to quarter.
35
Revenues by
customer type for the periods presented is set forth
below:
|
|
YEARS
ENDED
|
|
|
|
|
DECEMBER
31,
|
Dollar
|
|
|
|
2019
|
2018
|
Variance
|
|
|
|
|
|
|
U.S.
Federal Government
|
$
86,497,328
|
$
66,346,922
|
$
20,150,406
|
|
U.S.
State and Local Governments
|
479,379
|
445,855
|
33,524
|
|
Foreign
Governments
|
109,948
|
148,155
|
(38,207
)
|
|
Commercial
Enterprises
|
14,633,592
|
16,737,964
|
(2,104,372
)
|
|
|
|
|
|
|
|
$
101,720,247
|
$
83,678,896
|
$
18,041,351
|
■
Our sales
to
federal government customers increased primarily due to activities
of the U.S. Department of Commerce contract supporting the 2020
Census and increased units managed for Department of Homeland
Security (DHS).
■
Our sales to state
and local government customers increased as compared to last year
due to increases in the number of units managed.
■
Our sales to
foreign government customers decreased as compared to last year due
to a slow-down in the timing of sales of perpetual
licenses.
■
Our sales to
commercial
enterprise customers decreased in 2019 as compared to 2018
primarily due to discontinuation of lower margin professional
services.
Cost
of Revenues
Cost of revenues
for the year ended December 31, 2019 were approximately $84.3
million (or 83% of revenues) as compared to approximately $68.4
million (or 82% of revenues) in 2018. The dollar increase was
driven by higher carrier services and higher labor costs to support
billable service fee contracts and inventory costs related to
accessory sales as compared to last year. Our cost of revenues may
fluctuate due to revenue mix, such as higher carrier services and
product and accessories sales activities which depends heavily on
customer mobility equipment accessory requirements.
Gross
Profit
Gross profit for
the year ended was approximately $17.4 million (or 17% of
revenues), as compared to approximately $15.3 million (or 18% of
revenues) in 2018. The dollar increase in gross profit
reflects higher margins related to billable services and
accessories sales as compared to last year.
Operating
Expenses
Sales and marketing
expense for the year ended December 31, 2019 was approximately $1.7
million (or 1.6% of revenues), as compared to approximately $1.7
million (or 2.1% of revenues) in 2018. We maintained our
conservative deployment of sales and marketing assets during 2019
which enabled us to keep our cost profile unchanged. We expect to
make strategic hires of sales and marketing resources in an effort
to build our commercial sales pipeline opportunities.
General and
administrative expenses for the year ended December 31, 2019 were
approximately $13.8 million (or 14% of revenues), as compared to
approximately $13.3 million (or 16% of revenues) in 2018. The
decrease (as a percentage of revenue) in general and administrative
expense reflects the impact of our adoption of new lease accounting
guidance which requires us to treat lease payments similar to term
debt with recognition of interest expense and amortization expense.
Excluding the impact of our adoption of this new lease accounting
standard our general and administrative expense would have been
$14.4 million (of 14% of revenues) for 2019.
36
Product development
costs associated with our next generation TDI Optimiser™
application for the years ended December 31, 2019 and 2018 were
approximately $146,000 and $229,000, respectively, which were
capitalized.
Depreciation and
amortization expense for the year ended December 31, 2019 was
approximately $988,100, as compared to approximately $415,300 in
2018. The increase in depreciation and amortization
expense reflects the impact of our adoption of new lease accounting
guidance which requires us to treat lease payments similar to term
debt with recognition of interest expense and amortization expense.
Excluding the impact of our adoption of this new lease accounting
standard our depreciation and amortization expense would have been
$419,500 for 2019.
Other
(Expense) Income
Net
other expense for the year ended December 31, 2019 was
approximately $266,400 as compared to approximately $72,700 in
2018. The increase in net expense substantially reflects
higher interest expense as a result of the adoption of the new
lease accounting standard during 2019 and to a lesser extent
interest expense associated with advances against our line of
credit.
Excluding
the impact of our adoption of new lease accounting, net other
expense would have been $19,628.
Provision
for Income Taxes
Income tax
provision for the year ended December 31, 2019 was approximately
$0.4 million, as compared to approximately $1.2 million in 2018.
The prior year income tax provision included state minimum taxes
and foreign taxes payable, as well as an out of period adjustment
of $1.2 million.
Net
Income (Loss)
As a result of the
factors above, net income for the year ended December 31, 2019 was
approximately $0.2 million as compared to a net loss of
approximately $1.5 million in 2018.
Liquidity
and Capital
Net Working Capital
Our immediate
sources of liquidity include cash and cash equivalents, accounts
receivable, unbilled receivables and access to a working capital
credit facility with Atlantic Union Bank for up to $5.0
million.
At December 31,
2019, our net working capital was approximately $5.0 million as
compared to $3.7 million at December 31, 2018. The increase in net
working capital was primarily driven by increases in
revenue and temporary payable timing differences. We utilized
our credit facility to manage short term cash flow requirements
during the quarter. We may need to raise additional capital to fund
major growth initiatives and/or acquisitions and there can be no
assurance that additional capital will be available on acceptable
terms or at all.
Cash Flows from Operating Activities
Cash provided by
operating activities provides an indication of our ability to
generate sufficient cash flow from our recurring business
activities. Our single largest cash operating expense is labor and
company sponsored benefits. Our second largest cash operating
expense is our facility costs and related technology communication
costs to support delivery of our services to our customers. We
lease our facilities under non-cancellable long term contracts. Any
changes to our fixed labor and/or infrastructure costs may require
a significant amount of time to take effect depending on the nature
of the change made and cash payments to terminate any agreements
that have not yet expired. We experience temporary collection
timing differences from time to time due to customer invoice
processing delays that are often beyond our control, including
intermittent U.S. federal government shutdowns related to budgetary
funding issues.
37
For the year ended
December 31, 2019, net cash provided by operations was
approximately $5.9 million driven by improved collections of
accounts receivable and temporary payable timing
differences.
For the year ended
December 31, 2018, net cash used in operations was approximately
$2.1 million driven by an increase in uncollected accounts
receivable and a temporary slowdown in billing out unbilled
accounts receivable due to the government shutdown.
Cash Flows from Investing Activities
Cash used in
investing activities provides an indication of our long term
infrastructure investments. We maintain our own technology
infrastructure and may need to make additional purchases of
computer hardware, software and other fixed infrastructure assets
to ensure our environment is properly maintained and can support
our customer obligations. We typically fund purchases of long term
infrastructure assets with available cash or capital lease
financing agreements.
For the year ended
December 31, 2019, cash used in investing activities was
approximately $0.5 million
and
predominantly consisted of computer hardware and furniture and
fixture purchases and capitalized internally developed software
costs related to our TDI Optimiser™
solutions.
For the year ended
December 31, 2018, cash used in investing activities was
approximately $0.5 million
and
predominantly consisted of computer hardware and software purchases
and capitalized internally developed software costs related to our
TDI Optimiser™ solutions
.
Cash Flows from Financing Activities
Cash used in
financing activities provides an indication of our debt financing
and proceeds from capital raise transactions and stock option
exercises.
For the year ended
December 31, 2019, cash used in financing activities was
approximately $0.8 million and consisted of finance lease principal
repayments of approximately $473,300, payment of debt issuance
costs of $5,000, and repurchases of our common stock of $366,000.
The Company was advanced and repaid approximately $6.8 million in
cumulative line of credit advances during the year.
For the year
ended December 31, 2018, cash used in financing activities was
approximately $0.2 million and consisted of capital lease principal
repayments of approximately $101,700, contingent consideration
of approximately $100,000 paid related to our intellectual property
acquisition of Probaris ID™, partially offset by proceeds of
approximately $44,000 from the exercise of stock options. The
Company was advanced and repaid approximately $14.0 million in
cumulative line of credit advances during the year.
Net Effect of Exchange Rate on Cash and Equivalents
For the year ended
December 31, 2019, the depreciation of the Euro relative to the US
dollar decreased the translated value of our foreign cash balances
by approximately $47,000 as compared to last year. For the year
ended December 31, 2018, the gradual depreciation of the Euro
relative to the US dollar decreased the translated value of our
foreign cash balances by approximately $57,600.
38
Credit Facilities and Other Commitments
At December 31,
2019, there were no outstanding borrowings against the
Company’s $5.0 million working capital credit facility with
Atlantic Union Bank. At December 31, 2019, there were no material
commitments for additional capital expenditures, but that could
change with the addition of material contract awards or task orders
awarded in the future. The available amount under the working
capital credit facility is subject to a borrowing base, which is
equal to the lesser of (i) $5.0 million or (ii) 70% of the net
unpaid balance of our eligible accounts receivable. The facility is
secured by a first lien security interest on all of our personal
property, including its accounts receivable, general intangibles,
inventory and equipment. The maturity date of the credit facility
is April 30, 2020 and the facility has a variable interest rate
equal to the Wall Street Journal prime rate plus
0.50%.
The credit facility
requires that the Company meet the following financial covenants on
a quarterly basis: (i) maintain a minimum adjusted tangible net
worth of at least $2.0 million, (ii) maintain minimum consolidated
adjusted EBITDA of at least two times interest expense and (iii)
maintain a current ratio of 1.10:1 (excluding finance lease
liabilities reported under recently adopted lease accounting
standards).
We believe our
working capital credit facility, provided it is renewed or replaced
upon its expiration on April 30, 2020, along with cash on hand,
should be sufficient to meet our minimum requirements for our
current business operations and implementation of new business.
Over the long term, we must successfully execute our growth plans
to increase profitable revenue and income streams to generate
positive cash flows to sustain adequate liquidity without impairing
growth initiatives or requiring the infusion of additional funds
from external sources to meet minimum operating requirements,
including debt service. We may need to raise additional capital to
fund our operations and there can be no assurance that additional
capital will be available on acceptable terms, or at
all.
Contractual
Obligations
The table below
identifies transactions that represent our contractually committed
future obligations. Purchase obligations include our agreements to
purchase goods and services that are enforceable and legally
binding and that specify significant terms, including: fixed or
minimum quantities to be purchased; fixed, minimum or variable
price provisions; and the approximate timing of the transaction.
The following reflects a summary of our contractual obligations for
fiscal years ending December 31:
|
Obligation Type
|
2020
|
2021
|
2022
|
2023
|
2024
|
Thereafter
|
Total
|
|
|
|
|
|
|
|
|
|
|
Operating
lease obligations (1)
|
$
774,339
|
$
794,852
|
$
815,985
|
$
771,833
|
$
791,357
|
$
4,074,464
|
$
8,022,830
|
|
Finance
lease obligations (1)
|
121,071
|
6,009
|
-
|
-
|
-
|
-
|
127,080
|
|
|
|
|
|
|
|
|
|
|
|
$
895,410
|
$
800,861
|
$
815,985
|
$
771,833
|
$
791,357
|
$
4,074,464
|
$
8,149,910
|
(1)
See
Note 8 for further information on leases and the
adoption of ASC 842.
As of
December 31, 2019, the Company has an additional lease for
office space that had not yet commenced with estimated future
minimum rental commitments of approximately $1.91 million.
This leases is expected to commence in 2020 with lease terms of up
to 8 years. These undiscounted amounts are not included in the
table above.
Off-Balance
Sheet Arrangements
The Company has no
existing off-balance sheet arrangements as defined under SEC
regulations.
39
ITEM
7A. QUANTITATIVE AND QUALITATIVE DISCLOSURES ABOUT MARKET
RISK
Not
required.
ITEM
8. FINANCIAL STATEMENTS AND SUPPLEMENTAL DATA
The consolidated
financial statements and schedules required hereunder and contained
herein are listed under Item 15 below.
ITEM
9A. CONTROLS AND PROCEDURES
Evaluation
of Disclosure Controls and Procedures
Under the
supervision and with the participation of our management, including
our chief executive officer and chief financial officer, we
conducted an evaluation of our disclosure controls and procedures,
as such term is defined under Rule 13a-15(e) and 15d-15(e)
promulgated under the Securities Exchange Act of 1934, as amended
(the "Exchange Act"). Based on this evaluation, our chief executive
officer and chief financial officer concluded that our disclosure
controls and procedures were not effective as of the end of the
period covered by this annual report on Form 10-K to ensure
information required to be disclosed in the reports filed or
submitted under the Exchange Act is recorded, processed, summarized
and reported, within the time period specified in the SEC's rules
and forms. These disclosure controls and procedures include
controls and procedures designed to ensure that information
required to be disclosed by us in the reports we file or submit is
accumulated and communicated to management, including our chief
executive officer and chief financial officer, as appropriate, to
allow timely decisions regarding required disclosure.
Management's
Annual Report on Internal Control over Financial
Reporting
Our management is
responsible for establishing and maintaining adequate internal
control over financial reporting, as such term is defined in
Exchange Act Rules 13a-15(f) and 15d-15(f). Under the supervision
and with the participation of our management, including our chief
executive officer and chief financial officer, we conducted an
evaluation of the effectiveness of our internal control over
financial reporting based on the framework in Internal Control -
Integrated Framework issued by the Committee of Sponsoring
Organizations of the Treadway Commission. Based on our evaluation
under the framework in Internal Control - Integrated Framework
(2013), our management concluded that our internal control over
financial reporting (ICOFR) was effective as of December 31,
2019.
This Annual Report
on Form 10-K does not include an attestation report of the
Company’s independent registered public accounting firm
regarding internal control over financial reporting due to the
permanent exemptions for smaller reporting companies.
Our system of ICOFR
was designed to provide reasonable assurance regarding the
preparation and fair presentation of published financial statements
in accordance with accounting principles generally accepted in the
United States. All internal control systems, no matter how well
designed, have inherent limitations. Therefore, even those systems
determined to be effective can provide only reasonable assurance
and may not prevent or detect misstatements. Also, projections of
any evaluation of effectiveness to future periods are subject to
the risk that controls may become inadequate because of changes in
conditions, or that the degree of compliance with the policies or
procedures may deteriorate.
Changes
in Internal Controls over Financial Reporting
There were no
changes in the Company’s ICOFR during the fourth quarter of
2019 that have materially affected, or are reasonably likely to
materially affect, the Company’s ICOFR.
40
PART III.
ITEM
10. DIRECTORS, EXECUTIVE OFFICERS AND CORPORATE
GOVERNANCE
Information
concerning our directors, executive officers, and corporate
governance is incorporated herein by reference to our definitive
proxy statement to be filed with the Securities and Exchange
Commission within 120 days after the end of the fiscal year covered
by this Form 10-K with respect to the 2020 Annual Meeting of
Stockholders.
ITEM
11. EXECUTIVE COMPENSATION
Incorporated herein
by reference to our definitive proxy statement to be filed with the
Securities and Exchange Commission within 120 days after the end of
the fiscal year covered by this Form 10-K with respect to
the 2020 Annual Meeting of Stockholders.
ITEM
12. SECURITY OWNERSHIP OF CERTAIN BENEFICIAL OWNERS AND MANAGEMENT
AND RELATED STOCKHOLDER MATTERS
Information about
security ownership is incorporated herein by reference to our
definitive proxy statement to be filed with the Securities and
Exchange Commission within 120 days after the end of the fiscal
year covered by this Form 10-K with respect to
the 2020 Annual Meeting of Stockholders.
Equity Compensation Plan Information
The following table
sets forth information as of December 31, 2019, with respect to the
Company’s compensation plans under which its Common Stock is
authorized for issuance:
|
|
(a)
|
(b)
|
(c)
|
|
|
Number of Securities
|
Weighted
average
|
Number of Securities remaining available for
future
|
|
|
to be issued
|
exercise
|
issuance
|
|
|
upon exercise
|
price of
|
(excluding
|
|
|
of outstanding
|
of outstanding
|
securities
|
|
|
options, warrants
|
options, warrants
|
reflected in
|
|
Directors, Nominees
and Executive
Officers
|
and rights
|
and rights
|
column (a)
|
|
|
|
|
|
|
Equity
Compensation Plans:
|
|
|
|
|
|
|
|
|
|
Approved
by security holders
|
3,508,334
|
$
0.59
|
2,065,707
|
|
|
|
|
|
|
Not
approved by security holders
|
-
|
$
0.00
|
-
|
|
|
|
|
|
|
Total
|
3,508,334
|
$
0.59
|
2,065,707
|
ITEM
13. CERTAIN RELATIONSHIPS AND RELATED TRANSACTIONS, AND DIRECTOR
INDEPENDENCE
Incorporated herein
by reference to our definitive proxy statement to be filed with the
Securities and Exchange Commission within 120 days after the end of
the fiscal year covered by this Form 10-K with respect to the 2020
Annual Meeting of Stockholders.
41
ITEM 14. PRINCIPAL ACCOUNTING FEES AND SERVICES
Incorporated herein
by reference to our definitive proxy statement to be filed with the
Securities and Exchange Commission within 120 days after the end of
the fiscal year covered by this Form 10-K with respect to the 2020
Annual Meeting of Stockholders.
PART
IV.
ITEM
15. EXHIBITS AND FINANCIAL STATEMENT SCHEDULES
■
Financial
Statements and Financial Statement Schedule
Financial Statements:
Report
of Independent Registered Public Accounting Firm
Consolidated
Balance Sheets as of December 31, 2019 and 2018
Consolidated
Statements of Operations for the Years Ended December 31, 2019 and
2018
Consolidated
Statements of Changes in Stockholders’
Equity for the Years Ended
December 31, 2019 and 2018
Consolidated
Statements of Cash Flow for the Years Ended December 31, 2019 and
2018
Notes
to Consolidated Financial Statements
All
other schedules are omitted either because they are not applicable
or not required, or because the required information is included in
the financial statements or notes thereto
■
Exhibits
:
The following exhibits are filed herewith or incorporated herein by
reference:
42
|
Appointment and Standstill Agreement dated July 3, 2018
(incorporated by reference from Exhibit 10.1 to Registrant’s
Current Report on Form 8-K, as filed on July 3, 2018)
|
|
|
Employment Agreement, between WidePoint Corporation and Jason
Holloway. * (Incorporated herein by reference to Exhibit 10.2 to
the Registrant’s Current Report on Form 8-K filed on December
20, 2017.)
|
|
|
Offer Letter to Kellie H. Kim.* (Incorporated herein by reference
to Exhibit 10.1 to the Registrant’s Current Report on Form
8-K filed on December 16, 2019.)
|
|
|
101
|
Interactive Data Files
|
|
101
|
INS+ XBRL Instance Document
|
|
101
|
SCH+ XBRL Taxonomy Extension Schema Document
|
|
101
|
CAL+ XBRL Taxonomy Extension Calculation Linkbase
Document
|
|
101
|
DEF+ XBRL Taxonomy Definition Linkbase Document
|
|
101
|
LAB+ XBRL Taxonomy Extension Label Linkbase Document
|
|
101
|
PRE+ XBRL Taxonomy Extension Presentation Linkbase
Document
|
___________________
*
Management contract
or compensatory plan.
43
SIGNATURES
Pursuant to the
requirements of the Securities Exchange Act of 1934, the registrant
has duly caused this report to be signed on its behalf by the
undersigned thereunto duly authorized.
|
|
|
WidePoint
Corporation
|
|
|
|
|
|
|
|
Date:
|
March
24, 2020
|
|
s/ JIN
H. KANG
|
|
|
|
|
Jin H. Kang
|
|
|
|
|
Chief
Executive Officer
|
|
|
|
|
|
|
Date:
|
March
24, 2020
|
|
/s/
KELLIE H.
KIM
|
|
|
|
|
Kellie H. Kim
|
|
|
|
|
Chief
Financial Officer
|
Pursuant
to the requirements of the Securities Exchange Act of 1934, this
report has been signed below by the following persons, on behalf of
the registrant and in the capacities and on the dates
indicated.
|
Dated:
|
March
24, 2020
|
|
/s/ JIN
H. KANG
|
|
|
|
|
Jin H. Kang
|
|
|
|
|
Director,
Chief Executive Officer and President
|
|
|
|
|
(Principal
Executive Officer)
|
|
|
|
|
|
|
Dated:
|
March
24, 2020
|
|
/s/
OTTO GUENTHER
|
|
|
|
|
Otto Guenther
|
|
|
|
|
Chairman
of the Board
|
|
|
|
|
|
|
Dated:
|
March
24, 2020
|
|
/s/
JULIA A. BOWEN
|
|
|
|
|
Julia A. Bowen
|
|
|
|
|
Director
|
|
|
|
|
|
|
Dated:
|
March
24, 2020
|
|
/s/
RICHARD L. TODARO
|
|
|
|
|
Ricgard L. Todaro
|
|
|
|
|
Director
|
|
|
|
|
|
|
Dated:
|
March
24, 2020
|
|
/s/
PHILIP RICHTER
|
|
|
|
|
Philip Richter
|
|
|
|
|
Director
|
44
INDEX
TO FINANCIAL STATEMENTS
|
|
Page
|
|
|
|
|
Report of Independent Registered Public Accounting
Firm
|
F-1
|
|
|
|
|
Consolidated Balance Sheets as of December 31, 2019 and
2018
|
F-2
|
|
|
|
|
Consolidated Statements of Operations for the Years ended December
31, 2019 and 2018
|
F-3
|
|
|
|
|
Consolidated Statements of Comprehensive Income (Loss) for the
Years ended December 31, 2019 and 2018
|
F-4
|
|
|
|
|
Consolidated Statements of Stockholders’ Equity for the Years
ended December 31, 2019 and 2018
|
F-5
|
|
|
|
|
Consolidated Statements of Cash Flows for the Years ended December
31, 2019 and 2018
|
F-6
|
|
|
|
|
Notes to Consolidated Financial Statements
|
F-8
|
REPORT OF INDEPENDENT REGISTERED PUBLIC ACCOUNTING
FIRM
The Board of
Directors and Shareholders of
WidePoint
Corporation
Opinion on the Financial Statements
We have audited the
accompanying consolidated balance sheets of WidePoint Corporation
and subsidiaries (the “Company”) as of December 31,
2019 and 2018, and the related consolidated statements of
operations, comprehensive income (loss), changes in
stockholders’ equity, and cash flows for the years then
ended, and the related notes. In our opinion, the consolidated
financial statements
present fairly,
in all material respects, the
consolidated
financial position of the Company as of
December 31, 2019 and 2018
and
the
consolidated
results of its
operations and its cash flows for the years then ended, in
conformity with accounting principles generally accepted in the
United States of America.
Change in Accounting Principle
As
disclosed in Note 2 to the consolidated financial statements, in
2019 the Company changed its method of accounting for leases due to
the adoption of Accounting Standards Codification
(“ASC”) Topic No. 842, and as disclosed in Note 3, in
2018 the Company changed its method of accounting for revenue
recognition due to the adoption of ASC Topic No. 606.
Basis for Opinion
These consolidated
financial statements are the responsibility of the Company’s
management. Our responsibility is to express an opinion on these
consolidated financial statements based on our audits.
We are a public accounting firm registered with
the Public Company Accounting Oversight Board (United States)
(“PCAOB”) and are required to be independent with
respect to the Company in accordance with the U.S. federal
securities laws and the applicable rules and regulations of the
Securities and Exchange Commission and the
PCAOB.
We conducted our
audits in accordance with the standards of the Public Company
Accounting Oversight Board (United States). Those standards require
that we plan and perform the audit to obtain reasonable assurance
about whether the consolidated financial statements are free of
material misstatement, whether due to error or fraud. The Company
is not required to have, nor were we engaged to perform, an audit
of its internal control over financial reporting.
As part of our audits we are required to obtain an
understanding of internal control over financial reporting but not
for the purpose of expressing an opinion on the effectiveness of
the Company’s internal control over financial
reporting.
Accordingly, we express no such
opinion.
Our audits included
performing procedures to assess the risks of material misstatement
of the consolidated
financial statements, whether due
to error or fraud, and performing procedures to respond to those
risks. Such procedures included examining, on a test basis,
evidence regarding the amounts and disclosures in the consolidated
financial statements. Our audits also included evaluating the
accounting principles used and significant estimates made by
management, as well as evaluating the overall presentation of the
consolidated financial statements. We believe that our
audit
s
provide a reasonable
basis for our opinion.
/s/ Moss Adams
LLP
Phoenix,
Arizona
March 24,
2020
We have
served as the Company’s auditor since 2007.
F-1
WIDEPOINT
CORPORATION AND SUBSIDIARIES
Consolidated
Balance Sheets
|
|
DECEMBER
31,
|
|
|
|
2019
|
2018
|
|
|
|
|
|
ASSETS
|
||
|
CURRENT
ASSETS
|
|
|
|
Cash
and cash equivalents
|
$
6,879,627
|
$
2,431,892
|
|
Accounts
receivable, net of allowance for doubtful accounts
|
|
|
|
of
$126,235 and $106,733 in 2019 and 2018, respectively
|
14,580,928
|
11,089,315
|
|
Unbilled
accounts receivable
|
13,976,958
|
9,566,170
|
|
Other
current assets
|
1,094,847
|
1,086,686
|
|
|
|
|
|
Total
current assets
|
36,532,360
|
24,174,063
|
|
|
|
|
|
NONCURRENT
ASSETS
|
|
|
|
Property
and equipment, net
|
681,575
|
1,012,684
|
|
Operating
lease right of use asset, net
|
5,932,769
|
-
|
|
Intangibles,
net
|
2,450,770
|
3,103,753
|
|
Goodwill
|
18,555,578
|
18,555,578
|
|
Other
long-term assets
|
140,403
|
209,099
|
|
|
|
|
|
Total
assets
|
$
64,293,455
|
$
47,055,177
|
|
|
|
|
|
LIABILITIES AND STOCKHOLDERS' EQUITY
|
||
|
|
|
|
|
CURRENT
LIABILITIES
|
|
|
|
Accounts
payable
|
$
13,581,822
|
$
7,363,621
|
|
Accrued
expenses
|
14,947,981
|
10,716,438
|
|
Deferred
revenue
|
2,265,067
|
2,072,344
|
|
Current
portion of operating lease liabilities
|
599,619
|
107,325
|
|
Current
portion of other term obligations
|
133,777
|
192,263
|
|
|
|
|
|
Total
current liabilities
|
31,528,266
|
20,451,991
|
|
|
|
|
|
NONCURRENT
LIABILITIES
|
|
|
|
Operating
lease liabilities, net of current portion
|
5,593,649
|
122,040
|
|
Other
term obligations, net of current portion
|
-
|
73,952
|
|
Deferred
revenue, net of current portion
|
363,560
|
466,714
|
|
Deferred
tax liability
|
1,868,562
|
1,523,510
|
|
|
|
|
|
Total
liabilities
|
39,354,037
|
22,638,207
|
|
|
|
|
|
STOCKHOLDERS'
EQUITY
|
|
|
|
Preferred
stock, $0.001 par value; 10,000,000 shares
|
|
|
|
authorized;
2,045,714 shares issued and none outstanding
|
-
|
-
|
|
Common
stock, $0.001 par value; 110,000,000 shares
|
|
|
|
authorized;
83,861,453 and 84,112,446 shares
|
|
|
|
issued
and oustanding, respectively
|
83,861
|
84,113
|
|
Additional
paid-in capital
|
95,279,114
|
94,926,560
|
|
Accumulated
other comprehensive loss
|
(242,594
)
|
(186,485
)
|
|
Accumulated
deficit
|
(70,180,963
)
|
(70,407,218
)
|
|
|
|
|
|
Total
stockholders’ equity
|
24,939,418
|
24,416,970
|
|
|
|
|
|
Total
liabilities and stockholders’ equity
|
$
64,293,455
|
$
47,055,177
|
The accompanying
notes are an integral part of these consolidated financial
statements.
F-2
WIDEPOINT
CORPORATION AND SUBSIDIARIES
Consolidated
Statements of Operations
|
|
YEARS
ENDED
|
|
|
|
DECEMBER
31,
|
|
|
|
2019
|
2018
|
|
|
|
|
|
REVENUES
|
$
101,720,247
|
$
83,678,896
|
|
COST OF REVENUES
(including amortization and depreciation of
|
|
|
|
$922,455 and
$892,314, respectively)
|
84,342,282
|
68,409,219
|
|
|
|
|
|
GROSS
PROFIT
|
17,377,965
|
15,269,677
|
|
|
|
|
|
OPERATING
EXPENSES
|
|
|
|
Sales and
marketing
|
1,659,875
|
1,743,693
|
|
General and
administrative expenses (including share-based
|
|
|
|
compensation of
$717,987 and $683,404, respectively)
|
13,844,689
|
13,301,052
|
|
Depreciation and
amortization
|
988,146
|
415,337
|
|
|
|
|
|
Total operating
expenses
|
16,492,710
|
15,460,082
|
|
|
|
|
|
INCOME (LOSS) FROM
OPERATIONS
|
885,255
|
(190,405
)
|
|
|
|
|
|
OTHER INCOME
(EXPENSE)
|
|
|
|
Interest
income
|
5,355
|
6,797
|
|
Interest
expense
|
(310,582
)
|
(79,540
)
|
|
Other
income
|
38,877
|
(2
)
|
|
|
|
|
|
Total other
expense
|
(266,350
)
|
(72,745
)
|
|
|
|
|
|
INCOME (LOSS)
BEFORE INCOME TAX PROVISION
|
618,905
|
(263,150
)
|
|
INCOME TAX
PROVISION
|
392,650
|
1,193,326
|
|
|
|
|
|
NET INCOME
(LOSS)
|
$
226,255
|
$
(1,456,476
)
|
|
|
|
|
|
BASIC EARNINGS
(LOSS) PER SHARE
|
$
0.00
|
$
(0.02
)
|
|
|
|
|
|
BASIC
WEIGHTED-AVERAGE SHARES OUTSTANDING
|
83,974,536
|
83,274,171
|
|
|
|
|
|
DILUTED EARNINGS
(LOSS) PER SHARE
|
$
0.00
|
$
(0.02
)
|
|
|
|
|
|
DILUTED
WEIGHTED-AVERAGE SHARES OUTSTANDING
|
84,010,285
|
83,274,171
|
The accompanying
notes are an integral part of these consolidated financial
statements.
F-3
WIDEPOINT CORPORATION AND SUBSIDIARIES
Consolidated
Statements of Comprehensive Income (Loss)
|
|
YEARS
ENDED
|
|
|
|
DECEMBER 31,
|
|
|
|
2019
|
2018
|
|
|
|
|
|
NET INCOME
(LOSS)
|
$
226,255
|
$
(1,456,476
)
|
|
|
|
|
|
Other
comprehensive loss:
|
|
|
|
Foreign
currency translation adjustments, net of tax
|
(56,109
)
|
(64,024
)
|
|
|
|
|
|
Other
comprehensive loss
|
(56,109
)
|
(64,024
)
|
|
|
|
|
|
COMPREHENSIVE
INCOME (LOSS)
|
$
170,146
|
$
(1,520,500
)
|
The accompanying
notes are an integral part of these consolidated financial
statements.
F-4
WIDEPOINT CORPORATION AND SUBSIDIARIES
Consolidated
Statements of Changes in Stockholders’ Equity
|
|
|
|
Additional
|
|
|
|
|
|
Common
Stock
|
Paid-In
|
Accumulated
|
Accumulated
|
|
|
|
|
Issued
|
Amount
|
Capital
|
OCI
|
Deficit
|
Total
|
|
|
|
|
|
|
|
|
|
Balance, January 1,
2018
|
83,031,595
|
$
83,032
|
$
94,200,237
|
$
(122,461
)
|
$
(68,950,742
)
|
$
25,210,066
|
|
|
|
|
|
|
|
|
|
Issuance of common
stock —
|
|
|
|
|
|
|
|
options
exercises
|
100,000
|
100
|
43,900
|
-
|
-
|
44,000
|
|
|
|
|
|
|
|
|
|
Issuance of common
stock —
|
|
|
|
|
|
|
|
restricted
|
980,851
|
981
|
(981
)
|
-
|
-
|
-
|
|
|
|
|
|
|
|
|
|
Stock compensation
expense —
|
|
|
|
|
|
|
|
restricted
|
-
|
-
|
387,690
|
-
|
-
|
387,690
|
|
|
|
|
|
|
|
|
|
Stock compensation
expense —
|
|
|
|
|
|
|
|
non-qualified stock
options
|
-
|
-
|
295,714
|
-
|
-
|
295,714
|
|
|
|
|
|
|
|
|
|
Foreign currency
translation —
|
|
|
|
|
|
|
|
(loss)
|
-
|
-
|
-
|
(64,024
)
|
-
|
(64,024
)
|
|
|
|
|
|
|
|
|
|
Net
loss
|
-
|
-
|
-
|
|
(1,456,476
)
|
(1,456,476
)
|
|
|
|
|
|
|
|
|
|
Balance, December
31, 2018
|
84,112,446
|
$
84,113
|
$
94,926,560
|
$
(186,485
)
|
$
(70,407,218
)
|
$
24,416,970
|
|
|
|
|
|
|
|
|
|
|
|
|
|
|
|
|
|
Common
stock repurchased
|
(863,733
)
|
(865
)
|
(364,820
)
|
-
|
-
|
(365,685
)
|
|
|
|
|
|
|
|
|
|
Issuance
of common stock —
|
|
|
|
|
|
|
|
restricted
|
662,740
|
663
|
(663
)
|
-
|
-
|
-
|
|
|
|
|
|
|
|
|
|
Cancellation
of common stock —
|
|
|
|
|
|
|
|
restricted
|
(50,000
)
|
(50
)
|
50
|
-
|
-
|
-
|
|
|
|
|
|
|
|
|
|
Stock
compensation expense —
|
|
|
|
|
|
|
|
restricted
|
-
|
-
|
381,251
|
-
|
-
|
381,251
|
|
|
|
|
|
|
|
|
|
Stock
compensation expense —
|
|
|
|
|
|
|
|
non-qualified
stock options
|
-
|
-
|
336,736
|
-
|
-
|
336,736
|
|
|
|
|
|
|
|
|
|
Foreign
currency translation —
|
|
|
|
|
|
|
|
(loss)
|
-
|
-
|
-
|
(56,109
)
|
-
|
(56,109
)
|
|
|
|
|
|
|
|
|
|
Net
income
|
-
|
-
|
-
|
|
226,255
|
226,255
|
|
|
|
|
|
|
|
|
|
Balance,
December 31, 2019
|
83,861,453
|
$
83,861
|
$
95,279,114
|
$
(242,594
)
|
$
(70,180,963
)
|
$
24,939,418
|
The accompanying
notes are an integral part of these consolidated financial
statements.
F-5
WIDEPOINT
CORPORATION AND SUBSIDIARIES
Consolidated
Statements of Cash Flows
|
|
YEARS
ENDED
|
|
|
|
DECEMBER
31,
|
|
|
|
2019
|
2018
|
|
|
|
|
|
CASH FLOWS FROM
OPERATING ACTIVITIES
|
|
|
|
Net income
(loss)
|
$
226,255
|
$
(1,456,476
)
|
|
Adjustments to
reconcile net income (loss) to net cash provided by
|
|
|
|
(used in) operating
activities:
|
|
|
|
Deferred income tax
expense
|
343,659
|
1,128,213
|
|
Depreciation
expense
|
1,124,110
|
551,305
|
|
Provision for
doubtful accounts
|
22,037
|
4,803
|
|
Amortization of
intangibles
|
786,491
|
756,346
|
|
Amortization of
deferred financing costs
|
5,000
|
17,304
|
|
Share-based
compensation expense
|
717,987
|
683,404
|
|
Changes in assets
and liabilities:
|
|
|
|
Accounts receivable
and unbilled receivables
|
(7,967,993
)
|
(4,502,811
)
|
|
Inventories
|
(29,868
)
|
(26,986
)
|
|
Prepaid expenses
and other current assets
|
(12,576
)
|
(269,348
)
|
|
Other
assets
|
62,960
|
(172,364
)
|
|
Accounts payable
and accrued expenses
|
10,443,535
|
1,190,046
|
|
Income tax
payable
|
33,346
|
10,179
|
|
Deferred revenue
and other liabilities
|
99,899
|
(48,505
)
|
|
|
|
|
|
Net cash provided
by (used in) operating activities
|
5,854,842
|
(2,134,890
)
|
|
|
|
|
|
CASH FLOWS FROM
INVESTING ACTIVITIES
|
|
|
|
Purchases of
property and equipment
|
(370,322
)
|
(261,505
)
|
|
Software
development costs
|
(146,227
)
|
(228,841
)
|
|
|
|
|
|
Net cash used in
investing activities
|
(516,549
)
|
(490,346
)
|
|
|
|
|
|
CASH FLOWS FROM
FINANCING ACTIVITIES
|
|
|
|
Advances on bank
line of credit
|
6,784,934
|
14,048,741
|
|
Repayments of bank
line of credit advances
|
(6,784,934
)
|
(14,048,741
)
|
|
Principal
repayments under finance lease obligations
|
(473,278
)
|
(101,698
)
|
|
Debt
issuance costs
|
(5,000
)
|
-
|
|
Contingent
consideration payment
|
-
|
(100,000
)
|
|
Common stock
repurchased
|
(365,685
)
|
-
|
|
Proceeds from
exercise of stock options
|
-
|
44,000
|
|
|
|
|
|
Net cash used in
financing activities
|
(843,963
)
|
(157,698
)
|
|
|
|
|
|
Net
effect of exchange rate on cash and equivalents
|
(46,595
)
|
(57,631
)
|
|
|
|
|
|
NET INCREASE
(DECREASE) IN CASH
|
4,447,735
|
(2,840,565
)
|
|
|
|
|
|
CASH AND CASH
EQUIVALENTS, beginning of period
|
2,431,892
|
5,272,457
|
|
|
|
|
|
CASH AND CASH
EQUIVALENTS, end of period
|
$
6,879,627
|
$
2,431,892
|
The accompanying
notes are an integral part of these consolidated financial
statements.
F-6
WIDEPOINT
CORPORATION AND SUBSIDIARIES
Consolidated
Statements of Cash Flows
|
|
YEARS
ENDED
|
|
|
|
DECEMBER
31,
|
|
|
|
2019
|
2018
|
|
|
|
|
|
SUPPLEMENTAL CASH
FLOW INFORMATION
|
|
|
|
Cash paid for
interest
|
$
216,096
|
$
51,953
|
|
Cash paid for
income taxes
|
$
14,859
|
$
44,633
|
|
|
|
|
|
NONCASH INVESTING
AND FINANCING ACTIVITIES
|
|
|
|
Insurance policies
financed by short term notes payable
|
$
181,923
|
$
195,246
|
|
Leased assets
obtained in exchange for new lease liabilities
|
$
471,919
|
$
-
|
The accompanying
notes are an integral part of these consolidated financial
statements.
F-7
NOTES
TO CONSOLIDATED FINANCIAL STATEMENTS
1.
Organization
and Nature of Operations
Organization
WidePoint
Corporation (“WidePoint” or the “Company”)
was incorporated in Delaware on May 30, 1997 and conducts
operations through its wholly-owned operating subsidiaries in the
United States, Ireland, the Netherlands and the United Kingdom. The
Company’s principal executive and administrative headquarters
is located in Fairfax, Virginia.
Nature of Operations
The Company is a
leading provider of trusted mobility management (TM2). The
Company’s TM2 platform and service solutions enable its
customers to efficiently secure, manage and analyze the entire
lifecycle of their mobile communications assets through its
federally compliant platform Intelligent Telecommunications
Management System (ITMS™). The Company’s ITMS platform
is SSAE 18 compliant and was granted an Authority to Operate by the
U.S. Department of Homeland Security. Additionally, the Company was
granted an Authority to Operate by the General Services
Administration with regard to its identity credentialing component
of its TM2 platform. The Company’s TM2 platform is internally
hosted and accessible on-demand through a secure customer portal
that is specially configured for each customer. The Company can
deliver these solutions in a number of configurations ranging from
utilizing the platform as a service to a full-service solution that
includes full lifecycle support for all end users and the
organization.
A significant
portion of the Company’s expenses, such as personnel and
facilities costs, are fixed in the short term and may be not be
easily modified to manage through changes in the Company’s
market place that may create pressure on pricing and/or costs to
deliver its services.
The Company has
periodic capital expense requirements to maintain and upgrade its
internal technology infrastructure tied to its hosted solutions and
other such costs may be significant when incurred in any given
quarter.
2.
Significant
Accounting Policies
Basis of Presentation
The accompanying
consolidated financial statements were prepared in accordance with
accounting principles generally accepted in the United States of
America (“U.S. GAAP”) and the financial statement
rules and regulations of the Securities and Exchange
Commission.
Principles of Consolidation
The accompanying
consolidated financial statements include the accounts of the
Company amd its wholly owned subsidiaries. All significant
inter-company amounts were eliminated in
consolidation.
Reclassifications
Certain
reclassifications have been made to prior period consolidated
balance sheet to conform to current period presentation. Such
reclassifications had no effect on net income as previously
reported.
F-8
Accounting Standards Update
Recently Adopted Accounting Standards
Leases
In
February 2016, the Financial Accounting Standards Board (FASB)
issued a new accounting standard on leases, Accounting Standard
Update (ASC) 2016-02, Leases (Topic 842). Effective January 1,
2019, the Company adopted the standard update with new guidance
intended to increase transparency and comparability among
organizations relating to leases. The new guidance requires lessees
to recognize a liability to make lease payments and a right-of-use
asset representing the right to use the underlying asset for the
lease term. The standards update retained a dual model for lease
classification, requiring leases to be classified as finance or
operating leases to determine recognition in the statements of
operations and cash flow; however, substantially all leases are now
required to be recognized on the balance sheet. The standards
update also requires quantitative and qualitative disclosures
regarding key information about leasing arrangements.
The
Company elected the modified retrospective transition
method and applied the new guidance at the date of adoption,
without adjusting the comparative periods presented. The Company
also elected the practical expedients permitted under the
transition guidance that retain the lease classification and
initial direct costs for any leases that existed prior to adoption
of the standard. In addition, the Company did not reassess whether
any contracts entered into prior to adoption are
leases.
Upon
adoption of the standard, the Company recorded approximately $6.1
million of right of use assets and finance lease-related
liabilities, respectively. The adoption of this standards update
had a material impact on the Company’s Consolidated Balance
Sheets and related disclosures. The adoption of this standards
update did not have a material impact on the Company’s
results of operations or cash flows.
The
cumulative effect of the changes made to our January 1, 2019
balance sheet for the adoption of the standards update was as
follows:
|
|
|
|
As Reported
|
|
|
As Previously
|
|
under
|
|
|
Reported
|
|
Topic 842
|
|
|
DECEMBER 31,
|
Adoption
|
JANUARY 1,
|
|
|
2018
|
Adjustment
|
2019
|
|
Operating
lease right of use asset, net
|
$
-
|
$
6,061,566
|
$
6,061,566
|
|
Property
and equipment, net
|
1,012,684
|
(170,000
)
|
842,684
|
|
Other
current assets
|
1,086,686
|
(38,015
)
|
1,048,671
|
|
Current
portion of operating lease liabilities
|
122,040
|
268,711
|
390,751
|
|
Current
portion of other term obligations
|
192,263
|
(40,859
)
|
151,404
|
|
Operating
lease liabilities, net of current portion
|
122,040
|
5,699,651
|
5,821,691
|
|
Other
term obligations, net of current portion
|
73,952
|
(73,952
)
|
-
|
F-9
Stock
Compensation
In June
2018, the FASB issued ASU 2018-07, Compensation - Stock
Compensation (Topic 718); Improvements to non-employee Share-Based
Payment Accounting. Effective January 1, 2019, the Company adopted
ASU 2018-07. The new guidance simplifies the accounting for
share-based payments made to nonemployees. Under this ASU,
share-based awards to nonemployees will be measured at fair value
on the grant date of the awards. Entities will need to assess the
probability of satisfying performance conditions if any are
present, and awards will continue to be classified according to ASC
718 upon vesting, which eliminates the need to reassess
classification upon vesting, consistent with awards granted to
employees. The Company has not historically issued a material
amount of share-based payments to non-employees. There was no
material effect on the Company’s consolidated financial
statements upon adoption.
Accounting Standards under Evaluation
In January 2017,
ASU No. 2017-04, Simplifying the Test for Goodwill Impairment was
issued. Under the amendments in this ASU, an entity should perform
its annual, or interim, goodwill impairment test by comparing the
fair value of a reporting unit with its carrying amount. An entity
should recognize an impairment charge for the amount by which the
carrying amount exceeds the reporting unit's fair value; however,
the loss should not exceed the total amount of goodwill allocated
to that reporting unit. The ASU also eliminated the requirements
for any reporting unit with a zero or negative carrying amount to
perform a qualitative assessment and, if it fails that qualitative
test, to perform Step 2 of the goodwill impairment test. An entity
should apply this ASU on a prospective basis and for its annual or
any interim goodwill impairment tests in fiscal years beginning
after December 15, 2019. The Company will adopt this guidance
prospectively on January 1, 2020. Adoption of this guidance is
not expected to have a material impact on its consolidated
financial statements.
Foreign Currency
Assets and
liabilities denominated in foreign currencies are translated into
U.S. dollars based upon exchange rates prevailing at the end of
each reporting period. The resulting translation adjustments, along
with any related tax effects, are included in accumulated other
comprehensive (loss) income, a component of stockholders’
equity. Translation adjustments are reclassified to earnings upon
the sale or substantial liquidation of investments in foreign
operations. Revenues and expenses are translated at the average
month-end exchange rates during the year. Gains and losses related
to transactions in a currency other than the functional currency,
including operations outside the U.S. where the functional currency
is the U.S. dollar, are reported net in the Company’s
Consolidated Statements of Operations, depending on the nature of
the activity. See Note 18 for additional information.
Segment Reporting
Segments are
defined by authoritative guidance as components of a company in
which separate financial information is available and is evaluated
by the chief operating decision maker (CODM), or a decision-making
group, in deciding how to allocate resources and in evaluating
financial performance. The Company’s CODM is its chief
executive officer.
The Company’s
customers view our market as a singular business and demand an
integrated and scalable suite of enterprise-wide solutions. The
Company’s TM2 offerings are substantially managed service
driven solutions that use our proprietary technology platform to
deliver our services. The amount of labor required to perform our
contract obligations may vary significantly contract to contract
depending on the customer’s specific requirements; however,
the way in which we perform these services is consistent across the
company and requires a connected group of internal subject matter
experts and support personnel.
F-10
In order to
evaluate a managed service business model the Company’s CODM
and the senior executive team measure financial performance based
on our overall mixture of managed and carrier services and related
margins. These financial metrics provide a stronger indication of
how we are managing our key customer relationships; and it also
determines our overall profitability.
The Company
presents a single segment for purposes of financial reporting and
prepared its consolidated financial statements upon that
basis.
Use of Estimates
The preparation of
consolidated financial statements in conformity with accounting
principles generally accepted in the U.S. requires management to
make estimates and assumptions that affect the reported amounts of
assets and liabilities and disclosure of contingent assets and
liabilities at the date of the financial statements and the
reported amounts of revenues and expenses during the reporting
period. The more significant areas requiring use of estimates and
judgment relate to revenue recognition, accounts receivable
valuation reserves, ability to realize intangible assets and
goodwill, ability to realize deferred income tax assets, fair value
of certain financial instruments and the evaluation of
contingencies and litigation. Management bases its estimates on
historical experience and on various other assumptions that are
believed to be reasonable under the circumstances. Actual results
could differ from those estimates.
Fair Value Measurements
Fair value is
defined as the price that would be received to sell an asset or
paid to transfer a liability in an orderly transaction between
market participants at the measurement date, based on the
Company’s principal or, in the absence of a principal, most
advantageous market for the specific asset or liability. U.S. GAAP
provides for a three-level hierarchy of inputs to valuation
techniques used to measure fair value, defined as
follows:
Level 1
- Inputs that are
quoted prices (unadjusted) for identical assets or liabilities in
active markets that the entity can access.
Level 2
- Inputs other than
quoted prices included within Level 1 that are observable for the
asset or liability, either directly or indirectly, for
substantially the full term of the asset or liability,
including:
■
Quoted prices for
similar assets or liabilities in active markets
■
Quoted prices for
identical or similar assets or liabilities in markets that are not
active
■
Inputs other than
quoted prices that are observable for the asset or
liability
■
Inputs that are
derived principally from or corroborated by observable market data
by correlation or other means
Level 3
- Inputs that are
unobservable and reflect the Company’s own assumptions about
the assumptions market participants would use in pricing the asset
or liability based on the best information available in the
circumstances (e.g., internally derived assumptions surrounding the
timing and amount of expected cash flows). The Company measured the
fair value of contingent seller financed promissory notes presented
on the consolidated balance sheets at fair value on a recurring
basis using significantly unobservable inputs (Level 3) during the
years ended December 31, 2019 and 2018. See Note 3 for additional
information regarding financial liabilities carried at fair
value.
F-11
The Company
monitors the market conditions and evaluates the fair value
hierarchy levels at least quarterly. For any transfers in and out
of the levels of the fair value hierarchy, the Company elects to
disclose the fair value measurement at the beginning of the
reporting period during which the transfer occurred. See Note 3 for
financial assets and liabilities subject to fair value
measurements.
Going Concern Evaluation
The Company has
performed an annual assessment of its ability to continue as a
going concern as required under ASU No. 2014-15, Presentation of
Financial Statements – Going Concern (“ASU No.
2014-15”) and concluded no additional disclosures are
required.
Financial Instruments
Financial
instruments that potentially subject the Company to credit risk
consist of cash and cash equivalents and accounts
receivable.
Cash and Cash Equivalents
The Company
maintains interest-bearing cash deposits and short-term overnight
investments with large financial institutions. The Company
considers all highly liquid investments with original maturities of
three months or less to be cash equivalents for purposes of these
consolidated financial statements. Interest-bearing cash deposits
maintained by financial institutions in the United States of
America are insured by the Federal Deposit Insurance Corporation
(“FDIC”) up to a maximum of $250,000. At December 31,
2019 and 2018, the Company had deposits in excess of FDIC limits of
approximately $3,902,000 and $522,000, respectively.
The Company also maintains
deposits with a financial institution in Ireland that are insured
by the Central Bank of Ireland up to a maximum of €100,000
per financial institution. The Company also maintains deposits with
a financial institution in the United Kingdom that are insured by
Financial Services Compensation Scheme up to a maximum of
£75,000 per financial institution. At December 31, 2019 and
2018, the Company had foreign bank deposits in excess of insured
limits of approximately $748,000 and $1,021,800,
respectively.
Allowances for Doubtful Accounts
The Company
determines its allowance for doubtful accounts by considering a
number of factors, including the type of customer, credit
worthiness, payment history, length of time accounts receivable are
past due, the Company’s previous loss history, the
customer’s current ability to pay its obligation to the
Company, and the condition of the general economy and the industry
as a whole. The Company writes off accounts receivable when they
are deemed to be uncollectible, having exhausted all collection
efforts. Payments subsequently received on such receivables are
credited to the allowance for doubtful accounts.
Customer account
balances outstanding longer than the contractual payment terms are
reviewed for collectability and after 90 days are considered past
due unless arrangements were made at the time of the transaction
that specified different payment terms. Upon specific review and
its determination that a bad debt reserve may be required, the
Company will reserve such amount if it views the account as
potentially uncollectable.
F-12
Inventories
Inventories consist
of mobile devices and accessories and identity credential hardware
components. Inventories are valued at the lower of cost, using
first-in, first-out method, or net realizable value. The Company
may record a write-down for inventories which have become obsolete
or are in excess of anticipated demand or net realizable value. If
future demand or market conditions for our products are less
favorable than forecasted or if unforeseen technological changes
negatively impact the utility of inventory, we may be required to
record additional write-downs, which would adversely affect our
gross profit. For the years ended December 31, 2019 and 2018, there
were no inventory write-downs.
Property and Equipment
Property and
equipment are stated at historical cost, net of accumulated
depreciation and amortization. Depreciation and amortization
expense is computed using the straight-line method over the
estimated useful lives based upon the classification of the
property and/or equipment or lease period for assets acquired under
capital lease arrangements. The estimated useful lives of the
assets are as follows:
|
|
|
Estimated
|
|
|
|
Useful
Life
|
|
|
|
|
|
Computer hardware
and software
|
|
3-5
years
|
|
Furniture and
fixtures
|
|
5
years
|
|
Mobile
equipment
|
|
3
years
|
The Company
assesses the recoverability of property and equipment by
determining whether the depreciation of property and equipment over
its remaining life can be recovered through projected undiscounted
future cash flows. The amount of property and equipment impairment
if any, is measured based on fair value and is charged to
operations in the period in which property and equipment impairment
is determined by management. As of December 31, 2019 and 2018, the
Company’s management has not identified any material
impairment of its property and equipment.
Leases
The
Company has operating and finance leases for corporate offices,
data centers, computer hardware and automobiles that are accounted
for under ASC 842. The leases have remaining lease terms ranging
from one year to eighteen years.
The
Company determines if an arrangement is a lease at inception. The
Company considers any contract where there is an identified asset
and that it has the right to control the use of such asset in
determining whether the contract contains a lease. A right-of-use
(“ROU”) asset represents the Company’s right to
use an underlying asset for the lease term and the lease
liabilities represent its obligation to make lease payments arising
from the lease. Operating lease ROU assets and lease liabilities
are recognized at commencement date based on the present value of
lease payments over the lease term. As the Company’s
operating leases do not provide an implicit rate, the Company uses
an incremental borrowing rate based on the information available on
the adoption date in determining the present value of lease
payments. The operating lease ROU assets include any lease payments
made prior to the rent commencement date. Lease expense for lease
payments are recognized on a straight-line basis over the lease
term.
F-13
Goodwill and Other Intangible Assets
The
Company accounts for goodwill and other indefinite-lived intangible
assets in accordance with ASC Topic 350,
Intangibles
. Under ASC Topic
350, goodwill and certain indefinite-lived intangible assets are
not amortized but are subject to an annual impairment test, and
between annual tests if indicators of potential impairment
exist.
The Company
evaluates goodwill for impairment annually as of December 31st and
between annual tests if events occur or circumstances change that
would more likely than not reduce the fair value of the reporting
unit below its carrying value. The Company has the option to first
assess qualitative factors to determine whether it is more likely
than not that the fair value of a reporting unit is less than its
carrying amount as a basis for determining whether it is necessary
to perform the two-step quantitative goodwill impairment test or
bypass the qualitative assessment for any reporting period and
proceed to performing the first step of the two-step goodwill
impairment test.
Goodwill impairment
testing involves management judgment, requiring an assessment of
whether the carrying value of the reporting unit can be supported
by its fair value using widely accepted valuation techniques. The
quantitative goodwill impairment test utilizes a two-step approach.
The first step identifies whether there is potential impairment by
comparing the fair value of a reporting unit to the carrying
amount, including goodwill. If the fair value of a reporting unit
is less than its carrying amount, the second step of the impairment
test is required to measure the amount of any impairment
loss.
The Company uses a
combination of the income approach (discounted cash flow method)
and market approach (market multiples). When preparing discounted
cash flow models under the income approach, the Company uses
internal forecasts to estimate future cash flows expected to be
generated by the reporting units. Our internal forecasts are
developed using observable (Level 2) and unobservable (Level 3)
inputs. Actual results may differ from forecasted results. When
preparing the market approach the Company may adjust market
multiples to reflect the Company’s risk profile and other
factors deemed appropriate to properly apply the market
approach.
The Company uses
the expected weighted average cost of capital, estimated using a
capital asset pricing model, to discount future cash flows for each
reporting unit. Our cost of equity estimate is developed using a
combination of observable (Level 2) and unobservable (Level 3)
inputs with appropriate adjustments that take into consideration
our risk profile and other factors deemed appropriate. The Company
believes the discount rates used appropriately reflect the risks
and uncertainties in the financial markets generally and
specifically in the Company’s internally developed forecasts.
Further, to assess the reasonableness of the valuations derived
from the discounted cash flow models, the Company also analyzes
market-based multiples for similar industries of the reporting
unit, where available.
Revenue from Contracts with Customers
Revenue
is recognized upon transfer of control of promised products or
services to customers in an amount that reflects the consideration
the Company expects to receive in exchange for those products or
services. The Company enters into contracts that can include
various combinations of products and services, which are generally
capable of being distinct and accounted for as separate performance
obligations. Revenue is recognized net of allowances for returns
and any taxes collected from customers, which are subsequently
remitted to governmental authorities.
F-14
The
Company reports products and services under the categories managed
services and carrier services as described below:
Managed
Services.
The Company delivers managed services under a
full-service, quasi full-service or self-service solution to suit
our customers’ needs. A significant portion of our reported
gross profit is tied to this service component. Revenue is accrued
based on what the Company expects will be ultimately invoiced.
Differences between accrued revenues and actual billed revenues are
adjusted in the period that billings are prepared and such
differences have not historically been material. Managed services
are not interdependent and there are no undelivered performance
obligations in these arrangements. The Company aggregates its
billable revenue under the following groupings:
●
Managed Service
Fees:
The Company delivers
managed services under firm fixed price contracts that include
multiple performance obligations.
o
Revenue
for fixed price services are generally completed and billed in the
same accounting period and we charge a fixed fee for each
performance obligation which may be tied to the number of units
managed, percentage of supplier spend and/or savings, units
delivered, certificates issued by the Company, certificate
validation services installed in a customer’s environment,
accessories sold and billable hours. Revenue from this service
requires significant accounting estimates due to delays between
completion of the service and the normal billing
cycle.
o
Revenue
for fixed price software licenses that are sold as a perpetual
license with no significant customization are recognized when the
software is delivered. Software sold as a SasS license is
recognized ratably over the license term from the date the software
is accepted by the customer. Implementation fees are recognized
over the term of the license agreement once the software has been
delivered. Maintenance services, if contracted, are recognized
ratably over the term of the maintenance agreement, generally
twelve months. Revenue from this service does not require
significant accounting estimates.
●
Billable Service
Fees.
The Company delivers
subject matter expertise either offsite or onsite for certain
customers at a fixed hourly rate or fixed monthly fee. Billable
services are generally completed and billed in the same accounting
period and we charge a fixed fee based on actual hours worked and
actual costs incurred. Revenue is accrued based on what the Company
expects will be ultimately invoiced. Differences between accrued
revenues and actual billed revenues are adjusted in the period that
billings are prepared and such differences have not historically
been material.
●
Reselling and Other
Service Fees.
The Company
delivers third party products and services to satisfy customer
contractual obligations. We recognize revenues and related costs on
a gross basis for such arrangements whenever we have primary
economic risk. We have economic risk in these transactions as we
are seen as the primary creditor, we carry inventory risk for
undelivered products and services, we directly issue purchase
orders third party suppliers, and we have discretion in sourcing
among many different suppliers. For those transactions in which we
procure and deliver products and services for our customers on
their own account we do not recognize revenues and related costs on
a gross basis for these arrangements. We only recognize revenues
earned for arranging the transaction and any related
costs.
F-15
Carrier
Services.
The Company bills for
costs incurred to deliver phone, data and satellite and related
mobile services for a connected device or end point. These services
require us to procure, process and pay communications carrier
invoices. We recognize revenues and related costs on a gross basis
for such arrangements whenever we have primary economic risk. We
have economic risk in these transactions when we are seen as the
primary creditor, we directly issue purchase orders directly to
communications carriers for wireline and wireless services, and/or
we have discretion in choosing optimal providers and rate plans.
For arrangements in which we do not have such economic risk we
recognize revenues and related costs on a net basis. A significant
portion of our overall reported revenue is tied to this service
component; however, it represents an insignificant portion of our
overall reported gross profit. This is a commodity type service and
margins are nominal, but this is a necessary service to deliver to
federal government customers that engage us to provide a
full-service solution. The Company does not provide these services
at risk for commercial customers due to the increased credit risk
involved.
Significant Judgments
The
Company’s contracts with customers often include promises to
transfer multiple products and services to a customer under a fixed
rate or fixed fee arrangement. Determining whether products and
services are considered distinct performance obligations that
should be accounted for separately versus together may require
significant judgment. Components of our managed service solution
are generally distinct performance obligations that are not
interdependent and can be completed within a month. The
Company’s products are generally sold with a right of return
and the Company may provide other event driven credits or
disincentives for not meeting performance obligations which are
accounted for as variable consideration when estimating the amount
of revenue to recognize. Returns and credits are estimated at
contract inception and updated at the end of each reporting period
as additional information becomes available and only to the extent
that it is probable that a significant reversal of any incremental
revenue will not occur.
Contract Balances
A significant
portion of contract balances represent revenues earned on federal
government contracts. Timing of revenue recognition may differ
materially from the timing of invoicing to customers due a
long-standing practice of issuing a consolidated managed service
invoice. A consolidated invoice usually requires data such as
billable hours, units managed, credentials issued, accessories sold
and usage data from telecommunications providers and other
suppliers. As a result it could take between thirty (30) to sixty
(60) days after all performance obligations have been met to
deliver a complete customer invoice. As a result, the Company may
have both accounts receivables (invoiced revenue) and unbilled
receivables (revenue recognize but not yet invoiced) that could
represent one or more months of revenue. Additionally, the Company
may be required under contractual terms to bill for services in
advance and deferred recognition of revenue until all performance
obligations have been met.
Payment terms and
conditions vary by contract type, although terms generally include
a requirement of payment within thirty (30) to ninety (90) days.
Payment terms and conditions for government and commercial
customers are described below:
●
Government contract
billings are generally due within thirty (30) days of the invoice
date. Government accounts receivable payments could be delayed due
to administrative processing delays by the government agency,
continuing budget resolutions that may delay availability of
contract funding, and/or administrative only invoice correction
requests by contracting officers that may delay payment processing
by our government customer.
●
Commercial
contracts are billed based on the underlying contract terms and
conditions which generally have repayment terms that range from
thirty (30) to ninety (90) days. In instances where the timing of
revenue recognition differs from the timing of invoicing, we have
determined our contracts generally do not include a significant
financing component.
F-16
The primary purpose
of our invoicing terms is to provide customers with simplified and
predictable ways of purchasing our products and services, not to
receive financing from our customers.
The allowance for
doubtful accounts reflects the Company’s best estimate of
probable losses inherent in uncollected accounts receivable.
Customer accounts receivable balances that remain uncollected for
more than 45 days are reviewed for collectability and are
considered past due after 90 days unless different contractual
repayment terms were extended under a contract with a customer. The
Company determines its allowance for doubtful accounts after
considering factors that could affect collectability of past due
accounts receivable and such factors regularly include the
customers’ financial condition and credit worthiness, recent
payment history, type of customer and the length of time accounts
receivable are past due. Upon specific review and its determination
that a bad debt reserve may be required, the Company will reserve
such amount if it views the account as potentially
uncollectable.
Customer accounts
receivable balances that remain uncollected for more than 120 days
and/or that have not been settled in accordance with contractual
repayment terms and for which no firm payment commitments exist are
placed with a third-party collection agency and a reserve is
established for the entire uncollected balance. The Company writes
off accounts receivable after 180 days or earlier when they become
uncollectible. Payments subsequently received on such receivables
are credited to the allowance for doubtful accounts. If the
accounts receivable has been written off and no allowance for
doubtful accounts exist subsequent payments received are credited
to bad debt expense as a recovery.
Costs to Obtain a Contract with a Customer
The Company does
not recognize assets from the costs to obtain a contract with a
customer and generally expenses these costs as incurred. The
Company primarily uses internal labor to manage and oversee the
customer acquisition process and to finalize contract terms and
conditions and commence customer start-up activities, if any.
Internal labor costs would be incurred regardless of the outcome of
a contract with a customer and as such those costs are not
considered incremental to the cost to obtain a contract with a
customer. The Company does not typically incur significant
incremental costs to obtain a contract with a customer after such
contract has been awarded. Incremental costs to obtain a
contract with a customer may include payment of commissions to
certain internal and/or external sales agents upon collection of
invoiced sales from the customer. The Company does not
typically prepay sales commissions in advance of being paid for
services delivered.
Product Development
Product development
expenses include payroll, employee benefits, and other employee
related expenses associated with product development. Product
development expenses also include third-party development and
programming costs, subject matter experts, localization costs
incurred to translate software for international markets, and the
amortization of purchased software code and services content. Costs
related to product development are expensed until the point that
technological feasibility is reached, which for our software
products, is generally shortly before the products are commercially
available for release. Once technological feasibility is reached,
such costs are not normally material. To the extent costs are
significant such costs are capitalized and amortized to cost of
revenue over the estimated lives of the solution.
For the years ended
December 31, 2019 and 2018, the Company incurred product
development costs associated with its next generation TDI
Optimiser™ application of approximately $146,000 and
$229,000, respectively, which were capitalized. See Note 9 to the
consolidated financial statements for additional information about
capitalization of product development costs.
F-17
Income Taxes
The Company
accounts for income taxes in accordance with authoritative guidance
which requires that deferred tax assets and liabilities be computed
based on the difference between the financial statement and income
tax bases of assets and liabilities using the enacted marginal tax
rate. The guidance requires that the net deferred tax asset be
reduced by a valuation allowance if, based on the weight of
available evidence, it is more likely than not that some portion or
all of the net deferred tax asset will not be
realized.
Management assesses
the available positive and negative evidence to estimate if
sufficient future taxable income will be generated to use the
existing deferred tax assets. Under existing income tax accounting
standards such objective evidence is more heavily weighted in
comparison to other subjective evidence such as our projections for
future growth, tax planning and other tax strategies.
The Company
recognizes the impact of an uncertain tax position taken or
expected to be taken on an income tax return in the financial
statements at the amount that is more likely than not to be
sustained upon audit by the relevant taxing authority. An uncertain
income tax position will not be recognized in the financial
statements unless it is more likely than not of being sustained
upon audit by the relevant taxing authority.
Basic and Diluted Earnings Per Share (EPS)
Basic EPS includes
no dilution and is computed by dividing net income by the
weighted-average number of common shares outstanding for the
period. Diluted EPS includes the potential dilution that could
occur if securities or other contracts to issue common and
restricted stock were exercised or converted into common and
restricted stock. The number of incremental shares from assumed
conversions of stock options and unvested restricted stock awards
included in the calculation of diluted EPS was calculated using the
treasury stock method. See Note 17 to the consolidated financial
statements for computation of EPS.
Employee Stock-Based Compensation
The Company
accounts for stock-based employee compensation arrangements under
provisions of ASC 718-10. The Company recognizes the cost of
employee stock awards granted in exchange for employee services
based on the grant-date fair value of the award using a
Black-Scholes option-pricing model, net of expected forfeitures.
Those costs are recognized ratably over the vesting period. Each
stock option has an exercise price equal to the market price of the
Company’s common stock on the date of grant and a contractual
term ranging from 3 to 10 years. See Note 16 to the consolidated
financial statements for additional information about stock-based
compensation programs.
Non-Employee Stock-Based Compensation
The Company
accounts for stock-based non-employee compensation arrangements
using the fair value recognition provisions of ASC 505-50,
“Equity-Based Payments to Non-Employees” (formerly
known as FASB Statement 123,
Accounting for Stock-Based Compensation
and “Emerging Issues Task Force”
EITF 96-18, Accounting for Equity Instruments
That Are Issued to Other Than Employees for Acquiring, or in
Conjunction with Selling, Goods or Services).
F-18
3.
Fair
Value Measurements
The consolidated
financial statements include financial instruments for which the
fair market value may differ from amounts reflected on a historical
basis.
Financial Assets and Financial Liabilities Carried at Other Than
Fair Value
The Company’s
financial instruments include cash equivalents, accounts
receivable, short and long-term debt (except for contingent
promissory notes) and other
financial
instruments associated with the
issuance of the common stock. The carrying values of cash
equivalents and accounts receivable approximate their fair value
because of the short maturity of these instruments and past
evidence indicates that these instruments settle for their carrying
value. The carrying amounts of the Company’s bank borrowings
under its credit facility approximate fair value because the
interest rates reflect current market rates.
4.
Accounts
Receivable and Significant Concentrations
A significant
portion of the Company’s revenue arrangements consist of firm
fixed price contracts with agencies of the U.S. federal government
and several large multinational publicly traded and private
corporations. Accounts receivable consist of the following by
customer type in the table below as of the periods
presented:
|
|
DECEMBER
31,
|
|
|
|
2019
|
2018
|
|
|
|
|
|
Government
(1)
|
$
12,604,582
|
$
7,332,338
|
|
Commercial
(2)
|
2,102,581
|
3,863,710
|
|
Gross accounts
receivable
|
14,707,163
|
11,196,048
|
|
Less: allowances
for doubtful
|
|
|
|
accounts
(3)
|
126,235
|
106,733
|
|
|
|
|
|
Accounts
receivable, net
|
$
14,580,928
|
$
11,089,315
|
(1) Government
contracts are generally firm fixed price not to exceed arrangements
with a term of five (5) years, which consists of a base year and
four (4) annual option year renewals. Government receivables are
billed under a single consolidated monthly invoice and are billed
approximately thirty (30) to sixty (60) days in arrears from the
date of service and payment is generally due within thirty (30)
days of the invoice date. Government accounts receivable payments
could be delayed due to administrative processing delays by the
government agency, continuing budget resolutions that may delay
availability of contract funding, and/or administrative only
invoice correction requests by contracting officers that may delay
payment processing by our government customer.
(2) Commercial
contracts are generally fixed price arrangements with contract
terms ranging from two (2) to three (3) years. Commercial accounts
receivables are billed based on the underlying contract terms and
conditions which generally have repayment terms that range from
thirty (30) to ninety (90) days. Commercial receivables are stated
at amounts due from customers net of an allowance for doubtful
accounts if deemed necessary.
(3) During the
years ended December 31, 2019 and 2018, the Company recorded
provisions for bad debt expense related to commercial customers
totaling approximately $22,000, and $4,800, respectively. The
Company has not historically maintained a bad debt reserve for its
government customers as it has not experienced material or
recurring bad debt charges and the nature and size of the contracts
has not necessitated the Company’s establishment of such a
bad debt reserve.
F-19
Significant Concentrations
Customers
representing ten percent or more of consolidated accounts
receivable are set forth in the table below as of the periods
presented:
|
|
DECEMBER
31,
|
|
|
|
2019
|
2018
|
|
|
As
a % of
|
As a %
of
|
|
Customer Name
|
Receivables
|
Receivables
|
|
|
|
|
|
U.S. Customs Border
Patrol
|
--
|
14%
|
|
U.S. Coast
Guard
|
--
|
13%
|
|
Iron
Bow Technologies
|
--
|
15%
|
|
National
Aeronautics and Space Administration
|
21%
|
--
|
|
United States
Census Bureau
|
18%
|
--
|
Customers
representing ten percent or more of consolidated revenues are set
forth in the table below for each of the periods
presented:
|
|
YEARS
ENDED
|
|
|
|
DECEMBER
31,
|
|
|
|
2019
|
2018
|
|
|
As a %
of
|
As a %
of
|
|
Customer
Name
|
Revenues
|
Revenues
|
|
|
|
|
|
U.S. Immigration
and Customs Enforcement
|
14%
|
16%
|
|
U.S. Customs Border
Patrol
|
12%
|
11%
|
|
United States
Census Bureau
|
10%
|
--
|
5.
Unbilled
Accounts Receivable and Significant Concentrations
Unbilled accounts
receivable represent revenues earned in connection with products
and/or services delivered for which we are unable to issue a formal
billing to the customer at the balance sheet due to either timing
of invoice processing or delays due to fixed contractual billing
schedules. A significant portion of our unbilled accounts
receivable consist of carrier services and cybersecurity hardware
and software products delivered but not invoiced at the end of the
reporting period. Unbilled receivables consist of the following by
customer type as of the periods presented below:
|
|
DECEMBER
31,
|
|
|
|
2019
|
2018
|
|
|
|
|
|
Government
|
$
13,712,913
|
$
9,253,586
|
|
Commercial
|
264,045
|
312,584
|
|
|
|
|
|
Unbilled accounts
receivable
|
$
13,976,958
|
$
9,566,170
|
F-20
Significant Concentrations
Customers
representing ten percent or more of consolidated unbilled accounts
receivable are set forth in the table below as of the periods
presented:
|
|
DECEMBER
31,
|
|
|
|
2019
|
2018
|
|
|
As
a % of
|
As a %
of
|
|
Customer Name
|
Receivables
|
Receivables
|
|
|
|
|
|
U.S.
Department of Homeland Security Headquarters
|
--
|
11
%
|
|
U.S.
Immigration and Customs Enforcement
|
24
%
|
37
%
|
|
United States
Census Bureau
|
23
%
|
--
|
|
U.S.
Coast Guard
|
--
|
11
%
|
|
U.S. Transportation
Safety Administration
|
--
|
10
%
|
6.
Other
Current Assets
Other current
assets consisted of the following as of the periods presented
below:
|
|
DECEMBER
31,
|
|
|
|
2019
|
2018
|
|
|
|
|
|
Inventories
|
$
213,713
|
$
183,900
|
|
Prepaid rent,
insurance and other assets
|
881,134
|
902,786
|
|
|
|
|
|
Total other current
assets
|
$
1,094,847
|
$
1,086,686
|
7.
Property
and Equipment
Major classes of
property and equipment consisted of the following as of the periods
presented below:
|
|
DECEMBER
31,
|
|
|
|
2019
|
2018
|
|
|
|
|
|
Computer hardware
and software
|
$
2,041,978
|
$
2,110,298
|
|
Furniture and
fixtures
|
399,521
|
333,539
|
|
Leasehold
improvements
|
299,340
|
268,561
|
|
Automobiles
|
56,800
|
178,597
|
|
Gross property and
equipment
|
2,797,639
|
2,890,995
|
|
Less: accumulated
depreciation and
amortization
|
2,116,064
|
1,878,311
|
|
|
|
|
|
Property and
equipment, net
|
$
681,575
|
$
1,012,684
|
F-21
During the years
ended December 31, 2019 and 2018, the Company purchased for cash
property and equipment totaling approximately $370,300 and
$261,500, respectively.
During the years
ended December 31, 2019 and 2018, property and equipment
depreciation expense was approximately $555,400 and $551,305,
respectively.
During the years
ended December 31, 2019 and 2018, there were no material disposals
of owned property and equipment.
There were no
changes in the estimated useful lives used to depreciate property
and equipment during the years ended December 31, 2019 and
2018.
8.
Leases
The
Company entered into operating leases for corporate and operational
facilities (“real estate leases”), computer hardware
for datacenters and automobiles (collectively “all other
leases”).
Real
estate leases. Substantially all real estate leases have
remaining terms of six (6) to nine (9) years, with additional five
(5) year extensions available. All of these leases require a fixed
lease payment that contains an annual lease payment escalation
provision ranging from 3% to 4% per year. Certain leases contain
early termination provisions that would require payment of
unamortized tenant improvements, real estate broker commissions
paid, and up to six (6) months of rent to compensate the landlord
for early termination. The cost to exit a lease would be
significant and potentially range $0.2 million to $0.8 million. The
earliest any lease termination provisions could be exercised would
be in 2023.
All
other leases. Non-real estate operating leases have remaining
terms of one (1) to two (2) years. All of these leases require a
fixed lease payment over the entire lease term with no escalation
provision. There are no early termination provisions under such
arrangements.
The
components of lease expense were as follows:
|
|
YEAR
ENDED
|
|
|
DECEMBER 31,
|
|
|
2019
|
|
|
|
|
Operating lease
expense
|
$
212,221
|
|
|
|
|
Finance lease
expense:
|
|
|
Amortization of
right of use assets
|
$
568,688
|
|
Interest on finance
lease liabilities
|
285,978
|
|
|
|
|
Total finance lease
expense
|
$
854,666
|
F-22
Operating lease
expense is included in general and administrative expenses in the
consolidated statement of operations. Amortization of right of use
assets is include in depreciation and amortization in the
consolidated statement of operations. Finance lease right of use
assets of $388,721 are included in operating lease right of use
asset, net in the consolidated balance sheets.
Supplemental cash
flow information related to leases was as follows:
Cash
paid for amounts included in the measurement of lease
liabilities:
|
|
YEAR
ENDED
|
|
|
DECEMBER 31,
|
|
|
2019
|
|
|
|
|
Cash
paid for amounts included in the measurement of lease
liabilities:
|
|
|
Operating
cash flows from operating leases
|
$
212,221
|
|
Operating
cash flows from finance leases
|
285,978
|
|
Financing
cash flows from finance leases
|
473,278
|
|
|
|
|
Right
of use assets obtained in exchange for lease
obligations:
|
|
|
Operating
leases
|
$
471,919
|
|
Finance
leases
|
$
-
|
Supplemental
balance sheet information related to leases was as
follows:
|
|
DECEMBER 31,
|
|
|
2019
|
|
|
|
|
Operating
lease right of use assets, net
|
$
5,932,769
|
|
Current
portion of operating lease liabilities
|
599,619
|
|
Operating
lease liabilities, net of current portion
|
5,593,649
|
|
|
|
|
Weighted
average remaining lease term
|
|
|
Operating
leases
|
11.1
|
|
Finance
leases
|
1.1
|
|
Weighted
average discount rate
|
|
|
Operating
leases
|
5
%
|
|
Finance
leases
|
5
%
|
Maturities of lease
liabilities as of December 31, 2019, were as follows:
F-23
|
|
Operating Leases
|
Finance Leases
|
|
2020
|
$
774,339
|
$
121,071
|
|
2021
|
794,852
|
6,009
|
|
2022
|
815,985
|
-
|
|
2023
|
771,833
|
-
|
|
2024
|
791,357
|
-
|
|
Thereafter
|
4,074,464
|
-
|
|
Total
undiscounted operating lease payments
|
8,022,830
|
127,080
|
|
Less:
Imputed interest
|
1,950,778
|
5,864
|
|
Total
finance lease liability
|
$
6,072,052
|
$
121,216
|
As of
December 31, 2019, the Company has an additional lease for
office space that had not yet commenced with estimated future
minimum rental commitments of approximately $1.91 million.
This lease is expected to commence in 2020 with a term of up to 8
years. These undiscounted amounts are not included in the table
above.
9.
Intangibles
The Company’s
intangible assets are comprised of purchased intangibles consisting
of customer relationships, channel relationships,
telecommunications software, trade names and trademarks and
non-compete agreements. Intangible assets acquired in connection
with a business combination are valued at fair value and amortized
on a straight-line basis over the expected useful life which may
range from three (3) to fifteen (15) years or more depending on the
intangible asset characteristics.
The Company’s
intangible assets also include internally developed software used
in the sales and delivery of its information technology service
offerings. The Company capitalizes certain internal costs related
to software development to deliver its information technology
services including but not limited to its Intelligent
Telecommunications Management System (ITMS™), Public Key
Infrastructure (PKI) and Optimiser Telecom Data Intelligence
(TDI™) applications. Significant development costs are
capitalized from the point of demonstrated technological
feasibility until the point in time that the product is available
for general release to customers. Once the product is available for
general release, capitalized costs are amortized based on units
sold, or on a straight-line basis generally over the expected
functional life which may range from two (2) to five (5)
years.
The following
tables summarize purchased and internally developed intangible
assets subject to amortization as of the periods presented
below:
F-24
|
|
DECEMBER 31,
2019
|
|||
|
|
|
|
|
Weighted
|
|
|
|
|
|
Average
|
|
|
Gross
Carrying
|
Accumulated
|
Net
Book
|
Amortization
|
|
|
Amount
|
Amortization
|
Value
|
Period
|
|
|
|
|
|
|
|
Customer
Relationships
|
$
1,980,000
|
$
(1,980,000
)
|
$
-
|
8.0
|
|
Channel
Relationships
|
2,628,080
|
(992,830
)
|
1,635,250
|
5.0
|
|
Internally
Developed Software
|
1,623,122
|
(988,340
)
|
634,782
|
3.0
|
|
Trade
Name and Trademarks
|
290,472
|
(109,734
)
|
180,738
|
5.0
|
|
|
|
|
|
|
|
|
$
6,521,674
|
$
(4,070,904
)
|
$
2,450,770
|
|
|
|
DECEMBER 31,
2018
|
|||
|
|
|
|
|
Weighted
|
|
|
|
|
|
Average
|
|
|
Gross
Carrying
|
Accumulated
|
Net
Book
|
Amortization
|
|
|
Amount
|
Amortization
|
Value
|
Period
|
|
|
|
|
|
|
|
Customer
Relationships
|
$
1,980,000
|
$
(1,732,500
)
|
$
247,500
|
8.0
|
|
Channel
Relationships
|
2,628,080
|
(817,625
)
|
1,810,455
|
5.0
|
|
Internally
Developed Software
|
1,476,623
|
(630,927
)
|
845,696
|
3.0
|
|
Trade
Name and Trademarks
|
290,472
|
(90,370
)
|
200,102
|
5.0
|
|
|
|
|
|
|
|
|
$
6,375,175
|
$
(3,271,422
)
|
$
3,103,753
|
|
Purchased Intangibles
For the years ended
December 31, 2019 and 2018, the Company did not recognize any
acquisition related intangible assets.
For the years ended
December 31, 2019, there were no disposals or sales of purchased
intangible assets. For the year ended December 31, 2018, the
Company disposed of fully amortized purchased intangible assets
with a historical cost and accumulated amortization of
approximately $2,374,700
Internally Developed
For the year ended
December 31, 2019, the Company recorded capitalized software
development costs of approximately $146,000 related to costs
associated with our next generation TDI™
application.
For the year ended
December 31, 2018 the Company recorded capitalized software
development costs of approximately $229,000 related to costs
associated with our next generation TDI™
application.
F-25
The total weighted
average remaining life of purchased and internally developed
intangible assets is approximately 5.3 years and 1.3 years,
respectively, at December 31, 2019.
The following table
summarizes the estimated future amortization by purchased
intangible asset type for fiscal years ending December
31:
|
Intangible Asset
Type
|
2020
|
2021
|
2022
|
2023
|
2024
|
Thereafter
|
Total
|
|
|
|
|
|
|
|
|
|
|
Channel
Relationships
|
$
175,205
|
$
175,205
|
$
175,205
|
$
175,205
|
$
175,205
|
$
759,225
|
$
1,635,250
|
|
Internally
Developed Software
|
274,280
|
244,583
|
98,533
|
17,386
|
-
|
-
|
634,782
|
|
Trade
Name and Trademarks
|
19,365
|
19,365
|
19,365
|
19,365
|
19,365
|
83,914
|
180,738
|
|
|
|
|
|
|
|
|
|
|
|
$
468,850
|
$
439,153
|
$
293,102
|
$
211,956
|
$
194,570
|
$
843,139
|
$
2,450,770
|
The aggregate
amortization expense recorded was approximately $786,000 and
$756,000 for the years ended December 31, 2019 and 2018,
respectively.
10.
Goodwill
There were no
changes in goodwill during the years ended December 31, 2019 and
2018. As of December 31, 2019 and 2018, goodwill was not impaired
and there were no accumulated impairment losses.
11.
Other
Current Liabilities
Accrued expenses
consisted of the following as of the periods presented
below:
|
|
DECEMBER 31,
|
DECEMBER
31,
|
|
|
2019
|
2018
|
|
|
|
|
|
Carrier service
costs
|
$
12,274,440
|
$
8,476,110
|
|
Salaries and
payroll taxes
|
1,781,628
|
1,308,726
|
|
Inventory
purchases, consultants and other costs
|
834,131
|
913,038
|
|
Severance
costs
|
7,612
|
1,634
|
|
U.S. income tax
payable
|
8,850
|
8,550
|
|
Foreign income tax
payable
|
41,320
|
8,380
|
|
|
|
|
|
Total accrued
expenses
|
$
14,947,981
|
$
10,716,438
|
F-26
12.
Line
of Credit
Commercial Loan Agreement Facility
On June 15,
2017, the Company entered into a Loan and Security Agreement with
Atlantic Union Bank (formerly known as Access National Bank) (the
“Loan Agreement”). The Loan Agreement provides for a
$5.0 million working capital revolving line of credit. The Loan
Agreement has a maturity date of April 30, 2020 and a variable
interest rate equal to the Wall Street Journal prime rate plus
0.50%.
The Loan Agreement
requires that the Company meet the following financial covenants on
a quarterly basis: (i) maintain a minimum adjusted tangible net
worth of at least $2.0 million, (ii) maintain minimum consolidated
adjusted EBITDA of at least two times interest expense and (iii)
maintain a current ratio of 1.10:1 (excluding finance lease
liabilities reported under recently adopted lease accounting
standards).
The available
amount under the working capital line of credit is subject to a
borrowing base, which is equal to the lesser of (i) $5.0 million or
(ii) 70% of the net unpaid balance of the Company’s eligible
accounts receivable. The facility is secured by a first lien
security interest on all of the Company’s personal property,
including its accounts receivable, general intangibles, inventory
and equipment maintained in the United States. As of December 31,
2019, the Company was eligible to borrow up to $4.9 million under
the borrowing base formula.
.
Under the current
credit facility with Access National Bank the Company was advanced
and repaid approximately $6.8 million during the year ended
December 31, 2019.
13.
Other
Obligations
The Company
annually finances the cost of its commercial liability insurance
premiums for a period of less than 12 months. During the years
ended December 31, 2019 and 2018, the Company financed
approximately $181,900 and $195,200, respectively.
14.
Income
Taxes
Income tax
provision is as follows for the years ended:
|
|
DECEMBER
31,
|
|
|
|
2019
|
2018
|
|
State
|
$
10,000
|
$
10,000
|
|
Foreign
|
38,991
|
55,113
|
|
Total
|
48,991
|
65,113
|
|
|
|
|
|
Deferred provision
(benefit)
|
|
|
|
Federal
|
177,049
|
633,073
|
|
State
|
189,632
|
514,220
|
|
Foreign
|
(23,022
)
|
(19,080
)
|
|
Total
|
343,659
|
1,128,213
|
|
|
|
|
|
Income tax
provision
|
$
392,650
|
$
1,193,326
|
F-27
Income tax
provision (benefit) effective rates, which differs from the federal
and state statutory rate as follows for the years
ended:
|
|
DECEMBER
31,
|
|
|
|
2019
|
2018
|
|
|
|
|
|
Statutory federal
income tax rate
|
21.0%
|
21.0%
|
|
State, net of
federal benefit
|
1.5%
|
-2.1%
|
|
Non-deductible
expenses
|
16.5%
|
5.4%
|
|
Change in valuation
allowance
|
-22.1%
|
-200.1%
|
|
Foreign rate
differential
|
-1.1%
|
3.1%
|
|
Return to accrual
difference true-ups
|
32.8%
|
0.6%
|
|
Other
|
14.7%
|
6.9%
|
|
Deferred tax
adjustment and true-up
|
-2.8%
|
-84.1%
|
|
Combined effective
tax rate
|
60.5%
|
-249.4%
|
The tax effects of
temporary differences that give rise to significant portions of the
Company’s deferred tax assets (liabilities) consisted of the
following:
|
|
DECEMBER 31,
|
|
|
|
2019
|
2018
|
|
Deferred tax
assets:
|
|
|
|
Net operating loss
carryforwards
|
$
10,203,094
|
$
10,513,224
|
|
Alternative minimum
tax credit
|
45,650
|
45,650
|
|
Share-based
compensation
|
653,679
|
536,223
|
|
Intangible
amortization
|
481,192
|
565,013
|
|
Other
assets
|
241,358
|
423,394
|
|
|
|
|
|
Total deferred tax
assets
|
11,624,973
|
12,083,504
|
|
Less: valuation
allowance
|
(10,364,787
)
|
(10,507,891
)
|
|
Total deferred tax
assets, net
|
1,260,186
|
1,575,613
|
|
|
|
|
|
Deferred tax
liabilities:
|
|
|
|
Goodwill
amortization
|
2,532,649
|
2,293,533
|
|
Depreciation
|
135,470
|
345,136
|
|
Foreign intangible
amortization
|
447,811
|
447,811
|
|
Other
liabilities
|
12,818
|
12,643
|
|
|
|
|
|
Total deferred tax
liabilities
|
3,128,748
|
3,099,123
|
|
|
|
|
|
Net deferred tax
liability
|
$
(1,868,562
)
|
$
(1,523,510
)
|
F-28
As of December 31,
2019, the Company had approximately $37.5 million in net operating
loss (NOL) carry forwards available to offset future taxable income
for federal income tax purposes, net of the potential Section 382
limitations. These federal NOL carry forwards expire between 2020
and 2036. Included in the recorded deferred tax asset, the Company
had a benefit of approximately $39.5 million available to offset
future taxable income for state income tax purposes. These state
NOL carry forwards expire between 2024 and 2036. Because of the
change of ownership provisions of the Tax Reform Act of 1986, use
of a portion of our domestic NOL may be limited in future periods.
Further, a portion of the carryforwards may expire before being
applied to reduce future income tax liabilities.
Changes
in the valuation allowance for the years ended were as
follows:
|
|
DECEMBER
31,
|
|
|
|
2019
|
2018
|
|
|
|
|
|
Beginning
balance
|
$
(10,507,891
)
|
$
(9,550,279
)
|
|
Decreases
(increases)
|
143,104
|
(957,612
)
|
|
|
|
|
|
Ending
balance
|
$
(10,364,787
)
|
$
(10,507,891
)
|
The Company’s
valuation allowance predominantly consisted of domestic net
operating loss carryforwards and certain state net operating loss
carryforwards. A significant piece of objective negative evidence
considered in management’s evaluation of the realizability of
its deferred tax assets was the existence of cumulative losses over
the latest three-year period. Management forecast future taxable
income, but concluded that there may not be enough of a recovery
before the end of the fiscal year to overcome the negative
objective evidence of three years of cumulative losses. On the
basis of this evaluation, management recorded a valuation allowance
against all deferred tax assets. If management’s assumptions
change and we determine we will be able to realize these deferred
tax assets, the tax benefits relating to any reversal of the
valuation allowance on deferred tax assets will be accounted for as
a reduction of income tax expense.
The Company files
U.S. federal income tax returns with the Internal Revenue Service
(“IRS”) as well as income tax returns in various states
and certain foreign countries. The Company may be subject to
examination by the IRS for tax years 2003 and forward. The Company
may be subject to examinations by various state taxing
jurisdictions for tax years 2003 and forward. The Company may be
subject to examination by various foreign countries for tax years
2014 forward. As of December 31, 2019, the Company is currently not
under examination by the IRS, any state or foreign tax
jurisdiction. The Company did not have any unrecognized tax
benefits at either December 31, 2019 or 2018. In the future, any
interest and penalties related to uncertain tax positions will be
recognized in income tax expense.
15.
Stockholders’
Equity
Preferred Stock
The Company’s
Certificate of Incorporation authorizes the Company to issue up to
10,000,000 shares of preferred stock, $0.001 par value per share.
Under the terms of the Company’s Certificate of
Incorporation, the board of directors is authorized, subject to any
limitations prescribed by law, without stockholder approval, to
issue such shares of preferred stock in one or more series. Each
such series of preferred stock shall have such rights, preferences,
privileges and restrictions, including voting rights, dividend
rights, conversion rights, redemption privileges and liquidation
preferences, as shall be determined by the board of directors. In
November 2004, the Company filed a certificate of designation
designating 2,045,714 shares of the Company’s preferred stock
as shares of Series A Convertible Preferred Stock, which shares
were later issued. All of the shares of Series A Convertible
Preferred Stock that were issued was converted into common stock
and may not be reissued. Accordingly, as of December 31, 2019,
there were 7,954,286 undesignated shares of preferred stock
remaining available for issuance. There were no issuances of
preferred stock during the year ended December 31,
2019.
F-29
Common Stock
The Company is
authorized to issue 110,000,000 shares of common stock, $.001 par
value per share. As of December 31, 2019, there were 83,861,453
shares issued and outstanding (including 507,500 restricted shares
not vested).
Common Stock Issuances - Employee Stock Option
Exercises
There were no
shares of common stock issued as a result of stock option exercises
during the year ended December 31, 2019. Shares of common stock
issued as a result of stock option exercises and realized gross
proceeds for the year ended December 31, 2018 were 100,000 and
$43,900, respectively. See Note 16 for additional information
regarding stock option plans.
Stock Repurchase Program
The
Board of Directors approved a stock repurchase plan to purchase up
to $2.5 million of the Company’s common stock, with $2.1
million outstanding as of December 31, 2019.
16.
Stock
Options and Award Programs
The Company’s
stock incentive plan is administered by the Compensation Committee
and authorizes the grant or award of incentive stock options,
non-qualified stock options (NQSO), restricted stock awards (RSA),
stock appreciation rights, dividend equivalent rights, performance
unit awards and phantom shares. The Company issues new shares of
common stock upon the exercise of stock options. Any shares
associated with options forfeited are added back to the number of
shares that underlie stock options to be granted under the stock
incentive plan. The Company has issued restricted stock awards and
non-qualified stock option awards as described below.
Valuation of Stock Awards
Restricted Stock
. The Company
records the fair value of all restricted stock awards based on the
grant date fair value and amortizes stock compensation on a
straight-line basis over the vesting period. Restricted stock award
shares are issued when granted and included in the total number of
common shares issued and outstanding. During the years ended
December 31, 2019 and 2018, the Company granted 662,740 RSAs and
980,851 RSAs, respectively.
F-30
Non-Qualified Stock Options
. The
Company estimates the fair value of nonqualified stock awards using
a Black-Scholes Option Pricing model (“Black-Scholes
model”). The fair value of each stock award is estimated on
the date of grant using the Black-Scholes model, which requires an
assumption of dividend yield, risk free interest rates, volatility,
forfeiture rates and expected option life. The risk-free interest
rates are based on the U.S. Treasury yield for a period consistent
with the expected term of the option in effect at the time of the
grant. Expected volatilities are based on the historical volatility
of our common stock over the expected option term. The expected
term of options granted is based on analyses of historical employee
termination rates and option exercises. There were 25,000 of
non-qualified stock option awards granted to a non-employee as
compensation for investor relations services during December 31,
2019.
Restricted Stock Awards
A summary of RSA
activity as of December 31, 2019 and 2018, and changes for the
years then ended are set forth below:
|
|
2019
|
2018
|
|
NON-VESTED AWARDS
|
|
|
|
|
|
|
|
Non-vested awards
outstanding, January 1,
|
300,000
|
-
|
|
Granted
(+)
|
662,740
(1)
|
980,851
(1)
|
|
Cancelled
(-)
|
50,000
(2)
|
-
|
|
Vested
(-)
|
405,240
(3)
|
680,851
(1)
|
|
Non-vested awards
outstanding, December 31,
|
507,500
|
300,000
|
|
|
|
|
|
Weighted-average
remaining contractual life (in years)
|
7.99
|
2.01
|
|
|
|
|
|
Unamortized RSA
compensation expense
|
$
90,759
|
$
136,310
|
|
|
|
|
|
Aggregate intrinsic
value of RSAs non-vested, December 31
|
$
197,925
|
$
126,000
|
|
|
|
|
|
Aggregate intrinsic
value of RSAs vested, December 31
|
$
171,867
|
$
320,000
|
(1)
During the year ended December 31, 2019,
the
Company granted 662,740 RSAs, of which i) 238,572 of RSAs were
awarded to members of the Company’s board of directors as
part of their annual board retainer fee that had a grant date fair
value of $100,200 and vested during the period, and ii) 424,168 of
RSAs were awarded to key employees tied to the attainment of
certain financial goals as outlined by the Company’s
Compensation Committee of the Board of Directors that had a grant
date fair value of $254,501. During the year ended December 31,
2018, the Company granted 980,851 RSAs, of which i) 300,000 of
RSAs were awarded as part of additional compensation plan to
align key employees with the Company’s long term financial
goals, and ii) 680,851 were awarded to members of the
Company’s board of directors as part of their annual board
retainer fee and vested during the period.
(2)
There were 50,000 RSAs that were cancelled during the year
ended December 31, 2019. There were no RSAs cancelled or
expired during the year ended December 31, 2018.
(3)
During the year ended December 31, 2019, 405,240 RSA
vested.
F-31
Non-Qualified Stock Option Awards
Option pricing
model assumptions for NQSO awards granted were valued using the
following assumptions for the years then ended as set forth
below:
|
|
YEAR ENDED
DECEMBER 31, 2019
|
YEAR ENDED
DECEMBER 31, 2018
|
||||||
|
|
Non-Qualified Stock Option Awards
|
Non-Qualified
Stock Option Awards
|
||||||
|
|
Employees
|
Directors
|
Non-Employees
|
Total
|
Employees
|
Directors
|
Non-Employees
|
Total
|
|
|
|
|
|
|
|
|
|
|
|
Stock options
granted
|
--
|
--
|
25,000
|
25,000
|
100,000
|
--
|
50,000
|
150,000
|
|
Expected dividend
yield
|
--
|
--
|
0%
|
0%
|
0%
|
--
|
0%
|
0%
|
|
Expected
volatility
|
--
|
--
|
64.5%
|
64.5%
|
65.2% - 66.7%
|
--
|
69.5%
|
65.2%-6.95%
|
|
Risk-free interest
rate
|
--
|
--
|
2.4%
|
2.4%
|
2.72% - 2.73%
|
--
|
1.0%
|
1.0%-2.73%
|
|
Forfeiture
rate
|
--
|
--
|
1.2%
|
1.2%
|
4.43% - 4.81%
|
--
|
10.3%
|
4.43%-10.3%
|
|
Expected
life
|
--
|
--
|
3 years
|
3 years
|
5
years
|
--
|
3
years
|
3-5
years
|
A summary of NQSO
activity as of December 31, 2019 and 2018, and changes during the
years then ended are set forth below:
|
|
2019
|
2018
|
||
|
|
|
Weighted
|
|
Weighted
|
|
|
|
Average
|
|
Average
|
|
|
|
Grant
Date
|
|
Grant
Date
|
|
NON-VESTED AWARDS
|
Shares
|
Fair
Value
|
Shares
|
Fair
Value
|
|
|
|
|
|
|
|
Non-vested
balances, January 1,
|
2,067,503
|
$
0.36
|
2,685,004
|
$
0.35
|
|
Granted
(+)
|
25,000
(1)
|
$
0.15
|
150,000
(1)
|
$
0.25
|
|
Cancelled
(-)
|
80,001
(2)
|
$
0.34
|
50,000
(2)
|
$
0.32
|
|
Vested/Excercised
(-)
|
1,170,832
|
$
0.34
|
717,501
(3)
|
$
0.30
|
|
Non-vested
balances, December 31,
|
841,670
|
$
0.38
|
2,067,503
|
$
0.36
|
F-32
|
|
2019
|
2018
|
||
|
|
|
Weighted
|
|
Weighted
|
|
|
|
Average
|
|
Average
|
|
OUTSTANDING AND
EXERCISABLE AWARDS
|
Shares
|
Exercise
Price
|
Shares
|
Exercise
Price
|
|
|
|
|
|
|
|
Awards outstanding,
January 1,
|
4,013,334
|
$
0.58
|
4,173,334
|
$
0.60
|
|
Granted
(+)
|
25,000
(1)
|
$
0.41
|
150,000
(1)
|
$
0.50
|
|
Cancelled
(-)
|
530,000
(2)
|
$
0.55
|
210,000
(2)
|
$
0.83
|
|
Exercised
(-)
|
-
|
-
|
100,000
(3)
|
$
0.44
|
|
Awards outstanding,
December 31,
|
3,508,334
|
$
0.59
|
4,013,334
|
$
0.58
|
|
|
|
|
|
|
|
Awards vested and
expected to vest,
|
|
|
|
|
|
December
31,
|
3,310,178
|
$
0.59
|
3,422,491
|
$
0.58
|
|
|
|
|
|
|
|
Awards outstanding
and exercisable,
|
|
|
|
|
|
December
31,
|
2,666,664
|
$
0.58
|
1,945,831
|
$
0.56
|
(1) During
the year ended December 31, 2019,
there
were NQSO grants of 25,000 granted to a non-employee as
compensation for investor relations services. During the year ended
December 31, 2018, there were NQSO grants of 150,000, as further
described below:
●
Employees
.
The Company granted 100,000 NQSOs as part of an additional
compensation to align a key employee with the Company’s long
term financial goals. This stock award grant was valued using a
Black-Scholes model that assumed a 3-year vesting period, 5-year
option term, a risk free rate of 2.7%, volatility of 66.7%, no
assumed dividend yield, and a forfeiture rate estimate of
4.8%.
●
Non-Employees
. The Company granted
50,000 NQSOs as payment for a portion of the annual retainer paid
to its public investor relations firm. This stock award grant was
valued using a Black-Scholes model that assumed a 1-year vesting
period, 2-year option term, a risk free rate of 2.6%, volatility of
69.5%, no assumed dividend yield, and a forfeiture rate estimate of
10.3%.
(2) During
the year ended December 31, 2019, there were 530,000 NQSOs that
were cancelled, of which 80,001 were unvested, related to voluntary
terminations. During the year ended December 31, 2018, there were
210,000 NQSOs that were cancelled, of which 50,000 that were
cancelled due to termination of employment and the reminder expired
unexercised at the end of the option term.
(3) The
total intrinsic value of stock options exercised during the year
ended December 31, 2019 was approximately $10,000.
F-33
There was no
intrinsic value associated with options outstanding, exercisable
and expected to vest as of December 31, 2019 as the stock price was
below the lowest option exercise price. Aggregate intrinsic value
represents total pretax intrinsic value (the difference between
WidePoint’s closing stock price on December 31, 2019 and the
exercise price, multiplied by the number of in-the-money options)
that would have been received by the option holders had all option
holders exercised their options on December 31, 2019. The intrinsic
value will change based on the fair market value of
WidePoint’s stock.
The
weighted-average remaining contractual life of the non-qualified
stock options outstanding, exercisable, and vested and expected to
vest was 2.0 years, 1.8 years and 1.8 years, respectively, as of
December 31, 2019.
Stock Compensation Expense
Share-based
compensation recognized under ASC 718-10 (including restricted
stock awards) represents both stock options based expense and stock
grant expense. The Company recognized share-based compensation
expense for the years then ended December 31 as set forth
below:
|
|
YEAR ENDED
DECEMBER 31, 2019
|
YEAR ENDED
DECEMBER 31, 2018
|
||||||
|
|
Shared-Based Compensation Expense
|
Shared-Based
Compensation Expense
|
||||||
|
|
Employees
|
Directors
|
Non-Employees
|
Total
|
Employees
|
Directors
|
Non-Employees
|
Total
|
|
|
|
|
|
|
|
|
|
|
|
Restricted stock
compensation expense
|
$
281,051
|
$
100,200
|
$
-
|
$
381,251
|
$
67,690
|
$
320,000
|
$
-
|
$
387,690
|
|
Non-qualified
option stock compensation expense
|
326,249
|
-
|
10,487
|
336,736
|
291,625
|
-
|
4,089
|
295,714
|
|
|
|
|
|
|
|
|
|
|
|
Total share-based
compensation before taxes
|
$
607,300
|
$
100,200
|
$
10,487
|
$
717,987
|
$
359,315
|
$
320,000
|
$
4,089
|
$
683,404
|
At December 31,
2019, the Company had approximately $613,800 of total unamortized
compensation expense, net of estimated forfeitures, related to
NQSOs that will be recognized over the weighted average period of 1
year.
F-34
17.
Earnings Per Common Share (EPS)
The computations of
basic and diluted EPS for the years ended were as
follows:
|
|
YEARS
ENDED
|
|
|
|
DECEMBER
31,
|
|
|
|
2019
|
2018
|
|
|
|
|
|
Basic
Earnings (Loss) Per Share Computation:
|
|
|
|
Net income
(loss)
|
$
226,255
|
$
(1,456,476
)
|
|
Weighted average
number of common shares
|
83,974,536
|
83,274,171
|
|
Basic Earnings
(Loss) Per Share
|
$
0.00
|
$
(0.02
)
|
|
|
|
|
|
Diluted
Earnings (Loss) Per Share Computation:
|
|
|
|
Net income
(loss)
|
$
226,255
|
$
(1,456,476
)
|
|
|
|
|
|
Weighted average
number of common shares
|
83,974,536
|
83,274,171
|
|
Incremental shares
from assumed conversions
|
|
|
|
of stock
options
|
35,749
|
-
|
|
Adjusted weighted
average number of
|
|
|
|
common
shares
|
84,010,285
|
83,274,171
|
|
|
|
|
|
Diluted Earnings
(Loss) Per Share
|
$
0.00
|
$
(0.02
)
|
Unexercised stock
options and restricted stock awards of 4,015,834 for the year
ended December 31, 2018, have been excluded from the
computation of loss per share because inclusion of these securities
would have been anti-dilutive.
18.
Accumulated Other Comprehensive Loss
Changes in the
Company’s cumulative foreign currency translation adjustments
due to translation of its foreign subsidiaries’ Euro currency
financial statements into the Company’s reporting currency
were as and for the periods presented below:
|
|
YEARS
ENDED
|
|
|
|
DECEMBER 31,
|
|
|
|
2019
|
2018
|
|
|
|
|
|
Balances, January
1
|
$
(186,485
)
|
$
(122,461
)
|
|
|
|
|
|
Net foreign currency
translation loss
|
(56,109
)
|
(64,024
)
|
|
|
|
|
|
Balances, December
31
|
$
(242,594
)
|
$
(186,485
)
|
19.
Commitments and Contingencies
Employment Agreements
The Company has
employment agreements with certain executives that set forth
compensation levels and provide for severance payments in certain
instances.
F-35
Litigation
The Company is not
involved in any material legal proceedings.
20.
Revenue by Service Type, Customer Type and by Geographic
Region
The Company
recognized revenues by the following broad service
types:
|
|
YEARS
ENDED
|
|
|
|
DECEMBER
31,
|
|
|
|
2019
|
2018
|
|
|
|
|
|
Carrier
Services
|
$
68,739,090
|
$
50,050,000
|
|
Managed
Services:
|
|
|
|
Managed
Service Fees
|
25,830,928
|
25,232,019
|
|
Billable
Service Fees
|
4,304,616
|
1,838,018
|
|
Reselling
and Other Services
|
2,845,613
|
6,558,859
|
|
|
|
|
|
|
$
101,720,247
|
$
83,678,896
|
The
Company recognized revenues for the following customer types as set
forth below:
|
|
YEARS
ENDED
|
|
|
|
DECEMBER
31,
|
|
|
|
2019
|
2018
|
|
U.S.
Federal Government
|
$
86,497,328
|
$
66,346,922
|
|
U.S.
State and Local Governments
|
479,379
|
445,855
|
|
Foreign
Governments
|
109,948
|
148,155
|
|
Commercial
Enterprises
|
14,633,592
|
16,737,964
|
|
|
|
|
|
|
$
101,720,247
|
$
83,678,896
|
The
Company recognized revenues from customers in the following
geographic regions:
|
|
YEARS
ENDED
|
|
|
|
DECEMBER
31,
|
|
|
|
2019
|
2018
|
|
|
|
|
|
North
America
|
$
97,197,927
|
$
78,702,974
|
|
Europe
|
4,522,320
|
4,975,922
|
|
|
|
|
|
|
$
101,720,247
|
$
83,678,896
|
F-36
TABLE OF CONTENTS
Part IItem 1. BusinessItem 1A. Risk FactorsItem 1B. Unresolved Staff CommentsItem 2. PropertiesItem 3. Legal ProceedingsItem 4. Mine Safety DisclosuresPart IIItem 5. Market For Registrant's Common Equity, Related Stockholder Matters and Issuer Purchases Of Equity SecuritiesItem 6. Selected Financial DataItem 7. Management's Discussion and Analysis Of Financial Condition and Results Of OperationsNote 8 For Further Information on Leases and The Adoption Of Asc 842Item 7A. Quantitative and Qualitative Disclosures About Market RiskItem 8. Financial Statements and Supplemental DataItem 9A. Controls and ProceduresPart IIIItem 10. Directors, Executive Officers and Corporate GovernanceItem 11. Executive CompensationItem 12. Security Ownership Of Certain Beneficial Owners and Management and Related Stockholder MattersItem 13. Certain Relationships and Related Transactions, and Director IndependenceItem 14. Principal Accounting Fees and ServicesPart IVItem 15. Exhibits and Financial Statement Schedules