XCEL ENERGY INC
10-Ks and 10-Qs
|
|
|
|
|
|
|
|
|
|
|
|
|
|
|
|
|
|
|
|
|
|
|
|
|
|
|
|
|
|
|
|
|
|
|
|
|
|
|
|
|
|
|
|
|
|
|
|
|
|
|
|
|
|
|
|
|
|
|
UNITED STATES
SECURITIES AND EXCHANGE COMMISSION
Washington, D.C. 20549
FORM 10-K
|
(Mark One)
|
|
|
x
|
ANNUAL REPORT PURSUANT TO SECTION 13 OR 15(d) OF THE SECURITIES EXCHANGE ACT OF 1934
|
|
For the fiscal year ended December 31, 2010
|
|
|
or
|
|
|
o
|
TRANSITION REPORT PURSUANT TO SECTION 13 OR 15(d) OF THE SECURITIES EXCHANGE ACT OF 1934
|
Commission File Number: 1-3034
Xcel Energy Inc.
(Exact name of registrant as specified in its charter)
|
Minnesota
|
41-0448030
|
|
|
(State or other jurisdiction of incorporation or organization)
|
(I.R.S. Employer Identification No.)
|
414 Nicollet Mall
Minneapolis, MN 55401
(Address of principal executive offices)
Registrant’s telephone number, including area code:
612-330-5500
Securities registered pursuant to Section 12(b) of the Act:
|
Title of each class
|
Name of each exchange on which registered
|
|
|
Common Stock, $2.50 par value per share
|
New York
|
|
|
Rights to Purchase Common Stock, $2.50 par value per share
|
New York
|
|
|
Cumulative Preferred Stock, $100 par value:
|
||
|
Preferred Stock $3.60 Cumulative
|
New York
|
|
|
Preferred Stock $4.08 Cumulative
|
New York
|
|
|
Preferred Stock $4.10 Cumulative
|
New York
|
|
|
Preferred Stock $4.11 Cumulative
|
New York
|
|
|
Preferred Stock $4.16 Cumulative
|
New York
|
|
|
Preferred Stock $4.56 Cumulative
|
New York
|
|
|
$7.60 Junior Subordinated Notes, Series due 2068
|
New York
|
|
|
Securities registered pursuant to section 12(g) of the Act:
None
|
||
Indicate by check mark if the registrant is a well-known seasoned issuer, as defined in Rule 405 of the Securities Act.
x
Yes
o
No
Indicate by check mark if the registrant is not required to file reports pursuant to Section 13 or Section 15(d) of the Act.
o
Yes
x
No
Indicate by check mark whether the registrant (1) has filed all reports required to be filed by Section 13 or 15(d) of the Securities Exchange Act of 1934 during the preceding 12 months (or for such shorter period that the registrant was required to file such reports), and (2) has been subject to such filing requirements for the past 90 days.
x
Yes
o
No
Indicate by check mark whether the registrant has submitted electronically and posted on its corporate Website, if any, every Interactive Data File required to be submitted and posted pursuant to Rule 405 and Regulation S-T (§232.405 of this chapter) during the preceding 12 months (or for such shorter period that the registrant was required to submit and post such files).
x
Yes
o
No
Indicate by check mark if disclosure of delinquent filers pursuant to Item 405 of Regulations S-K (§229.405 of this chapter) is not contained herein, and will not be contained, to the best of the registrant’s knowledge, in definitive proxy or information statements incorporated by reference in Part III of this Form 10-K or any amendment to this Form 10-K.
o
Indicate by check mark whether the registrant is a large accelerated filer, an accelerated filer, a non-accelerated filer, or a smaller reporting company. See the definitions of “large accelerated filer,” “accelerated filer” and “smaller reporting company” in Rule 12b-2 of the Exchange Act.
x
Large accelerated filer
o
Accelerated filer
o
Non-accelerated filer (Do not check if a smaller reporting company)
o
Smaller Reporting Company
Indicate by check mark whether the registrant is a shell company (as defined in Rule 12b-2 of the Act).
o
Yes
x
No
As of June 30, 2010, the aggregate market value of the voting common stock held by non-affiliates of the Registrants was $9,472,921,126 and there were 459,627,420 shares of common stock outstanding.
As of Feb. 17, 2011, there were 482,686,603 shares of common stock outstanding, $2.50 par value.
DOCUMENTS INCORPORATED BY REFERENCE
The Registrant’s Definitive Proxy Statement for its 2011 Annual Meeting of Shareholders is incorporated by reference into Part III of this Form 10-K.
TABLE OF CONTENTS
|
PART I
|
|||
|
3
|
|||
|
3
|
|||
|
8
|
|||
|
10
|
|||
|
10
|
|||
|
10
|
|||
|
16
|
|||
|
17
|
|||
|
21
|
|||
|
27
|
|||
|
27
|
|||
|
27
|
|||
|
28
|
|||
|
29
|
|||
|
30
|
|||
|
32
|
|||
|
32
|
|||
|
32
|
|||
|
33
|
|||
|
33
|
|||
|
34
|
|||
|
42
|
|||
|
42
|
|||
|
44
|
|||
|
45
|
|||
|
PART II
|
|||
|
45
|
|||
|
48
|
|||
|
48
|
|||
|
80
|
|||
|
80
|
|||
|
151
|
|||
|
151
|
|||
|
151
|
|||
|
PART III
|
|||
|
151
|
|||
|
151
|
|||
|
152
|
|||
|
152
|
|||
|
152
|
|||
|
PART IV
|
|||
|
152
|
|||
|
163
|
|||
|
Xcel Energy Subsidiaries and Affiliates
(current and former)
|
|
|
Cheyenne
|
Cheyenne Light, Fuel and Power Company, a Wyoming corporation
|
|
Eloigne
|
Eloigne Company, a Minnesota corporation which invests in rental housing projects that qualify for low-income housing tax credits.
|
|
e prime
|
e prime, inc., a wholly owned subsidiary formerly in the business of natural gas trading
|
|
NCE
|
New Century Energies, Inc.
|
|
NRG
|
NRG Energy, Inc., a Delaware corporation and independent power producer
|
|
NSP-Minnesota
|
Northern States Power Company, a Minnesota corporation
|
|
NSP-Wisconsin
|
Northern States Power Company, a Wisconsin corporation
|
|
PSCo
|
Public Service Company of Colorado, a Colorado corporation
|
|
PSRI
|
P.S.R. Investments, Inc., a manager of corporate owned life insurance policies
|
|
Seren
|
Seren Innovations, Inc., a wholly owned subsidiary formerly a broadband communications network
|
|
SPS
|
Southwestern Public Service Co., a New Mexico corporation
|
|
UE
|
Utility Engineering Corporation, an engineering, construction and design company
|
|
utility subsidiaries
|
NSP-Minnesota, NSP-Wisconsin, PSCo, SPS
|
|
WGI
|
WestGas InterState, Inc., a Colorado corporation operating an interstate natural gas pipeline
|
|
WYCO
|
WYCO Development LLC, a joint venture formed with Colorado Interstate Gas Company to develop and lease natural gas pipeline, storage, and compression facilities
|
|
Xcel Energy
|
Xcel Energy Inc., a Minnesota corporation
|
|
Federal and State Regulatory Agencies
|
|
|
AQCC
|
Colorado Air Quality Control Commission
|
|
ASLB
|
Atomic Safety and Licensing Board
|
|
CAPCD
|
Colorado Air Pollution Control Division
|
|
CPUC
|
Colorado Public Utilities Commission. The state agency that regulates the retail rates, services and other aspects of PSCo’s operations in Colorado. The CPUC also has jurisdiction over the capital structure and issuance of securities by PSCo.
|
|
CSB
|
U.S. Chemical Safety Board
|
|
DOE
|
United States Department of Energy
|
|
DOT
|
United States Department of Transportation
|
|
EIB
|
New Mexico Environmental Improvement Board
|
|
EPA
|
United States Environmental Protection Agency
|
|
FERC
|
Federal Energy Regulatory Commission. The U.S. agency that regulates the rates and services for transportation of electricity and natural gas; the sale of wholesale electricity, in interstate commerce, including the sale of electricity at market-based rates; hydroelectric generation licensing; and accounting requirements for utility holding companies, service companies, and public utilities.
|
|
IRS
|
Internal Revenue Service
|
|
MOAG
|
Minnesota Office of Attorney General
|
|
MPCA
|
Minnesota Pollution Control Agency
|
|
MPSC
|
Michigan Public Service Commission. The state agency that regulates the retail rates, services and other aspects of NSP-Wisconsin’s operations in Michigan.
|
|
MPUC
|
Minnesota Public Utilities Commission. The state agency that regulates the retail rates, services and other aspects of NSP-Minnesota’s operations in Minnesota. The MPUC also has jurisdiction over the capital structure and issuance of securities by NSP-Minnesota.
|
|
NDPSC
|
North Dakota Public Service Commission. The state agency that regulates the retail rates, services and other aspects of NSP-Minnesota’s operations in North Dakota.
|
|
NERC
|
North American Electric Reliability Corporation. A self-regulatory organization, subject to oversight by the FERC and government authorities in Canada, to develop and enforce reliability standards.
|
|
NMED
|
New Mexico Environment Department
|
|
NMPRC
|
New Mexico Public Regulation Commission. The state agency that regulates the retail rates and services and other aspects of SPS’ operations in New Mexico. The NMPRC also has jurisdiction over the issuance of securities by SPS.
|
|
NRC
|
Nuclear Regulatory Commission. The federal agency that regulates the operation of nuclear power plants.
|
|
OCC
|
Colorado Office of Consumer Counsel
|
|
OES
|
Office of Energy Security, Minnesota Department of Commerce.
|
|
OSHA
|
Occupational Safety and Health Administration
|
|
PSCW
|
Public Service Commission of Wisconsin. The state agency that regulates the retail rates, services, securities issuances and other aspects of NSP-Wisconsin’s operations in Wisconsin.
|
|
PUCT
|
Public Utility Commission of Texas. The state agency that regulates the retail rates, services and other aspects of SPS’ operations in Texas.
|
|
SDPUC
|
South Dakota Public Utilities Commission. The state agency that regulates the retail rates, services and other aspects of NSP-Minnesota’s operations in South Dakota.
|
|
SEC
|
Securities and Exchange Commission
|
|
Electric, Purchased Gas and Resource Adjustment Clauses
|
|
|
CIP
|
Conservation improvement program. Includes a comprehensive list of programs that
benefits customers who conserve energy or use electricity at off-peak times of day.
|
|
DSM
|
Demand side management. Energy conservation, weatherization and other programs to conserve or manage energy use by customers.
|
|
DSMCA
|
Demand side management cost adjustment. A clause permitting PSCo to recover demand side management costs over five years while non-labor incremental expenses and carrying costs associated with deferred DSM costs are recovered on an annual basis. Costs for the low-income energy assistance program are recovered through the DSMCA.
|
|
ECA
|
Retail electric commodity adjustment. Allows PSCo to recover its actual fuel and purchased energy expense in a calendar year to a benchmark formula. Short-term sales margins and margins from the sale of SO
2
allowances are shared with retail customers through the ECA.
|
|
EECRF
|
Energy efficiency cost recovery factor
|
|
EIR
|
Environmental improvement rider. Recovers costs of improvements made to two Minnesota plants under the MERP program.
|
|
FCA
|
Fuel clause adjustment. A clause included in electric rate schedules that provides for monthly rate adjustments to reflect the actual cost of electric fuel and purchased energy compared to a prior forecast. The difference between the electric costs collected through the FCA rates and the actual costs incurred in a month are collected or refunded in a subsequent period.
|
|
FPPCAC
|
Fuel and purchased power cost adjustment clause. Allows SPS to use a monthly adjustment factor for fuel and purchased power.
|
|
GAP
|
Gas affordability program. Recovers costs of offering co-payment program to low income customers.
|
|
GCA
|
Gas cost adjustment. Allows PSCo to recover its actual costs of purchased natural gas and natural gas transportation. The GCA is revised monthly to coincide with changes in purchased gas costs.
|
|
MCR
|
Mercury cost recovery rider. Recovers the cost related to reducing mercury emissions at two NSP-Minnesota fossil fuel power plants.
|
|
OATT
|
Open Access Transmission Tariff
|
|
PCCA
|
Purchased capacity cost adjustment. Allows PSCo to recover from retail customers for all purchased capacity payments to power suppliers. Capacity charges are not included in PSCo’s electric rates or other recovery mechanisms.
|
|
PDRA
|
Partial Decoupling Rate Adjustment. A clause included in PSCo’s retail natural gas schedules that recovers revenue lost to decreasing use per customer beyond a threshold.
|
|
PGA
|
Purchased gas adjustment. A clause included in NSP-Minnesota’s and NSP-Wisconsin’s retail natural gas rate schedules that provides for prospective monthly rate adjustments to reflect the forecasted cost of purchased natural gas and natural gas transportation. The annual difference between the natural gas costs collected through PGA rates and the actual natural gas costs is collected or refunded over the subsequent period.
|
|
QSP
|
Quality of service plan. Provides for bill credits to retail customers if the utility does not achieve certain operational performance targets and/or specific capital investments for reliability. The current QSP for the PSCo electric utility provides for bill credits to customers based on operational performance standards through Dec. 31, 2012.
|
|
RDF
|
Renewable development fund. Supports the development of renewable energy projects.
|
|
RES
|
Renewable energy standard
|
|
RESA
|
Renewable energy standard adjustment
|
|
SCA
|
Steam cost adjustment. Allows PSCo to recover the difference between its actual cost of fuel and the amount of these costs recovered under its base steam service rates. The SCA is revised annually to coincide with changes in fuel costs.
|
|
SEP
|
State Energy Policy
|
|
TCA
|
Transmission cost adjustment. Provides for the recovery of transmission plant revenue requirements.
|
|
TCR
|
Transmission cost recovery adjustment. Allows NSP-Minnesota to recover the cost of transmission facilities not included in the determination of NSP-Minnesota’s electric rates in retail electric rates in Minnesota. The TCR will be revised annually as new transmission investments and costs are incurred.
|
|
TCRF
|
Transmission cost recovery factor
|
|
Other Terms and Abbreviations
|
|
|
ACRS
|
Advisory Committee for Reactor Safety
|
|
AFUDC
|
Allowance for funds used during construction. Defined in regulatory accounts as non-cash accounting convention that represents the estimated composite interest costs of debt and a return on equity funds used to finance
construction. The allowance is capitalized in property accounts and included in income.
|
|
ALJ
|
Administrative law judge. A judge presiding over regulatory proceedings.
|
|
APBO
|
Accumulated Postretirement Benefit Obligation
|
|
ARC
|
Aggregator of Retail Customers
|
|
ARO
|
Asset retirement obligation. Obligations associated with the retirement of tangible long-lived assets and the associated asset retirement costs.
|
|
ASC
|
FASB Accounting Standards Codification
|
|
ASM
|
Ancillary Services Market
|
|
BAL
|
Balancing authority
|
|
BART
|
Best Available Retrofit Technology
|
|
BRIGO
|
Buffalo Ridge Incremental Generation Outlet
|
|
BTA
|
Best Technology Available
|
|
CAA
|
Clean Air Act
|
|
CACJA
|
Clean Air Clean Jobs Act
|
|
CAIR
|
Clean Air Interstate Rule
|
|
CAMR
|
Clean Air Mercury Rule
|
|
CapX2020
|
An alliance of electric cooperatives, municipals and investor-owned utilities in the upper Midwest involved in a joint transmission line planning and construction effort.
|
|
CATR
|
Clean Air Transport Rule
|
|
CCN
|
Certificate of Convenience and Necessity
|
|
CIPS
|
Critical Infrastructure Protection Standards
|
|
CO
2
|
Carbon dioxide
|
|
Codification
|
FASB Accounting Standards Codification
|
|
COLI
|
Corporate owned life insurance
|
|
CON
|
Certificate of Need
|
|
CPCN
|
Certificate of Public Convenience and Necessity
|
|
CWA
|
Clean Water Act
|
|
CWIP
|
Construction work in progress
|
|
decommissioning
|
The process of closing down a nuclear facility and reducing the residual radioactivity to a level that permits the release of the property and termination of license. Nuclear power plants are required by the NRC to set aside funds for their decommissioning costs during operation.
|
|
derivative instrument
|
A financial instrument or other contract with all three of the following characteristics:
|
|
| ● | An underlying and a notional amount or payment provision or both; | |
| ● | Requires no initial investment or an initial net investment that is smaller than would be required for other types of contracts that would be expected to have a similar response to changes in market factors; and | |
| ● | Terms require or permit a net settlement, can be readily settled net by means outside the contract, or provides for delivery of an asset that puts the recipient in a position not substantially different from net settlement. | |
|
distribution
|
The system of lines, transformers, switches and mains that connect electric and natural gas transmission systems to customers.
|
|
|
DOI
|
Division of Investigation
|
|
|
DRIP
|
Dividend Reinvestment Program
|
|
|
EEI
|
Edison Electric Institute
|
|
|
EPS
|
Earnings per share of common stock outstanding
|
|
|
ETR
|
Effective tax rate
|
|
|
FASB
|
Financial Accounting Standards Board
|
|
|
Fitch
|
Fitch Ratings
|
|
|
FTRs
|
Financial transmission rights. Used to hedge the costs associated with transmission congestion.
|
|
|
GAAP
|
Generally accepted accounting principles
|
|
|
generation
|
The process of transforming other forms of energy, such as nuclear or fossil fuels, into electricity. Also, the amount of electric energy produced, expressed in MW (capacity) or MW hours (energy).
|
|
|
GHG
|
Greenhouse gas
|
|
|
IRP
|
Integrated Resource Plan
|
|
|
LIBOR
|
London Interbank Offered Rate
|
|
|
LLW
|
Low-level radioactive waste
|
|
|
LNG
|
Liquefied natural gas. Natural gas that has been converted to a liquid.
|
|
|
MACT
|
Maximum Achievable Control Technology
|
|
|
mark-to-market
|
The process whereby an asset or liability is recognized at fair value.
|
|
|
MERP
|
Metropolitan Emissions Reduction Project
|
|
|
MGP
|
Manufactured gas plant
|
|
|
MISO
|
Midwest Independent Transmission System Operator, Inc.
|
|
|
Moody’s
|
Moody’s Investors Service
|
|
|
MRO
|
Midwest Reliability Organization
|
|
|
MVP
|
Multi-Value Project
|
|
|
native load
|
The customer demand of retail and wholesale customers that a utility has an obligation to serve: e.g., an obligation to provide electric or natural gas service created by statute or long-term contract.
|
|
|
natural gas
|
A naturally occurring mixture of gases found in porous geological formations beneath the earth’s surface, often in association with petroleum. The principal constituent is methane.
|
|
|
NAV
|
Notice of alleged violation
|
|
|
NOL
|
Net operating loss
|
|
|
nonutility
|
All items of revenue, expense and investment not associated, either by direct assignment or by allocation, with providing service to the utility customer.
|
|
|
NOPR
|
Notice of proposed rulemaking
|
|
|
NOx
|
Nitrogen oxide
|
|
|
NEI
|
Nuclear Energy Institute
|
|
|
O&M
|
Operating and maintenance
|
|
|
OCI
|
Other comprehensive income
|
|
|
PBRP
|
Performance-based regulatory plan. An annual electric earnings test, an electric quality of service plan and a natural gas quality of service plan established by the CPUC.
|
|
|
PCB
|
Polychlorinated biphenyl
|
|
|
PFS
|
Private Fuel Storage, LLC. A consortium of private parties (including NSP-Minnesota) working to establish a private facility for interim storage of spent nuclear fuel.
|
|
|
PIIC
|
Prairie Island Indian Community
|
|
|
PJM
|
PJM Interconnection, LLC
|
|
|
PPA
|
Purchased power agreement
|
|
|
Provident
|
Provident Life & Accident Insurance Company
|
|
|
PRP
|
Potentially responsible party
|
|
|
PSP
|
Performance share plan
|
|
|
PURPA
|
Public Utility Regulatory Policies Act of 1978
|
|
|
PV
|
Photovoltaic
|
|
|
rate base
|
The investor-owned plant facilities for generation, transmission and distribution and other assets used in supplying utility service to the consumer.
|
|
|
REC
|
Renewable energy credit
|
|
|
RECB
|
Regional Expansion Criteria Benefits
|
|
|
RFP
|
Request for proposal
|
|
|
ROE
|
Return on equity
|
|
|
ROFR
|
Right of first refusal
|
|
|
RPS
|
Renewable Portfolio Standard. A regulation that requires the increased production of energy from renewable energy sources, such as wind, solar, biomass, and geothermal.
|
|
|
RTO
|
Regional Transmission Organization. An independent entity, which is established to have “functional control” over a utility’s electric transmission systems, in order to provide non-discriminatory access to transmission of electricity.
|
|
|
SCR
|
Selective Catalytic Reduction
|
|
|
SIP
|
State implementation plan
|
|
|
SO
2
|
Sulfur dioxide
|
|
|
SPP
|
Southwest Power Pool, Inc.
|
|
|
Standard & Poor’s
|
Standard & Poor’s Ratings Services
|
|
|
TSR
|
Total shareholder return
|
|
|
unbilled revenues
|
Amount of service rendered but not billed at the end of an accounting period. Cycle meter-reading practices result in unbilled consumption between the date of last meter reading and the end of the period.
|
|
|
underlying
|
A specified interest rate, security price, commodity price, foreign exchange rate, index of prices or rates, or other variable, including the occurrence or nonoccurrence of a specified event such as a scheduled payment under a contract.
|
|
|
WECC
|
Western Electricity Coordinating Council
|
|
|
wheeling or transmission
|
An electric service wherein high-voltage transmission facilities of one utility system are used to transmit power generated within or purchased from another system.
|
|
|
working capital
|
Funds necessary to meet operating expenses.
|
|
|
WTMPA
|
West Texas Municipal Power Agency
|
|
|
Measurements
|
||
|
Bcf
|
Billion cubic feet
|
|
|
Btu
|
British thermal unit. A standard unit for measuring thermal energy or heat commonly used as a gauge for the energy content of natural gas and other fuels.
|
|
|
GWh
|
Gigawatt hours. One gigawatt hour equals one billion watt hours.
|
|
|
KV
|
Kilovolts (one KV equals one thousand volts)
|
|
|
KW
|
Kilowatts (one KW equals one thousand watts)
|
|
|
KWh
|
Kilowatt hours
|
|
|
Mcf
|
Thousand cubic feet
|
|
|
MMBtu
|
One million Btus
|
|
|
MW
|
Megawatts (one MW equals one thousand KW)
|
|
|
Volt
|
The unit of measurement of electromotive force. Equivalent to the force required to produce a current of one ampere through a resistance of one ohm. The unit of measure for electrical potential. Generally measured in kilovolts.
|
|
|
Watt
|
A measure of power production or usage.
|
|
Xcel Energy is a holding company, with subsidiaries engaged primarily in the utility business. In 2010, Xcel Energy’s continuing operations included the activity of four wholly owned utility subsidiaries that serve electric and natural gas customers in eight states. These utility subsidiaries are NSP-Minnesota, NSP-Wisconsin, PSCo and SPS. These utilities serve customers in portions of Colorado, Michigan, Minnesota, New Mexico, North Dakota, South Dakota, Texas and Wisconsin. Along with WYCO, a joint venture formed with Colorado Interstate Gas Company (CIG) to develop and lease natural gas pipeline, storage, and compression facilities, and WGI, an interstate natural gas pipeline company, these companies comprise the continuing regulated utility operations.
Xcel Energy was incorporated under the laws of Minnesota in 1909. Xcel Energy’s executive offices are located at 414 Nicollet Mall, Minneapolis, Minn. 55401. Its website address is www.xcelenergy.com. Xcel Energy makes available, free of charge through its website, its annual report on Form 10-K, quarterly reports on Form 10-Q, current reports on Form 8-K and all amendments to those reports filed or furnished pursuant to Section 13(a) or 15(d) of the Securities Exchange Act of 1934 as soon as reasonably practicable after the reports are electronically filed with or furnished to the SEC. The public may read and copy any materials that Xcel Energy files with the SEC at the SEC’s Public Reference Room at 100 F Street, N.E., Washington, D.C. 20549. The public may obtain information on the operation of the Public Reference Room by calling the SEC at 1-800-SEC-0330. The SEC also maintains an internet site that contains reports, proxy and information statements, and other information regarding issuers that file electronically with the SEC at http://www.sec.gov.
Xcel Energy focuses on growing through investments in electric and natural gas rate base to 1) meet growing customer demands, 2) comply with environmental and renewable energy initiatives and 3) maintain or increase reliability and quality of service to customers. Xcel Energy files periodic rate cases and establishes formula rate or automatic rate adjustment mechanisms with state and federal regulators to earn a return on its investments and recover costs of operations. Environmental leadership is a strategic priority for Xcel Energy. Our environmental leadership strategy is designed to meet customer and policy maker expectations while creating shareholder value.
NSP-Minnesota
NSP-Minnesota is an operating utility primarily engaged in the generation, purchase, transmission, distribution and sale of electricity in Minnesota, North Dakota and South Dakota. The wholesale customers served by NSP-Minnesota comprised approximately 6 percent of its total sales in 2010. NSP-Minnesota also purchases, transports, distributes and sells natural gas to retail customers and transports customer-owned natural gas in Minnesota and North Dakota. NSP-Minnesota provides electric utility service to approximately 1.4 million customers and natural gas utility service to approximately 0.5 million customers. Approximately 89 percent of NSP-Minnesota’s retail electric operating revenues were derived from operations in Minnesota during 2010. Generally, NSP-Minnesota’s earnings contribute approximately 35 percent to 45 percent of Xcel Energy’s consolidated net income.
The electric production and transmission system of NSP-Minnesota is managed as an integrated system with that of NSP-Wisconsin, jointly referred to as the NSP System. The electric production and transmission costs of the entire NSP System are shared by NSP-Minnesota and NSP-Wisconsin. A FERC-approved Interchange Agreement between the two companies provides for the sharing of all generation and transmission costs of the NSP System.
NSP-Minnesota owns the following direct subsidiaries: United Power and Land Company, which holds real estate; and NSP Nuclear Corporation.
NSP-Wisconsin
NSP-Wisconsin is an operating utility primarily engaged in the generation, transmission, distribution and sale of electricity in portions of northwestern Wisconsin and in the western portion of the Upper Peninsula of Michigan. The wholesale customers served by NSP-Wisconsin comprised approximately 8 percent of its total sales in 2010. NSP-Wisconsin also purchases, transports, distributes and sells natural gas to retail customers and transports customer-owned natural gas in the same service territory. NSP-Wisconsin provides electric utility service to approximately 250,000 customers and natural gas utility service to approximately 106,000 customers. The management of the electric production and transmission system of NSP-Wisconsin is integrated with NSP-Minnesota. Approximately 98 percent of NSP-Wisconsin’s retail electric operating revenues were derived from operations in Wisconsin during 2010. Generally, NSP-Wisconsin’s earnings contribute approximately 5 percent to 10 percent of Xcel Energy’s consolidated net income.
NSP-Wisconsin owns the following direct subsidiaries: Chippewa and Flambeau Improvement Co., which operates hydro reservoirs; Clearwater Investments Inc., which owns interests in affordable housing; and NSP Lands, Inc., which holds real estate.
PSCo
PSCo is an operating utility engaged primarily in the generation, purchase, transmission, distribution and sale of electricity in Colorado. The wholesale customers served by PSCo comprised approximately 20 percent of its total sales in 2010. PSCo also purchases, transports, distributes and sells natural gas to retail customers and transports customer-owned natural gas. PSCo provides electric utility service to approximately 1.4 million customers and natural gas utility service to approximately 1.3 million customers. All of PSCo’s retail electric operating revenues were derived from operations in Colorado during 2010. Generally, PSCo’s earnings contribute approximately 45 percent to 55 percent of Xcel Energy’s consolidated net income.
PSCo owns the following direct subsidiaries: 1480 Welton, Inc. and United Water Company, both of which own certain real estate interests; and Green and Clear Lakes Company, which owns water rights and certain real estate interests. PSCo also owns PSRI, which held certain former employees’ life insurance policies. Following settlement with the IRS during 2007, such policies were terminated. PSCo also holds a controlling interest in several other relatively small ditch and water companies.
SPS
SPS is an operating utility engaged primarily in the generation, purchase, transmission, distribution and sale of electricity in portions of Texas and New Mexico. The wholesale customers served by SPS comprised approximately 36 percent of its total sales in 2010. SPS provides electric utility service to approximately 375,000 retail customers in Texas and New Mexico. Approximately 74 percent of SPS’ retail electric operating revenues were derived from operations in Texas during 2010. Generally, SPS’ earnings contribute approximately 5 percent to 10 percent of Xcel Energy’s consolidated net income.
In October 2010, SPS sold certain electric distribution assets in Lubbock, Texas to Lubbock Power and Light (LP&L) for $87 million. This sale resulted in a pre-tax gain of approximately $20 million which will be shared with retail customers in Texas, and has been deferred as a regulatory liability pending the determination of the sharing by the PUCT. SPS’ retail sales in Lubbock were approximately 3 percent of SPS’ total energy sales in both 2010 and 2009. SPS anticipates it will sell the same amount of power to the city under existing wholesale power arrangements with WTMPA.
Other Subsidiaries
WGI was incorporated in 1990 under the laws of Colorado. WGI is a small interstate natural gas pipeline company engaged in transporting natural gas from the PSCo system near Chalk Bluffs, Colo., to the Cheyenne system near Cheyenne, Wyo.
WYCO was formed as a joint venture with CIG to develop and lease natural gas pipeline, storage, and compression facilities. Xcel Energy has a 50 percent ownership interest in WYCO. WYCO’s High Plains gas pipeline began operations in 2008 and its Totem gas storage facilities began operations in 2009. The gas pipeline and storage facilities are leased under a FERC-approved agreement to CIG.
Xcel Energy Services Inc. is the service company for the Xcel Energy holding company.
Xcel Energy’s nonregulated subsidiary in continuing operations is Eloigne, which invests in rental housing projects that qualify for low-income housing tax credits.
Xcel Energy conducts its utility business in the following reportable segments: regulated electric utility, regulated natural gas utility and all other. See Note 17 to the consolidated financial statements for further discussion relating to comparative segment revenues, income from continuing operations and related financial information.
Overview
Environmental Regulations, Climate Change and Clean Energy
—
Electric utilities are subject to a significant array of environmental regulations. Further, there are significant future environmental regulations under consideration to encourage the use of clean energy technologies and regulate emissions of GHGs to address climate change.
While environmental regulations, climate change and clean energy continue to evolve, Xcel Energy has undertaken a number of initiatives to meet current and prepare for potential future regulations, reduce GHG emissions and respond to state renewable and energy efficiency goals. Although the impact of these policies on Xcel Energy will depend on the specifics of state and federal policies, legislation, and regulation, we believe that, based on prior state commission practice, we would be granted the authority to recover the cost of these initiatives through rates.
Additional information regarding climate change and clean energy is presented in the Management’s Discussion and Analysis section.
Utility Competition
—
The FERC has continued its efforts to promote competitive wholesale markets through open access transmission and other means. As a consequence, Xcel Energy’s utility subsidiaries and their wholesale customers can purchase generation resources from competing wholesale suppliers and use the transmission systems of the utility subsidiaries on a comparable basis to the utility subsidiaries’ to serve their native load.
Transmission
—
In June 2010, the FERC issued a NOPR that would eliminate any preferential right at the federal level for an incumbent transmission provider to construct new transmission facilities in its service territory, referred to as a ROFR. The NOPR is pending FERC action. Irrespective of the NOPR, the utility subsidiaries are pursuing several new transmission facility projects.
The FERC approved the open access transmission planning processes for the Xcel Energy operating companies and the RTOs serving the NSP-Minnesota, NSP-Wisconsin and SPS systems (MISO and SPP, respectively).
In addition to utility-sponsored transmission expansion, several large “overlay” transmission projects have been proposed to construct 765 KV transmission facilities through the service areas of the utility subsidiaries. Xcel Energy is participating in certain overlay project evaluations to ensure that any projects proposed are the most cost effective options. It is not certain if or when specific overlay projects may be constructed and placed in service.
Alternative Energy Options
—
Xcel Energy’s industrial and large commercial customers have the ability to own or operate facilities to generate their own electricity. In addition, customers may have the option of substituting other fuels, such as natural gas, steam or chilled water for heating, cooling and manufacturing purposes, or the option of relocating their facilities to a lower cost region. While each of Xcel Energy’s utility subsidiaries faces these challenges, their rates are competitive with currently available alternatives. In December 2010, NSP-Wisconsin’s two largest wholesale customers, the cities of Rice Lake, Wis. and Medford, Wis., each issued a notice canceling their wholesale power contracts with NSP-Wisconsin. The two cities will begin purchasing power from an alternate supplier. Medford will terminate service at the end of 2011, and Rice Lake will terminate service at the end of 2012. In 2009, these two customers represented over half of NSP-Wisconsin’s wholesale load and revenue, and approximately 3 percent of NSP-Wisconsin’s total electric operating revenue.
Public Utility Regulation
Summary of Regulatory Agencies and Areas of Jurisdiction
—
Retail rates, services and other aspects of NSP-Minnesota’s operations are regulated by the MPUC, the NDPSC and the SDPUC within their respective states. The MPUC also has regulatory authority over security issuances, property transfers, mergers and transactions between NSP-Minnesota and its affiliates. In addition, the MPUC reviews and approves NSP-Minnesota’s electric resource plans for meeting customers’ future energy needs. The MPUC also certifies the need for generating plants greater than 50 MW and transmission lines greater than 100 KV that will be located within the state.
No large power plant or transmission line may be constructed in Minnesota except on a site or route designated by the MPUC. The NDPSC and SDPUC have regulatory authority over generating and transmission facilities, and the siting and routing of new generation and transmission facilities in North Dakota and South Dakota, respectively.
NSP-Minnesota is subject to the jurisdiction of the FERC with respect to its wholesale electric operations, hydroelectric licensing, accounting practices, wholesale sales for resale, transmission of electricity in interstate commerce, compliance with mandatory NERC electric reliability standards and certain natural gas transactions in interstate commerce. NSP-Minnesota received authorization from the FERC to make wholesale electric sales at market-based prices (see Summary of Recent Federal Regulatory Developments
—
Market-Based Rate Rules discussion) and is a transmission-owner member of the MISO RTO.
Fuel, Purchased Energy and Conservation Cost-Recovery Mechanisms
—
NSP-Minnesota has several retail adjustment clauses that recover fuel, purchased energy and other resource costs:
|
|
●
|
CIP
— The CIP recovers the costs of programs that help customers save energy. CIP includes a comprehensive list of programs that benefit all customers including Saver’s Switch
®
, energy efficiency rebates and energy audits.
|
|
|
●
|
EIR
— The EIR recovers the costs of environmental improvements to the A.S. King, High Bridge and Riverside plants, which were renovated under the MERP program.
|
|
|
●
|
GAP
— The GAP is a surcharge billed to all non-interruptible customers to recover the costs of offering a low-income customer co-pay program designed to reduce natural gas service disconnections.
|
|
|
●
|
MCR
— The MCR recovers costs related to reducing Mercury emissions at two NSP-Minnesota fossil fuel power plants.
|
|
|
●
|
RDF
— The RDF allocates money collected from retail customers to support the development of emerging renewable energy projects research and development of renewable energy technologies.
|
|
|
●
|
RES
— The RES is a rider that recovers the costs of new renewable generation.
|
|
|
●
|
SEP
— The SEP recovers costs related to various energy policies approved by the Minnesota legislature.
|
|
|
●
|
TCR
— The TCR recovers costs associated with new investments in the electric transmission.
|
NSP-Minnesota’s retail electric rate schedules in Minnesota, North Dakota and South Dakota include a FCA for monthly billing adjustments for changes in prudently incurred cost of fuel, fuel related items and purchased energy. NSP-Minnesota is permitted to recover these costs through FCA mechanisms approved by the regulators in each jurisdiction. The FCAs allow NSP-Minnesota to bill customers for the cost of fuel and fuel related costs used to generate electricity at its plants and energy purchased from other suppliers. In general, capacity costs are not recovered through the FCA. In addition, costs associated with MISO are generally recovered through either the FCA or through rate cases.
Minnesota state law requires electric utilities to invest 1.5 percent of their state revenues in CIP, except NSP-Minnesota, which is required by law to invest 2 percent of state revenues. These costs are recovered through an annual cost-recovery mechanism for electric conservation and energy management program expenditures.
Capacity and Demand
Uninterrupted system peak demand for the NSP System’s electric utility for each of the last three years and the forecast for 2011, assuming normal weather, is listed below.
|
System Peak Demand (in MW)
|
||||||||||||||||
|
2008
|
2009
|
2010
|
2011 Forecast
|
|||||||||||||
|
NSP System
|
8,697 | 8,615 | 9,131 | 9,357 | ||||||||||||
The peak demand for the NSP System typically occurs in the summer. The 2010 uninterrupted system peak demand for the NSP System occurred on Aug. 9, 2010.
Energy Sources and Related Transmission Initiatives
NSP-Minnesota expects to use existing power plants, power purchases, CIP options, new generation facilities and expansion of existing power plants to meet its system capacity requirements.
Purchased Power
—
NSP-Minnesota has contracts to purchase power from other utilities and independent power producers. Capacity is the measure of the rate at which a particular generating source produces electricity. Energy is a measure of the amount of electricity produced from a particular generating source over a period of time. Long-term purchase power contracts typically require a periodic payment to secure the capacity and a charge for the associated energy actually purchased.
NSP-Minnesota also makes short-term purchases to comply with minimum availability requirements, to obtain energy at a lower cost and for various other operating requirements.
Purchased Transmission Services
—
In addition to using their integrated transmission system, NSP-Minnesota and NSP-Wisconsin have contracts with MISO and regional transmission service providers to deliver power and energy to the NSP System.
2010 NSP System Resource Decisions and Plan
—
In May 2010, NSP-Minnesota signed new power purchase and exchange agreements with Manitoba Hydro that will extend purchases through 2025. The existing agreements provided for the purchase of 850 MW, which would have started to expire in April 2015. NSP-Minnesota filed for approval with the MPUC in June 2010.
NSP-Minnesota filed its 2011-2025 resource plan in August 2010. In addition to the extension of contracts with Manitoba Hydro and previously approved life extensions and capacity increases at NSP-Minnesota’s nuclear generating plants, the near term actions in the plan include continued expansion of demand side management programs up to 1.5 percent of sales annually, the acquisition of up to 250 MW of additional wind power to be in service by 2012 if priced competitively, and the replacement of the remaining 270 MW of coal fired generation at the Black Dog generating plant with 680 MW combined-cycle unit by January 2016.
Through the Interchange Agreement, the Minnesota resource plan and decisions have a direct impact on the costs that are shared by NSP-Wisconsin.
Wind Generation
—
NSP-Minnesota invested approximately $500 million in wind generation through 2010 and expects to invest an additional $400 million in 2011. The 201 MW Nobles Wind Project in southwestern Minnesota began commercial operations in 2010 and the 150 MW Merricourt Wind Project in southeastern North Dakota is expected to reach commercial operation in 2011. The portion of the costs for the Nobles and Merricourt Wind Projects assigned to Minnesota electric retail customers are currently being collected through the RES rider. NSP-Minnesota has included the costs for the Nobles Wind Project in its current pending rate case in Minnesota and if approved, the costs will be recovered in base rates when final rates are implemented. The NDPSC granted advanced determinations of prudence for the Nobles and Merricourt Wind Projects and a CPCN for the Merricourt Wind Project. This process provides greater assurance that NSP-Minnesota can recover the North Dakota portion of prudently incurred expenses for these projects.
NSP-Minnesota Transmission CONs
—
In May 2009, the MPUC granted a CON to construct three 345 KV electric transmission lines as part of the CapX2020 project. The project to build the three lines includes construction of approximately 700 miles of new facilities at a cost of approximately $1.9 billion. The portion of the project cost to be constructed by NSP-Minnesota and NSP-Wisconsin is estimated to be approximately $1.0 billion. The remainder of the costs will be born by other utilities in the upper Midwest. These cost estimates will be revised after the regulatory process is completed. The MPUC also included a condition assuring a portion of the capacity of the Brookings, S.D. to Hampton, Minn. line is used for renewable energy. In May 2010, NSP-Minnesota and other CapX2020 utilities notified the MPUC that the in-service date for the Brookings, S.D. to Hampton, Minn. project is expected to be delayed to the second quarter of 2015, more than one year after the date provided in the MPUC CON decision. The MPUC ordered NSP-Minnesota to provide a report in January 2011 to update the status of the project. NSP-Minnesota filed the report, which described the numerous activities in progress to allow the project to be placed in service by second quarter 2015.
As part of the regulatory process for the CapX2020 345 KV projects, NSP-Minnesota and Great River Energy filed four route permit applications with the MPUC in addition to a facility permit application with the SDPUC, a certificate of corridor compatibility application with the NDPSC and a CPCN application with the PSCW. Two filed route permit applications have completed the evidentiary hearing processes, and the MPUC issued route permits for the Monticello, Minn. to St. Cloud, Minn. project and five of the six segments of the Brookings, S.D. to Hampton, Minn. project. One segment of the Brookings, S.D. to Hampton, Minn. line was referred back to the ALJ to develop more information concerning the appropriate location to cross the Minnesota River. That process has been completed and the ALJ issued recommendations in December 2010. In February 2011, the MPUC approved an aerial crossing of the Minnesota River. The other two CapX2020 route applications are expected to be sent to an evidentiary hearing in 2011.
Bemidji to Grand Rapids
In July 2009, the MPUC approved the CON application for a 230 KV CapX2020 transmission line between Bemidji, Minn. and Grand Rapids, Minn. Route permit hearings were concluded in May 2010, and a route permit was approved by the MPUC in November 2010. This line is expected to entail construction of approximately 68 miles of new facilities at a cost of $100 million. Construction related activities began in January 2011 and are expected to be completed in 2012. The estimated project cost to NSP-Minnesota is approximately $26 million.
Hiawatha Transmission Project
In November 2010, NSP-Minnesota submitted a CON application to the MPUC for two 115 KV lines in Minneapolis, Minn. Hearings on the CON will be held mid-2011 with an expectation of an MPUC decision of the CON and route permit by the end of 2011.
Glencoe to Waconia
In November 2010, NSP-Minnesota submitted a CON to the MPUC for 115 KV transmission line upgrades to the Glencoe, Minn. to Waconia, Minn. 69 KV line. This was followed by a route permit application filed in December 2010. Hearings on both applications will be held in mid-2011 with an expectation of an MPUC decision regarding both applications by the end of 2011.
Regulatory Investigations
Sewer Conflict Mitigation Deferred Accounting
—
In response to a February 2010 natural gas-fueled house fire in St. Paul, Minn., NSP-Minnesota initiated a three-year plan to investigate its natural gas system for conflicts between sewer lines and its natural gas lines, and are estimating plan costs at approximately $3.5 million per year. In December 2010, the MPUC approved deferred accounting of plan expenditures for recovery consideration in a future natural gas rate case.
ARCs
—
In 2009, the FERC adopted rules requiring MISO and other RTOs to allow ARCs to offer demand response aggregation services to end-use customers unless the relevant state regulatory agency prohibited the operation of ARCs. Under MISO’s proposed tariff revisions, ARCs would operate in competition with the state-regulated retail demand response programs offered by NSP-Minnesota. MISO requested its tariff revisions be effective in June 2010; however the FERC has not issued an order on MISO’s ARC-related tariff revisions. In May 2010, the MPUC and SDPUC issued orders prohibiting, or temporarily prohibiting, the operation of ARCs. In August 2010, the NDPSC issued an order prohibiting the operation of ARCs. In January 2011, the MPUC asked public utilities to explore the potential of programs with ARCs that compliment existing DSM and CIP initiatives.
FCA Investigation
—
In 2003, the MPUC opened an investigation to consider the continuing usefulness of the FCA for electric utilities in Minnesota. Continued discussions among utilities, the OES, MOAG and business customers regarding appropriate FCA reporting detail and provision of additional information to customers is ongoing.
Nuclear Power Operations and Waste Disposal
NSP-Minnesota owns two nuclear generating plants: the Monticello plant and the Prairie Island plant, which has two units. See Note 15 to the consolidated financial statements for further discussion regarding the nuclear generating plants.
Nuclear power plant operation produces gaseous, liquid and solid radioactive wastes. The discharge and handling of such wastes are controlled by federal regulation. High-level radioactive wastes primarily include used nuclear fuel. LLW consists primarily of demineralizer resins, paper, protective clothing, rags, tools and equipment that have become contaminated through use in the plant.
LLW Disposal
—
Federal law places responsibility on each state for securing a site to be used for the disposal of LLW generated within its borders. LLW from NSP-Minnesota’s Monticello and Prairie Island nuclear plants is currently disposed at the Clive facility located in Utah. If off-site LLW disposal facilities become unavailable, NSP-Minnesota has storage capacity available on-site at Prairie Island and Monticello that would allow both plants to continue to operate until the end of their current licensed lives.
High-Level Radioactive Waste Disposal
—
The federal government has the responsibility to permanently dispose of domestic spent nuclear fuel and other high-level radioactive wastes. The Nuclear Waste Policy Act requires the DOE to implement a program for nuclear high-level waste management. This includes the siting, licensing, construction and operation of a repository for spent nuclear fuel from civilian nuclear power reactors and other high-level radioactive wastes at a permanent federal storage or disposal facility. In 2002, the U.S. Congress designated Yucca Mountain, Nevada as the first deep geologic repository over the objections of the Governor of Nevada. In 2008, the DOE submitted an application to construct a deep geologic repository at Yucca Mountain to the NRC.
In 2010, the DOE announced its intention to stop the Yucca Mountain project and requested the NRC to approve the withdrawal of the application. A number of parties have challenged the DOE’s authority to stop the project and withdraw the application. The utility industry, including Xcel Energy, is represented in the challenges by the NEI. In light of the DOE’s plan to stop the project and withdraw its application, Xcel Energy in a separate action has requested the Secretary of Energy to set the fee collection rate for the Nuclear Waste Fund to zero until a definitive program is in place. In April 2010, the NEI, on behalf of its members, including Xcel Energy, filed a lawsuit against the DOE in federal court, requesting that the fee be suspended. In parallel with the action to stop the Yucca Mountain project, the Secretary of Energy convened a Blue Ribbon Commission to recommend alternatives to Yucca Mountain for disposing of used nuclear fuel. The final report containing recommendations from the Blue Ribbon Commission is expected in early 2012.
In June 2010, the ASLB issued a ruling that the DOE could not withdraw the Yucca Mountain application. The NRC Commissioners have made a decision to review the ASLB’s decision. A decision from the NRC Commissioners could come in the first quarter 2011.
To date, the DOE has not accepted any of NSP-Minnesota’s spent nuclear fuel. NSP-Minnesota has interim on-site storage for spent nuclear fuel at its Monticello and Prairie Island nuclear generating plants. As of Dec. 31, 2010, there were 29 casks loaded and stored at the Prairie Island plant and 10 casks loaded and stored at the Monticello plant. See Item 3 and Note 14 to the consolidated financial statements for further discussion of the legal proceedings against the DOE related to the nuclear waste disposal matter.
PFS
— NSP-Minnesota is part of a consortium of private parties working to establish a private facility for interim storage of spent nuclear fuel. In 2005, NSP-Minnesota indicated that it would hold in abeyance future investments in the construction of PFS as long as there is apparent and continuing progress in federally sponsored initiatives for storage, reuse, and/or disposal for the nation’s spent nuclear fuel. In 2006, the Department of the Interior issued two findings: (1) that it would not grant the leases for rail or intermodal sites and (2) that it was revoking its previous conditional approval of the site lease between PFS and the Skull Valley Indian tribe.
In 2007, PFS and the Skull Valley Band filed a lawsuit challenging these actions. The lawsuit remains pending. A judicial appeal of the NRC licensing decision has been held in abeyance pending the outcome of the lawsuit challenging the Department of the Interior decisions. The existence of PFS as a licensed out-of-state storage option remains a credible alternative if PFS and the Skull Valley Band can prevail in the pending litigation and if the federal government fails to make progress with their obligation to take title and remove spent nuclear fuel from all domestic reactor sites.
Nuclear Plant Power Uprates and Life Extension
Monticello Life Extension
— In 2006, the NRC renewed Monticello’s operating license 20 years or until 2030.
Prairie Island Life Extension
— In 2008, NSP-Minnesota filed an application with the NRC to renew the operating license of its two nuclear reactors at Prairie Island for an additional 20 years, until 2033 and 2034, respectively. The NRC staff is proceeding with the items necessary to process Prairie Island’s license renewal application and NSP-Minnesota anticipates receiving a final decision on the Prairie Island license renewal in the second quarter of 2011.
Monticello Nuclear Extended Power Uprate
—
In 2008, NSP-Minnesota filed for an extended power uprate of approximately 71 MW for NSP-Minnesota’s Monticello facility. The MPUC approved the extended power uprate in 2008. The filing was placed on hold by the NRC staff to address concerns raised by the ACRS related to containment pressure associated with pump performance. The industry submitted a white paper and the NRC staff recommended that the matter be addressed through specific filings to demonstrate any potential risk and mitigation measures. In a letter to the NRC staff, the ACRS indicated that modifications to the plant should be evaluated and made where practical. NSP-Minnesota is working with the NRC to determine whether an additional supplement to its filing will be necessary to address the issues and expects to complete the license proceeding in 2011.
Prairie Island Nuclear Extended Power Uprate —
In 2008, NSP-Minnesota filed for an extended power uprate of approximately 164 MW for NSP-Minnesota’s Prairie Island Units 1 and 2. The MPUC approved the extended power uprate in 2009. NSP-Minnesota cannot file for NRC approval of the extended power uprate until after the NRC renews the plants’ current operating licenses. A decision is expected in 2011. The extended power uprates are scheduled to be implemented during the 2014 and 2015 refueling outages.
Fuel Supply and Costs
The following table shows the delivered cost per MMBtu of each significant category of fuel consumed for electric generation, the percentage of total fuel requirements represented by each category of fuel and the total weighted average cost of all fuels.
|
Weighted
|
||||||||||||||||||||||||||||
|
|
Coal*
|
Nuclear
|
Natural Gas
|
Average
|
||||||||||||||||||||||||
|
NSP System Generating Plants
|
Cost
|
Percent |
Cost
|
Percent |
Cost
|
Percent |
Fuel Cost
|
|||||||||||||||||||||
|
2010
|
$
|
1.89
|
51
|
%
|
$
|
0.83
|
42
|
%
|
$
|
6.29
|
7
|
%
|
$
|
1.73
|
||||||||||||||
|
2009
|
1.78
|
57
|
0.70
|
39
|
7.36
|
4
|
1.61
|
|||||||||||||||||||||
|
2008
|
1.73
|
58
|
0.56
|
39
|
10.09
|
3
|
1.55
|
|||||||||||||||||||||
|
* Includes refuse-derived fuel and wood.
|
||||||||||||||||||||||||||||
See Items 1A and 7 for further discussion of fuel supply and costs.
Fuel Sources
Coal
— The NSP System normally maintains approximately 40 days of coal inventory at each plant site. Coal supply inventories at Dec. 31, 2010 and 2009 were approximately 39 and 43 days usage, respectively. NSP-Minnesota’s generation stations use low-sulfur western coal purchased primarily under long-term contracts with suppliers operating in Wyoming and Montana. Estimated coal requirements at NSP-Minnesota’s and NSP-Wisconsin’s major coal-fired generating plants were approximately 9.9 and 10.2 million tons per year at Dec. 31, 2010 and 2009, respectively.
NSP-Minnesota and NSP-Wisconsin have contracted for coal supplies to provide 85 percent of their coal requirements in 2011, 75 percent of their coal requirements in 2012 and 31 percent of their coal requirements in 2013. Any remaining requirements will be filled through a RFP process or through over-the-counter transactions.
NSP-Minnesota and NSP-Wisconsin have a number of coal transportation contracts that provide for delivery of 100 percent of their coal requirements through 2013. Coal delivery may be subject to short-term interruptions or reductions due to operation of the mines, transportation problems, weather and availability of equipment.
Nuclear
— To operate NSP-Minnesota’s nuclear generating plants, NSP-Minnesota secures contracts for uranium concentrates, uranium conversion, uranium enrichment and fuel fabrication. The contract strategy involves a portfolio of spot purchases and medium and long-term contracts for uranium, conversion and enrichment with multiple producers and with a focus on diversification to minimize potential impacts caused by supply interruptions due to geographical and world political issues.
|
|
●
|
Current nuclear fuel supply contracts cover 100 percent of uranium concentrates requirements through 2012, approximately 66 percent of the requirements for 2013 through 2017, and approximately 38 percent of the requirements for 2018 through 2025. Contracts for additional uranium concentrate supplies are currently being negotiated that are expected to provide a portion of the remaining open requirements through 2025.
|
|
|
●
|
Current contracts for conversion services cover 100 percent of the requirements through 2011, approximately 78 percent of the requirements from 2012 through 2016, and approximately 30 percent of the requirements for 2017 through 2025. Contracts for additional conversion services are being negotiated to provide a portion of remaining open requirements for 2012 and beyond.
|
|
|
●
|
Current enrichment services contracts cover 100 percent of 2011 through 2016 requirements, and approximately 54 percent of the requirements for 2017 through 2025. Contracts for additional enrichment services are being negotiated to provide a portion of the remaining open requirements for 2017 and beyond.
|
Fabrication services for Monticello are covered through 2014. A contract for fuel fabrication services for Monticello for 2015 and beyond is currently being negotiated. Prairie Island’s fuel fabrication is 100 percent committed to 2015.
NSP-Minnesota expects sufficient uranium, conversion and enrichment to be available for the total fuel requirements of its nuclear generating plants. Some exposure to spot market price volatility will remain, due to index-based pricing structures contained in some of the supply contracts.
Natural gas
— The NSP System uses both firm and interruptible natural gas and standby oil in combustion turbines and certain boilers. Natural gas supplies and associated transportation and storage services for power plants are procured under contracts with various terms to provide an adequate supply of fuel. The supply, transportation and storage contracts expire in various years from 2011 to 2028. All of the natural gas supply contracts have pricing that is tied to various natural gas indices. Most transportation contract pricing is based on FERC approved transportation tariff rates. These transportation rates are subject to revision based upon FERC approval of changes in the timing or amount of allowable cost recovery by providers. Certain natural gas supply and transportation agreements include obligations for the purchase and/or delivery of specified volumes of natural gas or to make payments in lieu of delivery. At Dec. 31, 2010, NSP-Minnesota’s commitments related to supply contracts were $14 million and commitments related to transportation and storage contracts were approximately $499 million. The NSP System has limited on-site fuel oil storage facilities and relies on the spot market for incremental supplies, if needed.
Wholesale Commodity Marketing Operations
NSP-Minnesota conducts various wholesale marketing operations, including the purchase and sale of electric capacity, energy and energy related products. NSP-Minnesota uses physical and financial instruments to minimize commodity price and credit risk and hedge supplies and purchases. See Item 7A for further discussion.
Public Utility Regulation
Summary of Regulatory Agencies and Areas of Jurisdiction
—
Retail rates, services and other aspects of NSP-Wisconsin’s operations are regulated by the PSCW and the MPSC, within their respective states. In addition, each of the state commissions certifies the need for new generating plants and electric transmission lines before the facilities may be sited and built. NSP-Wisconsin is subject to the jurisdiction of the FERC with respect to its wholesale electric operations, hydroelectric generation licensing, accounting practices, wholesale sales for resale, the transmission of electricity in interstate commerce, compliance with mandatory NERC electric reliability standards and certain natural gas transactions in interstate commerce. NSP-Wisconsin has received authorization from the FERC to make wholesale electric sales at market-based prices (see Summary of Recent Federal Regulatory Developments - Market-Based Rate Rules discussion) and is a transmission-owning member of the MISO RTO.
The PSCW has a biennial base-rate filing requirement. By June of each odd-numbered year, NSP-Wisconsin must submit a rate filing for the test year beginning the following January.
Fuel and Purchased Energy Cost Recovery Mechanisms
—
NSP-Wisconsin does not have an automatic electric fuel adjustment clause for Wisconsin retail customers. Instead, it has a procedure that compares actual monthly and anticipated annual fuel costs with costs included in retail base electric rates. If the comparison results in a difference of 2 percent, the PSCW may hold hearings limited to fuel costs and revise rates upward or downward. Any revised rates would remain in effect until the next rate change. The adjustment approved is calculated on an annual basis, but applied prospectively. NSP-Wisconsin’s wholesale electric rate schedules include a FCA to provide for adjustments to billings and revenues for changes in the cost of fuel and purchased energy. In 2011, the fuel and purchased energy cost recovery mechanism will be changed as discussed below.
NSP-Wisconsin’s retail electric rate schedules for Michigan customers include power supply cost recovery factors, which are based on 12-month projections. After each 12-month period, reconciliation is submitted whereby over-collections are refunded and any under-collections are collected from the customers over the subsequent 12-month period.
Wisconsin Fuel Cost Recovery Legislation —
In May 2010, Wisconsin adopted a law to modify its existing statutes and rules governing electric fuel cost recovery in utility rates. The prohibition on an automatic adjustment clause remains, but the provision requiring an emergency or extraordinary increase in the cost of fuel before the PSCW can approve a fuel-related rate increase was repealed.
Under the final rules, an electric utility will submit a forward-looking annual fuel cost plan for approval by the PSCW. Once a utility has an approved fuel cost plan, it can then defer any under-collection or over-collection of fuel costs for future rate recovery or refund, for the amount of any under/over-collection that exceeds a 2 percent symmetrical annual tolerance band. Approval of a fuel cost plan and any rate adjustment for recovery or refund of deferred costs would be determined by the PSCW after opportunity for a hearing. Rate recovery of deferred fuel cost is subject to an earnings test based on the utility’s most recently authorized ROE. The rule went into effect for calendar year 2011.
Wisconsin RPS and Energy Efficiency and Conservation Goals
—
The Wisconsin legislature passed an RPS that requires 10 percent of electric sales statewide to be supplied by renewable energy sources by the year 2015. However, under the RPS, each individual utility must increase its renewable percentage by 6 percent over its baseline level. For NSP-Wisconsin, the RPS is 12.89 percent. NSP-Wisconsin anticipates it will meet the RPS requirements with its pro-rata share of existing and planned renewable generation on the NSP System.
In 2010, the Wisconsin legislature approved a recommendation by the PSCW to increase state energy efficiency and conservation funding. NSP-Wisconsin will be allocated approximately $9.6 million of the statewide program costs for 2011. Historically, NSP-Wisconsin has recovered these costs in rates it charges to Wisconsin retail customers and expects to recover the increased program costs in rates going forward. The new statewide annual funding requirements are fixed as follows:
|
(Millions of Dollars)
|
||||
|
2011
|
$ | 120 | ||
|
2012
|
160 | |||
|
2013
|
204 | |||
|
2014 and thereafter
|
256 | |||
ARCs
—
In 2009, the FERC adopted rules requiring MISO to allow ARCs to offer demand response aggregation services to end-use customers unless the applicable state regulatory authority prohibits ARCs from serving retail customers in their state. ARCs would operate in competition with the state-regulated retail demand response programs offered by NSP-Wisconsin. MISO requested its tariff revisions be effective in June 2010; however the FERC has not issued an order on MISO’s ARC-related tariff revisions. During 2009, the PSCW and MPSC issued orders temporarily prohibiting ARCs from operating in Wisconsin and Michigan, respectively, pending further regulatory proceedings. No additional action has been taken by the PSCW or the MPSC since that time.
Capacity and Demand
NSP-Wisconsin operates an integrated system with NSP-Minnesota. See a discussion of the system capacity and demand under NSP-Minnesota Capacity and Demand discussed previously.
Energy Sources and Related Initiatives
NSP-Wisconsin operates an integrated system with NSP-Minnesota. See a discussion of the system energy sources under NSP-Minnesota Energy Sources and Related Initiatives discussed previously.
Fuel Supply and Costs
NSP-Wisconsin operates an integrated system with NSP-Minnesota. See a discussion of the system energy sources under NSP-Minnesota Fuel Supply and Costs discussed previously.
Public Utility Regulation
Summary of Regulatory Agencies and Areas of Jurisdiction
—
PSCo is regulated by the CPUC with respect to its facilities, rates, accounts, services and issuance of securities. PSCo is regulated by the FERC with respect to its wholesale electric operations, accounting practices, hydroelectric licensing, wholesale sales for resale, the transmission of electricity in interstate commerce, compliance with mandatory NERC electric reliability standards and certain natural gas transactions in interstate commerce. PSCo has received authorization from the FERC to make wholesale electricity sales at market-based prices (see Summary of Recent Federal Regulatory Developments
—
Market-Based Rate Rules discussion); however, PSCo withdrew its market-based rate authority with respect to sales in its own and affiliated operating company control areas.
Fuel, Purchased Energy and Conservation Cost-Recovery Mechanisms
—
PSCo has several retail adjustment clauses that recover fuel, purchased energy and other resource costs:
|
|
●
|
ECA
— The ECA recovers fuel and purchase power costs. Short-term sales margins and margins from the sale of SO
2
allowances are shared with retail customers through the ECA. The ECA mechanism is revised quarterly.
|
|
|
●
|
PCCA
— The PCCA allows for recovery of purchased capacity payments for power purchase agreements. Effective January 2011, the PCCA recovers the revenue requirement associated with the purchase of two facilities formerly under power purchase agreement: Blue Spruce Energy Center and Rocky Mountain Energy Center.
|
|
|
●
|
SCA
— The SCA allows PSCo to recover the difference between its actual cost of fuel and the amount of these costs recovered under its base steam service rates. The SCA rate is revised annually on Jan. 1, as well as on an interim basis to coincide with changes in fuel costs.
|
|
|
●
|
DSMCA
— The DSMCA clause permits PSCo to recover DSM and interruptible service option credit costs on a concurrent basis and performance initiatives based on achieving various energy savings goals. Beginning 2010, the CPUC approved recovery of the full amount of DSM-related costs through the combination of base rates and a DSMCA tracker mechanism.
|
|
|
●
|
RESA
— The RESA recovers the incremental costs of compliance with the RES and is set at its maximum level of 2 percent of the customer’s total bill.
|
|
|
●
|
Wind Source Service
— The Wind Source Service is a premium service for those customers who voluntarily choose to contribute funds for the acquisition of additional renewable resources beyond the level of PSCo’s resource plan. Wind Energy Service customers pay a charge that is in addition to the rates paid by other customers.
|
|
|
●
|
TCA
— The TCA provides for the recovery outside of rate cases of transmission plant revenue requirements and allows for a return on CWIP for transmission investments.
|
PSCo recovers fuel and purchased energy costs from its wholesale electric customers through a fuel cost adjustment clause approved by the FERC. PSCo’s wholesale customers have agreed to pay the full cost of renewable energy purchase and generation costs through a fuel clause and in exchange receive renewable energy credits associated with those resources.
PBRP and QSP Requirements
—
PSCo currently operates under an electric PBRP. This regulatory plan includes an electric QSP that provides for bill credits to customers if PSCo does not achieve certain performance targets relating to electric reliability and customer service through 2012. PSCo regularly monitors and records as necessary an estimated customer refund obligation under the PBRP. In April of each year following the measurement period, PSCo files its proposed rate adjustment under the PBRP. The CPUC conducts proceedings to review and approve these rate adjustments annually.
Capacity and Demand
Uninterrupted system peak demand for PSCo’s electric utility for each of the last three years and the forecast for 2011, assuming normal weather, is listed below.
|
System Peak Demand (in MW)
|
||||||||||||||||
|
2008
|
2009
|
2010
|
2011
|
|||||||||||||
|
PSCo
|
6,903 | 6,258 | 6,401 | 6,521 | ||||||||||||
The peak demand for PSCo’s system typically occurs in the summer. The 2010 uninterrupted system peak demand for PSCo occurred on July 14, 2010.
Energy Sources and Related Transmission Initiatives
PSCo expects to meet its system capacity requirements through existing electric generating stations, power purchases, new generation facilities, DSM options and phased expansion of existing generation at select power plants.
Purchased Transmission Services
—
In addition to using its own transmission system, PSCo has contracts with regional transmission service providers to deliver power and energy to PSCo’s customers.
Purchased Power
—
PSCo has contracts to purchase power from other utilities and independent power producers. Long-term purchase power contracts typically require a periodic payment to secure the capacity and a charge for the associated energy actually purchased.
PSCo also makes short-term purchases to replace generation from company-owned units that are unavailable due to maintenance and unplanned outages, to comply with minimum availability requirements, to obtain energy at a lower cost and for various other operating requirements.
Resource Plan
— In October 2009, the CPUC approved PSCo’s resource plan which includes 900 MW of additional intermittent renewable energy resources (wind and PV solar) and approximately 280 MW of “new technology” renewable energy sources. The CPUC also approved the selection of approximately 900 MW of traditional gas-fired resources.
Gas-fired Resources
In October 2010, the CPUC approved the acquisition of approximately 900 MW of gas-fired generation from subsidiaries of Calpine Corporation and the cost recovery settlement. In its approval, the CPUC required PSCo to file a rate case by April 30, 2012 to move the investment into rate base. The revenue requirements associated with the asset acquisition will continue to be recovered through the PCCA until final rates are implemented. The PCCA went into effect on Jan. 1, 2011. Fuel costs will continue to flow through the ECA. The acquisition closed on Dec. 6, 2010, and the related PPAs for the Blue Spruce Energy Center and Rocky Mountain Energy Center were terminated effective that date. See Note 19 to the consolidated financial statements for further discussion.
Solar and Wind Resources
In 2010, PSCo filed an amendment to the approved resource plan to reduce the amount of solar resources (combination of PV solar and new technology renewable energy resources) to 60 MW and to seek new bids for 200 MW of wind power due to the combination of a transmission line delay and changed market circumstances. The matter has been referred to an ALJ with direction to resolve the matter by May 2011.
RES — In March 2010, Colorado enacted a law that increases the RES and now mandates that at least 30 percent of energy sales be supplied by renewable energy for PSCo and removes the solar standard and replaces it with a distributed generation standard. Within the distributed generation standard, at least one-half of the distributed generation must be retail distributed generation, i.e., generation that is on customer premises behind the customer meter. The law requires that PSCo generate or cause to be generated electricity from renewable resources equaling:
|
|
●
|
At least 12 percent of its retail sales for the years 2011 through 2014;
|
|
|
●
|
At least 20 percent of its retail sales for the years 2015 through 2019; and
|
|
|
●
|
At least 30 percent of its retail sales for the years 2020 and thereafter.
|
In addition, distributed generation must equal:
|
|
●
|
At least 1 percent of retail sales in the years 2011 and 2012 and 1.25 percent of retail sales in the years 2013 and 2014;
|
|
|
●
|
At least 1.75 percent of retail sales in the years 2015 and 2016 and 2 percent of retail sales in the years 2017, 2018 and 2019; and
|
|
|
●
|
At least 3 percent of retail sales in the years 2020 and thereafter.
|
The CPUC has discretion to review the reasonableness of the increase in the distributed generation percentage in 2014. PSCo believes that its forecasted plan acquisitions of renewable resources only need minor modification to comply with the new standard.
CACJA
— The CACJA was signed into law in April 2010. The CACJA required PSCo to file a comprehensive plan to reduce annual emissions of NOx by at least 70 to 80 percent or greater from 2008 levels by 2017 from the coal-fired generation identified in the plan. The plan was required to consider both current and reasonably foreseeable CAA requirements and allows PSCo to propose emission controls, plant refueling, or plant retirement of at least 900 MW of coal-fired generating units in Colorado by Dec. 31, 2017. The legislation further encourages PSCo to submit long-term gas contracts to the CPUC for approval. The CACJA permits the CPUC to consider interim rate increases after Jan. 1, 2012, while the rate filing is pending and allows for multi-year rate plans.
In December 2010, the CPUC approved the following:
|
|
●
|
Shutdown Cherokee Units 1 and 2 in 2011 and Cherokee Unit 3 (365 MW in total) by the end of 2015, after a new natural gas combined-cycle unit is built at Cherokee Station (569 MW);
|
|
|
●
|
Fuel-switch Cherokee Unit 4 (352 MW) to natural gas by 2017;
|
|
|
●
|
Shutdown Arapahoe Unit 3 (45 MW) and fuel-switch Unit 4 (352 MW) in 2013 to natural gas;
|
|
|
●
|
Shutdown Valmont Unit 5 (186 MW) in 2017;
|
|
|
●
|
Install SCR for controlling NOx and a scrubber for controlling SO
2
on Pawnee Station in 2014;
|
|
|
●
|
Install SCR on Hayden Unit 1 in 2015 and Hayden Unit 2 in 2016; and
|
|
|
●
|
Convert Cherokee Unit 2 and Arapahoe Unit 3 to synchronous condensers to support the transmission system.
|
The CPUC provided for recovery on CWIP in rate base in each rate case and deferred accounting of accelerated depreciation costs. PSCo needs to make applications for detailed cost review before commencing each phase of the plan. The CPUC also encouraged PSCo to hold stakeholder meetings to discuss issues around a multi-year rate plan. In January 2011, the AQCC unanimously approved incorporation of the CACJA plan into Colorado’s regional haze SIP. See Note 14 to the consolidated financial statements for discussion. The Colorado state legislature must review the SIP, which will contain provisions of the CACJA approved by the CPUC. Unless changed by the legislature during its review process, the SIP (including the CACJA plan) will be sent to the EPA for incorporation into federal CAA regulations. The total investment associated with the adopted plan is approximately $1.0 billion over the next seven years. The rate impact of the proposed plan is expected to increase future bills on average by 2 percent annually.
San Luis Valley-Calumet-Comanche Unit 3 Transmission Project
—
In May 2009, PSCo and Tri-State Generation and Transmission Association filed a joint application with the CPUC for a project for 230 KV and 345 KV line and substation construction. The line is intended to assist in bringing solar power in the San Luis Valley to load. The line was originally expected to be placed in-service in 2013; however, that appears unlikely now due to delays in the siting and permitting of the line. Several landowners oppose this transmission line, including two large ranches. In November 2010, the ALJ issued a recommended decision granting the CPCN but proposing a significant refund obligation if the line was not heavily utilized ten years after it was in service. Several parties, including PSCo, filed exceptions to the recommended decision. The CPUC deliberated on the exceptions to the recommended decision and granted the CPCN without the refund obligation recommended by the ALJ. A written decision will follow.
SmartGridCity™ CPCN
— As part of the PSCo electric rate case, the CPUC included recovery of the revenue requirements associated with $45 million of capital and $4 million of annual O&M costs incurred by PSCo to develop and operate SmartGridCity™, subject to refund, and ordered PSCo to file for a CPCN for that project.
In February 2011, the CPUC approved the CPCN and allowed recovery of approximately $28 million of the capital cost and 100 percent of the O&M costs and ordered PSCo to file for a rate reduction in April 2011 to reflect the lower level of capital in rate base. The CPUC seeks additional information regarding the future plans to utilize SmartGridCity™ in an application to recover the additional capital. PSCo believes that it will be able to satisfy that requirement.
Fuel Supply and Costs
The following table shows the delivered cost per MMBtu of each significant category of fuel consumed for electric generation, the percentage of total fuel requirements represented by each category of fuel and the total weighted average cost of all fuels.
|
Weighted
|
||||||||||||||||||||
|
Coal
|
Natural Gas
|
Average
|
||||||||||||||||||
|
PSCo Generating Plants
|
Cost
|
Percent |
Cost
|
Percent |
Fuel Cost
|
|||||||||||||||
|
2010
|
$
|
1.58
|
85
|
%
|
$
|
5.05
|
15
|
%
|
$
|
2.11
|
||||||||||
|
2009
|
1.52
|
82
|
3.99
|
18
|
1.97
|
|||||||||||||||
|
2008
|
1.42
|
84
|
7.03
|
16
|
2.31
|
|||||||||||||||
See Items IA and 7 for further discussion of fuel supply and costs.
Fuel Sources
Coal
—
Coal inventory levels may vary widely among plants. However, PSCo normally maintains approximately 41 days of coal inventory at each plant site. Coal supply inventories at Dec. 31, 2010 and 2009 were approximately 34 and 68 days usage, respectively, based on the maximum burn rate for all of PSCo’s coal-fired plants. PSCo’s generation stations use low-sulfur western coal purchased primarily under contracts with suppliers operating in Colorado and Wyoming. During 2010 and 2009, PSCo’s coal requirements for existing plants were approximately 11.2 million and 9.2 million tons, respectively.
PSCo has contracted for coal suppliers to supply 84 percent of its coal requirements in 2011, 53 percent of its coal requirements in 2012 and 22 percent of its coal requirements in 2013. Any remaining requirements will be filled through an RFP process or through over-the-counter transactions.
PSCo has coal transportation contracts that provide for delivery of 100 percent of its coal requirements in 2011, 67 percent of its coal requirements in 2012 and 66 percent of its coal requirements in 2013. Coal delivery may be subject to short-term interruptions or reductions due to operation of the mines, transportation problems, weather, and availability of equipment.
Natural gas
—
PSCo uses both firm and interruptible natural gas and standby oil in combustion turbines and certain boilers. Natural gas supplies for PSCo’s power plants are procured under contracts to provide an adequate supply of fuel. The supply contracts expire in various years from 2011 through 2021. The transportation and storage contracts expire in various years from 2011 to 2040. The majority of natural gas supply contracts have pricing features tied to changes in various natural gas indices. PSCo hedges a portion of that risk through financial instruments. See Note 11 to the consolidated financial statements for further discussion. Most transportation contract pricing is based on FERC approved transportation tariff rates. These transportation rates are subject to revision based upon FERC approval of changes in the timing or amount of allowable cost recovery by providers. Certain natural gas supply and transportation agreements include obligations for the purchase and/or delivery of specified volumes of natural gas or to make payments in lieu of delivery. At Dec. 31, 2010, PSCo’s commitments related to supply contracts were approximately $817 million and transportation and storage contracts were approximately $1.0 billion.
Wholesale Commodity Marketing Operations
PSCo conducts various wholesale marketing operations, including the purchase and sale of electric capacity, energy and energy related products. PSCo uses physical and financial instruments to minimize commodity price and credit risk and hedge supplies and purchases. See Item 7A for further discussion.
Public Utility Regulation
Summary of Regulatory Agencies and Areas of Jurisdiction
—
The PUCT and NMPRC regulate SPS’ retail electric operations and have jurisdiction over its retail rates and services and the construction of transmission or generation in their respective states. The municipalities in which SPS operates in Texas have original jurisdiction over SPS’ rates in those communities. Each municipality can deny SPS’ rate increase. SPS can and does then appeal municipal rate decisions to the PUCT, which hears all municipal rate denials in one hearing. The NMPRC also has jurisdiction over the issuance of securities. SPS is regulated by the FERC with respect to its wholesale electric operations, accounting practices, wholesale sales for resale, the transmission of electricity in interstate commerce, compliance with mandatory NERC electric reliability standards and certain natural gas transactions in interstate commerce. SPS has received authorization from the FERC to make wholesale electric sales at market-based prices (see Summary of Recent Federal Regulatory Developments
-
Market-Based Rate Rules discussion).
Fuel, Purchased Energy and Conservation Cost-Recovery Mechanisms
—
Fuel and purchased energy costs are recovered in Texas through a fixed fuel and purchased energy recovery factor, which is part of SPS’ retail electric tariff. The regulations allow retail fuel factors to change up to three times per year.
There is an accounting of over- or under-recovery of fuel and purchased energy expenses under the fixed factor. Regulations also require refunding or surcharging over- or under-recovery amounts, including interest, when they exceed 4 percent of the utility’s annual fuel and purchased energy costs on a rolling 12-month basis, if this condition is expected to continue.
PUCT regulations require periodic examination of SPS fuel and purchased energy costs, the efficiency of the use of fuel and purchased energy, fuel acquisition and management policies and purchased energy commitments. SPS is required to file an application for the PUCT to retrospectively review fuel and purchased energy costs at least every three years.
The NMPRC has authorized SPS to use a monthly adjustment factor for a FPPCAC for SPS’ New Mexico retail jurisdiction. NMPRC regulations require SPS to periodically request authority to continue using its FPPCAC. The NMPRC reviews SPS’ use of its FPPCAC since the filing of its previous fuel clause continuation filing. As a follow-up to SPS’ last rate case, the NMPRC conducted an audit of SPS’ fuel and purchased power costs for a 12 month period from July 2009 through July 2010 and the tracking mechanism to capture costs and revenues associated with SPS’ RECs from assorted wind projects for the 12-month period from July 2009 through July 2010. Audit results are expected in the first quarter of 2011.
SPS recovers fuel and purchased energy costs from its wholesale customers through a monthly wholesale fuel and purchased economic energy cost adjustment clause accepted for filing by the FERC.
Texas EECRF Rider —
PUCT regulations established an EECRF rider under which electric utilities may recover costs associated with providing energy efficiency programs. The EECRF rider must be included in a utility’s tariff and may be established in a utility’s base rate case or through a separate request seeking to establish an EECRF. Previously, the PUCT concluded that the rule did not apply to SPS and that energy efficiency costs should be recovered in base rates. As part of the settlement in SPS’ last base rate case, SPS reached a negotiated settlement with the parties and included base rate recovery amounts explicitly designated for energy efficiency. In August 2010, the PUCT adopted a new rule that increases the energy efficiency goals and makes SPS subject to the same requirements with respect to the EECRF as other utilities in the state
.
Parties can appeal the application of the rule to SPS when SPS files for the rider in the spring of 2011.
Jones CCN
—
In August 2010, the PUCT approved SPS’ request for a CCN to build a gas-fired combustion turbine generating unit at SPS’ existing Jones Station in Lubbock, Texas. The NMPRC approved a similar CON in December 2010.
New Mexico Energy Efficiency Disincentive Rulemaking
—
During the 2008 New Mexico legislative session, increased energy efficiency goals and removal of disincentives were adopted. In 2010, the NMPRC adopted an amended rule incorporating the legislative changes. The rule had an interim mechanism that provides for recovery of disincentives and required utilities to file permanent rate design or other means of removing disincentives.
In July 2010, SPS filed its application to remove disincentives and requested direct lost margin recovery. A final approval order was received in December 2010 totaling $3.3 million for 2010 and 2011. A hearing in this case that focuses on the appropriate long-term mechanism is scheduled for March 2011.
Solar Contract Approval —
In December 2009, SPS entered into five solar energy PPAs with SunEdision, LLC (SunE), for the procurement of solar energy and associated RECs to meet its solar diversity requirements. The SunE PPAs involve five facilities, each consisting of 10 MW of capacity for a term of 20 years. In September 2010, the NMPRC approved the SunE PPAs and SPS’ proposed cost recovery.
New Mexico GHG Regulations
—
In 2010, the New Mexico EIB adopted regulations to limit and reduce GHGs, including CO
2
emissions from power plants and other industrial sources. SPS and several other utilities and industry groups have filed separate appeals with the New Mexico Court of Appeals challenging the validity of these GHG regulations. Compliance costs for these reductions or offsets may increase electricity rates to New Mexico customers. While regulated utilities generally recover costs resulting from regulatory requirements, SPS may not recover all costs related to complying with the regulatory requirements imposed on SPS under the existing EIB regulations. The effect of these regulations on the financial condition of SPS is uncertain, due to the lack of certainty about the validity of these challenged regulations, and also due to the relatively small proportion of SPS total greenhouse gases that are emitted in New Mexico.
TUCO Inc. (TUCO) to Woodward District Extra High Voltage (EHV) Interchange
—
In June 2009, SPP directed SPS to construct a 178 mile 345 KV transmission line between Lubbock, Texas and Woodward, Okla. The estimated investment in the new line is $149 million and will be recovered from SPP members, including SPS, in accordance with the SPP OATT and the retail ratemaking process. Preliminary work has begun for construction from the TUCO substation to the Oklahoma border. TRC was contracted to do the routing and environmental impact studies. SPS is expected to file an application requesting approval to build the line in March 2011.
Capacity and Demand
Uninterrupted system peak demand for SPS for each of the last three years and the forecast for 2011, assuming normal weather, is listed below.
|
System Peak Demand (in MW)
|
||||||||||||||||
|
2008
|
2009
|
2010
|
2011 Forecast
|
|||||||||||||
|
SPS
|
4,996 | 5,038 | 4,985 | 5,142 | ||||||||||||
The peak demand for the SPS system typically occurs in the summer. The 2010 uninterrupted system peak demand for SPS occurred on Aug. 4, 2010.
Energy Sources and Related Transmission Initiatives
SPS expects to use existing electric generating stations, power purchases and DSM options to meet its net dependable system capacity requirements.
Purchased Power
—
SPS has contracts to purchase power from other utilities and independent power producers. Long-term purchase power contracts typically require a periodic payment to secure the capacity from and a charge for the associated energy actually purchased. SPS also makes short-term purchases to comply with minimum availability requirements, and to obtain energy at a lower cost.
SPS Resource Planning
Integrated Resource Planning (IRP)
— SPS is soliciting public participation throughout 2011 in its New Mexico 2012 IRP filing through public and webcast meetings. SPS anticipates filing the IRP with the NMPRC in July 2012.
Renewable Energy Portfolio Plan
— SPS is required to develop and implement a renewable portfolio plan in which ten percent of its energy to serve its New Mexico retail customers is produced by renewable resources in 2011, increasing to 15 percent in 2015. SPS primarily fulfills its renewable portfolio requirements through the purchase of wind energy. In 2009, the NMPRC granted SPS a variance to allow SPS to delay meeting its solar energy requirement until 2012 provided that SPS compensates for any shortfall of the solar energy requirement for 2011 during 2012 through 2014. SPS executed and received NMPRC approval for a total of 50 MW of PV solar energy PPAs. SPS requested a variance from the NMPRC to extend the time to implement its other resource diversity requirements to January 2012.
Approved Resource Additions
— SPS plans to add a new third gas turbine to its Jones Plant site in Lubbock, Texas. SPS received CCN approvals from the PUCT and NMPRC for the turbine which will become operational in June 2011. This generating unit will add 168 MW of capacity to the SPS service territory. SPS also executed a purchase power agreement with Calpine Energy Services, LP for 200 MW from 2012 through 2018 that was approved by the NMPRC on Dec. 30, 2010.
Pending Resource Solicitations
— SPS finalized a power purchase agreement for 161 MW of wind resources and requested approval from the NMPRC in December 2010. SPS released a request for proposal in 2009 for approximately 43,000 MWh annually of biomass generation or an equivalent amount of biogas of approximately 326,000 MMBtu annually to meet its other resource diversity requirements in New Mexico. SPS is continuing its efforts to acquire viable biomass generation or a biogas purchase to meet its renewable energy portfolio plan in New Mexico.
Purchased Transmission Services
—
SPS has contractual arrangements with SPP and regional transmission service providers to deliver power and energy to its native load customers, which are retail and wholesale load obligations with terms of more than one year.
Fuel Supply and Costs
The following table shows the delivered cost per MMBtu of each significant category of fuel consumed for electric generation, the percentage of total fuel requirements represented by each category of fuel and the total weighted average cost of all fuels.
|
Weighted
|
||||||||||||||||||||
|
Coal
|
Natural Gas
|
Average
|
||||||||||||||||||
|
SPS Generating Plants
|
Cost
|
Percent |
Cost
|
Percent |
Fuel Cost
|
|||||||||||||||
|
2010
|
$
|
1.84
|
71
|
%
|
$
|
4.59
|
29
|
%
|
$
|
2.64
|
||||||||||
|
2009
|
1.74
|
73
|
3.80
|
27
|
2.30
|
|||||||||||||||
|
2008
|
1.86
|
71
|
8.41
|
29
|
3.78
|
|||||||||||||||
See Items 1A and 7 for further discussion of fuel supply and costs.
Fuel Sources
Coal
—
SPS purchases all of its coal requirements for its two coal facilities, Harrington and Tolk electric generating stations, from TUCO. TUCO arranges for the purchase, receiving, transporting, unloading, handling, crushing, weighing, and delivery of coal to meet SPS’ requirements. TUCO is responsible for negotiating and administering contracts with coal suppliers, transporters, and handlers. For the Harrington station, the coal supply contract with TUCO expires in 2016. For the Tolk station, the coal supply contract with TUCO expires in 2017. As of Dec. 31, 2010 and 2009, coal inventories at the Harrington site were approximately 38 and 46 days supply, respectively. As of Dec. 31, 2010 and 2009, coal inventories at the Tolk site were approximately 45 and 54 days supply, respectively. TUCO has coal agreements to supply 90 percent of SPS’ coal requirements in 2011, 57 percent of SPS’ coal requirements in 2012, and 44 percent of SPS’ coal requirements in 2013, which are sufficient quantities to meet the primary needs of the Harrington and Tolk stations.
Natural gas
—
SPS uses both firm and interruptible natural gas and standby oil in combustion turbines and certain boilers. Natural gas for SPS’ power plants is procured under contracts to provide an adequate supply of fuel; which typically is purchased with terms of one year or less. The transportation and storage contracts expire in various years from 2011 to 2033. All of the natural gas supply contracts have pricing that is tied to various natural gas indices. Most transportation contract pricing is based on FERC and Railroad Commission of Texas approved transportation tariff rates. These transportation rates are subject to revision based upon FERC or Railroad Commission of Texas approval of changes in the timing or amount of allowable cost recovery by providers. Certain natural gas supply and transportation agreements include obligations for the purchase and/or delivery of specified volumes of natural gas or to make payments in lieu of delivery. At Dec. 31, 2010, SPS’ commitments related to supply contracts were approximately $28 million and transportation and storage contracts were approximately $233 million.
Wholesale Commodity Marketing Operations
SPS conducts various wholesale marketing operations, including the purchase and sale of electric capacity, energy and energy related products. SPS uses physical and financial instruments to minimize commodity price and credit risk and hedge supplies and purchases. See Item 7A for further discussion.
Summary of Recent Federal Regulatory Developments
The FERC has jurisdiction over rates for electric transmission service in interstate commerce and electricity sold at wholesale, hydro facility licensing, natural gas transportation, accounting practices and certain other activities of Xcel Energy’s utility subsidiaries, and enforcement of NERC mandatory electric reliability standards. State and local agencies have jurisdiction over many of Xcel Energy’s utility activities, including regulation of retail rates and environmental matters. In addition to the matters discussed below, see Note 13 to the consolidated financial statements for further discussion of other regulatory matters.
FERC Penalty Guidelines Issued
— The Energy Act required the FERC to adopt new regulations to implement various aspects of the Energy Act. Violations of FERC rules are potentially subject to enforcement action by the FERC including financial penalties up to $1 million per day per violation.
In September 2010, the FERC issued a policy statement establishing guidelines to determine the financial penalties that would be applied for violations of FERC statutes, rules and orders, including violations of NERC mandatory reliability standard violations investigated by the FERC. The guidelines establish a base violation level for various types of violations, plus mitigating or aggravating factor adders and multipliers, depending on the nature and severity of the violation. Penalties range between a minimal amount and $72.5 million based on an application of a multiplier. The guidelines indicate that the FERC can deviate from the guidelines in its discretion. The guidelines can apply to any investigation where the FERC staff has not begun settlement negotiations regarding an alleged violation.
While Xcel Energy cannot predict the ultimate impact new FERC regulations will have on its operations or financial results, Xcel Energy is taking actions that are intended to comply with and implement new FERC rules and regulations as they become effective.
NERC Electric Reliability Standards Compliance
Compliance Audits and Self Reports
In October 2008, the WECC auditors issued their final audit report on PSCo’s compliance with certain NERC mandatory electric reliability standards. The report found a possible violation of one reliability standard related to relay maintenance.
In 2008, the NSP System, PSCo and SPS filed self-reports with the MRO, WECC and SPP regional entities, respectively, relating to failure to complete certain generation station battery tests, relay maintenance intervals and record keeping associated with certain CIPS. In 2009, the NSP System, PSCo, and SPS each reached agreement with the relevant regional entity that would resolve the PSCo open 2008 audit finding and the 2008 self reports by payment of a non-material penalty. These settlement agreements have been approved by the NERC and were filed for FERC approval in December 2010. In January 2011, the FERC issued an order accepting the NERC approval with no further action.
In March 2010, the MRO, SPP and WECC conducted a joint compliance spot check to evaluate compliance with the NERC CIPS. The regional entity issued a non-public final report in August 2010 alleging violations of certain CIPS requirements, including certain violations common to all Xcel Energy utility subsidiaries. Xcel Energy disputes the alleged violations and is working to resolve the issues. To what extent the regional entities or NERC may seek to impose penalties for violations of CIPS is unknown at this time.
In July 2010, the WECC issued a non-public NAV related to (1) two alleged non-common CIPS violations identified in the joint CIPS spot-check, and (2) two violations self-reported by PSCo related to certain BAL standards. The WECC NAV proposed a non-material penalty. PSCo requested that the proceedings be deferred to allow settlement negotiations to resolve the NAV. The matter is now in settlement discussions. Based on these discussions, a second self-report similar to one of the previously filed BAL self-reports was filed and this report will be resolved along with the other matters pending with WECC. None of the alleged or self-reported violations is expected to result in a material penalty.
In 2010, SPP conducted its triennial audit of SPS compliance with certain NERC mandatory electric reliability standards. The audit did not include an evaluation of SPS compliance with NERC CIPS. The auditors found no standards violations. The written SPP audit report is now being completed.
In November 2010, the NSP System, PSCo and SPS filed self-reports with the MRO, WECC and SPP, respectively, regarding potential violations of certain NERC CIPS. Additional self-reports of potential violations of CIPS standards were filed in January 2011. Based on the issues identified with CIPS compliance, the utility subsidiaries submitted a mitigation plan that provides for a comprehensive review of their CIPS compliance programs. Whether and to what extent penalties may be assessed against the utility subsidiaries for the issues identified and self-reported to date is unclear.
In February 2011, the NSP System will be subject to a comprehensive triennial audit by the MRO regarding compliance with various NERC mandatory reliability standards, including CIPS.
NERC Compliance Investigations
In September 2007, portions of the NSP System and transmission systems west and north of the NSP System briefly islanded from the rest of the Eastern Interconnection as a result of a series of transmission line outages. In addition, service to approximately 790 MW of load was temporarily interrupted, primarily in Saskatchewan, Canada. The initial transmission line outages occurred on the NSP System. In March 2008, NSP-Minnesota received notice that the MRO was commencing a compliance investigation of the event. Because the event affected more than one region, the NERC took over the investigation. In January 2010, the NERC issued a preliminary non-public report alleging the NSP System violated certain NERC reliability standards. The report represents the preliminary conclusions of the NERC and is subject to additional procedures at NERC, and ultimately FERC review. In late 2010, NERC transferred responsibility for completing the compliance investigation to the MRO. The final outcome of the compliance investigation, and whether and to what extent penalties for violations may be assessed, is unknown at this time.
In February 2010, the NERC notified NSP-Minnesota that it was commencing a non-public investigation of NSP-Minnesota maintenance practices associated with insulating oil levels in bulk electric system substations, as the result of an anonymous complaint received by the NERC. NSP-Minnesota is fully cooperating with the investigation. The final outcome of the NERC compliance investigation, and whether and to what extent NERC may seek to impose penalties for violations, is unknown at this time.
NERC Advisory Regarding Impact of Transmission Field Conditions on Facility Ratings —
In October 2010, the NERC issued an advisory requiring utilities to perform an assessment of field versus assumed “as built” transmission infrastructure conditions. In December 2010, the NERC issued a revised advisory extending the period for affected entities to complete their initial assessment and corrective actions until 2013 and 2014, respectively. The advisory compliance cost for the utility subsidiaries is estimated at $25 million to $30 million. Xcel Energy will seek recovery through applicable rate-making mechanisms.
Electric Transmission Rate Regulation
—
The FERC regulates the rates charged and terms and conditions for electric transmission services. FERC policy encourages utilities to turn over the functional control of their electric transmission assets for the sale of electric transmission services to an RTO. NSP-Minnesota and NSP-Wisconsin are members of the MISO RTO. SPS is a member of the SPP RTO. Each RTO separately files regional transmission tariff rates for approval by the FERC. All members within that RTO are then subjected to those rates. In 2009, PSCo filed a tariff to participate with other utilities in WestConnect, a consortium of utilities offering regionalized non-firm transmission services. The WestConnect tariff was effective in the first quarter of 2009. The WestConnect tariff has not had a material impact on PSCo transmission usage or revenues. WestConnect may provide wholesale energy market functions in the future, but would not be an RTO.
Proposed Rulemaking on Transmission Planning and Cost Allocation
—
In June 2010, the FERC issued a NOPR regarding transmission planning and cost allocation. The NOPR would (1) require that local and regional transmission planning processes address public policy requirements established by state or federal laws or regulations; (2) improve coordination between neighboring transmission planning regions of interregional facilities; (3) eliminate any preferential right at the federal level for an incumbent transmission provider to construct new transmission facilities in its service territory, referred to as a ROFR; and (4) require cost allocation methods for transmission facilities to satisfy newly established cost allocation principles. The FERC will consider the written comments provided on the NOPR prior to adopting a final rule. The content of the final rule cannot be predicted at this time; however, limiting an incumbent utility’s preferential ROFR to build transmission in its service territory states may have a negative impact on longer-term growth opportunities for the Xcel Energy utility subsidiaries.
MISO Transmission Pricing
— Certain new higher voltage transmission facilities determined by MISO to meet RECB eligibility criteria in the MISO tariff are subject to an allocation of 20 percent of the facility costs to all loads in the 15 state MISO region.
In July 2010, MISO and certain member transmission owners, including NSP-Minnesota and NSP-Wisconsin, filed proposed changes to the MISO tariff that would provide for regional cost allocation for 100 percent of the costs associated with transmission projects identified by MISO as MVPs. In December 2010, the FERC approved the tariff revisions, with conditions, to be effective in July 2010. The MVP tariff provisions are pending final FERC action. The MISO independent board of directors must approve MVP eligibility before the costs of a specific project are eligible for regional rate recovery under the MISO Tariff.
The MISO regional cost allocation methods require other customers in MISO to contribute to cost recovery for certain new transmission facilities constructed by NSP-Minnesota and NSP-Wisconsin. MISO approved the eligibility of the CapX2020 Fargo, N.D. and La Crosse, Wis. transmission expansion projects for 20 percent regional allocation; and NSP-Minnesota anticipates the Brookings, S.D. CapX2020 project will be recommended for eligibility as an MVP, and thus 100 percent regional cost allocation, during 2011. The CapX2020 Bemidji, Minn. transmission expansion project is not eligible for regional cost allocation. However, NSP-Minnesota and NSP-Wisconsin also pay a share of the costs of projects constructed by other transmission-owning entities in the MISO region found to be eligible for regional cost allocation. The transmission revenues received by the NSP System from MISO, and the transmission charges paid to MISO, associated with projects subject to regional cost allocation are expected to be material in future periods.
Market-Based Rate Rules
—
Each of the Xcel Energy utility subsidiaries was granted market-based rate authority. Under market-based rate rules, the NSP System was reauthorized to sell wholesale power at market-based rates in June 2009. SPS was reauthorized to sell at market-based rate rules outside its service territory by the FERC in July 2010. PSCo filed a request for market-based rate reauthorization outside its service territory in June 2010. The request is pending FERC action. Presently, the Xcel Energy utility subsidiaries may not sell power at market-based rates within the PSCo and SPS balancing authorities, where they have been found to have market power under the FERC’s applicable analysis. Both PSCo and SPS have cost-based coordination tariffs that they may use to make sales in their balancing authorities.
FERC Tie Line Investigation —
In October 2007, the FERC Office of Enforcement, DOI, commenced a non-public investigation of the transmission service arrangements across the Lamar Tie Line, a transmission facility that connects PSCo and SPS. In July 2008, the DOI issued a preliminary report alleging Xcel Energy violated certain FERC policies, rules and approved tariffs, that could result in material penalties under the FERC penalty guidelines. The report does not constitute a finding by the FERC, which may accept, modify or reject any or all of the preliminary conclusions set forth in the report. Xcel Energy provided a response that disagreed with the preliminary report and demonstrated compliance with applicable standards. In December 2010, the DOI initiated settlement negotiation with Xcel Energy regarding possible resolution of the non-public investigation. The final outcome of the FERC DOI investigation and to what extent FERC may seek to impose penalties for violations is unknown at this time.
MISO vs. PJM Complaint Proceedings
— In March 2010, MISO filed two complaints against PJM at the FERC alleging that PJM violated generation redispatch requirements under the joint operating agreement between the two RTOs, and alleging that incorrect modeling of certain generators by PJM resulted in underpayments by PJM of up to $135 million to generators in MISO (including NSP-Minnesota and NSP-Wisconsin) for redispatch provided from 2002 to 2009. MISO asked the FERC to direct PJM to pay the underpaid amount, plus interest. In April 2010, PJM filed a complaint against MISO, alleging that MISO dispatched generation in the MISO region improperly under the RTO joint operating agreement, and requested that the FERC order MISO to pay PJM up to $25 million. In January 2011, MISO and PJM filed a settlement agreement with the FERC that would provide for no payments between the RTOs for prior period errors, but establishes a process to validate and periodically update the operational modeling to prevent future similar errors. The settlement is pending FERC approval.
Revenue Sufficiency Guarantee (RSG) Charges —
The MISO tariff charges certain market participants a real-time RSG charge, which is designed to ensure that any generator scheduled or dispatched by MISO will receive no less than its offer price for start-up, no-load and incremental energy.
In August 2010, the FERC issued two RSG-related orders, one in which, among other items, it affirmed its initial decision to not require refunds for MISO’s failure to include virtual supply offers in its RSG calculations. The second order rejected various provisions of MISO’s redesign proposal, which was intended to replace the current RSG methodology. In December 2010, MISO filed a revised RSG tariff reflecting the 2009 “indicative” tariff proposal and subsequent FERC orders, to be effective March 2011.
Pacific Northwest FERC Refund Proceeding —
In July 2001, the FERC ordered a preliminary hearing to determine whether there may have been unjust and unreasonable charges for spot market bilateral sales in the Pacific Northwest for December 2000 through June 2001. PSCo supplied energy to the Pacific Northwest markets during this period and has been a participant in the hearings. In September 2001, the presiding ALJ concluded that prices in the Pacific Northwest during the referenced period were the result of a number of factors, including the shortage of supply, excess demand, drought and increased natural gas prices. Under these circumstances, the ALJ concluded that the prices in the Pacific Northwest markets were not unreasonable or unjust and no refunds should be ordered. Subsequent to the ruling, the FERC has allowed the parties to request additional evidence. Parties have claimed that the total amount of transactions with PSCo subject to refund is $34 million. In June 2003, the FERC issued an order terminating the proceeding without ordering further proceedings. Certain purchasers filed appeals of the FERC’s orders in this proceeding with the U.S. Court of Appeals for the Ninth Circuit.
In an order issued in August 2007, the Court of Appeals remanded the proceeding back to the FERC. The Court of Appeals also indicated that the FERC should consider other rulings addressing overcharges in the California organized markets. The Court of Appeals denied a petition for rehearing in April 2009, and the mandate was issued. The FERC has yet to act on this order on remand; currently, certain motions concerning procedures on remand are pending before the FERC.
FERC Audit of Wholesale FCA
—
In October 2009, the FERC notified NSP-Minnesota and NSP-Wisconsin that the FERC audit division began an audit of compliance with the FERC’s accounting and reporting regulations related to the calculation of the NSP-Minnesota and NSP-Wisconsin wholesale FCA for the period commencing Jan. 1, 2008.
FERC Audit of Transmission Incentives Compliance
—
In December 2007, the FERC granted NSP-Minnesota and NSP-Wisconsin approval to recover a return on CWIP on their investments in the BRIGO, Chisago, Minn. to Apple River, Wis. and CapX2020 transmission projects. The incentives are recovered through MISO transmission rates. In December 2010, the FERC notified NSP-Minnesota and NSP-Wisconsin that the FERC audit division is beginning an audit of their compliance with the FERC’s rules and orders related to collection of wholesale transmission investment incentives commencing December 2007.
|
Year Ended Dec. 31,
|
||||||||||||
|
2010
|
2009
|
2008
|
||||||||||
|
Electric sales (Millions of KWh)
|
||||||||||||
|
Residential
|
25,143 | 24,039 | 24,448 | |||||||||
|
Commercial and industrial
|
62,817 | 61,255 | 63,511 | |||||||||
|
Public authorities and other
|
1,100 | 1,079 | 1,079 | |||||||||
|
Total retail
|
89,060 | 86,373 | 89,038 | |||||||||
|
Sales for resale
|
20,532 | 21,588 | 23,454 | |||||||||
|
Total energy sold
|
109,592 | 107,961 | 112,492 | |||||||||
|
Number of customers at end of period
|
||||||||||||
|
Residential
|
2,906,248 | 2,905,105 | 2,891,320 | |||||||||
|
Commercial and industrial
|
414,862 | 415,703 | 411,935 | |||||||||
|
Public authorities and other
|
70,413 | 71,677 | 71,403 | |||||||||
|
Total retail
|
3,391,523 | 3,392,485 | 3,374,658 | |||||||||
|
Wholesale
|
88 | 101 | 114 | |||||||||
|
Total customers
|
3,391,611 | 3,392,586 | 3,374,772 | |||||||||
|
Electric revenues (Thousands of Dollars)
|
||||||||||||
|
Residential
|
$ | 2,622,284 | $ | 2,355,138 | $ | 2,458,105 | ||||||
|
Commercial and industrial
|
4,490,070 | 4,071,707 | 4,625,581 | |||||||||
|
Public authorities and other
|
126,345 | 116,933 | 127,757 | |||||||||
|
Total retail
|
7,238,699 | 6,543,778 | 7,211,443 | |||||||||
|
Wholesale
|
960,505 | 886,417 | 1,266,256 | |||||||||
|
Other electric revenues
|
252,641 | 274,528 | 205,294 | |||||||||
|
Total electric revenues
|
$ | 8,451,845 | $ | 7,704,723 | $ | 8,682,993 | ||||||
|
KWh sales per retail customer
|
26,260 | 25,460 | 26,384 | |||||||||
|
Revenue per retail customer
|
$ | 2,134 | $ | 1,929 | $ | 2,137 | ||||||
|
Residential revenue per KWh
|
10.43 | ¢ | 9.80 | ¢ | 10.05 | ¢ | ||||||
|
Commercial and industrial revenue per KWh
|
7.15 | 6.65 | 7.28 | |||||||||
|
Wholesale revenue per KWh
|
4.68 | 4.11 | 5.40 | |||||||||
The most significant developments in the natural gas operations of the utility subsidiaries are continued volatility in natural gas market prices, safety requirements for natural gas pipelines and the continued trend of declining use per residential customer, as well as small commercial and industrial customers (C&I), as a result of improved building construction technologies, higher appliance efficiencies and conservation. From 2000 to 2010, average annual sales to the typical residential customer declined from 96 MMBtu per year to 82 MMBtu per year and to a typical small C&I customer declined from 441 MMBtu per year to 394 MMBtu per year, on a weather-normalized basis. Although wholesale price increases do not directly affect earnings because of natural gas cost-recovery mechanisms, high prices can encourage further efficiency efforts by customers.
Public Utility Regulation
Summary of Regulatory Agencies and Areas of Jurisdiction
—
Retail rates, services and other aspects of NSP-Minnesota’s operations are regulated by the MPUC and the NDPSC within their respective states. The MPUC has regulatory authority over security issuances, certain property transfers, mergers with other utilities and transactions between NSP-Minnesota and its affiliates. In addition, the MPUC reviews and approves NSP-Minnesota’s natural gas supply plans for meeting customers’ future energy needs. NSP-Minnesota is subject to the jurisdiction of the FERC with respect to certain natural gas transactions in interstate commerce. NSP-Minnesota is subject to the DOT, the Minnesota Office of Pipeline Safety, the NDPSC and the SDPUC for pipeline safety compliance.
Purchased Gas and Conservation Cost-Recovery Mechanisms
—
NSP-Minnesota’s retail natural gas rates for Minnesota and North Dakota include a PGA clause that provides for prospective monthly rate adjustments to reflect the forecasted cost of purchased natural gas. The annual difference between the natural gas cost revenues collected through PGA rates and the actual natural gas costs are collected or refunded over the subsequent 12-month period. The MPUC and NDPSC have the authority to disallow recovery of certain costs if they find the utility was not prudent in its procurement activities.
NSP-Minnesota is required by Minnesota law to spend a minimum of 0.5 percent of Minnesota natural gas revenue on conservation improvement programs in the state of Minnesota. These costs were recovered from Minnesota customers through an annual cost-recovery mechanism for natural gas conservation and energy management program expenditures. In 2010, this law changed to an energy savings-based requirement, and the costs of conservation improvement programs will continue to be recoverable in Minnesota through a rate adjustment mechanism.
Capability and Demand
Natural gas supply requirements are categorized as firm or interruptible (customers with an alternate energy supply). The maximum daily send-out (firm and interruptible) for NSP-Minnesota was 689,223 MMBtu for 2010, which occurred on Dec. 13, 2010.
NSP-Minnesota purchases natural gas from independent suppliers, generally based on market indices that reflect current prices. The natural gas is delivered under transportation agreements with interstate pipelines. These agreements provide for firm deliverable pipeline capacity of 585,598 MMBtu per day. In addition, NSP-Minnesota contracts with providers of underground natural gas storage services. These agreements provide storage for approximately 26 percent of winter natural gas requirements and 32 percent of peak day firm requirements of NSP-Minnesota.
NSP-Minnesota also owns and operates one LNG plant with a storage capacity of 2.0 Bcf equivalent and three propane-air plants with a storage capacity of 1.3 Bcf equivalent to help meet its peak requirements. These peak-shaving facilities have production capacity equivalent to 246,000 MMBtu of natural gas per day, or approximately 31 percent of peak day firm requirements. LNG and propane-air plants provide a cost-effective alternative to annual fixed pipeline transportation charges to meet the peaks caused by firm space heating demand on extremely cold winter days.
NSP-Minnesota is required to file for a change in natural gas supply contract levels to meet peak demand, to redistribute demand costs among classes, or to exchange one form of demand for another. The 2009-2010 and 2010-2011 entitlement levels are pending MPUC action.
Natural Gas Supply and Costs
NSP-Minnesota actively seeks natural gas supply, transportation and storage alternatives to yield a diversified portfolio that provides increased flexibility, decreased interruption and financial risk, and economical rates. In addition, NSP-Minnesota conducts natural gas price hedging activity that has been approved by the MPUC. This diversification involves numerous domestic and Canadian supply sources with varied contract lengths.
The following table summarizes the average delivered cost per MMBtu of natural gas purchased for resale by NSP-Minnesota’s regulated retail natural gas distribution business:
|
2010
|
$ | 5.43 | ||
|
2009
|
5.78 | |||
|
2008
|
8.41 |
The cost of natural gas supply, transportation service and storage service is recovered through the PGA cost-recovery mechanism.
NSP-Minnesota has firm natural gas transportation contracts with several pipelines, which expire in various years from 2011 through 2029.
NSP-Minnesota has certain natural gas supply, transportation and storage agreements that include obligations for the purchase and/or delivery of specified volumes of natural gas or to make payments in lieu of delivery. At Dec. 31, 2010, NSP-Minnesota was committed to approximately $524 million in such obligations under these contracts.
NSP-Minnesota purchases firm natural gas supply utilizing long-term and short-term agreements from approximately 29 domestic and Canadian suppliers. This diversity of suppliers and contract lengths allows NSP-Minnesota to maintain competition from suppliers and minimize supply costs.
See Item 7 for further discussion of natural gas costs.
Public Utility Regulation
Summary of Regulatory Agencies and Areas of Jurisdiction
—
NSP-Wisconsin is regulated by the PSCW and the MPSC. The PSCW has a biennial base-rate filing requirement. By June of each odd-numbered year, NSP-Wisconsin must submit a rate filing for the test year period beginning the following January. NSP-Wisconsin is subject to the jurisdiction of the FERC with respect to certain natural gas transactions in interstate commerce. NSP-Wisconsin is subject to the DOT, the PSCW and the MPSC for pipeline safety compliance.
Natural Gas Cost-Recovery Mechanisms
—
NSP-Wisconsin has a retail PGA cost-recovery mechanism for Wisconsin operations to recover changes in the actual cost of natural gas and transportation and storage services. The PSCW has the authority to disallow certain costs if it finds the utility was not prudent in its procurement activities.
NSP-Wisconsin’s natural gas rate schedules for Michigan customers include a natural gas cost-recovery factor, which is based on 12-month projections.
Capability and Demand
Natural gas supply requirements are categorized as firm or interruptible (customers with an alternate energy supply). The maximum daily send-out (firm and interruptible) for NSP-Wisconsin was 146,018 MMBtu for 2010, which occurred on Dec. 14, 2010.
NSP-Wisconsin purchases natural gas from independent suppliers, generally based on market indices that reflect current prices. The natural gas is delivered under transportation agreements with interstate pipelines. These agreements provide for firm deliverable pipeline capacity of approximately 134,736 MMBtu per day. In addition, NSP-Wisconsin contracts with providers of underground natural gas storage services. These storage agreements provide storage for approximately 27 percent of winter natural gas requirements and 39 percent of peak day firm requirements of NSP-Wisconsin.
NSP-Wisconsin also owns and operates one LNG plant with a storage capacity of 270,000 Mcf equivalent and one propane-air plant with a storage capacity of 2,700 Mcf equivalent to help meet its peak requirements. These peak-shaving facilities have production capacity equivalent to 18,408 MMBtu of natural gas per day, or approximately 13 percent of peak day firm requirements. LNG and propane-air plants provide a cost-effective alternative to annual fixed pipeline transportation charges to meet the peaks caused by firm space heating demand on extremely cold winter days.
NSP-Wisconsin is required to file a natural gas supply plan with the PSCW annually to change natural gas supply contract levels to meet peak demand. NSP-Wisconsin’s winter 2010-2011 supply plan was approved by the PSCW in October 2010.
Natural Gas Supply and Costs
NSP-Wisconsin actively seeks natural gas supply, transportation and storage alternatives to yield a diversified portfolio that provides increased flexibility, decreased interruption and financial risk, and economical rates. In addition, NSP-Wisconsin conducts natural gas price hedging activity that has been approved by the PSCW. This diversification involves numerous domestic and Canadian supply sources with varied contract lengths.
The following table summarizes the average delivered cost per MMBtu of natural gas purchased for resale by NSP-Wisconsin’s regulated retail natural gas distribution business:
|
2010
|
$
|
5.46
|
||
|
2009
|
5.85
|
|||
|
2008
|
8.54
|
The cost of natural gas supply, transportation service and storage service is recovered through various cost-recovery adjustment mechanisms. NSP-Wisconsin has firm natural gas transportation contracts with several pipelines, which expire in various years from 2011 through 2032.
NSP-Wisconsin has certain natural gas supply, transportation and storage agreements that include obligations for the purchase and/or delivery of specified volumes of natural gas or to make payments in lieu of delivery. At Dec. 31, 2010, NSP-Wisconsin was committed to approximately $114 million in such obligations under these contracts.
NSP-Wisconsin purchased firm natural gas supply utilizing short-term agreements from approximately 12 domestic and Canadian suppliers. This diversity of suppliers and contract lengths allows NSP-Wisconsin to maintain competition from suppliers and minimize supply costs.
See Item 7 for further discussion of natural gas costs.
Public Utility Regulation
Summary of Regulatory Agencies and Areas of Jurisdiction
—
PSCo is regulated by the CPUC with respect to its facilities, rates, accounts, services and issuance of securities. PSCo holds a FERC certificate that allows it to transport natural gas in interstate commerce without PSCo becoming subject to full FERC jurisdiction under the federal Natural Gas Act. PSCo is also subject to the jurisdiction of the FERC with respect to certain natural gas transactions in interstate commerce. PSCo is subject to the DOT and CPUC with regards to pipeline safety compliance.
Purchased Gas and Conservation Cost-Recovery Mechanisms
—
PSCo has two retail adjustment clauses that recover purchased gas and other resource costs:
|
|
●
|
GCA
— The GCA mechanism allows PSCo to recover its actual costs of purchased gas and transportation to meet the requirements of its customers. The GCA is revised quarterly to allow for changes in gas rates.
|
|
|
●
|
DSMCA
— PSCo has a low-income energy assistance program. The costs of this energy conservation and weatherization program are recovered through the gas DSMCA.
|
|
|
●
|
PDRA
— The PDRA recovers revenue lost to decreasing use per customer beyond a threshold. No revenue is currently recovered through this clause.
|
PBRP and QSP Requirements
—
The CPUC established a natural gas QSP. This regulatory plan includes a natural gas QSP that provides for bill credits to customers if PSCo does not achieve certain performance targets relating to natural gas leak repair time and customer service through 2012. PSCo regularly monitors and records as necessary an estimated customer refund obligation under the PBRP. In April of each year following the measurement period, PSCo files its proposed rate adjustment under the PBRP. The CPUC conducts proceedings to review and approve these rate adjustments annually.
Capability and Demand
PSCo projects peak day natural gas supply requirements for firm sales and backup transportation, which include transportation customers contracting for firm supply backup, to be 1,908,006 MMBtu. In addition, firm transportation customers hold 562,175 MMBtu of capacity for PSCo without supply backup. Total firm delivery obligation for PSCo is 2,470,181 MMBtu per day. The maximum daily deliveries for PSCo in 2010 for firm and interruptible services were 1,820,806 MMBtu on Jan. 7, 2010.
PSCo purchases natural gas from independent suppliers, generally based on market indices that reflect current prices. The natural gas is delivered under transportation agreements with interstate pipelines. These agreements provide for firm deliverable pipeline capacity of approximately 1,838,824 MMBtu per day, which includes 849,568 MMBtu of supplies held under third-party underground storage agreements. In addition, PSCo operates three company-owned underground storage facilities, which provide about 41,000 MMBtu of natural gas supplies on a peak day. The balance of the quantities required to meet firm peak day sales obligations are primarily purchased at PSCo’s city gate meter stations and a small amount is received directly from wellhead sources.
PSCo is required by CPUC regulations to file a natural gas purchase plan by June of each year projecting and describing the quantities of natural gas supplies, upstream services and the costs of those supplies and services for the 12-month period of the following year. PSCo is also required to file a natural gas purchase report by October of each year reporting actual quantities and costs incurred for natural gas supplies and upstream services for the previous 12-month period.
Natural Gas Supply and Costs
PSCo actively seeks natural gas supply, transportation and storage alternatives to yield a diversified portfolio that provides increased flexibility, decreased interruption and financial risk, and economical rates. In addition, PSCo conducts natural gas price hedging activities that have been approved by the CPUC. This diversification involves numerous supply sources with varied contract lengths.
The following table summarizes the average delivered cost per MMBtu of natural gas purchased for resale by PSCo’s regulated retail natural gas distribution business:
|
2010
|
$ | 5.10 | ||
|
2009
|
5.13 | |||
|
2008
|
7.04 |
PSCo has natural gas supply, transportation and storage agreements that include obligations for the purchase and/or delivery of specified volumes of natural gas or to make payments in lieu of delivery. At Dec. 31, 2010, PSCo was committed to approximately $1.1 billion in such obligations under these contracts, which expire in various years from 2011 through 2029.
PSCo purchases natural gas by optimizing a balance of long-term and short-term natural gas purchases, firm transportation and natural gas storage contracts. During 2010, PSCo purchased natural gas from approximately 41 suppliers.
SPS
Natural Gas Facilities Used for Electric Generation
SPS does not provide natural gas service at retail, but purchases and transports natural gas for certain of its generation facilities and operates natural gas pipeline facilities connecting the generation facilities to interstate natural gas pipelines. SPS is subject to the jurisdiction of the FERC with respect to certain natural gas transactions in interstate commerce; and to the jurisdiction of the DOT and the PUCT for pipeline safety compliance.
See Item 7 for further discussion of natural gas costs.
|
Year Ended Dec. 31,
|
||||||||||||
|
2010
|
2009
|
2008
|
||||||||||
|
Natural gas deliveries (Thousands of MMBtu)
|
||||||||||||
|
Residential
|
137,809 | 141,719 | 145,615 | |||||||||
|
Commercial and industrial
|
87,599 | 88,943 | 92,682 | |||||||||
|
Total retail
|
225,408 | 230,662 | 238,297 | |||||||||
|
Transportation and other
|
121,261 | 126,993 | 133,207 | |||||||||
|
Total deliveries
|
346,669 | 357,655 | 371,504 | |||||||||
|
Number of customers at end of period
|
||||||||||||
|
Residential
|
1,735,032 | 1,723,419 | 1,712,835 | |||||||||
|
Commercial and industrial
|
152,937 | 152,312 | 151,731 | |||||||||
|
Total retail
|
1,887,969 | 1,875,731 | 1,864,566 | |||||||||
|
Transportation and other
|
5,281 | 4,826 | 4,350 | |||||||||
|
Total customers
|
1,893,250 | 1,880,557 | 1,868,916 | |||||||||
|
Natural gas revenues (Thousands of Dollars)
|
||||||||||||
|
Residential
|
$ | 1,115,253 | $ | 1,159,079 | $ | 1,496,772 | ||||||
|
Commercial and industrial
|
589,449 | 631,728 | 872,224 | |||||||||
|
Total retail
|
1,704,702 | 1,790,807 | 2,368,996 | |||||||||
|
Transportation and other
|
77,880 | 74,896 | 73,992 | |||||||||
|
Total natural gas revenues
|
$ | 1,782,582 | $ | 1,865,703 | $ | 2,442,988 | ||||||
|
MMBtu sales per retail customer
|
119.39 | 122.97 | 127.80 | |||||||||
|
Revenue per retail customer
|
$ | 903 | $ | 955 | $ | 1,271 | ||||||
|
Residential revenue per MMBtu
|
8.09 | ¢ | 8.18 | ¢ | 10.28 | ¢ | ||||||
|
Commercial and industrial revenue per MMBtu
|
6.73 | 7.10 | 9.41 | |||||||||
|
Transportation and other revenue per MMBtu
|
0.64 | 0.59 | 0.56 | |||||||||
Xcel Energy’s subsidiary facilities are regulated by federal and state environmental agencies. These agencies have jurisdiction over air emissions, water quality, wastewater discharges, solid wastes and hazardous substances. Various company activities require registrations, permits, licenses, inspections and approvals from these agencies. Xcel Energy has received all necessary authorizations for the construction and continued operation of its generation, transmission and distribution systems. Xcel Energy facilities have been designed and constructed to operate in compliance with applicable environmental standards.
Xcel Energy and its subsidiaries strive to comply with all environmental regulations applicable to its operations. However, it is not possible to determine when or to what extent additional facilities or modifications of existing or planned facilities will be required as a result of changes to environmental regulations, interpretations or enforcement policies or, what effect future laws or regulations may have upon Xcel Energy’s operations. See Item 7 and Notes 14 and 15 to the consolidated financial statements for further discussion of environmental contingencies.
See Item 7 for a discussion of expected capital expenditures and funding sources.
The number of full-time Xcel Energy employees at Dec. 31, 2010 and Dec. 31, 2009, is presented in the table below. Of the full-time employees listed below, 5,627, or 50 percent, and 5,665, or 50 percent, respectively, are covered under collective bargaining agreements. At Dec. 31, 2010:
|
|
●
|
NSP-Minnesota had 2,060 and NSP-Wisconsin had 402 bargaining employees covered under a collective-bargaining agreement, which expired at the end of 2010. NSP-Minnesota also had an additional 219 nuclear operation bargaining employees covered under several collective-bargaining agreements, which expired at various dates through September 2010. As of Dec. 31, 2010, contract negotiations with the NSP-Minnesota and NSP-Wisconsin bargaining groups were in process. On Feb. 16, 2011, the negotiations were settled via arbitration and a new collective-bargaining agreement with an expiration date of Dec. 31, 2013 went into effect.
|
|
|
●
|
PSCo had 2,142 bargaining employees covered under a collective-bargaining agreement, which expires in May 2014.
|
|
|
●
|
SPS had 804 bargaining employees covered under a collective-bargaining agreement, which expires in October 2011.
|
|
2010
|
2009
|
|||||||
|
NSP-Minnesota
|
3,689 | 3,763 | ||||||
|
NSP-Wisconsin
|
559 | 561 | ||||||
|
PSCo
|
2,823 | 2,791 | ||||||
|
SPS
|
1,192 | 1,186 | ||||||
|
Xcel Energy Services Inc.
|
3,027 | 3,050 | ||||||
|
Total
|
11,290 | 11,351 | ||||||
Richard C. Kelly, 64, Chairman of the Board and Chief Executive Officer, Xcel Energy Inc., August 2009 to present. Previously, Chairman of the Board, President and Chief Executive Officer, Xcel Energy Inc., December 2005 to August 2009; President and Chief Executive Officer, Xcel Energy Inc., July 2005 to December 2005; President, Xcel Energy Inc., October 2003 to July 2005; Chief Operating Officer, Xcel Energy Inc., October 2003 to June 2005; Vice President and Chief Financial Officer, Xcel Energy Inc., August 2002 to October 2003 and President, Enterprises Business Unit, Xcel Energy Inc., August 2000 to August 2002.
Michael C. Connelly, 49, Vice President and General Counsel, Xcel Energy Inc., June 2007 to present. Previously, Vice President of Human Resources, Xcel Energy Inc., November 2005 to June 2007; Vice President and Deputy General Counsel, Xcel Energy Inc., January 2003 to November 2005 and Deputy General Counsel, Xcel Energy Inc., August 2000 to January 2003.
David L. Eves, 52, President, Director and Chief Executive Officer, PSCo, December 2009 to present. Previously, President, Director and Chief Operating Officer, PSCo, November 2009 to December 2009; President and Director, SPS, December 2006 to November 2009; Chief Executive Officer, SPS, August 2006 to November 2009; Vice President of Resource Planning and Acquisition, Xcel Energy Inc., November 2002 to July 2006 and Managing Director, Resource Planning and Acquisition, Xcel Energy Inc., August 2000 to November 2002.
Benjamin G.S. Fowke, III, 52, President and Chief Operating Officer, Xcel Energy Inc., August 2009 to present. Previously Executive Vice President and Chief Financial Officer, Xcel Energy Inc., December 2008 to August 2009; Vice President and Chief Financial Officer, Xcel Energy Inc., May 2004 to December 2008; Vice President, Chief Financial Officer and Treasurer, Xcel Energy Inc. October 2003 to May 2004; Vice President, and Treasurer Xcel Energy Inc., November 2002 to October 2003; and Vice President and Chief Financial Officer, Energy Markets Business Unit, Xcel Energy Inc., August 2000 to November 2002.
Cathy J. Hart, 61, Vice President and Corporate Secretary, Xcel Energy Inc., August 2000 to present; Vice President, Corporate Services Group, Xcel Energy Inc., November 2005 to present.
C. Riley Hill, 51, President, Director and Chief Executive Officer, SPS, November 2009 to present. Previously, Vice President and Chief Operating Officer, SPS, July 2009 to November 2009; Regional Vice President, Xcel Energy Services Inc., November 2007 to July 2009; Vice President, Construction, Operations and Maintenance, PSCo, February 2006 to November 2007 and Director Design and Construction, PSCo, March 2004 to February 2006.
Teresa S. Madden, 54, Vice President and Controller, Xcel Energy Inc., January 2004 to present. Previously, Vice President of Finance, Customer and Field Operations Business Unit, Xcel Energy Inc., August 2003 to January 2004; Interim CFO, Rogue Wave Software, Inc., February 2003 to July 2003 and Corporate Controller, Rogue Wave Software, Inc., October 2000 to February 2003.
Marvin E. McDaniel, 50, Vice President and Chief Administrative Officer, Xcel Energy Services Inc., August, 2009 to present and Vice President, Talent and Technology Business Areas, Xcel Energy Inc., August 2009 to present. Previously, Vice President, Human Resources, July 2007 to August 2009; Vice President and Assistant Controller, March 2005 to June 2007, Xcel Energy Services Inc. and Vice President and Controller Energy Markets Business Unit, Xcel Energy Services Inc., February 2004 to February 2005.
Judy M. Poferl, 50, President, Director and Chief Executive Officer, NSP-Minnesota, August 2009 to present. Previously, Regional Vice President, September 2008 to August 2009; Managing Director, Government and Regulatory Affairs, November 2007 to September 2008 and Director, Regulatory Administration, August 2000 to November 2007.
David M. Sparby, 56, Vice President and Chief Financial Officer, Xcel Energy Inc., August 2009 to present. Previously President, Director and Chief Executive Officer, NSP-Minnesota, August 2008 to August 2009; Executive Vice President and Director, Acting President and Chief Executive Officer, NSP-Minnesota, January 2007 to August 2008 and Vice President, Government and Regulatory Affairs, Xcel Energy Services Inc., September 2000 to January 2007.
Michael L. Swenson, 60, President, Director and Chief Executive Officer, NSP-Wisconsin, February 2002 to present. Previously, State Vice President for North Dakota and South Dakota, August 2000 to February 2002.
George E. Tyson II, 45, Vice President and Treasurer, Xcel Energy Inc., May 2004 to present. Previously, Managing Director and Assistant Treasurer, Xcel Energy Inc., July 2003 to May 2004; Director of Origination, Energy Markets Business Unit, Xcel Energy Inc., May 2002 to July 2003 and Associate and Vice President, Deutsche Bank Securities, December 1996 to April 2002.
No family relationships exist between any of the executive officers or directors.
Oversight of Risk and Related Processes
The goal of Xcel Energy’s risk management process is to understand, manage and, when possible, mitigate material risk. Xcel Energy management is responsible for identifying and managing risks, while the Board of Directors oversees and holds management accountable. As described more fully below, Xcel Energy is faced with a number of different types of risk. Xcel Energy confronts legislative and regulatory policy and compliance risks, including risks related to climate change and emission of CO
2
; risks for recovery of capital and operating costs; resource planning and other long-term planning risks, including resource acquisition risks; financial risks, including credit, interest rate and capital market risks; and macroeconomic risks, including risks related to economic conditions and changes in demand for Xcel Energy’s products and services. Cross-cutting risks such as these are discussed and managed across business areas and coordinated by Xcel Energy’s senior management. Our risk management process has three parts: identification and analysis, management and mitigation and communication and disclosure.
Xcel Energy management identifies and analyzes risks to determine materiality and other attributes such as timing, probability and controllability. Management broadly considers our business, the utility industry, the domestic and global economy and the environment to identify risks. Identification and analysis occurs formally through a key risk assessment process conducted by senior management, the securities disclosure process, the hazard risk management process and internal auditing and compliance with financial and operational controls. Management also identifies and analyzes risk through its business planning process and development of goals and key performance indicators, which include risk identification to determine barriers to implementing Xcel Energy’s strategy. At the same time, the business planning process identifies areas in which there is a potential for a business area to take inappropriate risk to meet goals and determines how to prevent inappropriate risk-taking.
Xcel Energy management seeks to mitigate the risks inherent in the implementation of Xcel Energy’s strategy. The process for risk mitigation includes adherence to our code of conduct and other compliance policies, operation of formal risk management structures and groups, and overall business management. At a threshold level, Xcel Energy has developed a robust compliance program and promotes a culture of compliance, which mitigates risk. Building on this culture of compliance, Xcel Energy manages and mitigates risks through operation of formal risk management structures and groups, including management councils, risk committees and the services of corporate areas such as internal audit, the corporate controller and legal services. While Xcel Energy has developed a number of formal structures for risk management, many material risks affect the business as a whole and are managed across business areas.
Xcel Energy management also communicates with the Board and key stakeholders regarding risk. Xcel Energy provides information to the Board in presentations and communications over the course of the year. Senior management presents an assessment of key risks to the Board annually. The presentation of the key risks and the discussion provides the Board with information on the risks management believes are material, including the earnings impact, timing, likelihood and controllability. Based on this presentation, the Board reviews risks at an enterprise level and confirms risk management and mitigation are included in Xcel Energy’s strategy. The guidelines on corporate governance and committee charters define the scope of review and inquiry for the Board and committees. The standing committees also oversee risk management as part of their charters. Each committee has responsibility for overseeing aspects of risk and Xcel Energy’s management and mitigation of the risk. The Board has overall responsibility for risk oversight. As described above, the Board reviews the key risk assessment process presented by senior management. This key risk assessment analyzes the most likely areas of future risk to Xcel Energy. The Board also reviews the performance and annual goals of each business area. This review, when combined with the oversight of specific risks by the committees, allows the Board to confirm risk is considered in the development of goals and that risk has been adequately considered and mitigated in the execution of corporate strategy. The presentation of the assessment of key risks also provides the basis for the discussion of risk in our public filings and securities disclosures.
Risks Associated with Our Business
Environmental Risks
We are subject to environmental laws and regulations, with which compliance could be difficult and costly.
We are subject to environmental laws and regulations that affect many aspects of our past, present and future operations, including air emissions, water quality, wastewater discharges and the generation, transport and disposal of solid wastes and hazardous substances. These laws and regulations require us to obtain and comply with a wide variety of environmental registrations, licenses, permits, inspections and other approvals. Environmental laws and regulations can also require us to restrict or limit the output of certain facilities or the use of certain fuels, to install pollution control equipment at our facilities, clean up spills and correct environmental hazards and other contamination. Both public officials and private individuals may seek to enforce the applicable environmental laws and regulations against us. We may be required to pay all or a portion of the cost to remediate (i.e. clean-up) sites where our past activities, or the activities of certain other parties, caused environmental contamination. At Dec. 31, 2010, these sites included:
|
|
●
|
Sites of former MGPs operated by our subsidiaries, predecessors, or other entities; and
|
|
|
●
|
Third party sites, such as landfills, for which we are alleged to be a potentially responsible party that sent hazardous materials and wastes.
|
We are also subject to mandates to provide customers with clean energy, renewable energy and energy conservation offerings. These mandates are designed in part to mitigate the potential environmental impacts of utility operations. Failure to meet the requirements of these mandates may result in fines or penalties, which could have a material adverse effect on our results of operations. If our regulators do not allow us to recover all or a part of the cost of capital investment or the O&M costs incurred to comply with the mandates, it could have a material adverse effect on our results of operations.
In addition, existing environmental laws or regulations may be revised, and new laws or regulations seeking to protect the environment may be adopted or become applicable to us, including but not limited to regulation of mercury, NOx, SO
2
, CO
2
, particulates and coal ash. We may also incur additional unanticipated obligations or liabilities under existing environmental laws and regulations.
We are subject to physical and financial risks associated with climate change.
There is a growing consensus that emissions of GHGs are linked to global climate change. Climate change creates physical and financial risk. Physical risks from climate change include an increase in sea level and changes in weather conditions, such as changes in precipitation and extreme weather events. We do not serve any coastal communities so the possibility of sea level rises does not directly affect us or our customers.
Our customers’ energy needs vary with weather conditions, primarily temperature and humidity. For residential customers, heating and cooling represent their largest energy use. To the extent weather conditions are affected by climate change, customers’ energy use could increase or decrease depending on the duration and magnitude of the changes.
Increased energy use due to weather changes may require us to invest in more generating assets, transmission and other infrastructure to serve increased load. Decreased energy use due to weather changes may affect our financial condition, through decreased revenues. Extreme weather conditions in general require more system backup, adding to costs, and can contribute to increased system stresses, including service interruptions. Weather conditions outside of our service territory could also have an impact on our revenues. We buy and sell electricity depending upon system needs and market opportunities. Extreme weather conditions creating high energy demand on our own and/or other systems may raise electricity prices as we buy short-term energy to serve our own system, which would increase the cost of energy we provide to our customers.
Severe weather impacts our service territories, primarily when thunderstorms, tornadoes and snow or ice storms occur. To the extent the frequency of extreme weather events increases, this could increase our cost of providing service. Changes in precipitation resulting in droughts or water shortages could adversely affect our operations, principally our fossil generating units. A negative impact to water supplies due to long-term drought conditions could adversely impact our ability to provide electricity to customers, as well as increase the price they pay for energy. We may not recover all costs related to mitigating these physical and financial risks.
To the extent climate change impacts a region’s economic health, it may also impact our revenues. Our financial performance is tied to the health of the regional economies we serve. The price of energy, as a factor in a region’s cost of living as well as an important input into the cost of goods and services, has an impact on the economic health of our communities. The cost of additional regulatory requirements, such as a tax on GHGs or additional environmental regulation could impact the availability of goods and prices charged by our suppliers which would normally be borne by consumers through higher prices for energy and purchased goods. To the extent financial markets view climate change and emissions of GHGs as a financial risk, this could negatively affect our ability to access capital markets or cause us to receive less than ideal terms and conditions.
Financial Risks
Our profitability depends in part on the ability of our utility subsidiaries to recover their costs from their customers and there may be changes in circumstances or in the regulatory environment that impair the ability of our utility subsidiaries to recover costs from their customers.
We are subject to comprehensive regulation by federal and state utility regulatory agencies. The utility commissions in the states where we operate our utility subsidiaries regulate many aspects of our utility operations, including siting and construction of facilities, customer service and the rates that we can charge customers. The FERC has jurisdiction, among other things, over wholesale rates for electric transmission service, the sale of electric energy in interstate commerce and certain natural gas transactions in interstate commerce.
The profitability of our utility operations is dependent on our ability to recover the costs of providing energy and utility services to our customers and earn a return on our capital investment in our utility operations. Our utility subsidiaries currently provide service at rates approved by one or more regulatory commissions. These rates are generally regulated based on an analysis of the utility’s costs incurred in a test year. Our utility subsidiaries are subject to both future and historical test years depending upon the regulatory mechanisms approved in each jurisdiction. Thus, the rates a utility is allowed to charge may or may not match its costs at any given time. While rate regulation is premised on providing a reasonable opportunity to earn a reasonable rate of return on invested capital, there can be no assurance that the applicable regulatory commission will judge all the costs of our utility subsidiaries to have been prudently incurred or that the regulatory process in which rates are determined will always result in rates that will produce full recovery of such costs. Rising fuel costs could increase the risk that our utility subsidiaries will not be able to fully recover their fuel costs from their customers. Furthermore, there could be changes in the regulatory environment that would impair the ability of our utility subsidiaries to recover costs historically collected from their customers.
Management currently believes these prudently incurred costs are recoverable given the existing regulatory mechanisms in place. However, changes in regulations or the imposition of additional regulations, including additional environmental regulation or regulation related to climate change, could have an adverse impact on our results of operations and hence could materially and adversely affect our ability to meet our financial obligations, including debt payments and the payment of dividends on our common stock.
Any reductions in our credit ratings could increase our financing costs and the cost of maintaining certain contractual relationships.
We cannot be assured that any of our current ratings or our subsidiaries’ ratings will remain in effect for any given period of time or that a rating will not be lowered or withdrawn entirely by a rating agency. In addition, our credit ratings may change as a result of the differing methodologies or change in the methodologies used by the various rating agencies. For example, Standard & Poor’s calculates an imputed debt associated with capacity payments from purchase power contracts. An increase in the overall level of capacity payments would increase the amount of imputed debt, based on Standard & Poor’s methodology. Therefore, Xcel Energy and its subsidiaries credit ratings could be adversely affected based on the level of capacity payments associated with purchase power contracts or changes in how imputed debt is determined. Any downgrade could lead to higher borrowing costs. Also, our utility subsidiaries may enter into certain procurement and derivative contracts that require the posting of collateral or settlement of applicable contracts if credit ratings fall below investment grade.
We are subject to capital market and interest rate risks.
Utility operations require significant capital investment in property, plant and equipment; consequently, we are an active participant in debt and equity markets. Any disruption in capital markets could have a material impact on our ability to fund our operations. Capital markets are global in nature and are impacted by numerous issues and events throughout the world economy, such as the recent concerns regarding European sovereign debt. Capital market disruption events, and resulting broad financial market distress, such as the events surrounding the collapse in the U.S. sub-prime mortgage market, could prevent us from issuing new securities or cause us to issue securities with less than ideal terms and conditions, such as higher interest rates.
Higher interest rates on short-term borrowings with variable interest rates or on incremental commercial paper issuances could also have an adverse effect on our operating results. Changes in interest rates may also impact the fair value of the debt securities in the nuclear decommissioning fund and master pension trust, as well as our ability to earn a return on short-term investments of excess cash.
We are subject to credit risks.
Credit risk includes the risk that our retail customers will not pay their bills, which may lead to a reduction in liquidity and an eventual increase in bad debt expense. Retail credit risk is comprised of numerous factors including the price of products and services provided, the overall economy and local economies in the geographic areas we serve, including local unemployment rates.
Credit risk also includes the risk that various counterparties that owe us money or product will breach their obligations. Should the counterparties to these arrangements fail to perform, we may be forced to enter into alternative arrangements. In that event, our financial results could be adversely affected and we could incur losses.
One alternative available to address counterparty credit risk is to transact on liquid commodity exchanges. The credit risk is then socialized through the exchange central clearinghouse function. While exchanges do remove counterparty credit risk, all participants are subject to margin requirements, which create an additional need for liquidity to post margin as exchange positions change value daily. The recently enacted Dodd-Frank Wall Street Reform Act may require broad clearing of financial swap transactions through a central counterparty, which may lead to additional margin requirements that could impact our liquidity. Also, in October 2010, the FERC finalized its rulemaking addressing the credit policies of organized electric markets, such as MISO and SPP, which may lead to additional margin requirements that could impact our liquidity.
We may at times have direct credit exposure in our short-term wholesale and commodity trading activity to various financial institutions trading for their own accounts or issuing collateral support on behalf of other counterparties. We may also have some indirect credit exposure due to participation in organized markets, such as PJM and MISO, in which any credit losses are socialized to all market participants.
We do have additional indirect credit exposures to various financial institutions in the form of letters of credit provided as security by power suppliers under various long-term physical purchased power contracts. If any of the credit ratings of the letter of credit issuers were to drop below the designated investment grade rating stipulated in the underlying long-term purchased power contracts, the supplier would need to replace that security with an acceptable substitute. If the security were not replaced, the party would be in technical default under the contract, which would enable us to exercise our contractual rights.
Increasing costs associated with our defined benefit retirement plans and other employee benefits may adversely affect our results of operations, financial position or liquidity.
We have defined benefit pension and postretirement plans that cover substantially all of our employees. Assumptions related to future costs, return on investments, interest rates and other actuarial assumptions have a significant impact on our funding requirements related to these plans. These estimates and assumptions may change based on economic conditions, actual stock market performance, changes in interest rates and changes in governmental regulations. In addition, the Pension Protection Act of 2006 changed the minimum funding requirements for defined benefit pension plans beginning in 2008. Therefore, our funding requirements and related contributions may change in the future. Also, the payout of a significant percentage of pension plan liabilities in a single year due to high retirements or employees leaving the company would trigger settlement accounting and could require the company to recognize material incremental pension expense related to unrecognized plan losses in the year these liabilities are paid.
Increasing costs associated with health care plans may adversely affect our results of operations.
Our self-insured costs of health care benefits for eligible employees and costs for retiree health care plans have increased substantially in recent years. Increasing levels of large individual health care claims and overall health care claims could have an adverse impact on our operating results, financial position, and liquidity. We believe that our employee benefit costs, including costs related to health care plans for our employees and former employees, will continue to rise. Legislation related to health care could also significantly change our benefit programs and costs.
We must rely on cash from our subsidiaries to make dividend payments.
We are a holding company and our investments in our subsidiaries are our primary assets. Substantially all of our operations are conducted by our subsidiaries. Consequently, our operating cash flow and our ability to service our indebtedness and pay dividends depends upon the operating cash flow of our subsidiaries and the payment of funds by them to us in the form of dividends. Our subsidiaries are separate legal entities that have no obligation to pay any amounts due pursuant to our obligations or to make any funds available for that purpose or for dividends on our common stock, whether by dividends or otherwise. In addition, each subsidiary’s ability to pay dividends to us depends on any statutory and/or contractual restrictions that may be applicable to such subsidiary, which may include requirements to maintain minimum levels of equity ratios, working capital or assets. Also, our utility subsidiaries are regulated by various state utility commissions, which generally possess broad powers to ensure that the needs of the utility customers are being met.
If our utility subsidiaries were to cease making dividend payments, our ability to pay dividends on our common stock and preferred stock or otherwise meet our financial obligations could be adversely affected.
Operational Risks
We are subject to commodity risks and other risks associated with energy markets and energy production.
We engage in wholesale sales and purchases of electric capacity, energy and energy-related products and are subject to market supply and commodity price risk. Commodity price changes can affect the value of our commodity trading derivatives. We mark certain derivatives to estimated fair market value on a daily basis (mark-to-market accounting), which may cause earnings volatility. Actual settlements can vary significantly from these estimates, and significant changes from the assumptions underlying our fair value estimates could cause significant earnings variability.
If we encounter market supply shortages or our suppliers are otherwise unable to meet their contractual obligations, we may be unable to fulfill our contractual obligations to our retail, wholesale and other customers at previously authorized or anticipated costs. Any such disruption, if significant, could cause us to seek alternative supply services at potentially higher costs or suffer increased liability for unfulfilled contractual obligations. Any significantly higher energy or fuel costs relative to corresponding sales commitments would have a negative impact on our cash flows and could potentially result in economic losses. Potential market supply shortages may not be fully resolved through alternative supply sources and such interruptions may cause short-term disruptions in our ability to provide electric and/or natural gas services to our customers. The impact of these cost and reliability issues vary in magnitude for each operating subsidiary depending upon unique operating conditions such as generation fuels mix, availability of water for cooling, availability of fuel transportation, electric generation capacity, transmission, etc.
Our subsidiary, NSP-Minnesota, is subject to the risks of nuclear generation.
NSP-Minnesota’s two nuclear stations, Prairie Island and Monticello, subject it to the risks of nuclear generation, which include:
|
|
●
|
The risks associated with storage, handling and disposal of radioactive materials and the current lack of a long-term disposal solution for radioactive materials;
|
|
|
●
|
Limitations on the amounts and types of insurance commercially available to cover losses that might arise in connection with nuclear operations; and
|
|
|
●
|
Uncertainties with respect to the technological and financial aspects of decommissioning nuclear plants at the end of licensed lives.
|
The NRC has authority to impose licensing and safety-related requirements for the operation of nuclear generation facilities. In the event of non-compliance, the NRC has the authority to impose fines or shut down a unit, or both, depending upon its assessment of the severity of the situation, until compliance is achieved. Revised NRC safety requirements could necessitate substantial capital expenditures at NSP-Minnesota’s nuclear plants. In addition, the Institute for Nuclear Power Operations reviews our nuclear operations and nuclear generation facilities. Compliance with the Institute for Nuclear Power Operations’ recommendations could result in substantial capital expenditures or a substantial increase in operating expenses.
If an incident did occur, it could have a material adverse effect on our results of operations or financial condition. Furthermore, the non-compliance of other nuclear facilities operators with applicable regulations or the occurrence of a serious nuclear incident at other facilities could result in increased regulation of the industry as a whole, which could then increase NSP-Minnesota’s compliance costs and impact the results of operations of its facilities.
NSP-Wisconsin’s production and transmission system is operated on an integrated basis with NSP-Minnesota’s production and transmission system, and NSP-Wisconsin may be subject to risks associated with NSP-Minnesota’s nuclear generation.
Our utility operations are subject to long-term planning risks.
On a periodic basis, or as needed, our utility operations file long-term resource plans with our regulators. These plans are based on numerous assumptions over the relevant planning horizon such as: sales growth, economic activity, costs, regulatory mechanisms, impact of technology on sales and production, customer response and continuation of the existing utility business model. Given the uncertainty in these planning assumptions, there is a risk that the magnitude and timing of resource additions and demand may not coincide. This could lead to under recovery of costs or insufficient resources to meet customer demand.
Our natural gas transmission and distribution operations involve numerous risks that may result in accidents and other operating risks and costs.
There are inherent in our natural gas transmission and distribution activities a variety of hazards and operating risks, such as leaks, explosions and mechanical problems, which could cause substantial financial losses. In addition, these risks could result in loss of human life, significant damage to property, environmental pollution, impairment of our operations and substantial losses to us. In accordance with customary industry practice, we maintain insurance against some, but not all, of these risks and losses.
The occurrence of any of these events not fully covered by insurance could have a material adverse effect on our financial position and results of operations. For our natural gas transmission or distribution lines located near populated areas, including residential areas, commercial business centers, industrial sites and other public gathering areas, the level of potential damages resulting from these risks is greater.
Public Policy Risks
We may be subject to legislative and regulatory responses to climate change and emissions, with which compliance could be difficult and costly.
Increased public awareness and concern regarding climate change may result in more regional and/or federal requirements to reduce or mitigate the effects of GHGs. Numerous states have announced or adopted programs to stabilize and reduce GHGs, and federal legislation has been introduced in both houses of Congress. Internationally, other nations have already agreed to regulate emissions of GHGs pursuant to the United Nations Framework Convention on Climate Change, also known as the “Kyoto Protocol,” by 2012. In addition, in 2009, the United States submitted a non-binding GHG emission reduction target of 17 percent compared to 2005 levels pursuant to the Copenhagen Accord. Such legislative and regulatory responses related to climate change and new interpretations of existing laws through climate change litigation create financial risk as our electric generating facilities are likely to be subject to regulation under climate change laws introduced at either the state or federal level within the next few years.
The EPA has taken steps to regulate GHGs under the CAA. In December 2009, the EPA issued a finding that GHG emissions endanger public health and welfare, and that motor vehicle emissions contribute to the GHGs in the atmosphere. This endangerment finding created a mandatory duty for the EPA to regulate GHGs from light duty motor vehicles. In January 2011, new EPA permitting requirements became effective for GHG emissions of new and modified large stationary sources, which are applicable to construction of new power plants or power plant modifications that increase emissions above a certain threshold. The EPA has also announced that it will propose GHG regulations applicable to emissions from existing power plants in July 2011, with final standards to be issued in 2012.
We are also currently a party to climate change lawsuits and may be subject to additional climate change lawsuits, including lawsuits similar to those described in Note 14 to the consolidated financial statements. While we believe such lawsuits are without merit, an adverse outcome in any of these cases could require substantial capital expenditures that cannot be determined at this time and could possibly require payment of substantial penalties or damages. Defense costs associated with such litigation can also be significant. Such payments or expenditures could affect results of operations, cash flows, and financial condition if such costs are not recovered through regulated rates.
Many of the federal and state climate change legislative proposals use a cap and trade policy structure, in which GHG emissions from a broad cross-section of the economy would be subject to an overall cap. Under the proposals, the cap becomes more stringent with the passage of time. The proposals establish mechanisms for GHG sources, such as power plants, to obtain “allowances” or permits to emit GHGs during the course of a year. The sources may use the allowances to cover their own emissions or sell them to other sources that do not hold enough emission allowances for their own operations. Proponents of the cap and trade policy believe it will result in the most cost effective, flexible emission reductions. There are many uncertainties, however, regarding when and in what form climate change legislation or regulation will be enacted. The impact of legislation and regulations, including a cap and trade structure, on us and our customers will depend on a number of factors, including whether GHG sources in multiple sectors of the economy are regulated, the overall GHG emissions cap level, the degree to which GHG offsets are allowed, the allocation of emission allowances to specific sources and the indirect impact of carbon regulation on natural gas and coal prices. While we do not have operations outside of the United States, any international treaties or accords could have an impact to the extent they lead to future federal or state regulations. Another important factor is our ability to recover the costs incurred to comply with any regulatory requirements that are ultimately imposed. We may not be able to timely recover all costs related to complying with regulatory requirements imposed on us. If our regulators do not allow us to recover all or a part of the cost of capital investment or the O&M costs incurred to comply with the mandates, it could have a material adverse effect on our results of operations.
We are also subject to a significant number of proposed and potential rules that will impact our coal-fired and other generation facilities. These include, but are not limited to, rules associated with mercury, regional haze, ozone, ash management and cooling water intake systems. The costs of investment to comply with these rules could be substantial. We may not be able to timely recover all costs related to complying with regulatory requirements imposed on us.
Increased risks of regulatory penalties could negatively impact our business.
The Energy Act increased the FERC’s civil penalty authority for violation of FERC statutes, rules and orders. The FERC can now impose penalties of $1 million per violation per day. In addition, more than 120 electric reliability standards that were historically subject to voluntary compliance are now mandatory and subject to potential financial penalties by NERC or FERC for violations. If a serious reliability incident did occur, it could have a material adverse effect on our operations or financial results.
Macroeconomic Risks
Economic conditions could negatively impact our business.
Our operations are affected by local, national and worldwide economic conditions. The consequences of a prolonged economic recession and uncertainty of recovery may result in a sustained lower level of economic activity and uncertainty with respect to energy prices and the capital and commodity markets. A sustained lower level of economic activity may also result in a decline in energy consumption, which may adversely affect our revenues and future growth. Instability in the financial markets, as a result of recession or otherwise, also may affect the cost of capital and our ability to raise capital, which are discussed in greater detail in the capital market risk section above.
Current economic conditions may be exacerbated by insufficient financial sector liquidity leading to potential increased unemployment, which may impact customers’ ability to pay timely, increase customer bankruptcies, and may lead to increased bad debt.
Further, worldwide economic activity has an impact on the demand for basic commodities needed for utility infrastructure, such as steel, copper, aluminum, etc., which may impact our ability to acquire sufficient supplies. Additionally, the cost of those commodities may be higher than expected.
Our operations could be impacted by war, acts of terrorism, threats of terrorism or disruptions in normal operating conditions due to localized or regional events.
Our generation plants, fuel storage facilities, transmission and distribution facilities and information systems may be targets of terrorist activities that could disrupt our ability to produce or distribute some portion of our energy products. Any such disruption could result in a significant decrease in revenues and significant additional costs to repair and insure our assets, which could have a material adverse impact on our financial condition and results of operations. The potential for terrorism has subjected our operations to increased risks and could have a material adverse effect on our business. While we have already incurred increased costs for security and capital expenditures in response to these risks, we may experience additional capital and operating costs to implement security for our plants, including our nuclear power plants under the NRC’s design basis threat requirements, such as additional physical plant security and additional security personnel. We have also already incurred increased costs for compliance with NERC reliability standards associated with critical infrastructure protection, and may experience additional capital and operating costs to comply with the NERC critical infrastructure protection standards as they are implemented and clarified.
The insurance industry has also been affected by these events and the availability of insurance covering risks we and our competitors typically insure against may decrease. In addition, the insurance we are able to obtain may have higher deductibles, higher premiums and more restrictive policy terms. For example, wildfire events, particularly in the geographic areas we serve, may cause insurance for wildfire losses to become difficult or expensive to obtain.
A security breach of our information systems could impact the reliability of the our generation, transmission and distribution systems and also subject us to financial harm associated with theft or inappropriate release of certain types of information, including, but not limited to system operating information and information regarding our customers and employees. We are unable to quantify the potential impact of such an event, however, such an event could result in significant costs and penalties, as well as legal costs.
A disruption of the regional electric transmission grid, interstate natural gas pipeline infrastructure or other fuel sources, could negatively impact our business. Because our generation, transmission systems and local natural gas distribution companies are part of an interconnected system, we face the risk of possible loss of business due to a disruption caused by the actions of a neighboring utility or an event (severe storm, severe temperature extremes, generator or transmission facility outage, pipeline rupture, railroad disruption, sudden and significant increase or decrease in wind generation, or any disruption of work force such as may be caused by flu epidemic) within our operating systems or on a neighboring system. Any such disruption could result in a significant decrease in revenues and significant additional costs to repair assets, which could have a material adverse impact on our financial condition and results.
The degree to which we are able to maintain day-to-day operations in response to unforeseen events, potentially through the execution of our business continuity plans, will in part determine the financial impact of certain events on our financial condition and results. It’s difficult to predict the magnitude of such events and associated impacts.
Rising energy prices could negatively impact our business.
Higher fuel costs could significantly impact our results of operations if requests for recovery are unsuccessful. In addition, higher fuel costs could reduce customer demand and/or increase bad debt expense, which could also have a material impact on our results of operations. Delays in the timing of the collection of fuel cost recoveries as compared with expenditures for fuel purchases could have an impact on our cash flows. We are unable to predict future prices or the ultimate impact of such prices on our results of operations or cash flows.
Our operating results may fluctuate on a seasonal and quarterly basis and can be adversely affected by milder weather.
Our electric and natural gas utility businesses are seasonal, and weather patterns can have a material impact on our operating performance. Demand for electricity is often greater in the summer and winter months associated with cooling and heating. Because natural gas is heavily used for residential and commercial heating, the demand for this product depends heavily upon weather patterns throughout our service territory, and a significant amount of natural gas revenues are recognized in the first and fourth quarters related to the heating season. Accordingly, our operations have historically generated less revenues and income when weather conditions are milder in the winter and cooler in the summer. Unusually mild winters and summers could have an adverse effect on our financial condition and results of operations.
None.
Virtually all of the utility plant of NSP-Minnesota and NSP-Wisconsin is subject to the lien of their first mortgage bond indentures. Virtually all of the electric utility plant of PSCo is subject to the lien of its first mortgage bond indenture.
Electric Utility Generating Stations:
|
NSP-Minnesota
|
Summer 2010
|
|||||||||
|
Net Dependable
|
||||||||||
|
Station, Location and Unit
|
Fuel
|
Installed
|
Capability (MW)
|
|||||||
|
Steam:
|
||||||||||
|
A.S. King-Bayport, Minn.
|
Coal
|
1968
|
511 | |||||||
|
Sherco-Becker, Minn.
|
||||||||||
|
Unit 1
|
Coal
|
1976
|
680 | |||||||
|
Unit 2
|
Coal
|
1977
|
682 | |||||||
|
Unit 3
|
Coal
|
1987
|
507 |
(a)
|
||||||
|
Monticello-Monticello, Minn.
|
Nuclear
|
1971
|
554 | |||||||
|
Prairie Island-Welch, Minn.
|
||||||||||
|
Unit 1
|
Nuclear
|
1973
|
521 | |||||||
|
Unit 2
|
Nuclear
|
1974
|
519 | |||||||
|
Black Dog-Burnsville, Minn., 2 Units
|
Coal/Natural Gas
|
1955-1960 | 241 | |||||||
|
Various locations, 4 Units
|
Wood/RDF
|
Various
|
36 |
(c)
|
||||||
|
Combustion Turbine:
|
||||||||||
|
Angus Anson-Sioux Falls, S.D., 3 Units
|
Natural Gas
|
1994-2005 | 338 | |||||||
|
Black Dog-Burnsville, Minn., 2 Units
|
Natural Gas
|
1987-2002 | 243 | |||||||
|
Blue Lake-Shakopee, Minn., 6 Units
|
Natural Gas
|
1974-2005 | 467 | |||||||
|
High Bridge-St. Paul, Minn., 3 Units
|
Natural Gas
|
2008 | 488 | |||||||
|
Inver Hills-Inver Grove Heights, Minn., 6 Units
|
Natural Gas
|
1972 | 282 | |||||||
|
Riverside-Minneapolis, Minn., 3 Units
|
Natural Gas
|
2009 | 473 | |||||||
|
Various locations, 18 Units
|
Natural Gas
|
Various
|
107 | |||||||
|
Wind:
|
||||||||||
|
Grand Meadow-Mower County, Minn.
|
Wind
|
2008 | 101 |
(b)
|
||||||
|
Nobles-Nobles County, Minn.
|
Wind
|
2010 | 201 |
(b)
|
||||||
|
Total
|
6,951 | |||||||||
| (a) | Based on NSP-Minnesota’s ownership of 59 percent. |
| (b) | This capacity is only available when wind conditions are sufficiently high enough to support the noted generation values above. Therefore, the on-demand net dependable capacity is zero. |
| (c) | RDF is refuse-derived fuel, made from municipal solid waste. |
|
NSP-Wisconsin
|
Summer 2010
|
|||||||||
|
Net Dependable
|
||||||||||
|
Station, Location and Unit
|
Fuel
|
Installed
|
Capability (MW)
|
|||||||
|
Steam:
|
||||||||||
|
Bay Front-Ashland, Wis., 3 Units
|
Coal/Wood/Natural Gas
|
1948-1956 | 56 | |||||||
|
French Island-La Crosse, Wis., 2 Units
|
Wood/RDF
|
1940-1948 | 17 |
(a)
|
||||||
|
Combustion Turbine:
|
||||||||||
|
Flambeau Station-Park Falls, Wis.
|
Natural Gas
|
1969 | 14 | |||||||
|
French Island-La Crosse, Wis., 2 Units
|
Natural Gas
|
1974 | 122 | |||||||
|
Wheaton-Eau Claire, Wis., 6 Units
|
Natural Gas
|
1973 | 300 | |||||||
|
Hydro:
|
||||||||||
|
Various locations, 63 Units
|
Hydro
|
Various
|
75 | |||||||
|
Total
|
584 | |||||||||
| (a) | RDF is refuse-derived fuel, made from municipal solid waste. |
|
PSCo
|
Summer 2010
|
|||||||||
|
Net Dependable
|
||||||||||
|
Station, Location and Unit
|
Fuel
|
Installed
|
Capability (MW)
|
|||||||
|
Steam:
|
||||||||||
|
Arapahoe-Denver, Colo., 2 Units
|
Coal
|
1951-1955 | 153 | |||||||
|
Cherokee-Denver, Colo., 4 Units
|
Coal
|
1957-1968 | 717 | |||||||
|
Comanche-Pueblo, Colo., 3 Units
|
Coal
|
1973-2010 | 1,171 |
(a)
|
||||||
|
Craig-Craig, Colo., 2 Units
|
Coal
|
1979-1980 | 83 |
(b)
|
||||||
|
Hayden-Hayden, Colo., 2 Units
|
Coal
|
1965-1976 | 237 |
(c)
|
||||||
|
Pawnee-Brush, Colo.
|
Coal
|
1981 | 505 | |||||||
|
Valmont-Boulder, Colo.
|
Coal
|
1964 | 184 | |||||||
|
Zuni-Denver, Colo., 2 Units
|
Coal
|
1948-1954 | 65 | |||||||
|
Combustion Turbine:
|
||||||||||
|
Blue Spruce-Aurora, Colo., 2 Units
|
Natural Gas
|
2003 | 278 |
(e)
|
||||||
|
Fort St. Vrain-Platteville, Colo., 6 Units
|
Natural Gas
|
1972-2009 | 969 | |||||||
|
Rocky Mountain-Keenesburg, Colo., 3 Units
|
Natural Gas
|
2004 | 601 |
(e)
|
||||||
|
Various locations, 6 Units
|
Natural Gas
|
Various
|
174 | |||||||
|
Hydro:
|
||||||||||
|
Cabin Creek-Georgetown, Colo.
|
||||||||||
|
Pumped Storage, 2 Units
|
Hydro
|
1967 | 210 | |||||||
|
Various locations, 9 Units
|
Hydro
|
Various
|
26 | |||||||
|
Wind:
|
||||||||||
|
Ponnequin-Weld County, Colo.
|
Wind
|
1999-2001 | 25 |
(d)
|
||||||
|
Diesel:
|
||||||||||
|
Cherokee-Denver, Colo., 2 Units
|
Diesel
|
1967 | 6 | |||||||
|
Total
|
5,404 | |||||||||
| (a) | Construction of Comanche Unit 3, a 750 MW coal-fired unit, was completed in 2010. PSCo owns two-thirds of the completed unit. |
|
(b)
|
Based on PSCo’s ownership interest of 10 percent.
|
|
(c)
|
Based on PSCo’s ownership interest of 76 percent of Unit 1 and 37 percent of Unit 2.
|
|
(d)
|
Amount represents nameplate rating capacity.
|
|
(e)
|
PSCo completed its acquisition of Blue Spruce Energy Center and Rocky Mountain Energy Center in December 2010. See Note 19 to the consolidated financial statements for further discussion.
|
|
SPS
|
Summer 2010
|
|||||||||
|
Net Dependable
|
||||||||||
|
Station, Location and Unit
|
Fuel
|
Installed
|
Capability (MW)
|
|||||||
|
Steam:
|
||||||||||
|
Harrington-Amarillo, Texas, 3 Units
|
Coal
|
1976-1980 | 1,018 | |||||||
|
Tolk-Muleshoe, Texas, 2 Units
|
Coal
|
1982-1985 | 1,065 | |||||||
|
Cunningham-Hobbs, N.M., 2 Units
|
Natural Gas
|
1957-1965 | 257 | |||||||
|
Jones-Lubbock, Texas, 2 Units
|
Natural Gas
|
1971-1974 | 486 | |||||||
|
Maddox-Hobbs, N.M.
|
Natural Gas
|
1967 | 118 | |||||||
|
Moore County-Amarillo, Texas
|
Natural Gas
|
1954 | 46 | |||||||
|
Nichols-Amarillo, Texas, 3 Units
|
Natural Gas
|
1960-1968 | 457 | |||||||
|
Plant X-Earth, Texas, 4 Units
|
Natural Gas
|
1952-1964 | 412 | |||||||
|
Combustion Turbine:
|
||||||||||
|
Carlsbad-Carlsbad, N.M.
|
Natural Gas
|
1968 | 10 | |||||||
|
Cunningham-Hobbs, N.M., 2 Units
|
Natural Gas
|
1998 | 223 | |||||||
|
Maddox-Hobbs, N.M.
|
Natural Gas
|
1963-1976 | 58 | |||||||
|
Riverview-Electric City, Texas
|
Natural Gas
|
1973 | 22 | |||||||
|
Diesel:
|
||||||||||
|
Tucumcari-Tucumcari, N.M., 2 Units
|
Diesel
|
1976-1979 | — |
(a)
|
||||||
|
Total
|
4,172 | |||||||||
(a)
This capacity is only available in emergency situations. Therefore, the on-demand net dependable capacity is zero.
Electric utility overhead and underground transmission and distribution lines (measured in conductor miles) at Dec. 31, 2010:
|
Conductor Miles
|
NSP-Minnesota
|
NSP-Wisconsin
|
PSCo
|
SPS
|
||||||||||||
|
500 KV
|
2,917 | — | — | — | ||||||||||||
|
345 KV
|
6,387 | 1,152 | 1,614 | 6,806 | ||||||||||||
|
230 KV
|
1,801 | — | 11,519 | 9,509 | ||||||||||||
|
161 KV
|
385 | 1,536 | — | — | ||||||||||||
|
138 KV
|
— | — | 92 | — | ||||||||||||
|
115 KV
|
7,362 | 1,736 | 4,882 | 11,365 | ||||||||||||
|
Less than 115 KV
|
82,692 | 31,809 | 72,946 | 21,130 | ||||||||||||
Electric utility transmission and distribution substations at Dec. 31, 2010:
|
NSP-Minnesota
|
NSP-Wisconsin
|
PSCo
|
SPS
|
|||||||||||||
|
Quantity
|
369 | 204 | 222 | 421 | ||||||||||||
Natural gas utility mains at Dec. 31, 2010:
|
Miles
|
NSP-Minnesota
|
NSP-Wisconsin
|
PSCo
|
WGI
|
||||||||||||
|
Transmission
|
135 | — | 2,301 | 12 | ||||||||||||
|
Distribution
|
9,586 | 2,209 | 21,302 | — | ||||||||||||
In the normal course of business, various lawsuits and claims have arisen against Xcel Energy. After consultation with legal counsel, Xcel Energy has recorded an estimate of the probable cost of settlement or other disposition for such matters.
Legal Contingencies
Nuclear Waste Disposal Litigation —
In 1998, NSP-Minnesota filed a complaint in the U.S. Court of Federal Claims against the United States requesting breach of contract damages for the DOE failure to begin accepting spent nuclear fuel by Jan. 31, 1998, as required by the contract between the DOE and NSP-Minnesota. At trial, NSP-Minnesota claimed damages in excess of $100 million through Dec. 31, 2004. In September 2007, the court awarded NSP-Minnesota $116.5 million in damages. In February 2008, the DOE filed an appeal to the U.S. Court of Appeals for the Federal Circuit, and NSP-Minnesota cross-appealed on the cost of capital issue. It is uncertain when the Court will issue a decision. Results of the judgment will not be recorded in earnings until the appeal, regulatory treatment and amounts to be shared with ratepayers have been resolved. Given the uncertainties, it is unclear as to how much, if any, of this judgment will ultimately have an effect on Xcel Energy’s consolidated results of operations, cash flows or financial position.
In August 2007, NSP-Minnesota filed a second complaint against the DOE in the U.S. Court of Federal Claims (NSP II), again claiming breach of contract damages for the DOE’s continuing failure to abide by the terms of the contract. This lawsuit will claim damages for the period Jan. 1, 2005 through Dec. 31, 2008, which includes costs associated with the storage of spent nuclear fuel at Prairie Island and Monticello, as well as the costs of complying with state regulation relating to the storage of spent nuclear fuel. Per the court’s scheduling order, NSP-Minnesota believes that it has suffered damages in excess of $250 million. The DOE claims NSP-Minnesota is entitled to at most approximately $55 million. Trial is expected to take place in 2011.
Additional Information
See Note 14 to the consolidated financial statements for further discussion of legal claims and environmental proceedings. See Item 1, Item 7 and Note 13 to the consolidated financial statements for a discussion of proceedings involving utility rates and other regulatory matters.
Quarterly Stock Data
Xcel Energy’s common stock is listed on the New York Stock Exchange (NYSE). The trading symbol is XEL. The following are the reported high and low sales prices based on the NYSE Composite Transactions for the quarters of 2010 and 2009 and the dividends declared per share during those quarters.
|
2010
|
High | Low | Dividends | |||||||||
|
First quarter
|
$ | 21.76 | $ | 19.82 | $ | 0.2450 | ||||||
|
Second quarter
|
22.14 | 19.81 | 0.2525 | |||||||||
|
Third quarter
|
23.28 | 20.47 | 0.2525 | |||||||||
|
Fourth quarter
|
24.36 | 23.02 | 0.2525 | |||||||||
|
2009
|
High | Low | Dividends | |||||||||
|
First quarter
|
$ | 19.13 | $ | 16.01 | $ | 0.2375 | ||||||
|
Second quarter
|
18.98 | 16.83 | 0.2450 | |||||||||
|
Third quarter
|
20.29 | 17.44 | 0.2450 | |||||||||
|
Fourth quarter
|
21.94 | 18.53 | 0.2450 | |||||||||
Book value per share at Dec. 31, 2010, was $16.76. The number of common shareholders of record as of Dec. 31, 2010 was approximately 79,461. The Articles of Incorporation of Xcel Energy place restrictions on the amount of common stock dividends it can pay when preferred stock is outstanding. Under the provisions, dividend payments may be restricted if Xcel Energy’s capitalization ratio (on a holding company basis only, not on a consolidated basis) is less than 25 percent. For these purposes, the capitalization ratio is equal to (i) common stock plus surplus divided by (ii) the sum of common stock plus surplus plus long-term debt. Based on this definition, Xcel Energy’s holding company capitalization ratio at Dec. 31, 2010 and 2009 was 84 percent and 85 percent, respectively. Therefore, the restrictions do not place any effective limit on Xcel Energy’s ability to pay dividends. See Item 7 and Note 7 to the consolidated financial statements for further discussion of Xcel Energy’s dividend policy.
The following compares our cumulative TSR on common stock with the cumulative total return of the EEI Investor-Owned Electrics Index and the Standard & Poor’s 500 Composite Stock Price Index over the last five fiscal years (assuming a $100 investment in each vehicle on Dec. 31, 2005, and the reinvestment of all dividends).
The EEI Investor-Owned Electrics Index currently includes 57 companies and is a broad measure of industry performance.
COMPARISON OF 5 YEAR CUMULATIVE TOTAL RETURN*
Among Xcel Energy, The EEI Investor-Owned Electrics,
and The S&P 500
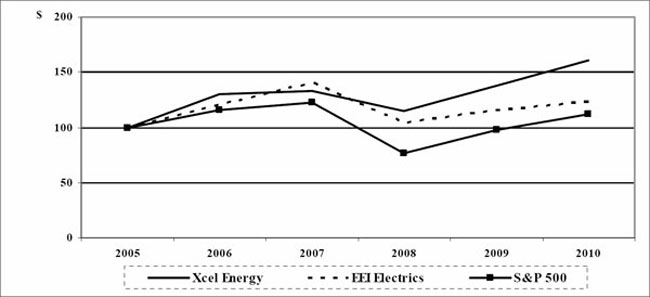
|
*
|
$100 invested on Dec. 31, 2005 in stock and index — including reinvestment of dividends. Fiscal years ending Dec. 31.
|
|
2005
|
2006
|
2007
|
2008
|
2009
|
2010
|
|||||||||||||||||||
|
Xcel Energy
|
$ | 100 | $ | 131 | $ | 133 | $ | 115 | $ | 138 | $ | 160 | ||||||||||||
|
EEI Investor-Owned Electrics
|
100 | 121 | 141 | 104 | 115 | 124 | ||||||||||||||||||
|
S&P 500
|
100 | 116 | 122 | 77 | 97 | 112 | ||||||||||||||||||
See Item 12 for a discussion of securities authorized for issuance under equity compensation plans.
UNREGISTERED SALES OF EQUITY SECURITIES AND USE OF PROCEEDS
Purchases of Equity Securities by the Issuer and Affiliated Purchasers
The following table provides information about our purchases of equity securities that are registered by Xcel Energy pursuant to Section 12 of the Exchange Act for the year ended Dec. 31, 2010:
| Issuer Purchases of Equity Securities | ||||||||||||||||
|
Period
|
Total Number
of Share
Purchases
|
Average Price Paid per Share | Total Number of Shares Purchased as Part of Publicly Announced Plans or Programs | Maximum Number (or Approximate Dollar Value) of Shares That May Yet Be Purchased Under the Plans or Programs | ||||||||||||
|
01/01/10 - 01/31/10
|
— | $ | — | — | — | |||||||||||
|
02/01/10 - 02/28/10
(a)
|
68,685 | 20.89 | — | — | ||||||||||||
|
03/01/10 - 03/31/10
(b)
|
9,868 | 21.00 | — | — | ||||||||||||
|
04/01/10 - 04/30/10
|
— | — | — | — | ||||||||||||
|
05/01/10 - 05/31/10
|
— | — | — | — | ||||||||||||
|
06/01/10 - 06/30/10
|
— | — | — | — | ||||||||||||
|
07/01/10 - 07/31/10
|
— | — | — | — | ||||||||||||
|
08/01/10 - 08/31/10
(a)
|
29,895 | 22.33 | — | — | ||||||||||||
|
09/01/10 - 09/30/10
|
— | — | — | — | ||||||||||||
|
10/01/10 - 10/31/10
|
— | — | — | — | ||||||||||||
|
11/01/10 - 11/30/10
|
— | — | — | — | ||||||||||||
|
12/01/10 - 12/31/10
|
— | — | — | — | ||||||||||||
|
Total
|
108,448 | — | — | |||||||||||||
|
(a)
|
Xcel Energy or one of its agents periodically purchases common shares in order to satisfy obligations under the Stock Equivalent Plan for Non-Employee Directors.
|
|
(b)
|
The repurchase of shares noted in the table above was made pursuant to the Xcel Energy Executive Annual Incentive Award Plan. The shares were returned to Xcel Energy on behalf of some of the participants receiving an incentive award of common shares to effectuate the payment of federal and state income taxes on the award.
|
|
(Millions of Dollars, Except Share and
|
||||||||||||||||||||
|
Per Share Data)
|
2010
|
2009
|
2008
|
2007
|
2006
|
|||||||||||||||
|
Operating revenues
|
$ | 10,311 | $ | 9,644 | $ | 11,203 | $ | 10,034 | $ | 9,840 | ||||||||||
|
Operating expenses
|
8,691 | 8,176 | 9,812 | 8,683 | 8,663 | |||||||||||||||
|
Income from continuing operations
|
752 | 686 | 646 | 576 | 569 | |||||||||||||||
|
Net income
|
756 | 681 | 646 | 577 | 572 | |||||||||||||||
|
Earnings available to common shareholders
|
752 | 677 | 641 | 573 | 568 | |||||||||||||||
|
Weighted average common shares outstanding:
|
||||||||||||||||||||
|
Basic
|
462,052 | 456,433 | 437,054 | 416,139 | 405,689 | |||||||||||||||
|
Diluted
|
463,391 | 457,139 | 441,813 | 433,131 | 429,605 | |||||||||||||||
|
Earnings per share from continuing operations:
|
||||||||||||||||||||
|
Basic
|
$ | 1.62 | $ | 1.49 | $ | 1.47 | $ | 1.38 | $ | 1.39 | ||||||||||
|
Diluted
|
1.61 | 1.49 | 1.46 | 1.35 | 1.35 | |||||||||||||||
|
Earnings per share:
|
||||||||||||||||||||
|
Basic
|
1.63 | 1.48 | 1.47 | 1.38 | 1.40 | |||||||||||||||
|
Diluted
|
1.62 | 1.48 | 1.46 | 1.35 | 1.36 | |||||||||||||||
|
Dividends declared per common share
|
1.00 | 0.97 | 0.94 | 0.91 | 0.88 | |||||||||||||||
|
Total assets
|
27,388 | 25,306 | 24,805 | 23,087 | 21,805 | |||||||||||||||
|
Long-term debt
|
9,263 | 7,889 | 7,732 | 6,342 | 6,450 | |||||||||||||||
|
Book value per share
|
16.76 | 15.92 | 15.35 | 14.70 | 14.28 | |||||||||||||||
|
Return on average common equity
|
9.8 | % | 9.5 | % | 9.7 | % | 9.5 | % | 10.1 | % | ||||||||||
|
Ratio of earnings to fixed charges
(a)
|
2.6 | 2.5 | 2.5 | 2.2 | 2.2 | |||||||||||||||
(a)
Excludes undistributed equity income and includes allowance for funds used during construction.
Business Segments and Organizational Overview
Continuing Operations
Xcel Energy is a public utility holding company. In 2010, Xcel Energy’s continuing operations included the activity of four utility subsidiaries that serve electric and natural gas customers in eight states. These utility subsidiaries are NSP-Minnesota, NSP-Wisconsin, PSCo and SPS. These utilities serve customers in portions of Colorado, Michigan, Minnesota, New Mexico, North Dakota, South Dakota, Texas and Wisconsin. Along with WYCO, a joint venture formed with CIG to develop and lease natural gas pipeline, storage, and compression facilities, and WGI, an interstate natural gas pipeline company, these companies comprise the continuing regulated utility operations.
Xcel Energy’s nonregulated subsidiary reported in continuing operations is Eloigne, which invests in rental housing projects that qualify for low-income housing tax credits.
Forward-Looking Statements
Except for the historical statements contained in this report, the matters discussed in the following discussion and analysis are forward-looking statements that are subject to certain risks, uncertainties and assumptions. Such forward-looking statements are intended to be identified in this document by the words “anticipate,” “believe,” “estimate,” “expect,” “intend,” “may,” “objective,” “outlook,” “plan,” “project,” “possible,” “potential,” “should” and similar expressions. Actual results may vary materially.
Forward-looking statements speak only as of the date they are made, and we do not undertake any obligation to update them to reflect changes that occur after that date. Factors that could cause actual results to differ materially include, but are not limited to: general economic conditions, including the availability of credit and its impact on capital expenditures and the ability of Xcel Energy and its subsidiaries to obtain financing on favorable terms; business conditions in the energy industry; actions of credit rating agencies; competitive factors, including the extent and timing of the entry of additional competition in the markets served by Xcel Energy and its subsidiaries; unusual weather; effects of geopolitical events, including war and acts of terrorism; state, federal and foreign legislative and regulatory initiatives that affect cost and investment recovery, have an impact on rates or have an impact on asset operation or ownership or impose environmental compliance conditions; structures that affect the speed and degree to which competition enters the electric and natural gas markets; costs and other effects of legal and administrative proceedings, settlements, investigations and claims; environmental laws and regulations; actions of accounting regulatory bodies; the items described under Factors Affecting Results of Continuing Operations; and the other risk factors listed from time to time by Xcel Energy in reports filed with the SEC, including “Risk Factors” in Item 1A of Xcel Energy’s Form 10-K for the year ended Dec. 31, 2010 and Exhibit 99.01 to Xcel Energy’s Form 10-K for the year ended Dec. 31, 2010.
Management’s Strategic Plans
Xcel Energy’s corporate strategy focuses on three core objectives 1) cost-effective environmental leadership 2) achieving our financial objectives and 3) optimizing the management of our operating utilities. Our objective is to provide value to our customers and execute environmental initiatives by investing in our core utility businesses and earning a reasonable return on our invested capital. Below is a detailed discussion of our three primary objectives and how they support our overall strategy.
Xcel Energy’s Environmental Leadership
Overview
Xcel Energy’s proactive environmental initiatives form one of three key strategic objectives. Xcel Energy believes that our environmental leadership initiatives have been successful in meeting customer and policy maker environmental expectations, while appropriately managing customer costs and hedging future environmental risk. This in turn, creates shareholder value.
As a portfolio of regulated utilities, Xcel Energy has an obligation to serve its customers by providing them with reasonably priced, reliable electric and gas services. However, Xcel Energy’s strategy goes beyond this traditional mission. Under our environmental strategy, Xcel Energy takes prudent, balanced steps to reduce the impact of our operations on the environment while promoting technological and public policy advancements that will support a cleaner electric system at a reasonable price to customers:
|
|
●
|
We continue to increase our use of efficient renewable resources.
|
|
|
●
|
We provide our customers with energy efficiency options at the lowest cost available while reducing emissions and saving natural resources.
|
|
|
●
|
We work with policy makers to undertake balanced, cost-effective and proactive initiatives to reduce the emissions and environmental impact associated with our operations.
|
Xcel Energy looks to advanced technology and business innovation to find cost-effective means to meet, and where appropriate, exceed new environmental mandates. Finally, Xcel Energy seeks to reduce regulatory uncertainty through constructive cost-recovery for environmental initiatives. As a result, we are well-positioned to meet the challenges of potential climate change and other environmental regulation and comply with state and federal renewable energy, efficiency and other clean energy mandates.
We believe that our leadership strategy has resulted in more efficient compliance with environmental mandates, by avoiding the cost and uncertainty of traditional, piecemeal environmental regulation. Our leadership strategy has positioned Xcel Energy with a diverse portfolio of energy resources, prevents excessive reliance on one form of energy production, and allows for more efficient, lower cost planning. Moreover, our strategy has allowed us to take advantage of favorable market conditions. For example, our acquisition of wind resources has not only positioned us to meet the requirements of state renewable energy mandates but our wind portfolio has been delivered to customers at prices that are competitive with energy that could have been provided by new fossil-fired generating units. As a whole, our balanced environmental leadership strategy has provided our customers with both environmental and financial benefits.
The foundation for Xcel Energy’s environmental strategy resides within its environmental policy. Under this policy, the Xcel Energy Board of Directors, acting through the Nuclear, Environmental and Safety Committee, establishes environmental performance goals and oversees Xcel Energy’s environmental compliance program and policy initiatives. The policy is available on our website at www.xcelenergy.com. Pursuant to that policy, we have established a highly effective environmental compliance program and have produced an excellent compliance record. Xcel Energy has created an environmental management system that provides employees with training and documentation of Xcel Energy’s compliance responsibilities, creates processes designed to minimize the risk of noncompliance and audits Xcel Energy’s environmental performance. Environmental performance goals, which include the goal of carbon reduction, consistent with our overall strategy, are incorporated into officer and employee job responsibilities and compensation.
Our environmental leadership strategy resulted in numerous environmental awards and recognition. For example, Xcel Energy was named to the 2010-2011 Dow Jones Sustainability Index for North America leading index of companies considered best in class for corporate economic, environmental and social performance. This is the fourth year Xcel Energy received this distinction. Xcel Energy was named to the Carbon Disclosure Project’s newly formed Carbon Performance Index for efforts to reduce GHGs. The American Wind Energy Association ranked Xcel Energy the nation’s number one wind energy provider for the past six years, and the Solar Electric Power Association ranked Xcel Energy number five among U.S. utilities for solar capacity for the past three years. Xcel Energy has achieved these rankings while at the same time maintaining a balanced strategy and providing our customers with energy at reasonable rates. As indicated above, in some circumstances our renewable energy initiatives have resulted in lower customer costs than a traditional, fossil-only strategy.
Xcel Energy strives to provide the public with detailed information regarding environmental performance and risk. Among other things, our utility companies operating in Minnesota, Colorado, and New Mexico use a carbon proxy cost mandated by the state commissions as part of its evaluation of the impact of potential GHG regulation on its future resource acquisition plans. Xcel Energy publishes a Corporate Responsibility Report annually, which is available on our website, www.xcelenergy.com.
Current Clean Energy, Renewable Energy, Conservation and Transmission Initiatives
Promoting Clean Energy
|
|
●
|
In December 2010, the CPUC approved PSCo’s Plan, required by the CACJA, to reduce annual emissions of NOx, SO
2
and mercury from five coal-fired power plants in Colorado by more than 80 percent from 2008 levels by 2017.
|
|
|
●
|
Xcel Energy, with approval from the CPUC, established the Innovative Clean Technology Program, an initiative to test promising new technologies with the potential to lower GHG emissions and result in other environmental improvements.
|
Renewable Energy
|
|
●
|
As noted above, Xcel Energy is the nation’s largest utility wind energy provider, holding this ranking for the last six years. In 2009 Xcel Energy had 3,176 MW of wind energy on our system. In 2010, this has grown to 3,432 MW. Xcel Energy plans continue to grow this to between 4,500 MW and 5,000 MW by 2015. Wind energy accounted for approximately 8 percent of our energy mix and by 2020, we project it will be approximately 16 percent of our energy.
|
|
|
●
|
Xcel Energy has a number of environmental initiatives focused on our customers. Xcel Energy has the third largest customer-driven wind program in the nation called WindSource
®
.
|
|
|
●
|
In 2010, NSP-Minnesota completed the new 201 MW Nobles Wind Project in southern Minnesota. NSP-Minnesota is also investing approximately $400 million for the 150 MW Merricourt Wind project located in southeastern North Dakota, expected to be operational by the end of 2011.
|
|
|
●
|
Xcel Energy is the nation’s fifth largest utility solar energy provider, holding this ranking for the last three years.
|
|
|
●
|
In Colorado, Minnesota and New Mexico, Xcel Energy manages a growing customer-sited solar program, known as Solar*Rewards
®
.
|
|
|
●
|
In 2010, PSCo completed a solar demonstration project under the Innovative Clean Technology Program described above. That project tested the use of solar thermal energy to supplement a coal plant steam cycle and reduce the plant’s fuel consumption and emissions.
|
|
|
●
|
Hydro provides 4 percent of Xcel Energy’s electric generation.
|
|
|
●
|
Xcel Energy operates 27 hydroelectric power plants in Wisconsin, Minnesota and Colorado, which can generate more than 500 MW and purchases large amounts of emissions-free, reasonably priced hydro-generated electricity from Manitoba Hydro.
|
Conservation
|
|
●
|
Xcel Energy’s efficiency programs saved approximately 698 GWh of electric energy in 2010, and Xcel Energy is allowed a performance incentive in Minnesota, Colorado and New Mexico.
|
|
|
●
|
Xcel Energy is also working to apply intelligence to its electric grid, creating a smart grid, to provide customers with more choice, reliability and control over their energy use. To that end, Xcel Energy has completed the nation’s first fully integrated SmartGridCity™ in Boulder, Colo., and is testing its potential to help manage energy consumption, improve service and reduce environmental impacts.
|
Transmission
|
|
●
|
In conjunction with its significant position in wind and currently with ownership with over 18,100 line miles, Xcel Energy is the fourth largest investor-owned transmission system. Further we expect to invest an additional $3.8 billion in transmission through 2015.
|
|
|
●
|
Xcel Energy is participating in a project called CapX2020 which is a joint initiative of 11 transmission-owning utilities in the upper Midwest to expand the electric transmission grid by approximately 700 miles. The estimated cost of this initiative is $1.9 billion, consisting of four major transmission projects, with the goal of providing continued reliable and affordable electric service. NSP-Minnesota’s and NSP-Wisconsin’s percentage ownership varies by project and its projected share of the investment is approximately $1 billion.
|
|
|
●
|
Under Senate Bill 100 in Colorado, PSCo has proposed to build approximately 1,000 miles of transmission in the state, including the San Luis Valley-Calumet-Comanche project, where utilities commission approval is pending. PSCo is partnering with Tri-State on the San Luis Valley-Calumet-Comanche Transmission Project, with an overall sharing percentage of approximately 60 percent to PSCo and 40 percent to Tri-State. As of December 2010, partnerships and sharing percentages have not been determined for any other projects.
|
In pursuing its environmental initiatives, Xcel Energy actively evaluates public policy proposals and promotes environmental initiatives that are designed to be reasonably priced, to assure compliance with state policies and programs, to manage long-term customer costs and, where appropriate, to provide growth opportunities.
GHG Emissions
Xcel Energy is committed to addressing climate change and the threat of climate change regulation through efforts to reduce its GHG emissions in a balanced, cost-effective manner.
Xcel Energy adopted a methodology for calculating CO
2
emissions based on the recently issued reporting protocols of The Climate Registry. Xcel Energy is a “founding reporter” under The Climate Registry. As third-party CO
2
reporting protocols continue to evolve, Xcel Energy expects additional changes in reporting methodology and reported CO
2
emissions. Starting in 2011, Xcel Energy will also report GHG emissions to the EPA under the agency’s newly adopted GHG reporting rule. Certain REC transactions include a transfer of environmental attributes. It is not clear whether future GHG reporting regulations could require reporting of CO
2
emissions for such REC transfers; current rules for EPA’s Greenhouse Gas Reporting Program do not address REC transactions.
Based on The Climate Registry’s current reporting protocol, Xcel Energy estimated that its current electric generating portfolio, which includes coal- and gas-fired plants, emitted approximately 60.2 million and 60.1 million tons of CO
2
in 2010 and 2009, respectively. Xcel Energy also estimated emissions associated with electricity purchased for resale to Xcel Energy customers from generation facilities owned by third parties. Xcel Energy estimates that these third-party facilities emitted approximately 20.3 million tons of CO
2
in 2010. Estimated total CO
2
emissions, associated with service to Xcel Energy electric customers, increased by 0.7 million tons in 2010 compared to 2009. The increase in emissions was associated with an increase of 1.5 million MWh of generation. However Xcel Energy’s total emissions have a cumulative decrease of 55.0 million tons since 2003.
In 2010, Xcel Energy completed the acquisition of the Blue Spruce Energy Center and Rocky Mountain Energy Center. Since Xcel Energy previously purchased the energy from these facilities, the combined CO
2
emissions from owned and purchased generation will not change. The CO
2
emissions from these facilities will now be included in emissions of owned assets. In 2010, Xcel Energy’s ownership share of Comanche Unit 3 resulted in CO
2
emissions of approximately 2.1 million tons, and we estimate that Comanche Unit 3’s 2011 emissions will be approximately 3.0 million tons. Xcel Energy plans to implement clean resource development and conservation plans that will result in overall reductions in Xcel Energy’s CO
2
emissions, including PSCo’s plan under the CACJA, both in absolute terms and per KWh of electricity produced.
State Resource Plans
As a result of our resource plans, Xcel Energy would:
|
|
●
|
Increase overall system wind capacity from approximately 3,432 MW at the end of 2010 to over 5,000 MW by 2015;
|
|
|
●
|
Extend power purchases and exchange agreements with Manitoba Hydro through 2025 for NSP-Minnesota;
|
|
|
●
|
Continue expansion of our customer energy efficiency and conservation programs;
|
|
|
●
|
Retire and replace several existing coal-fired electric generation facilities with natural gas or combined-cycle generation units at PSCo and NSP-Minnesota;
|
|
|
●
|
Install several SCRs for controlling NOx emissions and a scrubber for controlling SO
2
emissions on specified units at PSCo;
|
|
|
●
|
Improve the efficiency and reduction of CO
2
, mercury, SO
2
and NOx emissions at several existing fossil plants at NSP-Minnesota and PSCo; and
|
|
|
●
|
Upgrade the capacity of existing nuclear facilities at NSP-Minnesota.
|
These plans are designed so that, depending on fuel, commodity and other assumptions, Xcel Energy would maintain a reasonably priced product and continue to provide reliable power to our customers. At the same time, the plans would result in a significant reduction in GHG emissions. Overall, Xcel Energy estimates that, by implementing these plans, we would achieve a GHG reduction of 20 percent below 2005 levels by 2020.
Achieving Financial Objectives
Xcel Energy’s financial objectives have three phases 1) obtaining legislative and regulatory support for large investment initiatives, 2) investing in the utility business and 3) earning a fair return on utility system investments.
Obtaining Legislative and Regulatory Support
The first phase is obtaining legislative and regulatory support for large investment initiatives, prior to making the investment. To avoid excessive risk, it is critical that Xcel Energy reduce regulatory uncertainty before making large capital investments. Xcel Energy accomplished this through both the Minnesota and Colorado resource plans. The CPUC provided for recovery on CWIP in rate base in each rate case and deferred accounting of accelerated depreciation costs related to the CACJA. Xcel Energy obtained approval for several transmission lines through CONS in 2009 and 2010 for NSP- Minnesota, and expects to file an application for SPS in March 2011. In addition, various jurisdictions adopted legislation allowing for rider recovery of investments in renewable energy.
Investing in Our Utilities
The second phase is investing in our utilities. Xcel Energy is projected to spend approximately $13 billion in capital investment from 2011 through 2015, as disclosed in more detail in the Capital Requirements section and in Note 14 to the consolidated financial statements. In addition to Xcel Energy’s normal level of capital investment, Xcel Energy expects to have significant investment opportunity, in part attributable to the environmental strategy described above.
As a result of these investments, as well as continued investments in the transmission and distribution system, Xcel Energy expects that the rate base, or the amount on which Xcel Energy earns a return, will grow annually, on average, by more than 7 percent from 2011 through 2015.
Earning a Fair Return
The third phase is earning a fair return on utility system investments. To this end, the regulatory strategy is to receive regulatory approval for rate riders and DSM incentives, as well as general rate cases. A rate rider is a mechanism that allows recovery of certain costs and returns on investments without the costs and delays of filing a rate case. These riders allow for timely revenue recovery of the costs of large projects or other costs that vary over time. DSM incentives which exist in Colorado and New Mexico, and CIP incentives in Minnesota, allow Xcel Energy to earn from helping our customers reduce consumption. The incentive plans are designed to reward Xcel Energy for achieving performance at or above the approved savings goals.
Xcel Energy’s regulatory strategy is based on filing reasonable rate requests designed to provide recovery of legitimate expenses and a return on utility investments. Xcel Energy believes that the public utility commissions will provide reasonable recovery, and it is important to note that the financial plans include this assumption. Constructive results over the last several years are evidence of reasonable regulatory treatment and give Xcel Energy confidence that Xcel Energy is pursuing the right strategy. With any strategic plan, there are goals and objectives. Xcel Energy feels the following financial objectives continue to be achievable:
|
|
●
|
A long-term annual earnings per share growth rate target of 5 percent to 7 percent;
|
|
|
●
|
Annual dividend increases of 2 percent to 4 percent; and
|
|
|
●
|
Senior unsecured debt credit ratings in the BBB+ to A range.
|
Successful execution of the corporate strategic plan should allow Xcel Energy to achieve the outlined financial objectives, which in turn, should provide investors with an attractive total return on a low-risk investment.
Optimizing a Portfolio of Operating Utilities
Optimizing the management of a portfolio of operating utilities is the third area of focus related to the corporate strategy. Even though Xcel Energy ultimately manages the business based on the revenue streams provided by electricity and natural gas, Xcel Energy continues to evolve the management of the portfolio of utility investments. While Xcel Energy has four separate operating companies, there are certain similarities and differences that require us to effectively manage this portfolio. More specifically, Xcel Energy’s goal is to build on the similarities among the companies, which maximizes efficiencies from centralized management and deployment of common initiatives, such as market branding and environmental policy research. From an organizational perspective, examples of similarities include corporate center services as well as certain operational functions, such as management of the generation fleet, transmission systems, environmental compliance, government and legislative compliance, NERC and FERC compliance and safety programs.
At the same time, Xcel Energy realizes there are unique differences in each of our service territories such as local community focus and priorities, regulatory environment, physical plant infrastructure and age, weather, as well as others that require Xcel Energy to organize and align these utility specific areas to most effectively address these utility distinct characteristics. To that end, Xcel Energy has operating company presidents, each located in their respective jurisdiction. The objective of this organizational structure is to optimize Xcel Energy’s operating efficiency while maximizing accountability.
Financial Review
The following discussion and analysis by management focuses on those factors that had a material effect on Xcel Energy’s financial condition, results of operations and cash flows during the periods presented, or are expected to have a material impact in the future. It should be read in conjunction with the accompanying consolidated financial statements and the related notes to consolidated financial statements.
RESULTS OF OPERATIONS
The following table summarizes the diluted earnings per share for Xcel Energy:
|
Diluted Earnings (Loss) Per Share
|
2010
|
2009
|
2008
|
|||||||||
|
PSCo
|
$ | 0.86 | $ | 0.72 | $ | 0.76 | ||||||
|
NSP-Minnesota
|
0.60 | 0.64 | 0.65 | |||||||||
|
SPS
|
0.17 | 0.15 | 0.07 | |||||||||
|
NSP-Wisconsin
|
0.09 | 0.10 | 0.10 | |||||||||
|
Equity earnings of unconsolidated subsidiaries
|
0.04 | 0.03 | 0.01 | |||||||||
|
Regulated utility — continuing operations
|
1.76 | 1.64 | 1.59 | |||||||||
|
Holding company and other costs
|
(0.14 | ) | (0.14 | ) | (0.14 | ) | ||||||
|
Ongoing diluted earnings per share
|
1.62 | 1.50 | 1.45 | |||||||||
|
COLI settlement, PSRI and Medicare Part D
|
(0.01 | ) | (0.01 | ) | 0.01 | |||||||
|
Earnings per share from continuing operations
|
1.61 | 1.49 | 1.46 | |||||||||
|
Earnings (loss) per diluted share from discontinued operations
|
0.01 | (0.01 | ) | — | ||||||||
|
GAAP
diluted earnings per share
|
$ | 1.62 | $ | 1.48 | $ | 1.46 | ||||||
Ongoing earnings exclude adjustments for certain items. For 2010, these adjustments are related to the COLI program, PSRI and to the Patient Protection and Affordable Care Act — Medicare Part D. For 2009 and 2008 these adjustments are related to the COLI program. See below under Adjustments to GAAP Earnings and Note 6 to the consolidated financial statements for further discussion.
Xcel Energy’s management believes that ongoing earnings provide a meaningful comparison of earnings results and is representative of Xcel Energy’s fundamental core earnings power. Xcel Energy’s management uses ongoing earnings internally for financial planning and analysis, for reporting of results to the Board of Directors, in determining whether performance targets are met for performance-based compensation and when communicating its earnings outlook to analysts and investors.
Ongoing earnings for 2010, which exclude adjustments for certain items, were $1.62 per share, compared with $1.50 per share in 2009. Higher 2010 ongoing earnings were primarily due to improved electric margins as a result of new rates in various jurisdictions and warmer summer temperatures, which were partially offset by higher operating and maintenance expenses and property taxes.
Ongoing earnings for 2009 were $1.50 per diluted share, compared with $1.45 per diluted share in 2008. Higher 2009 ongoing earnings were primarily due to improved electric margins as a result of constructive rate case outcomes in Minnesota, Colorado, Texas, New Mexico and Wisconsin, which were partially mitigated by the negative impact of weather, lower sales and higher purchase capacity power costs. Offsetting stronger electric margins were higher operating and maintenance expenses, resulting from increased employee benefit costs as well as higher nuclear expenses, and dilution from the issuance of equity to fund the capital investment program.
Earnings Adjusted for Certain Items (Ongoing Earnings)
2010 Comparison with 2009
PSCo
— PSCo earnings increased by $0.14 per share for 2010. The increase is due to higher electric margin resulting from the full effect of two general rate increases, and warmer temperatures, which increased electric sales. The rate increases reflect the significant capital investments that PSCo has made in its utility operations. In addition, PSCo’s electric operations substantially under-earned its authorized return in 2009. The higher electric margin was partially offset by higher O&M expenses, higher property tax expense and depreciation expense.
NSP-Minnesota
— NSP-Minnesota earnings decreased by $0.04 per share for 2010. The decrease is primarily due to higher O&M expenses, property taxes and depreciation expense partially offset by the positive impact of warmer temperatures, higher earned incentives on energy efficiency and conservation programs and modest normalized sales growth.
SPS
— SPS earnings increased by $0.02 per share in 2010. The increase is primarily due to electric sales growth, particularly in the commercial and industrial customer class, the reversal of previously established fuel reserves following the regulatory approval of certain settlement agreements and lower interest expense, which was partially offset by higher O&M expenses.
NSP-Wisconsin
— NSP-Wisconsin earnings decreased by $0.01 per share for 2010. The decrease is primarily due to fuel recovery and higher O&M expenses, partially offset by warmer temperatures which increased electric sales, as well as new electric rates, that were effective in January 2010.
Equity Earnings of Unconsolidated Subsidiaries
—
The increase is primarily related to increased earnings from the equity investment in WYCO related to a natural gas storage facility that began operating in mid-2009.
2009 Comparison with 2008
PSCo
— Earnings at PSCo decreased by $0.04 per share for 2009. The 2009 decrease is largely due to the negative impact of weather and rising costs, partially offset by new electric rates that went into effect in July 2009.
NSP-Minnesota
— Earnings at NSP-Minnesota decreased by $0.01 per share for 2009. The 2009 decrease is mainly due to the negative impact of weather and timing of nuclear outage expenses. The decrease was partially mitigated by a $91 million electric rate increase that went into effect in January 2009.
SPS
— Earnings at SPS increased by $0.08 per share for 2009. The 2009 increase was primarily due to electric rate increases in Texas (effective in February 2009) and New Mexico (effective in July 2009) and the 2008 resolution of certain fuel cost allocation issues, which were partially offset by higher purchased capacity costs.
NSP-Wisconsin
— Earnings at NSP-Wisconsin were flat for 2009. The 2009 earnings reflect increased costs, which were offset by improved fuel recovery and new rates which were effective in January 2009.
Equity Earnings of Unconsolidated Subsidiaries
— Equity earnings of unconsolidated subsidiaries increased by $0.02 per share for 2009 due to our investment in WYCO, which owns a natural gas pipeline in Colorado that began operations in late 2008 as well as a gas storage facility that commenced operations in July 2009.
Adjustments to GAAP Earnings
2010 Comparison with 2009
COLI Settlement
— In July 2010, Xcel Energy, PSCo and PSRI entered into a settlement agreement with Provident related to all claims asserted by Xcel Energy, PSCo and PSRI against Provident in a lawsuit associated with the discontinued COLI program. Under the terms of the settlement, Xcel Energy, PSCo and PSRI were paid $25 million by Provident and Reassure America Life Insurance Company resulting in approximately $0.05 of non-recurring earnings per share, in the third quarter of 2010. The $25 million proceeds were not subject to income taxes.
PSRI
— In addition, during the first quarter of 2010, Xcel Energy recorded a non-recurring tax and interest charge of approximately $10 million, or $0.02 per share, due to an agreement in principle reached with the IRS following the completion of a financial reconciliation of Xcel Energy’s statement of account dating back to tax year 1993, related to the COLI program. During the third quarter of 2010, Xcel Energy and the IRS came to final agreement on the applicable interest netting computations related to these tax years. Accordingly, PSRI recorded a reduction to expense of $0.6 million, net of tax, during the third quarter of 2010.
Impact of the Patient Protection and Affordable Care Act — Medicare Part D —
During the first quarter of 2010, Xcel Energy recorded non-recurring tax expense of approximately $17 million, or $0.04 per share, of tax benefits previously recognized in income related to Medicare Part D subsidies due to the Patient Protection and Affordable Care Act enacted in March 2010. Under GAAP, Xcel Energy was required to reverse these previously recorded tax benefits in the period of enactment of the new legislation.
2009 Comparison with 2008
PSRI
— PSRI is a wholly owned subsidiary of PSCo. During 2007, Xcel Energy resolved a dispute with the IRS regarding its COLI program. The 2009 impact is primarily related to legal costs associated with company claims against the insurance provider and broker of the COLI policies.
Discontinued Operations
— Loss from discontinued operations increased by one cent over 2009 primarily related to an increase in tax related expenses and legal accruals for previously divested businesses.
Changes in Diluted Earnings Per Share
The following tables summarize significant components contributing to the changes in the diluted earnings per share compared with prior periods, which are discussed in more detail later.
|
Diluted Earnings (Loss) Per Share
|
Dec. 31,
|
|||
|
2009 GAAP diluted earnings per share
|
$ | 1.48 | ||
|
PSRI
|
0.01 | |||
|
2009 diluted earnings per share from continuing operations
|
1.49 | |||
|
Loss per share from discontinued operations
|
0.01 | |||
|
2009 ongoing diluted earnings per share
|
1.50 | |||
|
Components of change — 2010 vs. 2009
|
||||
|
Higher electric margins
|
0.55 | |||
|
Higher natural gas margins
|
0.03 | |||
|
Higher operating and maintenance expenses
|
(0.20 | ) | ||
|
Higher conservation and DSM expenses (partially offset in revenues)
|
(0.08 | ) | ||
|
Higher depreciation and amortization
|
(0.05 | ) | ||
|
Lower AFUDC — equity
|
(0.04 | ) | ||
|
Higher taxes (other than income taxes)
|
(0.03 | ) | ||
|
Dilution from DRIP, benefit plans and the 2010 common equity issuance
|
(0.02 | ) | ||
|
Higher interest charges
|
(0.02 | ) | ||
|
Other, net
|
(0.02 | ) | ||
|
2010 ongoing diluted earnings per share
|
1.62 | |||
|
COLI settlement, PSRI, and Medicare Part D
|
(0.01 | ) | ||
|
2010 diluted earnings per share from continuing operations
|
1.61 | |||
|
Earnings per share from discontinued operations
|
0.01 | |||
|
2010 GAAP diluted earnings per share
|
$ | 1.62 | ||
|
Diluted Earnings (Loss) Per Share
|
Dec. 31,
|
|||
|
2008 GAAP
diluted earnings per share
|
$ | 1.46 | ||
|
PSRI
|
(0.01 | ) | ||
|
2008 ongoing diluted earnings per share
|
1.45 | |||
|
Components of change — 2009 vs. 2008
|
||||
|
Higher electric margins
|
0.44 | |||
|
Lower natural gas margins
|
(0.02 | ) | ||
|
Higher equity earnings of unconsolidated subsidiaries
|
0.02 | |||
|
Higher operating and maintenance expenses
|
(0.19 | ) | ||
|
Higher conservation and DSM expenses (partially offset in revenues)
|
(0.09 | ) | ||
|
Lower other income (expense), net
|
(0.03 | ) | ||
|
Higher taxes, other than income taxes
|
(0.03 | ) | ||
|
Dilution from DRIP, benefit plan and the 2008 common equity issuance
|
(0.05 | ) | ||
|
2009 ongoing diluted earnings per share
|
1.50 | |||
|
PSRI
|
(0.01 | ) | ||
|
2009 diluted earnings per share from continuing operations
|
1.49 | |||
|
Diluted loss per share from discontinued operations
|
(0.01 | ) | ||
|
2009 GAAP diluted earnings per share
|
$ | 1.48 | ||
The following table provides a reconciliation of ongoing and GAAP earnings and earnings per diluted share for the years ended Dec. 31:
|
(Millions of Dollars)
|
2010
|
2009
|
2008
|
|||||||||
|
Ongoing earnings
|
$ | 756.4 | $ | 690.0 | $ | 641.1 | ||||||
|
COLI settlement, PSRI and Medicare Part D
|
(4.5 | ) | (4.5 | ) | 4.6 | |||||||
|
Total continuing operations
|
751.9 | 685.5 | 645.7 | |||||||||
|
Income (loss) from discontinued operations
|
3.9 | (4.6 | ) | (0.1 | ) | |||||||
|
Total GAAP earnings
|
$ | 755.8 | $ | 680.9 | $ | 645.6 | ||||||
|
Diluted Earnings (Loss) Per Share
|
2010
|
2009
|
2008
|
|||||||||
|
Ongoing earnings per diluted share
(a)
|
$ | 1.62 | $ | 1.50 | $ | 1.45 | ||||||
|
COLI settlement, PSRI and Medicare Part D
|
(0.01 | ) | (0.01 | ) | 0.01 | |||||||
|
Earnings per share — continuing operations
(a)
|
1.61 | 1.49 | 1.46 | |||||||||
|
Earnings (loss) from discontinued operations
|
0.01 | (0.01 | ) | — | ||||||||
|
Total GAAP earnings per diluted share
(a)
|
$ | 1.62 | $ | 1.48 | $ | 1.46 | ||||||
(a)
Includes the dividend requirements on preferred stock.
Continuing operations consist of the following:
|
|
●
|
Regulated utility subsidiaries, operating in the electric and natural gas segments; and
|
|
|
●
|
Other nonregulated subsidiaries and the holding company.
|
The following table summarizes the earnings contributions of Xcel Energy’s business segments on the basis of GAAP.
|
Contributions to Income
|
||||||||||||
|
(Millions of Dollars)
|
2010
|
2009
|
2008
|
|||||||||
|
GAAP income (loss) by segment
|
||||||||||||
|
Regulated electric income
|
$ | 665.2 | $ | 611.9 | $ | 552.3 | ||||||
|
Regulated natural gas income
|
114.6 | 108.9 | 129.3 | |||||||||
|
Other income
(a)
|
36.6 | 27.2 | 27.0 | |||||||||
|
Segment income — continuing operations
|
816.4 | 748.0 | 708.6 | |||||||||
|
Holding company and other costs
(a)
|
(64.5 | ) | (62.5 | ) | (62.9 | ) | ||||||
|
Total income — continuing operations
|
751.9 | 685.5 | 645.7 | |||||||||
|
Income (loss) from discontinued operations
|
3.9 | (4.6 | ) | (0.1 | ) | |||||||
|
Total GAAP net income
|
$ | 755.8 | $ | 680.9 | $ | 645.6 | ||||||
|
Contributions to Diluted Earnings (Loss) Per Share
|
||||||||||||
|
2010
|
2009
|
2008
|
||||||||||
|
GAAP earnings (loss) by segment
|
||||||||||||
|
Regulated electric
|
$ | 1.43 | $ | 1.33 | $ | 1.25 | ||||||
|
Regulated natural gas
|
0.24 | 0.24 | 0.29 | |||||||||
|
Other
(a)
|
0.08 | 0.06 | 0.06 | |||||||||
|
Segment earnings per share — continuing operations
|
1.75 | 1.63 | 1.60 | |||||||||
|
Holding company and other costs
(a)
|
(0.14 | ) | (0.14 | ) | (0.14 | ) | ||||||
|
Total earnings per share — continuing operations
|
1.61 | 1.49 | 1.46 | |||||||||
|
Earnings (loss) from discontinued operations
|
0.01 | (0.01 | ) | — | ||||||||
|
Total GAAP earnings per diluted share
|
$ | 1.62 | $ | 1.48 | $ | 1.46 | ||||||
(a)
Not a reportable segment. Included in all other segment results in Note 17.
The following discussion summarizes the items that affected the individual revenue and expense items reported in the consolidated statements of income.
Estimated Impact of Temperature Changes on Regulated Earnings
— Unseasonably hot summers or cold winters increase electric and natural gas sales while, conversely, mild weather reduces electric and natural gas sales. The estimated impact of weather on earnings is based on the number of customers, temperature variances and the amount of natural gas or electricity the average customer historically uses per degree of temperature. Accordingly, deviations in weather from normal levels can affect Xcel Energy’s financial performance.
Degree-day or Temperature-Humidity Index (THI) data is used to estimate amounts of energy required to maintain comfortable indoor temperature levels based on each day’s average temperature and humidity. Heating degree-days (HDD) is the measure of the variation in the weather based on the extent to which the average daily temperature falls below 65° Fahrenheit, and cooling degree-days (CDD) is the measure of the variation in the weather based on the extent to which the average daily temperature rises above 65° Fahrenheit. Each degree of temperature above 65° Fahrenheit is counted as one cooling degree-day, and each degree of temperature below 65° Fahrenheit is counted as one heating degree-day. In Xcel Energy’s more humid service territories, a THI is used in place of CDD, which adds a humidity factor to CDD. HDD, CDD and THI are most likely to impact the usage of Xcel Energy’s residential and commercial customers. Industrial customers are less weather sensitive.
Normal weather conditions are defined as either the 20-year or 30-year average of actual historical weather conditions. The historical period of time used in the calculation of normal weather differs by jurisdiction based on the time period used by the regulator in establishing estimated volumes in the rate setting process. The percentage increase (decrease) in normal and actual HDD, CDD and THI are provided in the following table:
| 2010 vs. Normal | 2009 vs. Normal |
2010 vs.
2009
|
2008 vs. Normal |
2009 vs.
2008
|
||||||||||||||||
|
HDD
|
(4.7 | ) % | 0.4 | % | (5.0 | ) % | 4.5 | % | (3.9 | ) % | ||||||||||
|
CDD
|
10.8 | (10.5 | ) | 23.8 | 1.0 | (11.4 | ) | |||||||||||||
|
THI
|
27.8 | (34.5 | ) | 95.1 | (15.5 | ) | (22.5 | ) | ||||||||||||
Weather — The following table summarizes the estimated impact on earnings per share of temperature variations compared with sales under normal weather conditions.
|
2010 vs.
Normal
|
2009 vs.
Normal
|
2010 vs.
2009
|
2008 vs.
Normal
|
2009 vs.
2008
|
||||||||||||||||
|
Retail electric
|
$ | 0.04 | $ | (0.05 | ) | $ | 0.09 | $ | (0.01 | ) | $ | (0.04 | ) | |||||||
|
Firm natural gas
|
(0.01 | ) | — | (0.01 | ) | 0.01 | (0.01 | ) | ||||||||||||
|
Total
|
$ | 0.03 | $ | (0.05 | ) | $ | 0.08 | $ | — | $ | (0.05 | ) | ||||||||
Sales Growth (Decline) — The following table summarizes Xcel Energy’s regulated sales growth (decline) for actual and weather-normalized energy sales for the years ended Dec. 31, compared with the previous year.
|
Dec. 31, 2010
|
Dec. 31, 2009
|
|||||||||||||||||||
|
Weather
|
||||||||||||||||||||
|
Weather
|
Normalized
|
Weather
|
||||||||||||||||||
|
Actual
|
Normalized
|
Lubbock
(a)
|
Actual
|
Normalized
|
||||||||||||||||
|
Electric residential
|
4.6 | % | 0.7 | % | 0.9 | % | (1.4 | ) % | 0.7 | % | ||||||||||
|
Electric commercial and industrial
|
2.6 | 1.4 | 1.6 | (3.3 | ) | (2.7 | ) | |||||||||||||
|
Total retail electric sales
|
3.1 | 1.2 | 1.4 | (2.7 | ) | (1.8 | ) | |||||||||||||
|
Firm natural gas sales
|
(2.9 | ) | (0.2 | ) | N/A | (2.6 | ) | 0.1 | ||||||||||||
(a) Adjusted for the October 2010 sale of SPS electric distribution assets to the city of Lubbock, Texas.
During 2009, we experienced lower than anticipated actual electric residential sales, and a decline in electric commercial and industrial sales on a weather-adjusted basis, which we believe was driven by overall economic conditions and to a lesser degree, increased conservation efforts. Sales in 2010 for the commercial and industrial class have shown signs of recovery. We anticipate that sales in the future will grow at a slower rate than historical levels, due in part to increased conservation activities.
Weather-normalized sales for 2011 are projected to grow approximately 1.0 to 1.3 percent for retail electric customers and to remain relatively flat for retail firm natural gas customers.
Electric Revenues and Margin
Electric revenues and fuel and purchased power expenses are largely impacted by the fluctuation in the price of natural gas, coal and uranium used in the generation of electricity, but as a result of the design of fuel recovery mechanisms to recover current expenses these price fluctuations have little impact on electric margin. The following tables detail the electric revenues and margin:
|
(Millions of Dollars)
|
2010
|
2009
|
2008
|
|||||||||
|
Electric revenues
|
$ | 8,452 | $ | 7,705 | $ | 8,683 | ||||||
|
Electric fuel and purchased power
|
(4,011 | ) | (3,672 | ) | (4,948 | ) | ||||||
|
Electric margin
|
$ | 4,441 | $ | 4,033 | $ | 3,735 | ||||||
The following tables summarize the components of the changes in electric revenues and electric margin for the years ended Dec. 31:
Electric Revenues
|
(Millions of Dollars)
|
2010 vs. 2009
|
|||
|
Fuel and purchased power cost recovery
|
$ | 288 | ||
|
Retail rate increases, including seasonal rates (Colorado, Wisconsin, South Dakota and New Mexico)
|
228 | |||
|
Conservation and DSM revenue and incentive (partially offset by expenses)
|
72 | |||
|
Estimated impact of weather
|
65 | |||
|
Retail sales increase (excluding weather impact)
|
18 | |||
|
Sales mix and demand revenues
|
16 | |||
|
Non-fuel riders
|
15 | |||
|
Transmission revenue
|
14 | |||
|
Trading
|
2 | |||
|
Firm wholesale
|
(11 | ) | ||
|
Other, net
|
40 | |||
|
Total increase in electric revenue
|
$ | 747 | ||
2010 Comparison with 2009 — Electric revenues increased due to higher fuel and purchased power costs, retail rate increases in Colorado, Wisconsin, South Dakota and New Mexico, higher conservation revenue and incentives and warmer than normal summer weather, primarily at NSP-Minnesota.
Electric Margin
2010 Comparison to 2009 — The increase in electric margin was due to retail rate increases in Colorado, Wisconsin, South Dakota and New Mexico, warmer than normal summer weather, primarily at NSP-Minnesota and higher conservation revenue and incentives.
|
(Millions of Dollars)
|
2010 vs. 2009
|
|||
|
Retail rate increases, including seasonal rates (Colorado, Wisconsin, South Dakota and New Mexico)
|
$
|
228
|
||
|
Conservation and DSM revenue and incentive (partially offset by expenses)
|
72
|
|||
|
Estimated impact of weather
|
65
|
|||
|
Retail sales increase (excluding weather impact)
|
18
|
|||
|
Sales mix and demand revenue
|
16
|
|||
|
Non-fuel riders
|
15
|
|||
|
Firm wholesale
|
9
|
|||
|
Trading
|
(7
|
) | ||
|
Other, net
|
(8
|
) | ||
|
Total increase in electric margin
|
$
|
408
|
||
2010 Comparison to 2009 — The increase in electric margin was due to retail rate increases in Colorado, Wisconsin, South Dakota and New Mexico, warmer than normal summer weather, primarily at NSP-Minnesota and higher conservation revenue and incentives.
Electric Revenues
|
(Millions of Dollars)
|
2009 vs. 2008
|
|||
|
Fuel and purchased power cost recovery
|
$ | (1,237 | ) | |
|
Trading
|
(73 | ) | ||
|
Estimated impact of weather
|
(26 | ) | ||
|
Retail sales decline (excluding weather impact)
|
(22 | ) | ||
|
Retail rate increases (Colorado, Minnesota, Texas, New Mexico and Wisconsin)
|
218 | |||
|
Conservation and DSM revenue and incentive (partially offset by expenses)
|
74 | |||
|
Non-fuel riders
|
22 | |||
|
MERP rider
|
17 | |||
|
2008 refund of nuclear refueling outage revenues due to change in recovery method
|
16 | |||
|
Transmission revenue
|
14 | |||
|
Sales mix and demand revenues
|
4 | |||
|
Other, net
|
15 | |||
|
Total decrease in electric revenue
|
$ | (978 | ) | |
2009 Comparison with 2008
— Electric revenues decreased due to lower fuel and purchased power costs, largely due to lower customer usage and lower commodity prices, lower trading and weather. This was partially offset by retail rate increases in Colorado, Minnesota, Texas, New Mexico and Wisconsin, higher conservation and non-fuel rider recovery, mostly from the RESA rider at PSCo and the TCRF rider at SPS.
Electric Margin
|
(Millions of Dollars)
|
2009 vs. 2008
|
|||
|
Retail rate increases (Colorado, Minnesota, Texas, New Mexico and Wisconsin)
|
$ | 218 | ||
|
Conservation and DSM revenue and incentive (partially offset by expenses)
|
74 | |||
|
Non-fuel riders
|
22 | |||
|
MERP rider
|
17 | |||
|
2008 refund of nuclear refueling outage revenues due to change in recovery method
|
16 | |||
|
NSP-Wisconsin fuel recovery
|
14 | |||
|
SPS 2008 fuel cost allocation regulatory accruals
|
12 | |||
|
Firm wholesale
|
11 | |||
|
Sales mix and demand revenues
|
4 | |||
|
Purchased capacity costs
|
(44 | ) | ||
|
Estimated impact of weather
|
(26 | ) | ||
|
Retail sales decline (excluding weather impact)
|
(22 | ) | ||
|
Other, net
|
2 | |||
|
Total increase in electric margin
|
$ | 298 | ||
2009 Comparison to 2008 — The increase in electric margin was due to electric rate increases in Colorado, Minnesota, Texas, New Mexico and Wisconsin, higher conservation and DSM revenue and non-fuel riders. This was partially offset by higher purchase capacity costs and a negative impact of weather.
Natural Gas Revenues and Margin
The cost of natural gas tends to vary with changing sales requirements and the cost of natural gas purchases. However, due to the design of purchased natural gas cost recovery mechanisms to recover current expenses for sales to retail customers, fluctuations in the cost of natural gas have little effect on natural gas margin. The following tables detail natural gas revenues and margin:
|
(Millions of Dollars)
|
2010
|
2009
|
2008
|
|||||||||
|
Natural gas revenues
|
$ | 1,783 | $ | 1,866 | $ | 2,443 | ||||||
|
Cost of natural gas sold and transported
|
(1,163 | ) | (1,266 | ) | (1,833 | ) | ||||||
|
Natural gas margin
|
$ | 620 | $ | 600 | $ | 610 | ||||||
Natural Gas Revenues
The following tables summarize the components of the changes in natural gas revenues and margin for the years ended Dec. 31:
|
(Millions of Dollars)
|
2010 vs. 2009
|
|||
|
Purchased natural gas adjustment clause recovery
|
$ | (100 | ) | |
|
Estimated impact of weather
|
(8 | ) | ||
|
Retail sales decrease (excluding weather impact)
|
(2 | ) | ||
|
Conservation and DSM revenue and incentive
|
18 | |||
|
Rate increase (Minnesota)
|
6 | |||
|
Other (including sales mix), net
|
3 | |||
|
Total decrease in natural gas revenues
|
$ | (83 | ) | |
2010 Comparison to 2009 —
Natural gas revenues decreased primarily due to lower natural gas costs in 2010, partially offset by higher conservation and DSM rates.
Natural Gas Margin
|
(Millions of Dollars)
|
2010 vs. 2009
|
|||
|
Conservation and DSM revenue and incentive (partially offset by expenses)
|
$ | 18 | ||
|
Rate increase (Minnesota)
|
6 | |||
|
Estimated impact of weather
|
(8 | ) | ||
|
Retail sales decrease (excluding weather impact)
|
(2 | ) | ||
|
Other, net
|
6 | |||
|
Total increase in natural gas margin
|
$ | 20 | ||
2010 Comparison to 2009 —
Natural gas margins increased mainly due to higher conservation and DSM rates in 2010.
Natural Gas Revenues
|
(Millions of Dollars)
|
2009 vs. 2008
|
|||
|
Purchased natural gas adjustment clause recovery
|
$ | (568 | ) | |
|
Estimated impact of weather
|
(10 | ) | ||
|
Conservation and DSM revenue and incentive
|
6 | |||
|
Other (including sales mix), net
|
(5 | ) | ||
|
Total decrease in natural gas revenues
|
$ | (577 | ) | |
2009 Comparison to 2008 —
Natural gas revenues decreased primarily due to lower natural gas costs in 2009, and the estimated impact of weather.
Natural Gas Margin
|
(Millions of Dollars)
|
2009 vs. 2008
|
|||
|
Estimated impact of weather
|
(10 | ) | ||
|
Conservation and DSM revenue and incentive (partially offset by expenses)
|
6 | |||
|
Other (including sales mix), net
|
(6 | ) | ||
|
Total decrease in natural gas margin
|
$ | (10 | ) | |
2009 Comparison to 2008 —
Natural gas margins decreased mainly due to milder than normal temperatures.
Non-Fuel Operating Expenses and Other Items
O&M Expenses
— O&M expenses increased by approximately $149.2 million, or 7.8 percent, for 2010 compared with 2009, and by $130.2 million, or 7.3 percent, for 2009 compared with 2008.
|
(Millions of Dollars)
|
2010 vs. 2009
|
|||
|
Higher plant generation costs
|
$ | 47 | ||
|
Higher labor costs
|
24 | |||
|
Higher nuclear plant operation costs
|
20 | |||
|
Higher contract labor costs
|
18 | |||
|
Higher employee benefit expense
|
15 | |||
|
Higher nuclear outage costs, net of deferral
|
10 | |||
|
Other, net
|
15 | |||
|
Total increase in operating and maintenance expenses
|
$ | 149 | ||
2010 Comparison to 2009 —
The increase in O&M expenses for 2010 was largely driven by the following:
|
|
●
|
Higher plant generation costs are primarily attributable to the timing of planned maintenance and overhaul work as well as incremental operating costs associated with new generation facilities placed in service in 2010.
|
|
|
●
|
Higher contract labor is primarily related to maintenance on our distribution facilities.
|
|
|
●
|
Higher nuclear plant operation costs are mainly due to increased labor and security expenses.
|
|
|
●
|
Higher labor costs are primarily due to higher overtime for storm restoration work and a shift in labor resources from capital to O&M projects.
|
|
|
●
|
Higher nuclear outage costs are due to the timing and higher cost of nuclear refueling outages.
|
|
|
●
|
Higher employee benefit costs for the year are primarily due to increased pension costs partially offset by lower health care costs.
|
|
(Millions of Dollars)
|
2009 vs. 2008
|
|||
|
Higher employee benefit expense
|
$ | 90 | ||
|
Nuclear outage costs, net of deferral
|
30 | |||
|
Higher nuclear plant operation costs
|
21 | |||
|
Higher plant generation costs
|
9 | |||
|
Higher labor costs
|
6 | |||
|
Lower consulting costs
|
(18 | ) | ||
|
Other, net
|
(8 | ) | ||
|
Total increase in operating and maintenance expenses
|
$ | 130 | ||
2009 Comparison to 2008 —
The increase in O&M expenses for 2009 was largely driven by the following:
|
|
●
|
Higher employee benefits costs are primarily attributable to 2009 employee performance based incentive compensation expenses, higher pension expenses and increased medical expenses. In 2008, no employee performance based incentive benefits were earned.
|
|
|
●
|
The increase in nuclear outage costs is due to the commissions’ approval of the change in the nuclear refueling outage recovery method from the direct expense method to the deferral and amortization method in 2008.
|
|
|
●
|
The increase in nuclear plant operation costs is driven primarily by an increase in security costs and regulatory fees, resulting from new NRC requirements.
|
|
|
●
|
Lower consulting costs are primarily the result of cost management initiatives achieved throughout 2009.
|
|
|
●
|
Lower uncollectible receivable costs are mainly due to improved collections and a decrease in natural gas prices.
|
Conservation and DSM Program Expenses
— Conservation and DSM program expenses increased by approximately $57.7 million for 2010 compared with 2009, and by approximately $64.4 million for 2009 compared with 2008. The higher expense is attributable to the continued expansion of programs and regulatory commitments. Conservation and DSM program expenses are generally recovered in our major jurisdictions concurrently through riders and base rates. Overall, the programs are designed to encourage the operating companies and their retail customers to conserve energy or change energy usage patterns in order to reduce peak demand on the gas or electric system. This, in turn, reduces the need for additional plant capacity, reduces emissions, serves to achieve other environmental goals as well as reduces energy costs to participating customers.
Depreciation and Amortization —
Depreciation and amortization expenses increased by approximately $40.8 million, or 5.0 percent, for 2010 compared with 2009. The change in depreciation expense is primarily due to Comanche Unit 3 going into service and normal system expansion.
Depreciation and amortization expenses decreased by $10.3 million, or 1.2 percent, for 2009 when compared with 2008. In 2009, NSP-Minnesota began recognizing a 10-year life extension of the Prairie Island nuclear plant for purposes of determining depreciation, as a result of the MPUC decision in the Minnesota electric rate case. In addition, in 2009, the MPUC extended the recovery period of decommissioning expense by 10 years for the Prairie Island and the Monticello nuclear plants. These decisions reduced depreciation and decommissioning expense in 2009. These decreases were partially offset by normal system expansion.
Taxes (Other Than Income Taxes) —
Taxes (other than income taxes) increased by approximately $25.5 million, or 8.3 percent, for 2010 compared with 2009. The increase is primarily due to an increase in property taxes in Colorado and Minnesota.
Taxes (other than income taxes) increased by approximately $19.9 million, or 6.9 percent, for 2009 compared with 2008. The increase was primarily due to increased property taxes across our jurisdictions.
Other Income (Expense), Net
— Other income (expense), net increased by $21.4 million for 2010 compared with 2009. The 2010 increase is primarily due to the COLI settlement in July 2010.
Other income (expense), net decreased by $30.6 million for 2009 compared with 2008. The net decline was mainly due to changes in non-qualified benefit plan liabilities related to market activity, lower interest on under recovered deferred fuel balances and a decrease in interest received from WYCO for construction deposits.
Equity Earnings of Unconsolidated Subsidiaries —
Equity earnings of unconsolidated subsidiaries increased by approximately $5.3 million for 2010 compared with 2009. The annual increase is primarily related to increased earnings from the equity investment in WYCO related to a natural gas storage facility that began operating in mid-2009.
Equity earnings of unconsolidated subsidiaries increased by approximately $21.1 million for 2009, compared with 2008. The increase was primarily due to increased earnings from the equity investment in WYCO, as a result of the High Plains natural gas pipeline, located in Colorado, which commenced operations in late 2008 as well as a gas storage facility that began operations in mid-2009.
AFUDC
— AFUDC decreased by approximately $30.7 million, for 2010 compared with 2009. The decrease is partially due to Comanche Unit 3 going into service in May 2010, as well as lower interest rates.
AFUDC increased by approximately $12.9 million, or 12.6 percent, for 2009 compared with 2008. The increase was due primarily to the construction of Comanche Unit 3, as well as other construction projects.
Interest Charges —
Interest charges increased by approximately $15.6 million, or 2.8 percent, for 2010 compared with 2009. The increase is due to higher long-term debt levels to fund investments in utility operations, partially offset by lower interest rates.
Interest charges increased by $8.7 million, or 1.6 percent, for 2009 compared with 2008. The increase was primarily the result of increased debt levels to fund new capital investments, partially offset by lower interest rates on short-term debt.
Income Taxes —
Income tax expense for continuing operations increased by $65.3 million for 2010 compared with 2009. The increase in income tax expense was primarily due to an increase in pretax income, and one time adjustments for a write-off of tax benefit previously recorded for Medicare Part D subsidies and an adjustment related to the COLI Tax Court proceedings. This was partially offset by a reversal of a valuation allowance for certain state tax credit carryovers. The effective tax rate for continuing operations was 36.7 percent for 2010 compared with 35.1 percent for 2009. The higher effective tax rate for 2010 was primarily due to the adjustments referenced above. The effective tax rate for ongoing earnings for 2010 was 35.3 percent.
Income tax expense for continuing operations increased by $32.6 million for 2009 compared with 2008. The increase in income tax expense was primarily due to an increase in pretax income. The ETR for continuing operations was 35.1 percent for 2009, compared with 34.4 percent for 2008. The higher ETR for 2009 was primarily due to the establishment of a valuation allowance against certain state tax credit carryovers that are now expected to expire prior to full utilization. Excluding this item, the ETR for 2009 would have been 34.6 percent.
Holding Company and Other Results
The following tables summarize the net income and earnings per share contributions of the continuing operations of Xcel Energy’s nonregulated businesses and Holding Company results:
|
Contribution to Xcel Energy
’
s Earnings
|
||||||||||||
|
(Millions of Dollars)
|
2010
|
2009
|
2008
|
|||||||||
|
Financing costs and preferred dividends — Holding Company
|
$ | (72.9 | ) | $ | (65.6 | ) | $ | (69.7 | ) | |||
|
Eloigne
|
5.4 | (4.7 | ) | 1.5 | ||||||||
|
Holding Company, taxes and other results
|
3.0 | 7.8 | 5.3 | |||||||||
|
Total Holding Company and other loss — continuing operations
|
$ | (64.5 | ) | $ | (62.5 | ) | $ | (62.9 | ) | |||
|
Contribution to Xcel Energy’s Earnings per Share
|
||||||||||||
|
(Earnings per Share)
|
2010
|
2009
|
2008
|
|||||||||
|
Financing costs and preferred dividends — Holding Company
|
$ | (0.16 | ) | $ | (0.14 | ) | $ | (0.15 | ) | |||
|
Eloigne
|
0.01 | (0.01 | ) | — | ||||||||
|
Holding Company, taxes and other results
|
0.01 | 0.01 | 0.01 | |||||||||
|
Total Holding Company and other loss per share — continuing operations
|
$ | (0.14 | ) | $ | (0.14 | ) | $ | (0.14 | ) | |||
Financing Costs and Preferred Dividends —
Holding Company and other results include interest expense and the earnings per share impact of preferred dividends, which are incurred at the Xcel Energy and intermediate holding company levels, and are not directly assigned to individual subsidiaries.
Eloigne —
Eloigne contributed income of $5.4 million in 2010, and a loss of approximately $4.7 million in 2009, both of which are primarily attributed to the sale of property.
Factors Affecting Results Operations
Xcel Energy’s utility revenues depend on customer usage, which varies with weather conditions, general business conditions and the cost of energy services. Various regulatory agencies approve the prices for electric and natural gas service within their respective jurisdictions and affect Xcel Energy’s ability to recover its costs from customers. The historical and future trends of Xcel Energy’s operating results have been, and are expected to be, affected by a number of factors, including those listed below.
General Economic Conditions
Economic conditions may have a material impact on Xcel Energy’s operating results. Management cannot predict the impact of a prolonged economic recession, fluctuating energy prices, terrorist activity, war or the threat of war. However, Xcel Energy could experience a material adverse impact to its results of operations, future growth or ability to raise capital resulting from a sustained general slowdown in future economic growth or a significant increase in interest rates.
Fuel Supply and Costs
Xcel Energy’s operating utilities have varying dependence on coal, natural gas and uranium. Changes in commodity prices are generally recovered through fuel recovery mechanisms and have very little impact on earnings. However, availability of supply, the potential implementation of a carbon tax and unanticipated changes in regulatory recovery mechanisms could impact our operations. See Item 1 for further discussion of fuel supply and costs.
Pension Plan Costs and Assumptions
Xcel Energy has significant net pension and postretirement benefit costs that are measured using actuarial valuations. Inherent in these valuations are key assumptions including discount rates and expected return on plan assets. Xcel Energy evaluates these key assumptions at least annually by analyzing current market conditions, which include changes in interest rates and market returns. Changes in the related net pension and postretirement benefits costs and funding requirements may occur in the future due to changes in assumptions. For further discussion and a sensitivity analysis on these assumptions, see “Employee Benefits” under Critical Accounting Policies and Estimates.
Regulation
FERC and State Regulation
—
The FERC and various state regulatory commissions regulate Xcel Energy’s utility subsidiaries. Decisions by these regulators can significantly impact Xcel Energy’s results of operations. Xcel Energy expects to periodically file for rate changes based on changing energy market and general economic conditions.
The electric and natural gas rates charged to customers of Xcel Energy’s utility subsidiaries are approved by the FERC and the regulatory commissions in the states in which they operate. The rates are generally designed to recover plant investment, operating costs and an allowed return on investment. Xcel Energy requests changes in rates for utility services through filings with the governing commissions. Because comprehensive general rate changes are not requested annually in some states, changes in operating costs can affect Xcel Energy’s financial results. In addition to changes in operating costs, other factors affecting rate filings are new investments, sales growth, which is affected by overall economic conditions, conservation and DSM efforts and the cost of capital. In addition, the ROE authorized is set by regulatory commissions in rate proceedings.
Wholesale Energy Market Regulation
—
Wholesale energy markets in the Midwest are operated by MISO to centrally dispatch all regional electric generation and apply a regional transmission congestion management system. MISO centrally issues bills and payments for many costs formerly incurred directly by NSP-Minnesota and NSP-Wisconsin. In January 2009, MISO implemented modifications to the original market to establish a regional ASM. The ASM provides further efficiencies in generation dispatch by allowing for regional regulation response and contingency reserve services through a bid-based market mechanism co-optimized with the original energy market. NSP-Minnesota and NSP-Wisconsin expect to recover MISO charges through either base rates or various recovery mechanisms. See Note 13 to the consolidated financial statements for further discussion.
Capital Expenditure Regulation
—
Xcel Energy’s utility subsidiaries make substantial investments in plant additions to build and upgrade power plants, and expand and maintain the reliability of the energy transmission and distribution systems. In addition to filing for increases in base rates charged to customers to recover the costs associated with such investments, the CPUC, MPUC, SDPUC and PUCT approved proposals to recover, through a rate rider, costs to upgrade generation plants and lower emissions, and/or increase transmission investment cost. These non-fuel rate riders are expected to provide significant cash flows to enable recovery of costs incurred on a timely basis. For wholesale electric transmission services, Xcel Energy has, consistent with FERC policy, implemented or proposed to establish formula rates for each of the utility subsidiaries that will provide annual rate changes as transmission investments increase in a manner similar to the rate riders.
Environmental Matters
Environmental costs include payments for nuclear plant decommissioning, storage and ultimate disposal of spent nuclear fuel, disposal of hazardous materials and waste, remediation of contaminated sites, monitoring of discharges to the environment and compliance with laws and permits with respect to Xcel Energy’s air emissions. A trend of greater environmental awareness and increasingly stringent regulation may continue to cause, higher operating expenses and capital expenditures for environmental compliance.
In addition to nuclear decommissioning and spent nuclear fuel disposal expenses, costs charged to operating expenses for environmental monitoring and disposal of hazardous materials and waste were approximately:
|
|
●
|
$256 million in 2010;
|
|
|
●
|
$225 million in 2009; and
|
|
|
●
|
$213 million in 2008.
|
Xcel Energy expects to expense an average of approximately $298 million per year from 2011 through 2015 for similar costs. However, the precise timing and amount of environmental costs, including those for site remediation and disposal of hazardous materials, are currently unknown. Additionally, the extent to which environmental costs will be included in and recovered through rates may fluctuate.
Capital expenditures for environmental improvements at regulated facilities were approximately:
|
|
●
|
$473 million in 2010;
|
|
|
●
|
$89 million in 2009; and
|
|
|
●
|
$230 million in 2008.
|
Xcel Energy expects to incur approximately $141 million in capital expenditures for compliance with environmental regulations and environmental improvements in 2011, and ranging from approximately $144 million to $301 million of related expenditures throughout the years from 2012 through 2015. Included in these amounts are expenditures to reduce emissions of generating plants in Minnesota and Colorado.
See Note 14 to the consolidated financial statements for further discussion of Xcel Energy’s environmental contingencies.
Air Emissions
Xcel Energy’s operations are subject to the CAA and similar state laws and regulations. These laws and regulations regulate air emissions from various sources, including electrical generating units, and impose certain monitoring and reporting requirements. Such laws and regulations may require that Xcel Energy obtain pre-approval for the construction or modification of certain projects that increase air emissions, obtain and strictly comply with air permits that contain emission and operational limitations or mandate the installation and operation of expensive pollution control equipment at facilities. Xcel Energy will likely be required to incur capital expenditures in the future to comply with these requirements.
Generating facilities throughout the Xcel Energy territory currently are subject to mercury reduction requirements only at the state level. In Minnesota, mercury emissions from two generating facilities, A.S. King and Sherco, are regulated by the Minnesota Mercury Legislation, which was promulgated in 2006 to provide a process for plans, implementation and cost recovery for utility efforts to curb mercury emissions at certain power plants. In Colorado, eight units are subject to a mercury emissions rule passed by the AQCC. Of those eight units, Xcel Energy only expects to install mercury emission controls on Pawnee Unit 1 by the end of 2011. The Pawnee mercury emission controls are included in the CACJA plan.
During 2008 through 2010, NSP-Minnesota completed sorbent control systems to reduce emissions at the Sherco Unit 3 and A.S. King generating plants. Following MPUC approval, such project costs were collected through the MCR rider.
In December 2009, NSP-Minnesota filed the plans for mercury control at Sherco Units 1 and 2 with the MPUC and the MPCA. In October 2010, the MPUC approved the plan, which will require installation of mercury controls on Sherco Units 1 and 2 by the end of 2014.
PSCo
In April 2010, the Colorado Legislature passed the CACJA. This legislation required PSCo to submit a plan to the CPUC to reduce NOx emissions by 70 to 80 percent from at least 900 MW of existing coal-fired generation by 2017. The purpose of the legislation was to develop a coordinated plan of emission reductions for utility boilers to comply with current and reasonably foreseeable CAA requirements such as regional haze, ozone nonattainment in the Denver, Colo. metropolitan area, control of hazardous air pollutants such as mercury and acid gases along with the reduction of GHG from power plant operations. In December 2010, the CPUC approved an emission reduction plan that included the retirement of several units, the conversion from coal to natural gas for two units and the addition of emission controls for NOx and SO
2
on three other units. The plan also includes the installation of two new natural gas combined-cycle units to replace the retired coal-fired boilers. Costs associated with implementing the plan are expected to be approximately $1.0 billion and are expected to be recovered through future rates with the plan fully implemented by the end of 2017. See further discussion in Public Utility Regulation.
The EPA has required states to develop SIPs to comply with regional haze BART requirements, which included identification of facilities that will have to reduce SO
2
, NOx and particulate matter emissions under BART and then set BART emissions limits for those facilities. The AQCC promulgated BART regulations requiring certain major stationary sources to evaluate and install, operate and maintain emission controls meeting BART to make reasonable progress toward meeting the national visibility goal. The combination of plant retirements and the installation of emission controls resulting from the approved CACJA emission control plan noted above will be incorporated into the regional haze SIP for Colorado as a BART alternative. As discussed above, the state of Colorado will submit the final regional haze SIP to the EPA for its review in early 2011.
Inflation
Inflation at its current level is not expected to materially affect Xcel Energy’s prices or returns to shareholders. However, potential future inflation resulting from the economic and monetary stimulus policies of the U.S. Government and the Federal Reserve could lead to future price increases for materials and services required to deliver electric and natural gas services to customers. These potential cost increases could in turn lead to increased prices to customers.
CRITICAL ACCOUNTING POLICIES AND ESTIMATES
Preparation of the consolidated financial statements and related disclosures in compliance with GAAP requires the application of accounting rules and guidance, as well as the use of estimates. The application of these policies necessarily involves judgments regarding future events, including the likelihood of success of particular projects, legal and regulatory challenges and anticipated recovery of costs. These judgments could materially impact the consolidated financial statements and disclosures, based on varying assumptions. In addition, the financial and operating environment also may have a significant effect on the operation of the business and on the results reported even if the nature of the accounting policies applied have not changed. The following is a list of accounting policies that are most critical to the portrayal of Xcel Energy’s financial condition and results, and that require management’s most difficult, subjective or complex judgments. Each of these has a higher potential likelihood of resulting in materially different reported amounts under different conditions or using different assumptions. Each critical accounting policy has been discussed with the Audit Committee of the Xcel Energy Board of Directors.
Regulatory Accounting
Xcel Energy is a holding company with rate-regulated subsidiaries that are subject to the accounting for Regulated Operations
,
which provides that rate-regulated entities account for and report assets and liabilities consistent with the recovery of those incurred costs in rates, if the rates established are designed to recover the costs of providing the regulated service and if the competitive environment makes it probable that such rates could be charged and collected. Xcel Energy’s rates are derived through the ratemaking process, which results in the recording of regulatory assets and liabilities based on the probability of current and future cash flows. Regulatory assets represent incurred or accrued costs that have been deferred because they are probable of future recovery from customers.
Regulatory liabilities represent amounts that are expected to be refunded to customers in future rates or amounts collected in current rates for future costs. In other businesses or industries, regulatory assets would be charged to expense and regulatory liabilities would be recorded as income.
As of Dec. 31, 2010 and 2009, Xcel Energy has recorded regulatory assets of approximately $2.5 billion and $2.3 billion and regulatory liabilities of approximately $1.3 billion and $1.3 billion, respectively. Each subsidiary is subject to regulation that varies from jurisdiction to jurisdiction. If future recovery of costs, in any such jurisdiction, ceases to be probable, Xcel Energy would be required to charge these assets to current earnings. While there are no current or expected proposals or changes in the regulatory environment that impact the probability of future recovery of these assets, if the SEC should mandate the use of international financial accounting standards (IFRS) the lack of an accounting standard for rate-regulated entities under IFRS could require us to charge incurred regulatory assets to earnings and regulatory liabilities to income. See Note 16 to the consolidated financial statements for further discussion of regulatory assets and liabilities.
Income Tax Accruals
Judgment, uncertainty, and estimates are a significant aspect of the income tax accrual process that accounts for the effects of current and deferred income taxes. Uncertainty associated with the application of tax statutes and regulations and the outcomes of tax audits and appeals require that judgment and estimates be made in the accrual process and in the calculation of the ETR.
ETRs are also highly impacted by assumptions. ETR calculations are revised every quarter based on best available year-end tax assumptions (income levels, deductions, credits, etc.) by legal entity; adjusted in the following year after returns are filed, with the tax accrual estimates being trued-up to the actual amounts claimed on the tax returns; and further adjusted after examinations by taxing authorities have been completed.
In accordance with the interim reporting guidance, a tax expense or benefit is recorded every quarter to eliminate the difference in continuing operations tax expense computed based on the actual year-to-date ETR and the forecasted annual ETR.
Accounting for income taxes also requires that only tax benefits that meet the “more likely than not” recognition threshold can be recognized or continue to be recognized. The change in the unrecognized tax benefits needs to be reasonably estimated based on evaluation of the nature of uncertainty, the nature of event that could cause the change and an estimated range of reasonably possible changes. At any period end, and as new developments occur, management will use prudent business judgment to unrecognize appropriate amounts of tax benefits. Unrecognized tax benefits can be recognized as issues are favorably resolved and loss exposures decline.
As disputes with the IRS and state tax authorities are resolved over time, we may need to adjust our unrecognized tax benefits and interest accruals to the updated estimates needed to satisfy tax and interest obligations for the related issues. These adjustments may be favorable or unfavorable, increasing or decreasing earnings. See Note 6 to the consolidated financial statements for further discussion.
Employee Benefits
Xcel Energy’s pension costs are based on an actuarial calculation that includes a number of key assumptions, most notably the annual return level that pension investment assets will earn in the future and the interest rate used to discount future pension benefit payments to a present value obligation for financial reporting. In addition, the actuarial calculation uses an asset-smoothing methodology to reduce the volatility of varying investment performance over time. See Note 9 to the consolidated financial statements for further discussion on the rate of return and discount rate used in the calculation of pension costs and obligations.
Pension costs and funding requirements are expected to increase in the next few years. While investment returns exceeded the assumed levels from 2004-2006 and during 2009-2010, investment returns in 2007 and 2008 were significantly below the assumed levels. The investment gains or losses resulting from the difference between the expected pension returns and actual returns earned are deferred in the year the difference arises and are recognized over the expected average remaining years of service for active employees. Based on current assumptions and the recognition of past investment gains and losses, Xcel Energy currently projects that the pension costs recognized for financial reporting purposes will increase from an expense of $12.9 million in 2009 and an expense of $47.8 million in 2010 to an expense of approximately $79.2 million in 2011 and expense of approximately $113.1 million in 2012. The expected increase in the 2011 expense is due to the continued phase in of unrecognized plan losses primarily resulting from the market decline in 2008.
Xcel Energy set the discount rate used to value the Dec. 31, 2010 pension and postretirement health care obligations at 5.5 percent, which is a 50 basis point decrease from Dec. 31, 2009. Xcel Energy uses multiple reference points in determining the discount rate, including Citigroup Pension Liability Discount Curve, the Citigroup Above Median Curve and bond matching studies. At Dec. 31, 2010, the above reference points supported the selected rate. In addition to the reference points utilized above, Xcel Energy also reviews general survey data provided by our actuaries to assess the reasonableness of the discount rate selected.
The Pension Protection Act changed the minimum funding requirements for defined benefit pension plans beginning in 2008.
|
|
●
|
Xcel Energy accelerated its planned 2010 contribution of $100 million based on available liquidity, bringing its total pension contributions to $200 million during 2009.
|
|
|
●
|
In 2010, Xcel Energy voluntarily contributed $34 million to one of its pension plans.
|
|
|
●
|
In January 2011, Xcel Energy contributed $134 million, allocated across three of its pension plans. The January 2011 contribution raised the overall funded status from 84 percent at Dec. 31, 2010 to 88 percent with all other pension assumptions remaining constant. At this time, no additional contributions are planned for 2011.
|
|
|
●
|
Projected pension funding contributions for 2012, which will be dependent on several factors including realized asset performance, future discount rate, IRS and legislative initiatives as well as other actuarial assumptions, are estimated to range between $150 million to $175 million.
|
|
|
●
|
For future years, we anticipate contributions will be made to avoid benefit restrictions and at-risk status.
|
These expected contributions are summarized in Note 9 to the consolidated financial statements. These amounts are estimates and may change based on actual market performance, changes in interest rates and any changes in governmental regulations. Therefore, additional contributions could be required in the future. However, all pension costs are expected to be recoverable in rates.
If Xcel Energy were to use alternative assumptions at Dec. 31, 2010, a one-percent change would result in the following impact on pension expense:
|
Pension Costs
|
||||||||
|
(Millions of Dollars)
|
+1%
|
-1%
|
||||||
|
Rate of return
|
$ | (30.2 | ) | $ | 30.6 | |||
|
Discount rate
|
(13.8 | ) | 14.4 | |||||
Effective Dec. 31, 2010, Xcel Energy reduced its initial medical trend assumption from 6.8 percent to 6.5 percent. The ultimate trend assumption remained unchanged at 5.0 percent. The period until the ultimate rate is reached increased from three years to eight years. Xcel Energy bases its medical trend assumption on the long-term cost inflation expected in the health care market, considering the levels projected and recommended by industry experts, as well as recent actual medical cost increases experienced by Xcel Energy’s retiree medical plan.
|
|
●
|
Xcel Energy contributed $62.2 million and $48.4 million during 2009 and 2010, respectively, to the postretirement health care plans.
|
|
|
●
|
Xcel Energy expects to contribute approximately $40.5 million during 2011.
|
Xcel Energy recovers employee benefits costs in its regulated utility operations consistent with accounting guidance with the exception of the areas noted below.
|
|
●
|
NSP-Minnesota recognizes pension expense in all regulatory jurisdictions based on expense as calculated using the aggregate normal cost actuarial method. Differences between aggregate normal cost and expense as calculated under accounting guidance are deferred as a regulatory liability.
|
|
|
●
|
Colorado, Texas, New Mexico and FERC jurisdictions allow the recovery of other post retirement benefit costs only to the extent that recognized expense is matched by cash contributions to an irrevocable trust. The company has consistently funded at a level to allow full recovery of costs in these jurisdictions.
|
See Note 9 to the consolidated financial statements for further discussion.
Nuclear Decommissioning
NSP-Minnesota owns nuclear generation facilities and regulations require NSP-Minnesota to decommission its nuclear power plants after each facility is taken out of service. Xcel Energy records future plant removal obligations as a liability at fair value. This liability will be increased over time by applying the interest method of accretion to the liability. Due to regulation, depreciation expense is recorded to match the recovery of the future cost of decommissioning, or retirement, of its nuclear generating plants. This recovery is calculated using an annuity approach designed to provide for full rate recovery of the future decommissioning costs.
Amounts recorded for nuclear AROs, in excess of decommissioning expense and investment returns, both realized and unrealized, cumulatively are deferred through the establishment of a regulatory asset for future recovery.
A portion of the rates charged to customers is deposited into an external trust fund, during the facilities’ operating lives, in order to provide for this obligation. The fair value of external nuclear decommissioning trust fund investments are generally estimated based on quoted market prices for those or similar investments. The fair values for commingled funds and international equity funds within the nuclear decommissioning fund take into consideration the value of underlying fund investments. Realized investment returns from these investments and recovery to date is used by regulators when determining future decommissioning recovery.
NSP-Minnesota conducts periodic decommissioning cost studies to estimate the costs that will be incurred to decommission the facilities. The costs are initially presented in amounts prior to inflation adjustments and then inflated to future periods using decommissioning specific cost inflators. Decommissioning of NSP-Minnesota’s nuclear facilities is planned for the period from cessation of operations through 2067 assuming the prompt dismantlement method. The following key assumptions have a significant effect on these estimates:
|
|
●
|
Escalation Rate
— The MPUC determines the escalation rate based on various presumptions surrounded by the fact that associated costs will escalate at a certain rate over time. The most recent decommissioning study set the escalation rate at 2.89 percent. An escalation rate for the cost of disposing of nuclear fuel waste was set at 6.0 percent. Over the short-term, these rates can differ from the set rates and accrual estimates can be significantly affected by small changes in assumed escalation rates.
|
|
|
●
|
Life Extension
— Currently, decommissioning recovery periods end in 2030 for Monticello and in 2023 and 2024 for Prairie Island’s two facilities. Changes made to decommissioning cost estimates, the escalation rate and the earnings rate can be affected by changes to these life periods. With the recent re-licensing of Monticello and the application for the re-licensing of Prairie Island, any change in license life could have a material effect on the accrual. Current decommissioning cost calculations for Monticello have assumed full life extension, which brings the regulatory recovery period up to 2030. An application to extend the operating licenses for both reactors at Prairie Island by 20 years was submitted to the NRC in 2008. The NRC is expected to decide on the application in 2011. Prairie Island’s operating license would be extended to 2033 and 2034 if life extension is approved. In the interim, the MPUC has extended the recovery period for Prairie Island Unit 1 to 2023 and Unit 2 to 2024. These changes were effective Jan. 1, 2009.
|
|
|
●
|
Cost Estimate with Spent Fuel Disposal
— Federal regulations require the DOE to provide a permanent repository for the storage of spent nuclear fuel. NSP-Minnesota has funded its portion of the DOE’s permanent disposal program since 1981. The spent fuel storage assumptions have a significant influence on the decommissioning cost estimate. The manner in which spent nuclear fuel is managed and the assumptions used to develop cost estimates of decommissioning programs have a dramatic impact, which in turn can have a corresponding impact on the resulting accrual.
|
The decommissioning calculation covers all expenses, including decontamination and removal of radioactive material, and extends over the estimated lives of the plants. The total obligation for decommissioning currently is expected to be funded 100 percent by a portion of the rates charged to customers, as approved by the MPUC and other commissions. Decommissioning expense recoveries are based upon the same assumptions and methodologies as the fair value obligations are recorded.
In addition to these assumptions discussed previously, assumptions related to future earnings of the nuclear decommissioning fund are utilized by the MPUC in determining the recovery of decommissioning costs. Through utilization of the annuity approach, an assumed rate of return on funding is calculated which provides the earnings rate. With a long period of decommissioning and a funding period over the operating lives of each facility, the ability of the fund to sustain the required payments after inflation while assuring the appropriate investment structure is critical for meeting future decommissioning obligations. Currently, an assumption that the external funds will earn a return of 6.3 percent, after tax, is utilized when setting recovery by the MPUC.
Significant uncertainties exist in estimating the future cost of decommissioning including the method to be utilized, the ultimate costs to decommission, and the planned treatment of spent fuel. Materially different results could be obtained if different assumptions were utilized. Currently, our estimates of future decommissioning costs and the obligation to retire the plants have a significant impact to our financial position. The amounts recorded for AROs and regulatory assets for unrecovered costs are $969.3 million and $150.9 million, respectively, as of Dec. 31, 2010, and $881.5 million and $207.0 million, respectively, as of Dec. 31, 2009. If different cost estimates, shorter life assumptions or different cost escalation rates were utilized, this ARO and the unrecovered balance in regulatory assets could change materially. If future earnings on the decommissioning fund are lower than those estimated currently, future decommissioning recoveries would need to increase. The significance to our results of operations is reduced due to the fact that we record decommissioning expense based upon recovery amounts approved by our regulators. This treatment reduces the volatility of expense over time. The difference between regulatory funding (including both depreciation expense less returns from the investments fund) and amounts recorded under current accounting guidance are deferred as a regulatory asset. See Note 15 to the consolidated financial statements for further discussion.
Xcel Energy continually makes judgments and estimates related to these critical accounting policy areas, based on an evaluation of the varying assumptions and uncertainties for each area. The information and assumptions underlying many of these judgments and estimates will be affected by events beyond the control of Xcel Energy, or otherwise change over time. This may require adjustments to recorded results to better reflect the events and updated information that becomes available. The accompanying financial statements reflect management’s best estimates and judgments of the impact of these factors as of Dec. 31, 2010. See Note 1 to the consolidated financial statements for further discussion.
Recent and Pending Accounting Changes
Consolidation of Variable Interest Entities
— In June 2009, the FASB issued new guidance on consolidation of variable interest entities. The guidance affects various elements of consolidation, including the determination of whether an entity is a variable interest entity and whether an enterprise is a variable interest entity’s primary beneficiary. These updates to the ASC were effective for interim and annual periods beginning after Nov. 15, 2009. Xcel Energy implemented the guidance on Jan. 1, 2010, and the implementation did not have a material impact on its consolidated financial statements. See Note 14 to the consolidated financial statements for further discussion and required disclosures regarding variable interest entities.
Fair Value Measurement Disclosures
— In January 2010, the FASB issued
Fair Value Measurements and Disclosures (Topic 820) — Improving Disclosures about Fair Value Measurements (ASU No. 2010-06)
, which updates the Codification to require new disclosures for assets and liabilities measured at fair value. The requirements include expanded disclosure of valuation methodologies for fair value measurements, transfers between levels of the fair value hierarchy, and gross rather than net presentation of certain changes in Level 3 fair value measurements. The updates to the Codification contained in ASU No. 2010-06 were effective for interim and annual periods beginning after Dec. 15, 2009, except for requirements related to gross presentation of certain changes in Level 3 fair value measurements, which are effective for interim and annual periods beginning after Dec. 15, 2010. Xcel Energy implemented the portions of the guidance required on Jan. 1, 2010, and the implementation did not have a material impact on its consolidated financial statements. See Note 11 to the consolidated financial statements for further discussion and required disclosures.
Derivatives, Risk Management and Market Risk
In the normal course of business, Xcel Energy and its subsidiaries are exposed to a variety of market risks. Market risk is the potential loss or gain that may occur as a result of changes in the market or fair value of a particular instrument or commodity. All financial and commodity-related instruments, including derivatives, are subject to market risk. See Note 11 to the consolidated financial statements for further discussion of market risks associated with derivatives.
Xcel Energy is exposed to the impact of changes in price for energy and energy related products, which is partially mitigated by Xcel Energy’s use of commodity derivatives. Though no material non-performance risk currently exists with the counterparties to Xcel Energy’s commodity derivative contracts, distress in the financial markets may in the future impact that risk to the extent it impacts those counterparties. Distress in the financial markets may also impact the fair value of the debt and equity securities in the nuclear decommissioning fund and master pension trust, as well as Xcel Energy’s ability to earn a return on short-term investments of excess cash.
Commodity Price Risk —
Xcel Energy’s utility subsidiaries are exposed to commodity price risk in their electric and natural gas operations. Commodity price risk is managed by entering into long- and short-term physical purchase and sales contracts for electric capacity, energy and energy-related products and for various fuels used in generation and distribution activities. Commodity price risk is also managed through the use of financial derivative instruments. Xcel Energy’s risk management policy allows it to manage commodity price risk within each rate-regulated operation to the extent such exposure exists.
Short-Term Wholesale and Commodity Trading Risk —
Xcel Energy’s utility subsidiaries conduct various short-term wholesale and commodity trading activities, including the purchase and sale of electric capacity, energy and energy-related instruments. Xcel Energy’s risk management policy allows management to conduct these activities within guidelines and limitations as approved by its risk management committee, which is made up of management personnel not directly involved in the activities governed by this policy.
Changes in the fair value of commodity trading contracts before the impacts of margin-sharing mechanisms for the years ended Dec. 31, were as follows:
|
(Thousands of Dollars)
|
2010
|
2009
|
||||||
|
Fair value of commodity trading net contract assets outstanding at Jan. 1
|
$ | 9,628 | $ | 4,169 | ||||
|
Contracts realized or settled during the period
|
(4,449 | ) | (21,740 | ) | ||||
|
Commodity trading contract additions and changes during period
|
15,070 | 27,199 | ||||||
|
Fair value of commodity trading net contract assets outstanding at Dec. 31
|
$ | 20,249 | $ | 9,628 | ||||
At Dec. 31, 2010, the fair values by source for the commodity trading net asset balance were as follows:
|
Futures / Forwards
|
||||||||||||||||||||||||
|
Maturity
|
Maturity
|
Total Futures/
|
||||||||||||||||||||||
|
Source of
|
Less Than
|
Maturity
|
Maturity
|
Greater Than
|
Forwards
|
|||||||||||||||||||
|
(Thousands of Dollars)
|
Fair Value
|
1 Year
|
1 to 3 Years
|
4 to 5 Years
|
5 Years
|
Fair Value
|
||||||||||||||||||
|
NSP-Minnesota
|
1 | $ | 5,914 | $ | 11,523 | $ | 976 | $ | — | $ | 18,413 | |||||||||||||
|
PSCo
|
1 | 573 | 1,245 | — | — | 1,818 | ||||||||||||||||||
| $ | 6,487 | $ | 12,768 | $ | 976 | $ | — | $ | 20,231 | |||||||||||||||
|
Options
|
||||||||||||||||||||||||
|
Maturity
|
Maturity
|
|||||||||||||||||||||||
|
Source of
|
Less Than
|
Maturity
|
Maturity
|
Greater Than
|
Total Options
|
|||||||||||||||||||
|
(Thousands of Dollars)
|
Fair Value
|
1 Year
|
1 to 3 Years
|
4 to 5 Years
|
5 Years
|
Fair Value
|
||||||||||||||||||
|
NSP-Minnesota
|
2 | $ | 18 | $ | — | $ | — | $ | — | $ | 18 | |||||||||||||
| $ | 18 | $ | — | $ | — | $ | — | $ | 18 | |||||||||||||||
1 — Prices actively quoted or based on actively quoted prices.
2 — Prices based on models and other valuation methods. These represent the fair value of positions calculated using internal models when directly and
indirectly quoted external prices or prices derived from external sources are not available. Internal models incorporate the use of options pricing and estimates of the present value of cash flows based upon underlying contractual terms. The models reflect management’s estimates, taking into account observable market prices, estimated market prices in the absence of quoted market prices, the risk-free market discount rate, volatility factors, estimated correlations of commodity prices and contractual volumes. Market price uncertainty and other risks also are factored into the models.
Normal purchases and sales transactions, as defined by the accounting guidance for derivatives and hedging, hedge transactions and certain other long-term power purchase contracts are not included in the fair values by source tables as they are not recorded at fair value as part of commodity trading operations.
At Dec. 31, 2010, a 10 percent increase in market prices over the next 12 months for commodity trading contracts would increase pretax income from continuing operations by approximately $0.1 million, whereas a 10 percent decrease would decrease pretax income from continuing operations by approximately $0.1 million.
Xcel Energy’s short-term wholesale and commodity trading operations measure the outstanding risk exposure to price changes on transactions, contracts and obligations that have been entered into, but not closed, using an industry standard methodology known as Value at Risk (VaR). VaR expresses the potential change in fair value on the outstanding transactions, contracts and obligations over a particular period of time under normal market conditions. The VaRs for the NSP-Minnesota and PSCo commodity trading operations, calculated on a consolidated basis using a Monte Carlo simulation with a 95 percent confidence level and a one-day holding period, were as follows:
|
Year Ended
|
||||||||||||||||||||
|
(Millions of Dollars)
|
Dec. 31
|
VaR Limit
|
Average
|
High
|
Low
|
|||||||||||||||
|
2010
|
$ | 0.15 | $ | 3.00 | $ | 0.22 | $ | 0.64 | $ | 0.03 | ||||||||||
|
2009
|
0.50 | 5.00 | 0.44 | 2.02 | 0.06 | |||||||||||||||
Interest Rate Risk
— Xcel Energy and its subsidiaries are subject to the risk of fluctuating interest rates in the normal course of business. Xcel Energy’s risk management policy allows interest rate risk to be managed through the use of fixed rate debt, floating rate debt and interest rate derivatives such as swaps, caps, collars and put or call options.
At Dec. 31, 2010, a 100-basis-point change in the benchmark rate on Xcel Energy’s variable rate debt would impact pretax interest expense by approximately $4.7 million annually. See Note 11 to the consolidated financial statements for a discussion of Xcel Energy and its subsidiaries’ interest rate derivatives.
Xcel Energy also maintains a nuclear decommissioning fund, as required by the NRC. The nuclear decommissioning fund is subject to interest rate risk and equity price risk. At Dec. 31, 2010, the fund was invested in a diversified portfolio of cash equivalents, debt securities, equity securities, and other funds. These funds may be used only for activities related to nuclear decommissioning. The accounting for nuclear decommissioning recognizes that costs are recovered through rates; therefore, fluctuations in equity prices or interest rates do not have an impact on earnings.
Credit Risk —
Xcel Energy and its subsidiaries are also exposed to credit risk. Credit risk relates to the risk of loss resulting from counterparties’ nonperformance on their contractual obligations. Xcel Energy and its subsidiaries maintain credit policies intended to minimize overall credit risk and actively monitor these policies to reflect changes and scope of operations.
At Dec. 31, 2010, a 10 percent increase in prices would have resulted in an increase in credit exposure of $72.4 million, while a decrease of 10 percent in prices would have resulted in a decrease in credit exposure of $0.1 million.
Xcel Energy and its subsidiaries conduct standard credit reviews for all counterparties. Xcel Energy employs additional credit risk control mechanisms when appropriate, such as letters of credit, parental guarantees, standardized master netting agreements and termination provisions that allow for offsetting of positive and negative exposures. Credit exposure is monitored and, when necessary, the activity with a specific counterparty is limited until credit enhancement is provided. Distress in the financial markets could increase Xcel Energy’s credit risk.
Fair Value Measurements
Xcel Energy follows accounting and disclosure guidance on fair value measurements that contains a hierarchy for inputs used in measuring fair value and generally requires that the most observable inputs available be used for fair value measurements. See Note 11 to the consolidated financial statements for further discussion of the fair value hierarchy and the amounts of assets and liabilities measured at fair value that have been assigned to Level 3.
Commodity Derivatives
— Xcel Energy continuously monitors the creditworthiness of the counterparties to its commodity derivative contracts and assesses each counterparty’s ability to perform on the transactions set forth in the contracts. Given this assessment and the typically short duration of these contracts, the impact of discounting commodity derivative assets for counterparty credit risk was not material to the fair value of commodity derivative assets at Dec. 31, 2010. Adjustments to fair value for credit risk of commodity trading instruments are recorded in electric revenues when necessary. Credit risk adjustments for other commodity derivative instruments are deferred as OCI or regulatory assets and liabilities. The classification as a regulatory asset or liability is based on commission approved regulatory recovery mechanisms. Xcel Energy also assesses the impact of its own credit risk when determining the fair value of commodity derivative liabilities. The impact of discounting commodity derivative liabilities for credit risk was immaterial to the fair value of commodity derivative liabilities at Dec. 31, 2010.
Commodity derivative assets and liabilities assigned to Level 3 consist primarily of FTRs, as well as forwards and options that are either long-term in nature or related to commodities and delivery points with limited observability. Level 3 commodity derivative assets represent an immaterial percentage of total assets measured at fair value at Dec. 31, 2010. Level 3 commodity derivative liabilities represent 2.3 percent of total liabilities measured at fair value at Dec. 31, 2010.
Determining the fair value of FTRs requires numerous management forecasts that vary in observability, including various forward commodity prices, retail and wholesale demand, generation and resulting transmission system congestion. Given the limited observability of management’s forecasts for several of these inputs, these instruments have been assigned a Level 3. Level 3 commodity derivatives assets and liabilities include $3.6 million and $1.2 million of estimated fair values, respectively, for FTRs held at Dec. 31, 2010.
Determining the fair value of certain commodity forwards and options can require management to make use of subjective forward price and volatility forecasts for commodities and delivery locations with limited observability, or subjective forecasts which extend to periods beyond those readily observable on active exchanges or quoted by brokers. When less observable forward price and volatility forecasts are significant to determining the value of commodity forwards and options, these instruments are assigned to Level 3.
There were no Level 3 commodity forwards or options held at Dec. 31, 2010.
Nuclear Decommissioning Fund
— Nuclear decommissioning fund assets assigned to Level 3 consist of asset-backed and mortgage-backed securities. To the extent appropriate, observable market inputs are utilized to estimate the fair value of these securities; however, less observable and subjective inputs are often significant to these valuations, including risk-based adjustments to the interest rate used to discount expected future cash flows, which include estimated prepayments of principal. Therefore, estimated fair values for all asset-backed and mortgage-backed securities totaling $105.8 million in the nuclear decommissioning fund at Dec. 31, 2010 (approximately 7.6 percent of total assets measured at fair value), are assigned to Level 3. Realized and unrealized gains and losses on nuclear decommissioning fund investments are deferred as a component of a regulatory asset for nuclear decommissioning.
Liquidity and Capital Resources
Cash Flows
|
(Millions of Dollars)
|
2010
|
2009
|
2008
|
|||||||||
|
Cash provided by operating activities
|
$ | 1,894 | $ | 1,913 | $ | 1,688 | ||||||
Cash provided by operating activities decreased by $19 million for 2010 as compared to 2009.
The decrease is primarily due to changes in working capital partially offset by higher net income and lower pension contributions made in 2010.
Cash provided by operating activities increased by $225 million for 2009 as compared to 2008. The increase was primarily attributable to higher net income, changes in working capital due to the timing of accounts receivable, accounts payable and inventory as a result of natural gas prices and an increase in plant-related deferred income taxes. The increase was partially offset by increased pension contributions made in 2009 and higher AFUDC due primarily to the construction of Comanche Unit 3, a power facility located in Colorado.
|
(Millions of Dollars)
|
2010
|
2009
|
2008
|
|||||||||
|
Cash used in investing activities
|
$ | (2,807 | ) | $ | (1,735 | ) | $ | (2,157 | ) | |||
Cash used in investing activities increased by $1.1 billion during 2010, primarily due to the acquisition of two natural-gas fired generation facilities and increased investment in utility operations primarily at PSCo, including the completion of Comanche Unit 3.
Cash used in investing activities decreased by $422 million during 2009, primarily due to reduced capital expenditures; a withdrawal of funds, to refund customers, from the external decommissioning fund as approved by the MPUC; as well as reduced investment in the WYCO natural gas pipeline and storage project. No cash was provided by investing activities for discontinued operations.
|
(Millions of Dollars)
|
2010
|
2009
|
2008
|
|||||||||
|
Cash provided by (used in) financing activities
|
$ | 906 | $ | (322 | ) | $ | 671 | |||||
Cash provided by financing activities increased by $1.2 billion during 2010. The increase was primarily attributable to higher proceeds from the issuance of long-term debt and common stock.
Cash used in financing activities increased by $993 million during 2009, primarily due to lower proceeds from the issuances of long-term debt and common stock and an increase in dividends, partially offset by lower repayments of short-term borrowings.
See discussion of trends, commitments and uncertainties with the potential for future impact on cash flow and liquidity under Capital Sources.
Capital Requirements
Utility Capital Expenditures —
The estimated cost of the capital expenditure programs of Xcel Energy and its subsidiaries, excluding discontinued operations, and other capital requirements for the years 2011 through 2015 are shown in the tables below.
|
(Millions of Dollars)
|
2011
|
2012
|
2013
|
2014
|
2015
|
|||||||||||||||
|
By Subsidiary
|
||||||||||||||||||||
|
NSP-Minnesota
|
$ | 1,300 | $ | 1,080 | $ | 1,470 | $ | 1,290 | $ | 1,090 | ||||||||||
|
PSCo
|
700 | 820 | 920 | 880 | 760 | |||||||||||||||
|
SPS
|
300 | 280 | 450 | 420 | 530 | |||||||||||||||
|
NSP-Wisconsin
|
150 | 170 | 160 | 210 | 170 | |||||||||||||||
|
Total capital expenditures
|
$ | 2,450 | $ | 2,350 | $ | 3,000 | $ | 2,800 | $ | 2,550 | ||||||||||
|
By Function
|
2011
|
2012
|
2013
|
2014
|
2015
|
|||||||||||||||
|
Electric generation
|
$ | 700 | $ | 700 | $ | 1,120 | $ | 945 | $ | 740 | ||||||||||
|
Electric transmission
|
450 | 705 | 960 | 865 | 870 | |||||||||||||||
|
Electric distribution
|
400 | 445 | 460 | 450 | 455 | |||||||||||||||
|
Wind
generation
|
400 | — | — | — | — | |||||||||||||||
|
Natural gas
|
200 | 175 | 215 | 215 | 170 | |||||||||||||||
|
Nuclear fuel
|
100 | 155 | 95 | 145 | 140 | |||||||||||||||
|
Common and other
|
200 | 170 | 150 | 180 | 175 | |||||||||||||||
|
Total capital expenditures
|
$ | 2,450 | $ | 2,350 | $ | 3,000 | $ | 2,800 | $ | 2,550 | ||||||||||
|
By Project
|
2011
|
2012
|
2013
|
2014
|
2015
|
|||||||||||||||
|
Base and other capital expenditures
|
$ | 1,500 | $ | 1,485 | $ | 1,575 | $ | 1,640 | $ | 1,785 | ||||||||||
|
NSP-Minnesota wind generation
|
400 | — | — | — | — | |||||||||||||||
|
Nuclear capacity increases and life extension
|
200 | 80 | 240 | 105 | 100 | |||||||||||||||
|
Nuclear fuel
|
100 | 155 | 95 | 145 | 140 | |||||||||||||||
|
PSCo CACJA
|
100 | 170 | 330 | 245 | 140 | |||||||||||||||
|
CapX2020
|
70 | 190 | 330 | 290 | 145 | |||||||||||||||
|
RES and infrastructure investments
|
70 | 150 | 200 | 185 | 205 | |||||||||||||||
|
Black Dog repowering
|
10 | 120 | 230 | 190 | 35 | |||||||||||||||
|
Total capital expenditures
|
$ | 2,450 | $ | 2,350 | $ | 3,000 | $ | 2,800 | $ | 2,550 | ||||||||||
The capital expenditure programs of Xcel Energy are subject to continuing review and modification. Actual utility construction expenditures may vary from the estimates due to changes in electric and natural gas projected load growth, regulatory decisions, legislative initiatives, reserve margins, the availability of purchased power, alternative plans for meeting Xcel Energy’s long-term energy needs, compliance with future environmental requirements and RPS to install emission-control equipment, and merger, acquisition and divestiture opportunities to support corporate strategies may impact actual capital requirements.
Contractual Obligations and Other Commitments
— Xcel Energy has contractual obligations and other commitments that will need to be funded in the future, in addition to its capital expenditure programs. The following is a summarized table of contractual obligations and other commercial commitments at Dec. 31, 2010. See the Statements of Capitalization and additional discussion in Notes 4 and 14 to the consolidated financial statements.
|
Payments Due by Period
|
||||||||||||||||||||
|
Less than 1
|
1 to 3
|
4 to 5
|
After 5
|
|||||||||||||||||
|
(Thousands of Dollars)
|
Total
|
Year
|
Years
|
Years
|
Years
|
|||||||||||||||
|
Long-term debt, principal and interest payments
|
$ | 18,195,520 | $ | 598,011 | $ | 2,283,166 | $ | 1,400,650 | $ | 13,913,693 | ||||||||||
|
Capital lease obligations
|
417,166 | 18,523 | 34,989 | 33,412 | 330,242 | |||||||||||||||
|
Operating leases
(a)(b)
|
3,150,020 | 177,327 | 379,375 | 406,600 | 2,186,718 | |||||||||||||||
|
Unconditional purchase obligations
|
10,010,629 | 1,860,084 | 2,311,469 | 1,676,557 | 4,162,519 | |||||||||||||||
|
Other long-term obligations
(c)
|
139,823 | 31,431 | 53,916 | 46,359 | 8,117 | |||||||||||||||
|
Payments to vendors in process
|
97,168 | 97,168 | — | — | — | |||||||||||||||
|
Short-term debt
|
466,400 | 466,400 | — | — | — | |||||||||||||||
|
Total contractual cash obligations
(d) (e) (f) (g)
|
$ | 32,476,726 | $ | 3,248,944 | $ | 5,062,915 | $ | 3,563,578 | $ | 20,601,289 | ||||||||||
|
(a)
|
Under some leases, Xcel Energy would have to sell or purchase the property that it leases if it chose to terminate before the scheduled lease expiration date. Most of Xcel Energy’s railcar, vehicle and equipment and aircraft leases have these terms. At Dec. 31, 2010, the amount that Xcel Energy would have to have to pay if it chose to terminate these leases was approximately $99.0 million. In addition, at the end of the equipment lease terms, each lease must be extended, equipment purchased for the greater of the fair value or unamortized value of equipment sold to a third party with Xcel Energy making up any deficiency between the sales price and the unamortized value.
|
|
(b)
|
Included in operating lease payments are $148.9 million, $332.4 million, $362.6 million and $2.1 billion, for the less than 1 year, 1-3 years, 4-5 years and after 5 years categories, respectively, pertaining to PPAs that were accounted for as operating leases.
|
|
(c)
|
Included in other long-term obligations are tax and interest related to unrecognized tax benefits recorded as required by accounting guidance.
|
|
(d)
|
Xcel Energy and its subsidiaries have contracts providing for the purchase and delivery of a significant portion of its current coal, nuclear fuel and natural gas requirements. Additionally, the utility subsidiaries of Xcel Energy have entered into agreements with utilities and other energy suppliers for purchased power to meet system load and energy requirements, replace generation from company-owned units under maintenance and during outages, and meet operating reserve obligations. Certain contractual purchase obligations are adjusted on indices. The effects of price changes are mitigated through cost of energy adjustment mechanisms.
|
|
(e)
|
Xcel Energy also has outstanding authority under contracts and blanket purchase orders to purchase up to approximately $2.1 billion of goods and services through the year 2050, in addition to the amounts disclosed in this table and in the forecasted capital expenditures.
|
|
(f)
|
In January 2011, Xcel Energy contributed $134 million, allocated across three of its pension plans. At this time, no additional contributions are planned for 2011. Projected pension funding contributions for 2010, which will be dependent on several factors including realized asset performance, future discount rate, IRS and legislative initiatives as well as other actuarial assumptions, are estimated to range between $150 million to $175 million.
|
|
(g)
|
Xcel Energy expects to contribute approximately $40.5 million to the postretirement health care plans during 2011.
|
Common Stock Dividends —
Future dividend levels will be dependent on Xcel Energy’s results of operations, financial position, cash flows, reinvestment opportunities and other factors, and will be evaluated by the Xcel Energy Board of Directors. Xcel Energy’s objective is to increase the annual dividend in the range of 2 percent to 4 percent per year. Xcel Energy’s dividend policy balances:
|
|
●
|
Projected cash generation from utility operations;
|
|
|
●
|
Projected capital investment in the utility businesses;
|
|
|
●
|
A reasonable rate of return on shareholder investment; and
|
|
|
●
|
The impact on Xcel Energy’s capital structure and credit ratings.
|
In addition, there are certain statutory limitations that could affect dividend levels. Federal law places certain limits on the ability of public utilities within a holding company system to declare dividends.
Specifically, under the Federal Power Act, a public utility may not pay dividends from any funds properly included in a capital account. The utility subsidiaries dividends may be limited indirectly or directly by state regulatory commissions, bond indenture covenants or restrictions under credit agreements for debt to total capitalization ratios.
The Articles of Incorporation of Xcel Energy place restrictions on the amount of common stock dividends it can pay when preferred stock is outstanding. Under the provisions, dividend payments may be restricted if Xcel Energy’s capitalization ratio (on a holding company basis only, not on a consolidated basis) is less than 25 percent. For these purposes, the capitalization ratio is equal to (i) common stock plus surplus divided by (ii) the sum of common stock plus surplus plus long-term debt. Based on this definition, Xcel Energy’s holding company capitalization ratio at Dec. 31, 2010 and 2009 was 84 percent and 85 percent, respectively. Therefore, the restrictions do not place any effective limit on Xcel Energy’s ability to pay dividends.
Regulation of Derivatives —
In July 2010, President Obama signed financial reform legislation which will regulate derivative transactions
amongst
other provisions. Provisions within the bill provide the Commodity Futures Trading Commission (CFTC) and SEC with expanded regulatory authority over derivative and swap transactions. This legislation could preclude or impede some types of over-the-counter energy commodity transactions and/or require clearing through regulated central counterparties, which could negatively impact the market for these transactions as well as result in extensive margin and fee requirements. Additionally there may be material increased reporting requirements. The bill contains provisions that should exempt certain derivatives end-users from much of the clearing and margining requirements. However, the CFTC is still developing the appropriate regulatory rules under the act and, at this time, it is not clear whether Xcel Energy will qualify for the exemption. If Xcel Energy does not meet the end-user exception, the margin requirements could be significant. Xcel Energy expects the various definitions and rulemakings to be completed during 2011. The full implications for Xcel Energy can not be determined until that time.
Pension Fund
—
Xcel Energy’s pension assets are invested in a diversified portfolio of domestic and international equity securities, short–term to long-duration fixed income securities, and alternative investments, including, private equity, real estate and commodity index investments. Xcel Energy accelerated its planned 2010 contribution of $100 million, based on available liquidity, bringing its total 2009 pension contributions to $200 million. In 2010, Xcel Energy voluntarily contributed $34 million to one of its pension plans. In January 2011, Xcel Energy contributed $134 million, allocated across three of its pension plans. The January 2011 contribution raised the overall funded status from 84 percent at Dec. 31, 2010 to 88 percent with all other pension assumptions remaining constant. At this time, no additional contributions are planned for 2011. Projected pension funding contributions for 2012, which will be dependent on several factors including realized asset performance, future discount rate, IRS and legislative initiatives as well as other actuarial assumptions, are estimated to range between $150 million to $175 million. The funded status and pension assumptions are summarized in the following tables:
|
(Millions of Dollars)
|
Dec. 31, 2010
|
Dec. 31, 2009
|
||||||
|
Fair value of pension assets
|
$ | 2,541 | $ | 2,449 | ||||
|
Projected pension obligation
(a)
|
3,030 | 2,830 | ||||||
|
Funded status
|
$ | (489 | ) | $ | (381 | ) | ||
(a)
Excludes non-qualified plan of $47 million and $46 million at Dec. 31, 2010 and 2009, respectively.
|
Pension Assumptions
|
2011
|
2010
|
||||||
|
Discount rate
|
5.50 | % | 6.00 | % | ||||
|
Expected long-term rate of return
|
7.50 | 7.79 | ||||||
Long-Term Contracts
—
In response to the CACJA passed in Colorado, PSCo entered into a 10-year physical gas supply contract from January 2012 through 2021 for gas-fired generation. Pricing is based on a formula and given current input assumptions; the notional value of the deal over the duration of the contract is in excess of $700 million. The contact was finalized in the fourth quarter of 2010 after receiving required approval from the CPUC.
Acquisition of Generation Assets —
In December 2010, PSCo purchased the Blue Spruce Energy Center and Rocky Mountain Energy Center from subsidiaries of Calpine Corporation for $739 million plus an additional $3 million for working capital adjustments. The Blue Spruce Energy Center is a 310 MW simple cycle natural gas-fired power plant that began commercial operations in 2003. The Rocky Mountain Energy Center is a 652 MW combined-cycle natural gas-fired power plant that began commercial operations in 2004. Both power plants previously provided energy and capacity to PSCo under purchased power agreements, which were set to expire in 2013 and 2014, respectively.
Capital Sources
Xcel Energy expects to meet future financing requirements by periodically issuing short-term debt, long-term debt, common stock, preferred securities and hybrid securities to maintain desired capitalization ratios.
Settlement with Provident —
In July 2010, Xcel Energy, PSCo and PSRI entered into a settlement agreement with Provident related to all claims asserted by Xcel Energy, PSCo and PSRI against Provident in a lawsuit associated with the discontinued COLI program. Under the terms of the settlement, Xcel Energy, PSCo and PSRI were paid $25 million by Provident and Reassure America Life Insurance Company. Xcel Energy, PSCo and PSRI recorded this settlement of $25 million, or approximately $0.05 of non-recurring earnings per share, in the third quarter of 2010. The $25 million proceeds were not subject to income taxes.
Tax Law Changes —
On Sept. 27, 2010, President Obama signed into law the Small Business Jobs Act of 2010, which contains a tax incentive package that includes a one-year extension through 2010 of 50 percent bonus depreciation for businesses of all sizes. It extends for one additional year the 50 percent bonus depreciation provision enacted in the Economic Stimulus Act of 2008 and subsequently renewed in the American Recovery and Reinvestment Act of 2009. The provision had expired at the end of 2009. Under the bonus depreciation provision, 50 percent of the basis of qualified property may be deducted in the year the property is placed in service and the remaining 50 percent recovered under normal depreciation rules. The accounting impacts of the provision, retroactive to Jan. 1, 2010 were reflected in the third quarter of 2010.
On Dec. 17, 2010, President Obama signed into law the Tax Relief, Unemployment Insurance Reauthorization, and Job Creation Act of 2010, which retroactively extends the research credit for 2010 and 2011. Additionally, this Act extends the 50 percent bonus depreciation provision through 2012 and expands the deduction to 100 percent for qualified property placed in service after Sept. 8, 2010 through 2011.
Sale of Lubbock Electric Distribution Assets
—
In October 2010, SPS sold its electric distribution system assets within the city limits of Lubbock, Texas to LP&L for approximately $87 million. The sale and related transactions eliminate the inefficiencies of maintaining duplicate distribution systems, one by SPS and the other by the city-owned LP&L.
Short-Term Funding Sources —
Xcel Energy uses a number of sources to fulfill short-term funding needs, including operating cash flow, notes payable, commercial paper and bank lines of credit. The amount and timing of short-term funding needs depend in large part on financing needs for construction expenditures, working capital and dividend payments.
Short-Term Investments —
Xcel Energy, NSP-Minnesota, NSP-Wisconsin, PSCo and SPS maintain cash operating accounts with Wells Fargo Bank. At Dec. 31, 2010, approximately $45.7 million of cash was held in these liquid operating accounts.
Commercial Paper —
Xcel Energy, NSP-Minnesota, PSCo and SPS each have individual commercial paper programs. The maximum amount of commercial paper outstanding during 2010 was $653 million. The weighted average interest rate for Xcel Energy’s commercial paper during 2010 was 0.36 percent. In an order dated Feb. 4, 2011, NSP-Wisconsin received regulatory approval to initiate a commercial paper program beginning in 2011. The authorized levels for these commercial paper programs are:
|
|
●
|
$800 million for Xcel Energy;
|
|
|
●
|
$500 million for NSP-Minnesota;
|
|
|
●
|
$700 million for PSCo;
|
|
|
●
|
$250 million for SPS; and
|
|
|
●
|
$150 million for NSP-Wisconsin.
|
Credit Facilities
— As of Feb. 14, 2011, Xcel Energy and its utility subsidiaries had the following committed credit facilities available to meet its liquidity needs:
|
(Millions of Dollars)
|
Facility
(c)
|
Drawn
(a)
|
Available
|
Cash
|
Liquidity
|
|||||||||||||||
|
NSP-Minnesota
|
$ | 482.2 | $ | 5.3 | $ | 476.9 | $ | 31.9 | $ | 508.8 | ||||||||||
|
PSCo
|
675.1 | 152.0 | 523.1 | 18.0 | 541.1 | |||||||||||||||
|
SPS
|
247.9 | 43.0 | 204.9 | 0.4 | 205.3 | |||||||||||||||
|
Xcel Energy — Holding Company
|
771.6 | 343.1 | 428.5 | 2.0 | 430.5 | |||||||||||||||
|
NSP-Wisconsin
(b)
|
— | — | — | 0.3 | 0.3 | |||||||||||||||
|
Total
|
$ | 2,176.8 | $ | 543.4 | $ | 1,633.4 | $ | 52.6 | $ | 1,686.0 | ||||||||||
|
(a)
|
Includes direct borrowings, outstanding commercial paper and letters of credit.
|
|
(b)
|
NSP-Wisconsin does not currently have a specific credit facility; however, it does have a borrowing agreement with NSP-Minnesota. For further discussion, see Note 4 to the consolidated financial statements.
|
|
(c)
|
These credit facilities expire in December 2011.
|
Xcel Energy plans to syndicate new credit agreements at the Holding Company, NSP-Minnesota, PSCo, SPS and NSP-Wisconsin during the first quarter of 2011 to replace the existing agreements. The total anticipated size of the new credit facilities will be approximately $2.45 billion.
Money Pool —
Xcel Energy received FERC approval to establish a utility money pool arrangement with the utility subsidiaries, subject to receipt of required state regulatory approvals. The utility money pool allows for short-term investments in and borrowings from the utility subsidiaries and investments from the Holding Company to the utility subsidiaries at market-based interest rates. The money pool balances are eliminated during consolidation.
The utility money pool arrangement does not allow the Holding Company to borrow from the utility subsidiaries. NSP-Minnesota, PSCo and SPS participate in the money pool pursuant to approval from their respective state regulatory commissions. NSP-Wisconsin does not participate in the money pool.
Equity Forward Instruments
—
In August 2010, Xcel Energy entered into equity forward agreements in connection with a public offering of 21.85 million shares of Xcel Energy common stock. Under the forward agreements, Xcel Energy agreed to issue to the banking counterparty 21.85 million shares of its common stock.
On Nov. 29, 2010, Xcel Energy settled the forward agreements by physically delivering 21.85 million shares of common equity and receiving cash proceeds of $449.8 million. The price used to determine cash proceeds was calculated based on the August 2010 public offering price of Xcel Energy’s common stock, adjusted for underwriting fees, as well as a daily adjustment based on the federal funds rate less a spread of 0.50 percent, and a decrease to reflect the dividend paid on Xcel Energy’s common stock in October 2010.
Registration Statements —
Xcel Energy’s articles of incorporation authorize the issuance of 1 billion shares of $2.50 par value common stock. As of Dec. 31, 2010 and 2009, Xcel Energy had approximately 482 million shares and 458 million shares of common stock outstanding, respectively. In addition, Xcel Energy’s articles of incorporation authorize the issuance of seven million shares of $100 par value preferred stock. On Dec. 31, 2010 and 2009, Xcel Energy had approximately one million shares of preferred stock outstanding. Xcel Energy and its subsidiaries have the following registration statements on file with the SEC, pursuant to which they may sell, from time to time, securities:
|
●
|
Xcel Energy has an effective automatic shelf registration statement that does not contain a limit on issuance capacity. However, Xcel Energy’s ability to issue securities is limited by authority granted by the Board of Directors, which currently authorizes the issuance of up to an additional $480 million of debt and common equity securities.
|
|
●
|
NSP-Minnesota has an automatic shelf registration statement filed in January 2011 that does not contain a limit on issuance capacity. However, NSP-Minnesota’s ability to issue securities is limited by authority granted by its Board of Directors, which currently authorizes the issuance of up to $1.5 billion of debt securities.
|
|
●
|
PSCo has an automatic shelf registration statement filed in October 2010 that does not contain a limit on issuance capacity. However, PSCo’s ability to issue securities is limited by authority granted by its Board of Directors, which currently authorizes the issuance of up to $1.4 billion of debt securities.
|
|
●
|
NSP-Wisconsin has $50 million of debt securities remaining under its currently effective registration statement.
|
Long-Term Borrowings
—
See the Statement of Capitalization and a discussion of the long-term borrowings in Note 4 to the consolidated financial statements.
Financing Plans
—
Xcel Energy issues debt and equity securities to refinance retiring maturities, reduce short-term debt, fund construction programs, infuse equity in subsidiaries, fund asset acquisitions and for other general corporate purposes. In addition to the periodic issuance and repayment of short-term debt, Xcel Energy and its utility subsidiaries’ financing plans are as follows:
|
|
●
|
NSP-Minnesota may issue up to $300 million of first mortgage bonds during the second half of 2011.
|
|
|
●
|
PSCo may issue approximately $250 million of first mortgage bonds during the second half of 2011.
|
|
|
●
|
SPS may issue approximately $150 million of senior unsecured notes during the second half of 2011.
|
|
|
●
|
Xcel Energy also anticipates issuing approximately $75 million of equity through the Dividend Reinvestment Program and various benefit programs in 2011.
|
Financing plans are subject to change, depending on capital expenditures, internal cash generation, market conditions and other factors.
Off-Balance-Sheet Arrangements
Xcel Energy does not have any off-balance-sheet arrangements, other than those currently disclosed, that have or are reasonably likely to have a current or future effect on financial condition, changes in financial condition, revenues or expenses, results of operations, liquidity, capital expenditures or capital resources that is material to investors.
Earnings Guidance
Xcel Energy’s 2011 ongoing earnings guidance is $1.65 to $1.75 per share. Key assumptions related to ongoing earnings are detailed below:
|
|
●
|
Normal weather patterns are experienced for the year.
|
|
|
●
|
Weather-adjusted retail electric utility sales, adjusted for the sale of the Lubbock distribution assets, are projected to grow approximately 1.0 to 1.3 percent.
|
|
|
●
|
Weather-adjusted retail firm natural gas sales are projected to be relatively flat.
|
|
|
●
|
Constructive outcomes in all rate case and regulatory proceedings.
|
|
|
●
|
Rider revenue recovery is projected to increase approximately $35 million.
|
|
|
●
|
O&M expenses are projected to increase approximately 4 percent.
|
|
|
●
|
Depreciation expense is projected to increase $55 million to $65 million.
|
|
|
●
|
Interest expense is projected to increase approximately $15 million to $25 million.
|
|
|
●
|
AFUDC — equity is projected to be relatively flat.
|
|
|
●
|
The effective tax rate is projected to be approximately 34 percent to 36 percent.
|
|
|
●
|
Average common stock and equivalents are projected to be approximately 485 million shares.
|
See Item 7, incorporated by reference.
See Item 15-1 for an index of financial statements included herein.
See Note 18 to the consolidated financial statements for summarized quarterly financial data.
Management Report on Internal Controls Over Financial Reporting
The management of Xcel Energy is responsible for establishing and maintaining adequate internal control over financial reporting. Xcel Energy’s internal control system was designed to provide reasonable assurance to the company’s management and board of directors regarding the preparation and fair presentation of published financial statements.
All internal control systems, no matter how well designed, have inherent limitations. Therefore, even those systems determined to be effective can provide only reasonable assurance with respect to financial statement preparation and presentation.
Xcel Energy management assessed the effectiveness of the company’s internal control over financial reporting as of Dec. 31, 2010. In making this assessment, it used the criteria set forth by the Committee of Sponsoring Organizations of the Treadway Commission (COSO) in
Internal Control — Integrated Framework.
Based on our assessment, we believe that, as of Dec. 31, 2010, the company’s internal control over financial reporting is effective based on those criteria.
Xcel Energy’s independent auditors have issued an audit report on the company’s internal control over financial reporting. Their report appears herein.
|
/S/ RICHARD C. KELLY
|
/S/ DAVID M. SPARBY
|
|
|
Richard C. Kelly
|
David M. Sparby
|
|
|
Chairman and Chief Executive Officer
|
Vice President and Chief Financial Officer
|
|
|
February 28, 2011
|
February 28, 2011
|
REPORT OF INDEPENDENT REGISTERED PUBLIC ACCOUNTING FIRM
Board of Directors and Stockholders
Xcel Energy Inc.
We have audited the accompanying consolidated balance sheets and consolidated statements of capitalization of Xcel Energy Inc. and subsidiaries (the “Company”) as of December 31, 2010 and 2009, and the related consolidated statements of income, common stockholders’ equity and comprehensive income, and cash flows for each of the three years in the period ended December 31, 2010. Our audits also included the financial statement schedules listed in the Index at Item 15. These financial statements and financial statement schedules are the responsibility of the Company’s management. Our responsibility is to express an opinion on the financial statements and financial statement schedules based on our audits.
We conducted our audits in accordance with the standards of the Public Company Accounting Oversight Board (United States). Those standards require that we plan and perform the audit to obtain reasonable assurance about whether the financial statements are free of material misstatement. An audit includes examining, on a test basis, evidence supporting the amounts and disclosures in the financial statements. An audit also includes assessing the accounting principles used and significant estimates made by management, as well as evaluating the overall financial statement presentation. We believe that our audits provide a reasonable basis for our opinion.
In our opinion, such consolidated financial statements present fairly, in all material respects, the financial position of Xcel Energy Inc. and subsidiaries as of December 31, 2010 and 2009, and the results of their operations and their cash flows for each of the three years in the period ended December 31, 2010, in conformity with accounting principles generally accepted in the United States of America. Also, in our opinion, such financial statement schedules, when considered in relation to the basic consolidated financial statements taken as a whole, present fairly, in all material respects, the information set forth therein.
We have also audited, in accordance with the standards of the Public Company Accounting Oversight Board (United States), the Company’s internal control over financial reporting as of December 31, 2010, based on the criteria established in
Internal Control—Integrated Framework
issued by the Committee of Sponsoring Organizations of the Treadway Commission and our report dated February 28, 2011 expressed an unqualified opinion on the Company’s internal control over financial reporting.
/s/ DELOITTE & TOUCHE LLP
Minneapolis, Minnesota
February 28, 2011
REPORT OF INDEPENDENT REGISTERED PUBLIC ACCOUNTING
FIRM
Board of Directors and Stockholders
Xcel Energy Inc.
We have audited the internal control over financial reporting of Xcel Energy Inc. and subsidiaries (the “Company”) as of December 31, 2010, based on criteria established in
Internal Control — Integrated Framework
issued by the Committee of Sponsoring Organizations of the Treadway Commission. The Company’s management is responsible for maintaining effective internal control over financial reporting and for its assessment of the effectiveness of internal control over financial reporting, included in the accompanying Management Report on Internal Controls over Financial Reporting. Our responsibility is to express an opinion on the Company’s internal control over financial reporting based on our audit.
We conducted our audit in accordance with the standards of the Public Company Accounting Oversight Board (United States). Those standards require that we plan and perform the audit to obtain reasonable assurance about whether effective internal control over financial reporting was maintained in all material respects. Our audit included obtaining an understanding of internal control over financial reporting, assessing the risk that a material weakness exists, testing and evaluating the design and operating effectiveness of internal control based on the assessed risk, and performing such other procedures as we considered necessary in the circumstances. We believe that our audit provides a reasonable basis for our opinion.
A company’s internal control over financial reporting is a process designed by, or under the supervision of, the company’s principal executive and principal financial officers, or persons performing similar functions, and effected by the company’s board of directors, management, and other personnel to provide reasonable assurance regarding the reliability of financial reporting and the preparation of financial statements for external purposes in accordance with generally accepted accounting principles. A company’s internal control over financial reporting includes those policies and procedures that (1) pertain to the maintenance of records that, in reasonable detail, accurately and fairly reflect the transactions and dispositions of the assets of the company; (2) provide reasonable assurance that transactions are recorded as necessary to permit preparation of financial statements in accordance with generally accepted accounting principles, and that receipts and expenditures of the company are being made only in accordance with authorizations of management and directors of the company; and (3) provide reasonable assurance regarding prevention or timely detection of unauthorized acquisition, use, or disposition of the company’s assets that could have a material effect on the financial statements.
Because of the inherent limitations of internal control over financial reporting, including the possibility of collusion or improper management override of controls, material misstatements due to error or fraud may not be prevented or detected on a timely basis. Also, projections of any evaluation of the effectiveness of the internal control over financial reporting to future periods are subject to the risk that the controls may become inadequate because of changes in conditions, or that the degree of compliance with the policies or procedures may deteriorate.
In our opinion, the Company maintained, in all material respects, effective internal control over financial reporting as of December 31, 2010, based on the criteria established in
Internal Control — Integrated Framework
issued by the Committee of Sponsoring Organizations of the Treadway Commission.
We have also audited, in accordance with the standards of the Public Company Accounting Oversight Board (United States) the consolidated financial statements and financial statement schedules as of and for the year ended December 31, 2010 of the Company and our report dated February 28, 2011 expressed an unqualified opinion on those financial statements and financial statement schedules.
/s/ DELOITTE & TOUCHE LLP
Minneapolis, Minnesota
February 28, 2011
XCEL ENERGY INC. AND SUBSIDIARIES
CONSOLIDATED STATEMENTS OF INCOME
(amounts in thousands, except per share data)
|
Year Ended Dec. 31
|
||||||||||||
|
2010
|
2009
|
2008
|
||||||||||
|
Operating revenues
|
||||||||||||
|
Electric
|
$ | 8,451,845 | $ | 7,704,723 | $ | 8,682,993 | ||||||
|
Natural gas
|
1,782,582 | 1,865,703 | 2,442,988 | |||||||||
|
Other
|
76,520 | 73,877 | 77,175 | |||||||||
|
Total operating revenues
|
10,310,947 | 9,644,303 | 11,203,156 | |||||||||
|
Operating expenses
|
||||||||||||
|
Electric fuel and purchased power
|
4,010,660 | 3,672,490 | 4,947,979 | |||||||||
|
Cost of natural gas sold and transported
|
1,162,926 | 1,266,440 | 1,832,699 | |||||||||
|
Cost of sales — other
|
29,540 | 22,107 | 21,082 | |||||||||
|
Other operating and maintenance expenses
|
2,057,249 | 1,908,097 | 1,777,933 | |||||||||
|
Conservation and demand side management program expenses
|
239,827 | 182,112 | 117,713 | |||||||||
|
Depreciation and amortization
|
858,882 | 818,052 | 828,379 | |||||||||
|
Taxes (other than income taxes)
|
331,894 | 306,433 | 286,580 | |||||||||
|
Total operating expenses
|
8,690,978 | 8,175,731 | 9,812,365 | |||||||||
|
Operating income
|
1,619,969 | 1,468,572 | 1,390,791 | |||||||||
|
Other income, net
|
31,143 | 9,771 | 40,406 | |||||||||
|
Equity earnings of unconsolidated subsidiaries
|
29,948 | 24,664 | 3,571 | |||||||||
|
Allowance for funds used during construction — equity
|
56,152 | 75,686 | 63,519 | |||||||||
|
Interest charges and financing costs
|
||||||||||||
|
Interest charges — includes other financing costs of $20,638, $20,162, and $20,390, respectively
|
577,291 | 561,654 | 552,919 | |||||||||
|
Allowance for funds used during construction — debt
|
(28,670 | ) | (39,799 | ) | (39,038 | ) | ||||||
|
Total interest charges and financing costs
|
548,621 | 521,855 | 513,881 | |||||||||
|
Income from continuing operations before income taxes
|
1,188,591 | 1,056,838 | 984,406 | |||||||||
|
Income taxes
|
436,635 | 371,314 | 338,686 | |||||||||
|
Income from continuing operations
|
751,956 | 685,524 | 645,720 | |||||||||
|
Income (loss) from discontinued operations, net of tax
|
3,878 | (4,637 | ) | (166 | ) | |||||||
|
Net income
|
755,834 | 680,887 | 645,554 | |||||||||
|
Dividend requirements on preferred stock
|
4,241 | 4,241 | 4,241 | |||||||||
|
Earnings available to common shareholders
|
$ | 751,593 | $ | 676,646 | $ | 641,313 | ||||||
|
Weighted average common shares outstanding:
|
||||||||||||
|
Basic
|
462,052 | 456,433 | 437,054 | |||||||||
|
Diluted
|
463,391 | 457,139 | 441,813 | |||||||||
|
Earnings per average common share — basic:
|
||||||||||||
|
Income from continuing operations
|
$ | 1.62 | $ | 1.49 | $ | 1.47 | ||||||
|
Income (loss) from discontinued operations
|
0.01 | (0.01 | ) | — | ||||||||
|
Earnings per share
|
$ | 1.63 | $ | 1.48 | $ | 1.47 | ||||||
|
Earnings per average common share — diluted:
|
||||||||||||
|
Income from continuing operations
|
$ | 1.61 | $ | 1.49 | $ | 1.46 | ||||||
|
Income (loss) from discontinued operations
|
0.01 | (0.01 | ) | — | ||||||||
|
Earnings per share
|
$ | 1.62 | $ | 1.48 | $ | 1.46 | ||||||
|
Cash dividends declared per common share
|
$ | 1.00 | $ | 0.97 | $ | 0.94 | ||||||
|
See Notes to Consolidated Financial Statements
|
||||||||||||
XCEL ENERGY INC. AND SUBSIDIARIES
(amounts in thousands of dollars)
|
Year Ended Dec. 31
|
||||||||||||
|
2010
|
2009
|
2008
|
||||||||||
|
Operating activities
|
||||||||||||
|
Net income
|
$ | 755,834 | $ | 680,887 | $ | 645,554 | ||||||
|
Remove (income) loss from discontinued operations
|
(3,878 | ) | 4,637 | 166 | ||||||||
|
Adjustments to reconcile net income to cash provided by operating activities:
|
||||||||||||
|
Depreciation and amortization
|
872,186 | 835,597 | 843,461 | |||||||||
|
Conservation and demand side management program amortization
|
21,700 | 29,418 | 39,931 | |||||||||
|
Nuclear fuel amortization
|
105,369 | 80,104 | 64,203 | |||||||||
|
Deferred income taxes
|
414,460 | 407,517 | 281,802 | |||||||||
|
Amortization of investment tax credits
|
(6,353 | ) | (6,426 | ) | (7,198 | ) | ||||||
|
Allowance for equity funds used during construction
|
(56,152 | ) | (75,686 | ) | (63,519 | ) | ||||||
|
Equity earnings of unconsolidated subsidiaries
|
(29,948 | ) | (24,664 | ) | (3,571 | ) | ||||||
|
Dividends from unconsolidated subsidiaries
|
32,538 | 29,059 | — | |||||||||
|
Provision for bad debts
|
44,068 | 49,023 | 63,407 | |||||||||
|
Share-based compensation expense
|
35,807 | 29,672 | 25,511 | |||||||||
|
Net realized and unrealized hedging and derivative transactions
|
(35,552 | ) | 39,029 | (31,895 | ) | |||||||
|
Changes in operating assets and liabilities:
|
||||||||||||
|
Accounts receivable
|
(29,749 | ) | 122,503 | (13,405 | ) | |||||||
|
Accrued unbilled revenues
|
(14,642 | ) | 49,430 | (11,520 | ) | |||||||
|
Inventories
|
9,239 | 100,504 | (135,099 | ) | ||||||||
|
Other current assets
|
10,461 | (84,783 | ) | 9,181 | ||||||||
|
Accounts payable
|
(188,855 | ) | (50,638 | ) | 27,463 | |||||||
|
Net regulatory assets and liabilities
|
36,096 | (38,403 | ) | (136,807 | ) | |||||||
|
Other current liabilities
|
13,192 | 49,388 | 140,264 | |||||||||
|
Pension and other employee benefit obligations
|
(62,625 | ) | (245,987 | ) | (105,113 | ) | ||||||
|
Change in other noncurrent assets
|
5,936 | (1,991 | ) | 48,283 | ||||||||
|
Change in other noncurrent liabilities
|
(35,190 | ) | (65,284 | ) | 6,507 | |||||||
|
Net cash provided by operating activities
|
1,893,942 | 1,912,906 | 1,687,606 | |||||||||
|
Investing activities
|
||||||||||||
|
Utility capital/construction expenditures
|
(2,217,327 | ) | (1,786,902 | ) | (2,113,655 | ) | ||||||
|
Allowance for equity funds used during construction
|
56,152 | 75,686 | 63,519 | |||||||||
|
Purchase of investments in external decommissioning fund
|
(3,781,438 | ) | (1,644,278 | ) | (957,752 | ) | ||||||
|
Proceeds from the sale of investments in external decommissioning fund
|
3,786,373 | 1,664,957 | 914,514 | |||||||||
|
Proceeds from the sale of assets
|
87,823 | — | — | |||||||||
|
Acquisition of generation assets
|
(732,495 | ) | — | — | ||||||||
|
Investment in WYCO Development LLC
|
(8,046 | ) | (42,490 | ) | (97,924 | ) | ||||||
|
Change in restricted cash
|
89 | 264 | 32,008 | |||||||||
|
Other investments
|
2,145 | (1,917 | ) | 2,589 | ||||||||
|
Net cash used in investing activities
|
(2,806,724 | ) | (1,734,680 | ) | (2,156,701 | ) | ||||||
|
Financing activities
|
||||||||||||
|
Proceeds from (repayment of) short-term borrowings, net
|
7,400 | 3,750 | (633,310 | ) | ||||||||
|
Proceeds from issuance of long-term debt
|
1,433,406 | 689,915 | 1,915,060 | |||||||||
|
Repayment of long-term debt, including reacquisition premiums
|
(560,383 | ) | (621,296 | ) | (581,313 | ) | ||||||
|
Proceeds from issuance of common stock
|
457,258 | 20,133 | 352,871 | |||||||||
|
Dividends paid
|
(432,110 | ) | (414,922 | ) | (382,282 | ) | ||||||
|
Net cash provided by (used in) financing activities
|
905,571 | (322,420 | ) | 671,026 | ||||||||
|
Net increase (decrease) in cash and cash equivalents
|
(7,211 | ) | (144,194 | ) | 201,931 | |||||||
|
Cash and cash equivalents at beginning of period
|
115,648 | 259,842 | 57,911 | |||||||||
|
Cash and cash equivalents at end of period
|
$ | 108,437 | $ | 115,648 | $ | 259,842 | ||||||
|
Supplemental disclosure of cash flow information:
|
||||||||||||
|
Cash paid for interest (net of amounts capitalized)
|
$ | (530,072 | ) | $ | (514,675 | ) | $ | (485,373 | ) | |||
|
Cash received (paid) for income taxes, net
|
(16,635 | ) | 21,154 | (94,744 | ) | |||||||
|
Supplemental disclosure of non-cash investing transactions:
|
||||||||||||
|
Property, plant and equipment additions in accounts payable
|
$ | 174,903 | $ | 68,417 | $ | 55,715 | ||||||
|
Storage assets under capital lease
|
6,314 | 71,553 | — | |||||||||
|
Supplemental disclosure of non-cash financing transactions:
|
||||||||||||
|
Issuance of common stock for reinvested dividends and 401(k) plans
|
$ | 63,905 | $ | 54,638 | $ | 56,009 | ||||||
|
Issuance of common stock for senior convertible notes
|
— | — | 57,500 | |||||||||
XCEL ENERGY INC. AND SUBSIDIARIES
(amounts in thousands of dollars)
|
Dec. 31
|
||||||||
|
2010
|
2009
|
|||||||
|
Assets
|
||||||||
|
Current assets
|
||||||||
|
Cash and cash equivalents
|
$ | 108,437 | $ | 115,648 | ||||
|
Accounts receivable, net
|
718,474 | 730,152 | ||||||
|
Accrued unbilled revenues
|
708,691 | 694,049 | ||||||
|
Inventories
|
560,800 | 566,205 | ||||||
|
Regulatory assets
|
388,541 | 357,011 | ||||||
|
Derivative instruments
|
54,079 | 97,700 | ||||||
|
Deferred income taxes
|
— | 223,079 | ||||||
|
Prepayments and other
|
193,621 | 192,791 | ||||||
|
Total current assets
|
2,732,643 | 2,976,635 | ||||||
|
Property, plant and equipment, net
|
20,663,082 | 18,508,296 | ||||||
|
Other assets
|
||||||||
|
Nuclear decommissioning fund and other investments
|
1,476,435 | 1,381,835 | ||||||
|
Regulatory assets
|
2,151,460 | 1,987,369 | ||||||
|
Derivative instruments
|
184,026 | 289,530 | ||||||
|
Other
|
180,044 | 162,296 | ||||||
|
Total other assets
|
3,991,965 | 3,821,030 | ||||||
|
Total assets
|
$ | 27,387,690 | $ | 25,305,961 | ||||
|
Liabilities and Equity
|
||||||||
|
Current liabilities
|
||||||||
|
Current portion of long-term debt
|
$ | 55,415 | $ | 543,814 | ||||
|
Short-term debt
|
466,400 | 459,000 | ||||||
|
Accounts payable
|
979,750 | 1,083,572 | ||||||
|
Regulatory liabilities
|
156,038 | 199,154 | ||||||
|
Taxes accrued
|
254,320 | 257,739 | ||||||
|
Accrued interest
|
163,907 | 159,686 | ||||||
|
Dividends payable
|
122,847 | 113,147 | ||||||
|
Derivative instruments
|
61,745 | 46,554 | ||||||
|
Other
|
276,111 | 227,333 | ||||||
|
Total current liabilities
|
2,536,533 | 3,089,999 | ||||||
|
Deferred credits and other liabilities
|
||||||||
|
Deferred income taxes
|
3,390,027 | 3,156,369 | ||||||
|
Deferred investment tax credits
|
92,937 | 99,290 | ||||||
|
Regulatory liabilities
|
1,179,765 | 1,148,014 | ||||||
|
Asset retirement obligations
|
969,310 | 881,479 | ||||||
|
Derivative instruments
|
285,986 | 307,770 | ||||||
|
Customer advances
|
269,087 | 295,470 | ||||||
|
Pension and employee benefit obligations
|
962,767 | 839,051 | ||||||
|
Other
|
249,635 | 211,666 | ||||||
|
Total deferred credits and other liabilities
|
7,399,514 | 6,939,109 | ||||||
|
Commitments and contingent liabilities
|
||||||||
|
Capitalization
|
||||||||
|
Long-term debt
|
9,263,144 | 7,888,628 | ||||||
|
Preferred stockholders’ equity
|
104,980 | 104,980 | ||||||
|
Common stock — $2.50 par value per share
|
1,205,834 | 1,143,773 | ||||||
|
Additional paid in capital
|
5,229,075 | 4,769,980 | ||||||
|
Retained earnings
|
1,701,703 | 1,419,201 | ||||||
|
Accumulated other comprehensive loss
|
(53,093 | ) | (49,709 | ) | ||||
|
Total common stockholders’ equity
|
8,083,519 | 7,283,245 | ||||||
|
Total liabilities and equity
|
$ | 27,387,690 | $ | 25,305,961 | ||||
See Notes to Consolidated Financial Statements
XCEL ENERGY INC. AND SUBSIDIARIES
CONSOLIDATED STATEMENTS OF COMMON STOCKHOLDERS’ EQUITY
AND COMPREHENSIVE INCOME
(amounts in thousands)
|
Common Stock Issued
|
Accumulated
|
Total
|
||||||||||||||||||||||
|
Additional
|
Other
|
Common
|
||||||||||||||||||||||
|
Paid In
|
Retained
|
Comprehensive
|
Stockholders’
|
|||||||||||||||||||||
|
Shares
|
Par Value
|
Capital
|
Earnings
|
Income (Loss)
|
Equity
|
|||||||||||||||||||
|
Balance at Dec. 31, 2007
|
428,783 | $ | 1,071,957 | $ | 4,286,917 | $ | 963,916 | $ | (21,788 | ) | $ | 6,301,002 | ||||||||||||
|
Adoption of new accounting guidance for endorsement split-dollar life insurance, net of tax of $(1,038)
|
(1,640 | ) | (1,640 | ) | ||||||||||||||||||||
|
Net income
|
645,554 | 645,554 | ||||||||||||||||||||||
|
Changes in unrecognized amounts of pension and retiree medical benefits, net of tax of $(11,986)
|
(19,441 | ) | (19,441 | ) | ||||||||||||||||||||
|
Net derivative instrument fair value changes, net of tax of $(5,758)
|
(11,697 | ) | (11,697 | ) | ||||||||||||||||||||
|
Unrealized loss - marketable securities, net of tax of $(513)
|
(743 | ) | (743 | ) | ||||||||||||||||||||
|
Comprehensive income for 2008
|
613,673 | |||||||||||||||||||||||
|
Dividends declared:
|
||||||||||||||||||||||||
|
Cumulative preferred stock
|
(4,241 | ) | (4,241 | ) | ||||||||||||||||||||
|
Common stock
|
(415,678 | ) | (415,678 | ) | ||||||||||||||||||||
|
Issuances of common stock
|
25,009 | 62,523 | 372,061 | 434,584 | ||||||||||||||||||||
|
Share-based compensation
|
36,041 | 36,041 | ||||||||||||||||||||||
|
Balance at Dec. 31, 2008
|
453,792 | $ | 1,134,480 | $ | 4,695,019 | $ | 1,187,911 | $ | (53,669 | ) | $ | 6,963,741 | ||||||||||||
|
Net income
|
680,887 | 680,887 | ||||||||||||||||||||||
|
Changes in unrecognized amounts of pension and retiree medical benefits, net of tax of $(2,203)
|
(3,129 | ) | (3,129 | ) | ||||||||||||||||||||
|
Net derivative instrument fair value changes, net of tax of $4,224
|
6,678 | 6,678 | ||||||||||||||||||||||
|
Unrealized gain - marketable securities, net of tax of $284
|
411 | 411 | ||||||||||||||||||||||
|
Comprehensive income for 2009
|
684,847 | |||||||||||||||||||||||
|
Dividends declared:
|
||||||||||||||||||||||||
|
Cumulative preferred stock
|
(4,241 | ) | (4,241 | ) | ||||||||||||||||||||
|
Common stock
|
(445,356 | ) | (445,356 | ) | ||||||||||||||||||||
|
Issuances of common stock
|
3,717 | 9,293 | 48,679 | 57,972 | ||||||||||||||||||||
|
Share-based compensation
|
26,282 | 26,282 | ||||||||||||||||||||||
|
Balance at Dec. 31, 2009
|
457,509 | $ | 1,143,773 | $ | 4,769,980 | $ | 1,419,201 | $ | (49,709 | ) | $ | 7,283,245 | ||||||||||||
|
Net income
|
755,834 | 755,834 | ||||||||||||||||||||||
|
Changes in unrecognized amounts of pension and retiree medical benefits, net of tax of $(1,416)
|
(1,855 | ) | (1,855 | ) | ||||||||||||||||||||
|
Net derivative instrument fair value changes, net of tax of $(1,208)
|
(1,659 | ) | (1,659 | ) | ||||||||||||||||||||
|
Unrealized gain - marketable securities, net of tax of $89
|
130 | 130 | ||||||||||||||||||||||
|
Comprehensive income for 2010
|
752,450 | |||||||||||||||||||||||
|
Dividends declared:
|
||||||||||||||||||||||||
|
Cumulative preferred stock
|
(4,241 | ) | (4,241 | ) | ||||||||||||||||||||
|
Common stock
|
(469,091 | ) | (469,091 | ) | ||||||||||||||||||||
|
Issuances of common stock
|
24,825 | 62,061 | 426,717 | 488,778 | ||||||||||||||||||||
|
Share-based compensation
|
32,378 | 32,378 | ||||||||||||||||||||||
|
Balance at Dec. 31, 2010
|
482,334 | $ | 1,205,834 | $ | 5,229,075 | $ | 1,701,703 | $ | (53,093 | ) | $ | 8,083,519 | ||||||||||||
See Notes to Consolidated Financial Statements
XCEL ENERGY INC. AND SUBSIDIARIES
CONSOLIDATED STATEMENTS OF CAPITALIZATION
(amounts in thousands of dollars)
|
Dec. 31
|
||||||||
|
2010
|
2009
|
|||||||
|
Long-Term Debt
|
||||||||
|
NSP-Minnesota
|
||||||||
|
First Mortgage Bonds, Series due:
|
||||||||
|
Aug. 1, 2010, 4.75%
|
$ | — | $ | 175,000 | ||||
|
Aug. 28, 2012, 8%
|
450,000 | 450,000 | ||||||
|
Aug. 15, 2015, 1.95%
|
250,000 | — | ||||||
|
March 1, 2018, 5.25%
|
500,000 | 500,000 | ||||||
|
March 1, 2019, 8.5%
(b)
|
27,900 | 27,900 | ||||||
|
Sept. 1, 2019, 8.5%
(b)
|
100,000 | 100,000 | ||||||
|
July 1, 2025, 7.125%
|
250,000 | 250,000 | ||||||
|
March 1, 2028, 6.5%
|
150,000 | 150,000 | ||||||
|
April 1, 2030, 8.5%
(b)
|
69,000 | 69,000 | ||||||
|
July 15, 2035, 5.25%
|
250,000 | 250,000 | ||||||
|
June 1, 2036, 6.25%
|
400,000 | 400,000 | ||||||
|
July 1, 2037, 6.2%
|
350,000 | 350,000 | ||||||
|
Nov. 1, 2039, 5.35%
|
300,000 | 300,000 | ||||||
|
Aug. 15, 2040, 4.85%
|
250,000 | — | ||||||
|
Other
|
32 | 66 | ||||||
|
Unamortized discount
|
(9,020 | ) | (8,788 | ) | ||||
|
Total
|
3,337,912 | 3,013,178 | ||||||
|
Less current maturities
|
19 | 175,037 | ||||||
|
Total NSP-Minnesota long-term debt
|
$ | 3,337,893 | $ | 2,838,141 | ||||
|
PSCo
|
||||||||
|
First Mortgage Bonds, Series due:
|
||||||||
|
Oct. 1, 2012, 7.875%
|
$ | 600,000 | $ | 600,000 | ||||
|
March 1, 2013, 4.875%
|
250,000 | 250,000 | ||||||
|
April 1, 2014, 5.5%
|
275,000 | 275,000 | ||||||
|
Sept. 1, 2017, 4.375%
(b)
|
129,500 | 129,500 | ||||||
|
Aug. 1, 2018, 5.8%
|
300,000 | 300,000 | ||||||
|
Jan. 1, 2019, 5.1%
(b)
|
48,750 | 48,750 | ||||||
|
June 1, 2019, 5.125%
|
400,000 | 400,000 | ||||||
|
Nov. 15, 2020, 3.2%
|
400,000 | — | ||||||
|
Sept. 1, 2037, 6.25%
|
350,000 | 350,000 | ||||||
|
Aug. 1, 2038, 6.5%
|
300,000 | 300,000 | ||||||
|
Capital lease obligations, through 2060, 11.2% — 13.6%
|
190,223 | 183,026 | ||||||
|
Unamortized discount
|
(8,250 | ) | (7,324 | ) | ||||
|
Total
|
3,235,223 | 2,828,952 | ||||||
|
Less current maturities
|
6,970 | 3,964 | ||||||
|
Total PSCo long-term debt
|
$ | 3,228,253 | $ | 2,824,988 | ||||
|
SPS
|
||||||||
|
Unsecured Senior E Notes, due Oct. 1, 2016, 5.6%
|
$ | 200,000 | $ | 200,000 | ||||
|
Unsecured Senior G Notes, due Dec. 1, 2018, 8.75%
|
250,000 | 250,000 | ||||||
|
Unsecured Senior C and D Notes, due Oct. 1, 2033, 6%
|
100,000 | 100,000 | ||||||
|
Unsecured Senior F Notes, due Oct. 1, 2036, 6%
|
250,000 | 250,000 | ||||||
|
Pollution control obligations, securing pollution control revenue bonds, due:
|
||||||||
|
July 1, 2011, 5.2%
|
44,500 | 44,500 | ||||||
|
July 1, 2016, 8.5%
|
— | 25,000 | ||||||
|
Sept. 1, 2016, 5.75%
|
57,300 | 57,300 | ||||||
|
Unamortized discount
|
(4,033 | ) | (4,353 | ) | ||||
|
Total
|
897,767 | 922,447 | ||||||
|
Less current maturities
|
44,500 | — | ||||||
|
Total SPS long-term debt
|
$ | 853,267 | $ | 922,447 | ||||
See Notes to Consolidated Financial Statements
XCEL ENERGY INC. AND SUBSIDIARIES
CONSOLIDATED STATEMENTS OF CAPITALIZATION — (Continued)
(amounts in thousands of dollars)
|
Dec. 31
|
||||||||
|
2010
|
2009
|
|||||||
|
Long-Term Debt — continued
|
||||||||
|
NSP-Wisconsin
|
||||||||
|
First Mortgage Bonds, Series due:
|
||||||||
|
Oct. 1, 2018, 5.25%
|
$ | 150,000 | $ | 150,000 | ||||
|
Sept. 1, 2038, 6.375%
|
200,000 | 200,000 | ||||||
|
City of La Crosse Resource Recovery Bond, Series due Nov. 1, 2021, 6%
(a)
|
18,600 | 18,600 | ||||||
|
Fort McCoy System Acquisition, due Oct. 15, 2030, 7%
|
659 | 693 | ||||||
|
Other
|
1,954 | 2,015 | ||||||
|
Unamortized discount
|
(1,857 | ) | (1,965 | ) | ||||
|
Total
|
369,356 | 369,343 | ||||||
|
Less current maturities
|
1,502 | 34 | ||||||
|
Total NSP-Wisconsin long-term debt
|
$ | 367,854 | $ | 369,309 | ||||
|
Other Subsidiaries
|
||||||||
|
Various Eloigne Co. Affordable Housing Project Notes, due 2011-2045, 0% — 9%
|
$ | 61,039 | $ | 68,179 | ||||
|
Total
|
61,039 | 68,179 | ||||||
|
Less current maturities
|
5,088 | 7,344 | ||||||
|
Total other subsidiaries long-term debt
|
$ | 55,951 | $ | 60,835 | ||||
|
Xcel Energy Inc.
|
||||||||
|
Unsecured Senior Notes, Series due:
|
||||||||
|
Dec. 1, 2010, 7%
|
$ | — | $ | 358,636 | ||||
|
April 1, 2017, 5.613%
|
253,979 | 253,979 | ||||||
|
May 15, 2020, 4.7%
|
550,000 | — | ||||||
|
July 1, 2036, 6.5%
|
300,000 | 300,000 | ||||||
|
Junior Subordinated Notes, Series due:
|
||||||||
|
Jan. 1, 2068, 7.6%
|
400,000 | 400,000 | ||||||
|
Elimination of PSCo capital lease obligation with affiliates
|
(74,937 | ) | (70,557 | ) | ||||
|
Unamortized discount
|
(11,780 | ) | (11,715 | ) | ||||
|
Total
|
1,417,262 | 1,230,343 | ||||||
|
Less current maturities (including elimination of PSCo capital lease obligation)
|
(2,664 | ) | 357,435 | |||||
|
Total Xcel Energy Inc. long-term debt
|
$ | 1,419,926 | $ | 872,908 | ||||
|
Total long-term debt
|
$ | 9,263,144 | $ | 7,888,628 | ||||
|
Preferred Stockholders’ Equity
|
||||||||
|
Preferred Stock — authorized 7,000,000 shares of $100 par value; outstanding shares:
|
||||||||
|
2010: 1,049,800; 2009: 1,049,800
|
||||||||
|
$3.60 series, 275,000 shares
|
$ | 27,500 | $ | 27,500 | ||||
|
$4.08 series, 150,000 shares
|
15,000 | 15,000 | ||||||
|
$4.10 series, 175,000 shares
|
17,500 | 17,500 | ||||||
|
$4.11 series, 200,000 shares
|
20,000 | 20,000 | ||||||
|
$4.16 series, 99,800 shares
|
9,980 | 9,980 | ||||||
|
$4.56 series, 150,000 shares
|
15,000 | 15,000 | ||||||
|
Total preferred stockholders
’
equity
|
$ | 104,980 | $ | 104,980 | ||||
|
Common Stockholders’ Equity
|
||||||||
|
Common Stock — authorized 1,000,000,000 shares of $2.50 par value; outstanding shares:
|
||||||||
|
2010: 482,333,750; 2009: 457,509,263
|
$ | 1,205,834 | $ | 1,143,773 | ||||
|
Additional paid in capital
|
5,229,075 | 4,769,980 | ||||||
|
Retained earnings
|
1,701,703 | 1,419,201 | ||||||
|
Accumulated other comprehensive loss
|
(53,093 | ) | (49,709 | ) | ||||
|
Total common stockholders’ equity
|
$ | 8,083,519 | $ | 7,283,245 | ||||
|
(a)
Resource recovery financing.
|
||||||||
|
(b)
Pollution control financing.
|
See Notes to Consolidated Financial Statements
XCEL ENERGY INC. AND SUBSIDIARIES
NOTES TO CONSOLIDATED FINANCIAL STATEMENTS
1. Summary of Significant Accounting Policies
Business and System of Accounts —
Xcel Energy’s utility subsidiaries are principally engaged in the generation, purchase, transmission, distribution and sale of electricity and in the purchase, transportation, distribution and sale of natural gas. The utility subsidiaries are subject to regulation by the FERC and state utility commissions. All of the utility subsidiaries’ accounting records conform to the FERC uniform system of accounts or to systems required by various state regulatory commissions, which are the same in all material respects.
Principles of Consolidation —
In 2010, Xcel Energy’s continuing operations included the activity of NSP-Minnesota, NSP-Wisconsin, PSCo and SPS. These utility subsidiaries serve electric and natural gas customers in portions of Colorado, Michigan, Minnesota, New Mexico, North Dakota, South Dakota, Texas and Wisconsin. WGI, an interstate natural gas pipeline company, and WYCO, a joint venture with CIG to develop and lease natural gas pipeline, storage, and compression facilities, are also included in continuing regulated utility operations.
Xcel Energy’s nonregulated subsidiary in continuing operations is Eloigne, which invests in rental housing projects that qualify for low-income housing tax credits. Xcel Energy owns the following additional direct subsidiaries, some of which are intermediate holding companies with additional subsidiaries: Xcel Energy Wholesale Group Inc., Xcel Energy Markets Holdings Inc., Xcel Energy Ventures Inc., Xcel Energy Retail Holdings Inc., Xcel Energy Communications Group Inc., and Xcel Energy Services Inc. Xcel Energy and its subsidiaries collectively are referred to as Xcel Energy.
Xcel Energy uses the equity method of accounting for its investments in partnerships, joint ventures and certain projects for which it does not have a controlling financial interest. Under this method, a proportionate share of pretax income is recorded as equity earnings of unconsolidated subsidiaries. In the consolidation process, all intercompany transactions and balances are eliminated. Xcel Energy has investments in several plants and transmission facilities jointly owned with other utilities. Xcel Energy’s share of jointly owned facilities is recorded as property, plant and equipment, consistent with industry practice. See Note 5 to the consolidated financial statements for further discussion.
Revenue Recognition —
Revenues related to the sale of energy are generally recorded when service is rendered or energy is delivered to customers. However, the determination of the energy sales to individual customers is based on the reading of their meter, which occurs on a systematic basis throughout the month. At the end of each month, amounts of energy delivered to customers since the date of the last meter reading are estimated and the corresponding unbilled revenue is recognized. Xcel Energy presents its revenue net of any excise or other fiduciary-type taxes or fees.
Xcel Energy’s utility subsidiaries have various rate-adjustment mechanisms in place that currently provide for the recovery of natural gas and electric fuel costs, as well as purchased energy costs. These cost-adjustment tariffs may increase or decrease the level of costs recovered through base rates and are revised periodically for any difference between the total amount collected under the clauses and the recoverable costs incurred. Where applicable, under governing state regulatory commission rate orders, fuel cost over-recoveries (the excess of fuel revenue billed to customers over fuel costs incurred) are deferred as regulatory liabilities and under-recoveries (the excess of fuel costs incurred over fuel revenues billed to customers) are deferred as regulatory assets. A summary of significant rate-adjustment mechanisms follows:
|
|
●
|
NSP-Minnesota’s rates include a cost of fuel and purchased energy mechanism and a cost of gas recovery mechanism allowing recovery of the respective costs, which are trued-up on a two-month and annual basis, respectively. The electric cost of fuel and purchased energy mechanisms for NSP-Minnesota also provide a sharing among shareholders and customers of certain margins on short-term wholesale and commodity trading.
|
|
|
●
|
NSP-Minnesota’s rates include a CIP rider for cost recovery of conservation and energy management program costs as well as recovery of a financial incentive for meeting energy savings goals.
|
|
|
●
|
NSP-Minnesota operates under various service quality standards, which could require customer refunds if certain criteria are not met. NSP-Minnesota is allowed to recover certain costs associated with new transmission facilities through the TCR and certain costs associated with generation facilities through other rate riders.
|
|
|
●
|
NSP-Wisconsin’s retail rates in Wisconsin include a cost of gas adjustment clause for purchased natural gas, but not for purchased electric energy or electric fuel. Requests can be made for recovery of those electric costs prospectively through the rate review process, which normally occurs every two years, or an interim fuel-cost hearing process. Effective 2011, NSP-Wisconsin will submit a forward-looking annual fuel cost plan that will allow deferral of fuel cost under-collection or over-collection, subject to PSCW hearings and approval, and other requirements. NSP-Wisconsin’s wholesale electric rate schedules include an FCA to provide adjustments to billings and revenues for changes in the cost of fuel and purchased energy.
|
|
|
●
|
PSCo generally recovers all prudently incurred electric fuel and purchased energy costs through the ECA for PSCo’s retail jurisdiction. The ECA allows for sharing of margins on short-term energy sales and margins from the sale of SO
2
allowances.
|
|
|
●
|
PSCo generally recovers all purchased capacity costs through the PCCA for the company’s retail jurisdiction. The PCCA mechanism is revised annually. In October 2010, the CPUC approved the acquisition of generation assets from subsidiaries of Calpine Corporation and the associated cost recovery of the purchase through the PCCA mechanism on an interim basis until PSCo’s next electric rate case on or before April 30, 2012.
|
|
|
●
|
PSCo’s rates include annual adjustments for the recovery of conservation and energy management program costs, as well as a financial incentive based on its performance in achieving established goals through the DSMCA. PSCo is allowed to recover certain costs associated with renewable energy resources through a specific retail rate rider.
|
|
|
●
|
PSCo recovers costs associated with investment in transmission facilities made after December 2008 through the TCA rate rider.
|
|
|
●
|
In Texas, SPS recovers fuel and purchased energy costs through a fixed fuel and purchased energy recovery factor, which is part of SPS’ retail electric rates. The Texas retail fuel factors can change up to three times per year based on the projected costs of natural gas. In January 2010, the PUCT approved recovery of certain transmission investments and other transmission costs through the TCRF rider. In New Mexico, the NMPRC has authorized SPS to use a monthly adjustment factor for FPPCAC to recover fuel and purchased power costs, subject to ongoing NMPRC approvals and audits.
|
|
|
●
|
NSP-Minnesota, NSP-Wisconsin, PSCo and SPS sell firm power and energy in wholesale markets, which are regulated by the FERC. Certain of the rates charged on wholesale power sales include monthly wholesale fuel cost-recovery mechanisms. For NSP-Minnesota, these rates include cost recovery mechanisms indexed to retail rates, including the monthly cost of fuel and purchased energy recovery mechanisms.
|
Commodity Trading Operations —
All applicable gains and losses related to commodity trading activities, whether or not settled physically, are shown on a net basis in the consolidated statements of income.
Xcel Energy’s commodity trading operations are conducted by NSP-Minnesota, PSCo and SPS. Commodity trading activities are not associated with energy produced from Xcel Energy’s generation assets or energy and capacity purchased to serve native load. Commodity trading contracts are recorded at fair market value and commodity trading results include the impact of all margin-sharing mechanisms. See Note 11 to the consolidated financial statements for further discussion.
Fair Value Measurements
— Xcel Energy presents cash equivalents, interest rate derivatives, commodity derivatives and nuclear decommissioning fund assets at estimated fair values in its consolidated financial statements. Cash equivalents are recorded at cost plus accrued interest to approximate fair value. Changes in the observed trading prices and liquidity of cash equivalents, including commercial paper and money market funds, are also monitored as additional support for determining fair value, and losses are recorded in earnings if fair value falls below recorded cost. For interest rate derivatives, quoted prices based primarily on observable market interest rate curves are used as a primary input to establish fair value. For commodity derivatives, the most observable inputs available are generally used to determine the fair value of each contract. In the absence of a quoted price for an identical contract in an active market, Xcel Energy may use quoted prices for similar contracts, or internally prepared valuation models to determine fair value. For the nuclear decommissioning fund, published trading data and pricing models, generally using the most observable inputs available, are utilized to estimate fair value for each class of security.
Types of and Accounting for Derivative Instruments —
Xcel Energy and its subsidiaries use derivative instruments in connection with their interest rate, utility commodity price, vehicle fuel price, short-term wholesale and commodity trading activities, including forward contracts, futures, swaps and options. All derivative instruments not designated and qualifying for the normal purchases and normal sales exception, as defined by the accounting guidance for derivatives and hedging, are recorded on the consolidated balance sheets at fair value as derivative instruments valuation. This includes certain instruments used to mitigate market risk for the utility operations and all instruments related to the commodity trading operations. The classification of changes in fair value for those derivative instruments is dependent on the designation of a qualifying hedging relationship. Changes in fair value of derivative instruments not designated in a qualifying hedging relationship are reflected in current earnings or as a regulatory asset or liability. The classification is dependent on the applicability of specific regulation.
Gains or losses on hedging transactions for the sale of energy or energy-related products are primarily recorded as a component of revenue; hedging transactions for fuel used in energy generation are recorded as a component of fuel costs; hedging transactions for natural gas purchased for resale are recorded as a component of natural gas costs; hedging transactions for vehicle fuel costs are recorded as a component of capital projects or O&M costs; and interest rate hedging transactions are recorded as a component of interest expense. Certain utility subsidiaries are allowed to recover in electric or natural gas rates the costs of certain financial instruments purchased to reduce commodity cost volatility.
Cash Flow Hedges
— Qualifying hedging relationships are designated as a hedge of a forecasted transaction or future cash flow (cash flow hedge). The accounting for derivatives requires that the hedging relationship be highly effective and that a company formally designate a hedging relationship to apply hedge accounting. Xcel Energy and its subsidiaries formally document all hedging relationships in accordance with this guidance. The documentation includes, among other factors, the identification of the hedging instrument and the hedged transaction, as well as the risk management objectives and strategies for undertaking the hedging transaction. In addition, at inception and on a quarterly basis, Xcel Energy and its subsidiaries formally assess whether the derivative instruments being used are highly effective in offsetting changes in the cash flows of the hedged items.
Changes in the fair value of a derivative designated and qualified as a cash flow hedge, to the extent effective are included in OCI, or deferred as a regulatory asset or liability based on recovery mechanisms until earnings are affected by the hedged transaction. Xcel Energy discontinues hedge accounting prospectively when it has determined that a derivative no longer qualifies as an effective hedge, or when it is no longer probable that the hedged forecasted transaction will occur. To test the effectiveness of hedges, a hypothetical hedge is used to mirror all the critical terms of the hedged transaction and the dollar-offset method is utilized to assess the effectiveness of the actual hedge at inception and on an ongoing basis. Gains and losses related to discontinued hedges that were previously deferred in OCI or deferred as regulatory assets or liabilities will remain deferred until the hedged transaction is reflected in earnings, unless it is probable that the hedged forecasted transaction will not occur, in which case associated deferred amounts are immediately recognized in current earnings.
Normal Purchases and Normal Sales
— Xcel Energy’s utility subsidiaries enter into contracts for the purchase and sale of commodities for use in their business operations. Derivatives and hedging accounting guidance requires a company to evaluate these contracts to determine whether the contracts are derivatives. Certain contracts that meet the definition of a derivative may be exempted from derivative accounting as normal purchases or normal sales.
Xcel Energy evaluates all of its contracts at inception to determine if they are derivatives and if they meet the normal purchases and normal sales designation requirements. None of the contracts entered into within the commodity trading operations qualify for a normal purchases and normal sales designation.
See Note 11 to the consolidated financial statements for further discussion of Xcel Energy’s risk management and derivative activities.
Property, Plant and Equipment and Depreciation —
Property, plant and equipment is stated at original cost. The cost of plant includes direct labor and materials, contracted work, overhead costs and applicable interest expense. The cost of plant retired is charged to accumulated depreciation and amortization. Amounts recovered in rates for future removal costs are recorded as regulatory liabilities. Significant additions or improvements extending asset lives are capitalized, while repairs and maintenance costs are charged to expense as incurred. Maintenance and replacement of items determined to be less than units of property are charged to operating expenses as incurred. Planned major maintenance activities are charged to operating expense unless the cost represents the acquisition of an additional unit of property or the replacement of an existing unit of property. Property, plant and equipment also includes costs associated with property held for future use. Upon regulatory approval of deferred accounting for accelerated depreciation expenses, property, plant and equipment that is to be early decommissioned is reclassified as plant to be retired.
Xcel Energy records depreciation expense related to its plant using the straight-line method over the plant’s useful life. Actuarial and semi-actuarial life studies are performed on a periodic basis and submitted to the state and federal commissions for review. Upon acceptance by the various commissions, the resulting lives and net salvage rates are used to calculate depreciation. Depreciation expense, expressed as a percentage of average depreciable property, was approximately 3.0, 2.9, and 3.2 percent for the years ended Dec. 31, 2010, 2009 and 2008, respectively.
AFUDC —
AFUDC represents the cost of capital used to finance utility construction activity. AFUDC is computed by applying a composite pretax rate to qualified CWIP. The amount of AFUDC capitalized as a utility construction cost is credited to other nonoperating income (for equity capital) and interest charges (for debt capital). AFUDC amounts capitalized are included in Xcel Energy’s rate base for establishing utility service rates. In addition to construction-related amounts, AFUDC also is recorded to reflect returns on capital used to finance conservation programs in Minnesota.
Generally, AFUDC costs are recovered from customers as the related property is depreciated. However, in some cases commissions have approved a more current recovery of cost associated with large capital projects, resulting in a lower recognition of AFUDC.
Decommissioning —
Xcel Energy accounts for the future cost of decommissioning, or retirement, of its nuclear generating plants through annual depreciation accruals using an annuity approach designed to provide for full rate recovery of the future decommissioning costs. The decommissioning calculation covers all expenses, including decontamination and removal of radioactive material, and extends over the estimated lives of the plants. The calculation assumes that NSP-Minnesota and NSP-Wisconsin will recover those costs through rates. The fair value of external nuclear decommissioning fund investments are generally determined based on quoted market prices for those or similar investments. The fair values for commingled funds and international equity funds within the external nuclear decommissioning fund take into consideration the value of underlying fund investments. See Note 15 to the consolidated financial statements for further discussion on nuclear decommissioning.
Nuclear Fuel Expense —
Nuclear fuel expense, which is recorded as the nuclear generating plants use fuel, includes the cost of fuel used in the current period (including AFUDC), as well as future disposal costs of spent nuclear fuel and costs associated with the end-of-life fuel segments.
Nuclear Refueling Outage Costs
—
Xcel Energy uses a deferral and amortization method for nuclear refueling O&M costs. This method amortizes refueling outage costs over the period between refueling outages consistent with how the costs are recovered ratably in electric rates.
Leases
— Xcel Energy and its utility subsidiaries evaluate a variety of contracts for lease classification at inception, including purchased power agreements and rental arrangements for office space, vehicles, and equipment. Contracts determined to contain a lease because of per unit pricing that is other than fixed or market price, terms regarding the use of a particular asset, and other factors are evaluated further to determine if the arrangement is a capital lease.
Three PSCo contracts for the use of certain natural gas pipeline or storage facilities meet the capital lease criteria and are accounted for as capital leases. The assets acquired under these capital leases were initially recorded in property, plant and equipment at the lower of fair market value or the present value of future lease payments and are amortized over their actual contract term in accordance with practices allowed by regulators.
Variable Interest Entities
— Effective Jan. 1, 2010, Xcel Energy adopted new guidance on consolidation of variable interest entities. The guidance requires enterprises to consider the activities that most significantly impact an entity’s financial performance and power to direct those activities, when determining whether an enterprise is a variable interest entity’s primary beneficiary.
Under its purchased power agreements, Xcel Energy’s utility subsidiaries purchase power from independent power producing entities that own natural gas or biomass fueled power plants. Through various mechanisms in certain purchased power agreements, Xcel Energy incurs variable fuel costs, and consequently these mechanisms have been determined to create variable interests in the independent power producing entities. Certain independent power producing entities are therefore variable interest entities. Xcel Energy has concluded that these entities are not required to be consolidated in its consolidated financial statements because it does not have the power to direct the activities that most significantly impact the entities’ economic performance.
Eloigne and NSP-Wisconsin have entered into limited partnerships for the construction and operation of affordable rental housing developments which qualify for low-income housing tax credits. Xcel Energy has determined Eloigne and NSP-Wisconsin’s low-income housing limited partnerships to be variable interest entities primarily due to contractual arrangements within each limited partnership that establish sharing of ongoing voting control and profits and losses that does not consistently align with the partners’ proportional equity ownership. Xcel Energy has determined that Eloigne and NSP-Wisconsin have the power to direct the activities that most significantly impact these entities’ economic performance, and therefore Xcel Energy consolidates these limited partnerships in its consolidated financial statements.
Environmental Costs —
Environmental costs are recorded when it is probable Xcel Energy is liable for the costs and the liability can be reasonably estimated. Costs are deferred as a regulatory asset if it is probable that the costs will be recovered from customers in future rates. Otherwise, the costs are expensed. If an environmental expense is related to facilities currently in use, such as emission-control equipment, the cost is capitalized and depreciated over the life of the plant.
Estimated remediation costs, excluding inflationary increases, are recorded. The estimates are based on experience, an assessment of the current situation and the technology currently available for use in the remediation. The recorded costs are regularly adjusted as estimates are revised and remediation proceeds. If several designated responsible parties exist, costs are estimated and recorded only for Xcel Energy’s share of the cost. Any future costs of restoring sites where operation may extend indefinitely are treated as a capitalized cost of plant retirement. The depreciation expense levels recoverable in rates include a provision for removal expenses, which may include final remediation costs. Removal costs recovered in rates are classified as a regulatory liability.
Legal Costs —
Litigation accruals are recorded when it is probable Xcel Energy is liable for the costs and the liability can be reasonably estimated. External legal fees related to settlements are expensed as incurred.
Income Taxes —
Xcel Energy accounts for income taxes using the asset and liability method, which requires the recognition of deferred tax assets and liabilities for the expected future tax consequences of events that have been included in the financial statements. Xcel Energy defers income taxes for all temporary differences between pretax financial and taxable income, and between the book and tax bases of assets and liabilities. Xcel Energy uses the tax rates that are scheduled to be in effect when the temporary differences are expected to reverse. The effect of a change in tax rates on deferred tax assets and liabilities is recognized in income in the period that includes the enactment date.
Deferred tax assets are reduced by a valuation allowance if, based on the weight of available evidence, it is more likely than not that some portion or all of the deferred tax asset will not be realized. In making such a determination, all available positive and negative evidence, including scheduled reversals of deferred tax liabilities, projected future taxable income, tax planning strategies and recent financial operations, is considered.
Due to the effects of past regulatory practices, when deferred taxes were not required to be recorded, the reversal of some temporary differences are accounted for as current income tax expense. Investment tax credits are deferred and their benefits amortized over the book depreciable lives of the related property. Utility rate regulation also has resulted in the recognition of certain regulatory assets and liabilities related to income taxes, which are summarized in Note 16 to the consolidated financial statements. See Note 6 to the consolidated financial statements for more information on income taxes.
Xcel Energy follows the applicable accounting guidance to measure and disclose uncertain tax positions that it has taken or expects to take in its income tax returns. In accordance with this guidance, Xcel Energy recognizes a tax position in its consolidated financial statements when it is more likely than not that the position will be sustained upon examination based on the technical merits of the position. Recognition of changes in uncertain tax positions are reflected as a component of income tax expense.
Xcel Energy reports interest and penalties related to income taxes within the other income and interest charges sections in the consolidated statements of income.
Xcel Energy and its subsidiaries file consolidated federal income tax returns and combined and separate state income tax returns. Federal income taxes paid by Xcel Energy, as parent of the Xcel Energy consolidated group, are allocated to the Xcel Energy subsidiaries based on separate company computations of tax. A similar allocation is made for state income taxes paid by Xcel Energy in connection with combined state filings. The holding company also allocates its own income tax benefits to its direct subsidiaries based on the relative positive tax liabilities of the subsidiaries.
Use of Estimates —
In recording transactions and balances resulting from business operations, Xcel Energy uses estimates based on the best information available. Estimates are used for such items as plant depreciable lives, AROs, decommissioning, tax provisions, uncollectible amounts, environmental costs, unbilled revenues, jurisdictional fuel and energy cost allocations and actuarially determined benefit costs. The recorded estimates are revised when better information becomes available or when actual amounts can be determined. Those revisions can affect operating results. The depreciable lives of certain plant assets are reviewed annually and revised, if appropriate.
Cash and Cash Equivalents —
Xcel Energy considers investments in certain instruments, including commercial paper and money market funds, with a remaining maturity of three months or less at the time of purchase, to be cash equivalents.
Restricted Cash —
At Dec. 31, 2010 and 2009, Xcel Energy had restricted cash of $1 million. The restricted cash balances primarily represent deposits held in conjunction with short-term wholesale and commodity trading activities. These balances are presented as a component of other assets on the consolidated balance sheets.
Inventory —
All inventory is recorded at average cost.
Regulatory Accounting —
Our regulated utility subsidiaries account for certain income and expense items in accordance with accounting guidance for regulated operations. Under this guidance:
|
|
●
|
Certain costs, which would otherwise be charged to expense, are deferred as regulatory assets based on the expected ability to recover the costs in future rates; and
|
|
|
●
|
Certain credits, which would otherwise be reflected as income, are deferred as regulatory liabilities based on the expectation the amounts will be returned to customers in future rates, or because the amounts were collected in rates prior to the costs being incurred.
|
Estimates of recovering deferred costs and returning deferred credits are based on specific ratemaking decisions or precedent for each item. Regulatory assets and liabilities are amortized consistent with the treatment in the rate setting process.
If restructuring or other changes in the regulatory environment occur, regulated utility subsidiaries may no longer be eligible to apply this accounting treatment, and may be required to eliminate such regulatory assets and liabilities from their balance sheets. Such changes could have a material effect on Xcel Energy’s results of operations in the period the write-offs are recorded. See Note 16 to the consolidated financial statements for further discussion of regulatory assets and liabilities.
Conservation Programs
—
Xcel Energy’s utility subsidiaries have implemented programs in many of their retail jurisdictions to assist customers in conserving energy and reducing peak demand on the electric and natural gas systems. These programs include, but are not limited to, efficiency and redesign programs and rebates for the purchase of items such as compact fluorescent bulbs, saver switches, and energy-efficient heating and cooling appliances.
The costs incurred for DSM and CIP programs are deferred if it is probable that future revenue, in an amount at least equal to the deferred amount, will be provided to permit recovery of the previously incurred cost, rather than to provide for expected future amounts of similar programs. For incentive programs designed to allow recovery of lost margins and/or conservation performance incentives, recorded revenues are limited to those amounts expected to be collected within twenty four months following the end of the annual period in which they are earned.
For PSCo, SPS and NSP-Minnesota, DSM and CIP program costs are recovered through a combination of base rate revenue and rider mechanisms. The revenue billed to customers recovers incurred costs for conservation programs and also incentive amounts that are designed to encourage Xcel Energy’s achievement of energy conservation goals and compensate for related lost sales margin. For these utility subsidiaries, regulatory assets are recognized to reflect the amount of costs or earned incentives that have not yet been collected from customers. NSP-Wisconsin recovers approved conservation program costs in base rate revenue, without the use of rider mechanisms.
Deferred Financing Costs —
Other assets included deferred financing costs of approximately $74 million and $69 million, net of amortization, at Dec. 31, 2010 and 2009, respectively. Xcel Energy is amortizing these financing costs over the remaining maturity periods of the related debt.
Debt premiums, discounts and expenses are amortized over the life of the related debt. The premiums, discounts and expenses associated with refinanced debt are deferred and amortized over the life of the related new issuance, in accordance with regulatory guidelines.
Guarantees —
Xcel Energy and its subsidiaries recognize, upon issuance or modification of a guarantee, a liability for the fair market value of the obligations that have been assumed in issuing the guarantee. This liability includes consideration of specific triggering events and other conditions which may modify the ongoing obligation to perform under the guarantee.
The obligation recognized is reduced over the term of the guarantee as Xcel Energy is released from risk under the guarantee. See Note 12 to the consolidated financial statements for specific details of issued guarantees.
Accounts Receivable and Allowance for Bad Debts —
Accounts receivable are stated at the actual billed amount net of an allowance for bad debts. Xcel Energy establishes an allowance for uncollectible receivables based on a policy that reflects its expected exposure to the credit risk of customers.
Renewable Energy Credits —
RECs are marketable environmental commodities that represent proof that energy was generated from eligible renewable energy sources. RECs are awarded upon delivery of the associated energy and can be bought and sold. RECs are typically used as a form of measurement of compliance to RPS enacted by those states that are encouraging construction and consumption from renewable energy sources, but can also be sold separately from the energy produced. Currently, utility subsidiaries acquire RECs from the generation or purchase of renewable power.
When RECs are acquired in the course of generation or purchased as a result of meeting load obligations, they are recorded as inventory at cost. RECs acquired for trading purposes are recorded as other investments and are also recorded at cost. The cost of RECs that are utilized for compliance purposes is recorded as electric fuel and purchased power expense. The net margin on sales of RECs for trading purposes is recorded as electric utility operating revenues, net of any margin sharing requirements. As a result of state regulatory orders, Xcel Energy reduces recoverable fuel costs for the value of certain RECs and records the cost of future compliance requirements that are recoverable in future rates as regulatory assets.
Emission Allowances —
Emission allowances are recorded at cost, including the annual SO
2
and NOx emission allowance entitlement received at no cost from the EPA. Xcel Energy follows the inventory accounting model for all emission allowances. The sales of emission allowances are included in electric utility operating revenues and the operating activities section of the consolidated statements of cash flows.
Reclassifications
—
Certain prior year amounts have been reclassified to conform to the current year presentation, including amounts related to discontinued operations, regulatory assets and liabilities, and deferred income taxes in the consolidated balance sheet and consolidated statements of cash flows. These reclassifications did not have an impact on income from continuing operations.
Subsequent Events
—
Management has evaluated the impact of events occurring after Dec. 31, 2010 up to the date of issuance of these consolidated financial statements. These statements contain all necessary adjustments and disclosures resulting from that evaluation.
2. Accounting Pronouncements
Consolidation of Variable Interest Entities
— In June 2009, the FASB issued new guidance on consolidation of variable interest entities. The guidance affects various elements of consolidation, including the determination of whether an entity is a variable interest entity and whether an enterprise is a variable interest entity’s primary beneficiary. These updates to the ASC were effective for interim and annual periods beginning after Nov. 15, 2009. Xcel Energy implemented the guidance on Jan. 1, 2010, and the implementation did not have a material impact on its consolidated financial statements. See Note 14 to the consolidated financial statements for further information and required disclosures regarding variable interest entities.
Fair Value Measurement Disclosures
— In January 2010, the FASB issued
Fair Value Measurements and Disclosures (Topic 820) — Improving Disclosures about Fair Value Measurements (ASU No. 2010-06)
, which updates the Codification to require new disclosures for assets and liabilities measured at fair value. The requirements include expanded disclosure of valuation methodologies for fair value measurements, transfers between levels of the fair value hierarchy, and gross rather than net presentation of certain changes in Level 3 fair value measurements. The updates to the Codification contained in ASU No. 2010-06 were effective for interim and annual periods beginning after Dec. 15, 2009, except for requirements related to gross presentation of certain changes in Level 3 fair value measurements, which are effective for interim and annual periods beginning after Dec. 15, 2010. Xcel Energy implemented the portions of the guidance required on Jan. 1, 2010, and the implementation did not have a material impact on its consolidated financial statements. See Note 11 to the consolidated financial statements for further information and required disclosures.
3. Selected Balance Sheet Data
|
(Thousands of Dollars)
|
Dec. 31, 2010
|
Dec. 31, 2009
|
||||||
|
Accounts receivable, net
|
||||||||
|
Accounts receivable
|
$ | 773,037 | $ | 786,255 | ||||
|
Less allowance for bad debts
|
(54,563 | ) | (56,103 | ) | ||||
| $ | 718,474 | $ | 730,152 | |||||
|
Inventories
|
||||||||
|
Materials and supplies
|
$ | 196,081 | $ | 172,993 | ||||
|
Fuel
|
188,566 | 221,457 | ||||||
|
Natural gas
|
176,153 | 171,755 | ||||||
| $ | 560,800 | $ | 566,205 | |||||
|
Property, plant and equipment, net
|
||||||||
|
Electric plant
|
$ | 24,993,582 | $ | 22,402,657 | ||||
|
Natural gas plant
|
3,463,343 | 3,269,934 | ||||||
|
Common and other property
|
1,555,287 | 1,492,463 | ||||||
|
Plant to be retired
(a)
|
236,606 | 48,572 | ||||||
|
Construction work in progress
|
1,186,433 | 1,769,545 | ||||||
|
Total property, plant and equipment
|
31,435,251 | 28,983,171 | ||||||
|
Less accumulated depreciation
|
(11,068,820 | ) | (10,776,667 | ) | ||||
|
Nuclear fuel
|
1,837,697 | 1,737,469 | ||||||
|
Less accumulated amortization
|
(1,541,046 | ) | (1,435,677 | ) | ||||
| $ | 20,663,082 | $ | 18,508,296 | |||||
|
(a)
|
In 2009, in accordance with the CPUC’s approval of PSCo’s 2007 Colorado resource plan and subsequent rate case decisions, PSCo agreed to early retire its Cameo Units 1 and 2, Arapahoe Units 3 and 4 and Zuni Units 1 and 2 facilities. In 2010, in response to the CACJA, the CPUC approved the early retirement of Cherokee Units 1, 2 and 3, Arapahoe Unit 3 and Valmont Unit 5 between 2011 and 2017. Amounts are presented net of accumulated depreciation. See Item 1 – Public Utility Regulation for further discussion.
|
4. Borrowings and Other Financing Instruments
Money Pool
—
Xcel Energy and its utility subsidiaries have established a money pool arrangement that allows for short-term investments in and borrowings from the utilities between each other. The holding company may make investments in the utility subsidiaries at market-based interest rates; however, the money pool arrangement does not allow the utility subsidiaries to make investments in the holding company. The money pool investments and borrowings are eliminated upon consolidation.
Commercial Paper —
Xcel Energy and its utility subsidiaries meet their short-term liquidity requirements primarily through the issuance of commercial paper and borrowings under their credit facilities. The following table presents commercial paper outstanding for Xcel Energy:
|
(Millions of Dollars)
|
Dec. 31, 2010
|
Dec. 31, 2009
|
||||||
|
Commercial paper outstanding
|
$
|
466
|
$
|
459
|
||||
|
Weighted average interest rate
|
0.40
|
%
|
0.36
|
%
|
||||
|
Commercial paper borrowing limit
|
$
|
2,177
|
$
|
2,177
|
||||
Credit Facilities — Xcel Energy and its utility subsidiaries must have revolving credit facilities in place at least equal to the amount of their respective commercial paper borrowing limits and cannot issue commercial paper in an aggregate amount exceeding available capacity under these credit agreements. All credit facility bank borrowings and outstanding commercial paper reduce the available capacity under the respective credit facilities as presented in the table below. At Dec. 31, 2010 and Dec. 31, 2009, there were no credit facility bank borrowings outstanding.
At Dec. 31, 2010, Xcel Energy and its utility subsidiaries had the following committed credit facilities available:
|
(Millions of Dollars)
|
Credit Facility
|
Drawn
(a)
|
Available
|
Original Term
|
Maturity
|
||||||||||
|
NSP-Minnesota
|
$ | 482 | $ | 5 | $ | 477 |
Five year
|
December 2011
|
|||||||
|
PSCo
|
675 | 275 | 400 |
Five year
|
December 2011
|
||||||||||
|
SPS
|
248 | 49 | 199 |
Five year
|
December 2011
|
||||||||||
|
Xcel Energy — Holding Company
|
772 | 148 | 624 |
Five year
|
December 2011
|
||||||||||
|
NSP-Wisconsin
(b)
|
— | — | — | ||||||||||||
|
Total
|
$ | 2,177 | $ | 477 | $ | 1,700 | |||||||||
|
(a)
|
Includes outstanding commercial paper and issued and outstanding letters of credit.
|
|
(b)
|
NSP-Wisconsin does not have a separate credit facility; however, it has a borrowing agreement with NSP-Minnesota, see further discussion below.
|
The lines of credit provide short-term financing in the form of notes payable to banks, letters of credit and back-up support for commercial paper borrowings. Xcel Energy and its utility subsidiaries have the right to request an extension of the final maturity date by one year. The maturity extension is subject to majority bank group approval.
|
|
●
|
Each credit facility has a financial covenant requiring that the debt-to-total capitalization ratio of each entity be less than or equal to 65 percent. Each entity was in compliance at Dec. 31, 2010 and 2009 as evidenced by the table below:
|
|
Debt-to-Total Capitalization Ratio
|
||||||||
|
2010
|
2009
|
|||||||
|
NSP-Minnesota
|
49 | % | 48 | % | ||||
|
PSCo
|
46 | 45 | ||||||
|
SPS
|
50 | 49 | ||||||
|
Xcel Energy — Consolidated
|
55 | 55 | ||||||
If Xcel Energy or any of its utility subsidiaries do not comply with the covenant, an event of default may be declared, and if not remedied, any outstanding amounts due under the facility can be declared due by the lender.
|
|
●
|
Each credit facility has a cross default provision that provides Xcel Energy will be in default on its borrowings under the facility if any of its subsidiaries, comprising more than 15 percent of the consolidated assets of Xcel Energy on a consolidated basis, defaults on any of its indebtedness greater than $50 million.
|
|
|
●
|
The interest rates under these lines of credit are based on either the agent bank’s prime rate or the applicable LIBOR, plus a borrowing margin based on the applicable debt rating. Based on current credit ratings, the borrowing margin is 35 basis points for Xcel Energy and SPS, and 25 basis points for NSP-Minnesota and PSCo.
|
|
|
●
|
The commitment fees, also based on applicable long-term credit ratings, are calculated on the unused portion of the lines of credit at 8 basis points per year for Xcel Energy and SPS and at 6 basis points per year for NSP-Minnesota and PSCo.
|
|
|
●
|
At Dec. 31, 2010, the credit facilities were used to provide backup for $466.4 million of commercial paper outstanding and $10.1 million of letters of credit. At Dec. 31, 2009, the credit facilities were used to provide backup for $459.0 million of commercial paper outstanding and $21.0 million of letters of credit.
|
|
|
●
|
Xcel Energy plans to syndicate new credit agreements at the Holding Company, NSP-Minnesota, PSCo, SPS, and NSP-Wisconsin during the first quarter of 2011 to replace the existing agreements. The total anticipated size of the new credit facilities will be approximately $2.45 billion.
|
|
|
●
|
In an order dated Feb. 4, 2011, NSP-Wisconsin received regulatory approval to establish a commercial paper program authorized for $150 million and enter into a back-up credit facility. Subsequently, NSP-Wisconsin’s intercompany borrowing arrangement with NSP-Minnesota will be terminated.
|
Long-Term Borrowings
All property of NSP-Minnesota and NSP-Wisconsin and the electric property of PSCo are subject to the liens of their first mortgage indentures. In addition, certain payments made by SPS under its pollution-control obligations are pledged to secure obligations of the Red River Authority of Texas.
Maturities of long-term debt are:
|
(Millions of Dollars)
|
||||
|
2011
|
$ | 55 | ||
|
2012
|
1,059 | |||
|
2013
|
259 | |||
|
2014
|
282 | |||
|
2015
|
257 | |||
Xcel Energy
In May 2010, Xcel Energy issued $550 million of 4.70 percent unsecured senior notes, due May 15, 2020. Xcel Energy added the net proceeds from the sale of the notes to its general funds and used the proceeds to repay commercial paper and fund equity investments in its utility subsidiaries.
Xcel Energy has entered into a Replacement Capital Covenant (RCC). Under the terms of the RCC, Xcel Energy has agreed not to redeem or repurchase all or part of the $400 million of 7.6 percent junior subordinated notes due 2068 (Junior Subordinated Notes) prior to 2038 unless qualifying securities are issued to non-affiliates in a replacement offering in the 180 days prior to the redemption or repurchase date. Qualifying securities include those that have equity-like characteristics that are the same as, or more equity-like than, the applicable characteristics of the Junior Subordinated Notes at the time of redemption or repurchase.
NSP-Minnesota
In August 2010, NSP-Minnesota issued $250 million of 1.95 percent first mortgage bonds, due Aug. 15, 2015 and $250 million of 4.85 percent first mortgage bonds, due Aug. 15, 2040. NSP-Minnesota added the net proceeds from the sale of the bonds to its general funds and applied a portion of the proceeds to the repayment of short-term debt, including short-term debt incurred to fund the repayment at maturity of $175 million of 4.75 percent first mortgage bonds due Aug. 1, 2010. The balance of the net proceeds was used for general corporate purposes, including the funding of capital expenditures.
In November 2009, NSP-Minnesota issued $300 million of 5.35 percent first mortgage bonds, due Nov. 1, 2039. NSP-Minnesota added the net proceeds from the sale of the first mortgage bonds to its general funds and applied a portion of the proceeds to the repayment of commercial paper and borrowings under the utility money pool arrangement incurred to fund the repayment at maturity of $250 million of 6.875 percent unsecured senior notes due Aug. 1, 2009.
NSP-Wisconsin
In March 2009, NSP-Wisconsin redeemed its 7.375 percent $65.0 million first mortgage bonds due Dec. 1, 2026.
PSCo
In November 2010, PSCo issued $400 million of 3.2 percent first mortgage bonds, due Nov. 15, 2020. PSCo used the proceeds to fund a portion of the $739 million purchase price of the Rocky Mountain Energy Center and the Blue Spruce Energy Center generation assets. PSCo funded the balance of the purchase price of these generation assets through short-term borrowings and a capital contribution from Xcel Energy. See Note 19 to the consolidated financial statements for further discussion.
In June 2009, PSCo issued $400 million of 5.125 percent first mortgage bonds, due June 1, 2019. PSCo added the proceeds from the sale of the first mortgage bonds to its general funds and applied a portion of the net proceeds to fund the payment at maturity of $200 million of 6.875 percent unsecured senior notes due July 15, 2009.
SPS
In February 2010, SPS redeemed its $25.0 million pollution control obligations, securing pollution control revenue bonds, due July 1, 2016.
5. Joint Ownership of Generation, Transmission and Gas Facilities
Following are the investments by Xcel Energy’s subsidiaries in jointly owned generation, transmission and gas facilities and the related ownership percentages as of Dec. 31, 2010:
|
Construction
|
||||||||||||||||
|
Plant in
|
Accumulated
|
Work in
|
||||||||||||||
|
(Thousands of Dollars)
|
Service
|
Depreciation
|
Progress
|
Ownership %
|
||||||||||||
|
NSP-Minnesota
|
||||||||||||||||
|
Electric Generation:
|
||||||||||||||||
|
Sherco Unit 3
|
$ | 538,043 | $ | 350,093 | $ | 13,494 | 59.0 | |||||||||
|
Sherco Common Facilities Units 1, 2 and 3
|
126,437 | 79,988 | 5,601 | 75.0 | ||||||||||||
|
Sherco Substation
|
4,790 | 2,486 | — | 59.0 | ||||||||||||
|
Electric Transmission:
|
||||||||||||||||
|
Grand Meadow Line and Substation
|
11,204 | 603 | — | 50.0 | ||||||||||||
|
CapX2020 Transmission
|
19,449 | 4,075 | 48,758 | 55.6 | ||||||||||||
|
Total NSP-Minnesota
|
$ | 699,923 | $ | 437,245 | $ | 67,853 | ||||||||||
|
Construction
|
||||||||||||||||
|
Plant in
|
Accumulated
|
Work in
|
||||||||||||||
|
(Thousands of Dollars)
|
Service
|
Depreciation
|
Progress
|
Ownership %
|
||||||||||||
|
PSCo
|
||||||||||||||||
|
Electric Generation:
|
||||||||||||||||
|
Hayden Unit 1
|
$ | 89,176 | $ | 59,191 | $ | — | 75.5 | |||||||||
|
Hayden Unit 2
|
82,079 | 54,680 | 21,405 | 37.4 | ||||||||||||
|
Hayden Common Facilities
|
33,553 | 13,286 | 170 | 53.1 | ||||||||||||
|
Craig Units 1 and 2
|
53,878 | 32,344 | 284 | 9.7 | ||||||||||||
|
Craig Common Facilities 1, 2 and 3
|
33,710 | 15,444 | 2,534 | 6.5 - 9.7 | ||||||||||||
|
Comanche Unit 3
|
882,626 | 11,069 | 130 | 66.7 | ||||||||||||
|
Comanche Common Facilities
|
4,246 | 80 | 3,205 | 82.0 | ||||||||||||
|
Electric Transmission:
|
||||||||||||||||
|
Transmission and other facilities,
including substations
|
148,002 | 55,249 | 2,080 |
Various
|
||||||||||||
|
Gas Transportation:
|
||||||||||||||||
|
Rifle to Avon
|
16,278 | 6,369 | 4 | 60.0 | ||||||||||||
|
Total PSCo
|
$ | 1,343,548 | $ | 247,712 | $ | 29,812 | ||||||||||
NSP-Minnesota is part owner of Sherco Unit 3, an 860 MW, coal-fueled electric generating unit. NSP-Minnesota is the operating agent under the joint ownership agreement. NSP-Minnesota’s share of operating expenses and construction expenditures are included in the applicable utility accounts. CapX2020 is a joint initiative of 11 transmission-owning utilities in Minnesota and the surrounding region to expand the electric transmission grid by approximately 700 miles. The estimated cost of this initiative is $1.9 billion consisting of four major transmission projects with the goal of providing continued reliable and affordable electric service. NSP-Minnesota’s and NSP-Wisconsin’s percentage ownership varies by project and its projected share of the investment is approximately $1 billion. In 2010, construction began on two of the major projects (Fargo, N.D. to Monticello, Minn. and Bemidji, Minn. to Grand Rapids, Minn. lines). In-service dates for the entire project are currently estimated to be from 2011 through 2015. Each of the respective owners is responsible for funding its portion of the construction costs.
PSCo’s current operational assets include approximately 820 MW of jointly owned generating capacity. PSCo’s share of operating expenses and construction expenditures are included in the applicable utility accounts. Each of the respective owners is responsible for the issuance of its own securities to finance its portion of the construction costs. PSCo began major construction on a new jointly owned 750 MW, coal-fired unit in Pueblo, Colo. in January 2006. The new unit, Comanche Unit 3, was completed and commercial operations occurred in July 2010. PSCo is the operating agent under the joint ownership agreement. PSCo’s ownership interest in Comanche Unit 3 is 66.7 percent, and interest in the common facilities (assets used by all three Comanche units) is approximately 82 percent.
6. Income Taxes
COLI
— In 2007, Xcel Energy and the U.S. government settled an ongoing dispute regarding PSCo’s right to deduct interest expense on policy loans related to its COLI program that insured lives of certain PSCo employees. These COLI policies were owned and managed by PSRI, a wholly owned subsidiary of PSCo. Xcel Energy paid the U.S. government a total of $64.4 million in settlement of the U.S. government’s claims for tax, penalty, and interest for tax years 1993 through 2007. Xcel Energy surrendered the policies to its insurer on Oct. 31, 2007, without recognizing a taxable gain. As a result of the settlement, the lawsuit filed by Xcel Energy in the U.S. District Court was dismissed and the Tax Court proceedings were dismissed in December 2010 and January 2011.
As part of the Tax Court proceedings, during the first quarter of 2010, Xcel Energy and the IRS reached an agreement in principle after a comprehensive financial reconciliation of Xcel Energy’s statement of account, dating back to tax year 1993. Upon completion of this review, PSRI recorded a net non-recurring tax and interest charge of approximately $10 million (including $7.7 million tax expense and $2.3 million interest expense, net of tax), during the first quarter of 2010. During the third quarter of 2010, Xcel Energy and the IRS came to final agreement on the applicable interest netting computations related to these tax years. Accordingly, PSRI recorded a reduction to expense of $0.6 million, net of tax, during the third quarter of 2010.
In July 2010, Xcel Energy, PSCo and PSRI entered into a settlement agreement with Provident related to all claims asserted by Xcel Energy, PSCo and PSRI against Provident in a lawsuit associated with the discontinued COLI program. Under the terms of the settlement, Xcel Energy, PSCo and PSRI were paid $25 million by Provident and Reassure America Life Insurance Company in the third quarter of 2010. The $25 million proceeds were not subject to income taxes.
Medicare Part D Subsidy Reimbursements
—
In March 2010, the Patient Protection and Affordable Care Act was signed into law. The law includes provisions to generate tax revenue to help offset the cost of the new legislation. One of these provisions reduces the deductibility of retiree health care costs to the extent of federal subsidies received by plan sponsors that provide retiree prescription drug benefits equivalent to Medicare Part D coverage, beginning in 2013. Based on this provision, Xcel Energy is subject to additional taxes and is required to reverse previously recorded tax benefits in the period of enactment. Xcel Energy expensed approximately $17 million of previously recognized tax benefits relating to Medicare Part D subsidies during the first quarter of 2010. Xcel Energy does not expect the $17 million of additional tax expense to recur in future periods.
Federal Audit
—
Xcel Energy files a consolidated federal income tax return. During the first quarter of 2010, the IRS completed an examination of Xcel Energy’s federal income tax returns of tax years 2006 and 2007. The IRS did not propose any material adjustments for those tax years. The statute of limitations applicable to Xcel Energy’s 2006 federal income tax return expired in August 2010. The statute of limitations applicable to Xcel Energy’s 2007 federal income tax return expires in September 2011. The IRS commenced an examination of tax years 2008 and 2009 in the third quarter of 2010. As of Dec. 31, 2010, the IRS had not proposed any material adjustments to tax years 2008 and 2009.
State Audits
—
Xcel Energy files consolidated state tax returns based on income in its major operating jurisdictions of Colorado, Minnesota, Texas, and Wisconsin, and various other state income-based tax returns. As of Dec. 31, 2010, Xcel Energy’s earliest open tax years that are subject to examination by state taxing authorities in its major operating jurisdictions are as follows:
|
State
|
Year
|
||
|
Colorado
|
2004 | ||
|
Minnesota
|
2006 | ||
|
Texas
|
2006 | ||
|
Wisconsin
|
2006 |
In 2009, Xcel Energy received a request for information from the state of Minnesota relating to tax years 2002 through 2007 in order to determine whether to undertake an audit of those years. After its review in the second quarter of 2010, the state of Minnesota indicated that it does not intend to perform audit procedures on these years at this time. Also, during the second quarter of 2010, the state of Texas completed its audit of tax years 2006 and 2007. No change in tax liability was proposed. As of Dec. 31, 2010, there were no state income tax audits in progress.
Unrecognized Tax Benefits
—
The unrecognized tax benefit balance includes permanent tax positions, which if recognized would affect the annual ETR. In addition, the unrecognized tax benefit balance includes temporary tax positions for which the ultimate deductibility is highly certain but for which there is uncertainty about the timing of such deductibility. A change in the period of deductibility would not affect the ETR but would accelerate the payment of cash to the taxing authority to an earlier period.
A reconciliation of the amount of unrecognized tax benefit is as follows:
|
(Millions of Dollars)
|
Dec. 31, 2010
|
Dec. 31, 2009
|
||||||
|
Unrecognized tax benefit - Permanent tax positions
|
$ | 5.9 | $ | 10.6 | ||||
|
Unrecognized tax benefit - Temporary tax positions
|
34.6 | 19.7 | ||||||
|
Unrecognized tax benefit balance
|
$ | 40.5 | $ | 30.3 | ||||
A reconciliation of the beginning and ending amount of unrecognized tax benefit is as follows:
|
(Millions of Dollars)
|
2010
|
2009
|
2008
|
|||||||||
|
Balance at Jan. 1
|
$ | 30.3 | $ | 42.1 | $ | 30.6 | ||||||
|
Additions based on tax positions related to the current year - continuing operations
|
13.4 | 12.6 | 9.7 | |||||||||
|
Reductions based on tax positions related to the current year - continuing operations
|
(0.6 | ) | (1.8 | ) | (1.0 | ) | ||||||
|
Additions for tax positions of prior years - continuing operations
|
5.5 | 6.8 | 7.6 | |||||||||
|
Reductions for tax positions of prior years - continuing operations
|
(1.8 | ) | (2.3 | ) | (0.3 | ) | ||||||
|
Additions for tax positions of prior years - discontinued operations
|
— | — | 2.3 | |||||||||
|
Reductions for tax positions of prior years - discontinued operations
|
(6.3 | ) | — | — | ||||||||
|
Settlements with taxing authorities - continuing operations
|
— | (27.1 | ) | (4.0 | ) | |||||||
|
Lapse of applicable statutes of limitations - continuing operations
|
— | — | (2.8 | ) | ||||||||
|
Balance at Dec. 31
|
$ | 40.5 | $ | 30.3 | $ | 42.1 | ||||||
The unrecognized tax benefit amounts were reduced by the tax benefits associated with NOL and tax credit carryforwards. The amounts of tax benefits associated with NOL and tax credit carryfowards are as follows:
|
(Millions of Dollars)
|
Dec. 31, 2010
|
Dec. 31, 2009
|
||||||
|
NOL and tax credit carryforwards
|
$ | (38.0 | ) | $ | (29.3 | ) | ||
The increase in the unrecognized tax benefit balance of $10.2 million in 2010 was due to the addition of similar uncertain tax positions related to current and prior years’ activity, partially offset by a decrease due to a clarification of tax law in a court ruling issued to an unrelated taxpayer, coupled with the completion of the state of Minnesota review of tax years 2002 through 2007. Xcel Energy’s amount of unrecognized tax benefits could significantly change in the next 12 months as the IRS audit progresses and state audits resume. At this time, due to the uncertain nature of the audit process, it is not reasonably possible to estimate an overall range of possible change.
The payable for interest related to unrecognized tax benefits is partially offset by the interest benefit associated with NOL and tax credit carryforwards. A reconciliation of the beginning and ending amount of the payable for interest related to unrecognized tax benefits reported is as follows:
|
(Millions of Dollars)
|
2010
|
2009
|
2008
|
|||||||||
|
Payable for interest related to unrecognized tax benefits at Jan. 1
|
$ | (0.2 | ) | $ | (0.4 | ) | $ | (5.3 | ) | |||
|
Interest income (expense) related to unrecognized tax benefits - continuing operations
|
(0.6 | ) | 1.5 | 3.9 | ||||||||
|
Interest income (expense) related to unrecognized tax benefits - discontinued operations
|
0.5 | (1.3 | ) | 1.0 | ||||||||
|
Payable for interest related to unrecognized tax benefits at Dec. 31
|
$ | (0.3 | ) | $ | (0.2 | ) | $ | (0.4 | ) | |||
No amounts were accrued for penalties related to unrecognized tax benefits as of Dec. 31, 2010, 2009 or 2008. During 2008, a $1.0 million liability for penalties accrued as of Dec. 31, 2007 was reversed.
Other Income Tax Matters —
NOL amounts represent the amount of the tax loss that is carried forward and tax credits represent the deferred tax asset. NOL and tax credit carryforwards as of Dec. 31 were as follows:
|
(Millions of Dollars)
|
2010
|
2009
|
||||||
|
Federal NOL carryforward
|
$ | 989 | $ | 523 | ||||
|
Federal tax credit carryforwards
|
205 | 183 | ||||||
|
State NOL carryforwards
|
1,363 | 1,244 | ||||||
|
Valuation allowances for state NOL carryforwards
|
(32 | ) | (76 | ) | ||||
|
State tax credit carryforwards, net of federal detriment
|
21 | 19 | ||||||
|
Valuation allowances for state tax credit carryforwards, net of federal benefit
|
— | (5 | ) | |||||
The federal carryforward periods expire between 2021 and 2030. The state carryforward periods expire between 2011 and 2030.
Total income tax expense from continuing operations differs from the amount computed by applying the statutory federal income tax rate to income before income tax expense. The following reconciles such differences for the years ending Dec. 31:
| 2010 | 2009 | 2008 | ||||||||||
|
Federal statutory rate
|
35.0 | % | 35.0 | % | 35.0 | % | ||||||
|
Increases (decreases) in tax from:
|
||||||||||||
|
State income taxes, net of federal income tax benefit
|
3.9 | 4.0 | 4.4 | |||||||||
|
Tax credits recognized, net of federal income tax expense
|
(1.8 | ) | (2.0 | ) | (1.8 | ) | ||||||
|
Regulatory differences — utility plant items
|
(1.1 | ) | (2.0 | ) | (2.1 | ) | ||||||
|
Resolution of income tax audits and other
|
0.6 | 0.8 | — | |||||||||
|
Change in unrecognized tax benefits
|
0.1 | (0.5 | ) | (0.1 | ) | |||||||
|
Life insurance policies
|
(0.8 | ) | (0.2 | ) | (0.2 | ) | ||||||
|
Previously recognized Medicare Part D subsidies
|
1.4 | — | — | |||||||||
|
Other, net
|
(0.6 | ) | — | (0.8 | ) | |||||||
|
Effective income tax rate from continuing operations
|
36.7 | % | 35.1 | % | 34.4 | % | ||||||
The components of Xcel Energy’s income tax expense for the years ending Dec. 31 were:
|
(Thousands of Dollars)
|
2010
|
2009
|
2008
|
|||||||||
|
Current federal tax expense (benefit)
|
$ | 16,657 | $ | (39,886 | ) | $ | 56,044 | |||||
|
Current state tax expense
|
12,580 | 8,672 | 26,904 | |||||||||
|
Current change in unrecognized tax expense (benefit)
|
(2,982 | ) | (7,627 | ) | 3,891 | |||||||
|
Current tax credits
|
(944 | ) | — | — | ||||||||
|
Deferred federal tax expense
|
376,073 | 360,252 | 236,307 | |||||||||
|
Deferred state tax expense
|
52,543 | 69,947 | 38,758 | |||||||||
|
Deferred change in unrecognized tax expense (benefit)
|
4,641 | 2,387 | (4,535 | ) | ||||||||
|
Deferred tax credits
|
(15,580 | ) | (16,005 | ) | (11,485 | ) | ||||||
|
Deferred investment tax credits
|
(6,353 | ) | (6,426 | ) | (7,198 | ) | ||||||
|
Total income tax expense from continuing operations
|
$ | 436,635 | $ | 371,314 | $ | 338,686 | ||||||
The components of Xcel Energy’s net deferred tax liability (current and noncurrent) at Dec. 31 were as follows:
|
(Thousands of Dollars)
|
2010
|
2009
|
||||||
|
Deferred tax liabilities:
|
||||||||
|
Differences between book and tax bases of property
|
$ | 3,853,425 | $ | 3,224,842 | ||||
|
Regulatory assets
|
242,760 | 232,887 | ||||||
|
Other
|
219,035 | 198,912 | ||||||
|
Total deferred tax liabilities
|
$ | 4,315,220 | $ | 3,656,641 | ||||
|
Deferred tax assets:
|
||||||||
|
NOL carryforward
|
$ | 423,728 | $ | 251,089 | ||||
|
Tax credit carryforward
|
226,022 | 196,475 | ||||||
|
Unbilled revenue - fuel costs
|
69,358 | 62,056 | ||||||
|
Regulatory liabilities
|
51,600 | 48,426 | ||||||
|
Environmental remediation
|
41,696 | 40,874 | ||||||
|
Deferred investment tax credits
|
39,916 | 39,968 | ||||||
|
Rate refund
|
8,971 | 40,956 | ||||||
|
Accrued liabilities and other
|
58,891 | 43,507 | ||||||
|
Total deferred tax assets
|
$ | 920,182 | $ | 723,351 | ||||
|
Net deferred tax liability
|
$ | 3,395,038 | $ | 2,933,290 | ||||
7. Preferred and Common Stock
Preferred Stock —
Xcel Energy has authorized 7,000,000 shares of preferred stock with a $100 par value. At Dec. 31, 2010 and 2009, Xcel Energy had six series of preferred stock outstanding, redeemable at its option at prices ranging from $102 to $103.75 per share plus accrued dividends. The holders of the $3.60 series preferred stock are entitled to three votes per each share held. The holders of the other series of preferred stock are entitled to one vote per share. In the event dividends payable on the preferred stock of any series outstanding is in arrears in an amount equal to four quarterly dividends, the holders of preferred stocks, voting as a class, are entitled to elect the smallest number of directors necessary to constitute a majority of the Board of Directors. The holders of common stock, voting as a class, are entitled to elect the remaining directors.
The charters of some of Xcel Energy’s subsidiaries also authorize the issuance of preferred stock. However, at Dec. 31, 2010 and 2009, there were no preferred shares of subsidiaries outstanding. The following table lists preferred shares by subsidiary:
|
Preferred
Shares Authorized
|
Par Value | Preferred Shares Outstanding | |||||||||
|
SPS
|
10,000,000 | $ | 1.00 |
None
|
|||||||
|
PSCo
|
10,000,000 | 0.01 |
None
|
||||||||
Common Stock — In August 2010, Xcel Energy entered into forward agreements in connection with a public offering of 21.85 million shares of Xcel Energy common stock. Under the forward agreements, Xcel Energy agreed to issue to the banking counterparty 21.85 million shares of its common stock, including an over allotment of 2.85 million shares.
On Nov. 29, 2010, Xcel Energy settled the forward agreements by physically delivering 21.85 million shares of common stock and receiving cash proceeds of $449.8 million. The forward price used to determine cash proceeds was calculated based on the August 2010 public offering price of Xcel Energy’s common stock, adjusted for underwriting fees, as well as a daily adjustment based on the federal funds rate less a spread of 0.50 percent, and a decrease to reflect the dividend paid on Xcel Energy’s common stock in October 2010.
The equity forward instruments were accounted for as equity and recorded at fair value at the execution of the forward agreements, and were not subsequently adjusted for changes in fair value until settlement. Based upon the market terms of the equity forward instruments, including initial pricing of $20.855 per share determined based on the August 2010 offering price of Xcel Energy’s common stock of $21.50 per share less underwriting fees of $0.645 per share, and as no premium on the transaction was due either party to the forward agreements at execution, no fair value was recorded to equity for the instruments when the forward agreements were entered. At settlement, the proceeds of $449.8 million were recorded to common stock and additional paid in capital.
In September 2008, Xcel Energy issued 17,250,000 shares of common stock to underwriters at a price of $20.10 per share. The underwriters re-offered the shares to the public at a price of $20.20 per share plus a commission of $0.05 per share from the purchasers.
Common Stock Equivalents —
Xcel Energy has common stock equivalents consisting of equity forward instruments, 401(k) equity awards and stock options. Restricted stock units and performance shares are included as common stock equivalents when all necessary conditions for issuance have been satisfied by the end of the reporting period.
In 2010, 2009 and 2008, Xcel Energy had approximately 5.4 million, 7.6 million and 8.1 million weighted average options outstanding, respectively, that were antidilutive, and therefore, excluded from the earnings per share calculation. The dilutive impact of common stock equivalents affecting earnings per share was as follows for the years ending Dec. 31:
|
2010
|
2009
|
2008
|
||||||||||||||||||||||||||||||||||
|
(Amounts in thousands,
except per share data)
|
Income
|
Shares
|
Per
Share
Amount
|
Income
|
Shares
|
Per
Share
Amount
|
Income
|
Shares
|
Per
Share
Amount
|
|||||||||||||||||||||||||||
|
Net income
|
$ | 755,834 | $ | 680,887 | $ | 645,554 | ||||||||||||||||||||||||||||||
|
Less: Dividend requirements on preferred stock
|
(4,241 | ) | (4,241 | ) | (4,241 | ) | ||||||||||||||||||||||||||||||
|
Basic earnings per share:
|
||||||||||||||||||||||||||||||||||||
|
Earnings available to common shareholders
|
751,593 | 462,052 | $ | 1.63 | 676,646 | 456,433 | $ | 1.48 | 641,313 | 437,054 | $ | 1.47 | ||||||||||||||||||||||||
|
Effect of dilutive securities:
|
||||||||||||||||||||||||||||||||||||
|
Equity forward instruments
|
— | 700 | — | — | — | — | ||||||||||||||||||||||||||||||
|
Convertible senior notes
|
— | — | — | — | 4,498 | 4,144 | ||||||||||||||||||||||||||||||
|
401(k) equity awards
|
— | 639 | — | 705 | — | 596 | ||||||||||||||||||||||||||||||
|
Stock options
|
— | — | — | 1 | — | 19 | ||||||||||||||||||||||||||||||
|
Diluted earnings per share:
|
||||||||||||||||||||||||||||||||||||
|
Earnings available to common shareholders and assumed conversions
|
$ | 751,593 | 463,391 | $ | 1.62 | $ | 676,646 | 457,139 | $ | 1.48 | $ | 645,811 | 441,813 | $ | 1.46 | |||||||||||||||||||||
Common Stock Dividends Per Share — Historically, Xcel Energy has paid quarterly dividends to its shareholders. Dividends on common stock are paid as declared by the Board of Directors. Dividends declared per share for the quarters of 2010, 2009 and 2008 were:
|
Dividends Per Share
|
2010
|
2009
|
2008
|
|||||||||
|
First quarter
|
$ | 0.2450 | $ | 0.2375 | $ | 0.2300 | ||||||
|
Second quarter
|
0.2525 | 0.2450 | 0.2375 | |||||||||
|
Third quarter
|
0.2525 | 0.2450 | 0.2375 | |||||||||
|
Fourth quarter
|
0.2525 | 0.2450 | 0.2375 | |||||||||
| $ | 1.0025 | $ | 0.9725 | $ | 0.9425 | |||||||
Dividend and Other Capital-Related Restrictions — The Articles of Incorporation of Xcel Energy place restrictions on the amount of common stock dividends it can pay when preferred stock is outstanding. Under the provisions, dividend payments may be restricted if Xcel Energy’s capitalization ratio (on a holding company basis only, not on a consolidated basis) is less than 25 percent. For these purposes, the capitalization ratio is equal to (i) common stock plus surplus divided by (ii) the sum of common stock plus surplus plus long-term debt. Based on this definition, Xcel Energy’s holding company capitalization ratio at Dec. 31, 2010 and 2009 was 84 percent and 85 percent, respectively. Therefore, the restrictions do not place any effective limit on Xcel Energy’s ability to pay dividends.
In addition, NSP-Minnesota’s first mortgage indenture places certain restrictions on the amount of cash dividends it can pay to Xcel Energy, the holder of its common stock. Even with these restrictions, NSP-Minnesota could have paid more than $1.1 billion in additional cash dividends on common stock at Dec. 31, 2009, or $1.1 billion at Dec. 31, 2010.
The issuance of securities by Xcel Energy generally is not subject to regulatory approval. However, utility financings and certain intra-system financings are subject to the jurisdiction of the applicable state regulatory commissions and/or the FERC under the Federal Power Act.
|
|
●
|
PSCo currently has authorization to issue up to $1.4 billion of long-term debt and up to $800 million of short-term debt.
|
|
|
●
|
SPS currently has authorization to issue up to $200 million of long-term debt and up to $400 million of short-term debt.
|
|
|
●
|
NSP-Wisconsin currently has authorization to issue up to $50 million of long-term debt and $150 million of short-term debt.
|
|
|
●
|
NSP-Minnesota has authorization to issue long-term securities provided the equity-to-total capitalization ratio remains between 46.9 percent and 57.3 percent and to issue short-term debt provided it does not exceed 15 percent of total capitalization. Total capitalization for NSP-Minnesota cannot exceed $8.1 billion.
|
Xcel Energy believes these authorizations are adequate and will seek additional authorization when necessary; however, there can be no assurance that additional authorization will be granted on the timeframe or in the amounts requested.
|
|
●
|
The FERC has granted a blanket authorization for certain intra-system financings involving holding companies. The utility subsidiaries participate in the money pool, in amounts ranging from $250 million for each of NSP-Minnesota and PSCo, to $100 million for SPS. NSP-Wisconsin is not authorized and does not participate in the money pool. NSP-Wisconsin currently has regulatory authorization to borrow up to $150 million in short-term borrowings from NSP-Minnesota. In an order dated Feb. 4, 2011, NSP-Wisconsin received regulatory approval to establish a commercial paper program authorized for $150 million and enter into a back-up credit facility. Subsequently, NSP-Wisconsin’s intercompany borrowing arrangement with NSP-Minnesota will be terminated.
|
8. Share-Based Compensation
Stock Options —
Xcel Energy has incentive compensation plans under which stock options and other performance incentives are awarded to key employees. Xcel Energy has not granted stock options since December 2001. The weighted average number of common and potentially dilutive shares outstanding used to calculate Xcel Energy’s diluted earnings per share include the dilutive effect of stock options and other stock awards based on the treasury stock method. The options normally have a term of 10 years and generally become exercisable from three to five years after grant date or upon specified circumstances.
Activity in stock options was as follows:
|
2010
|
2009
|
2008
|
||||||||||||||||||||||
|
Average
|
Average
|
Average
|
||||||||||||||||||||||
|
Exercise
|
Exercise
|
Exercise
|
||||||||||||||||||||||
|
(Awards in Thousands)
|
Awards
|
Price
|
Awards
|
Price
|
Awards
|
Price
|
||||||||||||||||||
|
Outstanding and exercisable at Jan. 1
|
6,657 | $ | 28.17 | 8,460 | $ | 27.05 | 9,547 | $ | 27.19 | |||||||||||||||
|
Exercised
|
(51 | ) | 19.31 | (794 | ) | 19.84 | (12 | ) | 18.28 | |||||||||||||||
|
Forfeited
|
— | — | (11 | ) | 20.04 | (67 | ) | 22.28 | ||||||||||||||||
|
Expired
|
(4,108 | ) | 26.91 | (998 | ) | 25.40 | (1,008 | ) | 28.76 | |||||||||||||||
|
Outstanding and exercisable at Dec. 31
|
2,498 | 30.42 | 6,657 | 28.17 | 8,460 | 27.05 | ||||||||||||||||||
|
Range of Exercise Prices
|
||||||||||||
| $25.90 to $30.00 |
$30.01 to
$40.00
|
$40.01 to
$47.00
|
||||||||||
|
Options outstanding and exercisable
:
|
||||||||||||
|
Number outstanding and exercisable
|
1,981,225 | 14,343 | 502,780 | |||||||||
|
Weighted average remaining contractual life (years)
|
0.9 | 0.8 | 0.5 | |||||||||
|
Weighted average exercise price
|
$ | 26.20 | $ | 35.95 | $ | 46.88 | ||||||
|
(Thousands of Dollars)
|
2010
|
2009
|
2008
|
|||||||||
|
Market value of exercises
|
$ | 1,087 | $ | 16,429 | $ | 250 | ||||||
|
Intrinsic value of options exercised
(a)
|
93 | 670 | 36 | |||||||||
(a)
Intrinsic value is calculated as market price at exercise date less the option exercise price.
Cash received from stock options exercised and actual tax benefit realized for the tax deductions from stock options exercised during the years ended Dec. 31 were as follows:
|
(Thousands of Dollars)
|
2010
|
2009
|
2008
|
|||||||||
|
Cash received from stock options exercised
|
$ | 1,033 | $ | 15,759 | $ | 214 | ||||||
|
Tax benefit realized for the tax deductions from stock options exercised
|
40 | 277 | — | |||||||||
Restricted Stock — Certain employees may elect to receive shares of common or restricted stock under the Xcel Energy Executive Annual Incentive Award Plan. Restricted stock vests and settles in equal annual installments over a three-year period. Xcel Energy reinvests dividends on the restricted stock it holds while restrictions are in place. Restrictions also apply to the additional shares of restricted stock acquired through dividend reinvestment. If the restricted shares are forfeited, the employee is not entitled to the dividends on those shares. Restricted stock has a fair value equal to the market trading price of Xcel Energy’s stock at the grant date.
Xcel Energy granted shares of restricted stock for the years ended Dec. 31 as follows:
|
(Shares in Thousands)
|
2010
|
2009
|
2008
|
|||||||||
|
Granted shares
|
44 | — | 28 | |||||||||
|
Grant date fair value
|
$ | 20.47 | $ | — | $ | 20.62 | ||||||
A summary of the changes of nonvested restricted stock for the year ended Dec. 31, 2010 were as follows:
| (Shares in Thousands) | Shares | Weighted Average Grant Date Fair Value | ||||||
|
Nonvested restricted stock at Jan. 1, 2010
|
32 | $ | 21.77 | |||||
|
Granted
|
44 | 20.47 | ||||||
|
Vested
|
(23 | ) | 22.85 | |||||
|
Dividend equivalents
|
2 | 21.98 | ||||||
|
Nonvested restricted stock at Dec. 31, 2010
|
55 | 20.28 | ||||||
Restricted Stock Units (RSUs) — Xcel Energy’s Board of Directors has granted RSUs under the Xcel Energy Omnibus Incentive Plan approved by the shareholders in 2000 and under the Xcel Energy 2005 Omnibus Incentive Plan. Both plans allow the attachment of various performance goals to the RSUs granted. The performance goals may vary by plan year. The restrictions on RSUs will not lapse, even if performance goals have been achieved, until two years after the grant date.
Payout of the RSUs and the lapsing of restrictions on the transfer of units are based on one of two separate performance criteria. A portion of the awarded units, plus associated earned dividend equivalents, will be settled and the restricted period will lapse after Xcel Energy achieves a specified EPS growth (adjusted for COLI for grant years prior to 2008). Additionally, Xcel Energy’s annual dividend paid on its common stock must remain at a specified amount per share or greater. EPS growth will be measured annually at the end of each fiscal year. The remaining awarded units, plus associated earned dividend equivalents, will be settled and the restricted period will lapse after the results of environmental performance, measured as a percentage of target performance, meets or exceeds threshold performance. The environmental performance indicators will be measured annually at the end of each fiscal year. If the performance criteria have not been met within four years of the date of grant, all associated units shall be forfeited.
The 2005 RSUs measured on EPS growth and all 2006 RSUs met their targets as of Dec. 31, 2007 and were settled in shares in February 2008. In addition, the 2007 environmental RSUs met their target as of Dec. 31, 2009 and were settled in shares in February 2010. The 2007 RSUs measured on EPS growth and all 2008 RSUs met their targets as of Dec. 31, 2010 and were settled in shares in February 2011.
The RSUs granted for the years ended Dec. 31 were as follows:
|
(Units in Thousands)
|
2010
|
2009
|
2008
|
|||||||||
|
Granted units
|
601 | 597 | 460 | |||||||||
|
Weighted average grant date fair value
|
$ | 21.26 | $ | 18.88 | $ | 20.60 | ||||||
A summary of the changes of nonvested RSUs for the year ended Dec. 31, 2010, were as follows:
|
(Units in Thousands)
|
Units
|
Weighted Average Grant Date Fair Value
|
||||||
|
Nonvested restricted stock units at Jan. 1, 2010
|
1,199 | $ | 19.52 | |||||
|
Granted
|
601 | 21.26 | ||||||
|
Forfeited
|
(106 | ) | 19.84 | |||||
|
Vested
|
(627 | ) | 20.11 | |||||
|
Dividend equivalents
|
71 | 19.95 | ||||||
|
Nonvested restricted stock units at Dec. 31, 2010
|
1,138 | 20.12 | ||||||
The total fair value of nonvested RSUs as of Dec. 31, 2010 was $26.8 million and the weighted average remaining contractual life was 2.7 years.
There were approximately 627,000 RSUs that vested during the year ended Dec. 31, 2010. The total fair value of RSUs vested during the year ended 2010 was $14.8 million. There were approximately 41,000 RSUs that vested during the year ended Dec. 31, 2009. The total fair value of RSUs vested during the year ended 2009 was $0.8 million. No RSUs vested during the year ended Dec. 31, 2008.
Stock Equivalent Unit Plan —
Non-employee members of the Xcel Energy Board of Directors receive annual awards of stock equivalent units, with each unit having a value equal to one share of Xcel Energy common stock. The annual grants are vested as of the date of each member’s election to the board of directors; there is no further service or other condition attached to the annual grants after the member has been elected to the board. Additionally, directors may elect to receive their fees in stock equivalent units in lieu of cash, and similarly have no further service or other conditions attached. Dividends on Xcel Energy’s common stock are converted to stock equivalent units and granted based on the number of stock equivalent units held by each participant as of the dividend date. The stock equivalent units are payable as a distribution of Xcel Energy’s common stock upon a director’s termination of service.
The stock equivalent units granted for the years ended Dec. 31 were as follows:
|
(Units in Thousands)
|
2010
|
2009
|
2008
|
|||||||||
|
Granted units
|
66 | 72 | 85 | |||||||||
|
Grant date fair value
|
$ | 21.14 | $ | 17.87 | $ | 20.46 | ||||||
A summary of the stock equivalent unit changes for the year ended Dec. 31, 2010 are as follows:
|
(Units in Thousands)
|
Units
|
Weighted Average Grant Date Fair Value
|
||||||
|
Stock equivalent units at Jan. 1, 2010
|
622 | $ | 19.50 | |||||
|
Granted
|
66 | 21.14 | ||||||
|
Units distributed
|
(241 | ) | 19.42 | |||||
|
Dividend equivalents
|
24 | 22.04 | ||||||
|
Stock equivalent units at Dec. 31, 2010
|
471 | 19.90 | ||||||
PSP Awards — Xcel Energy’s Board of Directors has granted PSP awards under the Xcel Energy Omnibus Incentive Plan approved by the shareholders in 2000 and under the Xcel Energy 2005 Omnibus Incentive Plan. Both plans allow Xcel Energy to attach various performance goals to the PSP awards granted. The PSP awards have been historically dependent on a single measure of performance, Xcel Energy’s TSR measured over a three-year period. Xcel Energy’s TSR is compared to the TSR of other companies in the EEI Investor-Owned Electrics index. At the end of the three-year period, potential payouts of the PSP awards range from 0 percent to 200 percent, depending on Xcel Energy’s TSR compared to the peer group.
The PSP awards granted for the years ended Dec. 31 were as follows:
|
(In Thousands)
|
2010
|
2009
|
2008
|
|||||||||
|
Awards granted
|
225 | 207 | 216 | |||||||||
The total amounts of performance awards settled during the years ended Dec. 31 were as follows:
|
(In Thousands)
|
2010
|
2009
|
2008
|
|||||||||
|
Awards settled
|
267 | 293 | 328 | |||||||||
|
Settlement amount (cash and common stock)
|
$ | 5,460 | $ | 5,195 | $ | 6,826 | ||||||
The amount of cash used to settle Xcel Energy’s PSP awards was $2.7 million and $2.6 million in 2010 and 2009, respectively.
Share-Based Compensation Expense
— The vesting of the RSUs is predicated on the achievement of a performance condition, which is the achievement of an earnings per share or environmental measures target. RSU awards and restricted stock are considered to be equity awards, since the plan settlement determination (shares or cash) resides with Xcel Energy and not the participants. In addition, these awards have not been previously settled in cash and Xcel Energy plans to continue electing share settlement. The grant date fair value of RSUs and restricted stock is expensed as employees vest in their rights to those awards.
The PSP awards have been historically settled partially in cash, and therefore, do not qualify as an equity award, but rather are accounted for as a liability award. As liability awards, the fair value on which ratable expense is based, as employees vest in their rights to those awards, is remeasured each period based on the current stock price and performance conditions, and final expense is based on the market value of the shares on the date the award is settled.
The compensation costs related to share-based awards for the years ended Dec. 31 were as follows:
|
(Thousands of Dollars)
|
2010
|
2009
|
2008
|
|||||||||
|
Compensation cost for share-based awards
(a) (b)
|
$ | 35,807 | $ | 29,672 | $ | 23,912 | ||||||
|
Tax benefit recognized in income
|
13,964 | 11,471 | 9,241 | |||||||||
|
Total compensation cost capitalized
|
3,646 | 3,636 | 3,666 | |||||||||
|
(a)
|
Compensation costs for share-based payment arrangements is included in other O&M expense in the consolidated statements of income.
|
|
(b)
|
Included in compensation cost for share-based awards are matching contributions related to the Xcel Energy 401(k) plan, which totaled $20.7 million, $19.3 million, and $18.6 million for the years ended 2010, 2009, and 2008, respectively.
|
The maximum aggregate number of shares of common stock available for issuance under the Xcel Energy Omnibus Incentive Plan, approved in 2000, is 14.5 million and 8.3 million shares were approved for issuance under the Xcel Energy 2005 Omnibus Incentive Plan. Under the Executive Annual Incentive Plan approved in 2000, the total number of shares approved for issuance is 1.5 million, and 1.2 million shares were approved for issuance under the Executive Annual Incentive Plan in 2005.
As of Dec. 31, 2010 and 2009, there was approximately $18.6 million and $17.9 million, respectively, of total unrecognized compensation cost related to nonvested share-based compensation awards. Xcel Energy expects to recognize that cost over a weighted average period of 1.8 years.
9. Benefit Plans and Other Postretirement Benefits
Xcel Energy offers various benefit plans to its employees. Approximately 50 percent of employees that receive benefits are represented by several local labor unions under several collective-bargaining agreements. At Dec. 31, 2010:
|
|
●
|
NSP-Minnesota had 2,060 and NSP-Wisconsin had 402 bargaining employees covered under a collective-bargaining agreement, which expired at the end of 2010. NSP-Minnesota also had an additional 219 nuclear operation bargaining employees covered under several collective-bargaining agreements, which expired at various dates through September 2010. As of Dec. 31, 2010, contract negotiations with the NSP-Minnesota and NSP-Wisconsin bargaining groups were in process. On Feb. 16, 2011, the negotiations were settled via arbitration and a new collective-bargaining agreement with an expiration date of Dec. 31, 2013 went into effect.
|
|
|
●
|
PSCo had 2,142 bargaining employees covered under a collective-bargaining agreement, which expires in May 2014.
|
|
|
●
|
SPS had 804 bargaining employees covered under a collective-bargaining agreement, which expires in October 2011.
|
Effective Jan. 1, 2009, Xcel Energy adopted new guidance on employers’ disclosures about pension and postretirement benefit plan assets. The new guidance expands employers’ disclosure requirements for benefit plan assets, including investment policies and strategies, major categories of plan assets, and information regarding fair value measurements consistent with the disclosures for entities’ recurring fair value measurements.
The accounting guidance for fair value measurements establishes a hierarchal framework for disclosing the observability of the inputs utilized in measuring fair value. The three Levels defined by the hierarchy and examples of each Level are as follows:
Level 1 — Quoted prices are available in active markets for identical assets as of the reporting date. The types of assets included in Level 1 are highly liquid and actively traded instruments with quoted prices, such as common stocks listed by the New York Stock Exchange.
Level 2 — Pricing inputs are other than quoted prices in active markets, but are either directly or indirectly observable as of the reporting date. The types of assets included in Level 2 are typically either comparable to actively traded securities or contracts or priced with models using highly observable inputs, such as corporate bonds with pricing based on market interest rate curves and recent trades of similarly rated securities.
Level 3 — Significant inputs to pricing have little or no observability as of the reporting date. The types of assets included in Level 3 are those with inputs requiring significant management judgment or estimation, such as asset and mortgage backed securities, for which subjective risk-based adjustments to estimated yield and forecasted prepayments are significant inputs.
Pension Benefits
Xcel Energy has several noncontributory, defined benefit pension plans that cover almost all employees. Benefits are based on a combination of years of service, the employee’s average pay and social security benefits. Xcel Energy’s policy is to fully fund into an external trust the actuarially determined pension costs recognized for ratemaking and financial reporting purposes, subject to the limitations of applicable employee benefit and tax laws.
Xcel Energy bases its investment-return assumption on expected long-term performance for each of the investment types included in its pension asset portfolio. Xcel Energy considers the actual historical returns achieved by its asset portfolio over the past 20-year or longer period, as well as the long-term return levels projected and recommended by investment experts. The historical weighted average annual return for the past 20 years for the Xcel Energy portfolio of pension investments is 9.72 percent, which is greater than the current assumption level. The pension cost determination assumes a forecasted mix of investment types over the long term. Investment returns in 2010 were above the assumed level of 7.79 percent. Investment returns in 2009 were above the assumed level of 8.50 percent while returns in 2008 were below the assumed level of 8.75 percent. Xcel Energy continually reviews its pension assumptions. In 2011, Xcel Energy will use an investment return assumption of 7.50 percent.
The assets are invested in a portfolio according to Xcel Energy’s return, liquidity and diversification objectives to provide a source of funding for plan obligations and minimize the necessity of contributions to the plan, within appropriate levels of risk. The principal mechanism for achieving these objectives is the allocation of assets to selected asset classes, given the long-term risk, return, and liquidity characteristics of each particular asset class. There were no significant concentrations of risk in any particular industry, index, or entity; however, as we have experienced in recent years, unusual market volatility can impact even well-diversified portfolios and significantly affect the return levels achieved by pension assets in any year. The following table presents the target pension asset allocations:
|
2010
|
2009
|
|||||||
|
Domestic and international equity securities
|
24 | % | 24 | % | ||||
|
Long-duration fixed income securities
|
41 | 34 | ||||||
|
Short-to-intermediate fixed income securities
|
11 | 19 | ||||||
|
Alternative investments
|
17 | 18 | ||||||
|
Cash
|
7 | 5 | ||||||
|
Total
|
100 | % | 100 | % | ||||
In 2009, Xcel Energy engaged J.P. Morgan’s Pension Advisory Group to evaluate the allocation of the total assets in the master pension trust, taking into consideration the funded status of each individual pension plan provided by Xcel Energy. The ongoing investment strategy is based on plan-specific investment recommendations that seek to minimize potential investment and interest rate risk as a plan’s funded status increases over time. The investment recommendations result in a greater percentage of short-to-intermediate term and long-duration fixed income securities being allocated to specific plans having relatively higher funded status ratios, and a greater percentage of growth assets being allocated to plans having relatively lower funded status ratios. The aggregate asset allocation presented in the table above for the master pension trust results from the plan-specific strategies.
Pension Plan Assets
The following tables present, for each of the fair value hierarchy Levels, pension plan assets that are measured at fair value as of Dec. 31, 2010 and 2009:
|
Dec. 31, 2010
|
||||||||||||||||
|
(Thousands of Dollars)
|
Level 1
|
Level 2
|
Level 3
|
Total
|
||||||||||||
|
Cash equivalents
|
$ | — | $ | 109,027 | $ | — | $ | 109,027 | ||||||||
|
Short-term investments
|
122,643 | 26,683 | — | 149,326 | ||||||||||||
|
Derivatives
|
— | 8,140 | — | 8,140 | ||||||||||||
|
Government securities
|
— | 117,522 | — | 117,522 | ||||||||||||
|
Corporate bonds
|
— | 641,807 | — | 641,807 | ||||||||||||
|
Asset-backed securities
|
— | — | 26,986 | 26,986 | ||||||||||||
|
Mortgage-backed securities
|
— | — | 113,418 | 113,418 | ||||||||||||
|
Common stock
|
117,899 | — | — | 117,899 | ||||||||||||
|
Private equity investments
|
— | — | 122,223 | 122,223 | ||||||||||||
|
Commingled equity and bond funds
|
— | 1,152,386 | — | 1,152,386 | ||||||||||||
|
Real estate
|
— | — | 73,701 | 73,701 | ||||||||||||
|
Securities lending collateral obligation and other
|
— | (91,727 | ) | — | (91,727 | ) | ||||||||||
|
Total
|
$ | 240,542 | $ | 1,963,838 | $ | 336,328 | $ | 2,540,708 | ||||||||
|
Dec. 31, 2009
|
||||||||||||||||
|
(Thousands of Dollars)
|
Level 1
|
Level 2
|
Level 3
|
Total
|
||||||||||||
|
Cash equivalents
|
$ | — | $ | 221,971 | $ | — | $ | 221,971 | ||||||||
|
Short-term investments
|
— | 324,683 | — | 324,683 | ||||||||||||
|
Derivatives
|
— | 11,606 | — | 11,606 | ||||||||||||
|
Government securities
|
— | 94,949 | — | 94,949 | ||||||||||||
|
Corporate bonds
|
— | 522,403 | — | 522,403 | ||||||||||||
|
Asset-backed securities
|
— | — | 47,825 | 47,825 | ||||||||||||
|
Mortgage-backed securities
|
— | — | 144,006 | 144,006 | ||||||||||||
|
Common stock
|
89,260 | — | — | 89,260 | ||||||||||||
|
Private equity investments
|
— | — | 82,098 | 82,098 | ||||||||||||
|
Commingled equity and bond funds
|
— | 1,014,072 | — | 1,014,072 | ||||||||||||
|
Real estate
|
— | — | 66,704 | 66,704 | ||||||||||||
|
Securities lending collateral obligation and other
|
— | (170,251 | ) | — | (170,251 | ) | ||||||||||
|
Total
|
$ | 89,260 | $ | 2,019,433 | $ | 340,633 | $ | 2,449,326 | ||||||||
The following tables present the changes in Level 3 pension plan assets for the years ended Dec. 31, 2010 and 2009:
|
(Thousands of Dollars)
|
Jan. 1, 2010
|
Realized and
Unrealized Gains
(Losses)
|
Purchases,
Issuances, and
Settlements, net
|
Dec. 31, 2010
|
||||||||||||
|
Asset-backed securities
|
$ | 47,825 | $ | (3,678 | ) | $ | (17,161 | ) | $ | 26,986 | ||||||
|
Mortgage-backed securities
|
144,006 | (5,376 | ) | (25,212 | ) | 113,418 | ||||||||||
|
Real estate
|
66,704 | 7,100 | (103 | ) | 73,701 | |||||||||||
|
Private equity investments
|
82,098 | (1,032 | ) | 41,157 | 122,223 | |||||||||||
|
Total
|
$ | 340,633 | $ | (2,986 | ) | $ | (1,319 | ) | $ | 336,328 | ||||||
|
(Thousands of Dollars)
|
Jan. 1, 2009
|
Realized and
Unrealized Gains
(Losses)
|
Purchases,
Issuances, and
Settlements, net
|
Dec. 31, 2009
|
||||||||||||
|
Asset-backed securities
|
$ | 77,398 | $ | 48,285 | $ | (77,858 | ) | $ | 47,825 | |||||||
|
Mortgage-backed securities
|
166,610 | 103,470 | (126,074 | ) | 144,006 | |||||||||||
|
Real estate
|
109,289 | (43,207 | ) | 622 | 66,704 | |||||||||||
|
Private equity investments
|
81,034 | (5,682 | ) | 6,746 | 82,098 | |||||||||||
|
Total
|
$ | 434,331 | $ | 102,866 | $ | (196,564 | ) | $ | 340,633 | |||||||
Benefit Obligations — A comparison of the actuarially computed pension benefit obligation and plan assets, on a combined basis, is presented in the following table:
|
(Thousands of Dollars)
|
2010
|
2009
|
||||||
|
Accumulated Benefit Obligation at Dec. 31
|
$ | 2,865,845 | $ | 2,676,174 | ||||
|
Change in Projected Benefit Obligation:
|
||||||||
|
Obligation at Jan. 1
|
$ | 2,829,631 | $ | 2,598,032 | ||||
|
Service cost
|
73,147 | 65,461 | ||||||
|
Interest cost
|
165,010 | 169,790 | ||||||
|
Plan amendments
|
18,739 | (35,341 | ) | |||||
|
Actuarial loss
|
169,203 | 223,122 | ||||||
|
Benefit payments
|
(225,438 | ) | (191,433 | ) | ||||
|
Obligation at Dec. 31
|
$ | 3,030,292 | $ | 2,829,631 | ||||
|
Change in Fair Value of Plan Assets:
|
||||||||
|
Fair value of plan assets at Jan. 1
|
$ | 2,449,326 | $ | 2,185,203 | ||||
|
Actual return on plan assets
|
282,688 | 255,556 | ||||||
|
Employer contributions
|
34,132 | 200,000 | ||||||
|
Benefit payments
|
(225,438 | ) | (191,433 | ) | ||||
|
Fair value of plan assets at Dec. 31
|
$ | 2,540,708 | $ | 2,449,326 | ||||
|
Funded Status of Plans at Dec. 31:
|
||||||||
|
Funded status
(a)
|
$ | (489,584 | ) | $ | (380,305 | ) | ||
|
Amounts Not Yet Recognized as Components of Net Periodic Benefit Cost:
|
||||||||
|
Net loss
|
$ | 1,502,888 | $ | 1,432,370 | ||||
|
Prior service cost
|
40,965 | 42,883 | ||||||
|
Total
|
$ | 1,543,853 | $ | 1,475,253 | ||||
|
Amounts Related to the Funded Status of the Plans Have Been Recorded as
Follows Based Upon Expected Recovery in Rates:
|
||||||||
|
Regulatory assets
|
$ | 1,478,890 | $ | 1,413,774 | ||||
|
Deferred income taxes
|
26,592 | 25,101 | ||||||
|
Net-of-tax accumulated other comprehensive income
|
38,371 | 36,378 | ||||||
|
Total
|
$ | 1,543,853 | $ | 1,475,253 | ||||
|
Measurement date
|
Dec. 31, 2010
|
Dec. 31, 2009
|
||||||
|
Significant Assumptions Used to Measure Benefit Obligations:
|
||||||||
|
Discount rate for year-end valuation
|
5.50 | % | 6.00 | % | ||||
|
Expected average long-term increase in compensation level
|
4.00 | 4.00 | ||||||
|
Mortality table
|
RP 2000
|
RP 2000
|
||||||
(a) Amounts are recognized in noncurrent liabilities on Xcel Energy’s consolidated balance sheet.
Cash Flows —
Cash funding requirements can be impacted by changes to actuarial assumptions, actual asset levels and other calculations prescribed by the funding requirements of income tax and other pension-related regulations. These regulations did not require cash funding for 2008 through 2010 for Xcel Energy’s pension plans and are not expected to require cash funding in 2011.
Xcel Energy made total pension contributions of $34 million and $200 million during 2010 and 2009, respectively.
|
|
●
|
Voluntary contributions were made to the Xcel Energy Pension Plan of $34 million in 2010.
|
|
|
●
|
Voluntary contributions were made to the PSCo Bargaining Pension Plan of $173 million in 2009.
|
|
|
●
|
Voluntary contributions were made to the NCE Non-Bargaining Pension Plan of $27 million in 2009.
|
|
|
●
|
Voluntary contributions were made across three of Xcel Energy’s pension plans for $134 million in January 2011. The contribution raised the overall funded status from 84 percent at Dec. 31, 2010 to 88 percent with all other pension assumptions remaining constant.
|
|
|
●
|
Pension funding contributions for 2012, which will be dependent on several factors including, realized asset performance, future discount rate, IRS and legislative initiatives as well as other actuarial assumptions, are estimated to range between $150 million to $175 million.
|
Plan Amendments —
The 2010 increase of the projected benefit obligation for plan amendments is due to a change in the discount rate basis for lump sum conversion of annuities for participants in the Xcel Energy Pension Plan.
Benefit Costs —
The components of net periodic pension cost (credit) are:
|
(Thousands of Dollars)
|
2010
|
2009
|
2008
|
|||||||||
|
Service cost
|
$ | 73,147 | $ | 65,461 | $ | 62,698 | ||||||
|
Interest cost
|
165,010 | 169,790 | 167,881 | |||||||||
|
Expected return on plan assets
|
(232,318 | ) | (256,538 | ) | (274,338 | ) | ||||||
|
Amortization of prior service cost
|
20,657 | 24,618 | 20,584 | |||||||||
|
Amortization of net loss
|
48,315 | 12,455 | 11,156 | |||||||||
|
Net periodic pension cost
(credit)
|
74,811 | 15,786 | (12,019 | ) | ||||||||
|
(Costs) credits not recognized due to effects of regulation
|
(27,027 | ) | (2,891 | ) | 9,034 | |||||||
|
Net benefit cost (credit) recognized for financial reporting
|
$ | 47,784 | $ | 12,895 | $ | (2,985 | ) | |||||
|
Significant Assumptions Used to Measure Costs:
|
||||||||||||
|
Discount rate
|
6.00 | % | 6.75 | % | 6.25 | % | ||||||
|
Expected average long-term increase in compensation level
|
4.00 | 4.00 | 4.00 | |||||||||
|
Expected average long-term rate of return on assets
|
7.79 | 8.50 | 8.75 | |||||||||
Pension costs include an expected return impact for the current year that may differ from actual investment performance in the plan. The return assumption used for 2011 pension cost calculations will be 7.50 percent. The cost calculation uses a market-related valuation of pension assets. Xcel Energy uses a calculated value method to determine the market-related value of the plan assets. The market-related value begins with the fair market value of assets as of the beginning of the year. The market-related value is determined by adjusting the fair market value of assets to reflect the investment gains and losses (the difference between the actual investment return and the expected investment return on the market-related value) during each of the previous five years at the rate of 20 percent per year.
Xcel Energy also maintains noncontributory, defined benefit supplemental retirement income plans for certain qualifying executive personnel. Benefits for these unfunded plans are paid out of Xcel Energy’s operating cash flows.
Defined Contribution Plans
Xcel Energy maintains 401(k) and other defined contribution plans that cover substantially all employees. Total contributions to these plans were approximately $27.3 million in 2010, $21.9 million in 2009 and $17.9 million in 2008.
Postretirement Health Care Benefits
Xcel Energy has a contributory health and welfare benefit plan that provides health care and death benefits to most Xcel Energy retirees.
|
|
●
|
The former NSP discontinued contributing toward health care benefits for nonbargaining employees retiring after 1998 and for bargaining employees of NSP-Minnesota and NSP-Wisconsin who retired after 1999.
|
|
|
●
|
Xcel Energy discontinued contributing toward health care benefits for former NCE nonbargaining employees retiring after June 30, 2003.
|
|
|
●
|
Employees of NCE who retired in 2002 continue to receive employer-subsidized health care benefits.
|
|
|
●
|
Nonbargaining employees of the former NCE who retired after 1998, bargaining employees of the former NCE who retired after 1999 and nonbargaining employees of NCE who retired after June 30, 2003, are eligible to participate in the Xcel Energy health care program with no employer subsidy.
|
In 1993, Xcel Energy adopted accounting guidance regarding other non-pension postretirement benefits and elected to amortize the unrecognized APBO on a straight-line basis over 20 years.
Regulatory agencies for nearly all of Xcel Energy’s retail and wholesale utility customers have allowed rate recovery of accrued postretirement benefit costs. The Colorado jurisdictional postretirement benefit costs deferred during the transition period are being amortized to expense on a straight-line basis over the 15-year period from 1998 to 2012. NSP-Minnesota also transitioned to full accrual accounting for postretirement benefit costs, with regulatory differences fully amortized prior to 1997.
Plan Assets —
Certain state agencies that regulate Xcel Energy’s utility subsidiaries also have issued guidelines related to the funding of postretirement benefit costs. SPS is required to fund postretirement benefit costs for Texas and New Mexico jurisdictional amounts collected in rates and PSCo is required to fund postretirement benefit costs in irrevocable external trusts that are dedicated to the payment of these postretirement benefits. Also, a portion of the assets contributed on behalf of nonbargaining retirees has been funded into a sub-account of the Xcel Energy pension plans. These assets are invested in a manner consistent with the investment strategy for the pension plan.
Xcel Energy bases its investment-return assumption for the postretirement health care fund assets on expected long-term performance for each of the investment types included in its asset portfolio. The assets are invested in a portfolio according to Xcel Energy’s return, liquidity and diversification objectives to provide a source of funding for plan obligations and minimize the necessity of contributions to the plan, within appropriate levels of risk. The principal mechanism for achieving these objectives is the allocation of assets to selected asset classes, given the long-term risk, return, and liquidity characteristics of each particular asset class. There were no significant concentrations of risk in any particular industry, index, or entity. Investment-return volatility is not considered to be a material factor in postretirement health care costs.
The following tables present, for each of the fair value hierarchy Levels, postretirement benefit plan assets that are measured at fair value as of Dec. 31, 2010 and 2009:
|
Dec. 31, 2010
|
||||||||||||||||
|
(Thousands of Dollars)
|
Level 1
|
Level 2
|
Level 3
|
Total
|
||||||||||||
|
Cash equivalents
|
$ | 72,573 | $ | 76,352 | $ | — | $ | 148,925 | ||||||||
|
Derivatives
|
— | 13,632 | — | 13,632 | ||||||||||||
|
Government securities
|
— | 3,402 | — | 3,402 | ||||||||||||
|
Corporate bonds
|
— | 70,752 | — | 70,752 | ||||||||||||
|
Asset-backed securities
|
— | — | 2,585 | 2,585 | ||||||||||||
|
Mortgage-backed securities
|
— | — | 19,212 | 19,212 | ||||||||||||
|
Preferred stock
|
— | 507 | — | 507 | ||||||||||||
|
Commingled equity and bond funds
|
— | 102,962 | — | 102,962 | ||||||||||||
|
Securities lending collateral obligation and other
|
— | 70,253 | — | 70,253 | ||||||||||||
|
Total
|
$ | 72,573 | $ | 337,860 | $ | 21,797 | $ | 432,230 | ||||||||
|
Dec. 31, 2009
|
||||||||||||||||
|
(Thousands of Dollars)
|
Level 1
|
Level 2
|
Level 3
|
Total
|
||||||||||||
|
Cash equivalents
|
$ | — | $ | 165,291 | $ | — | $ | 165,291 | ||||||||
|
Short-term investments
|
— | 2,226 | — | 2,226 | ||||||||||||
|
Derivatives
|
— | 5,937 | — | 5,937 | ||||||||||||
|
Government securities
|
— | 1,538 | — | 1,538 | ||||||||||||
|
Corporate bonds
|
— | 60,416 | — | 60,416 | ||||||||||||
|
Asset-backed securities
|
— | — | 8,293 | 8,293 | ||||||||||||
|
Mortgage-backed securities
|
— | — | 47,078 | 47,078 | ||||||||||||
|
Preferred stock
|
— | 540 | — | 540 | ||||||||||||
|
Commingled equity and bond funds
|
— | 89,296 | — | 89,296 | ||||||||||||
|
Securities lending collateral obligation and other
|
— | 4,074 | — | 4,074 | ||||||||||||
|
Total
|
$ | — | $ | 329,318 | $ | 55,371 | $ | 384,689 | ||||||||
The following tables present the changes in Level 3 postretirement benefit plan assets for the years ended Dec. 31, 2010 and 2009:
|
(Thousands of Dollars)
|
Jan. 1, 2010
|
Realized and
Unrealized Gains |
Purchases,
Issuances, and Settlements, net |
Dec. 31, 2010
|
||||||||||||
|
Asset-backed securities
|
$ | 8,293 | $ | 1,814 | $ | (7,522 | ) | $ | 2,585 | |||||||
|
Mortgage-backed securities
|
47,078 | 14,715 | (42,581 | ) | 19,212 | |||||||||||
|
(Thousands of Dollars)
|
Jan. 1, 2009
|
Realized and
Unrealized Gains |
Purchases,
Issuances, and Settlements, net |
Dec. 31, 2009
|
||||||||||||
|
Asset-backed securities
|
$ | 8,705 | $ | 1,029 | $ | (1,441 | ) | $ | 8,293 | |||||||
|
Mortgage-backed securities
|
69,988 | 3,022 | (25,932 | ) | 47,078 | |||||||||||
Benefit Obligations —
A comparison of the actuarially computed benefit obligation and plan assets for Xcel Energy postretirement health care plans that benefit employees of its utility subsidiaries is presented in the following table:
|
(Thousands of Dollars)
|
2010
|
2009
|
||||||
|
Change in Projected Benefit Obligation:
|
||||||||
|
Obligation at Jan. 1
|
$ | 728,902 | $ | 794,597 | ||||
|
Service cost
|
4,006 | 4,665 | ||||||
|
Interest cost
|
42,780 | 50,412 | ||||||
|
Medicare subsidy reimbursements
|
5,423 | 3,226 | ||||||
|
Plan amendments
|
— | (27,407 | ) | |||||
|
Plan participants’ contributions
|
14,315 | 13,786 | ||||||
|
Actuarial loss (gain)
|
68,126 | (47,446 | ) | |||||
|
Benefit payments
|
(68,647 | ) | (62,931 | ) | ||||
|
Obligation at Dec. 31
|
$ | 794,905 | $ | 728,902 | ||||
|
Change in Fair Value of Plan Assets:
|
||||||||
|
Fair value of plan assets at Jan. 1
|
$ | 384,689 | $ | 299,566 | ||||
|
Actual return on plan assets
|
53,430 | 72,101 | ||||||
|
Plan participants’ contributions
|
14,315 | 13,786 | ||||||
|
Employer contributions
|
48,443 | 62,167 | ||||||
|
Benefit payments
|
(68,647 | ) | (62,931 | ) | ||||
|
Fair value of plan assets at Dec. 31
|
$ | 432,230 | $ | 384,689 | ||||
|
(Thousands of Dollars)
|
2010
|
2009
|
||||||
|
Funded Status of Plans at Dec. 31:
|
||||||||
|
Funded status
|
$ | (362,675 | ) | $ | (344,213 | ) | ||
|
Current liabilities
|
(5,392 | ) | (2,240 | ) | ||||
|
Noncurrent liabilities
|
(357,283 | ) | (341,973 | ) | ||||
|
Net postretirement amounts recognized on consolidated balance sheets
|
$ | (362,675 | ) | $ | (344,213 | ) | ||
|
Amounts Not Yet Recognized as Components of Net Periodic Benefit Cost:
|
||||||||
|
Net loss
|
$ | 221,335 | $ | 189,743 | ||||
|
Prior service credit
|
(28,954 | ) | (33,886 | ) | ||||
|
Transition obligation
|
29,591 | 44,035 | ||||||
|
Total
|
$ | 221,972 | $ | 199,892 | ||||
|
Amounts Related to the Funded Status of the Plans Have Been Recorded as Follows Based Upon Expected Recovery in Rates:
|
||||||||
|
Regulatory assets
|
$ | 218,177 | $ | 190,172 | ||||
|
Regulatory liabilities
|
(6,423 | ) | — | |||||
|
Deferred income taxes
|
4,159 | 3,943 | ||||||
|
Net-of-tax accumulated other comprehensive income
|
6,059 | 5,777 | ||||||
|
Total
|
$ | 221,972 | $ | 199,892 | ||||
|
Measurement date
|
Dec. 31, 2010
|
Dec. 31, 2009
|
||||||
|
Significant Assumptions Used to Measure Benefit Obligations:
|
||||||||
|
Discount rate for year-end valuation
|
5.50 | % | 6.00 | % | ||||
|
Mortality table
|
RP 2000
|
RP 2000
|
||||||
|
Health care costs trend rate - initial
|
6.50 | % | 6.80 | % | ||||
Effective Dec. 31, 2010, the ultimate trend assumption remained unchanged at 5.0 percent. The period until the ultimate rate is reached increased from three years to eight years. Xcel Energy bases its medical trend assumption on the long-term cost inflation expected in the health care market, considering the levels projected and recommended by industry experts, as well as recent actual medical cost increases experienced by Xcel Energy’s retiree medical plan.
A 1-percent change in the assumed health care cost trend rate would have the following effects:
| One Percentage Point | ||||||||
|
(Thousands of Dollars)
|
Increase
|
Decrease
|
||||||
|
APBO
|
$ | 98,812 | $ | (76,175 | ) | |||
|
Service and interest components
|
5,006 | (4,193 | ) | |||||
Cash Flows —
The postretirement health care plans have no funding requirements under income tax and other retirement-related regulations other than fulfilling benefit payment obligations, when claims are presented and approved under the plans. Additional cash funding requirements are prescribed by certain state and federal rate regulatory authorities, as discussed previously. Xcel Energy contributed $48.4 million during 2010 and $62.2 million during 2009 and expects to contribute approximately $40.5 million during 2011.
Plan Amendments —
No amendments occurred during 2010 to the Xcel Energy health and welfare benefit plan.
Benefit Costs —
The components of net periodic postretirement benefit costs are:
|
(Thousands of Dollars)
|
2010
|
2009
|
2008
|
|||||||||
|
Service cost
|
$ | 4,006 | $ | 4,665 | $ | 5,350 | ||||||
|
Interest cost
|
42,780 | 50,412 | 51,047 | |||||||||
|
Expected return on plan assets
|
(28,529 | ) | (22,775 | ) | (31,851 | ) | ||||||
|
Amortization of transition obligation
|
14,444 | 14,444 | 14,577 | |||||||||
|
Amortization of prior service cost
|
(4,932 | ) | (2,726 | ) | (2,175 | ) | ||||||
|
Amortization of net loss
|
11,643 | 19,329 | 11,498 | |||||||||
|
Net periodic postretirement benefit cost
|
39,412 | 63,349 | 48,446 | |||||||||
|
Additional cost recognized due to effects of regulation
|
3,891 | 3,891 | 3,891 | |||||||||
|
Net benefit cost recognized for financial reporting
|
$ | 43,303 | $ | 67,240 | $ | 52,337 | ||||||
|
Significant Assumptions Used to Measure Costs:
|
||||||||||||
|
Discount rate
|
6.00 | % | 6.75 | % | 6.25 | % | ||||||
|
Expected average long-term rate of return on assets (before tax)
|
7.50 | 7.50 | 7.50 | |||||||||
Projected Benefit Payments
The following table lists Xcel Energy’s projected benefit payments for the pension and postretirement benefit plans:
|
(Thousands of Dollars)
|
Projected Pension Benefit Payments
|
Gross Projected Postretirement Health Care Benefit Payments
|
Expected Medicare Part D Subsidies
|
Net Projected Postretirement Health Care Benefit Payments
|
||||||||||||
|
2011
|
$ | 254,426 | $ | 59,752 | $ | 4,770 | $ | 54,982 | ||||||||
|
2012
|
247,156 | 60,230 | 5,126 | 55,104 | ||||||||||||
|
2013
|
249,908 | 60,607 | 5,475 | 55,132 | ||||||||||||
|
2014
|
257,886 | 61,833 | 5,773 | 56,060 | ||||||||||||
|
2015
|
259,978 | 63,184 | 6,061 | 57,123 | ||||||||||||
|
2016-2020
|
1,338,658 | 325,154 | 34,115 | 291,039 | ||||||||||||
10. Other Income, Net
Other income (expense), net, for the years ended Dec. 31 consisted of the following:
|
(Thousands of Dollars)
|
2010
|
2009
|
2008
|
|||||||||
|
Interest income
|
$ | 11,023 | $ | 14,928 | $ | 29,753 | ||||||
|
COLI settlement (See Note 6)
|
25,000 | — | — | |||||||||
|
Other nonoperating income
|
1,689 | 3,650 | 6,320 | |||||||||
|
Insurance policy (expenses) income
|
(6,529 | ) | (8,646 | ) | 4,337 | |||||||
|
Other nonoperating expenses
|
(40 | ) | (161 | ) | (4 | ) | ||||||
|
Other income, net
|
$ | 31,143 | $ | 9,771 | $ | 40,406 | ||||||
|
11. Derivative Instruments and Fair Value Measurements
|
Xcel Energy and its utility subsidiaries enter into derivative instruments, including forward contracts, futures, swaps and options, for trading purposes and to reduce risk in connection with changes in interest rates, utility commodity prices and vehicle fuel prices, as well as variances in forecasted weather.
Short-Term Wholesale and Commodity Trading Risk —
Xcel Energy’s utility subsidiaries conduct various short-term wholesale and commodity trading activities, including the purchase and sale of electric capacity, energy and energy-related instruments. Xcel Energy’s risk management policy allows management to conduct these activities within guidelines and limitations as approved by its risk management committee, which is made up of management personnel not directly involved in the activities governed by this policy.
Interest Rate Derivatives —
Xcel Energy and its utility subsidiaries enter into various instruments that effectively fix the interest payments on certain floating rate debt obligations or effectively fix the yield or price on a specified benchmark interest rate for an anticipated debt issuance for a specific period. These derivative instruments are generally designated as cash flow hedges for accounting purposes.
At Dec. 31, 2010, accumulated OCI related to interest rate derivatives included $0.7 million of net losses expected to be reclassified into earnings during the next 12 months as the related hedged interest rate transactions impact earnings.
During the fourth quarter of 2009, Xcel Energy settled a $25 million notional value interest rate swap at SPS. This interest rate swap was not designated as a hedging instrument, and as such, gains and losses from changes in the fair value of the interest rate swap were recorded to earnings.
Commodity Derivatives —
Xcel Energy’s utility subsidiaries enter into derivative instruments to manage variability of future cash flows from changes in commodity prices in their electric and natural gas operations, as well as for trading purposes. This could include the purchase or sale of energy or energy-related products, natural gas to generate electric energy, gas for resale and vehicle fuel.
At Dec. 31, 2010, Xcel Energy had various vehicle fuel related contracts designated as cash flow hedges extending through December 2014. Xcel Energy’s utility subsidiaries also enter into derivative instruments that mitigate commodity price risk on behalf of electric and natural gas customers but are not designated as qualifying hedging transactions. Changes in the fair value of non-trading commodity derivative instruments are recorded in OCI or deferred as a regulatory asset or liability. The classification as a regulatory asset or liability is based on commission approved regulatory recovery mechanisms. Xcel Energy recorded immaterial amounts to income related to the ineffectiveness of cash flow hedges for the years ended Dec. 31, 2010 and 2009.
At Dec. 31, 2010, accumulated OCI related commodity derivative cash flow hedges included $0.1 million of net gains expected to be reclassified into earnings during the next 12 months as the hedged transactions occur.
Additionally, Xcel Energy’s utility subsidiaries enter into commodity derivative instruments for trading purposes not directly related to commodity price risks associated with serving their electric and natural gas customers. Changes in the fair value of these commodity derivatives are recorded in electric operating revenues, net of amounts credited to customers under margin-sharing mechanisms.
The following table details the gross notional amounts of commodity forwards, options and FTRs at Dec. 31, 2010 and Dec. 31, 2009:
|
(Amounts in Thousands)
(a)(b)
|
Dec. 31, 2010
|
Dec. 31, 2009
|
||||||
|
MWh of electricity
|
46,794 | 37,932 | ||||||
|
MMBtu of natural gas
|
75,806 | 57,181 | ||||||
|
Gallons of vehicle fuel
|
800 | 3,580 | ||||||
(a)
Amounts are not reflective of net positions in the underlying commodities.
(b)
Notional amounts for options are included on a gross basis, but are weighted for the probability of exercise
.
Financial Impact of Qualifying Cash Flow Hedges —
The impact of qualifying interest rate and vehicle fuel cash flow hedges on Xcel Energy’s accumulated OCI, included in the consolidated statements of common stockholders’ equity and comprehensive income, is detailed in the following table:
|
(Thousands of Dollars)
|
2010
|
2009
|
2008
|
|||||||||
|
Accumulated other comprehensive loss related to cash flow hedges at Jan. 1
|
$ | (6,435 | ) | $ | (13,113 | ) | $ | (1,416 | ) | |||
|
After-tax net unrealized losses related to derivatives accounted for as hedges
|
(4,289 | ) | (710 | ) | (12,083 | ) | ||||||
|
After-tax net realized losses on derivative transactions reclassified into earnings
|
2,630 | 7,388 | 386 | |||||||||
|
Accumulated other comprehensive loss related to cash flow hedges at Dec. 31
|
$ | (8,094 | ) | $ | (6,435 | ) | $ | (13,113 | ) | |||
Xcel Energy had no derivative instruments designated as fair value hedges during the years ended Dec. 31, 2010 and Dec. 31, 2009. Therefore, no gains or losses from fair value hedges or related hedged transactions were recognized for these periods.
The following tables detail the impact of derivative activity during the years ended Dec. 31, 2010 and Dec. 31, 2009, respectively, on OCI, regulatory assets and liabilities and income:
|
Dec. 31, 2010
|
||||||||||||||||||||
|
Fair Value
|
Pre-Tax Amounts
|
|||||||||||||||||||
|
Changes Recognized
|
Reclassified into Income
|
Pre-Tax Gains
|
||||||||||||||||||
|
During the Period in:
|
During the Period from:
|
Recognized
|
|
|||||||||||||||||
|
Other
|
Regulatory
|
Other
|
Regulatory
|
|
During the
|
|
||||||||||||||
|
Comprehensive
|
Assets and
|
Comprehensive
|
Assets and
|
|
Period in
|
|
||||||||||||||
|
(Thousands of Dollars)
|
Losses
|
Liabilities
|
Income
|
Liabilities
|
|
Income
|
|
|||||||||||||
|
Derivatives designated as cash flow hedges
|
||||||||||||||||||||
|
Interest rate
|
$
|
(7,210
|
) |
$
|
—
|
$
|
1,107
|
(a)
|
$
|
—
|
$
|
—
|
||||||||
|
Vehicle fuel and other commodity
|
(238
|
) |
—
|
3,474
|
(e)
|
—
|
—
|
|||||||||||||
|
Total
|
$
|
(7,448
|
) |
$
|
—
|
$
|
4,581
|
$
|
—
|
$
|
—
|
|||||||||
|
Other derivative instruments
|
||||||||||||||||||||
|
Trading commodity
|
$
|
—
|
$
|
—
|
$
|
—
|
$
|
—
|
$
|
11,004
|
(b)
|
|||||||||
|
Electric commodity
|
—
|
3,969
|
—
|
(21,840
|
)
(c)
|
—
|
||||||||||||||
|
Natural gas commodity
|
—
|
(105,396
|
) |
—
|
51,034
|
(d)
|
—
|
|||||||||||||
|
Other
|
—
|
—
|
—
|
—
|
135
|
(b)
|
||||||||||||||
|
Total
|
$
|
—
|
$
|
(101,427
|
) |
$
|
—
|
$
|
29,194
|
$
|
11,139
|
|||||||||
|
Dec. 31, 2009
|
||||||||||||||||||||
|
Fair Value
|
Pre-Tax Amounts
|
|||||||||||||||||||
|
Changes Recognized
|
Reclassified into Income
|
Pre-Tax Gains | ||||||||||||||||||
|
During the Period in:
|
During the Period from:
|
(Losses)
|
||||||||||||||||||
|
Other
|
Recognized
|
|||||||||||||||||||
|
Comprehensive
|
Regulatory
|
Other
|
Regulatory
|
During the
|
||||||||||||||||
|
Income
|
Assets and
|
Comprehensive
|
Assets and
|
Period in
|
||||||||||||||||
|
(Thousands of Dollars)
|
(Losses)
|
Liabilities
|
Income
|
Liabilities
|
Income
|
|||||||||||||||
|
Derivatives designated as cash flow hedges
|
||||||||||||||||||||
|
Interest rate
|
$
|
(3,840
|
) |
$
|
—
|
$
|
6,064
|
(a)
|
$
|
—
|
$
|
—
|
||||||||
|
Electric commodity
|
—
|
(18,599
|
) |
—
|
(4,755
|
)
(c)
|
—
|
|||||||||||||
|
Natural gas commodity
|
—
|
(15,830
|
) |
—
|
78,488
|
(d)
|
(30,241
|
)
(d)
|
||||||||||||
|
Vehicle fuel and other commodity
|
2,287
|
—
|
6,391
|
(e)
|
—
|
—
|
||||||||||||||
|
Total
|
$
|
(1,553
|
) |
$
|
(34,429
|
) |
$
|
12,455
|
$
|
73,733
|
$
|
(30,241
|
) | |||||||
|
Other derivative instruments
|
||||||||||||||||||||
|
Interest rate
|
$
|
—
|
$
|
—
|
$
|
—
|
$
|
—
|
$
|
2,503
|
(a)
|
|||||||||
|
Trading commodity
|
—
|
—
|
—
|
—
|
9,866
|
(b)
|
||||||||||||||
|
Electric commodity
|
—
|
20,607
|
—
|
(343
|
)
(c)
|
—
|
||||||||||||||
|
Natural gas commodity
|
—
|
3,962
|
—
|
9,307
|
(d)
|
—
|
||||||||||||||
|
Other
|
—
|
—
|
—
|
—
|
(160
|
)
(b)
|
||||||||||||||
|
Total
|
$
|
—
|
$
|
24,569
|
$
|
—
|
$
|
8,964
|
$
|
12,209
|
||||||||||
|
(a)
|
Recorded to interest charges.
|
|
(b)
|
Recorded to electric operating revenues. Portions of these total gains and losses are subject to sharing with electric customers through margin-sharing mechanisms and deducted from gross revenue, as appropriate.
|
|
(c)
|
Recorded to electric fuel and purchased power; these derivative settlement gains and losses are shared with electric customers through fuel and purchased energy cost-recovery mechanisms, and reclassified out of income as regulatory assets or liabilities, as appropriate.
|
|
(d)
|
Recorded to cost of natural gas sold and transported; these derivative settlement gains and losses are shared with natural gas customers through purchased natural gas cost-recovery mechanisms, and reclassified out of income as regulatory assets or liabilities, as appropriate.
|
|
(e)
|
Recorded to other O&M expenses.
|
Credit Related Contingent Features
—
Contract provisions of the derivative instruments that the utility subsidiaries enter into may require the posting of collateral or settlement of the contracts for various reasons, including if the applicable utility subsidiary is unable to maintain its credit ratings. If the credit ratings of PSCo were downgraded below investment grade, contracts underlying $5.6 million and $0.6 million of derivative instruments in a gross liability position at Dec. 31, 2010 and Dec. 31, 2009, respectively, would have required Xcel Energy to post collateral or settle applicable contracts, which would have resulted in payments to counterparties of $9.8 million and $3.4 million, respectively. At Dec. 31, 2010 and Dec. 31, 2009, there was no collateral posted on these specific contracts.
Certain of the utility subsidiaries’ derivative instruments are also subject to contract provisions that contain adequate assurance clauses. These provisions allow counterparties to seek performance assurance, including cash collateral, in the event that a given utility subsidiary’s ability to fulfill its contractual obligations is reasonably expected to be impaired. Xcel Energy’s utility subsidiaries had no collateral posted related to adequate assurance clauses in derivative contracts as of Dec. 31, 2010 and Dec. 31, 2009.
Fair Value Measurements
The accounting guidance for fair value measurements and disclosures provides a single definition of fair value and requires enhanced disclosures about assets and liabilities measured at fair value. A hierarchal framework for disclosing the observability of the inputs utilized in measuring assets and liabilities at fair value is established by this guidance. The three Levels in the hierarchy are as follows:
Level 1
—
Quoted prices are available in active markets for identical assets or liabilities as of the reporting date. The types of assets and liabilities included in Level 1 are highly liquid and actively traded instruments with quoted prices.
Level 2
—
Pricing inputs are other than quoted prices in active markets, but are either directly or indirectly observable as of the reporting date. The types of assets and liabilities included in Level 2 are typically either comparable to actively traded securities or contracts, or priced with discounted cash flow or option pricing models using highly observable inputs.
Level 3
—
Significant inputs to pricing have little or no observability as of the reporting date. The types of assets and liabilities included in Level 3 are those valued with models requiring significant management judgment or estimation.
Recurring Fair Value Measurements
The following table presents for each of the hierarchy Levels, Xcel Energy’s assets and liabilities that are measured at fair value on a recurring basis at Dec. 31, 2010:
|
Dec. 31, 2010
|
||||||||||||||||||||||||
|
Fair Value
|
||||||||||||||||||||||||
|
Fair Value
|
Counterparty
|
|||||||||||||||||||||||
|
(Thousands of Dollars)
|
Level 1
|
Level 2
|
Level 3
|
Total
|
Netting
(c)
|
Total
|
||||||||||||||||||
|
Current derivative assets
|
||||||||||||||||||||||||
|
Derivatives designated as cash flow hedges:
|
||||||||||||||||||||||||
|
Vehicle fuel and other commodity
|
$ | — | $ | 126 | $ | — | $ | 126 | $ | — | $ | 126 | ||||||||||||
|
Other derivative instruments:
|
||||||||||||||||||||||||
|
Trading commodity
|
487 | 37,019 | — | 37,506 | (21,352 | ) | 16,154 | |||||||||||||||||
|
Electric commodity
|
— | — | 3,619 | 3,619 | (1,226 | ) | 2,393 | |||||||||||||||||
|
Natural gas commodity
|
— | 1,595 | — | 1,595 | (1,219 | ) | 376 | |||||||||||||||||
|
Total current derivative assets
|
$ | 487 | $ | 38,740 | $ | 3,619 | $ | 42,846 | $ | (23,797 | ) | 19,049 | ||||||||||||
|
Purchased power agreements
(b)
|
35,030 | |||||||||||||||||||||||
|
Current derivative instruments
|
$ | 54,079 | ||||||||||||||||||||||
|
Noncurrent derivative assets
|
||||||||||||||||||||||||
|
Derivatives designated as cash flow hedges:
|
||||||||||||||||||||||||
|
Vehicle fuel and other commodity
|
$ | — | $ | 150 | $ | — | $ | 150 | $ | — | $ | 150 | ||||||||||||
|
Other derivative instruments:
|
||||||||||||||||||||||||
|
Trading commodity
|
— | 32,621 | — | 32,621 | (4,595 | ) | 28,026 | |||||||||||||||||
|
Natural gas commodity
|
— | 1,246 | — | 1,246 | (269 | ) | 977 | |||||||||||||||||
|
Total noncurrent derivative assets
|
$ | — | $ | 34,017 | $ | — | $ | 34,017 | $ | (4,864 | ) | 29,153 | ||||||||||||
|
Purchased power agreements
(b)
|
154,873 | |||||||||||||||||||||||
|
Noncurrent derivative instruments
|
$ | 184,026 | ||||||||||||||||||||||
|
Dec. 31, 2010
|
||||||||||||||||||||||||
|
Fair Value
|
||||||||||||||||||||||||
|
Fair Value
|
Counterparty
|
|||||||||||||||||||||||
|
(Thousands of Dollars)
|
Level 1
|
Level 2
|
Level 3
|
Total
|
Netting
(c)
|
Total
|
||||||||||||||||||
|
Other recurring fair value assets
|
||||||||||||||||||||||||
|
Nuclear decommissioning fund
(a)
|
||||||||||||||||||||||||
|
Cash equivalents
|
$ | 76,281 | $ | 7,556 | $ | — | $ | 83,837 | $ | — | $ | 83,837 | ||||||||||||
|
Commingled funds
|
— | 133,080 | — | 133,080 | — | 133,080 | ||||||||||||||||||
|
International equity funds
|
— | 58,584 | — | 58,584 | — | 58,584 | ||||||||||||||||||
|
Debt securities:
|
||||||||||||||||||||||||
|
Government securities
|
— | 146,654 | — | 146,654 | — | 146,654 | ||||||||||||||||||
|
U.S. corporate bonds
|
— | 288,304 | — | 288,304 | — | 288,304 | ||||||||||||||||||
|
Foreign securities
|
— | 1,581 | — | 1,581 | — | 1,581 | ||||||||||||||||||
|
Municipal bonds
|
— | 97,557 | — | 97,557 | — | 97,557 | ||||||||||||||||||
|
Asset-backed securities
|
— | — | 33,174 | 33,174 | — | 33,174 | ||||||||||||||||||
|
Mortgage-backed securities
|
— | — | 72,589 | 72,589 | — | 72,589 | ||||||||||||||||||
|
Equity securities:
|
||||||||||||||||||||||||
|
Common stock
|
435,270 | — | — | 435,270 | — | 435,270 | ||||||||||||||||||
|
Total
|
$ | 511,551 | $ | 733,316 | $ | 105,763 | $ | 1,350,630 | $ | — | $ | 1,350,630 | ||||||||||||
|
Current derivative liabilities
|
||||||||||||||||||||||||
|
Other derivative instruments:
|
||||||||||||||||||||||||
|
Trading commodity
|
$ | 392 | $ | 30,608 | $ | — | $ | 31,000 | $ | (24,007 | ) | $ | 6,993 | |||||||||||
|
Electric commodity
|
— | — | 1,227 | 1,227 | (1,227 | ) | — | |||||||||||||||||
|
Natural gas commodity
|
20 | 52,709 | — | 52,729 | (21,169 | ) | 31,560 | |||||||||||||||||
|
Total current derivative liabilities
|
$ | 412 | $ | 83,317 | $ | 1,227 | $ | 84,956 | $ | (46,403 | ) | 38,553 | ||||||||||||
|
Purchased power agreements
(b)
|
23,192 | |||||||||||||||||||||||
|
Current derivative instruments
|
$ | 61,745 | ||||||||||||||||||||||
|
Noncurrent derivative liabilities
|
||||||||||||||||||||||||
|
Other derivative instruments:
|
||||||||||||||||||||||||
|
Trading commodity
|
$ | — | $ | 18,878 | $ | — | $ | 18,878 | $ | (4,596 | ) | $ | 14,282 | |||||||||||
|
Natural gas commodity
|
— | 438 | — | 438 | (269 | ) | 169 | |||||||||||||||||
|
Total noncurrent derivative liabilities
|
$ | — | $ | 19,316 | $ | — | $ | 19,316 | $ | (4,865 | ) | 14,451 | ||||||||||||
|
Purchased power agreements
(b)
|
271,535 | |||||||||||||||||||||||
|
Noncurrent derivative instruments
|
$ | 285,986 | ||||||||||||||||||||||
|
(a)
|
Reported in nuclear decommissioning fund and other investments on the consolidated balance sheet, which also includes $97.6 million of equity investments in unconsolidated subsidiaries and $28.2 million of miscellaneous investments
|
|
(b)
|
In 2003, as a result of implementing new guidance on the normal purchase exception for derivative accounting, Xcel Energy began recording several long-term purchased power agreements at fair value due to accounting requirements related to underlying price adjustments. As these purchases are recovered through normal regulatory recovery mechanisms in the respective jurisdictions, the changes in fair value for these contracts were offset by regulatory assets and liabilities. During 2006, Xcel Energy qualified these contracts under the normal purchase exception. Based on this qualification, the contracts are no longer adjusted to fair value and the previous carrying value of these contracts will be amortized over the remaining contract lives along with the offsetting regulatory assets and liabilities.
|
|
(c)
|
The accounting guidance for derivatives and hedging
permits the netting of receivables and payables for derivatives and related collateral amounts when a legally enforceable master netting agreement exists between Xcel Energy and a counterparty. A master netting agreement is an agreement between two parties who have multiple contracts with each other that provides for the net settlement of all contracts in the event of default on or termination of any one contract.
|
Xcel Energy recognizes transfers between Levels as of the beginning of each period. The following table presents the transfers that occurred from Level 3 to Level 2 during the year ended Dec. 31, 2010.
|
Year Ended
|
||||
|
(Thousands of Dollars)
|
Dec. 31, 2010
|
|||
|
Trading commodity derivatives not designated as cash flow hedges:
|
||||
|
Current assets
|
$ | 7,271 | ||
|
Noncurrent assets
|
26,438 | |||
|
Current liabilities
|
(4,115 | ) | ||
|
Noncurrent liabilities
|
(16,069 | ) | ||
|
Total
|
$ | 13,525 | ||
There were no transfers of amounts from Level 2 to Level 3, or any transfers to or from Level 1 for the year ended Dec. 31, 2010. The transfer of amounts from Level 3 to Level 2 is due to the valuation of certain long-term derivative contracts for which observable commodity pricing forecasts became a more significant input during the period.
The following table presents for each of the hierarchy Levels, Xcel Energy’s assets and liabilities that are measured at fair value on a recurring basis at Dec. 31, 2009:
|
Dec. 31, 2009
|
||||||||||||||||||||||||
|
Fair Value
|
||||||||||||||||||||||||
|
Fair Value
|
Counterparty
|
|||||||||||||||||||||||
|
(Thousands of Dollars)
|
Level 1
|
Level 2
|
Level 3
|
Total
|
Netting
(c)
|
Total
|
||||||||||||||||||
|
Current derivative assets
|
||||||||||||||||||||||||
|
Other derivative instruments:
|
||||||||||||||||||||||||
|
Trading commodity
|
$ | — | $ | 16,128 | $ | 7,241 | $ | 23,369 | $ | (13,763 | ) | $ | 9,606 | |||||||||||
|
Electric commodity
|
— | — | 23,540 | 23,540 | 1,425 | 24,965 | ||||||||||||||||||
|
Natural gas commodity
|
— | 10,921 | — | 10,921 | 165 | 11,086 | ||||||||||||||||||
|
Total current derivative assets
|
$ | — | $ | 27,049 | $ | 30,781 | $ | 57,830 | $ | (12,173 | ) | 45,657 | ||||||||||||
|
Purchased power agreements
(b)
|
52,043 | |||||||||||||||||||||||
|
Current derivative instruments
|
$ | 97,700 | ||||||||||||||||||||||
|
Noncurrent derivative assets
|
||||||||||||||||||||||||
|
Derivatives designated as cash flow hedges:
|
||||||||||||||||||||||||
|
Vehicle fuel and other commodity
|
$ | — | $ | 154 | $ | — | $ | 154 | $ | — | $ | 154 | ||||||||||||
|
Other derivative instruments:
|
||||||||||||||||||||||||
|
Trading commodity
|
— | 8,554 | 13,145 | 21,699 | (3,516 | ) | 18,183 | |||||||||||||||||
|
Natural gas commodity
|
— | 527 | — | 527 | 254 | 781 | ||||||||||||||||||
|
Total noncurrent derivative assets
|
$ | — | $ | 9,235 | $ | 13,145 | $ | 22,380 | $ | (3,262 | ) | 19,118 | ||||||||||||
|
Purchased power agreements
(b)
|
270,412 | |||||||||||||||||||||||
|
Noncurrent derivative instruments
|
$ | 289,530 | ||||||||||||||||||||||
|
Dec. 31, 2009
|
||||||||||||||||||||||||
|
Fair Value
|
||||||||||||||||||||||||
|
Fair Value
|
Counterparty
|
|||||||||||||||||||||||
|
(Thousands of Dollars)
|
Level 1
|
Level 2
|
Level 3
|
Total
|
Netting
(c)
|
Total
|
||||||||||||||||||
|
Other recurring fair value assets
|
||||||||||||||||||||||||
|
Nuclear decommissioning fund
(a)
|
||||||||||||||||||||||||
|
Cash equivalents
|
$ | — | $ | 28,134 | $ | — | $ | 28,134 | $ | — | $ | 28,134 | ||||||||||||
|
Debt securities:
|
||||||||||||||||||||||||
|
Government securities
|
— | 74,126 | — | 74,126 | — | 74,126 | ||||||||||||||||||
|
U.S. corporate bonds
|
— | 312,844 | — | 312,844 | — | 312,844 | ||||||||||||||||||
|
Foreign securities
|
— | 9,445 | — | 9,445 | — | 9,445 | ||||||||||||||||||
|
Municipal bonds
|
— | 149,088 | — | 149,088 | — | 149,088 | ||||||||||||||||||
|
Asset-backed securities
|
— | — | 11,918 | 11,918 | — | 11,918 | ||||||||||||||||||
|
Mortgage-backed securities
|
— | — | 81,189 | 81,189 | — | 81,189 | ||||||||||||||||||
|
Equity securities:
|
||||||||||||||||||||||||
|
Common stock
|
581,995 | — | — | 581,995 | — | 581,995 | ||||||||||||||||||
|
Total
|
$ | 581,995 | $ | 573,637 | $ | 93,107 | $ | 1,248,739 | $ | — | $ | 1,248,739 | ||||||||||||
|
Current derivative liabilities
|
||||||||||||||||||||||||
|
Derivatives designated as cash flow hedges:
|
||||||||||||||||||||||||
|
Vehicle fuel and other commodity
|
$ | — | $ | 3,243 | $ | — | $ | 3,243 | $ | — | $ | 3,243 | ||||||||||||
|
Other derivative instruments:
|
||||||||||||||||||||||||
|
Trading commodity
|
— | 17,803 | 4,566 | 22,369 | (18,093 | ) | 4,276 | |||||||||||||||||
|
Electric commodity
|
— | — | 3,276 | 3,276 | 1,425 | 4,701 | ||||||||||||||||||
|
Natural gas commodity
|
— | 6,749 | — | 6,749 | 165 | 6,914 | ||||||||||||||||||
|
Other commodity
|
— | — | 360 | 360 | — | 360 | ||||||||||||||||||
|
Total current derivative liabilities
|
$ | — | $ | 27,795 | $ | 8,202 | $ | 35,997 | $ | (16,503 | ) | 19,494 | ||||||||||||
|
Purchased power agreements
(b)
|
27,060 | |||||||||||||||||||||||
|
Current derivative instruments
|
$ | 46,554 | ||||||||||||||||||||||
|
Noncurrent derivative liabilities
|
||||||||||||||||||||||||
|
Other derivative instruments:
|
||||||||||||||||||||||||
|
Trading commodity
|
$ | — | $ | 5,384 | $ | 7,682 | $ | 13,066 | $ | (3,521 | ) | $ | 9,545 | |||||||||||
|
Natural gas commodity
|
— | 662 | — | 662 | 254 | 916 | ||||||||||||||||||
|
Total noncurrent derivative liabilities
|
$ | — | $ | 6,046 | $ | 7,682 | $ | 13,728 | $ | (3,267 | ) | 10,461 | ||||||||||||
|
Purchased power agreements
(b)
|
297,309 | |||||||||||||||||||||||
|
Noncurrent derivative instruments
|
$ | 307,770 | ||||||||||||||||||||||
|
(a)
|
Reported in nuclear decommissioning fund and other investments on the consolidated balance sheet, which also includes $104.5 million of equity investments in unconsolidated subsidiaries and $28.6 million of miscellaneous investments.
|
|
(b)
|
In 2003, as a result of implementing new guidance on the normal purchase exception for derivative accounting, Xcel Energy began recording several long-term purchased power agreements at fair value due to accounting requirements related to underlying price adjustments. As these purchases are recovered through normal regulatory recovery mechanisms in the respective jurisdictions, the changes in fair value for these contracts were offset by regulatory assets and liabilities. During 2006, Xcel Energy qualified these contracts under the normal purchase exception. Based on this qualification, the contracts are no longer adjusted to fair value and the previous carrying value of these contracts will be amortized over the remaining contract lives along with the offsetting regulatory assets and liabilities.
|
|
(c)
|
The accounting guidance for derivatives and hedging permits the netting of receivables and payables for derivatives and related collateral amounts when a legally enforceable master netting agreement exists between Xcel Energy and a counterparty. A master netting agreement is an agreement between two parties who have multiple contracts with each other that provides for the net settlement of all contracts in the event of default on or termination of any one contract.
|
The methods utilized to measure the fair value of commodity derivatives include the use of forward prices and volatilities to value commodity forwards and options. Levels are assigned to these fair value measurements based on the significance of the use of subjective forward price and volatility forecasts for commodities and delivery locations with limited observability, or the significance of contractual settlements that extend to periods beyond those readily observable on active exchanges or quoted by brokers. Electric commodity derivatives include FTRs, for which fair value is determined using complex predictive models and inputs including forward commodity prices as well as subjective forecasts of retail and wholesale demand, generation and resulting transmission system congestion. Given the limited observability of management’s forecasts for several of these inputs, fair value measurements for FTRs have been assigned a Level 3.
Xcel Energy continuously monitors the creditworthiness of the counterparties to its commodity derivative contracts and assesses each counterparty’s ability to perform on the transactions set forth in the contracts. Given this assessment, as well as an assessment of the impact of Xcel Energy’s own credit risk when determining the fair value of commodity derivative liabilities, the impact of considering credit risk was immaterial to the fair value of commodity derivative assets and liabilities presented in the consolidated balance sheets.
Cash equivalents are recorded at cost plus accrued interest to approximate fair value. Changes in the observed trading prices and liquidity of cash equivalents, including money market funds, are also monitored as additional support for determining fair value. Equity securities are valued using quoted prices in active markets. The fair values for commingled funds and international equity funds are measured using net asset values, which take into consideration the value of underlying fund investments, as well as the other accrued assets and liabilities of a fund, in order to determine a per share market value. The investments in commingled funds and international equity funds may be redeemed for net asset value. Debt securities are primarily priced using recent trades and observable spreads from benchmark interest rates for similar securities, except for asset-backed and mortgage-backed securities, which also require significant, subjective risk-based adjustments to the interest rate used to discount expected future cash flows, which include estimated principal prepayments. Therefore, fair value measurements for asset-backed and mortgage-backed securities have been assigned a Level 3.
The following table presents the changes in Level 3 commodity derivatives for the years ended Dec. 31, 2010, 2009 and 2008:
|
Year Ended Dec. 31,
|
||||||||||||
|
(Thousands of Dollars)
|
2010
|
2009
|
2008
|
|||||||||
|
Balance at Jan. 1
|
$ | 28,042 | $ | 23,221 | $ | 19,466 | ||||||
|
Purchases and settlements, net
|
(963 | ) | (4,143 | ) | (5,981 | ) | ||||||
|
Transfers (out of) into Level 3
|
(13,525 | ) | 1,280 | (3,962 | ) | |||||||
|
(Losses) gains recognized in earnings
|
(14,924 | ) | (581 | ) | 2,129 | |||||||
|
Gains recognized as regulatory assets and liabilities
|
3,762 | 8,265 | 11,569 | |||||||||
|
Balance at Dec. 31
|
$ | 2,392 | $ | 28,042 | $ | 23,221 | ||||||
Losses on Level 3 commodity derivatives recognized in earnings for the years ended Dec. 31, 2010 and Dec. 31, 2009, include $6.2 million and $8.2 million of net unrealized gains, respectively, relating to commodity derivatives held at Dec. 31, 2010 and Dec. 31, 2009. Gains on Level 3 commodity derivatives recognized in earnings for the ended Dec. 31, 2008, include $3.7 million of net unrealized gains relating to commodity derivatives held at Dec. 31, 2008. Realized and unrealized gains and losses on commodity trading activities are included in electric revenues. Realized and unrealized gains and losses on non-trading derivative instruments are recorded in OCI or deferred as regulatory assets and liabilities. The classification as a regulatory asset or liability is based on the commission approved regulatory recovery mechanisms. Realized and unrealized gains and losses on nuclear decommissioning fund investments are deferred as a component of a regulatory asset for nuclear decommissioning.
The following table presents the changes in Level 3 nuclear decommissioning fund assets for the years ended Dec. 31, 2010, 2009 and 2008:
| Year Ended Dec. 31, | ||||||||||||||||||||||||
| 2010 | 2009 | 2008 | ||||||||||||||||||||||
|
Mortgage-
|
Asset-
|
Mortgage-
|
Asset-
|
Mortgage-
|
Asset-
|
|||||||||||||||||||
|
Backed
|
Backed
|
Backed
|
Backed
|
Backed
|
Backed
|
|||||||||||||||||||
|
(Thousands of Dollars)
|
Securities
|
Securities
|
Securities
|
Securities
|
Securities
|
Securities
|
||||||||||||||||||
|
Balance at Jan. 1
|
$ | 81,189 | $ | 11,918 | $ | 98,461 | $ | 10,962 | $ | 100,802 | $ | 7,854 | ||||||||||||
|
Purchases and settlements, net
|
(12,204 | ) | 20,993 | (27,872 | ) | (484 | ) | 7,907 | 4,291 | |||||||||||||||
|
Gains (losses) recognized as regulatory assets and liabilities
|
3,604 | 263 | 10,600 | 1,440 | (10,248 | ) | (1,183 | ) | ||||||||||||||||
|
Balance at Dec. 31
|
$ | 72,589 | $ | 33,174 | $ | 81,189 | $ | 11,918 | $ | 98,461 | $ | 10,962 | ||||||||||||
12. Financial Instruments
The estimated Dec. 31 fair values of Xcel Energy’s recorded financial instruments are as follows:
|
2010
|
2009
|
|||||||||||||||
|
(Thousands of Dollars)
|
Carrying
Amount
|
Fair Value
|
Carrying
Amount
|
Fair Value
|
||||||||||||
|
Nuclear decommissioning fund
|
$ | 1,350,630 | $ | 1,350,630 | $ | 1,248,739 | $ | 1,248,739 | ||||||||
|
Other investments
|
9,063 | 9,063 | 9,649 | 9,649 | ||||||||||||
|
Long-term debt, including current portion
|
9,318,559 | 10,224,845 | 8,432,442 | 9,026,257 | ||||||||||||
The fair value of cash and cash equivalents, notes and accounts receivable and notes and accounts payable are not materially different from their carrying amounts. The fair value of external nuclear decommissioning fund investments are generally estimated based on quoted market prices for those or similar investments. The fair values for commingled funds and international equity funds within the nuclear decommissioning fund take into consideration the value of underlying fund investments. The fair values of Xcel Energy’s other investments are estimated based on quoted market prices for those or similar investments. The fair values of Xcel Energy’s long-term debt is estimated based on the quoted market prices for the same or similar issues, or the current rates for debt of the same remaining maturities and credit quality.
The fair value estimates presented are based on information available to management as of Dec. 31, 2010 and 2009. These fair value estimates have not been comprehensively revalued for purposes of these consolidated financial statements since that date, and current estimates of fair values may differ significantly.
Guarantees —
Xcel Energy provides guarantees and bond indemnities supporting certain subsidiaries. The guarantees issued by Xcel Energy guarantee payment or performance by its subsidiaries under specified agreements or transactions. As a result, Xcel Energy’s exposure under the guarantees is based upon the net liability of the relevant subsidiary under the specified agreements or transactions. Most of the guarantees issued by Xcel Energy limit the exposure of Xcel Energy to a maximum amount stated in the guarantees. In connection with the purchase and sale agreements related to Calpine and Lubbock, respectively, Xcel Energy provides for indemnification by each of the purchaser and the seller, to the counterparty for liabilities incurred as a result of a breach of a representation or warranty by the indemnifying party. These indemnification obligations generally have a discrete term and are intended to protect the parties against risks that are difficult to predict or impossible to quantify at the time of the consummation of a particular transaction. As of Dec. 31, 2010, Xcel Energy has no assets held as collateral related to its guarantees and bond indemnities.
On Dec. 31, 2010, Xcel Energy had the following amount of guarantees and exposure under these guarantees for which the triggering event would require performance, including those guarantees related to Seren, UE, and Xcel Energy Argentina, which are components of discontinued operations:
|
(Millions of Dollars)
|
Guarantor
|
Guarantee Amount
|
Current Exposure
|
Triggering Event
|
||||||||||
|
Guarantee the indemnification obligations of Lubbock under an asset purchase agreement
(g) (h)
|
SPS
|
$ | 87.0 |
|
(g)
|
|
(g)
|
|||||||
|
Guarantee the indemnification obligations of Xcel Energy Wholesale Group Inc. under a stock purchase agreement
(h)
|
Xcel Energy
|
17.5 | $ | 17.5 |
|
(c)
|
||||||||
|
Guarantee the indemnification obligations of Xcel Energy Argentina Inc. under a stock purchase agreement
(h)
|
Xcel Energy
|
14.7 | — |
|
(c)
|
|||||||||
|
Guarantee the indemnification obligations of Seren under an asset purchase agreement
(h)
|
Xcel Energy
|
12.5 | — |
|
(c)
|
|||||||||
|
Guarantee the indemnification obligations of Seren under an asset purchase agreement
(h)
|
Xcel Energy
|
10.0 | — |
|
(c)
|
|||||||||
|
Guarantee of customer loans for the Farm Rewiring Program
(e)
|
NSP-Wisconsin
|
1.0 | 0.5 |
|
(e)
|
|||||||||
|
Combination of guarantees benefiting various Xcel Energy subsidiaries
(h)
|
Xcel Energy
|
13.0 | — |
|
(b) (c)
|
|||||||||
|
Total guarantees issued
|
$ | 155.7 | $ | 18.0 | ||||||||||
|
Guarantee performance and payment of surety bonds for itself and its
subsidiaries (f) (i) |
Xcel Energy
|
$ | 32.5 |
|
(a)
|
|
(d)
|
|||||||
|
(a)
|
The total exposure of this indemnification cannot be determined. Xcel Energy believes the exposure to be significantly less than the total amount of the outstanding bonds.
|
|
(b)
|
Nonperformance and/or nonpayment.
|
|
(c)
|
Losses caused by default in performance of covenants or breach of any warranty or representation in the purchase agreement.
|
|
(d)
|
Failure of Xcel Energy or one of its subsidiaries to perform under the agreement that is the subject of the relevant bond. In addition, per the
indemnity agreement between Xcel Energy and the various surety companies, the surety companies have the discretion to demand that collateral be posted.
|
|
(e)
|
The debtor becomes the subject of bankruptcy or other insolvency proceedings.
|
|
(f)
|
Xcel Energy agreed to indemnify an insurance company in connection with surety bonds they may issue or have issued for Utility Engineering up to $80 million. The Xcel Energy indemnification will be triggered only in the event that Utility Engineering has failed to meet its obligations to the surety company.
|
|
(g)
|
SPS has provided indemnification to Lubbock for losses arising out of any breach of the representations, warranties and covenants under the related asset purchase agreement and for losses arising out of certain other matters, including pre-closing unknown liabilities. The indemnification provisions are capped at the purchase price, $87 million, in the aggregate. As of Dec. 31, 2010, no claims have been made. The indemnification provisions for most representations and warranties expire 12 months after the closing date. Certain representations and warranties, including those having to do with transaction authorization survive indefinitely. The indemnification for covenants survives until the applicable covenant is performed. See Note 19 to the consolidated financial statements for further discussion.
|
|
(h)
|
The term of this guarantee is continuing.
|
|
(i)
|
The guarantee expires at various dates through 2022.
|
Letters of Credit
Xcel Energy and its subsidiaries use letters of credit, generally with terms of one year, to provide financial guarantees for certain operating obligations. At Dec. 31, 2010 and 2009, there were $11.2 million and $22.2 million of letters of credit outstanding, respectively. The contract amounts of these letters of credit approximate their fair value and are subject to fees determined in the marketplace.
|
13. Rate Matters
|
NSP-Minnesota
|
Pending and Recently Concluded Regulatory Proceedings — MPUC
|
Base Rate
NSP-Minnesota Electric Rate Case
— In November 2010, NSP-Minnesota filed a request with the MPUC to increase annual electric rates in Minnesota for 2011 by approximately $150 million, or an increase of 5.62 percent. The rate filing is based on a 2011 forecast test year and included a requested ROE of 11.25 percent, an electric rate base of approximately $5.6 billion and an equity ratio of 52.56 percent. In January 2011, NSP-Minnesota revised its requested 2011 rate increase to $148.3 million as the result of the sale of certain transmission assets.
NSP-Minnesota requested an additional increase of $48.3 million or 1.81 percent effective Jan. 1, 2012, to address certain known and measurable cost increases in 2012. Additionally, NSP-Minnesota seeks to transfer approximately $158 million already collected from ratepayers through riders into base rates at the conclusion of this case with implementation of final rates.
The MPUC approved an interim rate increase of $123 million, subject to refund, effective Jan. 2, 2011. The interim rates remain in effect until the MPUC makes its final decision on the case. An MPUC decision is anticipated in the fourth quarter of 2011. The following procedural schedule has been established:
|
|
●
|
Intervenor direct testimony due April 5, 2011;
|
|
|
●
|
Rebuttal testimony due May 4, 2011;
|
|
|
●
|
Surrebuttal testimony due
May 26, 2011;
|
|
|
●
|
Evidentiary hearings due June 1-8, 2011;
|
|
|
●
|
Initial brief due July 29, 2011;
|
|
|
●
|
Reply brief and findings due Aug. 19, 2011;
|
|
|
●
|
ALJ report Sept. 19, 2011; and
|
|
|
●
|
MPUC order due Nov. 28, 2011.
|
NSP-Minnesota Gas Rate Case
— In November 2009, NSP-Minnesota filed a request with the MPUC to increase Minnesota natural gas rates by $16.2 million for 2010, based on an ROE of 11 percent, an equity ratio of 52.46 percent and a rate base of $441 million. In December 2009, the MPUC approved an interim rate increase of $11.1 million, subject to refund. Interim rates went into effect on Jan. 11, 2010.
In June 2010, NSP-Minnesota revised its request to an increase of $10.0 million based on an ROE of 10.6 percent. In November 2010, the MPUC authorized a rate increase of approximately $7 million based on an ROE of 10.0 percent.
Electric, Purchased Gas and Resource Adjustment Clauses
TCR Rider —
The MPUC has approved a TCR rider that allows annual adjustments to retail electric rates to provide recovery of certain incremental transmission investments between rate cases. In 2010, the MPUC approved a TCR rider that recovered approximately $10.8 million during 2010. In October 2010, NSP-Minnesota filed its 2011 rider recovery request, seeking approval to recover approximately $12.9 million during 2011. The request is pending MPUC action.
RES Rider —
The MPUC has approved a RES rider to recover the costs for utility-owned projects implemented in compliance with the Minnesota RES. In 2010, the MPUC approved a RES rider that resulted in $38.4 million in revenue recovery during 2010. In October 2010, NSP-Minnesota filed its 2011 rider recovery request, seeking approval to recover approximately $67.8 million during 2011.
MERP Rider
—
In December 2009, the MPUC authorized NSP-Minnesota to recover revenue requirements related to environmental improvement projects of approximately $116.7 million during 2010 through the MERP rider. In October 2010, NSP-Minnesota filed a request to recover approximately $111.4 million during 2011. Final MPUC action is pending; however, NSP-Minnesota is allowed to implement the 2011 adjustment prior to MPUC approval. If the approval is for a different amount, any under- or over- collections would be trued up in the next annual period.
CIP Rider
— CIP expenses are recovered through a charge embedded in base rates and a rider that is adjusted annually. In April 2010, NSP-Minnesota filed its annual rider petitions requesting recovery of approximately $45 million of electric CIP expenses and financial incentives and $10.2 million of natural gas CIP expenses and financial incentives. These amounts correspond to the forecasted unrecovered year-end balances. During the proceedings, the OES recommended that cost recovery be accelerated and increased to reduce the unrecovered balances and the associated carrying charges assessed to customers on the balances. This would result in higher rider rates in the short-term, but future rates would be lower as the unrecovered balance was lowered.
In October 2010, the MPUC approved an increase to the electric CIP rider rate to increase cost recovery and reduce the unrecovered CIP balance to approximately zero by the end of 2012. Based on the higher rate, NSP-Minnesota estimates recovery of $66.7 million through the rider during the November 2010 to September 2011 timeframe. This is in addition to an expected $48.1 million through the conservation cost recovery charge component of base rates.
In November 2010, the MPUC approved the natural gas CIP rider to bring the tracker balance to approximately zero by the end of 2011. NSP-Minnesota estimates recovery of approximately $18.6 million through the natural gas CIP rider during the December 2010 to September 2011 timeframe. This is in addition to an expected $3.0 million through the conservation cost recovery charge component of base rates.
Pending and Recently Concluded Regulatory Proceedings — NDPSC
NSP-Minnesota North Dakota Electric Rate Case
— In December 2010, NSP-Minnesota filed a request with the NDPSC to increase 2011 electric rates in North Dakota by approximately $19.8 million, or an increase of 12 percent. The rate filing is based on a 2011 forecast test year and includes a requested ROE of 11.25 percent, an electric rate base of approximately $328 million and an equity ratio of 52.56 percent. NSP-Minnesota requested an additional increase of $4.2 million, or 2.6 percent, effective Jan. 1, 2012, to address certain known and measurable cost increases in 2012.
The NDPSC approved an interim rate increase of approximately $17.4 million, subject to refund, effective Feb. 18, 2011. The interim rates would remain in effect until the NDPSC makes its final decision on the case, which is anticipated in the fourth quarter of 2011.
The schedule is as follows:
|
|
●
|
Intervenor direct testimony due June 20, 2011;
|
|
|
●
|
Rebuttal testimony due July 22, 2011;
|
|
|
●
|
Evidentiary hearings due Aug. 9-12, 2011;
|
|
|
●
|
Initial briefs due Sept. 16, 2011;
|
|
|
●
|
Reply brief and findings due Sept. 30, 2011; and
|
|
|
●
|
NDPSC order due Nov. 16, 2011.
|
|
NSP-Wisconsin
|
|
Pending and Recently Concluded Regulatory Proceedings — PSCW
|
Base Rate
NSP-Wisconsin 2010 Electric Rate Case Reopener
— In August 2010, NSP-Wisconsin filed a request with the PSCW to reopen the 2010 rate case and increase retail electric rates for 2011 by $29.1 million, or 5.4 percent, based on a forecast 2011 test year. In January 2011, the PSCW issued its final decision in the case, approving an increase of $21.1 million, or 3.9 percent. The new rates went into effect on Jan. 15, 2011.
PSCo
Pending and Recently Concluded Regulatory Proceedings — CPUC
Base Rate
PSCo 2010 Electric Rate Case
— In December 2009, the CPUC approved a rate increase of approximately $128.3 million; however, due to the delay in Comanche Unit 3 coming online, the CPUC approved PSCo’s proposal to phase in the approved electric rate increase to reflect the actual cost of service. In the first quarter of 2011, the CPUC reconsidered several matters at PSCo’s request and increased that amount by $2.2 million, resulting in an overall rate increase of approximately $130 million.
Under the plan, the following increases have been implemented:
|
|
●
|
A rate increase of $67 million was implemented on Jan. 1, 2010.
|
|
|
●
|
In May 2010, base rates were increased to recover $125 million annually, when Comanche Unit 3 went into service.
|
|
|
●
|
Base rates increased to recover approximately $130 million annually on Jan. 1, 2011, to reflect 2011 property taxes.
|
A second phase of the rate case addressed changes to rate design. The new rates, approved by the CPUC, went into effect on June 1, 2010. In this phase of the proceeding, the CPUC approved tiered summer rates for residential customers and seasonally differentiated rates for other customer classes, which will impact the timing of revenue collection, as compared to the previous rate design, depending on customer response. Year-to-date electric revenues and margin were positively impacted by approximately $31 million, related to the implementation of such rate design and seasonal rates. Seasonal rates are designed to be revenue neutral on an annual basis. However, the quarterly pattern of revenue collection is expected to be different than in the past as seasonal rates are higher in the summer months and lower throughout the remainder of the year.
PSCo 2010 Gas Rate Case
— In December 2010, PSCo filed a request with the CPUC to increase Colorado retail gas rates by $27.5 million, effective in the summer of 2011. The request was based on a 2011 forecast test year, a 10.90 percent ROE, a rate base of $1.1 billion and an equity ratio of 57.10 percent. PSCo also proposed that beginning in 2012, it be allowed to recover certain compliance and aging infrastructure costs through a pipeline integrity rider.
Electric, Purchased Gas and Resource Adjustment Clauses
TCA Rider —
In November 2010, PSCo filed its annual TCA rider, to adjust the amounts recovered in the rider based on updated plant balances. The filing increased rates by $9.0 million, effective Jan. 1, 2011.
REC Sharing Settlement
— In August 2009, PSCo filed an application seeking approval of treatment of margins associated with sales of Colorado RECs that are bundled with energy into California. In January 2010, PSCo, the OCC, the CPUC staff, the Colorado Governor’s Energy Office and Western Resource Advocates entered into a unanimous settlement in this case. The settlement establishes a pilot program and defines certain margin splits during this pilot period. The settlement provides that margins would be shared based on the following allocations:
|
Carbon
|
||||||||||||
|
Margin
|
Customers
|
PSCo
|
Offsets
|
|||||||||
|
Less than $10 million
|
50 | % | 40 | % | 10 | % | ||||||
|
$10 million to $30 million
|
55 | 35 | 10 | |||||||||
|
Greater than $30 million
|
60 | 30 | 10 | |||||||||
Amounts designated as carbon offsets are recorded as a regulatory liability until carbon offset-related expenditures are incurred. Carbon offsets are capped at $10 million, with the remaining 10 percent going to customers after the cap is reached. The unanimous settlement also clarified that margins associated with RECs bundled with Colorado energy would be shared 20 percent to PSCo and 80 percent to customers. Margins associated with sales of unbundled stand-alone RECs without energy would be credited 100 percent to customers, and PSCo has the right to file a separate application for sharing margins from stand-alone REC sales. The CPUC approved the settlement in May 2010. Since the settlement, PSCo has filed an application to share margins from the sales of stand alone RECs at 20 percent to PSCo and 80 percent to customers. The application will be decided in the first quarter of 2011. PSCo is expected to file a proposal for permanent treatment of REC margins, except the stand-alone REC margins in March 2011.
Pending and Recently Concluded Regulatory Proceedings — FERC
Wholesale Rate Case
— On Feb. 8, 2011, PSCo filed a request with the FERC to change Colorado wholesale electric customer rates to formula based rates with an expected increase of $16.1 million annually for 2011. PSCo is seeking to make the request effective in April 2011; however, the FERC has the authority to grant a five month suspension from the April date. The request was based on a 2011 forecast test year, a 10.9 percent ROE, a total PSCo wholesale production rate base of $407.4 million and an equity ratio of 57.1 percent. Under the proposal, the formula rate would be estimated each year for the following year and then would be trued up to actual costs after the conclusion of the calendar year. The primary drivers of the revenue deficiency are the inclusion of the recently acquired Blue Spruce Energy Center and Rocky Mountain Energy Center generating units and inclusion of the costs of early retirement of certain coal plants under the CACJA emissions reduction plan, all of which were approved by the CPUC in late 2010.
SPS
Pending and Recently Concluded Regulatory Proceedings — PUCT
Base Rate
SPS Texas Retail Base Rate Case —
In May 2010, SPS filed an electric rate case in Texas seeking an annual base rate increase of approximately $71.5 million inclusive of franchise fees. On a net basis, the request seeks to increase customer bills by approximately $53.4 million or 7 percent. The rate filing is based on a 2009 test year adjusted for known and measurable changes, a requested ROE of 11.35 percent, an electric rate base of $1.031 billion and an equity ratio of 51.0 percent. The filing with the PUCT also includes a request to reconcile SPS’ fuel and purchased power costs for calendar years 2008 and 2009. As of Dec. 31, 2009, SPS had a fuel cost under-recovery of approximately $3.3 million.
In November 2010, SPS filed an update to the cost of service to reflect the impact on Texas retail rates, primarily resulting from its sale of Lubbock facilities. The total request was reduced to approximately $63.7 million and the net request $47.6 million.
On Feb. 11, 2011, the parties reached an unopposed settlement to resolve all issues in the case. Effective Feb. 16, 2011, base rates increased by $39.4 million, of which $16.9 is associated with the transfer of two riders, the TCRF and Power Cost Recovery Factor into base rates and a $22.5 million traditional base rate increase. In addition, SPS is allowed to defer up to $2.3 million of pension and benefit costs and $1.6 million of renewable energy credits that had been included in SPS’ base rate request.
Effective Jan. 1, 2012, the settlement provides for SPS to increase base rates by $13.1 million and allows SPS to seek an energy efficiency cost recovery factor rider for $2.9 million that if approved would result in an effective rate increase of $16.0 million. SPS plans to make its filing for the rider by May 1, 2011 pursuant to a recent PUCT order. In addition, SPS is allowed to track and defer up to $4.3 million of pension and benefit costs above the test year levels as well as $1.6 million of renewable energy credits, as described above.
SPS agreed not to file another rate case until Sept. 15, 2012. In addition, SPS cannot file a TCRF until 2013, and if SPS files a TCRF application before the effective date of rates in its next rate case, it must reduce the calculated TCRF revenue requirement by $12.2 million.
Interim rates became effective on Feb. 16, 2011, subject to refund pending PUCT approval of the settlement. PUCT approval of the settlement would result in no refund of interim rates. The PUCT is expected to consider the final order during the first half of 2011.
Pending and Recently Concluded Regulatory Proceedings — FERC
Wholesale Rate Complaints
— In November 2004, Golden Spread Electric, Lyntegar Electric, Farmer’s Electric, Lea County Electric, Central Valley Electric and Roosevelt County Electric, all wholesale cooperative customers of SPS, filed a rate complaint with the FERC alleging that SPS’ rates for wholesale service were excessive and that SPS had incorrectly calculated monthly fuel cost adjustment charges to such customers (the complaint). Cap Rock, another full-requirements customer of SPS, Public Service Company of New Mexico (PNM) and Occidental Permian Ltd. and Occidental Power Marketing, L.P. (Occidental), SPS’ largest retail customer, intervened in the proceeding.
In April 2008, the FERC issued its order on the complaint applied to the remaining non-settling parties. In July 2008, SPS submitted its compliance report to the FERC and calculated the base rate refund for the 18-month period to be $6.1 million and the fuel refund to be $4.4 million. Several wholesale customers protested these calculations. The status of various settlements and the applicable regulatory approvals are discussed below. At this time, PNM, which filed a separate complaint, is the only party that has not settled. As of Dec. 31, 2010, SPS has accrued an amount it believes is sufficient to cover the estimated refund obligation related to the PNM complaint.
Golden Spread Complaint Settlement
— SPS reached a settlement with Golden Spread (which included Lyntegar Electric) and Occidental in December 2007 regarding base rate and fuel issues raised in the complaint described above as well as a subsequent rate proceeding. The FERC approved the settlement in April 2008. The PUCT and NMPRC approvals were obtained in the first quarter of 2010 eliminating the potential contingent payments by SPS resulting from an adverse cost assignment decision or a failure to obtain state approvals.
New Mexico Cooperatives’ Complaint Settlement
— In June 2010, the FERC approved the settlement with Farmers’ Electric Cooperative of New Mexico, Lea County Electric Cooperative, Central Valley Electric Cooperative and Roosevelt County Electric Cooperative, and Occidental. The settlement resolves all issues arising from the complaint docket and implements a replacement contract with a formula production rate at 10.5 percent ROE and extended the term of its requirements sale to the four wholesale customers.
The four wholesale customers must reduce their power purchases by 90 to 100 MW in 2012, and implement staged reductions in system average cost power purchases through the term of the agreement, which terminates in May 2026. The settlement made the replacement contract contingent on certain state approvals, which were obtained by SPS. In the event that all state regulatory approvals had not been received, the settlement included a one time contingent payment of $12 million by SPS to these wholesale customers.
These wholesale customers agreed to hold SPS harmless from any future adverse regulatory treatment regarding the proposed wholesale power sale. As a result of the FERC approval of the settlement and resolution of the complaint with the New Mexico cooperatives, SPS released previously established reserves of $11.5 million in the second quarter of 2010.
The New Mexico parties and NMPRC staff filed a stipulation to resolve the NMPRC proceeding. The NMPRC issued a final order approving the stipulation in August 2010. The PUCT approved the settlement replacement arrangement in September 2010.
Cap Rock Complaint Settlement
— In July 2010, SPS and Cap Rock filed a settlement agreement with the FERC. Cap Rock agrees that its production base rates will be converted to a formula rate design. In December 2010, the FERC approved the settlement. Pursuant to the settlement, SPS released previously established reserves of $3.3 million in the fourth quarter of 2010 and paid Cap Rock $1 million.
14. Commitments and Contingent Liabilities
Commitments
Capital Commitments —
As of Dec. 31, 2010, the estimated cost of capital expenditure programs of Xcel Energy and its subsidiaries is approximately $2.45 billion in 2011, $2.35 billion in 2012, $3.0 billion in 2013, $2.8 billion in 2014 and $2.55 billion in 2015. Xcel Energy’s capital forecast includes the following major projects:
Nuclear Capacity Increases and Life Extension
— NSP-Minnesota is seeking a 20-year license renewal for the Prairie Island nuclear plant. A renewed operating license was approved and issued for Monticello by the NRC in November 2006 licensing the plant to operate until 2030, and the MPUC order approving the spent fuel storage capacity needed to support plant operations until 2030 went into effect in June 2007. The application to renew Prairie Island’s operating licenses was submitted to the NRC in April 2008 and a final decision is expected in early 2011. The application for a CON for additional spent fuel storage capacity to support 20 additional years of plant operation was approved by the MPUC in December 2009.
NSP-Minnesota is pursuing capacity increases of Monticello and Prairie Island that will total approximately 235 MW, to be implemented, if approved, between 2010 and 2015. Total capital investment between 2011 and 2015 for these activities is estimated to be approximately $725 million to bring the total investment to over $1 billion. The MPUC approved the Monticello power uprate CON and site permit in December 2008 and the Prairie Island power uprate CON and site permit in December 2009. The filing for the Monticello power uprate was placed on hold by the NRC staff to address concerns raised by the ACRS related to containment pressure associated with pump performance. NSP-Minnesota is working with the NRC to determine whether it needs to supplement its filing as necessary to address the issues and expects to complete the license proceeding in 2011. NSP-Minnesota cannot file for NRC approval of the extended power uprate for Prairie Island until after the NRC renews the plants’ current operating licenses. A decision is expected in 2011. The extended power uprates are scheduled to be implemented during the 2014 and 2015 refueling outages.
Wind Generation
— NSP-Minnesota invested approximately $500 million in wind generation through 2010 and expects to invest an additional $400 million in 2011. The 201 MW Nobles Wind Project in southwestern Minnesota began commercial operations in 2010 and the 150 MW Merricourt Wind Project in southeastern North Dakota is expected to reach commercial operation in 2011. NSP-Minnesota received regulatory approval for these projects, and has requested recovery of eligible costs, which began in 2010.
CapX2020
— In 2006, CapX2020, an alliance of electric cooperatives, municipals and investor-owned utilities in the upper Midwest, including Xcel Energy, announced that it had identified several groups of transmission projects that proposed to be complete by 2020. Group 1 project investments are expected to total approximately $1.9 billion. Major construction began in 2010 on two of the four Group 1 projects, with the in-service date of the last project expected to be in 2015. Xcel Energy’s investment is expected to be approximately $1.0 billion depending on the routes and configurations approved by affected state commissions. The remainder of the costs will be born by other utilities in the upper Midwest. Approximately 75 percent of the 2010 capital expenditures and return on investment for transmission projects are expected to be recovered under an NSP-Minnesota TCR tariff rider mechanism authorized by Minnesota legislation, as well as a similar TCR mechanism passed in South Dakota. Cost-recovery by NSP-Wisconsin is expected to occur through the biennial PSCW rate case process.
Black Dog Repowering
— NSP-Minnesota is proposing construction over the next five years to repower the Black Dog plant in Burnsville, Minn.
The $585 million project will replace the remaining coal-fired units and install approximately 680 MW of natural gas generation in 2016. The new gas-fired generation is a combined-cycle facility consisting of two combustion turbines and one steam turbine.
CACJA
— The CACJA was signed into law in April 2010. The CACJA aims to reduce annual emissions of NOx
by at least 70 to 80 percent or greater from 2008 levels by 2017 from the coal fired generation identified in the plan. The total cost of the plan would result in new construction of approximately $1.0 billion over the next seven years.
The capital expenditure programs of Xcel Energy are subject to continuing review and modification. Actual utility construction expenditures may vary from the estimates due to changes in electric and natural gas projected load growth, regulatory decisions, legislative initiatives, reserve margins, the availability of purchased power, alternative plans for meeting Xcel Energy’s long-term energy needs, compliance with future requirements and RPS to install emission-control equipment, and merger, acquisition and divestiture opportunities to support corporate strategies may impact actual capital requirements.
Fuel Contracts —
Xcel Energy and its subsidiaries have contracts providing for the purchase and delivery of a significant portion of its current coal, nuclear fuel and natural gas requirements. These contracts expire in various years between 2011 and 2040. In addition, Xcel Energy is required to pay additional amounts depending on actual quantities shipped under these agreements. Xcel Energy’s risk of loss, in the form of increased costs from market price changes in fuel, is mitigated through the use of natural gas and energy cost rate adjustment mechanisms, which provide for pass-through of most fuel, storage and transportation costs to customers.
The estimated minimum purchases for Xcel Energy under these contracts as of Dec. 31, 2010, is as follows:
|
(Millions of Dollars)
|
2010
|
|||
|
Coal
|
$ | 2,711.2 | ||
|
Nuclear fuel
|
1,170.1 | |||
|
Natural gas supply
|
1,313.7 | |||
|
Natural gas storage and transportation
|
3,053.4 | |||
Purchased Power Agreements
—
The utility subsidiaries of Xcel Energy have entered into agreements with other utilities and energy suppliers for purchased power to meet system load and energy requirements, replace generation from company-owned units under maintenance or during outages, and meet operating reserve obligations.
NSP-Minnesota, PSCo and SPS have various pay-for-performance contracts with expiration dates through the year 2034. In general, these contracts provide for energy payments based on actual power taken under the contracts as well as capacity payments. Capacity payments are typically contingent on the independent power producing entity meeting certain contract obligations, including plant availability requirements. Certain contractual payments are adjusted based on market indices; however, the effects of price adjustments are mitigated through purchased energy cost recovery mechanisms.
Included in electric fuel and purchased power expenses for purchase power agreements accounted for as executory contracts were payments for capacity of $426.7 million, $461.3 million, and $480.2 million in 2010, 2009 and 2008, respectively. At Dec. 31, 2010, the estimated future payments for capacity that the utility subsidiaries of Xcel Energy are obligated to purchase, subject to availability, are as follows:
|
(Millions of Dollars)
|
||||
|
2011
|
$ | 328.1 | ||
|
2012
|
266.5 | |||
|
2013
|
219.1 | |||
|
2014
|
217.0 | |||
|
2015
|
195.8 | |||
|
2016 and thereafter
|
535.7 | |||
|
Total
|
$ | 1,762.2 | ||
Variable Interest Entities
— Effective Jan. 1, 2010, Xcel Energy adopted new guidance on consolidation of variable interest entities. The guidance requires enterprises to consider the activities that most significantly impact an entity’s financial performance, and power to direct those activities, when determining whether an enterprise is a variable interest entity’s primary beneficiary.
Purchased Power Agreements
— NSP-Minnesota, PSCo and SPS purchase power from independent power producing entities that own natural gas or biomass fueled power plants. Under certain purchased power agreements with these entities, these subsidiaries are required to reimburse natural gas or biomass fuel costs, or to participate in tolling arrangements under which the subsidiaries procure the natural gas required to produce the energy that they purchase. These specific purchased power agreements have been determined by Xcel Energy to create variable interests in the independent power producing entities; therefore, certain independent power producing entities are variable interest entities.
Xcel Energy is not subject to risk of loss from the operations of these entities, and no significant financial support has been, or is in the future required to be provided other than contractual payments for energy and capacity set forth in purchased power agreements.
Xcel Energy has evaluated each of these variable interest entities for possible consolidation, including review of qualitative factors such as the length and terms of the contract, control over O&M, historical and estimated future fuel and electricity prices, and financing activities. Xcel Energy has concluded that these entities are not required to be consolidated in its consolidated financial statements because it does not have the power to direct the activities that most significantly impact the entities’ economic performance. Xcel Energy had approximately 5,012 MW of capacity under long-term purchased power agreements as of Dec. 31, 2010 and Dec. 31, 2009 with entities that have been determined to be variable interest entities.
Fuel Contracts
— SPS purchases all of its coal requirements for its Harrington and Tolk electric generating stations from TUCO under contracts for those facilities that expire in 2016 and 2017, respectively. TUCO arranges for the purchase, receiving, transporting, unloading, handling, crushing, weighing, and delivery of coal to meet SPS’ requirements. TUCO is responsible for negotiating and administering contracts with coal suppliers, transporters and handlers.
No significant financial support has been, or is in the future, required to be provided to TUCO by SPS, other than contractual payments for delivered coal. However, the fuel contracts have been determined to create a variable interest in TUCO due to SPS’ reimbursement of certain fuel procurement costs, and therefore TUCO is a variable interest entity. SPS has concluded that it is not the primary beneficiary of TUCO because SPS does not have the power to direct the activities that most significantly impact TUCO’s economic performance.
Low-Income Housing Limited Partnerships
— Eloigne and NSP-Wisconsin have entered into limited partnerships for the construction and operation of affordable rental housing developments which qualify for low-income housing tax credits. Xcel Energy has determined Eloigne and NSP-Wisconsin’s low-income housing limited partnerships to be variable interest entities primarily due to contractual arrangements within each limited partnership that establish sharing of ongoing voting control and profits and losses that does not consistently align with the partners’ proportional equity ownership. These limited partnerships are designed to qualify for low-income housing tax credits, and Eloigne and NSP-Wisconsin generally receive a larger allocation of the tax credits than the general partners at inception of the arrangements. Xcel Energy has determined that Eloigne and NSP-Wisconsin have the power to direct the activities that most significantly impact these entities’ economic performance, and therefore Xcel Energy consolidates these limited partnerships in its consolidated financial statements.
Equity financing for these entities has been provided by Eloigne and NSP-Wisconsin and the general partner of each limited partnership, and Xcel Energy’s risk of loss is limited to its capital contributions, adjusted for any distributions and its share of undistributed profits and losses; no significant additional financial support has been, or is in the future, required to be provided to the limited partnerships by Eloigne or NSP-Wisconsin. Mortgage-backed debt typically comprises the majority of the financing at inception of each limited partnership and is paid over the life of the limited partnership arrangement. Obligations of the limited partnerships are generally secured by the housing properties of each limited partnership, and the creditors of each limited partnership have no significant recourse to Xcel Energy or its subsidiaries. Likewise, the assets of the limited partnerships may only be used to settle obligations of the limited partnerships, and not those of Xcel Energy or its subsidiaries.
Amounts reflected in Xcel Energy’s consolidated balance sheets for the Eloigne and NSP-Wisconsin low-income housing limited partnerships include the following:
|
(Thousands of Dollars)
|
Dec. 31, 2010
|
Dec. 31, 2009
|
||||||
|
Current assets
|
$ | 3,794 | $ | 3,674 | ||||
|
Property, plant and equipment, net
|
97,602 | 103,552 | ||||||
|
Other noncurrent assets
|
8,236 | 7,577 | ||||||
|
Total assets
|
$ | 109,632 | $ | 114,803 | ||||
|
Current liabilities
|
$ | 11,884 | $ | 12,315 | ||||
|
Mortgages and other long-term debt payable
|
53,195 | 54,927 | ||||||
|
Other noncurrent liabilities
|
8,333 | 8,250 | ||||||
|
Total liabilities
|
$ | 73,412 | $ | 75,492 | ||||
Leases —
Xcel Energy and its subsidiaries lease a variety of equipment and facilities used in the normal course of business. Three of these leases qualify as capital leases and are accounted for accordingly. The assets and liabilities acquired under capital leases are recorded at the lower of fair market value or the present value of future lease payments and are amortized over their actual contract term in accordance with practices allowed by regulators.
WYCO was formed as a joint venture with CIG to develop and lease natural gas pipeline, storage, and compression facilities. Xcel Energy has a 50 percent ownership interest in WYCO. In 2009, WYCO’s Totem gas storage facilities were placed in service. WYCO leases the facilities to CIG, and CIG operates the facilities, providing natural gas storage services to PSCo under a service arrangement that commenced on July 1, 2009.
PSCo accounts for its Totem natural gas storage service arrangement with CIG as a capital lease in accordance with the authoritative guidance on lease accounting. As a result, PSCo has a $149.9 million capital lease obligation recorded for the arrangement as of Dec. 31, 2010. WYCO is expected to incur approximately $4.4 million of additional construction costs, 50 percent of which will be paid by Xcel Energy, to finalize construction and make Totem operational at full storage capacity. Xcel Energy eliminates 50 percent of the capital lease obligation related to WYCO in the consolidated balance sheet along with an equal amount of Xcel Energy’s equity investment in WYCO.
Following is a summary of property held under capital leases:
|
(Millions of Dollars)
|
2010
|
2009
|
||||||
|
Storage, leaseholds and rights
|
$ | 196.1 | $ | 183.6 | ||||
|
Gas pipeline
|
20.7 | 20.7 | ||||||
|
Property held under capital lease
|
216.8 | 204.3 | ||||||
|
Accumulated depreciation
|
(26.6 | ) | (21.3 | ) | ||||
|
Total property held under capital leases, net
|
$ | 190.2 | $ | 183.0 | ||||
The remainder of the leases, primarily for office space, railcars, generating facilities, trucks, aircraft, cars and power-operated equipment, are accounted for as operating leases. Total expenses under operating lease obligations for Xcel Energy and its subsidiaries was approximately $197.4 million, $209.5 million, and $176.9 million for 2010, 2009 and 2008, respectively. These expenses include payments for capacity recorded to electric fuel and purchased power expenses for purchase power agreements accounted for as operating leases of $163.7 million, $171.3 million, and $130.3 million in 2010, 2009 and 2008, respectively.
Included in the future commitments under operating leases are estimated future payments under purchase power agreements that have been accounted for as operating leases in accordance with the applicable accounting guidance. Future commitments under operating and capital leases are:
|
Purchase Power
|
||||||||||||||||
|
Other
|
Agreement
|
Total
|
||||||||||||||
|
Operating
|
Operating
|
Operating
|
||||||||||||||
|
(Millions of Dollars)
|
Leases
|
Leases
(a) (b)
|
Leases
|
Capital Leases
|
||||||||||||
|
2011
|
$ | 28.4 | $ | 148.9 | $ | 177.3 | $ | 18.5 | ||||||||
|
2012
|
24.1 | 159.0 | 183.1 | 17.6 | ||||||||||||
|
2013
|
22.8 | 173.4 | 196.2 | 17.4 | ||||||||||||
|
2014
|
22.6 | 180.6 | 203.2 | 17.3 | ||||||||||||
|
2015
|
21.5 | 182.0 | 203.5 | 16.1 | ||||||||||||
|
Thereafter
|
104.1 | 2,082.6 | 2,186.7 | 330.2 | ||||||||||||
|
Total minimum obligation
|
417.1 | |||||||||||||||
|
Interest component of obligation
|
(301.8 | ) | ||||||||||||||
|
Present value of minimum obligation
|
$ | 115.3 | ||||||||||||||
|
(a)
|
Amounts do not include purchase power agreements accounted for as executory contracts.
|
|
(b)
|
Purchase power agreement operating leases contractually expire through 2033.
|
Technology Agreements
— Xcel Energy has a contract that extends through 2015 with International Business Machines Corp. (IBM) for information technology services. The contract is cancelable at Xcel Energy’s option, although there are financial penalties for early termination. In 2010, Xcel Energy paid IBM $93.6 million under the contract and $2.0 million for other project business. In 2009, Xcel Energy paid IBM $96.6 million under the contract and $1.2 million for other project business. The contract also has a committed minimum payment each year from 2011 through September 2015.
In August 2008, Xcel Energy entered into a contract with Accenture for information technology services, which began on Feb. 1, 2009 and extends through 2016. The contract is cancelable at Xcel Energy’s option, although Xcel Energy would be obligated to pay 50 percent of the contract value for early termination. In 2010, Xcel Energy paid Accenture $22.7 million under the contract and $8.4 million for other project business. In 2009, Xcel Energy paid Accenture $11.3 million under the contract and $1.6 million for other project business. The contract also has a committed minimum payment each year from 2011 through 2016.
Committed minimum payments under these obligations are as follows:
|
IBM
|
Accenture
|
|||||||
|
(Millions of Dollars)
|
Agreement
|
Agreement
|
||||||
|
2011
|
$ | 19.0 | $ | 9.7 | ||||
|
2012
|
17.9 | 8.7 | ||||||
|
2013
|
17.6 | 8.4 | ||||||
|
2014
|
17.2 | 8.2 | ||||||
|
2015 and thereafter
|
11.9 | 16.3 | ||||||
Environmental Contingencies
Xcel Energy and its subsidiaries have been, or are currently, involved with the cleanup of contamination from certain hazardous substances at several sites. In many situations, the subsidiary involved believes it will recover some portion of these costs through insurance claims. Additionally, where applicable, the subsidiary involved is pursuing, or intends to pursue, recovery from other PRPs and through the rate regulatory process. New and changing federal and state environmental mandates can also create added financial liabilities for Xcel Energy and its subsidiaries, which are normally recovered through the rate regulatory process. To the extent any costs are not recovered through the options listed above, Xcel Energy would be required to recognize an expense.
Site Remediation
—
The Comprehensive Environmental Response, Compensation and Liability Act of 1980 and comparable state laws impose liability, without regarding the legality of the original conduct, on certain classes of persons responsible for the release of hazardous substances to the environment. Xcel Energy must pay all or a portion of the cost to remediate sites where past activities of its subsidiaries or other parties have caused environmental contamination. Environmental contingencies could arise from various situations, including sites of former MGPs operated by Xcel Energy subsidiaries, predecessors, or other entities; and third-party sites, such as landfills, for which Xcel Energy is alleged to be a PRP that sent hazardous materials and wastes. At Dec. 31, 2010 and Dec. 31, 2009, the liability for the cost of remediating these sites was estimated to be $104.0 million and $102.1 million, respectively, of which $5.7 million and $6.3 million, respectively, was considered to be a current liability.
MGP Sites
Ashland MGP Site
— NSP-Wisconsin has been named a PRP for creosote and coal tar contamination at a site in Ashland, Wis. The Ashland/Northern States Power Lakefront Superfund Site (Ashland site) includes property owned by NSP-Wisconsin, which was previously an MGP facility and two other properties: an adjacent city lakeshore park area, on which an unaffiliated third party previously operated a sawmill; and an area of Lake Superior’s Chequamegon Bay adjoining the park.
In 2002, the Ashland site was placed on the National Priorities List. In 2009, the EPA issued its proposed remedial action plan (PRAP). The EPA issued its Record of Decision (ROD) in September 2010, which documents the remedy that the EPA has selected for the cleanup of the site. The EPA has estimated the cost for its selected cleanup is between $83 million and $97 million. The EPA’s cost estimate is expected to be within plus 50 percent to minus 30 percent of the actual project costs. It is anticipated that the EPA will issue special notice letters to several PRPs, including NSP-Wisconsin in 2011, and in those letters, the EPA will invite the PRPs to participate in negotiations with the EPA to conduct or pay for all, or a portion, of the future cleanup work at the site.
NSP-Wisconsin’s potential liability, the actual cost of remediating the Ashland site and the time frame over which the amounts may be paid out are not determinable until after the EPA issues special notice letters and engages in negotiations with the PRPs at the site. NSP-Wisconsin also continues to work to identify and access state and federal funds to apply to the ultimate remediation cost of the entire site. NSP-Wisconsin has recorded a liability of $97.5 million based upon potential remediation and design costs together with estimated outside legal and consultant costs.
NSP-Wisconsin has deferred, as a regulatory asset, the costs accrued for the Ashland site based on an expectation that the PSCW will continue to allow NSP-Wisconsin to recover payments for environmental remediation from its customers. The PSCW has consistently authorized recovery in NSP-Wisconsin rates of all remediation costs incurred at the Ashland site and has authorized recovery of similar remediation costs for other Wisconsin utilities. External MGP remediation costs are subject to deferral in the Wisconsin retail jurisdiction and are reviewed for prudence as part of the Wisconsin biennial retail rate case process.
In addition, in 2003, the Wisconsin Supreme Court rendered a ruling that reopens the possibility that NSP-Wisconsin may be able to recover a portion of the remediation costs from its insurance carriers. Any insurance proceeds received by NSP-Wisconsin will be credited to ratepayers.
In addition to potential liability for remediation, NSP-Wisconsin may also have potential liability for natural resource damages at the Ashland site. NSP-Wisconsin has recorded an estimate of its potential liability based upon its best estimate of potential exposure.
Asbestos Removal —
Some of Xcel Energy’s facilities contain asbestos.
Most asbestos will remain undisturbed until the facilities that contain it are demolished or removed. Xcel Energy has recorded an estimate for final removal of the asbestos as an ARO. See additional discussion of AROs below. It may be necessary to remove some asbestos to perform maintenance or make improvements to other equipment. The cost of removing asbestos as part of other work is immaterial and is recorded as incurred as operating expenses for maintenance projects, capital expenditures for construction projects or removal costs for demolition projects.
Other Environmental Requirements
EPA GHG Endangerment Rulemaking
— In December 2009, the EPA issued its “endangerment” finding that GHG emissions endanger public health and welfare and that emissions from motor vehicles contribute to the GHGs in the atmosphere. The EPA has promulgated permit requirements for GHGs for large new and modified stationary sources, such as power plants. These regulations became applicable in 2011. In December 2010, the EPA announced a settlement with several states and environmental groups to begin preparing regulations of emissions from both new and existing steam electric generating units, such as coal-fired power plants, under Section 111 of the CAA. The EPA plans to propose these regulations in July 2011 and finalize them in the first half of 2012.
CAIR
— In 2005, the EPA issued the CAIR to further regulate SO
2
and NOx emissions. The objective of CAIR is to cap emissions of SO
2
and NOx in the eastern United States, including Minnesota, Texas and Wisconsin. In 2008, the U.S. Court of Appeals for the District of Columbia vacated and remanded CAIR.
In July 2010, the EPA issued the proposed CATR, which would replace CAIR by requiring SO
2
and NOx reductions in 31 states and the District of Columbia. The EPA is proposing to reduce these emissions through federal implementation plans for each affected state. The EPA’s preferred approach would set emission limits for each state and allow limited interstate emissions trading. As proposed, CATR will impact Minnesota and Wisconsin for annual SO
2
and NOx emissions, and Texas in the form of ozone season NOx emission allowances. Xcel Energy is analyzing the proposed rule to determine whether emission reductions are needed from facilities in these affected states. Until CATR becomes final, Xcel Energy will continue activities to support CAIR compliance.
CAIR – SPS
Under CAIR’s cap and trade structure, SPS can comply through capital investments in emission controls or purchase of emission allowances from other utilities making reductions on their systems. The remaining scheduled capital investments for NOx controls in the SPS region are estimated at $16.4 million. For 2010, the NOx allowance compliance costs were $0.5 million. Annual purchases of SO
2
allowances are estimated to be up to $4.5 million each year, beginning in 2013, for phase I. If CATR is implemented as proposed then no SO
2
allowances would be purchased since CATR replaces CAIR. Xcel Energy believes the cost of any required capital investment or allowance purchases will be recoverable from customers in rates.
CAIR – NSP-Wisconsin and NSP-Minnesota
The NOx allowance cost in 2010 for NSP-Wisconsin was $0.1 million. Xcel Energy believes the cost of any required capital investment or allowance purchases will be recoverable from customers in rates. In 2009, the EPA published a rule staying the effectiveness of CAIR in Minnesota effective in December 2009. Cost estimates are therefore not included at this time for NSP-Minnesota.
CAMR —
In 2005, the EPA issued the CAMR, which regulated mercury emissions from power plants. In February 2008, the U.S. Court of Appeals for the District of Columbia vacated the CAMR, which impacted federal CAMR requirements, but not necessarily state-only mercury legislation and rules. The EPA has agreed to finalize MACT emission standards for all hazardous air pollutants from electric utility steam generating units by November 2011 to replace the CAMR. Xcel Energy anticipates that the EPA will require affected facilities to demonstrate compliance within three to five years. Costs associated with such requirements are uncertain at this time.
Colorado Mercury Regulation
— Colorado’s mercury regulations require mercury emission controls capable of achieving 80 percent capture to be installed at the Pawnee Generating Station by the end of 2011. The expected cost estimate for the Pawnee Generating Station is $2.3 million for capital costs with an annual estimate of $1.4 million for sorbent expense. PSCo has evaluated the Colorado mercury control requirements for its other units in Colorado and believes that, under the current regulations, no further controls will be required other than the planned controls at the Pawnee Generating Station. The Pawnee mercury controls are included in the CACJA plan.
Minnesota Mercury Legislation
— In 2006, the Minnesota legislature enacted the Mercury Emissions Reduction Act (Act) providing a process for plans, implementation and cost recovery for utility efforts to curb mercury emissions at certain power plants. For NSP-Minnesota, the Act covers units at the A.S. King and Sherco generating facilities. NSP-Minnesota installed and is operating and maintaining continuous mercury emission monitoring systems at these generating facilities.
In November 2008, the MPUC approved the implementation of the Sherco Unit 3 and A.S. King mercury emission reduction plans. A sorbent injection control system was installed at Sherco Unit 3 in December 2009, and installation of a sorbent injection system was completed at A.S. King in December 2010. In 2010, NSP-Minnesota collected the revenue requirements associated with these projects through the MCR rider. In the 2010 Minnesota electric general rate case, NSP-Minnesota proposed moving the costs of these projects into base rates as part of the interim rates effective on Jan. 2, 2011. Concurrent with the implementation of interim rates, the MCR rider will be reduced to zero.
In December 2009, NSP-Minnesota filed its mercury control plan at Sherco Units 1 and 2 with the MPUC and the MPCA. In October 2010, the MPUC approved the plan, which will require installation of mercury controls on Sherco Units 1 and 2 by the end of 2014.
Regional Haze Rules —
In 2005, the EPA finalized amendments to its regional haze rules including provisions that require the installation and operation of emission controls, known as BART, for industrial facilities emitting air pollutants that reduce visibility in certain national parks and wilderness areas throughout the United States. Xcel Energy generating facilities in several states will be subject to BART requirements. Individual states are required to identify the facilities located in their states that will have to reduce SO
2
, NOx and particulate matter emissions under BART and then set BART emissions limits for those facilities.
PSCo
In 2006, the Colorado Air Quality Control Commission promulgated BART regulations requiring certain major stationary sources to evaluate, install, operate and maintain BART to make reasonable progress toward meeting the national visibility goal. The CAPCD has indicated that it expects to submit a Regional Haze BART/Reasonable Further Progress SIP to the EPA for approval in 2011. In January 2011, the Colorado Air Quality Commission approved a revised Regional Haze BART/Regional Further Progress SIP incorporating the Colorado CACJA emission reduction plan. In accordance with Colorado law, the SIP is now before the Colorado general assembly for review prior to submission to the EPA. PSCo anticipates that for those plants included in the Colorado CACJA emission reduction plan, the plan will satisfy regional haze requirements. The Colorado SIP, however, must be approved by the EPA. PSCo expects the cost of any required capital investment will be recoverable from customers. Emissions controls are expected to be installed between 2012 and 2017.
In March 2010, two environmental groups petitioned the U.S. Department of the Interior to certify that 12 coal-fired boilers and one coal-fired cement kiln in Colorado are contributing to visibility problems in Rocky Mountain National Park. Four PSCo plants are named in the petition: Cherokee, Hayden, Pawnee and Valmont. The groups allege that the Colorado BART rule is inadequate to satisfy the CAA mandate of ensuring reasonable further progress towards restoring natural visibility conditions in the park. It is not known when the U.S. Department of the Interior will rule on the petition.
NSP-Minnesota
NSP-Minnesota submitted its BART alternatives analysis to the MPCA for Sherco Units 1 and 2 in 2006. The MPCA reviewed the BART analyses for all units in Minnesota and determined that overall, compliance with CAIR is better than BART. The MPCA completed their BART determination and proposed SO
2
and NOx limits in the draft SIP that are equivalent to the reductions made under CAIR.
In October 2009, the U.S. Department of the Interior certified that a portion of the visibility impairment in Voyageurs and Isle Royale National Parks is reasonably attributable to emissions from NSP-Minnesota’s Sherco Units 1 and 2. The EPA is required to make its own determination as to whether Sherco Units 1 and 2 cause or contribute to visibility impairment and, if so, whether the level of controls proposed by MPCA is appropriate.
The MPCA determined that this certification does not alter the proposed SIP. The SIP proposes BART controls for the Sherco generating facilities that are designed to improve visibility in the national parks, but does not require SCR on Units 1 and 2. The MPCA concluded that the minor visibility benefits derived from SCR do not outweigh the substantial costs. In December 2009, the MPCA Citizens Board approved the SIP, which has been submitted to the EPA for approval. Until the EPA takes final action on the SIP, the total cost of compliance cannot be estimated with a reasonable degree of certainty.
Federal CWA
— The federal CWA requires the EPA to regulate cooling water intake structures to assure that these structures reflect the BTA for minimizing adverse environmental impacts. In 2004, the EPA published phase II of the rule, which applies to existing cooling water intakes at steam-electric power plants. Several lawsuits were filed against the EPA challenging the phase II rulemaking. In April 2009, the U.S. Supreme Court issued a decision concluding that the EPA can consider a cost benefit analysis when establishing BTA. The decision gives the EPA the discretion to consider costs and benefits when it reconsiders its phase II rules. Until the EPA fully responds, the rule’s compliance requirements and associated deadlines will remain unknown. As such, it is not possible to provide an accurate estimate of the overall cost of this rulemaking at this time.
As part of NSP-Minnesota’s 2009 CWA permit renewal for the Black Dog plant, the MPCA required that the plant submit a plan for compliance with the CWA. The compliance plan was submitted for MPCA review and approval in April 2010. The MPCA is currently reviewing the proposal in consultation with the EPA. Xcel Energy anticipates a decision on the plan by the end of 2011.
Proposed Coal Ash Regulation
— Xcel Energy’s operations generate hazardous wastes that are subject to the Federal Resource Recovery and Conservation Act and comparable state laws that impose detailed requirements for handling, storage, treatment and disposal of hazardous waste. In June 2010, the EPA published a proposed rule seeking comment on whether to regulate coal combustion byproducts (often referred to as coal ash) as hazardous or nonhazardous waste. Coal ash is currently exempt from hazardous waste regulation. If the EPA ultimately issues a final rule under which coal ash is regulated as hazardous waste, Xcel Energy’s costs associated with the management and disposal of coal ash would significantly increase, and the beneficial reuse of coal ash would be negatively impacted. Xcel Energy submitted comments to the EPA on Nov. 19, 2010 indicating its support of the development of regulations to manage coal ash as a nonhazardous waste. The timing, scope and potential cost of any final rule that might be implemented are not determinable at this time.
PSCo Notice of Violation (NOV)
— In 2002, PSCo received an NOV from the EPA alleging violations of the New Source Review (NSR) requirements of the CAA at the Comanche Station and Pawnee Station in Colorado. The NOV specifically alleges that various maintenance, repair and replacement projects undertaken at the plants in the mid to late 1990s should have required a permit under the NSR process. PSCo believes it has acted in full compliance with the CAA and NSR process. PSCo also believes that the projects identified in the NOV fit within the routine maintenance, repair and replacement exemption contained within the NSR regulations or are otherwise not subject to the NSR requirements. PSCo disagrees with the assertions contained in the NOV and intends to vigorously defend its position.
Cunningham Compliance Order
— In February 2010, SPS received a draft compliance order from the NMED for Cunningham Station. In the draft order, NMED alleges that Cunningham exceeded its permit limits for NOx and failed to report these exceedances as required by its permit. In September 2010, the NMED issued a final compliance order that contained a penalty of $7.6 million. SPS requested an administrative hearing to contest the order. The administrative hearing has been scheduled for April 2011.
Asset Retirement Obligations
Xcel Energy records future plant removal obligations as a liability at fair value with a corresponding increase to the carrying values of the related long-lived assets in accordance with the applicable accounting guidance. This liability will be increased over time by applying the interest method of accretion to the liability and the capitalized costs will be depreciated over the useful life of the related long-lived assets. The recording of the obligation for regulated operations has no income statement impact due to the deferral of the adjustments through the establishment of a regulatory asset.
Recorded ARO —
AROs have been recorded for plant related to nuclear production, steam production, wind production, electric transmission and distribution, natural gas transmission and distribution and office buildings. The steam production obligation includes asbestos, ash-containment facilities, radiation sources and decommissioning. The asbestos recognition associated with the steam production includes certain plants at NSP-Minnesota, PSCo and SPS. NSP-Minnesota also recorded asbestos recognition for its general office building. Generally, this asbestos abatement removal obligation originated in 1973 with the CAA, which applied to the demolition of buildings or removal of equipment containing asbestos that can become airborne on removal. AROs also have been recorded for NSP-Minnesota, PSCo and SPS steam production related to ash-containment facilities such as bottom ash ponds, evaporation ponds and solid waste landfills. The origination date on the ARO recognition for ash-containment facilities at steam plants was the in-service date of various facilities. Additional AROs have been recorded for NSP-Minnesota and PSCo steam production plant related to radiation sources in equipment used to monitor the flow of coal, lime and other materials through feeders.
Xcel Energy recognized an ARO for the retirement costs of natural gas mains at NSP-Minnesota, NSP-Wisconsin and PSCo. In addition, an ARO was recognized for the removal of electric transmission and distribution equipment at NSP-Minnesota, NSP-Wisconsin, PSCo and SPS. The electric transmission and distribution ARO consists of many small potential obligations associated with PCBs, mineral oil, storage tanks, treated poles, lithium batteries, mercury and street lighting lamps. These electric and natural gas assets have many in-service dates for which it is difficult to assign the obligation to a particular year. Therefore, the obligation was measured using an average service life.
For the nuclear assets, the ARO associated with the decommissioning of two NSP-Minnesota nuclear generating plants, Monticello and Prairie Island, originates with the in-service date of the facility. See Note 15 to the consolidated financial statements for further discussion of nuclear obligations.
A reconciliation of the beginning and ending aggregate carrying amounts of Xcel Energy’s AROs is shown in the table below for the 12 months ended Dec. 31, 2010 and Dec. 31, 2009, respectively:
|
Beginning
|
Revisions
|
Ending
|
||||||||||||||||||||||
|
Balance
|
Liabilities
|
Liabilities
|
to Prior
|
Balance
|
||||||||||||||||||||
|
(Thousands of Dollars)
|
Jan. 1, 2010
|
Recognized
|
Settled
|
Accretion
|
Estimates
|
Dec. 31, 2010
|
||||||||||||||||||
|
Electric plant
|
||||||||||||||||||||||||
|
Steam production asbestos
|
$ | 95,093 | $ | 3,771 | $ | (2,330 | ) | $ | 6,037 | $ | (8,942 | ) | $ | 93,629 | ||||||||||
|
Steam production ash containment
|
17,552 | 32 | — | 903 | 1,201 | 19,688 | ||||||||||||||||||
|
Steam production radiation sources
|
176 | — | — | 12 | (22 | ) | 166 | |||||||||||||||||
|
Nuclear production decommissioning
|
758,923 | — | — | 50,551 | — | 809,474 | ||||||||||||||||||
|
Wind production
|
7,751 | 25,671 | — | 592 | 4,539 | 38,553 | ||||||||||||||||||
|
Electric transmission and distribution
|
27 | — | — | 12 | 5,688 | 5,727 | ||||||||||||||||||
|
Natural gas plant
|
||||||||||||||||||||||||
|
Gas transmission and distribution
|
936 | — | — | 60 | — | 996 | ||||||||||||||||||
|
Common and other property
|
||||||||||||||||||||||||
|
Common general plant asbestos
|
1,021 | — | — | 56 | — | 1,077 | ||||||||||||||||||
|
Total liability
|
$ | 881,479 | $ | 29,474 | $ | (2,330 | ) | $ | 58,223 | $ | 2,464 | $ | 969,310 | |||||||||||
The fair value of NSP-Minnesota assets legally restricted, for purposes of settling the nuclear ARO, is $1.4 billion as of Dec. 31, 2010, including external nuclear decommissioning investment funds and internally funded amounts.
In 2010 and 2009, revisions were made for asbestos, ash-containment facilities, wind turbines, radiation sources and electric transmission and distribution asset retirement obligations due to revised estimates and end of life dates. In 2009, revisions were made for nuclear plants.
|
Beginning
|
Revisions
|
Ending
|
||||||||||||||||||||||
|
Balance
|
Liabilities
|
Liabilities
|
to Prior
|
Balance
|
||||||||||||||||||||
|
(Thousands of Dollars)
|
Jan. 1, 2009
|
Recognized
|
Settled
|
Accretion
|
Estimates
|
Dec. 31, 2009
|
||||||||||||||||||
|
Electric plant
|
||||||||||||||||||||||||
|
Steam production asbestos
|
$ | 93,141 | $ | — | $ | — | $ | 5,987 | $ | (4,035 | ) | $ | 95,093 | |||||||||||
|
Steam production ash containment
|
18,643 | — | — | 1,100 | (2,191 | ) | 17,552 | |||||||||||||||||
|
Steam production radiation sources
|
337 | — | — | 24 | (185 | ) | 176 | |||||||||||||||||
|
Nuclear production decommissioning
|
1,013,342 | — | — | 61,469 | (315,888 | ) | 758,923 | |||||||||||||||||
|
Wind production
|
7,447 | — | — | 483 | (179 | ) | 7,751 | |||||||||||||||||
|
Electric transmission and distribution
|
313 | — | — | 19 | (305 | ) | 27 | |||||||||||||||||
|
Natural gas plant
|
||||||||||||||||||||||||
|
Gas transmission and distribution
|
880 | — | — | 56 | — | 936 | ||||||||||||||||||
|
Common and other property
|
||||||||||||||||||||||||
|
Common general plant asbestos
|
1,079 | — | — | 59 | (117 | ) | 1,021 | |||||||||||||||||
|
Total liability
|
$ | 1,135,182 | $ | — | $ | — | $ | 69,197 | $ | (322,900 | ) | $ | 881,479 | |||||||||||
The revised end of life date for the Prairie Island nuclear plant approved by the MPUC in 2008 and effective Jan. 1, 2009 resulted in the nuclear production decommissioning ARO and related regulatory asset decreasing by $315.9 million in 2009.
Indeterminate AROs —
PSCo has underground natural gas storage facilities that have special closure requirements for which the final removal date cannot be determined; therefore, an ARO has not been recorded.
Removal Costs —
Xcel Energy records a regulatory liability for plant removal costs for other generation, transmission and distribution facilities of its utility subsidiaries. Generally, the accrual of future non-ARO removal obligations is not required. However, long-standing ratemaking practices approved by applicable state and federal regulatory commissions have allowed provisions for such costs in historical depreciation rates. These removal costs have accumulated over a number of years based on varying rates as authorized by the appropriate regulatory entities. Given the long periods over which the amounts were accrued and the changing of rates through time, the utility subsidiaries have estimated the amount of removal costs accumulated through historic depreciation expense based on current factors used in the existing depreciation rates.
The accumulated balances by entity are as follows at Dec. 31:
|
(Millions of Dollars)
|
2010
|
2009
|
||||||
|
NSP-Minnesota
|
$ | 400 | $ | 372 | ||||
|
NSP-Wisconsin
|
107 | 102 | ||||||
|
PSCo
|
385 | 375 | ||||||
|
SPS
|
88 | 93 | ||||||
|
Total Xcel Energy
|
$ | 980 | $ | 942 | ||||
Nuclear Insurance
NSP-Minnesota’s public liability for claims resulting from any nuclear incident is limited to $12.6 billion under the Price-Anderson amendment to the Atomic Energy Act. NSP-Minnesota has secured $375 million of coverage for its public liability exposure with a pool of insurance companies. The remaining $12.2 billion of exposure is funded by the Secondary Financial Protection Program, available from assessments by the federal government in case of a nuclear accident. NSP-Minnesota is subject to assessments of up to $117.5 million per reactor per accident for each of its three licensed reactors, to be applied for public liability arising from a nuclear incident at any licensed nuclear facility in the United States. The maximum funding requirement is $17.5 million per reactor during any one year. These maximum assessment amounts are both subject to inflation adjustment by the NRC and state premium taxes. The NRC’s last adjustment was effective October 2008. The next adjustment is due on or before October 2013.
NSP-Minnesota purchases insurance for property damage and site decontamination cleanup costs from Nuclear Electric Insurance Ltd. (NEIL). The coverage limits are $2.3 billion for each of NSP-Minnesota’s two nuclear plant sites. NEIL also provides business interruption insurance coverage, including the cost of replacement power obtained during certain prolonged accidental outages of nuclear generating units. Premiums are expensed over the policy term. All companies insured with NEIL are subject to retroactive premium adjustments if losses exceed accumulated reserve funds. Capital has been accumulated in the reserve funds of NEIL to the extent that NSP-Minnesota would have no exposure for retroactive premium assessments in case of a single incident under the business interruption and the property damage insurance coverage. However, in each calendar year, NSP-Minnesota could be subject to maximum assessments of approximately $15.8 million for business interruption insurance and $32.6 million for property damage insurance if losses exceed accumulated reserve funds.
Legal Contingencies
Lawsuits and claims arise in the normal course of business. Management, after consultation with legal counsel, has recorded an estimate of the probable cost of settlement or other disposition of them. The ultimate outcome of these matters cannot presently be determined. Accordingly, the ultimate resolution of these matters could have a material adverse effect on Xcel Energy’s financial position and results of operations.
Environmental Litigation
State of Connecticut vs. Xcel Energy Inc. et al. —
In 2004, the attorneys general of eight states and New York City, as well as several environmental groups, filed lawsuits in U.S. District Court in the Southern District of New York against five utilities, including Xcel Energy, to force reductions in CO
2
emissions. The other utilities include American Electric Power Co., Southern Co., Cinergy Corp. (merged into Duke Energy Corporation) and Tennessee Valley Authority. The lawsuits allege that CO
2
emitted by each company is a public nuisance. The lawsuits do not demand monetary damages. Instead, the lawsuits ask the court to order each utility to cap and reduce its CO
2
emissions. In September 2005, the court granted plaintiffs’ motion to dismiss on constitutional grounds. In August 2010, this decision was reversed by the Second Circuit and is currently on appeal before the United States Supreme Court. Oral arguments will be presented to the Supreme Court on April 19, 2011 and a decision is expected in the summer of 2011.
Comer vs. Xcel Energy Inc. et al.
— In 2006, Xcel Energy received notice of a purported class action lawsuit filed in U.S. District Court in the Southern District of Mississippi. The lawsuit names more than 45 oil, chemical and utility companies, including Xcel Energy, as defendants and alleges that defendants’ CO
2
emissions “were a proximate and direct cause of the increase in the destructive capacity of Hurricane Katrina.” Plaintiffs allege negligence and public and private nuisance and seek damages related to the loss resulting from the hurricane. Xcel Energy believes this lawsuit is without merit. In August 2007, the court dismissed the lawsuit in its entirety against all defendants on constitutional grounds. Plaintiffs’ subsequent appeals of this decision were unsuccessful, rendering the District Court’s dismissal the final determination.
Native Village of Kivalina vs. Xcel Energy Inc. et al.
— In 2008, the City and Native Village of Kivalina, Alaska, filed a lawsuit in U.S. District Court for the Northern District of California against Xcel Energy and 23 other utilities, oil, gas and coal companies. Plaintiffs claim that defendants’ emission of CO
2
and other GHGs contribute to global warming, which is harming their village. Xcel Energy believes the claims asserted in this lawsuit are without merit and joined with other utility defendants in filing a motion to dismiss in June 2008. In October 2009, the U.S. District Court dismissed the lawsuit on constitutional grounds. In November 2009, plaintiffs filed a notice of appeal to the U.S. Court of Appeals for the Ninth Circuit. It is unknown when the Ninth Circuit will render a final opinion. The amount of damages claimed by plaintiffs is unknown, but likely includes the cost of relocating the village of Kivalina. Plaintiffs’ alleged relocation is estimated to cost between $95 million to $400 million. No accrual has been recorded for this matter.
Employment, Tort and Commercial Litigation
Qwest vs. Xcel Energy Inc.
— In 2004, an employee of PSCo was seriously injured when a pole owned by Qwest malfunctioned. In September 2005, the employee commenced an action against Qwest in Colorado state court in Denver. In April 2006, Qwest filed a third party complaint against PSCo based on terms in a joint pole use agreement between Qwest and PSCo. In May 2007, the matter was tried and the jury found Qwest solely liable for the accident and this determination resulted in an award of damages in the amount of approximately $90 million. In April 2009, the Colorado Court of Appeals affirmed the jury verdict insofar as it relates to claims asserted by Qwest against PSCo. In February 2010, the Colorado Supreme Court agreed to review the Court of Appeals’ decision as to the punitive damages issue but will not review the Court of Appeals’ decision as it relates to PSCo. Oral arguments were presented in December 2010. It is unknown when the Colorado Supreme Court will render a decision. No accrual has been recorded for this matter.
Cabin Creek Hydro Generating Station Accident
— In October 2007, employees of RPI Coatings Inc. (RPI), a contractor retained by PSCo, were applying an epoxy coating to the inside of a penstock at PSCo’s Cabin Creek Hydro Generating Station (CCH) near Georgetown, Colo. A fire occurred inside a pipe used to deliver water from a reservoir to the hydro facility. Five RPI employees were unable to exit the pipe and rescue crews confirmed their deaths. The accident was investigated by several state and federal agencies, including the federal OSHA, the CSB and the Colorado Bureau of Investigations.
In March 2008, OSHA proposed penalties totaling $189,900 for 22 serious violations and three willful violations arising out of the accident. In April 2008, Xcel Energy notified OSHA of its decision to contest all of the proposed citations. Pursuant to a court order this proceeding has been stayed until July 1, 2011.
Three lawsuits were filed (two in Colorado state court and one in California state court) on behalf of the five deceased workers and by seven employees of RPI allegedly injured in the accident. PSCo and Xcel Energy were among the defendants named in each lawsuit. Settlements were subsequently reached in all three lawsuits by Xcel Energy and PSCo. These confidential settlements did not have a material adverse effect upon Xcel Energy’s consolidated results of operations, cash flows or financial position.
In August 2009, the U.S. Government announced that Xcel Energy and PSCo have been charged with five misdemeanor counts in federal court in Colorado for violation of an OSHA regulation related to the accident at Cabin Creek in October 2007. RPI Coatings, the contractor performing the work at the plant, and two individuals employed by RPI have also been indicted. In September 2009, both Xcel Energy and PSCo entered a not guilty plea, and both will vigorously defend against these charges. The trial date has been set for May 31, 2011. No accrual has been recorded for this proceeding nor is it expected that this proceeding will have a material adverse effect upon Xcel Energy’s consolidated results of operations, cash flows or financial position.
In August 2010, the CSB issued a report related to its investigation of the CCH accident. The report contains several findings and recommendations, some of which pertain to PSCo. Consistent with its delegated authority, the CSB investigation did not result in the issuance of any fines or penalties. PSCo has responded to the CSB concerning its recommendations.
Stone & Webster, Inc. vs. PSCo
— In July 2009, Stone & Webster, Inc. (Shaw) filed a complaint against PSCo in State District Court in Denver, Colo. for damages allegedly arising out of its construction work on the Comanche Unit 3 coal-fired plant. Shaw, a contractor retained to perform certain engineering, procurement and construction work on Comanche Unit 3, alleges, among other things, that PSCo mismanaged the construction of Comanche Unit 3. Shaw further claims that this alleged mismanagement caused delays and damages. The complaint also alleges that Xcel Energy and related entities guaranteed Shaw $10 million in future profits under the terms of a 2003 settlement agreement. Shaw alleges that it will not receive the $10 million to which it is entitled. Accordingly, Shaw seeks an amount up to $10 million relating to the 2003 settlement agreement. In total, Shaw seeks approximately $144 million in damages.
PSCo denies these allegations and believes the claims are without merit. PSCo filed an answer and counterclaim in August 2009, denying the allegations in the complaint and alleging that Shaw has failed to discharge its contractual obligations and has caused delays, and that PSCo is entitled to liquidated damages and excess costs incurred. In total, PSCo is seeking approximately $82 million in damages. In June 2010, PSCo exercised its contractual right to draw on Shaw’s letter of credit in the total amount of approximately $29.6 million. In September 2010, Shaw filed a second lawsuit related to PSCo’s decision to draw on the letter of credit. PSCo denied the merits of this claim.
Trial commenced in October 2010 and addressed only those issues raised in the first complaint and did not include Shaw’s claim asserted in the second lawsuit related to the letter of credit. In November 2010, a jury returned a verdict that awarded damages to Shaw and to PSCo. Specifically the jury awarded a total of $84.5 million to Shaw but also awarded $70.0 million to PSCo for damages related to its counterclaims, for a net verdict to Shaw in the amount of $14.5 million. Shaw subsequently filed post trial motions, which the court denied. It is uncertain whether Shaw will file an appeal. If the jury verdict remains unchanged it is not expected to have a material adverse effect on Xcel Energy’s consolidated results of operations, cash flows or financial position.
Other Contingencies
See Note 13 to the consolidated financial statements for further discussion.
15. Nuclear Obligations
Fuel Disposal —
NSP-Minnesota is responsible for temporarily storing used or spent nuclear fuel from its nuclear plants. The DOE is responsible for permanently storing spent fuel from NSP-Minnesota’s nuclear plants as well as from other U.S. nuclear plants. NSP-Minnesota has funded its portion of the DOE’s permanent disposal program since 1981. The fuel disposal fees are based on a charge of 0.1 cent per KWh sold to customers from nuclear generation. Fuel expense includes the DOE fuel disposal assessments of approximately $13 million in 2010, $12 million in 2009 and $13 million in 2008, respectively. In total, NSP-Minnesota had paid approximately $410.7 million to the DOE through Dec. 31, 2010. The Nuclear Waste Policy Act of 1982 required the DOE to begin accepting spent nuclear fuel no later than Jan. 31, 1998. NSP-Minnesota and other utilities have commenced lawsuits against the DOE to recover damages caused by the DOE’s failure to meet its statutory and contractual obligations.
NSP-Minnesota has its own temporary on-site storage facilities for spent fuel at its Monticello and Prairie Island nuclear plants, which consist of storage pools and dry cask facilities at both sites. The amount of spent fuel storage capacity currently authorized by the NRC and the MPUC will allow NSP-Minnesota to continue operation of its Prairie Island nuclear plant until the end of its renewed licenses terms, when approved by the NRC in 2011, and its Monticello nuclear plant until the end of its renewed operating license in 2030. Other alternatives for spent fuel storage are being investigated until a DOE facility is available, including pursuing the establishment of a private facility for interim storage of spent nuclear fuel as part of a consortium of electric utilities.
Regulatory Plant Decommissioning Recovery —
Decommissioning of NSP-Minnesota’s nuclear facilities is planned for the period from cessation of operations through 2067, assuming the prompt dismantlement method. NSP-Minnesota is currently recording the regulatory costs for decommissioning over the MPUC-approved cost-recovery period and including the accruals in a regulatory liability account. The total decommissioning cost obligation is recorded as an ARO in accordance with the applicable accounting guidance.
Monticello received its initial operating license in 1970 and began commercial operation in 1971. With its renewed operating license and CON for spent fuel capacity to support 20 years of extended operation, Monticello can operate until 2030. The Monticello 20-year depreciation life extension until September 2030 was granted by the MPUC in 2007. Construction of the Monticello dry-cask storage facility is complete, and 10 of the 30 canisters authorized have been filled and placed in the facility.
Prairie Island Units 1 and 2 received their initial operating license and began commercial operations in 1973 and 1974, respectively, and are currently licensed to operate until 2013 and 2014, respectively. In April 2008, NSP-Minnesota filed an application with the NRC to renew the operating license of its two nuclear reactors at Prairie Island that will allow operation for an additional 20 years until 2033 and 2034, respectively. The NRC staff is proceeding with the remaining items necessary to process Prairie Island’s license renewal application and NSP-Minnesota anticipates receiving a final decision on the Prairie Island license renewal in 2011. Prairie Island’s depreciation life, as approved by the MPUC in June 2010, is currently 2024. The Prairie Island dry-cask storage facility currently stores 29 casks to support operations until the end of the current operating licenses in 2013 and 2014. The MPUC approved the use of 35 additional casks to support operations until the end of the renewed operating licenses (once received from the NRC) in 2033 and 2034.
The total obligation for decommissioning currently is expected to be funded 100 percent by the external decommissioning trust fund, as approved by the MPUC, when decommissioning commences. The MPUC last approved NSP-Minnesota’s nuclear decommissioning study request in October 2009, using 2008 cost data. The next study update will be submitted in October 2011 for the 2012 accrual. The MPUC approval eliminated 2009 decommissioning funding for Minnesota retail customers, due to a full extension of the accrual period for the Monticello unit from 2020 to 2030, along with an extension of the accrual period for Prairie Island (from 2013 for Unit 1 and 2014 for Unit 2 to 2023 and 2024 respectively). In November 2009, the MPUC also approved a proposal to refund the Minnesota portion of the Monticello escrow fund in a supplemental filing.
Consistent with cost-recovery in utility customer rates, NSP-Minnesota previously recorded annual decommissioning accruals based on periodic site-specific cost studies and a presumed level of dedicated funding. Cost studies quantify decommissioning costs in current dollars. The most recent study, which resulted in an authorization of no funding, presumes that costs will escalate in the future at a rate of 2.89 percent per year. The total estimated decommissioning costs that will ultimately be paid, net of income earned by the external decommissioning trust fund, is currently being accrued using an annuity approach over the approved plant-recovery period. This annuity approach uses an assumed rate of return on funding, which is currently 6.30 percent, net of tax, for external funding. The net unrealized loss on nuclear decommissioning investments is deferred as a regulatory liability based on the assumed offsetting against decommissioning costs in current ratemaking treatment.
The external funds are held in trust and in escrow. The portion in escrow is subject to refund if approved by the various commissions. The MPUC authorized the return of $23.5 million of funds associated with the Monticello plant for the Minnesota retail jurisdictions. This amount was withdrawn in December 2009 and was refunded on customers’ bills in February 2010. An amount of approximately $5.9 million was also withdrawn from the Monticello plant portion of the escrow fund in March of 2010 in preparation for a refund to Wisconsin and Michigan retail customers. The funds have not yet been refunded as of Dec. 31, 2010, and the timing of the refunds will be determined in future rate cases in each jurisdiction.
At Dec. 31, 2010, NSP-Minnesota recorded and recovered in rates cumulative decommissioning expense of $1.4 billion. The following table summarizes the funded status of NSP-Minnesota’s decommissioning obligation based on approved regulatory recovery parameters from the most recently approved decommissioning study. Xcel Energy believes future decommissioning cost expense, if necessary, will continue to be recovered in customer rates. These amounts are not those recorded in the financial statements for the ARO.
|
(Thousands of Dollars)
|
2010
|
2009
|
||||||
|
Estimated decommissioning cost obligation (2008 dollars)
|
$ | 2,308,196 | $ | 2,308,196 | ||||
|
Effect of escalating costs (to 2010 and 2009 dollars, respectively, at 2.89 percent per year)
|
135,342 | 66,707 | ||||||
|
Estimated decommissioning cost obligation (in current dollars)
|
2,443,538 | 2,374,903 | ||||||
|
Effect of escalating costs to payment date (2.89 percent per year)
|
2,672,825 | 2,741,460 | ||||||
|
Estimated future decommissioning costs (undiscounted)
|
5,116,363 | 5,116,363 | ||||||
|
Effect of discounting obligation (using risk-free interest rate)
|
(3,856,516 | ) | (3,973,493 | ) | ||||
|
Discounted decommissioning cost obligation
|
1,259,847 | 1,142,870 | ||||||
|
Assets held in external decommissioning trust
|
1,350,630 | 1,248,739 | ||||||
|
Excess assets in external trust compared to discounted decommissioning obligation
|
$ | (90,783 | ) | $ | (105,869 | ) | ||
Decommissioning expenses recognized include the following components:
|
(Thousands of Dollars)
|
2010
|
2009
|
2008
|
|||||||||
|
Annual decommissioning cost expense reported as depreciation expense:
|
||||||||||||
|
Externally funded
|
$ | 934 | $ | 2,849 | $ | 43,239 | ||||||
|
Internally funded (including interest costs)
|
(777 | ) | (884 | ) | (819 | ) | ||||||
|
Net decommissioning expense recorded
|
$ | 157 | $ | 1,965 | $ | 42,420 | ||||||
Reductions to expense for internally-funded portions in 2010, 2009 and 2008 are a direct result of the 2008 decommissioning study jurisdictional allocation and 100 percent external funding approval, effectively unwinding the remaining internal fund over the remaining operating life of the unit. The 2008 nuclear decommissioning filing approved in 2009 has been used for the regulatory presentation. The change in estimated decommissioning obligations was calculated using a cost estimate for Monticello assuming a 60-year operating life.
Nuclear Decommissioning Fund —
The NRC requires NSP-Minnesota to maintain a portfolio of investments to fund the costs of decommissioning its nuclear generating plants. Together with all accumulated earnings or losses, the assets of the nuclear decommissioning fund are legally restricted for the purpose of decommissioning the Monticello and Prairie Island nuclear generating plants. The fund contains cash equivalents, debt securities, equity securities, and other funds - all classified as available-for-sale securities under the applicable accounting guidance. NSP-Minnesota plans to reinvest matured securities until decommissioning begins.
NSP-Minnesota recognizes the costs of funding the decommissioning of its nuclear generating plants over the lives of the plants, assuming rate recovery of all costs. Given the purpose and legal restrictions on the use of nuclear decommissioning fund assets, realized and unrealized gains on fund investments over the life of the fund are deferred as an offset of NSP-Minnesota’s regulatory asset for nuclear decommissioning costs. Consequently, any realized and unrealized gains and losses on securities in the nuclear decommissioning fund, including any other-than-temporary impairments, are deferred as a component of the regulatory asset for nuclear decommissioning. Deferred unrealized gains for the decommissioning fund were $82.5 million and $74.4 million at Dec. 31, 2010 and 2009, respectively, and unrealized losses and amounts recorded as other than temporary impairments were $65.2 million and $138.7 million at Dec. 31, 2010 and 2009, respectively.
The following tables present the cost and fair value of the investments in the nuclear decommissioning fund, by asset class on Dec. 31, 2010 and 2009:
|
2010
|
2009
|
|||||||||||||||
|
Fair
|
Fair
|
|||||||||||||||
|
(Thousands of Dollars)
|
Cost
|
Value
|
Cost
|
Value
|
||||||||||||
|
Cash equivalents
|
$ | 83,837 | $ | 83,837 | $ | 28,134 | $ | 28,134 | ||||||||
|
Commingled funds
|
131,000 | 133,080 | — | — | ||||||||||||
|
International equity funds
|
54,561 | 58,584 | — | — | ||||||||||||
|
Equity securities - Common stock
|
436,334 | 435,270 | 662,655 | 581,995 | ||||||||||||
|
Debt securities
|
||||||||||||||||
|
Government securities
|
146,473 | 146,654 | 74,162 | 74,126 | ||||||||||||
|
U.S. corporate bonds
|
279,028 | 288,304 | 299,259 | 312,844 | ||||||||||||
|
Foreign securities
|
1,233 | 1,581 | 9,269 | 9,445 | ||||||||||||
|
Municipal bonds
|
100,277 | 97,557 | 147,689 | 149,088 | ||||||||||||
|
Asset-backed securities
|
32,558 | 33,174 | 11,565 | 11,918 | ||||||||||||
|
Mortgage-backed securities
|
68,072 | 72,589 | 80,276 | 81,189 | ||||||||||||
|
Total nuclear decommissioning fund
|
$ | 1,333,373 | $ | 1,350,630 | $ | 1,313,009 | $ | 1,248,739 | ||||||||
The following table summarizes the final contractual maturity dates of the debt securities in the nuclear decommissioning fund, by asset class for the year ended Dec. 31, 2010:
|
Final Contractual Maturity
|
||||||||||||||||||||
|
(Thousands of Dollars)
|
Due in 1 Year
or Less |
Due in 1 to 5
Years |
Due in 5 to 10
Years |
Due after 10
Years |
Total
|
|||||||||||||||
|
Government securities
|
$ | 301 | $ | 117,041 | $ | 15,270 | $ | 14,042 | $ | 146,654 | ||||||||||
|
U.S. corporate bonds
|
3,071 | 71,615 | 178,067 | 35,551 | 288,304 | |||||||||||||||
|
Foreign securities
|
— | 1,581 | — | — | 1,581 | |||||||||||||||
|
Municipal bonds
|
— | — | 50,729 | 46,828 | 97,557 | |||||||||||||||
|
Asset-backed securities
|
— | 22,232 | 10,942 | — | 33,174 | |||||||||||||||
|
Mortgage-backed securities
|
— | — | 1,249 | 71,340 | 72,589 | |||||||||||||||
|
Debt securities
|
$ | 3,372 | $ | 212,469 | $ | 256,257 | $ | 167,761 | $ | 639,859 | ||||||||||
16. Regulatory Assets and Liabilities
Xcel Energy’s regulated businesses prepare their consolidated financial statements in accordance with the provisions of the applicable accounting guidance, as discussed in Note 1 to the consolidated financial statements. Under this guidance, regulatory assets and liabilities can be created for amounts that regulators may allow to be collected, or may require to be paid back to customers in future electric and natural gas rates. Any portion of Xcel Energy’s business that is not regulated cannot establish regulatory assets and liabilities. If changes in the utility industry or the business of Xcel Energy no longer allow for the application of regulatory accounting guidance under GAAP, Xcel Energy would be required to recognize the write-off of regulatory assets and liabilities in its consolidated statement of income.
The components of regulatory assets and liabilities shown on the consolidated balance sheets at Dec. 31, 2010 and Dec. 31, 2009 are:
|
See
|
Remaining
|
||||||||||||||||||||
|
(Thousands of Dollars)
|
Note(s)
|
Amortization Period
|
Dec. 31, 2010
|
Dec. 31, 2009
|
|||||||||||||||||
|
Regulatory Assets
|
Current
|
Noncurrent
|
Current
|
Noncurrent
|
|||||||||||||||||
|
Recoverable purchased natural gas and electric energy costs
|
1 |
One to two years
|
$ | 27,770 | $ | 9,907 | $ | 56,744 | $ | 10,620 | |||||||||||
|
Pension and employee benefit obligations
(a)
|
9 |
Various
|
115,218 | 1,209,879 | 87,255 | 1,119,300 | |||||||||||||||
|
AFUDC recorded in plant
(b)
|
1 |
Plant lives
|
— | 276,861 | — | 254,630 | |||||||||||||||
|
Contract valuation adjustments
(c)
|
11 |
Term of related contract
|
45,155 | 134,027 | — | 89,026 | |||||||||||||||
|
Net AROs
(d)
|
1,14 |
Plant lives
|
— | 150,913 | — | 206,994 | |||||||||||||||
|
Conservation programs
(b)
|
One to ten years
|
57,679 | 74,236 | 61,836 | 59,842 | ||||||||||||||||
|
Environmental remediation costs
|
13,14 |
Various
|
3,561 | 98,725 | 4,175 | 98,788 | |||||||||||||||
|
Renewable and environmental initiative costs
|
13,14 |
One to six years
|
75,372 | 20,487 | 63,493 | 13,579 | |||||||||||||||
|
Losses on reacquired debt
|
1 |
Term of related debt
|
6,319 | 49,001 | 6,685 | 55,320 | |||||||||||||||
|
Purchased power contracts costs
|
11 |
Term of related contract
|
— | 44,464 | — | 33,203 | |||||||||||||||
|
Nuclear outage costs
|
1,15 |
One to two years
|
33,819 | 7,169 | 57,707 | 3,040 | |||||||||||||||
|
Gas pipeline inspection costs
|
Pending rate case
|
2,000 | 29,358 | 2,542 | 10,234 | ||||||||||||||||
|
Depreciation differences
|
1 |
One to seven years
|
5,859 | 12,379 | — | — | |||||||||||||||
|
State commission adjustments
(b)
|
1 |
Plant lives
|
— | 9,235 | — | 8,401 | |||||||||||||||
|
Other
|
Various
|
15,789 | 24,819 | 16,574 | 24,392 | ||||||||||||||||
|
Total regulatory assets
|
$ | 388,541 | $ | 2,151,460 | $ | 357,011 | $ | 1,987,369 | |||||||||||||
|
Regulatory Liabilities
|
|||||||||||||||||||||
|
Deferred electric, gas, and steam production costs
|
1 | $ | 107,674 | $ | — | $ | 142,828 | $ | — | ||||||||||||
|
Plant removal costs
|
1,14 | — | 979,666 | 5,915 | 936,044 | ||||||||||||||||
|
Investment tax credit deferrals
|
1 | — | 65,856 | — | 65,884 | ||||||||||||||||
|
Deferred income tax adjustment
|
1 | — | 42,863 | — | 46,435 | ||||||||||||||||
|
Gain from asset sales
|
19 |
Pending future rate cases
|
4,281 | 25,492 | — | 10,329 | |||||||||||||||
|
Contract valuation adjustments
(c)
|
11 | 6,684 | 19,743 | 38,521 | 72,892 | ||||||||||||||||
|
REC margin sharing
|
13 |
Pending future rate case
|
— | 26,104 | — | — | |||||||||||||||
|
Renewable environmental initiative
|
13 | 14,752 | — | — | — | ||||||||||||||||
|
Low income discount program
|
7,062 | 4,032 | 5,160 | 2,017 | |||||||||||||||||
|
Nuclear outage costs
|
1 | 3,441 | 3,441 | 3,441 | 6,881 | ||||||||||||||||
|
Other
|
12,144 | 12,568 | 3,289 | 7,532 | |||||||||||||||||
|
Total regulatory liabilities
|
$ | 156,038 | $ | 1,179,765 | $ | 199,154 | $ | 1,148,014 | |||||||||||||
|
(a)
|
Includes $392.4 million and $415.5 million for the regulatory recognition of the NSP-Minnesota pension expense and the PSCo unamortized prior service costs at Dec. 31, 2010 and Dec. 31, 2009, respectively. These amounts are offset by $20.4 million and $18.1 million of regulatory assets related to the non-qualified pension plan of which $2.2 million and $2.1 million is included in the current asset at Dec. 31, 2010 and Dec. 31, 2009, respectively.
|
|
(b)
|
Earns a return on investment in the ratemaking process. These amounts are amortized consistent with recovery in rates.
|
|
(c)
|
Includes the fair value of certain long-term PPAs used to meet energy capacity requirements.
|
|
(d)
|
Includes amounts recorded for future recovery of AROs, less amounts recovered through nuclear decommissioning accruals and gains from decommissioning investments.
|
17. Segments and Related Information
The regulated electric utility operating results of NSP-Minnesota, NSP-Wisconsin, PSCo and SPS, as well as the regulated natural gas utility operating results of NSP-Minnesota, NSP-Wisconsin and PSCo are each separately and regularly reviewed by Xcel Energy’s chief operating decision maker. Xcel Energy evaluates performance by each utility subsidiary based on profit or loss generated from the product or service provided. These segments are managed separately because the revenue streams are dependent upon regulated rate recovery, which is separately determined for each segment.
Given the similarity of the regulated electric and regulated natural gas utility operations of its utility subsidiaries, Xcel Energy has the following reportable segments: regulated electric utility, regulated natural gas utility and all other.
|
|
●
|
Xcel Energy’s regulated electric utility segment generates, transmits, and distributes electricity in Minnesota, Wisconsin, Michigan, North Dakota, South Dakota, Colorado, Texas, and New Mexico. In addition, this segment includes sales for resale and provides wholesale transmission service to various entities in the United States. Regulated electric utility also includes commodity trading operations.
|
|
|
●
|
Xcel Energy’s regulated natural gas utility segment transports, stores and distributes natural gas primarily in portions of Minnesota, Wisconsin, North Dakota, Michigan and Colorado.
|
|
|
●
|
Revenues from operating segments not included above are below the necessary quantitative thresholds and are therefore included in the all other category. Those primarily include steam revenue, appliance repair services, nonutility real estate activities, revenues associated with processing solid waste into refuse-derived fuel and investments in rental housing projects that qualify for low-income housing tax credits.
|
Xcel Energy had equity investments in unconsolidated subsidiaries of $97.6 million and $104.5 million as of Dec. 31, 2010 and 2009, respectively, included in the regulated natural gas segment.
Asset and capital expenditure information is not provided for Xcel Energy’s reportable segments because as an integrated electric and natural gas utility, Xcel Energy operates significant assets that are not dedicated to a specific business segment, and reporting assets and capital expenditures by business segment would require arbitrary and potentially misleading allocations which may not necessarily reflect the assets that would be required for the operation of the business segments on a stand-alone basis.
To report income from continuing operations for regulated electric and regulated natural gas utility segments the majority of costs are directly assigned to each segment. However, some costs, such as common depreciation, common O&M expenses and interest expense are allocated based on cost causation allocators. A general allocator is used for certain general and administrative expenses, including office supplies, rent, property insurance and general advertising.
The accounting policies of the segments are the same as those described in Note 1 to the consolidated financial statements.
|
Regulated
|
Regulated
|
All
|
Reconciling
|
Consolidated
|
||||||||||||||||
|
(Thousands of Dollars)
|
Electric
|
Natural Gas
|
Other
|
Eliminations
|
Total
|
|||||||||||||||
| 2010 | ||||||||||||||||||||
|
Operating revenues from external customers
|
$ | 8,451,845 | $ | 1,782,582 | $ | 76,520 | $ | — | $ | 10,310,947 | ||||||||||
|
Intersegment revenues
|
1,015 | 5,653 | — | (6,668 | ) | — | ||||||||||||||
|
Total revenues
|
$ | 8,452,860 | 1,788,235 | 76,520 | (6,668 | ) | $ | 10,310,947 | ||||||||||||
|
Depreciation and amortization
|
$ | 748,815 | $ | 99,220 | $ | 10,847 | $ | — | $ | 858,882 | ||||||||||
|
Interest charges and financing costs
|
380,074 | 49,314 | 119,233 | — | 548,621 | |||||||||||||||
|
Income tax expense (benefit)
|
434,756 | 59,790 | (57,911 | ) | — | 436,635 | ||||||||||||||
|
Income (loss) from continuing operations
|
665,155 | 114,554 | (27,753 | ) | — | 751,956 | ||||||||||||||
|
2009
|
||||||||||||||||||||
|
Operating revenues from external customers
|
$ | 7,704,723 | $ | 1,865,703 | $ | 73,877 | $ | — | $ | 9,644,303 | ||||||||||
|
Intersegment revenues
|
816 | 2,931 | - | (3,747 | ) | — | ||||||||||||||
|
Total revenues
|
$ | 7,705,539 | $ | 1,868,634 | $ | 73,877 | $ | (3,747 | ) | $ | 9,644,303 | |||||||||
|
Depreciation and amortization
|
$ | 711,090 | $ | 95,633 | $ | 11,329 | $ | — | $ | 818,052 | ||||||||||
|
Interest charges and financing costs
|
371,525 | 44,572 | 105,758 | — | 521,855 | |||||||||||||||
|
Income tax expense (benefit)
|
357,128 | 81,956 | (67,770 | ) | — | 371,314 | ||||||||||||||
|
Income (loss) from continuing operations
|
611,851 | 108,948 | (35,275 | ) | — | 685,524 | ||||||||||||||
|
(Thousands of Dollars)
|
Regulated Electric |
Regulated
Natural Gas
|
All Other | Reconciling Eliminations | Consolidated Total | |||||||||||||||
|
2008
|
||||||||||||||||||||
|
Operating revenues from external customers
|
$ | 8,682,993 | $ | 2,442,988 | $ | 77,175 | $ | — | $ | 11,203,156 | ||||||||||
|
Intersegment revenues
|
973 | 6,793 | — | (7,766 | ) | — | ||||||||||||||
|
Total revenues
|
$ | 8,683,966 | $ | 2,449,781 | $ | 77,175 | $ | (7,766 | ) | $ | 11,203,156 | |||||||||
|
Depreciation and amortization
|
$ | 715,695 | $ | 99,306 | $ | 13,378 | $ | — | $ | 828,379 | ||||||||||
|
Interest charges and financing costs
|
352,083 | 45,819 | 115,979 | — | 513,881 | |||||||||||||||
|
Income tax expense (benefit)
|
345,543 | 73,647 | (80,504 | ) | — | 338,686 | ||||||||||||||
|
Income (loss) from continuing operations
|
552,300 | 129,298 | (35,878 | ) | — | 645,720 | ||||||||||||||
18. Summarized Quarterly Financial Data (Unaudited)
Due to the seasonality of Xcel Energy’s electric and natural gas sales, such interim results are not necessarily an appropriate base from which to project annual results. Summarized quarterly unaudited financial data is as follows:
|
Quarter Ended
|
||||||||||||||||
|
(Amounts in thousands, except per share data)
|
March 31, 2010
|
June 30, 2010
|
Sept. 30, 2010
|
Dec. 31, 2010
|
||||||||||||
|
Operating revenues
|
$ | 2,807,462 | $ | 2,307,764 | $ | 2,628,787 | $ | 2,566,934 | ||||||||
|
Operating income
|
403,665 | 325,304 | 568,630 | 322,370 | ||||||||||||
|
Income from continuing operations
|
167,340 | 135,625 | 312,488 | 136,503 | ||||||||||||
|
Discontinued operations — income (loss)
|
(222 | ) | 4,151 | (182 | ) | 131 | ||||||||||
|
Net income
|
167,118 | 139,776 | 312,306 | 136,634 | ||||||||||||
|
Earnings available to common shareholders
|
166,058 | 138,716 | 311,246 | 135,573 | ||||||||||||
|
Earnings per share total — basic
|
$ | 0.36 | $ | 0.30 | $ | 0.68 | $ | 0.29 | ||||||||
|
Earnings per share total — diluted
|
0.36 | 0.30 | 0.67 | 0.29 | ||||||||||||
|
Quarter Ended
|
||||||||||||||||
|
(Amounts in thousands, except per share data)
|
March 31, 2009
|
June 30, 2009
|
Sept. 30, 2009
|
Dec. 31, 2009
|
||||||||||||
|
Operating revenues
|
$ | 2,695,542 | $ | 2,016,083 | $ | 2,314,562 | $ | 2,618,116 | ||||||||
|
Operating income
|
370,797 | 279,368 | 465,148 | 353,259 | ||||||||||||
|
Income from continuing operations
|
175,818 | 117,064 | 221,793 | 170,849 | ||||||||||||
|
Discontinued operations — income (loss)
|
(1,751 | ) | 43 | (965 | ) | (1,964 | ) | |||||||||
|
Net income
|
174,067 | 117,107 | 220,828 | 168,885 | ||||||||||||
|
Earnings available to common shareholders
|
173,007 | 116,047 | 219,768 | 167,824 | ||||||||||||
|
Earnings per share total — basic
|
$ | 0.38 | $ | 0.25 | $ | 0.48 | $ | 0.37 | ||||||||
|
Earnings per share total — diluted
|
0.38 | 0.25 | 0.48 | 0.37 | ||||||||||||
19. Asset Acquisition and Sale
Acquisition of Generation Assets
— In December 2010, PSCo purchased the Blue Spruce Energy Center and Rocky Mountain Energy Center from Calpine Development Holdings, Inc. and Riverside Energy Center LLC for $739.0 million plus an additional $3.0 million for working capital adjustments. The working capital adjustments consisted of the settlement of PSCo’s most recent purchases of energy and capacity under the terminated purchased power agreements, adjusted for accrued operating liabilities of the acquired plants of $6.5 million.
The Blue Spruce Energy Center is a 310 MW simple cycle natural gas-fired power plant that began commercial operations in 2003. The Rocky Mountain Energy Center is a 652 MW combined-cycle natural gas-fired power plant that began commercial operations in 2004. Both power plants previously provided energy and capacity to PSCo under purchased power agreements, which were set to expire in 2013 and 2014, respectively. The acquisition developed out of PSCo’s resource planning activities, in which customers’ future energy needs are addressed in a formal planning process for meeting PSCo’s generation obligations, considering various assumptions and objectives including prices, reliability, and emissions levels. The generation assets were offered to PSCo as a competitive bid in the resource planning process, and the offer was the least cost option for thermal generation resources.
The purchase price has been allocated based on the estimated fair values of the assets acquired and the liabilities assumed at the date of acquisition, as follows:
|
(Thousands of Dollars)
|
||||
|
Assets acquired
|
||||
|
Inventory
|
$ | 3,834 | ||
|
Property, plant and equipment
|
735,916 | |||
|
Total assets acquired
|
739,750 | |||
|
Liabilities assumed
|
||||
|
Accrued expenses
|
7,255 | |||
|
Total liabilities assumed
|
7,255 | |||
|
Net assets acquired
|
$ | 732,495 | ||
The purchase agreement allows PSCo 90 days to review and approve the working capital adjustment based on an examination of the plants’ books and records. If subsequent to the acquisition date, information is obtained about conditions that existed at the acquisition date that indicate the initial recorded amounts should be adjusted, adjustments may be recorded in 2011 to the assets acquired and liabilities assumed in the acquisition.
Operating results for the plants subsequent to the date of acquisition are included in the Consolidated Statement of Income for the Year Ended Dec. 31, 2010. PSCo incurred approximately $1.2 million of recoverable acquisition-related legal and consulting costs that are deferred as a regulatory asset as of Dec. 31, 2010.
Sale of Lubbock Electric Distribution Assets
—
In November 2009, SPS entered into an asset purchase agreement with the city of Lubbock, Texas. This agreement had set forth that SPS would sell its electric distribution system assets within the city limits to LP&L for approximately $87 million. The sale and related transactions eliminate the inefficiencies of maintaining duplicate distribution systems, one by SPS and the other by the city-owned LP&L.
SPS has provided indemnification to Lubbock for losses arising out of any breach of the representations, warranties and covenants under the related asset purchase agreement and for losses arising out of certain other matters, including pre-closing unknown liabilities. See Note 12 to the consolidated financial statements for further discussion of guarantees.
SPS served about 24,000 customers within Lubbock, representing about 25 percent of the total customers in the dually certified service area. As part of this transaction, SPS will continue to provide wholesale power to meet the electric load for these customers, initially by amending the current wholesale full-requirements contract with WTMPA, which provides service to LP&L through 2019 and then for an additional 25 years under a new contract directly with LP&L when the WTMPA contract terminates. Both of these wholesale power agreements provide for formula rates that change annually based on the actual cost of service. The formula rate with WTMPA reflects an initial 10.5 percent ROE. All or portions of this transaction were reviewed and approved by the PUCT, the NMPRC and the FERC.
Additionally, SPS and the city of Lubbock entered into an amended long-term treated sewage effluent water agreement under which SPS will continue to purchase waste water from the city for cooling SPS’ Jones Station southeast of Lubbock.
In October 2010, the transaction closed resulting in a pre-tax gain of approximately $20 million which will be shared with retail customers in Texas, and has been deferred as a regulatory liability pending the determination of the sharing by the PUCT.
None.
Disclosure Controls and Procedures
Xcel Energy maintains a set of disclosure controls and procedures designed to ensure that information required to be disclosed in reports that it files or submits under the Securities Exchange Act of 1934 is recorded, processed, summarized, and reported within the time periods specified in SEC rules and forms. In addition, the disclosure controls and procedures ensure that information required to be disclosed is accumulated and communicated to management, including the chief executive officer (CEO) and chief financial officer (CFO), allowing timely decisions regarding required disclosure. As of Dec. 31, 2010, based on an evaluation carried out under the supervision and with the participation of Xcel Energy’s management, including the CEO and CFO, of the effectiveness of its disclosure controls and the procedures, the CEO and CFO have concluded that Xcel Energy’s disclosure controls and procedures were effective.
Internal Controls Over Financial Reporting
No change in Xcel Energy’s internal control over financial reporting has occurred during the most recent fiscal quarter that has materially affected, or is reasonably likely to materially affect, Xcel Energy’s internal control over financial reporting. Xcel Energy maintains internal control over financial reporting to provide reasonable assurance regarding the reliability of the financial reporting. Xcel Energy has evaluated and documented its controls in process activities, in general computer activities, and on an entity-wide level. During the year and in preparation for issuing its report for the year ended Dec. 31, 2010 on internal controls under section 404 of the Sarbanes-Oxley Act of 2002, Xcel Energy conducted testing and monitoring of its internal control over financial reporting. Based on the control evaluation, testing and remediation performed, Xcel Energy did not identify any material control weaknesses, as defined under the standards and rules issued by the Public Company Accounting Oversight Board and as approved by the SEC and as indicated in Management Report on Internal Controls herein.
At the Feb. 23, 2011 meeting of the Governance, Compensation and Nominating Committee, the Committee approved a policy whereby individuals newly hired or promoted to vice president and executive officer positions will be eligible to receive a supplemental pro rata grant of long-term incentive awards. This new policy has the effect of ensuring that the recipient has a total level of long-term incentive that is consistent with awards that would be granted to someone holding the position throughout the performance period, adjusted on a pro rata basis to reflect the time during the performance period the person is in the new position. At the February 2011 meeting, the Committee granted an aggregate of 19,099 shares of bonus stock and 23,874 performance-based restricted stock units to our President and Chief Operating Officer and Vice President and Chief Financial Officer under this new policy.
Information required under this Item with respect to directors is set forth in Xcel Energy’s Proxy Statement for its 2011 Annual Meeting of Shareholders, which is incorporated by reference. Information with respect to Executive Officers is included in Item 1 to this report.
Information required under this Item is set forth in Xcel Energy’s Proxy Statement for its 2011 Annual Meeting of Shareholders, which is incorporated by reference.
Information required under this Item is contained in Xcel Energy’s Proxy Statement for its 2011 Annual Meeting of Shareholders, which is incorporated by reference.
Information required under this Item is contained in Xcel Energy’s Proxy Statement for its 2011 Annual Meeting of Shareholders, which is incorporated by reference.
Information required under this Item is contained in Xcel Energy’s Proxy Statement for its 2011 Annual Meeting of Shareholders, which is incorporated by reference.
|
1.
|
Consolidated Financial Statements:
|
|
Management Report on Internal Controls — For the year ended Dec. 31, 2010.
|
|
|
Reports of Independent Registered Public Accounting Firm — For the years ended Dec. 31, 2010, 2009 and 2008.
|
|
|
Consolidated Statements of Income — For the three years ended Dec. 31, 2010, 2009 and 2008.
|
|
|
Consolidated Statements of Cash Flows — For the three years ended Dec. 31, 2010, 2009 and 2008.
|
|
|
Consolidated Balance Sheets — As of Dec. 31, 2010 and 2009.
|
|
|
2.
|
Schedule I — Condensed Financial Information of Registrant.
|
|
Schedule II — Valuation and Qualifying Accounts and Reserves for the years ended Dec. 31, 2010, 2009 and 2008.
|
|
|
3.
|
Exhibits
|
| * | Indicates incorporation by reference |
| + | Executive Compensation Arrangements and Benefit Plans Covering Executive Officers and Directors |
| t | Certain portions of this agreement have been omitted pursuant to a request for confidential treatment and have been filed separately with the SEC. |
|
^
|
Furnished, herewith, not filed. Pursuant to Rule 406T of Regulation S-T, the Interactive Data Files on Exhibit 101 hereto are deemed not filed or part of a registration statement or prospectus for purposes of Sections 11 or 12 of the Securities Act of 1933, as amended, are deemed not filed for purposes of Section 18 of the Securities and Exchange Act of 1934, as amended, and otherwise are not subject to liability under those sections.
|
|
Xcel Energy
|
|
|
2.01*
t
|
Purchase and Sale Agreement by and between Riverside Energy Center, LLC and Calpine Development Holdings, Inc., as Sellers, and PSCo, as Purchaser, dated as of April 2, 2010 (excluding certain schedules and exhibits referred to in the agreement, as amended, which the Registrant agrees to furnish supplemental to the SEC upon request) (Exhibit 2.01 to Form 10-Q for the quarter ended June 30, 2010 (file no. 001-03034)).
|
|
3.01*
|
Restated Articles of Incorporation of Xcel Energy, as amended on May 21, 2008 (Exhibit 3.01 to Form 10-Q for the quarter ended June 30, 2008 (file no. 001-03034)).
|
|
3.02*
|
Restated By-Laws of Xcel Energy (Exhibit 3.01 to Form 8-K dated Aug. 12, 2008 (file no. 001-03034)).
|
Xcel Energy
|
4.01*
|
Trust Indenture dated Dec. 1, 2000, between Xcel Energy and Wells Fargo Bank, Minnesota, National Association (NA), as Trustee. (Exhibit 4.01 to Form 8-K (file no. 001-03034) dated Dec. 18, 2000).
|
|
4.02*
|
Indenture dated Nov. 21, 2002 between Xcel Energy and Wells Fargo Bank, Minnesota, NA, 7.5 percent convertible senior notes due 2007 (Exhibit 4.137 to Form 10-K (file no. 001-03034) dated March 31, 2003).
|
|
4.03*
|
Supplemental Trust Indenture No. 2 dated June 15, 2003 between Xcel Energy and Wells Fargo Bank, Minnesota, NA, supplementing trust indenture dated Dec. 1, 2000 (Exhibit 4.01 to Form 10-Q (file no. 001-03034) dated Aug. 15, 2003).
|
|
4.04*+
|
Form of Stock Option Agreement Dated Aug. 5, 2005 (Exhibit 4.04 to Form S-8 (file no. 333-127217) dated Aug. 5, 2005).
|
|
4.05*+
|
Form of Restricted Stock Agreement Dated Aug. 5, 2005 (Exhibit 4.08 to Form S-8 (file no. 333-127217) dated Aug. 5, 2005).
|
|
4.06*
|
Supplemental Trust Indenture dated June 1, 2006 between Xcel Energy and Wells Fargo Bank, Minnesota, NA, as Trustee, creating $300,000,000 principal amount of 6.5 percent Senior Notes, Series due 2036 (Exhibit 4.01 to Current Report on Form 8-K (file no. 001-03034) dated June 6, 2006).
|
|
4.07*
|
Registration Rights Agreement dated March 30, 2007 between Xcel Energy and Merrill Lynch, Pierce, Fenner & Smith Incorporated, Greenwich Capital Markets, Inc. and Lazard Capital Markets LLC (Exhibit 10.1 to Form 8-K (file no. 001-03034) dated March 30, 2007).
|
|
4.08*
|
Supplemental Indenture dated March 30, 2007 between Xcel Energy and Wells Fargo Bank, Minnesota, NA, as Trustee, creating $253,979,000 aggregate principal amount of 5.613 percent Senior Notes, Series due 2017 (Exhibit 4.1 to Form 8-K (file no. 001-03034) dated March 30, 2007).
|
|
4.09*
|
Junior Subordinated Indenture, dated as of Jan. 1, 2008, by and between Xcel Energy and Wells Fargo Bank, Minnesota, NA, as Trustee (Exhibit 4.01 to Form 8-K (file no. 001-03034) dated Jan. 16, 2008).
|
|
4.10*
|
Supplemental Indenture No. 1, dated Jan. 16, 2008, by and between Xcel Energy and Wells Fargo Bank, Minnesota, NA, as Trustee (Exhibit 4.02 to Form 8-K (file no. 001-03034) dated Jan. 16, 2008).
|
|
4.11*
|
Replacement Capital Covenant, dated Jan. 16, 2008 (Exhibit 4.03 to Form 8-K (file no. 001-03034) dated Jan. 16, 2008).
|
|
4.12*
|
Supplemental Indenture No. 5 dated as of May 1, 2010 between Xcel Energy and Wells Fargo Bank, NA, as Trustee, creating $550,000,000 principal amount of 4.70 percent Senior Notes, Series due May 15, 2020 (Exhibit 4.01 to Form 8-K (file no. 001-03034) dated May 13, 2010).
|
|
NSP-Minnesota
|
|
|
4.13*
|
Supplemental and Restated Trust Indenture, dated May 1, 1988, from NSP-Minnesota to Harris Trust and Savings Bank, as Trustee, providing for the issuance of First Mortgage Bonds (Exhibit 4.02 to Form 10-K of NSP-Minnesota for the year 1988, file no. 001-03034). Supplemental Indentures between NSP-Minnesota and said Trustee, dated as follows:
|
|
Supplemental Indenture dated June 1, 1995, creating $250,000,000 principal amount of 7.125 percent First Mortgage Bonds, Series due July 1, 2025 (Exhibit 4.01 to Form 8-K (file no. 001-03034) dated June 28, 1995, Rider A).
|
|
|
Supplemental Indenture dated April 1, 1997, creating $100,000,000 principal amount of 8.5 percent First Mortgage Bonds, Series due Sept. 1, 2019 and $27,900,000 principal amount of 8.5 percent First Mortgage Bonds, Series due March 1, 2019 (Exhibit 4.47 to Form 10-K (file no. 001-03034) dated Dec. 31, 1997.)
|
|
|
Supplemental Indenture dated March 1, 1998, creating $150,000,000 principal amount of 6.5 percent First Mortgage Bonds, Series due March 1, 2028 (Exhibit 4.01 to Form 8-K (file no. 001-03034) dated March 11, 1998, Rider A).
|
|
|
4.14*
|
Supplemental Indenture Aug. 1, 2000 (Assignment and Assumption of Trust Indenture) (Exhibit 4.51 to NSP-Minnesota Form 10-12G (file no. 000-31709) dated Oct. 5, 2000).
|
|
4.15*
|
Indenture, dated July 1, 1999, between NSP-Minnesota and Norwest Bank Minnesota, NA, as Trustee, providing for the issuance of Sr. Debt Securities. (Exhibit 4.01 to NSP-Minnesota Form 8-K (file no. 001-03034) dated July 21, 1999).
|
|
4.16*
|
Supplemental Indenture, dated Aug. 18, 2000, supplemental to the Indenture dated July 1, 1999, among Xcel Energy, NSP-Minnesota and Wells Fargo Bank Minnesota, NA, as Trustee (Assignment and Assumption of Indenture). (Exhibit 4.63 to NSP-Minnesota Form 10-12G (file no. 000-31709) dated Oct. 5, 2000).
|
|
4.17*
|
Supplemental Indenture dated July 1, 2002 between NSP-Minnesota and BNY Midwest Trust Company, as successor Trustee, creating $69,000,000 principal amount of 8.5 percent First Mortgage Bonds, Series due April 1, 2030 (Exhibit 4.06 to NSP-Minnesota Current Report on Form 10-Q, (file no. 000-31387) dated Sept. 30, 2002).
|
|
4.18*
|
Supplemental Trust Indenture dated Aug. 1, 2002 between NSP-Minnesota and BNY Midwest Trust Company, as successor Trustee, creating $450,000,000 principal amount of 8.0 percent First Mortgage Bonds, Series due Aug. 28, 2012 (Exhibit 4.01 to NSP-Minnesota Current Report on Form 8-K, (file no. 000-31387) dated Aug. 22, 2002).
|
|
4.19*
|
Supplemental Indenture dated July 1, 2005 between NSP-Minnesota and BNY Midwest Trust Company, as successor Trustee, creating $250,000,000 principal amount of 5.25 percent First Mortgage Bonds, Series due July 15, 2035 (Exhibit 4.01 to NSP-Minnesota Current Report on Form 8-K, (file no. 000-31387) dated July 14, 2005).
|
|
4.20*
|
Supplemental Indenture dated May 1, 2006 between NSP-Minnesota and BNY Midwest Trust Company, as successor Trustee, creating $400,000,000 principal amount of 6.25 percent First Mortgage Bonds, Series due June 1, 2036 (Exhibit 4.01 to NSP-Minnesota Current Report on Form 8-K, (file no. 000-31387) dated May 18, 2006).
|
|
4.21*
|
Supplemental Indenture, dated June 1, 2007, between NSP-Minnesota and BNY Midwest Trust Company, as successor Trustee (Exhibit 4.01 to NSP-Minnesota Form 8-K (file no. 001-31387) dated June 19, 2007).
|
|
4.22*
|
Supplemental Indenture dated March 1, 2008 between NSP-Minnesota and BNY Midwest Trust Company, as successor Trustee (Exhibit 4.01 to Form 8-K (file no. 001-31387) dated March 11, 2008).
|
|
4.23*
|
Supplemental Indenture dated as of Nov. 1, 2009 between NSP-Minnesota and The Bank of New York Mellon Trust Co., NA, as successor Trustee, creating $300,000,000 principal amount of 5.35 percent First Mortgage Bonds, Series due Sept. 1, 2039 (Exhibit 4.01 of Form 8-K of NSP-Minnesota dated Nov. 16, 2009 (file no. 001-31387)).
|
|
4.24*
|
Supplemental Indenture dated as of Aug. 1, 2010 between NSP-Minnesota and The Bank of New York Mellon Trust Company, NA, as successor Trustee, creating $250,000,000 principal amount of 1.950 percent First Mortgage Bonds, Series due Aug. 15, 2015 and $250,000,000 principal amount of 4.850 percent First Mortgage Bonds, Series due Aug. 15, 2040 (Exhibit 4.01 to Form 8-K dated Aug. 11, 2010 (file no. 001-31387)).
|
|
NSP-Wisconsin
|
|
|
4.25*
|
Supplemental and Restated Trust Indenture, dated March 1, 1991, between NSP-Wisconsin and First Wisconsin Trust company, providing for the issuance of First Mortgage Bonds (Exhibit 4.01 to Registration Statement 33-39831).
|
|
4.26*
|
Supplemental Trust Indenture, dated April 1, 1991 (Exhibit 4.01 to Form 10-Q (file no. 001-03140) for the quarter ended March 31, 1991).
|
|
4.27*
|
Supplemental Trust Indenture, dated Dec. 1, 1996. (Exhibit 4.01 to Form 8-K (file no. 001-03140) dated Dec. 12, 1996).
|
|
4.28*
|
Trust Indenture dated Sept. 1, 2000, between NSP-Wisconsin and Firstar Bank, NA as Trustee. (Exhibit 4.01 to Form 8-K (file no. 001-03140) dated Sept. 25, 2000).
|
|
4.29*
|
Supplemental Trust Indenture dated Sept. 1, 2003 between NSP-Wisconsin and US Bank NA, supplementing indentures dated April 1, 1947 and March 1, 1991 (Exhibit 4.05 to Xcel Energy Form 10-Q (file no. 001-03034) dated Nov. 13, 2003).
|
|
4.30*
|
Supplemental Trust Indenture dated as of Sept. 1, 2008 between NSP-Wisconsin and U.S. Bank NA, as successor Trustee, creating $200,000,000 principal amount of 6.375 percent First Mortgage Bonds, Series due Sept. 1, 2038 (Exhibit 4.01 of Form 8-K of NSP-Wisconsin dated Sept. 3, 2008 (file no. 001-03140)).
|
|
PSCo
|
|
|
4.31*
|
Indenture, dated as of Oct. 1, 1993, between PSCo and Morgan Guaranty Trust Company of New York, as trustee,
providing for the issuance of First Collateral Trust Bonds (Form 10-Q, Sept. 30, 1993 — Exhibit 4(a)).
|
|
4.32*
|
Indentures supplemental to Indenture dated as of Oct. 1, 1993, between PSCo and Morgan Guaranty Trust Company of New York, as trustee,:
|
|
Dated as of
|
Previous Filing: Form; Date or file no.
|
Exhibit
No.
|
Dated as of
|
Previous Filing: Form; Date or file no.
|
Exhibit
No.
|
|||||
|
Nov. 1, 1993
|
S-3, (33-51167)
|
4(b)(2)
|
Aug. 15, 2002
|
10-Q, Sept. 30, 2002 (001-03280)
|
4.03
|
|||||
|
Jan. 1, 1994
|
10-K, 1993
|
4(b)(3)
|
Sept. 1, 2002
|
8-K, Sept. 18, 2002 (001-03280)
|
4.01
|
|||||
|
Sept. 2, 1994
|
8-K, September 1994
|
4(b)
|
Sept. 15, 2002
|
10-Q, Sept. 30, 2002 (001-03280)
|
4.04
|
|||||
|
May 1, 1996
|
10-Q, June 30, 1996
|
4(b)
|
March 1, 2003
|
S-3, April 14, 2003 (333-104504)
|
4(b)(3)
|
|||||
|
Nov. 1, 1996
|
10-K, 1996 (001-03280)
|
4(b)(3)
|
April 1, 2003
|
10-Q May 15, 2003 (001-03280)
|
4.02
|
|||||
|
Feb. 1, 1997
|
10-Q, March 31, 1997 (001-03280)
|
4(a)
|
May 1, 2003
|
S-4, June 11, 2003 (333-106011)
|
4.9
|
|||||
|
April 1, 1998
|
10-Q, March 31,1998 (001-03280)
|
4(b)
|
Sept. 1, 2003
|
8-K, Sept. 2, 2003 (001-03280)
|
4.02
|
|||||
|
Sept. 15, 2003
|
Xcel 10-K, March 15, 2004 (001-03034)
|
4.100
|
||||||||
|
Aug. 1, 2005
|
PSCo 8-K, Aug. 18, 2005 (001-03280)
|
4.02
|
||||||||
|
Aug. 1, 2007
|
PSCo 8-K, Aug. 14, 2007 (001-03280)
|
4.01
|
||||||||
|
Nov. 1, 2010
|
PSCo 8-K, Nov. 8, 2010 (001-03280)
|
4.01
|
|
4.33*
|
Indenture dated July 1, 1999, between PSCo and The Bank of New York, providing for the issuance of Senior Debt Securities and Supplemental Indenture dated July 15, 1999, between PSCo and The Bank of New York (Exhibits 4.1 and 4.2 to Form 8-K (file no. 001-03280) dated July 13, 1999).
|
|
4.34*
|
Financing Agreement between Adams County, Colorado and PSCo, dated as of Aug. 1, 2005 relating to $129,500,000 Adams County, Colorado Pollution Control Refunding Revenue Bonds, 2005 Series A. (Exhibit 4.01 to PSCo Current Report on Form 8-K, dated Aug. 18, 2005, file number 001-3280).
|
|
4.35*
|
Supplemental Indenture, dated Aug. 1, 2007, between PSCo and U.S. Bank Trust NA, as successor Trustee (Exhibit 4.01 to PSCo Form 8-K (file no 001-03280) dated Aug. 14, 2007).
|
|
4.36*
|
Supplemental Indenture dated as of Aug. 1, 2008, between PSCo and U.S. Bank Trust NA, as successor Trustee, creating $300,000,000 principal amount of 5.80 percent First Mortgage Bonds, Series No. 18 due 2018 and $300,000,000 principal amount of 6.50 percent First Mortgage Bonds, Series No. 19 due 2038 (Exhibit 4.01 of Form 8-K of PSCo dated Aug. 6, 2008 (file no. 001-03280)).
|
|
4.37*
|
Supplemental Indenture dated as of May 1, 2009 between PSCo and U.S. Bank Trust NA, as successor Trustee, creating $400,000,000 principal amount of 5.125 percent First Mortgage Bonds, Series No. 20 due 2019 (Exhibit 4.01 of Form 8-K of PSCo dated May 28, 2009 (file no. 001-03280)).
|
|
4.38*
|
Supplemental Indenture dated as of Nov. 1, 2010 between PSCo and U.S. Bank Trust NA, as successor Trustee, creating $400,000,000 principal amount of 3.200 percent First Mortgage Bonds, Series No. 21 due 2020 (Exhibit 4.01 of Form 8-K of PSCo dated Nov. 16, 2010 (file no. 001-03280)).
|
|
SPS
|
|
|
4.39*
|
Indenture dated Feb. 1, 1999 between SPS and The Chase Manhattan Bank (Exhibit 99.2 to Form 8-K (file no. 001-03789) dated Feb. 25, 1999).
|
|
4.40*
|
First Supplemental Indenture dated March 1, 1999 between SPS and The Chase Manhattan Bank (Exhibit 99.3 to Form 8-K (file no. 001-03789) dated Feb. 25, 1999).
|
|
4.41*
|
Second Supplemental Indenture dated Oct. 1, 2001 between SPS and The Chase Manhattan Bank (Exhibit 4.01 to Form 8-K (file no. 001-03789) dated Oct. 23, 2001).
|
|
4.42*
|
Third Supplemental Indenture dated Oct. 1, 2003 to the indenture dated Feb. 1, 1999 between SPS and JPMorgan Chase Bank, as successor Trustee, creating $100 million principal amount of Series C and Series D Notes, 6 percent due 2033 (Exhibit 4.04 to Xcel Energy Form 10-Q (file no. 001-03034) dated Nov. 13, 2003).
|
|
4.43*
|
Fourth Supplemental Indenture dated Oct. 1, 2006 between SPS and The Bank of New York, as successor Trustee (Exhibit 4.01 to Form 8-K (file no. 001-03789) dated Oct. 3, 2006).
|
|
4.44*
|
Red River Authority for Texas Indenture of Trust dated July 1, 1991 (Form 10-K, Aug. 31, 1991 — Exhibit 4(b)).
|
|
4.45*
|
Supplemental Trust Indenture dated as of Nov. 1, 2008 between SPS and The Bank of New York Mellon Trust Company, NA, as successor Trustee, creating $250,000,000 principal amount of Series G Senior Notes, 8.75 percent due 2018 (Exhibit 4.01 of Form 8-K of SPS, dated Nov. 14, 2008 (file no. 001-
03789)).
|
|
Xcel Energy
|
|
|
10.01*+
|
Xcel Energy Omnibus Incentive Plan (Exhibit A to Form DEF-14A (file no. 001-03034) filed Aug. 29, 2000).
|
|
10.02*+
|
Xcel Energy Non-Qualified Pension Plan (2009 Restatement) (Exhibit 10.02 to Form 10-K of Xcel Energy (file no. 001-03034) for the year ended Dec. 31, 2008).
|
|
10.03*+
|
Amended and Restated Executive Long-Term Incentive Award Stock Plan (Exhibit 10.02 to Form 10-Q of Xcel Energy (file no. 001-03034) for the quarter ended March 31, 1998).
|
|
10.04*+
|
NCE Omnibus Incentive Plan (Exhibit A to NCE, Inc. Form DEF 14A (file no. 001-12927) filed March 26, 1998.
|
|
10.05*+
|
Xcel Energy Senior Executive Severance Policy (2009 Amendment and Restatement) (Exhibit 10.05 to Form 10-K of Xcel Energy (file no. 001-03034) for the year ended Dec. 31, 2008).
|
|
10.06*+
|
Stock Equivalent Plan for Non-Employee Directors of Xcel Energy as amended and restated Jan. 1, 2009 (Exhibit 10.06 to Form 10-K of Xcel Energy (file no. 001-03034) for the year ended Dec. 31, 2008).
|
|
10.07*+
|
Xcel Energy Nonqualified Deferred Compensation Plan (2009 Restatement) (Exhibit 10.07 to Form 10-K of Xcel Energy (file no. 001-03034) for the year ended Dec. 31, 2008).
|
|
10.08*+
|
Xcel Energy Non-employee Directors’ Deferred Compensation Plan as amended and restated Jan. 1, 2009 (Exhibit 10.08 to Form 10-K of Xcel Energy (file no. 001-03034) for the year ended Dec. 31, 2008).
|
|
10.09*
|
Form of Services Agreement between Xcel Energy Services Inc. and utility companies (Exhibit H-1 to Form U5B (file no. 001-03034) dated Nov. 16, 2000).
|
|
10.10*+
|
Xcel Energy Omnibus Incentive Plan Form of Restricted Stock Unit Agreement (Exhibit 10.05 to Xcel Energy Form 10-Q (file no. 001-03034) dated June 30, 2005).
|
|
10.11*+
|
Xcel Energy Omnibus Incentive Plan Form of Performance Share Agreement (Exhibit 10.04 to Xcel Energy Form 10-Q (file no. 001-03034) dated June 30, 2005).
|
|
10.12*+
|
Xcel Energy Omnibus Incentive Plan Form of Restricted Stock Unit Agreement (Exhibit 10.07 to Xcel Energy Form 10-Q (file no. 001-03034) dated June 30, 2005).
|
|
10.13*+
|
Xcel Energy Omnibus 2005 Incentive Plan (Appendix B to Schedule 14A, Definitive Proxy Statement to Xcel Energy (file no. 001-03034) dated April 11, 2005).
|
|
10.14*+
|
Xcel Energy Executive Annual Incentive Award Plan (Appendix C to Schedule 14A, Definitive Proxy Statement to Xcel Energy (file no. 001-03034) dated April 11, 2005)
|
|
10.15*+
|
Xcel Energy Supplemental Executive Retirement Plan as amended and restated Jan. 1, 2009 (Exhibit 10.17 to Form 10-K of Xcel Energy (file no. 001-03034) for the year ended Dec. 31, 2008).
|
|
10.16*+
|
Amendment dated as of April 13, 2009 to the Xcel Energy Credit Agreement dated as of Dec. 14, 2006 (Exhibit 10.01 to Form 10-Q of Xcel Energy (file no. 001-03034) for the quarter ended June 30, 2009).
|
|
10.17*
|
Credit Agreement dated Dec. 14, 2006 between Xcel Energy and various lenders (Exhibit 10.01 to Form 10-Q of Xcel Energy (file no. 001-03034) for the quarter ended Sept. 30, 2009).
|
|
10.18*+
|
Amendment dated Aug. 26, 2009 to the Xcel Energy Senior Executive Severance and Change-in-Control Policy (Exhibit 10.06 to Form 10-Q of Xcel Energy (file no. 001-03034) for the quarter ended Sept. 30, 2009).
|
|
10.19*+
|
Xcel Energy Inc. Executive Annual Incentive Award Plan Form of Restricted Stock Agreement (Exhibit 10.08 to Form 10-Q of Xcel Energy (file no. 001-03034) for the quarter ended Sept. 30, 2009).
|
|
10.20*+
|
Xcel Energy 2010 Executive Annual Discretionary Award Plan (Exhibit 10.24 to Form 10-K of Xcel Energy (file no. 001-03034) for the year ended Dec. 31, 2009).
|
|
10.21*+
|
Xcel Energy Executive Annual Incentive Award Plan (as amended and restated effective Feb. 17, 2010) (incorporated by reference to Appendix A to Schedule 14A, Definitive Proxy Statement to Xcel Energy Inc. (file no. 001-03034) dated April 6, 2010).
|
|
10.22*+
|
Xcel Energy 2005 Long-Term Incentive Plan (as amended and restated effective Feb. 17, 2010) (incorporated by reference to Appendix B to Schedule 14A, Definitive Proxy Statement to Xcel Energy Inc. (file no. 001-03034) dated April 6, 2010).
|
|
Xcel Energy 2010 Executive Annual Discretionary Award Plan (as amended and restated effective Dec. 15, 2010).
|
|
|
Xcel Energy 2005 Long-Term Incentive Plan Form of Bonus Stock Agreement.
|
|
|
Xcel Energy 2005 Long-Term Incentive Plan Form of Performance Share Agreement.
|
|
|
Xcel Energy 2005 Long-Term Incentive Plan Form of Restricted Stock Unit Agreement.
|
|
NSP-Minnesota
|
|
|
10.27*
|
Ownership and Operating Agreement, dated March 11, 1982, between NSP-Minnesota, Southern Minnesota Municipal Power Agency and United Minnesota Municipal Power Agency concerning Sherburne County Generating Unit No. 3 (Exhibit 10.01 to Form 10-Q for the quarter ended Sept. 30, 1994, file no. 001-03034).
|
|
10.28*
|
Restated Interchange Agreement dated Jan. 16, 2001 between NSP-Wisconsin and NSP-Minnesota (Exhibit 10.01 to NSP-Wisconsin Form S-4 (file no. 333-112033) dated Jan. 21, 2004).
|
|
10.29*
|
Amendment dated as of April 13, 2009 to the NSP-Minnesota Credit Agreement dated as of Dec. 14, 2006 (Exhibit 10.02 to Form 10-Q of Xcel Energy (file no. 001-03034) for the quarter ended June. 30, 2009).
|
|
10.30*
|
Credit Agreement dated Dec. 14, 2006 between NSP-Minnesota and various lenders (Exhibit 10.02 to Form 10-Q of Xcel Energy (file no. 001-03034) for the quarter ended Sept. 30, 2009).
|
|
NSP-Wisconsin
|
|
|
10.31*
|
Restated Interchange Agreement dated Jan. 16, 2001 between NSP- Wisconsin and NSP-Minnesota (Exhibit 10.01 to Form S-4 (file no. 333-112033) dated Jan. 21, 2004).
|
|
PSCo
|
|
|
10.32*
|
Amended and Restated Coal Supply Agreement entered into Oct. 1, 1984 but made effective as of Jan. 1, 1976 between PSCo and Amax Inc. on behalf of its division, Amax Coal Co. (Form 10-K (file no. 001-03280) Dec. 31, 1984 — Exhibit 10I (1)).
|
|
10.33*
|
First Amendment to Amended and Restated Coal Supply Agreement entered into May 27, 1988 but made effective Jan. 1, 1988 between PSCo and Amax Coal Co. (Form 10-K (file no. 001-03280) Dec. 31, 1988 — Exhibit 10I (2)).
|
|
10.34*
|
Proposed Settlement Agreement excerpts, as filed with the CPUC (Exhibit 99.02 to Form 8-K (file no. 001-03034) dated Dec. 3, 2004).
|
|
10.35*
|
Settlement Agreement among PSCo and Concerned Environmental and Community Parties, dated Dec. 3, 2004 (Exhibit 99.03 to Form 8-K (file no. 001-03034) dated Dec. 3, 2004).
|
|
10.36*
|
Amendment dated as of April 13, 2009 to the PSCo Credit Agreement dated as of Dec. 14, 2006 (Exhibit 10.03 to Form 10-Q of Xcel Energy (file no. 001-03034) for the quarter ended June. 30, 2009).
|
|
10.37*
|
Credit Agreement dated Dec. 14, 2006 between PSCo and various lenders (Exhibit 10.03 to Form 10-Q of Xcel Energy (file no. 001-03034) for the quarter ended Sept. 30, 2009).
|
|
SPS
|
|
|
10.38*
|
Coal Supply Agreement (Harrington Station) between SPS and TUCO, dated May 1, 1979 (Form 8-K (file no. 001-03789), May 14, 1979 — Exhibit 3).
|
|
10.39*
|
Master Coal Service Agreement between Swindell-Dressler Energy Supply Co. and TUCO, dated July 1, 1978 (Form 8-K, (file no. 001-03789) May 14, 1979 — Exhibit 5(A)).
|
|
10.40*
|
Guaranty of Master Coal Service Agreement between Swindell-Dressler Energy Supply Co. and TUCO (Form 8-K, (file no. 3789) May 14, 1979 — Exhibit 5(B)).
|
|
10.41*
|
Coal Supply Agreement (Tolk Station) between SPS and TUCO dated April 30, 1979, as amended Nov. 1, 1979 and Dec. 30, 1981 (Form 10-Q, (file no. 3789) Feb. 28, 1982 — Exhibit 10(b)).
|
|
10.42*
|
Master Coal Service Agreement between Wheelabrator Coal Services Co. and TUCO dated Dec. 30, 1981, as amended Nov. 1, 1979 and Dec. 30, 1981 (Form 10-Q, (file no. 3789) Feb. 28, 1982 — Exhibit 10I).
|
|
10.43*
|
Power Purchase Agreement dated May 23, 1997 between Borger Energy Associates, L.P, and SPS.
|
|
10.44*
|
Amendment dated as of April 13, 2009 to the SPS Credit Agreement dated as of Dec. 14, 2006 (Exhibit 10.04 to Form 10-Q of Xcel Energy (file no. 001-03034) for the quarter ended June. 30, 2009).
|
|
10.45*
|
Credit Agreement dated Dec. 14, 2006 between SPS and various lenders (Exhibit 10.04 to Form 10-Q of Xcel Energy (file no. 001-03034) for the quarter ended Sept. 30, 2009).
|
|
Xcel Energy
|
|
|
Statement of Computation of Ratio of Earnings to Fixed Charges.
|
|
|
Subsidiaries of Xcel Energy Inc.
|
|
|
Consent of Independent Registered Public Accounting Firm.
|
|
|
Written Consent Resolution of the Board of Directors of Xcel Energy Inc., adopting Power of Attorney
|
|
|
Principal Executive Officer’s certification pursuant to 18 U.S. C. Section 1350, as adopted pursuant to Section 302 of the Sarbanes-Oxley Act of 2002.
|
|
|
Principal Financial Officer’s certification pursuant to 18 U.S. C. Section 1350, as adopted pursuant to Section 302 of the Sarbanes-Oxley Act of 2002.
|
|
|
Certification pursuant to 18 U.S.C. Section 1350, as adopted pursuant to Section 906 of the Sarbanes-Oxley Act of 2002.
|
|
|
Statement pursuant to Private Securities Litigation Reform Act of 1995.
|
|
|
101^
|
The following materials from Xcel Energy’s Annual Report on Form 10-K for the year ended Dec. 31, 2010 are formatted in XBRL (eXtensible Business Reporting Language): (i) the Consolidated Statements of Income, (ii) the Consolidated Statements of Cash Flows, (iii) the Consolidated Balance Sheets, (iv) the Consolidated Statements of Common Stockholders’ Equity and Comprehensive Income, (v) Consolidated Statements of Capitalization, (vi) Notes to Consolidated Financial Statements, and (vii) document and entity information.
|
SCHEDULE I
XCEL ENERGY INC.
CONDENSED STATEMENTS OF INCOME
(amounts in thousands, except per share data)
|
Year Ended Dec. 31
|
||||||||||||
|
2010
|
2009
|
2008
|
||||||||||
|
Income
|
||||||||||||
|
Equity earnings of subsidiaries
|
$ | 818,212 | $ | 743,798 | $ | 708,943 | ||||||
|
Total income
|
818,212 | 743,798 | 708,943 | |||||||||
|
Expenses and other deductions
|
||||||||||||
|
Operating expenses
|
11,849 | 9,116 | 10,481 | |||||||||
|
Other income
|
(681 | ) | (1,295 | ) | (6,327 | ) | ||||||
|
Interest charges and financing costs
|
112,510 | 101,118 | 114,341 | |||||||||
|
Total expenses and other deductions
|
123,678 | 108,939 | 118,495 | |||||||||
|
Income from continuing operations before income taxes
|
694,534 | 634,859 | 590,448 | |||||||||
|
Income tax benefit
|
(57,422 | ) | (50,665 | ) | (55,272 | ) | ||||||
|
Income from continuing operations
|
751,956 | 685,524 | 645,720 | |||||||||
|
Income (loss) from discontinued operations, net of tax
|
3,878 | (4,637 | ) | (166 | ) | |||||||
|
Net income
|
755,834 | 680,887 | 645,554 | |||||||||
|
Dividend requirements on preferred stock
|
4,241 | 4,241 | 4,241 | |||||||||
|
Earnings available to common shareholders
|
$ | 751,593 | $ | 676,646 | $ | 641,313 | ||||||
|
Weighted average common shares outstanding:
|
||||||||||||
|
Basic
|
462,052 | 456,433 | 437,054 | |||||||||
|
Diluted
|
463,391 | 457,139 | 441,813 | |||||||||
|
Earnings per average common share — basic:
|
||||||||||||
|
Income from continuing operations
|
$ | 1.62 | $ | 1.49 | $ | 1.47 | ||||||
|
Income (loss) from discontinued operations
|
0.01 | (0.01 | ) | — | ||||||||
|
Earnings per share
|
$ | 1.63 | $ | 1.48 | $ | 1.47 | ||||||
|
Earnings per average common share — diluted:
|
||||||||||||
|
Income from continuing operations
|
$ | 1.61 | $ | 1.49 | $ | 1.46 | ||||||
|
Income (loss) from discontinued operations
|
0.01 | (0.01 | ) | — | ||||||||
|
Earnings per share
|
$ | 1.62 | $ | 1.48 | $ | 1.46 | ||||||
|
Cash dividends declared per common share
|
$ | 1.00 | $ | 0.97 | $ | 0.94 | ||||||
XCEL ENERGY INC.
CONDENSED STATEMENTS OF CASH FLOWS
(amounts in thousands of dollars)
|
Year Ended Dec. 31
|
||||||||||||
|
2010
|
2009
|
2008
|
||||||||||
|
Operating activities
|
||||||||||||
|
Net cash provided by operating activities
|
$ | 537,840 | $ | 627,013 | $ | 455,387 | ||||||
|
Investing activities
|
||||||||||||
|
Return of capital from subsidiaries
|
— | — | 64,353 | |||||||||
|
Capital contributions to subsidiaries
|
(523,369 | ) | (297,004 | ) | (630,427 | ) | ||||||
|
Net cash used in investing activities
|
(523,369 | ) | (297,004 | ) | (566,074 | ) | ||||||
|
Financing activities
|
||||||||||||
|
Proceeds from (repayment of) short-term borrowings, net
|
(216,000 | ) | 13,750 | 125,000 | ||||||||
|
Proceeds from issuance of long-term debt
|
543,923 | — | 386,518 | |||||||||
|
Repayment of long-term debt
|
(358,636 | ) | — | (322,803 | ) | |||||||
|
Proceeds from issuance of common stock
|
457,258 | 20,133 | 352,871 | |||||||||
|
Dividends paid
|
(432,110 | ) | (414,922 | ) | (382,282 | ) | ||||||
|
Net cash used in (provided by) financing activities
|
(5,565 | ) | (381,039 | ) | 159,304 | |||||||
|
Net increase (decrease) in cash and cash equivalents
|
8,906 | (51,030 | ) | 48,617 | ||||||||
|
Cash and cash equivalents at beginning of period
|
748 | 51,778 | 3,161 | |||||||||
|
Cash and cash equivalents at end of period
|
$ | 9,654 | $ | 748 | $ | 51,778 | ||||||
XCEL ENERGY INC.
CONDENSED BALANCE SHEETS
(amounts in thousands of dollars)
|
Dec. 31
|
||||||||
|
2010
|
2009
|
|||||||
|
Assets
|
||||||||
|
Cash and cash equivalents
|
$ | 9,654 | $ | 748 | ||||
|
Accounts receivable from subsidiaries
|
266,323 | 264,789 | ||||||
|
Other current assets
|
35,276 | 30,165 | ||||||
|
Total current assets
|
311,253 | 295,702 | ||||||
|
Investment in subsidiaries
|
9,559,780 | 8,876,145 | ||||||
|
Other assets
|
134,157 | 64,813 | ||||||
|
Total other assets
|
9,693,937 | 8,940,958 | ||||||
|
Total assets
|
$ | 10,005,190 | $ | 9,236,660 | ||||
|
Liabilities and Equity
|
||||||||
|
Current portion of long-term debt
|
$ | — | $ | 358,636 | ||||
|
Dividends payable
|
122,847 | 113,147 | ||||||
|
Short-term debt
|
148,000 | 364,000 | ||||||
|
Other current liabilities
|
24,453 | 43,503 | ||||||
|
Total current liabilities
|
295,300 | 879,286 | ||||||
|
Other liabilities
|
29,192 | 26,885 | ||||||
|
Total other liabilities
|
29,192 | 26,885 | ||||||
|
Commitments and contingent liabilities
|
||||||||
|
Capitalization
|
||||||||
|
Long-term debt
|
1,492,199 | 942,264 | ||||||
|
Preferred stockholders
’
equity
|
104,980 | 104,980 | ||||||
|
Common stockholders’ equity
|
8,083,519 | 7,283,245 | ||||||
|
Total capitalization
|
9,680,698 | 8,330,489 | ||||||
|
Total liabilities and equity
|
$ | 10,005,190 | $ | 9,236,660 | ||||
NOTES TO CONDENSED FINANCIAL STATEMENTS
Incorporated by reference are Xcel Energy Inc. and Subsidiaries consolidated statements of common stockholders’ equity and OCI in Part II, Item 8.
Basis of Presentation
— The condensed financial information of the Holding Company of Xcel Energy is presented to comply with Rule 12-04 of Regulation S-X. Xcel Energy’s investments in subsidiaries are presented under the equity method of accounting. Under this method, the assets and liabilities of subsidiaries are not consolidated. The investments in net assets of the subsidiaries are recorded in the balance sheets. The income from operations of the subsidiaries is reported on a net basis as equity in income of subsidiaries.
Related Party Transactions
— The Holding Company presents its related party receivables net of payables. Accounts receivable and payable with affiliates at Dec. 31 were:
|
2010
|
2009
|
|||||||||||||||
|
Accounts
|
Accounts
|
Accounts
|
Accounts
|
|||||||||||||
|
(Thousands of Dollars)
|
Receivable
|
Payable
|
Receivable
|
Payable
|
||||||||||||
|
NSP-Minnesota
|
$ | 81,447 | $ | — | $ | 78,722 | $ | — | ||||||||
|
NSP-Wisconsin
|
12,510 | — | 9,122 | (20,448 | ) | |||||||||||
|
PSCo
|
66,828 | (11,532 | ) | 65,822 | (17,576 | ) | ||||||||||
|
SPS
|
24,769 | — | 17,240 | (2,560 | ) | |||||||||||
|
Xcel Energy Services Inc.
|
35,311 | (997 | ) | 49,642 | (1,146 | ) | ||||||||||
|
Xcel Energy Ventures Inc.
|
41,692 | — | 43,153 | — | ||||||||||||
|
Other subsidiaries of Xcel Energy
|
20,076 | (3,784 | ) | 42,674 | (241 | ) | ||||||||||
| $ | 282,633 | $ | (16,313 | ) | $ | 306,375 | $ | (41,971 | ) | |||||||
Dividends
— Cash dividends paid to Xcel Energy by subsidiaries were $663 million, $647 million, and $630 million in the three years ended Dec. 31, 2010, 2009, and 2008, respectively.
See Xcel Energy Inc. and Subsidiaries notes to the consolidated financial statements in Part II, Item 8 for other disclosures.
SCHEDULE II
XCEL ENERGY INC. AND SUBSIDIARIES
VALUATION AND QUALIFYING ACCOUNTS
YEARS ENDED DEC. 31, 2010, 2009 AND 2008
(amounts in thousands of dollars)
|
Additions
|
||||||||||||||||||||
|
Balance at
Jan. 1 |
Charged to
costs and expenses |
Charged to
other accounts (a) |
Deductions
from reserves (b) |
Balance at
Dec. 31 |
||||||||||||||||
|
Reserve deducted from related assets:
|
||||||||||||||||||||
|
Allowance for bad debts:
|
||||||||||||||||||||
|
2010
|
$ | 56,103 | $ | 44,068 | $ | 15,202 | $ | 60,810 | $ | 54,563 | ||||||||||
|
2009
|
64,239 | 49,023 | 21,869 | 79,028 | 56,103 | |||||||||||||||
|
2008
|
49,401 | 63,407 | 16,468 | 65,037 | 64,239 | |||||||||||||||
(a)
Recovery of amounts previously written off.
(b)
Principally bad debts written off or transferred.
Pursuant to the requirements of Section 13 or 15(d) of the Securities Exchange Act of 1934, the registrant has duly caused this annual report to be signed on its behalf by the undersigned, thereunto duly authorized.
|
XCEL ENERGY INC.
|
||
|
Feb. 28, 2011
|
By:
|
/s/ DAVID M. SPARBY
|
|
David M. Sparby
Vice President and Chief Financial Officer
(Principal Financial Officer)
|
Pursuant to the requirements of the Securities Exchange Act of 1934, this report has been signed below by the following persons on behalf of the registrant and in the capacities on Feb. 28, 2011.
|
/s/ RICHARD C. KELLY
|
Chairman, Chief Executive Officer and Director
|
|
|
RICHARD C. KELLY
|
(Principal Executive Officer)
|
|
|
/s/ TERESA S. MADDEN
|
Vice President and Controller
|
|
|
TERESA S. MADDEN
|
(Principal Accounting Officer)
|
|
|
/s/ DAVID M. SPARBY
|
Vice President and Chief Financial Officer
|
|
|
DAVID M. SPARBY
|
(Principal Financial Officer)
|
|
|
/s/ BENJAMIN G.S. FOWKE III
|
President, Chief Operating Officer and Director
|
|
|
BENJAMIN G.S. FOWKE III
|
||
|
*
|
Director
|
|
|
FREDRIC W. CORRIGAN
|
||
|
*
|
Director
|
|
|
RICHARD K. DAVIS
|
||
|
*
|
Director
|
|
|
ALBERT F. MORENO
|
||
|
*
|
Director
|
|
|
CHRISTOPHER J. POLICINSKI
|
||
|
*
|
Director
|
|
|
A. PATRICIA SAMPSON
|
||
|
*
|
Director
|
|
|
DAVID A. WESTERLUND
|
||
|
*
|
Director
|
|
|
TIMOTHY V. WOLF
|
||
|
*
|
|
Director
|
|
KIM WILLIAMS
|
||
|
*
|
/s/ DAVID M. SPARBY
|
Attorney-in-Fact
|
|
DAVID M. SPARBY
|
163
TABLE OF CONTENTS
Part IItem 1 BusinessItem 1A Risk FactorsItem 1B Unresolved Staff CommentsItem 2 PropertiesItem 3 Legal ProceedingsItem 4 ReservedPart IIItem 5 Market For Registrant S Common Equity, Related Stockholder Matters and Issuer Purchases Of Equity SecuritiesItem 6 Selected Financial DataItem 7 Management S Discussion and Analysis Of Financial Condition and Results Of OperationsItem 7A Quantitative and Qualitative Disclosures About Market RiskItem 8 Financial Statements and Supplementary DataItem 9 Changes in and Disagreements with Accountants on Accounting and Financial DisclosureItem 9A Controls and ProceduresItem 9B Other InformationPart IIIItem 10 Directors, Executive Officers and Corporate GovernanceItem 11 Executive CompensationItem 12 Security Ownership Of Certain Beneficial Owners and Management and Related Stockholder MattersItem 13 Certain Relationships and Related Transactions, and Director IndependenceItem 14 Principal Accountant Fees and ServicesPart IVItem 15 Exhibits, Financial Statement Schedules