XCEL ENERGY INC
10-Ks and 10-Qs
|
|
|
|
|
|
|
|
|
|
|
|
|
|
|
|
|
|
|
|
|
|
|
|
|
|
|
|
|
|
|
|
|
|
|
|
|
|
|
|
|
|
|
|
|
|
|
|
|
|
|
|
|
|
|
|
|
|
|
UNITED STATES
SECURITIES AND EXCHANGE COMMISSION
Washington, D.C. 20549
FORM 10-K
(Mark One)
|
x
|
ANNUAL REPORT PURSUANT TO SECTION 13 OR 15(d) OF THE SECURITIES EXCHANGE ACT OF 1934
|
For the fiscal year ended
December 31, 2017
or
|
¨
|
TRANSITION REPORT PURSUANT TO SECTION 13 OR 15(d) OF THE SECURITIES EXCHANGE ACT OF 1934
|
Commission File Number: 001-3034
Xcel Energy Inc.
(Exact name of registrant as specified in its charter)
|
Minnesota
|
|
41-0448030
|
|
(State or other jurisdiction of incorporation or organization)
|
|
(I.R.S. Employer Identification No.)
|
|
414 Nicollet Mall
|
||
|
Minneapolis, MN 55401
|
||
|
(Address of principal executive offices)
|
||
|
Registrant’s telephone number, including area code:
612-330-5500
|
||
Securities registered pursuant to Section 12(b) of the Act:
|
Title of each class
|
|
Name of each exchange on which registered
|
|
Common Stock, $2.50 par value per share
|
|
Nasdaq Stock Market LLC
|
|
Securities registered pursuant to section 12(g) of the Act:
None
|
|
|
Indicate by check mark if the registrant is a well-known seasoned issuer, as defined in Rule 405 of the Securities Act.
x
Yes
¨
No
Indicate by check mark if the registrant is not required to file reports pursuant to Section 13 or Section 15(d) of the Act.
¨
Yes
x
No
Indicate by check mark whether the registrant (1) has filed all reports required to be filed by Section 13 or 15(d) of the Securities Exchange Act of 1934 during the preceding 12 months (or for such shorter period that the registrant was required to file such reports), and (2) has been subject to such filing requirements for the past 90 days.
x
Yes
¨
No
Indicate by check mark whether the registrant has submitted electronically and posted on its corporate Website, if any, every Interactive Data File required to be submitted and posted pursuant to Rule 405 and Regulation S-T (§232.405 of this chapter) during the preceding 12 months (or for such shorter period that the registrant was required to submit and post such files).
x
Yes
¨
No
Indicate by check mark if disclosure of delinquent filers pursuant to Item 405 of Regulations S-K (§229.405 of this chapter) is not contained herein, and will not be contained, to the best of the registrant’s knowledge, in definitive proxy or information statements incorporated by reference in Part III of this Form 10-K or any amendment to this Form 10-K.
¨
Indicate by check mark whether the registrant is a large accelerated filer, an accelerated filer, a non-accelerated filer, a smaller reporting company, or an emerging growth company. See the definitions of “large accelerated filer,” “accelerated filer,” “smaller reporting company,” and “emerging growth company” in Rule 12b-2 of the Exchange Act.
x
Large accelerated filer
¨
Accelerated filer
¨
Non-accelerated filer (Do not check if a smaller reporting company)
¨
Smaller Reporting Company
¨
Emerging growth company
If an emerging growth company, indicate by check mark if the registrant has elected not to use the extended transition period for complying with any new or revised financial accounting standards provided pursuant to Section 13(a) of the Exchange Act.
¨
Indicate by check mark whether the registrant is a shell company (as defined in Rule 12b-2 of the Act).
¨
Yes
x
No
As of June 30, 2017, the aggregate market value of the voting common stock held by non-affiliates of the Registrants was
$23,304,874,235
and there were
507,952,795
shares of common stock outstanding.
As of
Feb. 19, 2018
, there were
508,064,983
shares of common stock outstanding, $2.50 par value.
DOCUMENTS INCORPORATED BY REFERENCE
The Registrant’s Definitive Proxy Statement for its 2018 Annual Meeting of Shareholders is incorporated by reference into Part III of this Form 10-K.
TABLE OF CONTENTS
Index
|
PART I
|
||
|
Item 1 —
|
||
|
Item 1A —
|
||
|
Item 1B —
|
||
|
Item 2 —
|
||
|
Item 3 —
|
||
|
Item 4 —
|
||
|
PART II
|
||
|
Item 5 —
|
||
|
Item 6 —
|
||
|
Item 7 —
|
||
|
Item 7A —
|
||
|
Item 8 —
|
||
|
Item 9 —
|
||
|
Item 9A —
|
||
|
Item 9B —
|
||
|
PART III
|
||
|
Item 10 —
|
||
|
Item 11 —
|
||
|
Item 12 —
|
||
|
Item 13 —
|
||
|
Item 14 —
|
||
|
PART IV
|
||
|
Item 15 —
|
||
|
Item 16 —
|
||
2
DEFINITION OF ABBREVIATIONS AND INDUSTRY TERMS
|
Xcel Energy Inc.’s Subsidiaries and Affiliates (current and former)
|
|
|
Capital Services
|
Capital Services, LLC
|
|
Eloigne
|
Eloigne Company
|
|
NCE
|
New Century Energies, Inc.
|
|
NSP-Minnesota
|
Northern States Power Company, a Minnesota corporation
|
|
NSP System
|
The electric production and transmission system of NSP-Minnesota and NSP-Wisconsin operated on an integrated basis and managed by NSP-Minnesota
|
|
NSP-Wisconsin
|
Northern States Power Company, a Wisconsin corporation
|
|
Operating companies
|
NSP-Minnesota, NSP-Wisconsin, PSCo and SPS
|
|
PSCo
|
Public Service Company of Colorado
|
|
SPS
|
Southwestern Public Service Co.
|
|
Utility subsidiaries
|
NSP-Minnesota, NSP-Wisconsin, PSCo and SPS
|
|
WGI
|
WestGas InterState, Inc.
|
|
WYCO
|
WYCO Development, LLC
|
|
Xcel Energy
|
Xcel Energy Inc. and its subsidiaries
|
|
XETD
|
Xcel Energy Transmission Development Company, LLC
|
|
XEST
|
Xcel Energy Southwest Transmission Company, LLC
|
|
XEWT
|
Xcel Energy West Transmission Company, LLC
|
|
Federal and State Regulatory Agencies
|
|
|
CFTC
|
Commodity Futures Trading Commission
|
|
CPUC
|
Colorado Public Utilities Commission
|
|
D.C. Circuit
|
United States Court of Appeals for the District of Columbia Circuit
|
|
DOC
|
Minnesota Department of Commerce
|
|
DOE
|
United States Department of Energy
|
|
DOT
|
United States Department of Transportation
|
|
EPA
|
United States Environmental Protection Agency
|
|
FERC
|
Federal Energy Regulatory Commission
|
|
Fifth Circuit
|
United States Court of Appeals for the Fifth Circuit
|
|
IRS
|
Internal Revenue Service
|
|
MPSC
|
Michigan Public Service Commission
|
|
MPUC
|
Minnesota Public Utilities Commission
|
|
NDPSC
|
North Dakota Public Service Commission
|
|
NERC
|
North American Electric Reliability Corporation
|
|
NMPRC
|
New Mexico Public Regulation Commission
|
|
NRC
|
Nuclear Regulatory Commission
|
|
PHMSA
|
Pipeline and Hazardous Materials Safety Administration
|
|
PSCW
|
Public Service Commission of Wisconsin
|
|
PUCT
|
Public Utility Commission of Texas
|
|
SDPUC
|
South Dakota Public Utilities Commission
|
|
SEC
|
Securities and Exchange Commission
|
3
|
Electric, Purchased Gas and Resource Adjustment Clauses
|
|
|
CIP
|
Conservation improvement program
|
|
DCRF
|
Distribution cost recovery factor
|
|
DSM
|
Demand side management
|
|
DSMCA
|
Demand side management cost adjustment
|
|
ECA
|
Retail electric commodity adjustment
|
|
EE
|
Energy efficiency
|
|
EECRF
|
Energy efficiency cost recovery factor
|
|
EIR
|
Environmental improvement rider (recovers the costs associated with investments in
environmental improvements to fossil fuel generation plants)
|
|
FCA
|
Fuel clause adjustment
|
|
FPPCAC
|
Fuel and purchased power cost adjustment clause
|
|
GCA
|
Gas cost adjustment
|
|
GUIC
|
Gas utility infrastructure cost rider
|
|
PCCA
|
Purchased capacity cost adjustment
|
|
PCRF
|
Power cost recovery factor (recovers the costs of certain purchased power costs)
|
|
PGA
|
Purchased gas adjustment
|
|
RDF
|
Renewable development fund
|
|
RER
|
Renewable energy rider
|
|
RES
|
Renewable energy standard
|
|
RESA
|
Renewable energy standard adjustment (recovers the costs of new renewable generation)
|
|
PSIA
|
Pipeline system integrity adjustment
|
|
SCA
|
Steam cost adjustment
|
|
SEP
|
State energy policy rider
|
|
TCA
|
Transmission cost adjustment
|
|
TCR
|
Transmission cost recovery adjustment
|
|
TCRF
|
Transmission cost recovery factor (recovers transmission infrastructure improvement costs
and changes in wholesale transmission charges)
|
|
WCA
|
Windsource
®
cost adjustment
|
|
Other Terms and Abbreviations
|
|
|
AFUDC
|
Allowance for funds used during construction
|
|
ALJ
|
Administrative law judge
|
|
APBO
|
Accumulated postretirement benefit obligation
|
|
ARO
|
Asset retirement obligation
|
|
ASC
|
FASB Accounting Standards Codification
|
|
ASU
|
FASB Accounting Standards Update
|
|
BART
|
Best available retrofit technology
|
|
C&I
|
Commercial and Industrial
|
|
CAA
|
Clean Air Act
|
|
CACJA
|
Clean Air Clean Jobs Act
|
|
CAIR
|
Clean Air Interstate Rule
|
|
CAISO
|
California Independent System Operator
|
|
CapX2020
|
Alliance of electric cooperatives, municipals and investor-owned utilities in the upper
Midwest involved in a joint transmission line planning and construction effort
|
|
CCN
|
Certificate of convenience and necessity
|
|
CIG
|
Colorado Interstate Gas Company, LLC
|
|
CO
2
|
Carbon dioxide
|
|
CON
|
Certificate of need
|
4
|
CPCN
|
Certificate of public convenience and necessity
|
|
CPP
|
Clean Power Plan
|
|
CSAPR
|
Cross-State Air Pollution Rule
|
|
CWA
|
Clean Water Act
|
|
CWIP
|
Construction work in progress
|
|
EEI
|
Edison Electric Institute
|
|
EGU
|
Electric generating unit
|
|
EPS
|
Earnings per share
|
|
EPU
|
Extended power uprate
|
|
ERCOT
|
Electric Reliability Council of Texas
|
|
ETR
|
Effective tax rate
|
|
FASB
|
Financial Accounting Standards Board
|
|
FTR
|
Financial transmission right
|
|
FTY
|
Forecast test year
|
|
GAAP
|
Generally accepted accounting principles
|
|
GHG
|
Greenhouse gas
|
|
Golden Spread
|
Golden Spread Electric Cooperative, Inc.
|
|
HTY
|
Historic test year
|
|
IM
|
Integrated market
|
|
IPP
|
Independent power producing entities
|
|
IRC
|
Internal Revenue Code
|
|
IRP
|
Integrated Resource Plan
|
|
ISFSI
|
Independent Spent Fuel Storage Installation
|
|
ITC
|
Investment Tax Credit
|
|
LCM
|
Life cycle management
|
|
LLW
|
Low-level radioactive waste
|
|
LNG
|
Liquefied natural gas
|
|
MGP
|
Manufactured gas plant
|
|
MISO
|
Midcontinent Independent System Operator, Inc.
|
|
Moody’s
|
Moody’s Investor Services
|
|
MWTG
|
Mountain West Transmission Group
|
|
NAAQS
|
National Ambient Air Quality Standard
|
|
Native load
|
Customer demand of retail and wholesale customers that a utility has an obligation to serve
under statute or long-term contract
|
|
NAV
|
Net asset value
|
|
NOL
|
Net operating loss
|
|
NO
X
|
Nitrogen oxide
|
|
NTC
|
Notifications to construct
|
|
O&M
|
Operating and maintenance
|
|
OATT
|
Open Access Transmission Tariff
|
|
OCC
|
Office of Consumer Counsel
|
|
OCI
|
Other comprehensive income
|
|
PI
|
Prairie Island nuclear generating plant
|
|
PJM
|
PJM Interconnection, LLC
|
|
PM
|
Particulate matter
|
|
PPA
|
Purchased power agreement
|
|
PRP
|
Potentially responsible party
|
|
PTC
|
Production tax credit
|
|
PV
|
Photovoltaic
|
|
QF
|
Qualifying facilities
|
|
R&E
|
Research and experimentation
|
|
REC
|
Renewable energy credit
|
5
|
RFP
|
Request for proposal
|
|
ROE
|
Return on equity
|
|
RPS
|
Renewable portfolio standards
|
|
RTO
|
Regional Transmission Organization
|
|
SIP
|
State implementation plan
|
|
SO
2
|
Sulfur dioxide
|
|
SPP
|
Southwest Power Pool, Inc.
|
|
S&P
|
Standard & Poor’s Ratings Services
|
|
TCJA
|
2017 federal tax reform enacted as Public Law No: 115-97, commonly referred to as the Tax Cuts and Jobs Act
|
|
TOs
|
Transmission owners
|
|
TransCo
|
Transmission-only subsidiary
|
|
TSR
|
Total shareholder return
|
|
VIE
|
Variable interest entity
|
|
Measurements
|
|
|
Bcf
|
Billion cubic feet
|
|
GWh
|
Gigawatt hours
|
|
KV
|
Kilovolts
|
|
KWh
|
Kilowatt hours
|
|
Mcf
|
Thousand cubic feet
|
|
MMBtu
|
Million British thermal units
|
|
MW
|
Megawatts
|
|
MWh
|
Megawatt hours
|
6
COMPANY OVERVIEW
Xcel Energy Inc. is a holding company with subsidiaries engaged primarily in the utility business. In 2017, Xcel Energy Inc.’s continuing operations included the activity of four wholly owned utility subsidiaries that serve electric and natural gas customers in portions of Colorado, Michigan, Minnesota, New Mexico, North Dakota, South Dakota, Texas and Wisconsin. These utility subsidiaries are NSP-Minnesota, NSP-Wisconsin, PSCo and SPS, and serve customers. Along with WYCO, a joint venture formed with CIG to develop and lease natural gas pipelines, storage, and compression facilities, and WGI, an interstate natural gas pipeline company, these companies comprise the regulated utility operations.
Xcel Energy Inc. was incorporated under the laws of Minnesota in 1909. Xcel Energy’s executive offices are located at 414 Nicollet Mall, Minneapolis, Minn. 55401. Its website address is www.xcelenergy.com. Xcel Energy makes available, free of charge through its website, its annual report on Form 10-K, quarterly reports on Form 10-Q, current reports on Form 8-K and all amendments to those reports filed or furnished pursuant to Section 13(a) or 15(d) of the Securities Exchange Act of 1934 as soon as reasonably practicable after the reports are electronically filed with or furnished to the SEC. The public may read and copy any materials that Xcel Energy files with the SEC at the SEC’s Public Reference Room at 100 F Street, N.E., Washington, D.C. 20549. The public may obtain information on the operation of the Public Reference Room by calling the SEC at 1-800-SEC-0330. The SEC also maintains an internet site that contains reports, proxy and information statements, and other information regarding issuers that file electronically with the SEC at http://www.sec.gov.
NSP-Minnesota
NSP-Minnesota is a utility primarily engaged in the generation, purchase, transmission, distribution and sale of electricity in Minnesota, North Dakota and South Dakota. NSP-Minnesota also purchases, transports, distributes and sells natural gas to retail customers and transports customer-owned natural gas in Minnesota and North Dakota. NSP-Minnesota provides electric utility service to approximately 1.5 million customers and natural gas utility service to approximately 0.5 million customers. Approximately 88 percent of NSP-Minnesota’s retail electric operating revenues were derived from operations in Minnesota during 2017 and 2016. Although NSP-Minnesota’s large C&I electric retail customers are comprised of many diversified industries, a significant portion of NSP-Minnesota’s large C&I electric sales include: petroleum refining and related industries, food products and health services. For small C&I customers, significant electric retail sales include the following industries: real estate and educational services. Generally, NSP-Minnesota’s earnings contribute approximately 35 percent to 45 percent of Xcel Energy’s consolidated net income.
The electric production and transmission costs of the entire NSP System are shared by NSP-Minnesota and NSP-Wisconsin. A FERC-approved Interchange Agreement between the two companies provides for the sharing of all generation and transmission costs of the NSP System.
The wholesale customers served by NSP-Minnesota comprised approximately 14 percent of its total KWh sold in 2017.
NSP-Minnesota owns the following direct subsidiary: United Power and Land Company, which holds real estate.
NSP-Wisconsin
NSP-Wisconsin is a utility primarily engaged in the generation, transmission, distribution and sale of electricity in portions of northwestern Wisconsin and in the western portion of the Upper Peninsula of Michigan. NSP-Wisconsin purchases, transports, distributes and sells natural gas to retail customers and transports customer-owned natural gas in this service territory. NSP-Wisconsin provides electric utility service to approximately 259,000 customers and natural gas utility service to approximately 114,000 customers. Approximately 98 percent of NSP-Wisconsin’s retail electric operating revenues were derived from operations in Wisconsin during 2017 and 2016. Although NSP-Wisconsin’s large C&I electric retail customers are comprised of many diversified industries, a significant portion of NSP-Wisconsin’s large C&I electric sales include: food products, paper, allied products and electric, gas and sanitary services
.
For small C&I customers, significant electric retail sales include the following industries: grocery and dining establishments, educational services and health services. Generally, NSP-Wisconsin’s earnings contribute approximately five percent to 10 percent of Xcel Energy’s consolidated net income.
The management of the electric generation and transmission system of NSP-Wisconsin is integrated with NSP-Minnesota.
NSP-Wisconsin owns the following direct subsidiaries: Chippewa and Flambeau Improvement Co., which operates hydro reservoirs; Clearwater Investments Inc., which owns interests in affordable housing; and NSP Lands, Inc., which holds real estate.
7
PSCo
PSCo is a utility engaged primarily in the generation, purchase, transmission, distribution and sale of electricity in Colorado. PSCo also purchases, transports, distributes and sells natural gas to retail customers and transports customer-owned natural gas. PSCo provides electric utility service to approximately 1.5 million customers and natural gas utility service to approximately 1.4 million customers. All of PSCo’s retail electric operating revenues were derived from operations in Colorado. Although PSCo’s large C&I electric retail customers are comprised of many diversified industries, a significant portion of PSCo’s large C&I electric sales include: fabricated metal products, communications and health services. For small C&I customers, significant electric retail sales include the following industries: real estate and dining establishments. Generally, PSCo’s earnings contribute approximately 35 percent to 45 percent of Xcel Energy’s consolidated net income.
The wholesale customers served by PSCo comprised approximately 14 percent of its total KWh sold in 2017.
PSCo owns the following direct subsidiaries: 1480 Welton, Inc. and United Water Company, both of which own certain real estate interests; and Green and Clear Lakes Company, which owns water rights and certain real estate interests. PSCo also holds a controlling interest in several other relatively small ditch and water companies.
SPS
SPS is a utility engaged primarily in the generation, purchase, transmission, distribution and sale of electricity in portions of Texas and New Mexico. SPS provides electric utility service to approximately 390,000 retail customers in Texas and New Mexico. Approximately 71 percent of SPS’ retail electric operating revenues were derived from operations in Texas during 2017 and 2016. Although SPS’ large C&I electric retail customers are comprised of many diversified industries, a significant portion of SPS’ large C&I electric sales include: oil and gas extraction, as well as petroleum refining and related industries. For small C&I customers, significant electric retail sales include the following industries: oil and gas extraction and grocery establishments. Generally, SPS’ earnings contribute approximately 10 percent to 15 percent of Xcel Energy’s consolidated net income.
The wholesale customers served by SPS comprised approximately 29 percent of its total KWh sold in 2017.
Other Subsidiaries
WGI is a small interstate natural gas pipeline company engaged in transporting natural gas from the PSCo system near Chalk Bluffs, Colo., to Cheyenne, Wyo.
WYCO was formed as a joint venture with CIG to develop and lease natural gas pipeline, storage, and compression facilities. Xcel Energy has a 50 percent ownership interest in WYCO. The gas pipeline and storage facilities are leased under a FERC-approved agreement to CIG.
Xcel Energy Services Inc. is the service company for Xcel Energy Inc.
XETD and XEST are TransCos that will, respectively, participate in MISO and SPP competitive bidding processes for transmission projects. XEWT is a TransCo formed to competitively bid on transmission projects in the western United States.
Xcel Energy Inc.’s nonregulated subsidiaries include Eloigne and Capital Services. Eloigne invests in rental housing projects that qualify for low-income housing tax credits, and Capital Services procures equipment for construction of renewable generation facilities at other subsidiaries.
Xcel Energy conducts its utility business in the following reportable segments: regulated electric utility, regulated natural gas utility and all other. See Note 17 to the consolidated financial statements for further discussion relating to comparative segment revenues, income from operations and related financial information.
8
ELECTRIC UTILITY OPERATIONS
NSP-Minnesota
Public Utility Regulation
Summary of Regulatory Agencies and Areas of Jurisdiction
—
Retail rates, services and other aspects of NSP-Minnesota’s operations are regulated by the MPUC, the NDPSC and the SDPUC within their respective states. The MPUC also has regulatory authority over security issuances, property transfers, mergers, dispositions of assets and transactions between NSP-Minnesota and its affiliates. In addition, the MPUC reviews and approves NSP-Minnesota’s IRPs for meeting customers’ future energy needs. The MPUC also certifies the need and siting for generating plants greater than 50 MW and transmission lines greater than 100 KV that will be located within the state. No large power plant or transmission line may be constructed in Minnesota except on a site or route designated by the MPUC. The NDPSC and SDPUC have regulatory authority over generation and transmission facilities, along with the siting and routing of new generation and transmission facilities in North Dakota and South Dakota, respectively.
NSP-Minnesota is subject to the jurisdiction of the FERC for its wholesale electric operations, hydroelectric licensing, accounting practices, wholesale sales for resale, transmission of electricity in interstate commerce, compliance with NERC electric reliability standards, asset transfers and mergers, and natural gas transactions in interstate commerce. NSP-Minnesota is a transmission owning member of the MISO RTO and operates within the MISO RTO and MISO wholesale market. NSP-Minnesota and NSP-Wisconsin are jointly authorized by the FERC to make wholesale electric sales at market-based prices.
Fuel, Purchased Energy and Conservation Cost-Recovery Mechanisms
—
NSP-Minnesota has several retail adjustment clauses that recover fuel, purchased energy and other resource costs:
|
•
|
CIP rider
— Recovers the costs of conservation and demand-side management programs.
|
|
•
|
EIR
— Recovers the costs of environmental improvement projects.
|
|
•
|
RDF
— Allocates money collected from retail customers to support the research and development of emerging renewable energy projects and technologies.
|
|
•
|
RES
— Recovers the cost of renewable generation in Minnesota.
|
|
•
|
RER
— Recovers the cost of renewable generation in North Dakota.
|
|
•
|
SEP
— Recovers costs related to various energy policies approved by the Minnesota legislature.
|
|
•
|
TCR
— Recovers costs associated with investments in electric transmission and distribution grid modernization costs.
|
|
•
|
Infrastructure rider
— Recovers costs for investments in generation and incremental property taxes in South Dakota.
|
NSP-Minnesota’s retail electric rates in Minnesota, North Dakota and South Dakota include a FCA for monthly billing adjustments to recover changes in prudently incurred costs of fuel related items and purchased energy. In general, capacity costs are recovered through base rates and are not recovered through the FCA. In addition, costs associated with MISO are generally recovered through either the FCA or base rates. In 2017, the MPUC voted to change the process in which utilities seek fuel cost recovery under the FCA in Minnesota to be implemented in July 2019. Under the new process, each month utilities would collect amounts equal to the baseline cost of energy set at the start of the plan year. Monthly variations to the baseline costs would be tracked and netted over a 12-month period. Subsequently, utilities would issue refunds above the baseline costs, and could seek recovery of any overage.
Minnesota state law requires NSP-Minnesota to invest two percent of its state electric revenues and half a percent of its state gas revenues in CIP. These costs are recovered through an annual cost-recovery mechanism for electric conservation and energy management program expenditures. Minnesota state law also requires NSP-Minnesota to submit a CIP plan at least every three years.
Capacity and Demand
Uninterrupted system peak demand for the NSP System’s electric utility for each of the last three years and the forecast for 2018, assuming normal weather conditions, is as follows:
|
System Peak Demand (in MW)
|
|||||||||||
|
2017
|
2016
|
2015
|
2018 Forecast
|
||||||||
|
NSP System
|
8,546
|
|
9,002
|
|
8,621
|
|
9,208
|
|
|||
9
The peak demand for the NSP System typically occurs in the summer. The 2017 system peak demand for the NSP System occurred on
July 17, 2017. The decline in peak load from 2016 to 2017 is in part due to considerably cooler weather in 2017. The 2018 forecast assumes normal peak day weather, which is warmer than actual 2017 peak day weather.
Energy Sources and Related Transmission Initiatives
NSP-Minnesota expects to use existing power plants, power purchases, CIP/DSM options, new generation facilities and expansion of existing power plants to meet its system capacity requirements.
Purchased Power
—
NSP-Minnesota has contracts to purchase power from other utilities and IPPs. Generally, long-term dispatchable purchased power contracts require a periodic capacity payment and a charge for the delivered associated energy. Some long-term purchased power contracts only contain a charge for the purchased energy. NSP-Minnesota also makes short-term purchases to meet system load and energy requirements, to replace generation from company-owned units under maintenance or during outages, to meet operating reserve obligations, or to obtain energy at a lower cost.
Purchased Transmission Services
—
NSP-Minnesota and NSP-Wisconsin have contracts with MISO and other regional transmission service providers to deliver power and energy to their customers.
NSP System Resource Plans
— In January 2017, the MPUC approved NSP-Minnesota’s IRP that includes:
|
•
|
Retirement of Sherco Unit 2 in 2023 and Sherco Unit 1 in 2026. The resulting need for 750 MW of capacity in 2026 will be addressed in a future CON proceeding;
|
|
•
|
Acquisition of at least 1,000 MW of wind by 2019. The mix of purchased power and owned facilities was not specified;
|
|
•
|
Acquisition of 650 MW of solar by 2021 either through the community solar gardens program or other cost-effective resources. The mix of purchased power and owned facilities was not specified;
|
|
•
|
Acquisition of at least 400 MW of additional demand response by 2023, and a study of the technical and economic achievability of 1,000 MW of additional demand response in total by 2025; and
|
|
•
|
Achievement of at least 444 GWh of energy efficiency in all planning years.
|
Minnesota Legislation
— In February 2017, the Minnesota governor signed a bill into law allowing NSP-Minnesota to build a natural gas combined-cycle power plant at NSP-Minnesota’s Sherco site. The plant was originally proposed as part of NSP-Minnesota’s resource plan, which enables the retirement of two coal units at the Sherco site. The plant’s in-service date is anticipated for 2026. Cost recovery of the plant will be subject to MPUC approval.
Wind Development
— In July 2017, the MPUC approved NSP-Minnesota’s proposal to add 1,550 MW of new wind generation including ownership of 1,150 MW of wind generation by NSP-Minnesota, which will help achieve NSP-Minnesota’s wind acquisition goal outlined in the IRP. In March 2017, NSP-Minnesota filed an Advanced Determination of Prudence with the NDPSC and reached a settlement with the NDPSC Staff. The timing of a NDPSC order is uncertain. These projects are expected to be completed by the end of 2020 and would qualify for 100 percent of the PTC. NSP-Minnesota’s total capital investment for these wind ownership projects is expected to be approximately $1.9 billion.
In September 2017, NSP-Minnesota filed with the MPUC seeking approval to build and own the Dakota Range project, a 300 MW wind project in South Dakota. The project is expected to be placed into service by the end of 2021 and qualify for 80 percent of the PTC. The DOC recommended the MPUC deny the petition on the basis that NSP-Minnesota did not follow the standard regulatory selection process of issuing a new RFP. However, the DOC acknowledged the Dakota Range project would benefit ratepayers and the MPUC could approve the project if it determines the public interest outweighs their concern about the regulatory selection process.
These wind projects are expected to provide significant savings to NSP-Minnesota’s customers and substantial environmental benefits. Projected savings/benefits assume fuel costs and generation mix consistent with various commission approved resource plans
.
NSP-Minnesota will provide supplemental filings to the MPUC in March 2018, which will estimate impacts of the TCJA on the wind projects.
10
PPA Terminations and Amendments
— In 2017, NSP-Minnesota filed requests with the MPUC and the NDPSC for several initiatives including changes to four PPAs to reduce future costs for customers. These actions include the following:
|
•
|
The termination of a PPA with Benson Power LLC (Benson) for its 55 MW biomass facility in Benson, Minn., including the purchase and closure of the facility. The purchase of the Benson biomass facility requires FERC approval, which was requested in August 2017. The transaction would result in payments of $95 million to terminate the PPA and acquire the facility, as well as additional expenditures of approximately $26 million to temporarily operate and close the facility.
|
|
•
|
The termination of a PPA with Laurentian Energy Authority I, LLC (Laurentian) for its 35 MW of biomass facilities in Hibbing and Virginia, Minn. The termination of the Laurentian PPA would result in approximately $109 million of contract cancellation payments over six years.
|
|
•
|
The remaining two requested PPA changes involve a PPA extension of the Hennepin Energy Recovery Center (HERC) 34 MW waste-to-energy facility at a price reflective of current market conditions and termination of the Pine Bend 12 MW waste-to-energy PPA.
|
In November 2017, the MPUC approved NSP-Minnesota’s request to terminate the Pine Bend PPA but rejected its request to extend the HERC PPA.
In January 2018, the MPUC issued an order approving NSP-Minnesota’s petition to terminate the PPAs with Benson and Laurentian, as well as purchase and close the Benson biomass facility. All approved costs are expected to be recoverable through the FCA, including a return on NSP-Minnesota’s total investment in the Benson transaction through 2028. NSP-Minnesota also reached a settlement agreement with the NDPSC Staff which allows for the termination of the PPAs with Benson, Laurentian and Pine Bend, as well as the purchase and closure of the Benson biomass facility. The NDPSC is expected to issue an order on the settlement in the second quarter of 2018. NSP-Minnesota and NSP-Wisconsin will jointly request FERC approval to modify the Interchange Agreement to share a portion of the termination costs with NSP-Wisconsin.
These terminations and amendments are intended to provide in excess of $600 million in net cost savings to NSP System customers over the next 10 years.
Jurisdictional Cost Recovery Allocation
— In December 2016, NSP-Minnesota filed a resource treatment framework with the NDPSC and MPUC. The filing proposed a framework to allow NSP-Minnesota’s operations in North Dakota and Minnesota to gradually become more independent of one another with respect to future generation resource selection while also identifying a path for cost sharing of current resources. NSP-Minnesota’s filing identified two options: a legal separation, creating a separate North Dakota operating company; or a pseudo-separation, which maintains the current corporate structure but directly assigns the costs and benefits of each resource to the jurisdiction that supports it
.
In October 2017, NDPSC staff filed testimony recommending no change to the current system of proxy pricing and policy-based disallowances claiming there is a likelihood of overall increased costs and potential loss of resource diversity. Hearings are planned for the second quarter of 2018.
Minnesota State Right-Of-First Refusal (ROFR) Statute Complaint
— In September 2017, LSP Transmission Holdings, LLC filed a complaint in the U.S. District Court for the District of Minnesota (Minnesota District Court) against the Minnesota Attorney General, the MPUC and the DOC. The complaint was in response to MISO assigning NSP-Minnesota and ITC Midwest, LLC to jointly own a new 345 KV transmission line from near Mankato, Minn. to Winnebago, Minn. The line was estimated by MISO to cost $103 million. The project was assigned to NSP-Minnesota and ITC Midwest as the incumbent utilities, consistent with a Minnesota state ROFR statute. The complaint challenges the constitutionality of the state ROFR statute and is seeking declaratory judgment that the statute violates the Commerce Clause of the U.S. Constitution and should not be enforced. The Minnesota state agencies and NSP-Minnesota filed motions to dismiss. Oral arguments were heard in February 2018, and the matter is now pending before the Minnesota District Court. The timing and outcome of the litigation is uncertain.
Nuclear Power Operations and Waste Disposal
NSP-Minnesota owns two nuclear generating plants: the Monticello plant and the PI plant. Nuclear power plant operations produce gaseous, liquid and solid radioactive wastes which are controlled by federal regulation. High-level radioactive wastes primarily include used nuclear fuel. LLW consists primarily of demineralizer resins, paper, protective clothing, rags, tools and equipment that have become contaminated through use in a plant.
11
NSP-Minnesota participates with regulators and in industry groups including the NRC, the Institute of Nuclear Power Operations and Utilities Service Alliance to stay informed of advancements in nuclear safety, mitigation strategies, performance and operational effectiveness. NSP-Minnesota applies this acquired knowledge by investing in technology and services that improve nuclear operations and detect, mitigate and protect NPS-Minnesota’s nuclear facilities.
NRC Regulation
— The NRC regulates nuclear operations. Decisions by the NRC can significantly impact the operations of the nuclear generating plants. The costs of complying with NRC orders and requirements can affect both operating expenses and capital investments of the plants. NSP-Minnesota has obtained recovery of these compliance costs in customer rates, and expects future compliance costs will continue to be recoverable from customers. Estimates of the future nuclear capital expenditures related to costs of NRC compliance are included in Xcel Energy’s capital forecast for electric generation. See Item 7 for further discussion of capital requirements.
Nuclear Regulatory Performance
—
The NRC has a Reactor Oversight Process that classifies U.S. nuclear reactors into various categories (referred to as Columns, from 1 to 5). Issues are evaluated as either green, white, yellow, or red based on their safety significance, with green representing the least safety concern and red representing the most concern.
As of Dec. 31, 2017, Monticello and PI Units 1 and 2 were in Column 1 (licensee response) with all green performance indicators and no greater than green findings or violations. Plants in Column 1 are subject to only a pre-defined set of basic NRC inspections.
LLW Disposal
—
LLW from NSP-Minnesota’s Monticello and PI nuclear plants is currently disposed at the Clive facility located in Utah and the Waste Control Specialists facility located in Texas. If off-site LLW disposal facilities become unavailable, NSP-Minnesota has storage capacity available on-site at PI and Monticello that would allow both plants to continue to operate until the end of their current licensed lives.
High-Level Radioactive Waste Disposal
—
The federal government has the responsibility to permanently dispose of domestic spent nuclear fuel and other high-level radioactive wastes. The Nuclear Waste Policy Act requires the DOE to implement a program for nuclear high-level waste management. This includes the siting, licensing, construction and operation of a repository for spent nuclear fuel from civilian nuclear power reactors and other high-level radioactive wastes at a permanent federal storage or disposal facility. The federal government has been evaluating a nuclear geologic repository at Yucca Mountain, Nevada for many years. At this time, there are no definitive plans for a permanent federal storage site at Yucca Mountain or any other site.
Review of PI Costs
—
As part of NSP-Minnesota’s 2016 multi-year electric rate case and IRP the MPUC ordered an investigation into NSP-Minnesota’s PI nuclear investments. The issue was resolved for the 2016 multi-year electric rate case settlement; however the DOC is continuing to investigate costs of operation and performance at PI in anticipation of NSP-Minnesota’s 2019 resource plan.
Nuclear Spent Fuel Storage
NSP-Minnesota has interim on-site storage for spent nuclear fuel at its Monticello and PI nuclear generating plants. As of Dec. 31, 2017, there were 40 casks loaded and stored at the PI plant and 16 canisters loaded and stored at the Monticello plant. An additional 24 casks for PI and 14 canisters for Monticello have been authorized by the State of Minnesota. This currently authorized storage capacity is sufficient to allow NSP-Minnesota to operate until the end of the operating licenses in 2030 for Monticello, 2033 for PI Unit 1, and 2034 for PI Unit 2. Authorizations for additional spent fuel storage capacity may be required at each site to support either continued operation or decommissioning if the federal government does not begin operation of a consolidated interim storage installation.
In 2013, NSP-Minnesota’s Monticello nuclear generating plant loaded and placed five storage canisters (canisters #11-15) in the ISFSI and a sixth canister (canister #16) was loaded but remained in the plant pending resolution of weld inspection issues. Successful pressure and leak testing demonstrated the safety and integrity of all six canisters involved. NSP-Minnesota took several actions to assure compliance with the NRC’s regulations and Monticello’s storage license.
In 2016, the NRC issued an order approving a settlement in which NSP-Minnesota agreed to a timeline for attaining compliance on all six canisters, as well as additional training and communications. During 2016, the NRC approved an exemption request for the completion of canister #16. That canister is now considered in compliance, and was placed in the ISFSI during 2016. In 2017, NSP-Minnesota submitted a plan and request to the NRC to restore Monticello canisters #11-15 to compliance through an exemption request. NSP-Minnesota requested that the NRC grant the exemption by October 2018.
Costs attributable to Monticello canisters #11-15 achieving full regulatory compliance within five years are currently being evaluated. No public safety issues have been raised, or are believed to exist, in this matter.
12
See Note 14 to the consolidated financial statements for further discussion regarding nuclear related items.
Energy Source Statistics
|
Year Ended Dec. 31
|
|||||||||||||||||
|
2017
|
2016
|
2015
|
|||||||||||||||
|
NSP System
|
Millions of
KWh
|
Percent of
Generation
|
Millions of
KWh
|
Percent of
Generation
|
Millions of
KWh
|
Percent of
Generation
|
|||||||||||
|
Nuclear
|
14,167
|
|
30
|
%
|
14,191
|
|
30
|
%
|
12,425
|
|
27
|
%
|
|||||
|
Coal
|
14,737
|
|
30
|
|
13,681
|
|
28
|
|
15,961
|
|
35
|
|
|||||
|
Wind
(a)
|
8,893
|
|
18
|
|
7,897
|
|
16
|
|
6,235
|
|
14
|
|
|||||
|
Natural Gas
|
5,786
|
|
12
|
|
7,810
|
|
16
|
|
6,689
|
|
15
|
|
|||||
|
Hydroelectric
|
3,080
|
|
6
|
|
3,203
|
|
7
|
|
3,326
|
|
7
|
|
|||||
|
Other
(b)
|
2,052
|
|
4
|
|
1,480
|
|
3
|
|
1,083
|
|
2
|
|
|||||
|
Total
|
48,715
|
|
100
|
%
|
48,262
|
|
100
|
%
|
45,719
|
|
100
|
%
|
|||||
|
Owned generation
|
36,640
|
|
75
|
%
|
36,381
|
|
75
|
%
|
33,818
|
|
74
|
%
|
|||||
|
Purchased generation
|
12,075
|
|
25
|
|
11,881
|
|
25
|
|
11,901
|
|
26
|
|
|||||
|
Total
|
48,715
|
|
100
|
%
|
48,262
|
|
100
|
%
|
45,719
|
|
100
|
%
|
|||||
|
(a)
|
This category includes wind energy de-bundled from RECs and also includes Windsource
®
RECs. The NSP System uses RECs to meet or exceed state resource requirements and may sell surplus RECs.
|
|
(b)
|
Includes energy from other sources, including solar, biomass, oil and refuse. Distributed generation from the Solar*Rewards
®
program is not included, and was approximately 17, 21 and eight million net KWh for 2017, 2016, and 2015, respectively.
|
Fuel Supply and Costs
The following table shows the delivered cost per MMBtu of each significant category of fuel consumed for owned electric generation, the percentage of total fuel requirements represented by each category of fuel and the total weighted average cost of all fuels.
|
Coal
(a)
|
Nuclear
|
Natural Gas
|
Weighted
Average Owned Fuel Cost
|
||||||||||||||||||||||
|
NSP System Generating Plants
|
Cost
|
Percent
|
Cost
|
Percent
|
Cost
|
Percent
|
|||||||||||||||||||
|
2017
|
$
|
2.08
|
|
45
|
%
|
$
|
0.78
|
|
45
|
%
|
$
|
4.10
|
|
10
|
%
|
$
|
1.72
|
|
|||||||
|
2016
|
2.03
|
|
42
|
|
0.80
|
|
44
|
|
3.30
|
|
14
|
|
1.67
|
|
|||||||||||
|
2015
|
2.15
|
|
47
|
|
0.83
|
|
40
|
|
3.89
|
|
13
|
|
1.85
|
|
|||||||||||
|
(a)
|
Includes refuse-derived fuel and wood.
|
See Items 1A and 7 for further discussion of fuel supply and costs.
Fuel Sources
Nuclear
— NSP-Minnesota secures contracts for uranium concentrates, uranium conversion, uranium enrichment and fuel fabrication to operate its nuclear plants. The contract strategy involves a portfolio of spot purchases and medium and long-term contracts for uranium concentrates, conversion services and enrichment services with multiple producers and with a focus on diversification to minimize potential impacts caused by supply interruptions due to geographical and world political issues.
|
•
|
Current nuclear fuel supply contracts cover 100 percent of uranium concentrates requirements through 2021 and approximately 57 percent of the requirements for 2022 through 2033;
|
|
•
|
Current contracts for conversion services cover 100 percent of the requirements through 2021 and approximately 50 percent of the requirements for 2022 through 2033; and
|
|
•
|
Current enrichment service contracts cover 100 percent of the requirements through 2025 and approximately 29 percent of the requirements for 2026 through 2033.
|
Fabrication services for Monticello and PI are 100 percent committed through 2030 and 2019, respectively.
13
NSP-Minnesota expects sufficient uranium concentrates, conversion services and enrichment services to be available for the total fuel requirements of its nuclear generating plants. Some exposure to market price volatility will remain due to index-based pricing structures contained in certain supply contracts.
Coal
— The NSP System normally maintains approximately 41 days of coal inventory. Coal supply inventories at Dec. 31, 2017 and 2016 were approximately 53 and 55 days of usage, respectively. Milder weather, purchase commitments and relatively low power and natural gas prices resulted in coal inventories being above optimal levels. NSP-Minnesota’s generation stations use low-sulfur western coal purchased primarily under contracts with suppliers operating in Wyoming and Montana. Coal requirements for the NSP System’s major coal-fired generating plants were approximately 8.0 million tons for 2017 and 7.5 million tons for 2016. Coal requirements for 2017 increased primarily due to slightly higher natural gas prices during the year. The estimated coal requirements for 2018 are approximately 8.3 million tons.
NSP-Minnesota and NSP-Wisconsin have contracted for coal supplies to provide 79 percent of their estimated coal requirements in 2018 and a declining percentage of the requirements in subsequent years. The NSP System’s general coal purchasing objective is to contract for approximately 75 percent of requirements for the first year, 40 percent of requirements in year two and 20 percent of requirements in year three. Remaining requirements will be filled through the procurement process or over-the-counter transactions.
NSP-Minnesota and NSP-Wisconsin have coal transportation contracts that provide for delivery of 100 and 25 percent of their coal requirements in 2018 and 2019, respectively. Coal delivery may be subject to interruptions or reductions due to operation of the mines, transportation problems, weather and availability of equipment.
Natural gas
— The NSP System uses both firm and interruptible natural gas supply in combustion turbines and certain boilers. Natural gas supplies, transportation and storage services for power plants are procured under contracts to provide an adequate supply of fuel. However, as natural gas primarily serves intermediate and peak demand, remaining forecasted requirements are able to be procured through a liquid spot market. Generally, natural gas supply contracts have variable pricing that is tied to various natural gas indices. Most transportation contract pricing is based on FERC approved transportation tariff rates. Certain natural gas supply and transportation agreements include obligations for the purchase and/or delivery of specified volumes of natural gas or to make payments in lieu of delivery. At Dec. 31, 2017 and 2016, the NSP System did not have any commitments related to gas supply contracts; however commitments related to gas transportation and storage contracts were approximately $398 million and $382 million, respectively. Commitments related to gas transportation and storage contracts expire in various years from 2018 to 2037.
The NSP System also has limited on-site fuel oil storage facilities and primarily relies on the spot market for incremental supplies.
Renewable Energy Sources
The NSP System’s renewable energy portfolio includes wind, hydroelectric, biomass and solar power from both owned generating facilities and PPAs. As of Dec. 31, 2017, the NSP System was in compliance with mandated RPS, which require generation from renewable resources of 25.0 percent and 12.9 percent of NSP-Minnesota and NSP-Wisconsin electric retail sales, respectively.
Renewable energy as a percentage of the NSP System’s total energy:
|
2017
|
2016
|
|||||
|
Renewable
|
28.8
|
%
|
26.1
|
%
|
||
|
Wind
|
18.3
|
|
16.4
|
|
||
|
Hydroelectric
|
6.3
|
|
6.6
|
|
||
|
Biomass and solar
|
4.2
|
|
3.1
|
|
||
The NSP System also offers customer-focused renewable energy initiatives. Windsource allows customers in Minnesota, Wisconsin and Michigan to purchase electricity from renewable sources. The number of customers utilizing Windsource increased to approximately 60,900 in 2017 from 54,000 in 2016.
14
Additionally, to encourage the growth of solar energy in Minnesota, customers are offered incentives to install solar panels on their homes and businesses under the Solar*Rewards
®
and Made in Minnesota solar incentive programs. Over 2,800 PV systems with approximately 33.75 MW of aggregate capacity have been installed in Minnesota as of Dec. 31, 2017 and 2,000 PV systems with approximately 25.2 MW of aggregate capacity were installed as of Dec. 31, 2016. The Solar*Rewards
®
Community
®
program is another option made available to encourage use of solar energy in Minnesota. This program allows for offsite development of solar and bill credits to customers based on an approved tariffed rate.
Wind
—
The NSP System acquires the majority of its wind energy from PPAs. Currently, the NSP System has more than 130 of these agreements in place, with facilities ranging in size from under one MW to more than 200 MW. The NSP System owns and operates five wind farms which have the capacity to generate 852 MW.
|
•
|
The NSP System had approximately 2,600 MW of wind energy on its system at the end of 2017 and 2016. In addition to receiving purchased wind energy under these agreements, the NSP System typically receives wind RECs, which are used to meet state renewable resource requirements.
|
|
•
|
The average cost per MWh of wind energy under existing contracts was approximately $44 for 2017 and $43 for 2016. The cost per MWh of wind energy varies by contract and may be influenced by a number of factors including regulation, state-specific renewable resource requirements and the year of contract execution. Generally, contracts executed in 2017 continued to benefit from improvements in technology, excess capacity among manufacturers and motivation to commence new construction prior to the anticipated expiration of the federal PTCs. In December 2015, the federal PTCs were extended through 2019 with a phase down on sites that began construction in 2017.
|
Hydroelectric
—
The NSP System acquires its hydroelectric energy from both owned generation and PPAs. The NSP System owns 20 hydroelectric plants throughout Wisconsin and Minnesota which provide approximately 263 MW of capacity. For 2017, PPAs provided approximately 34 MW of hydroelectric capacity. Additionally, the NSP System purchases approximately 850 MW of generation from Manitoba Hydro, which is sourced primarily from its fleet of hydroelectric facilities.
Wholesale and Commodity Marketing Operations
NSP-Minnesota conducts various wholesale marketing operations, including the purchase and sale of electric capacity, energy, ancillary services and energy-related products. NSP-Minnesota uses physical and financial instruments to minimize commodity price and credit risk and hedge sales and purchases. NSP-Minnesota also engages in trading activity unrelated to hedging and sharing of any margins is determined through state regulatory proceedings as well as the operation of the FERC approved joint operating agreement. NSP-Minnesota does not serve any wholesale requirements customers at cost-based regulated rates. See Item 7 for further discussion.
NSP-Wisconsin
Public Utility Regulation
Summary of Regulatory Agencies and Areas of Jurisdiction
—
Retail rates, services and other aspects of NSP-Wisconsin’s operations are regulated by the PSCW and the MPSC, within their respective states. In addition, each of the state commissions certifies the need for new generating plants and electric transmission lines before the facilities may be sited and built. NSP-Wisconsin is subject to the jurisdiction of the FERC for its wholesale electric operations, hydroelectric generation licensing, accounting practices, wholesale sales for resale, the transmission of electricity in interstate commerce, compliance with NERC electric reliability standards, asset transactions and mergers and natural gas transactions in interstate commerce. NSP- Wisconsin is a transmission owning member of the MISO RTO and operates within the MISO RTO and wholesale energy market. NSP-Wisconsin and NSP-Minnesota are jointly authorized by the FERC to make wholesale electric sales at market-based prices.
The PSCW has a biennial base rate filing requirement. By June of each odd numbered year, NSP-Wisconsin must submit a rate filing for the test year beginning the following January. In recent years, NSP-Wisconsin has been submitting rate filings each year.
15
Fuel and Purchased Energy Cost Recovery Mechanisms
—
NSP-Wisconsin does not have an automatic electric fuel adjustment clause for Wisconsin retail customers. Instead, under Wisconsin rules, utilities submit a forward-looking annual fuel cost plan to the PSCW for approval. Once the PSCW approves the fuel cost plan, utilities defer the amount of any fuel cost under-recovery or over-recovery in excess of a two percent annual tolerance band, for future rate recovery or refund. Approval of a fuel cost plan and any rate adjustment for refund or recovery of deferred costs is determined by the PSCW. Rate recovery of deferred fuel cost is subject to an earnings test based on the utility’s most recently authorized ROE. Fuel cost under-collections that exceed the two percent annual tolerance band may not be recovered if the utility earnings for that year exceed the authorized ROE.
NSP-Wisconsin’s electric fuel costs for 2017 were lower than authorized in rates and outside the two percent annual tolerance band, primarily due to lower purchased power costs coupled with moderate weather and generation sales into the MISO market. Under the fuel cost recovery rules, NSP-Wisconsin may retain approximately $4 million of fuel costs and defer approximately $10 million through Dec. 31, 2017. NSP-Wisconsin will file a reconciliation of 2017 fuel costs with the PSCW. The amount of any potential refund is subject to review and approval by the PSCW, which is not expected until mid-2018.
NSP-Wisconsin’s retail electric rate schedules for Michigan customers include power supply cost recovery factors, which are based on 12-month projections. After each 12-month period, a reconciliation is submitted whereby over-recoveries are refunded and any under-recoveries are collected from the customers over the subsequent 12-month period.
Wisconsin Energy Efficiency Program
—
In Wisconsin, the primary energy efficiency program is funded by the state’s utilities, but operated by independent contractors subject to oversight by the PSCW and the utilities. NSP-Wisconsin recovers these costs in rates charged to Wisconsin retail customers.
Capacity and Demand
NSP-Wisconsin operates an integrated system with NSP-Minnesota. See NSP-Minnesota Capacity and Demand.
Energy Sources and Related Transmission Initiatives
NSP-Wisconsin operates an integrated system with NSP-Minnesota. See NSP-Minnesota Energy Sources and Related Transmission Initiatives.
NSP-Wisconsin / American Transmission Company, LLC (ATC) - La Crosse to Madison, Wis. Transmission Line
— In 2013, NSP-Wisconsin and ATC jointly filed an application with the PSCW for a CPCN for a 345 KV transmission line that would extend from La Crosse, Wis. to Madison, Wis. NSP-Wisconsin’s half of the line will be shared with three co-owners, Dairyland Power Cooperative, WPPI Energy and Southern Minnesota Municipal Power Agency-Wisconsin.
In 2015, the PSCW issued its order approving a CPCN and route for the project. Two groups have appealed the CPCN order to the La Crosse County Circuit Court (Circuit Court). In May 2017, the Circuit Court determined that the project was necessary, allowing construction to continue on a seven mile segment near La Crosse, Wis. The parties have appealed various aspects of the case to the Wisconsin Court of Appeals which is currently pending. The CPCN remains in full effect unless one of the parties seeks and receives a stay from the court and posts a bond to cover damages the utilities may incur due to delay. The 180-mile project is expected to cost approximately $541 million. NSP-Wisconsin’s portion of the investment, which includes AFUDC, is estimated to be approximately $200 million. Construction on the line began in January 2016, with completion anticipated by late 2018.
Fuel Supply and Costs
NSP-Wisconsin operates an integrated system with NSP-Minnesota. See NSP-Minnesota Fuel Supply and Costs.
Wholesale and Commodity Marketing Operations
NSP-Wisconsin operates an integrated system with NSP-Minnesota. NSP-Wisconsin does not serve any wholesale requirements customers at cost-based regulated rates. See NSP-Minnesota Wholesale and Commodity Marketing Operations.
16
PSCo
Public Utility Regulation
Summary of Regulatory Agencies and Areas of Jurisdiction
—
PSCo is regulated by the CPUC with respect to its facilities, rates, accounts, services and issuance of securities. PSCo is regulated by the FERC for its wholesale electric operations, accounting practices, hydroelectric licensing, wholesale sales for resale, transmission of electricity in interstate commerce, compliance with the NERC electric reliability standards, asset transactions and mergers and natural gas transactions in interstate commerce. PSCo is not presently a member of an RTO and does not operate within an RTO energy market. PSCo is authorized by the FERC to make wholesale electric sales at market-based prices to customers outside PSCo’s balancing authority area.
Fuel, Purchased Energy and Conservation Cost-Recovery Mechanisms
— PSCo has several retail adjustment clauses that recover fuel, purchased energy and other resource costs:
|
•
|
ECA
— Recovers fuel and purchased energy costs. Short-term sales margins are shared with retail customers through the ECA. The ECA is revised quarterly.
|
|
•
|
PCCA
— Recovers purchased capacity payments.
|
|
•
|
SCA
— Recovers the difference between PSCo’s actual cost of fuel and the amount of these costs recovered under its base steam service rates. The SCA rate is revised on a quarterly basis.
|
|
•
|
DSMCA
— Recovers DSM, interruptible service costs and performance initiatives for achieving energy savings goals.
|
|
•
|
RESA
— Recovers the incremental costs of compliance with the RES with a maximum of two percent of the customer’s bill.
|
|
•
|
WCA
— Premium service for customers who choose to pay for renewable resources.
|
|
•
|
TCA
— Recovers costs associated with transmission investment outside of rate cases.
|
|
•
|
CACJA
— Recovers costs associated with the CACJA.
|
PSCo recovers fuel and purchased energy costs from its wholesale electric customers through a fuel cost adjustment clause approved by the FERC. PSCo’s wholesale customers pay the full cost of certain renewable energy purchase and generation costs through a fuel clause and in exchange receive RECs associated with those resources. The wholesale customers pay their jurisdictional allocation of production costs through a fully forecasted formula rate with true-up.
Capacity and Demand
Uninterrupted system peak demand for PSCo’s electric utility for each of the last three years and the forecast for 2018, assuming normal weather conditions, is as follows:
|
System Peak Demand (in MW)
|
|||||||||||
|
2017
|
2016
|
2015
|
2018 Forecast
|
||||||||
|
PSCo
|
6,671
|
|
6,585
|
|
6,284
|
|
6,462
|
|
|||
The peak demand for PSCo’s system typically occurs in the summer. The 2017 system peak demand for PSCo occurred on July 19, 2017. The 2017 system peak demand was higher than 2016 due to warmer July summer weather. The forecast of system peak assumes normal weather conditions.
Energy Sources and Related Transmission Initiatives
PSCo expects to meet its system capacity requirements through existing electric generating stations, power purchases, new generation facilities, DSM options and phased expansion of existing generation at select power plants.
Purchased Power
—
PSCo has contracts to purchase power from other utilities and IPPs. Long-term purchased power contracts for dispatchable resources typically require a periodic capacity charge and an energy charge for energy actually purchased. PSCo also contracts to purchase power for both wind and solar resources. In addition, PSCo makes short-term purchases to meet system load and energy requirements, to replace generation from company-owned units under maintenance or during outages, to meet operating reserve obligations, or to obtain energy at a lower cost.
Purchased Transmission Services
—
In addition to using its own transmission system, PSCo has contracts with regional transmission service providers to deliver energy to PSCo’s customers.
17
Rush Creek Wind Ownership Proposal
— In 2016, the CPUC granted PSCo a CPCN to build, own and operate a 600 MW wind generation facility in Colorado at Rush Creek. The CPCN includes a hard cost-cap of $1.096 billion (including transmission costs) and a capital cost sharing mechanism between customers and PSCo of 82.5 percent to customers and 17.5 percent to PSCo for every $10 million the project comes in below the cost-cap.
All major contracts required to complete the project have been executed. PTC components for safe harboring the facility have been fabricated and construction began in April 2017.
Investment costs will be recovered through the RESA and ECA riders until PSCo’s next rate case following Rush Creek’s in-service date. The wind generation facility is anticipated to be in service in October 2018.
Colorado Energy Plan (CEP)
— In 2016, PSCo filed its 2016 Electric Resource Plan (ERP) which included the estimated need for additional generation resources through spring of 2024. In 2017, PSCo filed an updated capacity need with the CPUC of 450 MW in 2023.
In August 2017, PSCo and various other stakeholders filed a stipulation agreement proposing the CEP, an alternative plan that increases the amount of new resources sought under the ERP. The CEP would increase PSCo’s potential capacity need up to 1,110 MW due to the proposed retirement of two coal units. The major components include:
|
•
|
Early retirement of 660 MWs of coal-fired generation at Comanche Units 1 (2022) and 2 (2025);
|
|
•
|
Accelerated depreciation for the early retirement of the two Comanche units and establishment of a regulatory asset to collect the incremental depreciation expense and related costs;
|
|
•
|
A RFP for up to 1,000 MW of wind, 700 MW of solar and 700 MW of natural gas and/or storage;
|
|
•
|
Utility ownership targets of 50 percent renewable generation resources and 75 percent of natural gas-fired, storage, or renewable with storage generation resources;
|
|
•
|
Reduction of the RESA rider, from two percent to one percent effective beginning 2021 or 2022; and
|
|
•
|
Construction of a new transmission switching station to further the development of renewable generating resources.
|
Hearings were held in February 2018 with two parties opposing both the coal retirements and utility ownership. Fifteen parties in the proceeding support the CEP. The CPUC is expected to rule on the stipulation agreement in March 2018. PSCo is currently evaluating bids from a RFP and anticipates filing its recommended portfolios in April 2018. A CPUC decision on the recommended portfolio is anticipated in the summer of 2018.
Approval of the CEP portfolio could increase capital investment up to $1.5 billion, based on a preliminary estimate. The level of capital investment may decline due to lower renewable pricing and the ultimate composition of assets selected as part of the RFP process. The expected cost and potential capital investment of the CEP will be determined once a recommended portfolio is filed with the CPUC. The CEP portfolio is not included in PSCo and Xcel Energy’s base capital expenditures forecast. See Item 7. Management’s Discussion and Analysis of Financial Condition and Result of Operations - Liquidity and Capital Resources for further discussion of the capital forecast.
Boulder, Colorado Municipalization
— In 2011, in the City of Boulder, Colorado (Boulder), voters passed a ballot measure authorizing the formation of an electric municipal utility, subject to certain conditions. Since that time, there have been various legal proceedings in multiple venues with jurisdiction over Boulder’s plan. In 2014, the Boulder City Council passed an ordinance to establish an electric utility. PSCo challenged the formation of this utility as premature and the Colorado Court of Appeals ruled in PSCo’s favor, vacating a lower court decision. Subsequently, the Colorado Supreme Court granted Boulder’s petition to review the Court of Appeals decision and oral arguments were held on Feb. 14, 2018. A ruling on the petition is anticipated in 2018.
In 2015, the Boulder District Court (District Court) affirmed a prior CPUC decision that Boulder cannot serve customers outside its city limits; these customers were included in Boulder’s plan at the time. The District Court also ruled the CPUC has jurisdiction over the transfer of any facilities to Boulder and in determining how the systems are separated. Further, the District Court found that the CPUC must give approval before Boulder files any condemnation proceeding. Boulder does not have authorization to initiate a condemnation proceeding at this time.
18
Boulder has filed multiple separation applications, the most recent one being in May 2017, which was challenged by PSCo and other intervenors. In September 2017, the CPUC issued a written decision, agreeing with several key aspects of PSCo’s position, stating PSCo is not required to undertake many of Boulder’s proposals, such as acting as a financier and contractor for Boulder. Additionally, the CPUC approved the designation of some electrical distribution assets for transfer, subject to Boulder completing certain items, including:
|
•
|
Filing an agreement between Boulder and PSCo providing permanent rights for PSCo to place and access facilities in Boulder needed to continue to serve its customers;
|
|
•
|
Filing a complete and accurate revised list of distribution assets desired to be transferred; and
|
|
•
|
Filing an agreement to address payments from Boulder to PSCo for costs of Boulder’s municipalization efforts.
|
Boulder has requested that the CPUC grant an extension through March 13, 2018 to complete such filings. Once those filings have been submitted, additional hearings may be held.
In November 2017, Boulder voters passed certain measures regarding Boulder’s pursuit of municipalization, including an extension and increase of the Utility Occupational Tax for funding Boulder’s exploration of municipalization.
MWTG —
PSCo, along with nine other electric service providers from the Rocky Mountain region, have been considering creating and operating a joint transmission tariff to increase wholesale market efficiency and improve regional transmission planning. In September 2017, the MWTG determined that membership in the SPP RTO could provide opportunities to reduce customer costs, and maximize resource and electric grid utilization. In October 2017, the MWTG commenced negotiations with SPP through the SPP public stakeholder process.
SPP’s Board of Directors and organizational groups have begun to address the MWTG’s proposed terms for integration into the SPP RTO. Should the MWTG decide to move forward, SPP would make filings with the FERC and PSCo would make filings with the CPUC and the FERC, in the later part of 2018. If approved, MWTG operations within the SPP RTO would not be expected to begin until late 2019 at the earliest. PSCo recently engaged a consultant to conduct an analysis of the benefits associated with membership in the SPP RTO. The analysis assumed gas price forecasts that are lower than gas price forecasts used by the other MWTG utilities in their analysis of the benefits associated with membership in the SPP RTO. PSCo is in the process of evaluating that analysis.
Energy Source Statistics
|
Year Ended Dec. 31
|
|||||||||||||||||
|
2017
|
2016
|
2015
|
|||||||||||||||
|
PSCo
|
Millions of
KWh
|
Percent of
Generation
|
Millions of
KWh
|
Percent of
Generation
|
Millions of
KWh
|
Percent of
Generation
|
|||||||||||
|
Coal
|
14,609
|
|
44
|
%
|
15,895
|
|
47
|
%
|
18,601
|
|
54
|
%
|
|||||
|
Natural Gas
|
9,195
|
|
28
|
|
8,632
|
|
25
|
|
7,948
|
|
23
|
|
|||||
|
Wind
(a)
|
7,804
|
|
24
|
|
8,106
|
|
24
|
|
6,699
|
|
19
|
|
|||||
|
Hydroelectric
|
624
|
|
2
|
|
1,179
|
|
3
|
|
662
|
|
2
|
|
|||||
|
Other
(b)
|
670
|
|
2
|
|
393
|
|
1
|
|
705
|
|
2
|
|
|||||
|
Total
|
32,902
|
|
100
|
%
|
34,205
|
|
100
|
%
|
34,615
|
|
100
|
%
|
|||||
|
Owned generation
|
23,053
|
|
70
|
%
|
22,753
|
|
67
|
%
|
22,981
|
|
66
|
%
|
|||||
|
Purchased generation
|
9,849
|
|
30
|
|
11,452
|
|
33
|
|
11,634
|
|
34
|
|
|||||
|
Total
|
32,902
|
|
100
|
%
|
34,205
|
|
100
|
%
|
34,615
|
|
100
|
%
|
|||||
|
(a)
|
This category includes wind energy de-bundled from RECs and also includes Windsource RECs. PSCo uses RECs to meet or exceed state resource requirements and may sell surplus RECs.
|
|
(b)
|
Distributed generation from the Solar*Rewards program is not included, and was approximately 393, 396 and 245 million net KWh for 2017, 2016, and 2015, respectively.
|
19
Fuel Supply and Costs
The following table shows the delivered cost per MMBtu of each significant category of fuel consumed for owned electric generation, the percentage of total fuel requirements represented by each category of fuel and the total weighted average cost of all fuels.
|
Coal
|
Natural Gas
|
Weighted Average Owned Fuel Cost
|
||||||||||||||||
|
PSCo Generating Plants
|
Cost
|
Percent
|
Cost
|
Percent
|
||||||||||||||
|
2017
|
$
|
1.56
|
|
70
|
%
|
$
|
3.82
|
|
30
|
%
|
$
|
2.25
|
|
|||||
|
2016
|
1.75
|
|
72
|
|
3.79
|
|
28
|
|
2.33
|
|
||||||||
|
2015
|
1.75
|
|
75
|
|
3.89
|
|
25
|
|
2.29
|
|
||||||||
See Items 1A and 7 for further discussion of fuel supply and costs.
Fuel Sources
Coal
—
PSCo normally maintains approximately 35 - 50 days of coal inventory. Coal supply inventories at Dec. 31, 2017 and 2016 were approximately 48 and 36 days of usage, respectively. PSCo has contracted for coal supply to provide 75 percent of its 9.1 million tons of estimated coal requirements in 2018, and a declining percentage of requirements in subsequent years. PSCo’s general coal purchasing objective is to contract for approximately 75 percent of requirements for the first year, 40 percent of requirements in year two, and 20 percent of requirements in year three. Remaining requirements will be filled through the procurement process or over-the-counter transactions.
PSCo has coal transportation contracts that provide for delivery of 100 percent its coal requirements in 2018 and 2019. Coal delivery may be subject to interruptions or reductions due to operation of the mines, transportation problems, weather and availability of equipment.
Natural gas
—
PSCo uses both firm and interruptible natural gas supply in combustion turbines and certain boilers. Natural gas supplies for PSCo’s power plants are procured under contracts to provide an adequate supply of fuel. However, as natural gas primarily serves intermediate and peak demand, any remaining forecasted requirements are able to be procured through a liquid spot market. The majority of natural gas supply under contract is covered by a long-term agreement with Anadarko Energy Services Company and the balance of natural gas supply contracts have variable pricing features tied to changes in various natural gas indices. PSCo hedges a portion of that risk through financial instruments. See Note 11 to the consolidated financial statements for further discussion.
Most transportation contract pricing is based on FERC approved transportation tariff rates. Certain natural gas supply and transportation agreements include obligations for the purchase and/or delivery of specified volumes of natural gas or to make payments in lieu of delivery.
|
•
|
At Dec. 31, 2017, PSCo’s commitments related to gas supply contracts, which expire between 2021 through 2023, were approximately $545 million and commitments related to gas transportation and storage contracts, which expire between 2018 through 2040, were approximately $620 million.
|
|
•
|
At Dec. 31, 2016, PSCo’s commitments related to gas supply contracts were approximately $654 million and commitments related to gas transportation and storage contracts were approximately $573 million.
|
PSCo has limited on-site fuel oil storage facilities and primarily relies on the spot market for incremental supplies.
20
Renewable Energy Sources
PSCo’s renewable energy portfolio includes wind, hydroelectric, biomass and solar power from both owned generating facilities and PPAs. As of Dec. 31, 2017, PSCo was in compliance with mandated RPS, which requires generation from renewable resources of 20.0 percent of electric retail sales.
Renewable energy as a percentage of PSCo’ total energy:
|
2017
|
2016
|
|||||
|
Renewable
|
27.7
|
%
|
28.3
|
%
|
||
|
Wind
|
23.7
|
|
23.7
|
|
||
|
Hydroelectric, biomass and solar
|
3.9
|
|
4.6
|
|
||
PSCo also offers customer-focused renewable energy initiatives. Windsource
®
allows customers to purchase electricity from renewable sources. The number of customers utilizing Windsource increased to approximately 50,000 in 2017 from 46,000 in 2016.
Additionally, to encourage the growth of solar energy on the system, customers are offered incentives to install solar panels on their homes and businesses under the Solar*Rewards
®
program. Over 34,900 PV systems with approximately 310 MW of aggregate capacity have been installed in Colorado as of Dec. 31, 2017 and over 32,500 PV systems with approximately 276 MW of aggregate capacity were installed as of Dec. 31, 2016. Additionally, 33 community solar gardens with 33.5 MW of capacity have been completed in Colorado as of Dec. 31, 2017.
Wind
— PSCo acquires the majority of its wind energy from PPAs. Currently, PSCo has 18 of these agreements in place, with facilities ranging in size from two MW to over 300 MW.
|
•
|
PSCo had approximately 2,560 MW of wind energy on its system at the end of 2017 and 2016. In addition to receiving purchased wind energy under these agreements, PSCo typically receives wind RECs which are used to meet state renewable resource requirements.
|
|
•
|
The average cost per MWh of wind energy under these contracts was approximately $42 in 2017 and 2016. The cost per MWh of wind energy varies by contract and may be influenced by a number of factors including regulation, state-specific renewable resource requirements, and the year of contract execution. Generally, previously executed contracts continued to benefit from improvements in wind technology, excess capacity among manufacturers, and motivation to commence new construction prior to the anticipated expiration of the federal PTCs. In December 2015, the federal PTCs were extended through 2019 with a phase down on sites that began construction in 2017.
|
Wholesale and Commodity Marketing Operations
PSCo conducts various wholesale marketing operations, including the purchase and sale of electric capacity, energy, ancillary services and energy related products. PSCo uses physical and financial instruments to minimize commodity price and credit risk and hedge sales and purchases. PSCo also engages in trading activity unrelated to hedging and sharing of any margins is determined through state regulatory proceedings as well as the operation of the FERC approved joint operating agreement. See Item 7 for further discussion.
21
SPS
Public Utility Regulation
Summary of Regulatory Agencies and Areas of Jurisdiction
—
The PUCT and NMPRC regulate SPS’ retail electric operations and have jurisdiction over its retail rates and services and the construction of transmission or generation in their respective states. The municipalities in which SPS operates in Texas have original jurisdiction over SPS’ rates in those communities. The municipalities’ rate setting decisions are subject to review by the PUCT, which has ultimate authority to set the rates SPS charges in the municipalities. The NMPRC also has jurisdiction over the issuance of securities. SPS is regulated by the FERC for its wholesale electric operations, accounting practices, wholesale sales for resale, the transmission of electricity in interstate commerce, compliance with NERC electric reliability standards, asset transactions and mergers, and natural gas transactions in interstate commerce. As approved by the FERC, SPS is a transmission-owning member of the SPP RTO and operates within the SPP RTO and SPP IM wholesale market. SPS is authorized to make wholesale electric sales at market-based prices.
Fuel, Purchased Energy and Conservation Cost-Recovery Mechanisms
—
SPS has several retail adjustment clauses that recover fuel, purchased energy and other resource costs:
|
•
|
DCRF
— Recovers distribution costs in Texas that are not included in base rates.
|
|
•
|
EECRF
— Recovers costs associated with providing energy efficiency programs in Texas.
|
|
•
|
EE rider
— Recovers costs associated with providing energy efficiency programs in New Mexico.
|
|
•
|
FPPCAC
— Adjusts monthly to recover the actual fuel and purchased power costs.
|
|
•
|
PCRF
— Allows recovery of certain purchased power costs in Texas that are not included in base rates.
|
|
•
|
RPS
— Recovers deferred costs associated with renewable energy programs in New Mexico.
|
|
•
|
TCRF
— Recovers certain transmission infrastructure improvement costs and changes in wholesale transmission charges in Texas that are not included in base rates.
|
Fuel and purchased energy costs are recovered in Texas through a fixed fuel and purchased energy recovery factor, which is part of SPS’ retail electric tariff. SO
2
and NOx allowance revenues and costs are also recovered through the fixed fuel and purchased energy recovery factor. The regulations allow retail fuel factors to change up to three times per year.
The fixed fuel and purchased energy recovery factor provides for the over- or under-recovery of fuel and purchased energy expenses. Regulations also require refunding or surcharging over- or under- recovery amounts, including interest, when they exceed four percent of the utility’s annual fuel and purchased energy costs on a rolling 12-month basis, if this condition is expected to continue.
PUCT regulations require periodic examination of SPS’ fuel and purchased energy costs, the efficient use of fuel and purchased energy, fuel acquisition and management policies and purchased energy commitments. SPS is required to file an application for the PUCT to retrospectively review fuel and purchased energy costs at least every three years. In June 2016, SPS filed its fuel reconciliation application which reconciled fuel and purchased power costs for 2013 through 2015. In March 2017, the PUCT approved the application.
SPS recovers fuel and purchased energy costs from its wholesale customers through a monthly wholesale fuel and purchased economic energy cost adjustment clause accepted for filing by the FERC.
Capacity and Demand
Uninterrupted system peak demand for SPS for each of the last three years and the forecast for 2018, assuming normal weather conditions, is as follows:
|
System Peak Demand (in MW)
|
|||||||||||
|
2017
|
2016
|
2015
|
2018 Forecast
|
||||||||
|
SPS
|
4,374
|
|
4,836
|
|
4,678
|
|
4,483
|
|
|||
22
The peak demand for the SPS system typically occurs in the summer. The 2017 system peak demand for SPS occurred on July 26, 2017. The decline in peak load from 2016 to 2017 is in part due to cooler weather in 2017. Additionally, the partial requirement contract with Golden Spread ended May 2017, contributing to the lower actual peak demand for SPS.
The 2018 forecast assumes normal peak day weather.
Energy Sources and Related Transmission Initiatives
SPS expects to use existing electric generating stations, power purchases, DSM and new generation options to meet its system capacity requirements. In addition, SPS has evaluated water supply issues at its Tolk facility, concluding that additional resource investment will be required to operate the plant through its existing life. The Ogallala aquifer in this region of the country has depleted more rapidly than expected and SPS installed a horizontal water well that could help to delay the need for a more substantial investment solution. As a result of this issue and to a lesser extent, future environmental rules facing the plant, SPS is seeking a decrease to the remaining life of the facility in its current Texas and New Mexico rate case proceedings (see Note 12).
Purchased Power
—
SPS has contracts to purchase power from other utilities and IPPs. Long-term purchased power contracts typically require a periodic capacity charge and an energy charge for energy actually purchased. SPS also makes short-term purchases to meet system load and energy requirements, to replace generation from company-owned units under maintenance or during outages, to meet operating reserve obligations or to obtain energy at a lower cost.
Purchased Transmission Services
—
SPS has contractual arrangements with SPP and regional transmission service providers to deliver power and energy to its native load customers.
TUCO Substation to Yoakum County Substation to Hobbs Plant Substation 345 KV Transmission Line
—
In 2014, SPP evaluated anticipated transmission needs for certain parts of the SPP region which is commonly known as the High Priority Incremental Load Study. As a result, SPS received 44 transmission projects, with an original estimated cost of $557 million. The most significant of these projects are the TUCO Substation to the Yoakum County Substation to the Hobbs Plant Substation and the Hobbs Plant Substation to the China Draw Substation transmission line projects.
In 2016 and 2017, SPS received CCNs for the three segments of the TUCO Substation to Yoakum County Substation to Hobbs Plant Substation 345 KV transmission line, which are expected to be in service in the second quarter of 2020. This 345 KV transmission line is part of a larger project which includes an additional 345 KV transmission line from the Hobbs Plant Substation to the China Draw Substation, which was approved by the NMPRC in 2016 and is anticipated to be in service by June 2018. The estimated total investment for these transmission lines is approximately $402 million.
Wind Proposals
— In March 2017, SPS filed proposals with the NMPRC and the PUCT to build, own and operate 1,000 MW of new wind generation through two wind farms for a cost of approximately $1.6 billion. In addition, the proposal includes a PPA for 230 MW of wind.
In December 2017, SPS and parties filed a unanimous stipulation with the NMPRC. The stipulation is subject to approval by the NMPRC. The key terms of the stipulation are listed below:
|
•
|
An investment cap of $1,675 per KW, which is equal to 102.5 percent of the estimated construction costs;
|
|
•
|
SPS customers would receive a credit to their bills if actual capacity factors fall below 48 percent;
|
|
•
|
SPS customers would receive 100 percent of the federal PTC; and
|
|
•
|
SPS can file a HTY rate case and include projected capital additions for the wind farms five months beyond the end of the test year. Interim rates would also be made effective 30 days after filing which will allow SPS to closely match the start of cost recovery for that wind farm with the in service date.
|
On Feb. 9, 2018, the Hearing Examiner issued a certification of stipulation (certification) recommending approval of all but one aspect of the stipulation, which is the provision for interim rate recovery of SPS’ investment in the two wind farms. On Feb. 19, 2018, SPS filed exceptions to the recommended decision, as did other parties to the stipulation.
In addition, SPS has reached a settlement in principle with parties in Texas and is working towards finalizing a stipulation. SPS has shared an updated analysis with all parties which shows the wind projects remain cost-effective following the passage of the TCJA. The settlements require approval by the NMPRC and PUCT. Both commissions are expected to rule on the settlements by the end of the first quarter of 2018. The Hale wind project in Texas and the Sagamore wind project in New Mexico are scheduled to be in service by mid-2019 and year-end 2020, respectively.
23
Lubbock Power & Light’s (LP&L’s) Request for Participation in ERCOT —
In September 2017, LP&L filed its application with the PUCT and proposed to transition a portion of its load to ERCOT no later than June 2021. As a result of LP&L’s proposal, approximately $18 million in wholesale transmission revenue would be reallocated to remaining SPS transmission customers at the time of the load transition. In November 2017, SPS and various other parties, including the PUCT Staff, filed direct testimony in response to LP&L’s application. SPS proposed an Interconnection Switching Fee to be determined by the PUCT.
In February 2018, SPS, LP&L, the PUCT Staff and various other parties filed a stipulation that provides SPS’ customers with an Interconnection Switching Fee of approximately $24 million to compensate them for the transfer of LP&L’s load from SPP to ERCOT. Under the settlement, SPS would allocate the Interconnection Switching Fee to its Texas and New Mexico retail and wholesale transmission customers through a bill credit following LP&L’s load transition to ERCOT (tentatively, June 2021). A PUCT decision is expected in March 2018. No final decision regarding LP&L’s departure or its potential timing is expected until completion of the PUCT proceedings.
Texas State ROFR Request for Declaratory Order —
In February 2017, SPS and SPP filed a joint petition with the PUCT for a declaratory order regarding SPS’ ROFR. SPS contended that Texas law grants an incumbent electric utility, operating in areas outside of ERCOT, the ROFR to construct new transmission facilities located in the utility’s service area. SPP stated that Texas law does not provide a clear statement regarding the ROFR for incumbent utilities and therefore SPP was abiding by the portion of its OATT, which requires competitive solicitation to construct and operate new transmission facilities within areas of Texas’ SPP footprint.
In October 2017, the PUCT issued an order finding that SPS does not possess an exclusive right to construct and operate transmission facilities within its service area. In January 2018, SPS and two other parties filed appeals of the PUCT’s order in the Texas State District Court. The appeals have been consolidated. A schedule has not been set for the case.
Energy Source Statistics
|
Year Ended Dec. 31
|
|||||||||||||||||
|
2017
|
2016
|
2015
|
|||||||||||||||
|
SPS
|
Millions of
KWh
|
Percent of
Generation
|
Millions of
KWh
|
Percent of
Generation
|
Millions of
KWh
|
Percent of
Generation
|
|||||||||||
|
Coal
|
10,999
|
|
40
|
%
|
10,990
|
|
39
|
%
|
12,441
|
|
44
|
%
|
|||||
|
Natural Gas
|
9,950
|
|
36
|
|
10,909
|
|
38
|
|
10,514
|
|
36
|
|
|||||
|
Wind
(a)
|
5,828
|
|
21
|
|
6,120
|
|
22
|
|
5,252
|
|
19
|
|
|||||
|
Other
(b)
|
770
|
|
3
|
|
347
|
|
1
|
|
150
|
|
1
|
|
|||||
|
Total
|
27,547
|
|
100
|
%
|
28,366
|
|
100
|
%
|
28,357
|
|
100
|
%
|
|||||
|
Owned generation
|
12,845
|
|
47
|
%
|
15,015
|
|
53
|
%
|
16,480
|
|
58
|
%
|
|||||
|
Purchased generation
|
14,702
|
|
53
|
|
13,351
|
|
47
|
|
11,877
|
|
42
|
|
|||||
|
Total
|
27,547
|
|
100
|
%
|
28,366
|
|
100
|
%
|
28,357
|
|
100
|
%
|
|||||
|
(a)
|
This category includes wind energy de-bundled from RECs and also includes Windsource RECs. SPS uses RECs to meet or exceed state resource requirements and may sell surplus RECs.
|
|
(b)
|
Distributed generation from the Solar*Rewards program is not included, was approximately 26, 14 and 13 million net KWh for 2017, 2016, and 2015, respectively.
|
Fuel Supply and Costs
The following table shows the delivered cost per MMBtu of each significant category of fuel consumed for owned electric generation, the percentage of total fuel requirements represented by each category of fuel and the total weighted average cost of all fuels.
|
Coal
|
Natural Gas
|
Weighted
Average Owned Fuel Cost
|
||||||||||||||||
|
SPS Generating Plants
|
Cost
|
Percent
|
Cost
|
Percent
|
||||||||||||||
|
2017
|
$
|
2.18
|
|
74
|
%
|
$
|
3.39
|
|
26
|
%
|
$
|
2.50
|
|
|||||
|
2016
|
2.12
|
|
70
|
|
2.81
|
|
30
|
|
2.32
|
|
||||||||
|
2015
|
2.12
|
|
73
|
|
3.11
|
|
27
|
|
2.39
|
|
||||||||
See Items 1A and 7 for further discussion of fuel supply and costs.
24
Fuel Sources
Coal
—
SPS purchases all of the coal requirements for its two coal facilities, Harrington and Tolk electric generating stations, from TUCO. TUCO arranges for the purchase, receiving, transporting, unloading, handling, crushing, weighing and delivery of coal to meet SPS’ requirements. TUCO is responsible for negotiating and administering contracts with coal suppliers, transporters and handlers. The coal supply contract with TUCO expires on Dec. 31, 2022 for both Harrington and Tolk.
SPS normally maintains approximately 35 - 50 days of coal inventory. As of Dec. 31, 2017 and 2016, coal inventories at SPS were approximately 52 and 64 day supply, respectively. Milder weather, purchase commitments and relatively low power and natural gas prices resulted in coal inventories being above optimal levels. SPS’ generation stations primarily use low-sulfur western coal from mines operating in Wyoming. TUCO has coal agreements to supply 79 percent of SPS’ estimated coal requirements in 2018 and a declining percentage of requirements in subsequent years. SPS’ general coal purchasing objective is to contract for approximately 75 percent of requirements for the first year, 40 percent of requirements in year two and 20 percent of requirements in year three.
Natural gas
—
SPS uses both firm and interruptible natural gas supply in combustion turbines and certain boilers. Natural gas for SPS’ power plants is procured under contracts to provide an adequate supply of fuel, which typically is purchased with terms of one year or less. The transportation and storage contracts expire between 2018 to 2033. All of the natural gas supply contracts have variable pricing that is tied to various natural gas indices.
Most transportation contract pricing is based on FERC and Railroad Commission of Texas approved transportation tariff rates. Certain natural gas supply and transportation agreements include obligations for the purchase and/or delivery of specified volumes of natural gas or to make payments in lieu of delivery. SPS’ commitments related to gas supply contracts were approximately $11 million and $17 million and commitments related to gas transportation and storage contracts were approximately $191 million and $161 million at Dec. 31, 2017 and 2016, respectively.
SPS has limited on-site fuel oil storage facilities and primarily relies on the spot market for incremental supplies.
Renewable Energy Sources
SPS’ renewable energy portfolio includes wind and solar power from PPAs. As of Dec. 31, 2017, SPS is in compliance with mandated RPS, which require generation from renewable resources of 3.7 percent of Texas electric retail sales and 15.0 percent of New Mexico electric retail sales.
Renewable energy as a percentage of SPS’ total energy:
|
2017
|
2016
|
|||||
|
Renewable
|
24.0
|
%
|
22.8
|
%
|
||
|
Wind
|
21.2
|
|
21.6
|
|
||
|
Solar
|
1.8
|
|
1.2
|
|
||
SPS also offers customer-focused renewable energy initiatives. Windsource
®
allows customers in New Mexico to purchase electricity from renewable sources. The number of customers utilizing Windsource increased to approximately 940 in 2017 from 900 in 2016.
Wind
— SPS acquires its wind energy from IPP contracts and QF tariffs. SPS currently has 24 of these agreements in place, with facilities ranging in size from under two MW to 250 MW.
|
•
|
SPS had approximately 1,500 MW of wind energy on its system at the end of 2017 and 2016. In addition to receiving purchased wind energy under these agreements, SPS typically receives wind RECs on certain agreements which are used to meet state renewable resource requirements.
|
|
•
|
The average cost per MWh of wind energy under the IPP contracts and QF tariffs was approximately $27 for 2017 and $25 for 2016. The cost per MWh of wind energy varies by contract and may be influenced by a number of factors including regulation, state-specific renewable resource requirements and the year of contract execution. Generally, contracts executed in 2017 continued to benefit from improvements in technology, excess capacity among manufacturers, and motivation to commence new construction prior to the anticipated expiration of the federal PTCs. In December 2015, the federal PTCs were extended through 2019 with a phase down on sites that began construction in 2017.
|
25
Wholesale and Commodity Marketing Operations
SPS conducts various wholesale marketing operations, including the purchase and sale of electric capacity, energy, ancillary services and energy related products. SPS uses physical and financial instruments to minimize commodity price and credit risk and hedge sales and purchases. See Item 7 for further discussion.
Summary of Recent Federal Regulatory
Developments
The FERC has jurisdiction over rates for electric transmission service in interstate commerce and electricity sold at wholesale, hydro facility licensing, natural gas transportation, asset transactions and mergers, accounting practices and certain other activities of Xcel Energy Inc.’s utility subsidiaries and TransCos, including enforcement of NERC mandatory electric reliability standards. State and local agencies have jurisdiction over many of Xcel Energy Inc.’s utility subsidiaries’ activities, including regulation of retail rates and environmental matters. In addition to the matters discussed below, see Note 12 to the accompanying consolidated financial statements for a discussion of other regulatory matters.
Xcel Energy attempts to mitigate the risk of regulatory penalties through formal training on prohibited practices and a compliance function that reviews interaction with the markets under FERC and CFTC jurisdictions. Public campaigns are conducted to raise awareness of the public safety issues of interacting with our electric systems. While programs to comply with regulatory requirements are in place, there is no guarantee the compliance programs or other measures will be sufficient to ensure against violations.
FERC Order, ROE Policy
— In June 2014, the FERC adopted a two-step ROE methodology for electric utilities in an order issued in a complaint proceeding involving New England Transmission Owners (NETOs). The issue of how to apply the FERC ROE methodology has been contested in various complaint proceedings, including two ROE complaints involving the MISO TOs, which include NSP-Minnesota and NSP-Wisconsin. In April 2017, the District of Columbia Circuit (D.C. Circuit) vacated and remanded the June 2014 ROE order. The D.C. Circuit found that the FERC had not properly determined that the ROE authorized for the NETOs prior to June 2014 was unjust and unreasonable. The D.C. Circuit also found that the FERC failed to justify the new ROE methodology. The FERC has yet to act on the D.C. Circuit’s decision. See Note 12 to the consolidated financial statements for discussion of the D.C. Circuit’s decision and the impact on the MISO ROE Complaints.
DOE Grid Resiliency Notice of Proposed Rule (NOPR)
— In September 2017, the DOE requested the FERC to consider and adopt a Grid Resiliency and Pricing Rule to address threats to the U.S. electrical grid. Under the proposed rule, coal and nuclear generation facilities would have to meet certain criteria to qualify for full recovery of their costs including a fair rate of return. In January 2018, the FERC rejected the DOE’s proposal, but alternatively initiated an inquiry into how RTOs and Independent System Operators address grid resilience. Efforts to resolve U.S. grid resilience issues may result from this proceeding and Xcel Energy plans to monitor and respond as necessary.
Public Utility Regulatory Policies Act (PURPA) Enforcement Complaint against CPUC
—
In December 2016, Sustainable Power Group, LLC (sPower) petitioned the FERC to initiate an enforcement action in federal court against the CPUC under PURPA. The petition asserts that a December 2016 CPUC ruling, which indicated that a QF must be a successful bidder in a PSCo resource acquisition bidding process, violated PURPA and FERC rules. In January 2017, PSCo filed a motion to intervene and protest, arguing that the FERC should decline the petition. The CPUC filed a similar pleading. sPower has proposed to construct 800 MW of solar generation and 700 MW of wind generation in Colorado and seeks to require PSCo to contract for these resources under PURPA.
If sPower were to prevail, PSCo’s ability to select generation resources through competitive bidding would be negatively affected. However, due to a lack of quorum at the FERC, the FERC did not act on that petition within the sixty days contemplated by PURPA.
Subsequently sPower filed a complaint for declaratory and injunctive relief in the United States District Court for the District of Colorado (District Court) requesting that the court find the bidding requirement in the CPUC QF rules to be unlawful. PSCo intervened in that proceeding and the CPUC filed a motion to dismiss. In June 2017, the United States Magistrate Judge issued a recommendation to the District Court that sPower’s complaint be dismissed because sPower failed to establish that it faced a substantial risk of harm. In October 2017, the District Court denied the CPUC’s motion to dismiss and instead allowed sPower to file an amended complaint. The case effectively started over and PSCo intervened. The CPUC filed a motion to dismiss the amended complaint which is currently pending before the District Court. The timing of a resolution in this case is unclear.
26
Electric Operating Statistics
Electric Sales Statistics
|
Year Ended Dec. 31
|
|||||||||||
|
2017
|
2016
|
2015
|
|||||||||
|
Electric sales (Millions of KWh)
|
|||||||||||
|
Residential
|
24,216
|
|
24,726
|
|
24,498
|
|
|||||
|
Large C&I
|
27,951
|
|
27,664
|
|
27,719
|
|
|||||
|
Small C&I
|
35,493
|
|
35,830
|
|
35,806
|
|
|||||
|
Public authorities and other
|
1,055
|
|
1,103
|
|
1,071
|
|
|||||
|
Total retail
|
88,715
|
|
89,323
|
|
89,094
|
|
|||||
|
Sales for resale
|
18,349
|
|
18,694
|
|
15,283
|
|
|||||
|
Total energy sold
|
107,064
|
|
108,017
|
|
104,377
|
|
|||||
|
Number of customers at end of period
|
|||||||||||
|
Residential
|
3,082,974
|
|
3,053,732
|
|
3,023,494
|
|
|||||
|
Large C&I
|
1,241
|
|
1,228
|
|
1,229
|
|
|||||
|
Small C&I
|
433,883
|
|
432,012
|
|
429,617
|
|
|||||
|
Public authorities and other
|
69,376
|
|
68,935
|
|
68,595
|
|
|||||
|
Total retail
|
3,587,474
|
|
3,555,907
|
|
3,522,935
|
|
|||||
|
Wholesale
|
58
|
|
52
|
|
47
|
|
|||||
|
Total customers
|
3,587,532
|
|
3,555,959
|
|
3,522,982
|
|
|||||
|
Electric revenues (Millions of Dollars)
|
|||||||||||
|
Residential
|
$
|
2,975
|
|
$
|
2,966
|
|
$
|
2,891
|
|
||
|
Large C&I
|
1,779
|
|
1,707
|
|
1,690
|
|
|||||
|
Small C&I
|
3,463
|
|
3,328
|
|
3,304
|
|
|||||
|
Public authorities and other
|
143
|
|
140
|
|
137
|
|
|||||
|
Total retail
|
8,360
|
|
8,141
|
|
8,022
|
|
|||||
|
Wholesale
|
719
|
|
693
|
|
660
|
|
|||||
|
Other electric revenues
|
597
|
|
666
|
|
594
|
|
|||||
|
Total electric revenues
|
$
|
9,676
|
|
$
|
9,500
|
|
$
|
9,276
|
|
||
|
KWh sales per retail customer
|
24,729
|
|
25,120
|
|
25,290
|
|
|||||
|
Revenue per retail customer
|
$
|
2,330
|
|
$
|
2,289
|
|
$
|
2,277
|
|
||
|
Residential revenue per KWh
|
|
12.29
|
¢
|
|
11.99
|
¢
|
|
11.80
|
¢
|
||
|
Large C&I revenue per KWh
|
6.36
|
|
6.17
|
|
6.10
|
|
|||||
|
Small C&I revenue per KWh
|
9.76
|
|
9.29
|
|
9.23
|
|
|||||
|
Total retail revenue per KWh
|
9.42
|
|
9.11
|
|
9.00
|
|
|||||
|
Wholesale revenue per KWh
|
3.92
|
|
3.71
|
|
4.32
|
|
|||||
27
Energy Source Statistics
|
Year Ended Dec. 31
|
|||||||||||||||||
|
2017
|
2016
|
2015
|
|||||||||||||||
|
Xcel Energy
|
Millions of
KWh
|
Percent of
Generation
|
Millions of
KWh
|
Percent of
Generation
|
Millions of
KWh
|
Percent of
Generation
|
|||||||||||
|
Coal
|
40,344
|
|
36
|
%
|
40,566
|
|
36
|
%
|
47,003
|
|
43
|
%
|
|||||
|
Natural Gas
|
24,932
|
|
23
|
|
27,351
|
|
25
|
|
25,151
|
|
23
|
|
|||||
|
Wind
(a)
|
22,526
|
|
21
|
|
22,123
|
|
20
|
|
18,186
|
|
17
|
|
|||||
|
Nuclear
|
14,168
|
|
13
|
|
14,191
|
|
13
|
|
12,895
|
|
12
|
|
|||||
|
Hydroelectric
|
3,866
|
|
4
|
|
4,435
|
|
4
|
|
4,001
|
|
4
|
|
|||||
|
Other
(b)
|
3,329
|
|
3
|
|
2,167
|
|
2
|
|
1,456
|
|
1
|
|
|||||
|
Total
|
109,165
|
|
100
|
%
|
110,833
|
|
100
|
%
|
108,692
|
|
100
|
%
|
|||||
|
Owned generation
|
72,539
|
|
66
|
%
|
74,149
|
|
67
|
%
|
73,279
|
|
67
|
%
|
|||||
|
Purchased generation
|
36,626
|
|
34
|
|
36,684
|
|
33
|
|
35,413
|
|
33
|
|
|||||
|
Total
|
109,165
|
|
100
|
%
|
110,833
|
|
100
|
%
|
108,692
|
|
100
|
%
|
|||||
|
(a)
|
This category includes wind energy de-bundled from RECs and also includes Windsource RECs. Xcel Energy uses RECs to meet or exceed state resource requirements and may sell surplus RECs.
|
|
(b)
|
Includes energy from other sources, including solar, biomass, oil and refuse. Distributed generation from the Solar*Rewards program is not included, and was approximately 435, 430 and 266 million net KWh for 2017, 2016 and 2015, respectively.
|
NATURAL GAS UTILITY OPERATIONS
Overview
Xcel Energy operates natural gas local distribution companies in six states, including Minnesota, Wisconsin, Michigan, South Dakota, North Dakota, and Colorado with PSCo being the largest. The most significant developments in the natural gas operations of the utility subsidiaries are uncertainty regarding political and regulatory developments that impact hydraulic fracturing, safety requirements for natural gas pipelines and the continued trend of declining use per residential and small C&I customer, as a result of improved building construction technologies, higher appliance efficiencies and conservation. From 2000 to 2017, average annual sales to the typical residential customer declined 17 percent, while sales to the typical small C&I customer declined 10 percent, each on a weather-normalized basis. Although wholesale price increases do not directly affect earnings because of natural gas cost-recovery mechanisms, high prices can encourage further efficiency efforts by customers.
The PHMSA
Pipeline Safety Act
—
The Pipeline Safety, Regulatory Certainty, and Job Creation Act (Pipeline Safety Act) requires additional verification of pipeline infrastructure records by pipeline owners and operators to confirm the maximum allowable operating pressure of lines located in high consequence areas or more-densely populated areas. In April 2016, the PHMSA released proposed rules that address this verification requirement along with a number of other significant changes to gas transmission regulations. These changes include requirements around use of automatic or remote-controlled shut-off valves, testing of certain previously untested transmission lines and expanding integrity management requirements. The Pipeline Safety Act also includes a maximum penalty for violating pipeline safety rules of $2 million per day for related violations.
PHMSA is currently working through the rule with its Pipeline Advisory Committee. Current estimates are the rule will likely go into effect in late 2018 or early 2019.
Xcel Energy has been taking actions that were intended to comply with the Pipeline Safety Act and any related PHMSA regulations as they become effective. PSCo and NSP-Minnesota can generally recover costs to comply with the transmission and distribution integrity management programs through the PSIA and GUIC riders, respectively.
28
NSP-Minnesota
Public Utility Regulation
Summary of Regulatory Agencies and Areas of Jurisdiction
—
Retail rates, services and other aspects of NSP-Minnesota’s retail natural gas operations are regulated by the MPUC and the NDPSC within their respective states. The MPUC has regulatory authority over security issuances, certain property transfers, mergers with other utilities and transactions between NSP-Minnesota and its affiliates. In addition, the MPUC reviews and approves NSP-Minnesota’s natural gas supply plans for meeting customers’ future energy needs. NSP-Minnesota is subject to the jurisdiction of the FERC with respect to certain natural gas transactions in interstate commerce. NSP-Minnesota is subject to the DOT, the Minnesota Office of Pipeline Safety, the NDPSC and the SDPUC for pipeline safety compliance, including pipeline facilities used in electric utility operations for fuel deliveries.
Purchased Gas and Conservation Cost-Recovery Mechanisms
—
NSP-Minnesota’s retail natural gas rates for Minnesota and North Dakota include a PGA clause that provides for prospective monthly rate adjustments to reflect the forecasted cost of purchased natural gas, transportation service and storage service. The annual difference between the natural gas cost revenues collected through PGA rates and the actual natural gas costs is collected or refunded over the subsequent 12-month period.
NSP-Minnesota also recovers costs associated with transmission and distribution pipeline integrity management programs through its GUIC rider. Costs recoverable under the GUIC rider include funding for pipeline assessments as well as deferred costs from NSP-Minnesota’s existing sewer separation and pipeline integrity management programs. The MPUC and NDPSC have the authority to disallow recovery of certain costs if they find the utility was not prudent in its procurement activities.
Minnesota state law requires utilities to invest 0.5 percent of their state natural gas revenues in CIP. These costs are recovered through customer base rates and an annual cost-recovery mechanism for the CIP expenditures.
Capability and Demand
Natural gas supply requirements are categorized as firm or interruptible (customers with an alternate energy supply). The maximum daily send-out (firm and interruptible) for NSP-Minnesota was 893,062 MMBtu, which occurred on Dec. 26, 2017 and 800,232 MMBtu, which occurred on Jan. 18, 2016.
NSP-Minnesota purchases natural gas from independent suppliers, generally based on market indices that reflect current prices. The natural gas is delivered under transportation agreements with interstate pipelines. These agreements provide for firm deliverable pipeline capacity of 640,489 MMBtu per day. In addition, NSP-Minnesota contracts with providers of underground natural gas storage services. These agreements provide storage for approximately 26 percent of winter natural gas requirements and 29 percent of peak day firm requirements of NSP-Minnesota.
NSP-Minnesota also owns and operates one LNG plant with a storage capacity of 2.0 Bcf equivalent and three propane-air plants with a storage capacity of 1.3 Bcf equivalent to help meet its peak requirements. These peak-shaving facilities have production capacity equivalent to 246,000 MMBtu of natural gas per day, or approximately 30 percent of peak day firm requirements. LNG and propane-air plants provide a cost-effective alternative to annual fixed pipeline transportation charges to meet the peaks caused by firm space heating demand on extremely cold winter days.
NSP-Minnesota is required to file for a change in natural gas supply contract levels to meet peak demand, to redistribute demand costs among classes, or to exchange one form of demand for another. In February 2017, the MPUC approved NSP-Minnesota’s contract demand levels for the 2016 through 2017 heating season. Demand levels for the 2017 through 2018 heating season were filed with the MPUC in August 2017.
Natural Gas Supply and Costs
NSP-Minnesota actively seeks natural gas supply, transportation and storage alternatives to yield a diversified portfolio that provides increased flexibility, decreased interruption and financial risk and economical rates. In addition, NSP-Minnesota conducts natural gas price hedging activity that has been approved by the MPUC.
29
The following table summarizes the average delivered cost per MMBtu of natural gas purchased for resale by NSP-Minnesota’s regulated retail natural gas distribution business:
|
2017
|
$
|
3.89
|
|
|
2016
|
3.47
|
|
|
|
2015
|
4.07
|
|
|
The cost of natural gas in 2017 increased due to higher wholesale commodity prices.
NSP-Minnesota has firm natural gas transportation contracts with several pipelines, which expire in various years from 2018 through 2033.
NSP-Minnesota has certain natural gas supply, transportation and storage agreements that include obligations for the purchase and/or delivery of specified volumes of natural gas or to make payments in lieu of delivery. At Dec. 31, 2017, NSP-Minnesota was committed to approximately $439 million in such obligations under these contracts.
NSP-Minnesota purchases firm natural gas supply utilizing long-term and short-term agreements from approximately 27 domestic and Canadian suppliers. This diversity of suppliers and contract lengths allows NSP-Minnesota to maintain competition from suppliers and minimize supply costs.
See Items 1A and 7 for further discussion of natural gas supply and costs.
NSP-Wisconsin
Public Utility Regulation
Summary of Regulatory Agencies and Areas of Jurisdiction
—
NSP-Wisconsin is regulated by the PSCW and the MPSC. The PSCW has a biennial base-rate filing requirement. By June of each odd-numbered year, NSP-Wisconsin must submit a rate filing for the test year period beginning the following January. NSP-Wisconsin is subject to the jurisdiction of the FERC with respect to certain natural gas transactions in interstate commerce. NSP-Wisconsin is subject to the DOT, the PSCW and the MPSC for pipeline safety compliance.
Natural Gas Cost-Recovery Mechanisms
—
NSP-Wisconsin has a retail PGA cost-recovery mechanism for Wisconsin operations to recover the actual cost of natural gas and transportation and storage services. The PSCW has the authority to disallow certain costs if it finds NSP-Wisconsin was not prudent in its procurement activities.
NSP-Wisconsin’s natural gas rate schedules for Michigan customers include a natural gas cost-recovery factor, which is based on 12-month projections and trued-up to the actual amounts on an annual basis.
Capability and Demand
Natural gas supply requirements are categorized as firm or interruptible (customers with an alternate energy supply). The maximum daily send-out (firm and interruptible) for NSP-Wisconsin was 160,170 MMBtu, which occurred on Dec. 26,
2017
and 155,583 MMBtu, which occurred on Jan. 18, 2016.
NSP-Wisconsin purchases natural gas from independent suppliers, generally based on market indices that reflect current prices. The natural gas is delivered under transportation agreements with interstate pipelines. These agreements provide for firm deliverable pipeline capacity of approximately 139,293 MMBtu per day. In addition, NSP-Wisconsin contracts with providers of underground natural gas storage services. These agreements provide storage for approximately 33 percent of winter natural gas requirements and 34 percent of peak day firm requirements of NSP-Wisconsin.
30
NSP-Wisconsin also owns and operates one LNG plant with a storage capacity of 270,000 Mcf equivalent to help meet its peak requirements. This peak-shaving facility has a production capacity equivalent to 18,000 MMBtu of natural gas per day, or approximately 12 percent of peak day firm requirements. LNG plants provide a cost-effective alternative to annual fixed pipeline transportation charges to meet the peaks caused by firm space heating demand on extremely cold winter days.
NSP-Wisconsin is required to file a natural gas supply plan with the PSCW annually to change natural gas supply contract levels to meet peak demand. NSP-Wisconsin’s winter 2017-2018 supply plan was approved by the PSCW in October 2017.
Natural Gas Supply and Costs
NSP-Wisconsin actively seeks natural gas supply, transportation and storage alternatives to yield a diversified portfolio that provides increased flexibility, decreased interruption and financial risk and economical rates. In addition, NSP-Wisconsin conducts natural gas price hedging activity that has been approved by the PSCW.
The following table summarizes the average delivered cost per MMBtu of natural gas purchased for resale by NSP-Wisconsin’s regulated retail natural gas distribution business:
|
2017
|
$
|
3.88
|
|
|
2016
|
3.62
|
|
|
|
2015
|
4.11
|
|
|
The cost of natural gas in 2017 increased due to higher commodity prices.
The cost of natural gas supply, transportation service and storage service is recovered through various cost-recovery adjustment mechanisms. NSP-Wisconsin has firm natural gas transportation contracts with several pipelines, which expire in various years from 2018 through 2029.
NSP-Wisconsin ha
s certain natural gas supply, transportation and storage agreements that include obligations for the purchase and/or delivery of specified volumes of natural gas or to make payments in lieu of delivery. At Dec. 31, 2017, NSP-Wisconsin was committed to approximately $84 million in such obligatio
ns under these contracts.
NSP-Wisconsin purchased firm natural gas supply utilizing long-term and short-term agreements from approximately
10 domestic and Canadian suppliers. This diversity of suppliers and contract lengths allows NSP-Wisconsin to maintain competition from suppliers and minimize supply costs.
See Items 1A and 7 for further discussion of natural gas supply and costs.
PSCo
Public Utility Regulation
Summary of Regulatory Agencies and Areas of Jurisdiction
—
PSCo is regulated by the CPUC with respect to its facilities, rates, accounts, services and issuance of securities. PSCo holds a FERC certificate that allows it to transport natural gas in interstate commerce without PSCo becoming subject to full FERC jurisdiction under the Federal Natural Gas Act. PSCo is subject to the DOT and the CPUC with regards to pipeline safety compliance.
Purchased Natural Gas and Conservation Cost-Recovery Mechanisms
—
PSCo has retail adjustment clauses that recover purchased natural gas and other resource costs:
|
•
|
GCA
— Recovers the actual costs of purchased natural gas and transportation to meet the requirements of its customers and is revised quarterly to allow for changes in natural gas rates.
|
|
•
|
DSMCA
— Recovers costs of DSM and performance initiatives to achieve various energy savings goals.
|
|
•
|
PSIA
— Recovers costs associated with transmission and distribution pipeline integrity management programs and two projects to replace large transmission pipelines.
|
31
Capability and Demand
Natural gas supply requirements are categorized as firm or interruptible (customers with an alternate energy supply). The maximum daily send-out (firm and interruptible) for PSCo was 1,948,167 MMBtu, which occurred on Jan. 5, 2017 and 1,932,070 MMBtu, which occurred on Dec. 17, 2016.
PSCo purchases natural gas from independent suppliers, generally based on market indices that reflect current prices. The natural gas is delivered under transportation agreements with interstate pipelines. These agreements provide for firm deliverable pipeline capacity of approximately 1,818,151 MMBtu per day, which includes 854,852 MMBtu of natural gas held under third-party underground storage agreements. In addition, PSCo operates three company-owned underground storage facilities, which provide approximately 43,500 MMBtu of natural gas supplies on a peak day. The balance of the quantities required to meet firm peak day sales obligations are primarily purchased at PSCo’s city gate meter stations.
PSCo is required by CPUC regulations to file a natural gas purchase plan each year projecting and describing the quantities of natural gas supplies, upstream services and the costs of those supplies and services for the 12-month period of the following year. PSCo is also required to file a natural gas purchase report by October of each year reporting actual quantities and costs incurred for natural gas supplies and upstream services for the previous 12-month period.
Natural Gas Supply and Costs
PSCo actively seeks natural gas supply, transportation and storage alternatives to yield a diversified portfolio that provides increased flexibility, decreased interruption and financial risk and economical rates. In addition, PSCo conducts natural gas price hedging activities that have been approved by the CPUC.
The following table summarizes the average delivered cost per MMBtu of natural gas purchased for resale by PSCo’s regulated retail natural gas distribution business:
|
2017
|
$
|
3.45
|
|
|
2016
|
3.27
|
|
|
|
2015
|
3.92
|
|
|
The cost of natural gas in 2017 increased due to higher wholesale commodity prices.
PSCo has natural gas supply, transportation and storage agreements that include obligations for the purchase and/or delivery of specified volumes of natural gas or to make payments in lieu of delivery. At Dec. 31, 2017, PSCo was committed to approximately $1.4 billion in such obligations under these contracts, which expire in various years from 2018 through 2029.
PSCo purchases natural gas by optimizing a balance of long-term and short-term natural gas purchases, firm transportation and natural gas storage contracts. During 2017, PSCo purchased natural gas from approximately 31 suppliers.
See Items 1A and 7 for further discussion of natural gas supply and costs.
SPS
Natural Gas Facilities Used for Electric Generation
SPS does not provide retail natural gas service, but purchases and transports natural gas for certain of its generation facilities and operates natural gas pipeline facilities connecting the generation facilities to interstate natural gas pipelines. SPS is subject to the jurisdiction of the FERC with respect to certain natural gas transactions in interstate commerce, and to the jurisdiction of the PHMSA and the PUCT for pipeline safety compliance.
See Items 1A and 7 for further discussion of natural gas supply and costs.
32
Natural Gas Operating Statistics
|
Year Ended Dec. 31
|
|||||||||||
|
2017
|
2016
|
2015
|
|||||||||
|
Natural gas deliveries (Thousands of MMBtu)
|
|||||||||||
|
Residential
|
134,189
|
|
132,853
|
|
135,394
|
|
|||||
|
C&I
|
87,271
|
|
84,082
|
|
86,093
|
|
|||||
|
Total retail
|
221,460
|
|
216,935
|
|
221,487
|
|
|||||
|
Transportation and other
|
142,497
|
|
133,498
|
|
125,263
|
|
|||||
|
Total deliveries
|
363,957
|
|
350,433
|
|
346,750
|
|
|||||
|
Number of customers at end of period
|
|||||||||||
|
Residential
|
1,856,221
|
|
1,835,507
|
|
1,814,321
|
|
|||||
|
C&I
|
157,798
|
|
157,286
|
|
156,306
|
|
|||||
|
Total retail
|
2,014,019
|
|
1,992,793
|
|
1,970,627
|
|
|||||
|
Transportation and other
|
7,705
|
|
7,316
|
|
6,981
|
|
|||||
|
Total customers
|
2,021,724
|
|
2,000,109
|
|
1,977,608
|
|
|||||
|
Natural gas revenues (Millions of Dollars)
|
|||||||||||
|
Residential
|
$
|
1,006
|
|
$
|
930
|
|
$
|
1,043
|
|
||
|
C&I
|
524
|
|
469
|
|
547
|
|
|||||
|
Total retail
|
1,530
|
|
1,399
|
|
1,590
|
|
|||||
|
Transportation and other
|
120
|
|
132
|
|
82
|
|
|||||
|
Total natural gas revenues
|
$
|
1,650
|
|
$
|
1,531
|
|
$
|
1,672
|
|
||
|
MMBtu sales per retail customer
|
109.96
|
|
108.86
|
|
112.39
|
|
|||||
|
Revenue per retail customer
|
$
|
760
|
|
$
|
702
|
|
$
|
807
|
|
||
|
Residential revenue per MMBtu
|
7.50
|
|
7.00
|
|
7.70
|
|
|||||
|
C&I revenue per MMBtu
|
6.00
|
|
5.58
|
|
6.36
|
|
|||||
|
Transportation and other revenue per MMBtu
|
0.84
|
|
0.99
|
|
0.65
|
|
|||||
GENERAL
Seasonality
The demand for electric power and natural gas is affected by seasonal differences in the weather. In general, peak sales of electricity occur in the summer months, and peak sales of natural gas occur in the winter months. As a result, the overall operating results may fluctuate substantially on a seasonal basis. Additionally, Xcel Energy’s operations have historically generated less revenues and income when weather conditions are milder in the winter and cooler in the summer. See Item 7 for further discussion.
Competition
Xcel Energy is a vertically integrated utility in all of its jurisdictions, subject to traditional cost-of-service regulation by state public utilities commissions. However, Xcel Energy is subject to different public policies that promote competition and the development of energy markets. Xcel Energy’s industrial and large commercial customers have the ability to own or operate facilities to generate their own electricity. In addition, customers may have the option of substituting other fuels, such as natural gas, steam or chilled water for heating, cooling and manufacturing purposes, or the option of relocating their facilities to a lower cost region. Customers also have the opportunity to supply their own power with distributed generation including solar generation and in most jurisdictions can avoid paying for most of the fixed production, transmission and distribution costs incurred to serve them. Several states have policies designed to promote the development of solar and other distributed energy resources through significant incentive policies; with these incentives and federal tax subsidies, distributed generating resources are potential competitors to Xcel Energy’s electric service business.
33
The FERC has continued to promote competitive wholesale markets through open access transmission and other means. As a result, Xcel Energy Inc.’s utility subsidiaries and their wholesale customers can purchase the output from generation resources of competing wholesale suppliers and use the transmission systems of the utility subsidiaries on a comparable basis to serve their native load.
In addition, FERC Order 1000 seeks to establish competition for construction and operation of certain new electric transmission facilities. State public utilities commissions have created resource planning programs that promote competition in the acquisition of electricity generation resources used to provide service to retail customers. Xcel Energy Inc.’s utility subsidiaries also have franchise agreements with certain cities subject to periodic renewal. If a city elected not to renew the franchise agreement, it could seek alternative means for its citizens to access electric power or gas, such as municipalization. While each of Xcel Energy Inc.’s utility subsidiaries faces these challenges, Xcel Energy believes their rates and services are competitive with currently available alternatives.
ENVIRONMENTAL MATTERS
Xcel Energy’s facilities are regulated by federal and state environmental agencies. These agencies have jurisdiction over air emissions, water quality, wastewater discharges, solid wastes and hazardous substances. Various company activities require registrations, permits, licenses, inspections and approvals from these agencies. Xcel Energy has received all necessary authorizations for the construction and continued operation of its generation, transmission and distribution systems. Xcel Energy’s facilities have been designed and constructed to operate in compliance with applicable environmental standards. However, it is not possible to determine when or to what extent additional facilities or modifications of existing or planned facilities will be required as a result of changes to environmental regulations, interpretations or enforcement policies or what effect future laws or regulations may have upon Xcel Energy’s operations. See Item 7 and Notes 12 and 13 to the consolidated financial statements for further discussion.
There are significant present and future environmental regulations to encourage the use of clean energy technologies and regulate emissions of GHGs to address climate change. Xcel Energy has undertaken a number of initiatives to meet current requirements and prepare for potential future regulations, reduce GHG emissions and respond to state renewable and energy efficiency goals. If these future environmental regulations do not provide credit for the investments we have already made to reduce GHG emissions, or if they require additional initiatives or emission reductions, then their requirements would potentially impose additional substantial costs. Xcel Energy believes, based on prior state commission practice, it would recover the cost of these initiatives through rates.
Xcel Energy is committed to addressing climate change and potential climate change regulation through efforts to reduce its GHG emissions in a balanced, cost-effective manner. Starting in 2011, Xcel Energy began reporting GHG emissions to the EPA under the EPA’s mandatory GHG Reporting Program.
Xcel Energy estimates that in 2017, it reduced the CO
2
emissions associated with the electric generating resources used to serve its customers by 35 percent from 2005 levels. This reduction accounts for emissions both from electric generating plants owned by Xcel Energy as well as purchased power. To achieve this goal, Xcel Energy primarily relied on strategies that resulted in:
|
•
|
Development of renewable energy facilities;
|
|
•
|
Retirement and replacement of existing generating plants; and
|
|
•
|
Customer energy efficiency programs.
|
CAPITAL SPENDING AND FINANCING
See Item 7 for a discussion of expected capital expenditures and funding sources.
EMPLOYEES
As of
Dec. 31, 2017
, Xcel Energy had
11,075
full-time employees and 59 part-time employees, of which
5,115
were covered under collective-bargaining agreements. See Note 9 to the consolidated financial statements for further discussion.
34
|
EXECUTIVE OFFICERS
(a)
|
||||
|
Name
|
Age
(b)
|
Current and Recent Positions Held
|
||
|
Ben Fowke
|
59
|
Chairman of the Board, President and Chief Executive Officer and Director, Xcel Energy Inc., August 2011 to present. Chief Executive Officer, NSP-Minnesota, NSP-Wisconsin, PSCo, and SPS, January 2015 to present. Previously, President and Chief Operating Officer, Xcel Energy Inc., August 2009 to August 2011.
|
||
|
Christopher B. Clark
|
51
|
President and Director, NSP-Minnesota, January 2015 to present. Previously, Regional Vice President, Rates and Regulatory Affairs, NSP-Minnesota, October 2012 to December 2014; Managing Director, Government and Regulatory Affairs, NSP-Minnesota, January 2012 to October 2012; Managing Attorney, Xcel Energy Inc., November 2007 to January 2012.
|
||
|
David L. Eves
|
59
|
President and Director, PSCo, January 2015 to present. Previously, President, Director and Chief Executive Officer, PSCo, December 2009 to December 2014. Effective March 1, 2018 he will serve as Executive Vice President and Group President, Utilities.
|
||
|
Robert C. Frenzel
|
47
|
Executive Vice President, Chief Financial Officer, Xcel Energy Inc., May 2016 to present. Previously, Senior Vice President and Chief Financial Officer, Luminant, a subsidiary of Energy Future Holdings Corp., an electric utility and power generation company, February 2012 to April 2016; Senior Vice President for Corporate Development, Strategy and Mergers and Acquisitions, Energy Future Holdings Corp., February 2009 to February 2012. In April 2014, Energy Future Holdings Corp., the majority of its subsidiaries, including Texas Competitive Energy Holdings (TCEH) the parent company of Luminant, filed a voluntary bankruptcy petition under Chapter 11 of the United States Bankruptcy Code. TCEH emerged from Chapter 11 in October 2016.
|
||
|
David T. Hudson
|
57
|
President and Director, SPS, January 2015 to present. Previously, President, Director and Chief Executive Officer, SPS, January 2014 to December 2014; Director, Community Service & Economic Development, SPS, April 2011 to January 2014; Director, Strategic Planning, SPS, May 2008 to April 2011.
|
||
|
Kent T. Larson
|
58
|
Executive Vice President and Group President Operations, Xcel Energy Inc., January 2015 to present. Previously, Senior Vice President, Group President Operations, Xcel Energy Services Inc., August 2014 to December 2014; Senior Vice President Operations, Xcel Energy Services Inc., September 2011 to August 2014; Chief Energy Supply Officer, Xcel Energy Services Inc., March 2010 to September 2011.
|
||
|
Marvin E. McDaniel, Jr.
|
58
|
Executive Vice President, Group President, Utilities, and Chief Administrative Officer, Xcel Energy Inc., January 2015 to present. Previously, Senior Vice President, Chief Administrative Officer, Xcel Energy Inc., August 2012 to December 2014; Senior Vice President and Chief Administrative Officer, Xcel Energy Services Inc., September 2011 to August 2012; Vice President and Chief Administrative Officer, Xcel Energy Services Inc., August 2009 to September 2011 and Vice President, Talent and Technology Business Areas, Xcel Energy Services Inc., August 2009 to September 2011. Xcel Energy has previously announced that Marvin E. McDaniel, Jr. will retire in 2018. Effective March 1, 2018 he will serve as Executive Vice President and Chief Administrative Officer.
|
||
|
Timothy O’Connor
|
58
|
Senior Vice President, Chief Nuclear Officer, Xcel Energy Services Inc., February 2013 to present. Previously, Acting Chief Nuclear Officer, NSP-Minnesota, September 2012 to February 2013; Vice President, Engineering and Nuclear Regulatory Compliance and Licensing July 2012 to September 2012; Monticello Site Vice President, May 2007 to July 2012.
|
||
|
Judy M. Poferl
|
58
|
Senior Vice President, Corporate Secretary and Executive Services, Xcel Energy Inc., January 2015 to present. Previously, Vice President, Corporate Secretary, Xcel Energy Inc., May 2013 to December 2014; President, Director and Chief Executive Officer, NSP-Minnesota, August 2009 to May 2013.
|
||
|
Jeffrey S. Savage
|
46
|
Senior Vice President, Controller, Xcel Energy Inc., January 2015 to present. Previously, Vice President, Controller, Xcel Energy Inc., September 2011 to December 2014; Senior Director, Financial Reporting, Corporate and Technical Accounting, Xcel Energy Services Inc., December 2009 to September 2011.
|
||
|
Mark E. Stoering
|
57
|
President and Director, NSP-Wisconsin, January 2015 to present. Previously, President, Director and Chief Executive Officer, NSP-Wisconsin, January 2012 to December 2014; Vice President, Portfolio Strategy and Business Development, Xcel Energy Services Inc., August 2000 to December 2011.
|
||
|
Scott M. Wilensky
|
61
|
Executive Vice President, General Counsel, Xcel Energy Inc., January 2015 to present. Previously, Senior Vice President, General Counsel, Xcel Energy Inc., September 2011 to December 2014; Vice President, Regulatory and Resource Planning, Xcel Energy Services Inc., September 2009 to September 2011.
|
||
(a)
No family relationships exist between any of the executive officers or directors.
(b)
Ages as of Dec. 31, 2017.
35
Xcel Energy is subject to a variety of risks, many of which are beyond our control. Important risks that may adversely affect the business, financial condition and results of operations are further described below. These risks should be carefully considered together with the other information set forth in this report and in future reports that Xcel Energy files with the SEC.
Oversight of Risk and Related Processes
A key accountability of the Board of Directors is the oversight of material risk, and our Board of Directors employs an effective process for doing so. Management and each Board of Directors’ committee have responsibility for overseeing the identification and mitigation of key risks and reporting its assessments and activities to the full Board of Directors.
Management identifies and analyzes risks to determine materiality and other attributes such as timing, probability and controllability. Management broadly considers our business, the utility industry, the domestic and global economies and the environment when identifying, assessing, managing and mitigating risk. Identification and analysis occurs formally through a key risk assessment process conducted by senior management, the financial disclosure process, the hazard risk management process and internal auditing and compliance with financial and operational controls. Management also identifies and analyzes risk through its business planning process and development of goals and key performance indicators, which include risk identification to determine barriers to implementing Xcel Energy’s strategy. The business planning process also identifies areas in which there is a potential for a business area to take inappropriate risk to meet goals, and determines how to prevent inappropriate risk-taking.
At a threshold level, Xcel Energy has developed a robust compliance program and promotes a culture of compliance, including tone at the top, which mitigates risk. The process for risk mitigation includes adherence to our code of conduct and other compliance policies, operation of formal risk management structures and groups and overall business management to mitigate the risks inherent in the implementation of strategy. Building on this culture of compliance, Xcel Energy manages and further mitigates risks through operation of formal risk management structures and groups, including management councils, risk committees and the services of internal corporate areas such as internal audit, the corporate controller and legal services.
Management communicates regularly with the Board of Directors and key stakeholders regarding risk. Senior management presents a periodic assessment of key risks to the Board of Directors. The presentation and the discussion of the key risks provides the Board of Directors with information on the risks management believes are material, including the earnings impact, timing, likelihood and controllability. Management also provides information to the Board of Directors in presentations and communications over the course of the year.
The Board of Directors approaches oversight, management and mitigation of risk as an integral and continuous part of its governance of Xcel Energy. First, the Board of Directors regularly reviews management’s key risk assessment and analyzes areas of existing and future risks and opportunities. In addition, the Board of Directors assigns oversight of certain critical risks to each of its four standing committees to ensure these risks are well understood and are given focused oversight by the appropriate committee. The Audit Committee is responsible for reviewing the adequacy of risk oversight and affirming that appropriate oversight occurs. New risks are considered and assigned as appropriate during the annual Board of Directors’ and committee evaluation process, and committee charters and annual work plans are updated accordingly. Committees regularly report on their oversight activities and certain risk issues may be brought to the full Board of Directors for consideration where deemed appropriate to ensure broad Board of Directors’ understanding of the nature of the risk. Finally, the Board of Directors conducts an annual strategy session where Xcel Energy’s future plans and initiatives are reviewed.
36
Risks Associated with Our Business
Environmental Risks
We are subject to environmental laws and regulations, with which compliance could be difficult and costly.
We are subject to environmental laws and regulations that affect many aspects of our past, present and future operations, including air emissions, water quality, wastewater discharges and the generation, transport and disposal of solid wastes and hazardous substances. These laws and regulations require us to obtain permits, licenses, and other approvals and to comply with a wide variety of environmental requirements including those for protected natural and cultural resources (such as wetlands, endangered species and other protected wildlife, and archaeological and historical resources). Environmental laws and regulations can also require us to restrict or limit the output of certain facilities or the use of certain fuels, shift generation to lower-emitting, but potentially more costly facilities, install pollution control equipment at our facilities, clean up spills and other contamination and correct environmental hazards. Environmental regulations may also lead to shutdown of existing facilities, either due to the difficulty in assuring compliance or that the costs of compliance makes operation of the units no longer economical. Both public officials and private individuals may seek to enforce the applicable environmental laws and regulations against us. We may be required to pay all or a portion of the cost to remediate (i.e., clean-up) sites where our past activities, or the activities of certain other parties, caused environmental contamination.
We are also subject to mandates to provide customers with clean energy, renewable energy and energy conservation offerings. Failure to meet the requirements of these mandates may result in fines or penalties, which could have a material effect on our results of operations. If our regulators do not allow us to recover all or a part of the cost of capital investment or the O&M costs incurred to comply with the mandates or other environmental requirements, it could have a material effect on our results of operations, financial position or cash flows.
In addition, existing environmental laws or regulations may be revised, and new laws or regulations may be adopted or become applicable to us, including but not limited to, regulation of mercury, NO
x
, SO
2
, CO
2
and other GHGs, particulates, cooling water intakes, water discharges and ash management. We may also incur additional unanticipated obligations or liabilities under existing environmental laws and regulations.
We are subject to physical and financial risks associated with climate change and other weather, natural disaster and resource depletion impacts.
Climate change can create physical and financial risk. Physical risks from climate change can include changes in weather conditions, changes in precipitation and extreme weather events.
Our customers’ energy needs vary with weather conditions, primarily temperature and humidity. For residential customers, heating and cooling represent their largest energy use. To the extent weather conditions are affected by climate change, customers’ energy use could increase or decrease. Increased energy use due to weather changes may require us to invest in additional generating assets, transmission and other infrastructure to serve increased load. Decreased energy use due to weather changes may result in decreased revenues. Extreme weather conditions in general require more system backup, adding to costs, and can contribute to increased system stress, including service interruptions. Weather conditions could also have an impact on our revenues. We buy and sell electricity depending upon system needs and market opportunities. Extreme weather conditions creating high energy demand may raise electricity prices, which would increase the cost of energy we provide to our customers.
Severe weather impacts our service territories, primarily when thunderstorms and associated flooding, tornadoes, wildfires and snow or ice storms occur. To the extent the frequency of extreme weather events increases, this could increase our cost of providing service. Changes in precipitation resulting in droughts or water shortages, whether caused by climate change or otherwise, could adversely affect our operations, principally our fossil generating units. A negative impact to water supplies due to long-term drought or water depletion conditions could adversely impact our ability to provide electricity to customers, as well as increase the price they pay for energy. We may not recover all costs related to mitigating these physical and financial risks.
37
Climate change may impact a region’s economic health, which could impact our revenues. Our financial performance is tied to the health of the regional economies we serve. The price of energy has an impact on the economic health of our communities. The cost of additional regulatory requirements, such as regulation of GHG or additional environmental regulation could impact the availability of goods and prices charged by our suppliers which would normally be borne by consumers through higher prices for energy and purchased goods. To the extent financial markets view climate change and emissions of GHGs as a financial risk, this could negatively affect our ability to access capital markets or cause us to receive less than ideal terms and conditions.
Financial Risks
Our profitability depends in part on the ability of our utility subsidiaries to recover their costs from their customers and there may be changes in circumstances or in the regulatory environment that impair the ability of our utility subsidiaries to recover costs from their customers.
We are subject to comprehensive regulation by federal and state utility regulatory agencies. The utility commissions in the states where we operate regulate many aspects of our utility operations, including siting and construction of facilities, customer service and the rates that we can charge customers. The FERC has jurisdiction, among other things, over wholesale rates for electric transmission service, the sale of electric energy in interstate commerce and certain natural gas transactions in interstate commerce.
The profitability of our utility operations is dependent on our ability to recover the costs of providing energy and utility services to our customers and earn a return on our capital investment. Our utility subsidiaries provide service at rates approved by one or more regulatory commissions. These rates are generally regulated and based on an analysis of the utility’s costs incurred in a test year. Our utility subsidiaries are subject to both future and historical test years depending upon the regulatory mechanisms approved in each jurisdiction. Thus, the rates a utility is allowed to charge may or may not match its costs at any given time. While rate regulation is premised on providing an opportunity to earn a reasonable rate of return on invested capital, in a continued low interest rate environment there has been pressure pushing down ROE. There can also be no assurance that the applicable regulatory commission will judge all the costs of our utility subsidiaries to have been prudent, which could result in cost disallowances, or that the regulatory process in which rates are determined will always result in rates that will produce full recovery of such costs. Changes in the long-term cost-effectiveness or changes to the operating conditions of our assets may result in early retirements and while regulation typically provides relief for these types of changes, there is no assurance that regulators would allow full recovery of all remaining costs leaving all or a portion of these asset costs stranded. Higher than expected inflation may increase costs of construction and operations. Rising fuel costs could increase the risk that our utility subsidiaries will not be able to fully recover their fuel costs from their customers. Furthermore, there could be changes in the regulatory environment that would impair the ability of our utility subsidiaries to recover costs historically collected from their customers, or these factors could cause the operating utilities to exceed commitments made regarding cost caps and result in less than full recovery. Overall, management currently believes prudently incurred costs are generally recoverable given the existing regulatory mechanisms in place.
Adverse regulatory rulings or the imposition of additional regulations could have an adverse impact on our results of operations and hence could materially and adversely affect our ability to meet our financial obligations, including debt payments and the payment of dividends on our common stock.
Any reductions in our credit ratings could increase our financing costs and the cost of maintaining certain contractual relationships.
We cannot be assured that any of our current ratings or our subsidiaries’ ratings will remain in effect for any given period of time, or that a rating will not be lowered or withdrawn entirely by a rating agency. Significant events including a major disallowance of costs, significantly lower returns on equity or equity ratios or impacts of tax policy changes, among others, may impact our cash flows and credit metrics, potentially resulting in a change in our credit ratings. In addition, our credit ratings may change as a result of the differing methodologies or change in the methodologies used by the various rating agencies. Any downgrade could lead to higher borrowing costs and could impact our ability to access capital markets. Also, our utility subsidiaries may enter into certain procurement and derivative contracts that require the posting of collateral or settlement of applicable contracts if credit ratings fall below investment grade.
38
We are subject to capital market and interest rate risks.
Utility operations require significant capital investment. As a result, we frequently need to access capital markets. Any disruption in capital markets could have a material impact on our ability to fund our operations. Capital markets are global in nature and are impacted by numerous issues and events throughout the world economy. Capital market disruption events and resulting broad financial market distress could prevent us from issuing short-term commercial paper, issuing new securities or cause us to issue securities with less than ideal terms and conditions, such as higher interest rates.
Higher interest rates on short-term borrowings with variable interest rates could also have an adverse effect on our operating results. Changes in interest rates may also impact the fair value of the debt securities in the nuclear decommissioning fund and master pension trust, as well as our ability to earn a return on short-term investments of excess cash.
We are subject to credit risks.
Credit risk includes the risk that our customers will not pay their bills, which may lead to a reduction in liquidity and an increase in bad debt expense. Credit risk is comprised of numerous factors including the price of products and services provided, the overall economy and local economies in the geographic areas we serve, including local unemployment rates.
Credit risk also includes the risk that various counterparties that owe us money or product will become insolvent and/or breach their obligations. Should the counterparties to these arrangements fail to perform, we may be forced to enter into alternative arrangements. In that event, our financial results could be adversely affected and we could incur losses.
We may at times have direct credit exposure in our short-term wholesale and commodity trading activity to various financial institutions trading for their own accounts or issuing collateral support on behalf of other counterparties. We may also have some indirect credit exposure due to participation in organized markets, such as CAISO, SPP, PJM, MISO and ERCOT, in which any credit losses are socialized to all market participants.
We do have additional indirect credit exposures to various domestic and foreign financial institutions in the form of letters of credit provided as security by power suppliers under various long-term physical purchased power contracts. If any of the credit ratings of the letter of credit issuers were to drop below the designated investment grade rating stipulated in the underlying long-term purchased power contracts, the supplier would need to replace that security with an acceptable substitute. If the security were not replaced, the party could be in technical default under the contract, which would enable us to exercise our contractual rights.
Increasing costs associated with our defined benefit retirement plans and other employee benefits may adversely affect our results of operations, financial position or liquidity.
We have defined benefit pension and postretirement plans that cover most of our employees. Assumptions related to future costs, return on investments, interest rates and other actuarial assumptions, including mortality tables, have a significant impact on our funding requirements related to these plans. These estimates and assumptions may change based on economic conditions, actual stock and bond market performance, changes in interest rates and changes in governmental regulations. In addition, the Pension Protection Act of 2006 changed the minimum funding requirements for defined benefit pension plans with modifications that allowed additional flexibility in the timing of contributions. Therefore, our funding requirements and related contributions may change in the future. Also, the payout of a significant percentage of pension plan liabilities in a single year due to high retirements or employees leaving Xcel Energy could trigger settlement accounting and could require Xcel Energy to recognize material incremental pension expense related to unrecognized plan losses in the year these liabilities are paid.
Increasing costs associated with health care plans may adversely affect our results of operations.
Our self-insured costs of health care benefits for eligible employees have increased in recent years. Increasing levels of large individual health care claims and overall health care claims could have an adverse impact on our operating results, financial position and liquidity. We believe that our employee benefit costs, including costs related to health care plans for our employees and former employees, will continue to rise. Changes in industry standards utilized by management in key assumptions (e.g., mortality tables) could have a significant impact on future liabilities and benefit costs. Legislation related to health care could also significantly change our benefit programs and costs.
39
We must rely on cash from our subsidiaries to make dividend payments.
We are a holding company and our investments in our subsidiaries are our primary assets. Substantially all of our operations are conducted by our subsidiaries. Consequently, our operating cash flow and our ability to service our indebtedness and pay dividends depends upon the operating cash flows of our subsidiaries and the payment of dividends to us. Our subsidiaries are separate legal entities that have no obligation to pay any amounts due pursuant to our obligations or to make any funds available for dividends on our common stock. In addition, each subsidiary’s ability to pay dividends to us depends on any statutory and/or contractual restrictions which may include requirements to maintain minimum levels of equity ratios, working capital or assets. Also, our utility subsidiaries are regulated by various state utility commissions, which possess broad powers to ensure that the needs of the utility customers are being met.
If our utility subsidiaries were to cease making dividend payments, our ability to pay dividends on our common stock or otherwise meet our financial obligations could be adversely affected.
Federal tax law may significantly impact our business.
Xcel Energy’s utility subsidiaries collect through regulated rates its estimated federal, state and local tax payments. There are a number of provisions in federal tax law designed to incentivize capital investments which have benefited our customers by keeping our utility subsidiaries’ rates lower than rates calculated without such provisions. Examples include the use of accelerated depreciation for most of our capital investments, PTCs for wind energy, ITCs for solar energy and R&E tax credits and deductions. Changes to federal tax law may benefit or adversely affect our earnings and customer costs. Changes to tax depreciable lives and the value of various tax credits could change the economics of resources and our resource selections. While regulation allows us to incorporate changes in tax law into the rate-setting process, there could be timing delays before regulated rates provide for realization of the tax changes in revenues. In addition, certain IRS tax policies such as the requirement to utilize normalization may impact our ability to economically deliver certain types of resources relative to market prices.
Operational Risks
Our natural gas and electric transmission and distribution operations involve numerous risks that may result in accidents and other operating risks and costs.
Our natural gas transmission and distribution activities include a variety of inherent hazards and operating risks, such as leaks, explosions and mechanical problems, which could cause substantial financial losses. Our electric transmission and distribution activities also include inherent hazards and operating risks such as contact, fire and widespread outages which could cause substantial financial losses. In addition, these natural gas and electric risks could result in loss of human life, significant damage to property, environmental pollution, impairment of our operations and substantial losses to us. We maintain insurance against some, but not all, of these risks and losses.
The occurrence of any of these events not fully covered by insurance could have a material effect on our financial position and results of operations. For our natural gas transmission or distribution lines located near populated areas, the level of potential damages resulting from these risks is greater.
Additionally, for natural gas the operating or other costs that may be required in order to comply with potential new regulations, including the Pipeline Safety Act, could be significant. The Pipeline Safety Act requires verification of pipeline infrastructure records by pipeline owners and operators to confirm the maximum allowable operating pressure of lines located in high consequence areas or more-densely populated areas. We have programs in place to comply with the Pipeline Safety Act and for systematic infrastructure monitoring and renewal over time. A significant incident could increase regulatory scrutiny and result in penalties and higher costs of operations.
40
Our utility operations are subject to long-term planning risks.
Most electric utility investments are long-lived and are planned to be used for decades. Transmission and generation investments typically have long lead times, and therefore are planned well in advance of when they are brought in-service subject to long-term resource plans. These plans are based on numerous assumptions over the planning horizon such as: sales growth, customer usage, commodity prices, economic activity, costs, regulatory mechanisms, customer behavior, available technology and public policy. The electric utility sector is undergoing a period of significant change. For example, public policy has driven increases in appliance and lighting efficiency and energy efficient buildings, wider adoption and lower cost of renewable generation and distributed generation, including community solar gardens and customer-sited solar, shifts away from coal generation to decrease CO
2
emissions and increasing use of natural gas in electric generation driven by lower natural gas prices. Over time, customer adoption of these technologies and increased energy efficiency could result in excess transmission and generation resources as well as stranded costs if Xcel Energy is not able to fully recover the costs and investments. These changes also introduce additional uncertainty into long-term planning which gives rise to a risk that the magnitude and timing of resource additions and growth in customer demand may not coincide, and that the preference for the types of additions may change from planning to execution. In addition, we are also subject to longer-term availability of the natural resource inputs such as coal, natural gas, uranium and water to cool our facilities. Lack of availability of these resources could jeopardize long-term operations of our facilities or make them uneconomic to operate.
The resource plans reviewed and approved by our state regulators assume continuation of the traditional utility cost of service model under which utility costs are recovered from customers as they receive the benefit of service. Xcel Energy is engaged in significant and ongoing infrastructure investment programs to accommodate renewable distributed generation and to maintain high system reliability. Changing customer expectations and changing technologies are requiring significant investments in advanced grid infrastructure. This also increases the exposure to potential outdating of technologies and the resultant risks. Xcel Energy is also investing in renewable and natural gas-fired generation to reduce our CO
2
emissions profile. The inability of coal mining companies to attract capital could disrupt longer-term supplies. Early plant retirements that may result from these changes could expose us to premature financial obligations, which could result in less than full recovery of all remaining costs. Both decreasing use per customer driven by appliance and lighting efficiency and the availability of cost-effective distributed generation puts downward pressure on load growth. This could lead to under recovery of costs, excess resources to meet customer demand and increases in electric rates. Finally, multiple states served by a single system may not agree as to the appropriate resource mix and the differing views may lead to costs incurred to comply with one jurisdiction that are not recoverable across all of the jurisdictions served by the same assets.
Our subsidiary, NSP-Minnesota, is subject to the risks of nuclear generation.
NSP-Minnesota’s two nuclear stations, PI and Monticello, subject it to the risks of nuclear generation, which include:
|
•
|
The risks associated with use of radioactive material in the production of energy, the management, handling, storage and disposal and the current lack of a long-term disposal solution for radioactive materials;
|
|
•
|
Limitations on the amounts and types of insurance available to cover losses that might arise in connection with nuclear operations, as well as obligations to contribute to an insurance pool in the event of damages at a covered U.S. reactor; and
|
|
•
|
Uncertainties with respect to the technological and financial aspects of decommissioning nuclear plants at the end of their licensed lives. For example, similar to pensions, interest rate and other assumptions regarding decommissioning costs may change based on economic conditions and changes in the expected life of the asset may cause our funding obligations to change.
|
The NRC has authority to impose licensing and safety-related requirements for the operation of nuclear generation facilities. In the event of non-compliance, the NRC has the authority to impose fines and/or shut down a unit until compliance is achieved. Revised NRC safety requirements could necessitate substantial capital expenditures or a substantial increase in operating expenses. In addition, the Institute for Nuclear Power Operations reviews NSP-Minnesota’s nuclear operations and nuclear generation facilities. Compliance with the Institute for Nuclear Power Operations’ recommendations could result in substantial capital expenditures or a substantial increase in operating expenses.
If an incident did occur, it could have a material effect on our results of operations or financial condition. Furthermore, the non-compliance of other nuclear facilities operators or the occurrence of a serious nuclear incident at other facilities could result in increased regulation of the industry, which could then increase NSP-Minnesota’s compliance costs and impact the results of operations of its facilities.
41
NSP-Wisconsin’s production and transmission system is operated on an integrated basis with NSP-Minnesota’s production and transmission system, and NSP-Wisconsin may be subject to risks associated with NSP-Minnesota’s nuclear generation.
We are subject to commodity risks and other risks associated with energy markets and energy production.
We engage in wholesale sales and purchases of electric capacity, energy and energy-related products as well as natural gas. In many markets in which we operate, emission allowances and/or renewable energy credits are also needed to comply with various statutes and commission rulings associated with energy transactions. As a result we are subject to market supply and commodity price risk. Commodity price changes can affect the value of our commodity trading derivatives. We mark certain derivatives to estimated fair market value on a daily basis (mark-to-market accounting). Actual settlements can vary significantly from estimated fair values recorded, and significant changes from the assumptions underlying our fair value estimates could cause earnings variability.
If we encounter market supply shortages or our suppliers are otherwise unable to meet their contractual obligations, we may be unable to fulfill our contractual obligations to our customers at previously anticipated costs. Therefore, a significant disruption could cause us to seek alternative supply services at potentially higher costs or suffer increased liability for unfulfilled contractual obligations. Any significantly higher energy or fuel costs relative to corresponding sales commitments could have a negative impact on our cash flows and potentially result in economic losses. Potential market supply shortages may not be fully resolved through alternative supply sources and may cause short-term disruptions in our ability to provide electric and/or natural gas services to our customers. The impact of these cost and reliability issues vary in magnitude for each operating subsidiary depending upon unique operating conditions such as generation fuels mix, availability of water for cooling, availability of fuel transportation including rail shipments of coal, electric generation capacity, transmission, natural gas pipeline capacity, etc. Failure to provide service due to disruptions could also result in fines, penalties or cost disallowances through the regulatory process.
Public Policy Risks
We may be subject to legislative and regulatory responses to climate change, with which compliance could be difficult and costly.
Increased public awareness and concern regarding climate change may result in more state, regional and/or federal requirements to reduce or mitigate the effects of GHGs. Legislative and regulatory responses related to climate change and new interpretations of existing laws through climate change litigation create financial risk as our electric generating facilities may be subject to additional regulation at either the state or federal level in the future. Such regulations could impose substantial costs on our system. International agreements could have an impact to the extent they lead to future federal or state regulations.
In 2015, the 21
st
Conference of the Parties to the United Nations Framework Convention on Climate Change reached consensus among 190 nations on an agreement (the Paris Agreement) that establishes a framework for GHG mitigation actions by all countries (“nationally determined contributions”), with a goal of holding the increase in global average temperature to below 2
o
Celsius above pre-industrial levels and an aspiration to limit the increase to 1.5
o
Celsius. If implemented, the Paris Agreement could result in future additional GHG reductions in the United States. On June 21, 2017, President Trump announced that the U.S. would withdraw from the Paris Agreement. Such a withdrawal, under terms of the Agreement, becomes effective in four years. Many state and local government entities, however, have indicated that they intend to pursue GHG mitigation with a goal of achieving the GHG reductions in the United States anticipated by the Paris Agreement.
We have been, and in the future may be, subject to climate change lawsuits. An adverse outcome in any of these cases could require substantial capital expenditures and could possibly require payment of substantial penalties or damages. Defense costs associated with such litigation can also be significant. Such payments or expenditures could affect results of operations, cash flows and financial condition if such costs are not recovered through regulated rates.
Some states and localities have indicated a desire to continue to pursue climate policies even in the absence of federal mandates. All of the steps that Xcel Energy has taken to date to reduce GHG emissions, including energy efficiency measures, adding renewable generation or retiring or converting coal plants to natural gas, occurred under state-endorsed resource plans, renewable energy standards and other state policies. While those actions likely would have put Xcel Energy in a good position to meet federal standards under the CPP or the Paris Agreement, repeal of these policies would not impact those state-endorsed actions and plans.
Whether under state or federal programs, an important factor is our ability to recover the costs incurred to comply with any regulatory requirements in a timely manner. If our regulators do not allow us to recover all or a part of the cost of capital investment or the O&M costs incurred to comply with the mandates, it could have a material effect on our results of operations.
42
Increased risks of regulatory penalties could negatively impact our business.
The Energy Act increased civil penalty authority for violation of FERC statutes, rules and orders. The FERC can now impose penalties of up to $1.2 million per violation per day, particularly as it relates to energy trading activities for both electricity and natural gas. Under statute, the FERC can adjust penalties for inflation. In addition, NERC electric reliability standards and critical infrastructure protection requirements are mandatory and subject to potential financial penalties by regional entities, the NERC or the FERC for violations. Additionally, the PHMSA, the Occupational Safety and Health Administration and other federal agencies also have penalty authority. In the event of serious incidents, these agencies have become more active in pursuing penalties. Some states have the authority to impose substantial penalties in the event of non-compliance. If a serious reliability or safety incident did occur, it could have a material effect on our operations or financial results.
Macroeconomic Risks
Economic conditions impact our business.
Our operations are affected by local, national and worldwide economic conditions. Growth in our customer base is correlated with economic conditions. While the number of customers is growing, sales growth is relatively modest due to an increased focus on energy efficiency including federal standards for appliance and lighting efficiency and distributed generation, primarily solar PV. Instability in the financial markets also may affect the cost of capital and our ability to raise capital, which is discussed in the capital market risk factor section above.
Economic conditions may be impacted by insufficient financial sector liquidity leading to potential increased unemployment, which may impact customers’ ability to pay timely, increase customer bankruptcies, and may lead to increased bad debt.
Further, worldwide economic activity has an impact on the demand for basic commodities needed for utility infrastructure, such as steel, copper, aluminum, etc., which may impact our ability to acquire sufficient supplies. We operate in a capital intensive industry, and federal policy on trade could significantly impact the costs of the materials we use. We may be at risk for higher than anticipated inflation both with respect to our own workforce, as well as our materials and labor that we contract for with others. There may be delays before these higher costs can be recovered in rates.
Our operations could be impacted by war, acts of terrorism, threats of terrorism or disruptions in normal operating conditions due to localized or regional events.
Our generation plants, fuel storage facilities, transmission and distribution facilities and information and control systems may be targets of terrorist activities. Any such disruption could impact operations or result in a decrease in revenues and additional costs to repair and insure our assets. These disruptions could have a material impact on our financial condition and results of operations. The potential for terrorism has subjected our operations to increased risks and could have a material effect on our business. We have already incurred increased costs for security and capital expenditures in response to these risks. In addition, we may experience additional capital and operating costs to implement security for our plants, including our nuclear power plants under the NRC’s design basis threat requirements. We have also already incurred increased costs for compliance with NERC reliability standards associated with critical infrastructure protection. In addition, we may experience additional capital and operating costs to comply with the NERC critical infrastructure protection standards as they are implemented and clarified.
The insurance industry has also been affected by these events and the availability of insurance may decrease. In addition, the insurance we are able to obtain may have higher deductibles, higher premiums and more restrictive policy terms.
A disruption of the regional electric transmission grid, interstate natural gas pipeline infrastructure or other fuel sources, could negatively impact our business, as well as our brand and reputation. Because our generation, the transmission systems and local natural gas distribution companies are part of an interconnected system, we face the risk of possible loss of business due to a disruption caused by the actions of a neighboring utility or an event (such as severe storm, severe temperature extremes, wildfires, solar storms, generator or transmission facility outage, breakdown or failure of equipment, pipeline rupture, railroad disruption, operator error, sudden and significant increase or decrease in wind generation or any disruption of work force such as may be caused by flu or other epidemic) within our operating systems or on a neighboring system. Any such disruption could result in a significant decrease in revenues and significant additional costs to repair assets, which could have a material impact on our financial condition and results.
43
The degree to which we are able to maintain day-to-day operations in response to unforeseen events will in part determine the financial impact of certain events on our financial condition and results. It is difficult to predict the magnitude of such events and associated impacts.
A cyber incident or cyber security breach could have a material effect on our business.
We operate in an industry that requires the continued operation of sophisticated information technology and control systems and network infrastructure. In addition, we use our systems and infrastructure to create, collect, use, disclose, store, dispose of and otherwise process sensitive information, including company data, customer energy usage data, and personal information regarding customers, employees and their dependents, contractors, shareholders and other individuals.
Our generation, transmission, distribution and fuel storage facilities, information technology systems and other infrastructure or physical assets, as well as the information processed in our systems (such as information about our customers, employees, operations, infrastructure and assets) could be affected by cyber security incidents, including those caused by human error. Our industry has begun to see an increased volume and sophistication of cyber security incidents from international activist organizations, Nation States and individuals. Cyber security incidents could harm our businesses by limiting our generating, transmitting and distributing capabilities, delaying our development and construction of new facilities or capital improvement projects to existing facilities, disrupting our customer operations or exposing us to liability. Our generation, transmission systems and natural gas pipelines are part of an interconnected system. Therefore, a disruption caused by the impact of a cyber security incident of the regional electric transmission grid, natural gas pipeline infrastructure or other fuel sources of our third party service providers’ operations, could also negatively impact our business. Our supply chain for procurement of digital equipment may expose software or hardware to these risks and could result in a breach or significant costs of remediation. In addition, such an event would likely receive regulatory scrutiny at both the federal and state level. We are unable to quantify the potential impact of cyber security threats or subsequent related actions. These potential cyber security incidents and corresponding regulatory action could result in a material decrease in revenues and may cause
significant additional costs (e.g., penalties, third party claims, repairs, insurance or compliance) and potentially disrupt our supply and markets for natural gas, oil and other fuels.
We maintain security measures designed to protect our information technology and control systems, network infrastructure and other assets. However, these assets and the information they process may be vulnerable to cyber security incidents, including the resulting disability, or failures of assets or unauthorized access to assets or information. If our technology systems were to fail or be breached, or those of our third-party service providers, we may be unable to fulfill critical business functions, including effectively maintaining certain internal controls over financial reporting. We are unable to quantify the potential impact of cyber security incidents on our business, our brand, and our reputation. The cyber security threat is dynamic and evolves continually, and our efforts to prioritize network monitoring may not be effective given the constant changes to threat vulnerability.
Rising energy prices could negatively impact our business.
Although commodity prices are currently relatively low, if fuel costs increase, customer demand could decline and bad debt expense may rise, which could have a material impact on our results of operations. While we have fuel clause recovery mechanisms in most of our states, higher fuel costs could significantly impact our results of operations if costs are not recovered. Delays in the timing of the collection of fuel cost recoveries as compared with expenditures for fuel purchases could have an impact on our cash flows. Low fuel costs could have a positive impact on sales, though low oil and natural gas prices could negatively impact oil and gas production activities and subsequently our sales volumes and revenue. We are unable to predict future prices or the ultimate impact of such prices on our results of operations or cash flows.
44
Our operating results may fluctuate on a seasonal and quarterly basis and can be adversely affected by milder weather.
Our electric and natural gas utility businesses are seasonal, and weather patterns can have a material impact on our operating performance. Demand for electricity is often greater in the summer and winter months associated with cooling and heating. Because natural gas is heavily used for residential and commercial heating, the demand depends heavily upon weather patterns throughout our service territory, and a significant amount of natural gas revenues are recognized in the first and fourth quarters related to the heating season. Accordingly, our operations have historically generated less revenues and income when weather conditions are milder in the winter and cooler in the summer. Unusually mild winters and summers could have an adverse effect on our financial condition, results of operations, or cash flows.
Our operations use third party contractors in addition to employees to perform periodic and on-going work.
We rely on third party contractors with specific qualifications to perform work both for ongoing operations and maintenance and for capital construction. We have contractual arrangements with these contractors which typically include performance standards, progress payments, insurance requirements and security for performance. Cyber security breaches seen in the news have at times exploited third party equipment or software in order to gain access. Poor vendor performance could impact on going operations, restoration operations, our reputation and could introduce financial risk or risks of fines.
None.
45
Virtually all of the utility plant property of NSP-Minnesota, NSP-Wisconsin, PSCo and SPS is subject to the lien of their first mortgage bond indentures.
Electric Utility Generating Stations:
|
NSP-Minnesota
Station, Location and Unit
|
Fuel
|
Installed
|
Summer 2017
Net Dependable
Capability (MW)
|
|||||
|
Steam:
|
||||||||
|
A.S. King-Bayport, Minn., 1 Unit
|
Coal
|
1968
|
511
|
|
||||
|
Sherco-Becker, Minn.
|
||||||||
|
Unit 1
|
Coal
|
1976
|
680
|
|
||||
|
Unit 2
|
Coal
|
1977
|
682
|
|
||||
|
Unit 3
|
Coal
|
1987
|
517
|
|
(a)
|
|||
|
Monticello-Monticello, Minn., 1 Unit
|
Nuclear
|
1971
|
617
|
|
||||
|
PI-Welch, Minn.
|
||||||||
|
Unit 1
|
Nuclear
|
1973
|
521
|
|
||||
|
Unit 2
|
Nuclear
|
1974
|
519
|
|
||||
|
Various locations, 4 Units
|
Wood/Refuse-derived fuel
|
Various
|
36
|
|
(b)
|
|||
|
Combustion Turbine:
|
||||||||
|
Angus Anson-Sioux Falls, S.D., 3 Units
|
Natural Gas
|
1994-2005
|
327
|
|
||||
|
Black Dog-Burnsville, Minn., 2 Units
|
Natural Gas
|
1987-2002
|
282
|
|
||||
|
Blue Lake-Shakopee, Minn., 6 Units
|
Natural Gas
|
1974-2005
|
453
|
|
||||
|
High Bridge-St. Paul, Minn., 3 Units
|
Natural Gas
|
2008
|
530
|
|
||||
|
Inver Hills-Inver Grove Heights, Minn., 6 Units
|
Natural Gas
|
1972
|
282
|
|
||||
|
Riverside-Minneapolis, Minn., 3 Units
|
Natural Gas
|
2009
|
454
|
|
||||
|
Various locations, 14 Units
|
Natural Gas
|
Various
|
67
|
|
||||
|
Wind:
|
||||||||
|
Border-Rolette County, N.D., 75 Units
|
Wind
|
2015
|
148
|
|
(c)
|
|||
|
Courtenay Wind, N.D., 100 Units
|
Wind
|
2016
|
195
|
|
(c)
|
|||
|
Grand Meadow-Mower County, Minn., 67 Units
|
Wind
|
2008
|
101
|
|
(c)
|
|||
|
Nobles-Nobles County, Minn., 134 Units
|
Wind
|
2010
|
201
|
|
(c)
|
|||
|
Pleasant Valley-Mower County, Minn., 100 Units
|
Wind
|
2015
|
196
|
|
(c)
|
|||
|
Total
|
7,319
|
|
||||||
|
(a)
|
Based on NSP-Minnesota’s ownership of
59 percent
.
|
|
(b)
|
Refuse-derived fuel is made from municipal solid waste.
|
|
(c)
|
This capacity is only available when wind conditions are sufficiently high enough to support the noted generation values above. Therefore, the on-demand net dependable capacity is zero.
|
46
|
NSP-Wisconsin
Station, Location and Unit
|
Fuel
|
Installed
|
Summer 2017
Net Dependable
Capability (MW)
|
|||||
|
Steam:
|
||||||||
|
Bay Front-Ashland, Wis., 3 Units
|
Coal/Wood/Natural Gas
|
1948-1956
|
56
|
|
||||
|
French Island-La Crosse, Wis., 2 Units
|
Wood/Refuse-derived fuel
|
1940-1948
|
16
|
|
(a)
|
|||
|
Combustion Turbine:
|
||||||||
|
Flambeau Station-Park Falls, Wis., 1 Unit
|
Natural Gas
|
1969
|
—
|
|
(b)
|
|||
|
French Island-La Crosse, Wis., 2 Units
|
Oil
|
1974
|
122
|
|
||||
|
Wheaton-Eau Claire, Wis., 5 Units
|
Natural Gas/Oil
|
1973
|
238
|
|
||||
|
Hydro:
|
||||||||
|
Various locations, 63 Units
|
Hydro
|
Various
|
135
|
|
||||
|
Total
|
567
|
|
||||||
|
(a)
|
Refuse-derived fuel is made from municipal solid waste.
|
|
(b)
|
Flambeau Station was retired on Dec. 31, 2017.
|
|
PSCo
Station, Location and Unit
|
Fuel
|
Installed
|
Summer 2017
Net Dependable
Capability (MW)
|
|||||
|
Steam:
|
||||||||
|
Comanche-Pueblo, Colo.
|
||||||||
|
Unit 1
|
Coal
|
1973
|
325
|
|
||||
|
Unit 2
|
Coal
|
1975
|
335
|
|
||||
|
Unit 3
|
Coal
|
2010
|
500
|
|
(b)
|
|||
|
Craig-Craig, Colo., 2 Units
|
Coal
|
1979-1980
|
83
|
|
(c)
|
|||
|
Hayden-Hayden, Colo., 2 Units
|
Coal
|
1965-1976
|
233
|
|
(d)
|
|||
|
Pawnee-Brush, Colo., 1 Unit
|
Coal
|
1981
|
505
|
|
||||
|
Valmont-Boulder, Colo., 1 Unit
|
Coal
|
1964
|
—
|
|
(e)
|
|||
|
Combustion Turbine:
|
||||||||
|
Blue Spruce-Aurora, Colo., 2 Units
|
Natural Gas
|
2003
|
264
|
|
||||
|
Cherokee-Denver, Colo., 1 Unit
|
Natural Gas
|
1968
|
310
|
|
(a)
|
|||
|
Cherokee-Denver, Colo., 3 Units
|
Natural Gas
|
2015
|
576
|
|
||||
|
Fort St. Vrain-Platteville, Colo., 6 Units
|
Natural Gas
|
1972-2009
|
968
|
|
||||
|
Rocky Mountain-Keenesburg, Colo., 3 Units
|
Natural Gas
|
2004
|
580
|
|
||||
|
Various locations, 6 Units
|
Natural Gas
|
Various
|
171
|
|
||||
|
Hydro:
|
||||||||
|
Cabin Creek-Georgetown, Colo.
|
||||||||
|
Pumped Storage, 2 Units
|
Hydro
|
1967
|
210
|
|
||||
|
Various locations, 9 Units
|
Hydro
|
Various
|
26
|
|
||||
|
Total
|
5,086
|
|
||||||
(a)
Cherokee Unit 4 was fuel switched from coal to natural gas in the third quarter of 2017.
(b)
Based on PSCo’s ownership interest of
67 percent
of Unit 3.
(c)
Based on PSCo’s ownership interest of
10 percent
. Craig Unit 1 is expected to be early retired in approximately 2025.
(d)
Based on PSCo’s ownership interest of
76 percent
of Unit 1 and
37 percent
of Unit 2.
(e)
Valmont Unit 5 was retired in the third quarter of 2017.
47
|
SPS
Station, Location and Unit
|
Fuel
|
Installed
|
Summer 2017
Net Dependable
Capability (MW)
|
|||||
|
Steam:
|
||||||||
|
Cunningham-Hobbs, N.M., 2 Units
|
Natural Gas
|
1957-1965
|
254
|
|
||||
|
Harrington-Amarillo, Texas, 3 Units
|
Coal
|
1976-1980
|
1,018
|
|
||||
|
Jones-Lubbock, Texas, 2 Units
|
Natural Gas
|
1971-1974
|
486
|
|
||||
|
Maddox-Hobbs, N.M., 1 Unit
|
Natural Gas
|
1967
|
112
|
|
||||
|
Nichols-Amarillo, Texas, 3 Units
|
Natural Gas
|
1960-1968
|
457
|
|
||||
|
Plant X-Earth, Texas, 4 Units
|
Natural Gas
|
1952-1964
|
411
|
|
||||
|
Tolk-Muleshoe, Texas, 2 Units
|
Coal
|
1982-1985
|
1,067
|
|
||||
|
Combustion Turbine:
|
||||||||
|
Carlsbad-Carlsbad, N.M., 1 Unit
|
Natural Gas
|
1968
|
—
|
|
(a)
|
|||
|
Cunningham-Hobbs, N.M., 2 Units
|
Natural Gas
|
1998
|
212
|
|
||||
|
Jones-Lubbock, Texas, 2 Units
|
Natural Gas
|
2011-2013
|
336
|
|
||||
|
Maddox-Hobbs, N.M., 1 Unit
|
Natural Gas
|
1963-1976
|
61
|
|
||||
|
Total
|
4,414
|
|
||||||
(a)
Carlsbad Unit 5 was retired on Dec. 31, 2017.
Electric utility overhead and underground transmission and distribution lines (measured in conductor miles) at Dec. 31, 2017:
|
Conductor Miles
|
NSP-Minnesota
|
NSP-Wisconsin
|
PSCo
|
SPS
|
||||||||
|
500 KV
|
2,917
|
|
—
|
|
—
|
|
—
|
|
||||
|
345 KV
|
9,040
|
|
1,153
|
|
2,630
|
|
8,516
|
|
||||
|
230 KV
|
2,157
|
|
—
|
|
12,911
|
|
9,608
|
|
||||
|
161 KV
|
417
|
|
1,656
|
|
—
|
|
—
|
|
||||
|
138 KV
|
—
|
|
—
|
|
92
|
|
—
|
|
||||
|
115 KV
|
7,515
|
|
1,877
|
|
4,969
|
|
13,555
|
|
||||
|
Less than 115 KV
|
85,458
|
|
32,600
|
|
76,988
|
|
24,795
|
|
||||
Electric utility transmission and distribution substations at Dec. 31, 2017:
|
NSP-Minnesota
|
NSP-Wisconsin
|
PSCo
|
SPS
|
||||||||||
|
Quantity
|
349
|
|
—
|
|
203
|
|
230
|
|
454
|
|
|||
Natural gas utility mains at Dec. 31, 2017:
|
Miles
|
NSP-Minnesota
|
NSP-Wisconsin
|
PSCo
|
WGI
|
||||||||
|
Transmission
|
136
|
|
—
|
|
2,315
|
|
11
|
|
||||
|
Distribution
|
11,320
|
|
2,542
|
|
22,540
|
|
—
|
|
||||
48
Xcel Energy is involved in various litigation matters that are being defended and handled in the ordinary course of business. The assessment of whether a loss is probable or is a reasonable possibility, and whether the loss or a range of loss is estimable, often involves a series of complex judgments about future events. Management maintains accruals for such losses that are probable of being incurred and subject to reasonable estimation. Management is sometimes unable to estimate an amount or range of a reasonably possible loss in certain situations, including but not limited to when (1) the damages sought are indeterminate, (2) the proceedings are in the early stages, or (3) the matters involve novel or unsettled legal theories. In such cases, there is considerable uncertainty regarding the timing or ultimate resolution of such matters, including a possible eventual loss.
Additional Information
See Note 13 to the consolidated financial statements for further discussion of legal claims and environmental proceedings. See Item 1, Item 7 and Note 12 to the consolidated financial statements for a discussion of proceedings involving utility rates and other regulatory matters.
None.
Quarterly Stock Data
Xcel Energy Inc.’s common stock was listed on the New York Stock Exchange (NYSE) in 2017, but moved to the Nasdaq Global Select Market (Nasdaq) in 2018. The trading symbol is XEL. The number of common shareholders of record as of
Dec. 31, 2017
was approximately 59,270. The following are the intra-day high and low stock prices based on the NYSE Composite Transactions for the quarters of
2017
and
2016
and the dividends declared per share during those quarters. See Item 7 and Note 4 to the consolidated financial statements for further discussion of Xcel Energy Inc.’s dividend policy and restrictions.
|
2017
|
High
|
Low
|
Dividends
|
|||||||||
|
First quarter
|
$
|
45.06
|
|
$
|
40.04
|
|
$
|
0.3600
|
|
|||
|
Second quarter
|
48.50
|
|
44.00
|
|
0.3600
|
|
||||||
|
Third quarter
|
50.56
|
|
45.18
|
|
0.3600
|
|
||||||
|
Fourth quarter
|
52.22
|
|
46.86
|
|
0.3600
|
|
||||||
|
2016
|
High
|
Low
|
Dividends
|
|||||||||
|
First quarter
|
$
|
41.85
|
|
$
|
35.19
|
|
$
|
0.3400
|
|
|||
|
Second quarter
|
44.78
|
|
38.43
|
|
0.3400
|
|
||||||
|
Third quarter
|
45.42
|
|
40.34
|
|
0.3400
|
|
||||||
|
Fourth quarter
|
41.80
|
|
38.00
|
|
0.3400
|
|
||||||
The following compares our cumulative TSR on common stock with the cumulative TSR of the EEI Investor-Owned Electrics Index and the S&P 500 Composite Stock Price Index over the last five years (assuming a $100 investment on Dec. 31, 2012, and the reinvestment of all dividends).
49
The EEI Investor-Owned Electrics Index (market capitalization-weighted) included 43 companies at year-end and is a broad measure of industry performance.
COMPARISON OF FIVE YEAR CUMULATIVE TOTAL RETURN*
Among Xcel Energy Inc., the EEI Investor-Owned Electrics
and the S&P 500
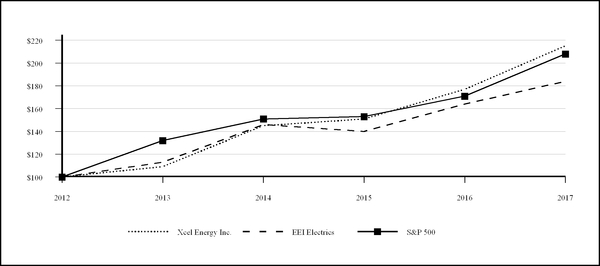
* $100 invested on Dec. 31, 2012 in stock or index — including reinvestment of dividends. Fiscal years ending Dec. 31.
|
2012
|
2013
|
2014
|
2015
|
2016
|
2017
|
||||||||||||||||||
|
Xcel Energy Inc.
|
$
|
100
|
|
$
|
109
|
|
$
|
145
|
|
$
|
151
|
|
$
|
177
|
|
$
|
215
|
|
|||||
|
EEI Investor-Owned Electrics
|
100
|
|
113
|
|
146
|
|
140
|
|
164
|
|
184
|
|
|||||||||||
|
S&P 500
|
100
|
|
132
|
|
151
|
|
153
|
|
171
|
|
208
|
|
|||||||||||
Securities Authorized for Issuance Under Equity Compensation Plans
Information required under Item 5
—
Securities Authorized for Issuance Under Equity Compensation Plans is contained in Xcel Energy Inc.’s Proxy Statement for its
2018
Annual Meeting of Shareholders, which is incorporated by reference.
UNREGISTERED SALES OF EQUITY SECURITIES AND USE OF PROCEEDS
Purchases of Equity Securities by the Issuer and Affiliated Purchasers
The following table provides information about our purchases of equity securities that are registered by Xcel Energy Inc. for the fourth quarter of fiscal year 2017, pursuant to Section 12 of the Exchange Act:
|
Issuer Purchases of Equity Securities
|
|||||||||||||
|
Period
|
Total Number
of Shares
Purchased
|
Average Price
Paid per Share
|
Total Number of
Shares Purchased as Part of Publicly Announced Plans or
Programs
|
Maximum Number of Shares That May Yet Be Purchased Under the Plans or Programs
|
|||||||||
|
Oct. 1, 2017 — Dec. 31, 2017
|
—
|
|
$
|
—
|
|
||||||||
|
Total
|
—
|
|
|
|
—
|
|
—
|
|
|||||
50
Set forth below is selected financial data for Xcel Energy related to the most five recent years ended Dec. 31. This information has been derived from and should be read in conjunction with the consolidated financial statements and notes appearing elsewhere in this annual report on Form 10-K.
|
(Millions of Dollars, Millions of Shares, Except Per Share Data)
|
2017
|
2016
|
2015
|
2014
|
2013
|
|||||||||||||||
|
Operating revenues
|
$
|
11,404
|
|
$
|
11,107
|
|
$
|
11,024
|
|
$
|
11,686
|
|
$
|
10,915
|
|
|||||
|
Operating expenses
|
9,214
|
|
8,893
|
|
9,024
|
|
9,738
|
|
9,067
|
|
||||||||||
|
Net income
|
1,148
|
|
1,123
|
|
984
|
|
1,021
|
|
948
|
|
||||||||||
|
Earnings available to common shareholders
|
1,148
|
|
1,123
|
|
984
|
|
1,021
|
|
948
|
|
||||||||||
|
Weighted average common shares outstanding:
|
||||||||||||||||||||
|
Basic
|
509
|
|
509
|
|
508
|
|
504
|
|
496
|
|
||||||||||
|
Diluted
|
509
|
|
509
|
|
508
|
|
504
|
|
497
|
|
||||||||||
|
GAAP EPS:
|
||||||||||||||||||||
|
Basic
|
$
|
2.26
|
|
$
|
2.21
|
|
$
|
1.94
|
|
$
|
2.03
|
|
$
|
1.91
|
|
|||||
|
Diluted
|
2.25
|
|
2.21
|
|
1.94
|
|
2.03
|
|
1.91
|
|
||||||||||
|
Dividends declared per common share
|
1.44
|
|
1.36
|
|
1.28
|
|
1.20
|
|
1.11
|
|
||||||||||
|
Total assets
(a) (b)
|
43,030
|
|
41,155
|
|
38,821
|
|
36,958
|
|
33,907
|
|
||||||||||
|
Long-term debt
(b)
(c)
|
14,520
|
|
14,195
|
|
12,399
|
|
11,500
|
|
10,911
|
|
||||||||||
|
Book value per share
|
22.56
|
|
21.73
|
|
20.89
|
|
20.20
|
|
19.21
|
|
||||||||||
|
Return on average common equity
|
10.2
|
%
|
10.4
|
%
|
9.5
|
%
|
10.3
|
%
|
10.3
|
%
|
||||||||||
|
Ratio of earnings to fixed charges
(d)
|
3.3
|
|
3.3
|
|
3.2
|
|
3.3
|
|
3.1
|
|
||||||||||
|
Non-GAAP:
|
||||||||||||||||||||
|
Ongoing earnings
(e)
|
$
|
1,171
|
|
$
|
1,123
|
|
$
|
1,064
|
|
$
|
1,021
|
|
$
|
968
|
|
|||||
|
Ongoing diluted EPS
(e)
|
2.30
|
|
2.21
|
|
2.09
|
|
2.03
|
|
1.95
|
|
||||||||||
|
(a)
|
As a result of adopting ASU No. 2015-17 (
Balance Sheet Classification of Deferred Taxes, Topic 740
), $140 million of current deferred income taxes was retrospectively reclassified to long-term deferred income tax liabilities on the consolidated balance sheet as of Dec. 31, 2015.
|
|
(b)
|
As a result of adopting ASU No. 2015-03 (
Simplifying the Presentation of Debt Issuance Costs, Subtopic 835-30
), $92 million of deferred debt issuance costs was retrospectively reclassified from other non-current assets to long-term debt on the consolidated balance sheet as of Dec. 31, 2015.
|
|
(c)
|
Includes capital lease obligations.
|
|
(d)
|
See Exhibit 12.01.
|
|
(e)
|
See Item 7 for reconciliations of ongoing earnings and diluted EPS to GAAP earnings and diluted EPS.
|
Business Segments and Organizational Overview
Xcel Energy Inc. is a public utility holding company. Xcel Energy’s operations included the activity of four utility subsidiaries that serve electric and natural gas customers in eight states. These utility subsidiaries are NSP-Minnesota, NSP-Wisconsin, PSCo and SPS. These utilities serve customers in portions of Colorado, Michigan, Minnesota, New Mexico, North Dakota, South Dakota, Texas and Wisconsin. Along with the TransCo subsidiaries, WYCO, a joint venture formed with CIG to develop and lease natural gas pipelines, storage and compression facilities, and WGI, an interstate natural gas pipeline company, these companies comprise the regulated utility operations.
Xcel Energy Inc.’s nonregulated subsidiaries are Eloigne and Capital Services. Eloigne invests in rental housing projects that qualify for low-income housing tax credits, and Capital Services procures equipment for construction of renewable generation facilities at other subsidiaries.
51
Forward-Looking Statements
Except for the historical statements contained in this report, the matters discussed herein are forward-looking statements that are subject to certain risks, uncertainties and assumptions. Such forward-looking statements, including the 2018 EPS guidance
,
the TCJA’s impact to Xcel Energy and its customers, long-term earnings per share and dividend growth rate, as well as assumptions and other statements identified in this document by the words “anticipate,” “believe,” “could,” “estimate,” “expect,” “intend,” “may,” “objective,” “outlook,” “plan,” “project,” “possible,” “potential,” “should,” “will,” “would” and similar expressions. Actual results may vary materially. Forward-looking statements speak only as of the date they are made, and we expressly disclaim any obligation to update any forward-looking information. The following factors, in addition to those discussed elsewhere in this Annual Report on Form 10-K for the fiscal year ended Dec. 31, 2017 (including the items described under Factors Affecting Results of Operations; and the other risk factors listed from time to time by Xcel Energy Inc. in reports filed with the SEC, including “Risk Factors” in Item 1A of this Annual Report on Form 10-K and Exhibit 99.01 hereto), could cause actual results to differ materially from management expectations as suggested by such forward-looking information: general economic conditions, including inflation rates, monetary fluctuations and their impact on capital expenditures and the ability of Xcel Energy Inc. and its subsidiaries to obtain financing on favorable terms; business conditions in the energy industry, including the risk of a slow down in the U.S. economy or delay in growth, recovery, trade, fiscal, taxation and environmental policies in areas where Xcel Energy has a financial interest; customer business conditions; actions of credit rating agencies; competitive factors including the extent and timing of the entry of additional competition in the markets served by Xcel Energy and its subsidiaries; unusual weather; effects of geopolitical events, including war and acts of terrorism; cyber security threats and data security breaches; state, federal and foreign legislative and regulatory initiatives that affect cost and investment recovery, have an impact on rates or have an impact on asset operation or ownership or impose environmental compliance conditions; structures that affect the speed and degree to which competition enters the electric and natural gas markets; costs and other effects of legal and administrative proceedings, settlements, investigations and claims; financial or regulatory accounting policies imposed by regulatory bodies; outcomes of regulatory proceedings; availability or cost of capital; and employee work force factors.
Management’s Strategic Priorities
Xcel Energy’s vision is to be the preferred and trusted provider of the energy our customers need. We continually evolve our business to meet the changing needs of our customers, investors and policymakers. We strive to provide our investors an attractive value proposition and our customers with safe, clean and reliable energy services at a competitive price. This mission is enabled via three key strategic priorities:
|
•
|
Lead the clean energy transition;
|
|
•
|
Enhance the customer experience; and
|
|
•
|
Keep bills low.
|
Successful execution of our strategic objectives should allow Xcel Energy to continue to deliver a competitive total return for our shareholders. Below is a discussion of these objectives.
Lead the clean energy transition
For more than a decade, we have managed the risk of climate change and increasing customer demand for renewable energy through a clean energy strategy that consistently reduces carbon emissions and transitions our operations for the future. As a result, we have successfully reduced our carbon emissions by 35 percent from 2005 to 2017. We expect to reduce our carbon footprint by 45 percent by 2021 and by 60 percent by 2030 (over 2005 levels).
Our service territories benefit from the geographic concentration of favorable renewable resources. Strong wind and high solar irradiance yield high generation capacity factors, which lowers the cost of these resources. The combination of high capacity factors, grid options from transmission investment and market operations, improved supply chain, technological improvements and the extension of the renewable tax credits translates into low renewable energy costs for our customers. As a result, we are able to invest in renewable generation, in which the capital costs are largely or completely offset by fuel savings. This provides us the opportunity to lower the emission profile of our generation fleet, grow our renewable portfolio and provide significant fuel savings to our customers. We call this our “Steel for Fuel” strategy.
52
We are transitioning how we produce, deliver and encourage the efficient use of energy through four primary mechanisms:
|
•
|
Increasing the use of affordable renewable energy;
|
|
•
|
Offering energy efficiency programs for customers;
|
|
•
|
Retiring or repowering coals units and modernizing our generating plants; and
|
|
•
|
Advancing power grid capabilities.
|
We have announced ambitious plans to add 3,680 MW of wind energy on our system by 2021. This includes:
|
•
|
The 600 MW Rush Creek project in Colorado that is under construction and will be owned entirely by Xcel Energy;
|
|
•
|
The 1,550 MW of wind generation in Minnesota and the Dakotas. This project has been approved by the MPUC and will include 1,150 MW of ownership and 400 MW of PPAs;
|
|
•
|
The proposed 1,230 MW of wind projects in Texas and New Mexico, which includes 1,000 MW of ownership and 230 MW of PPAs; and
|
|
•
|
The proposed 300 MW Dakota Range wind project in South Dakota.
|
In addition, the proposed CEP encompasses the retirement of 660 MW from two coal-fired units at Comanche and the potential addition of up to 1,000 MW of wind, 700 MW of solar and 700 MW of natural gas and/or storage.
Enhance the customer experience
The utility landscape is changing, and we must continue to thoughtfully anticipate and address the future needs of our stakeholders, including our customers, policymakers, employees and shareholders. Adapting to this changing environment is critical to our long-term success. Our customers expect to have choices, and we are committed to providing options and solutions that they want and value at a competitive price. Our continued investment in clean energy is an example of this commitment to our customers. Environmental stewardship remains foundational to Xcel Energy and our desire is to more broadly impact our customers and communities while creating shareholder value.
We will continue to expand our production of renewable energy, including wind and solar alternatives, and further develop and promote DSM, conservation and renewable programs. We are also in the process of transforming our transmission and distribution systems to accommodate increased levels of renewables, distributed energy resources and corresponding data growth, while maintaining high levels of reliability and security and keeping customer bills affordable. Finally, we are improving our communications to enable customers to interact with us in the way they prefer.
Keep bills low
Xcel Energy is very focused on our customers and the impact our actions have on the bill. Our objective is to keep total bill increases at or below the rate of inflation so our prices remain competitive relative to alternatives. We expect to continue to keep our customer bills low by executing on our Steel for Fuel plan, controlling O&M costs and promoting energy efficiency and conservation.
Xcel Energy is working to keep O&M expense relatively flat without compromising reliability or safety. We intend to accomplish this objective by continually improving our processes, leveraging technology, proactively managing risk and maintaining a workforce that is prepared to meet the needs of our business today and tomorrow. As a result of these actions, Xcel Energy’s 2017 O&M was lower than 2014 levels.
Provide a competitive total return to investors and maintain strong investment grade credit rating
Through our disciplined approach to business growth, financial investment, operations and safety, we plan to:
|
•
|
Deliver long-term annual EPS growth of five percent to six percent;
|
|
•
|
Deliver annual dividend increases of five percent to seven percent;
|
|
•
|
Target a dividend payout ratio of 60 to 70 percent of annual ongoing EPS; and
|
|
•
|
Maintain senior secured debt credit ratings in the A range and senior unsecured debt credit ratings in the BBB+ to A range.
|
53
We have consistently achieved our financial objectives, meeting or exceeding our earnings guidance range for thirteen consecutive years, and we believe we are positioned to continue to deliver on our value proposition. Our ongoing earnings have grown approximately 5.9 percent and our dividend has grown approximately 4.4 percent annually from 2005 through 2017. In addition, our current senior unsecured debt credit ratings for Xcel Energy and its utility subsidiaries are in the BBB+ to A range, while our secured operating company debt ratings are in the A range. Although the TCJA placed pressure on our credit metrics, we are taking steps to retain the health of our credit ratings.
Responsible by nature
We understand the important role we play as a member of society: meeting a basic need, taking great care of the investments made in our company and engaging with our communities in ways that helps them thrive. We believe energy is a critical service for all people; one that enhances quality of life and enables economic progress. We know our investors and their customers are putting their faith in us to create economic value for them and their families over the long term, and we will continue to prepare for tomorrow to retain their trust in us. We exist because of the families, businesses and cities that rely on us, and we are privileged to serve them. We see our success not simply as a measure of profit but also as our broader impact on the public good.
Financial Review
The following discussion and analysis by management focuses on those factors that had a material effect on Xcel Energy’s financial condition, results of operations and cash flows during the periods presented, or are expected to have a material impact in the future. It should be read in conjunction with the accompanying consolidated financial statements and the related notes to consolidated financial statements.
The only common equity securities that are publicly traded are common shares of Xcel Energy Inc. The diluted earnings and EPS of each subsidiary as well as the ROE of each subsidiary discussed below do not represent a direct legal interest in the assets and liabilities allocated to such subsidiary, but rather represent a direct interest in our assets and liabilities as a whole. Ongoing diluted EPS and ongoing ROE for Xcel Energy and by subsidiary are financial measures not recognized under GAAP. Ongoing diluted EPS is calculated by dividing the net income or loss attributable to the controlling interest of each subsidiary, adjusted for certain nonrecurring items, by the weighted average fully diluted Xcel Energy Inc. common shares outstanding for the period. Ongoing ROE is calculated by dividing the net income or loss attributable to the controlling interest of Xcel Energy or each subsidiary, adjusted for certain nonrecurring items, by each entity’s average common stockholders’ or stockholder’s equity. We use these non-GAAP financial measures to evaluate and provide details of earnings results. We believe these measurements are useful to investors to evaluate the actual and projected financial performance and contribution of our subsidiaries. These non-GAAP financial measures should not be considered as alternatives to measures calculated and reported in accordance with GAAP.
Results of Operations
The following tables summarize diluted EPS for Xcel Energy at Dec. 31:
|
2017
|
2016
|
2015
|
||||||||||||||||||||||||||
|
Diluted Earnings (Loss) Per Share
|
GAAP Diluted EPS
|
Impact of TCJA
|
Ongoing Diluted EPS
|
GAAP and Ongoing Diluted EPS
|
GAAP Diluted EPS
|
Loss on Monticello LCM/EPU Project
|
Ongoing Diluted EPS
(b)
|
|||||||||||||||||||||
|
NSP-Minnesota
|
$
|
0.96
|
|
$
|
0.05
|
|
$
|
1.01
|
|
$
|
0.96
|
|
$
|
0.70
|
|
$
|
0.16
|
|
$
|
0.85
|
|
|||||||
|
PSCo
|
0.97
|
|
(0.03
|
)
|
0.94
|
|
0.91
|
|
0.92
|
|
—
|
|
0.92
|
|
||||||||||||||
|
SPS
|
0.31
|
|
(0.01
|
)
|
0.30
|
|
0.30
|
|
0.25
|
|
—
|
|
0.25
|
|
||||||||||||||
|
NSP-Wisconsin
|
0.16
|
|
—
|
|
0.16
|
|
0.14
|
|
0.15
|
|
—
|
|
0.15
|
|
||||||||||||||
|
Equity earnings of unconsolidated subsidiaries
(a)
|
0.07
|
|
(0.04
|
)
|
0.03
|
|
0.05
|
|
0.04
|
|
—
|
|
0.04
|
|
||||||||||||||
|
Regulated utility
(b)
|
$
|
2.47
|
|
$
|
(0.03
|
)
|
$
|
2.45
|
|
$
|
2.35
|
|
$
|
2.06
|
|
$
|
0.16
|
|
$
|
2.21
|
|
|||||||
|
Xcel Energy Inc. and other
|
(0.22
|
)
|
0.07
|
|
(0.15
|
)
|
(0.15
|
)
|
(0.11
|
)
|
—
|
|
(0.11
|
)
|
||||||||||||||
|
Total
(b)
|
$
|
2.25
|
|
$
|
0.05
|
|
$
|
2.30
|
|
$
|
2.21
|
|
$
|
1.94
|
|
$
|
0.16
|
|
$
|
2.09
|
|
|||||||
|
(a)
|
Includes income taxes.
|
|
(b)
|
Amounts may not add due to rounding.
|
54
Xcel Energy’s management believes that ongoing earnings provide a meaningful comparison of earnings results and is representative of Xcel Energy’s fundamental core earnings power. Xcel Energy’s management uses ongoing earnings internally for financial planning and analysis, for reporting of results to the Board of Directors, in determining whether performance targets are met for performance-based compensation and when communicating its earnings outlook to analysts and investors.
2017 Adjustment to GAAP Earnings
Impact of the TCJA
— Xcel Energy recognized an estimated one-time, non-cash, income tax expense of approximately $23 million in the fourth quarter of 2017 for net excess deferred tax assets which may not be recovered from customers or not attributable to regulated operations, increased valuation allowances, etc. due to the enactment of the TCJA in December 2017. The income tax expense associated with the TCJA enactment has been excluded from Xcel Energy’s 2017 ongoing earnings, given the non-recurring nature of the TCJA’s broad and sweeping reform of the IRC. See Note 6 to the consolidated financial statements for further discussion.
2015 Adjustment to GAAP Earnings
Loss on Monticello LCM/EPU Project
— In March 2015, the MPUC approved full recovery, including a return, on $415 million of the project costs, inclusive of AFUDC, but only allowed recovery of the remaining $333 million of costs with no return on this portion of the investment for 2015 and beyond. As a result of this decision, Xcel Energy recorded a pre-tax charge of approximately $129 million, or $79 million net of tax, in the first quarter of 2015. See Note 12 to the consolidated financial statements for further discussion.
Earnings Adjusted for Certain Items
2017
Comparison with
2016
Xcel Energy
— GAAP earnings increased $0.04 per share for 2017. Ongoing earnings increased
$0.09
per share, excluding the impact of the TCJA. Earnings were higher as a result of increased electric and natural gas margins to recover infrastructure investments, reduced O&M expenses, a lower ETR and higher AFUDC. These positive factors were partially offset by increased depreciation expense, interest charges and property taxes.
NSP-Minnesota
— GAAP earnings were flat for 2017. Ongoing earnings increased $0.05 per share, excluding the impact of the TCJA. The change reflects higher electric margins driven by a 2017 Minnesota rate increase as well as increased gas margins, a lower ETR and reduced O&M expenses. The decrease in the ETR is largely driven by resolution of IRS appeals/audits and an increase in wind PTCs, which are flowed back to customers and reduce electric margin. Lower O&M expenses primarily relate to reduced expenses for nuclear refueling outages and overhauls at generation facilities. These positive factors were partially offset by higher depreciation expense due to increased invested capital as well as prior year amortization of Minnesota’s excess depreciation reserve and higher property taxes.
PSCo
— GAAP earnings increased $0.06 per share for 2017. Ongoing earnings increased $0.03 per share, excluding the impact of the TCJA. The increase in earnings was driven by higher electric and natural gas margins, increased AFUDC primarily related to the Rush Creek wind project, a decrease in O&M expenses (timing of generation outages) and a lower ETR, partially offset by higher depreciation expense, interest charges and the impact of unfavorable weather.
SPS
— GAAP earnings increased $0.01 per share for 2017. Ongoing earnings were flat, excluding the impact of the TCJA. Rate increases in Texas and New Mexico and a lower ETR were offset by higher depreciation expense (representing continued investment), O&M expenses (including the prior year deferrals associated with the Texas 2016 rate case), property taxes and the impact of unfavorable weather.
NSP-Wisconsin
— GAAP and ongoing earnings increased $0.02 per share for 2017. The change in ongoing earnings was driven by a rise in electric and natural gas rates, partially offset by additional depreciation expense related to continued transmission and distribution investments and higher O&M expenses.
Equity earnings of unconsolidated subsidiaries
— GAAP earnings increased $0.02 per share for 2017. Ongoing earnings of unconsolidated subsidiaries decreased $0.02 per share, excluding the impact of the TCJA. The decline primarily related to lower revenues due to lower rates at our WYCO subsidiary, which develops and leases natural gas pipelines, storage and compression facilities.
55
2016
Comparison with
2015
Xcel Energy
— 2016 GAAP earnings increased due to the 2015 loss on Monticello LCM/EPU project; see Note 12 for further information. Ongoing earnings increased
$0.12
per share (GAAP earnings increased $0.28 per share). Increases in electric and natural gas margins were primarily driven by higher rates and riders across various jurisdictions to recover our capital investments and the favorable impact of weather as compared with the previous year. These positive factors and a lower ETR were partially offset by higher depreciation, interest charges and property taxes.
NSP-Minnesota
— 2016 GAAP earnings increased due to the 2015 loss on Monticello LCM/EPU project; see Note 12 for further information. Ongoing earnings increased
$0.11
per share due to the following: higher electric margins primarily driven by an interim electric rate increase in Minnesota (net of estimated provision for refund); non-fuel riders; the favorable impact of weather; and a lower ETR. These positive factors were partially offset by higher depreciation, O&M expenses, interest charges and property taxes.
PSCo
— Earnings decreased
$0.01
per share for 2016. The positive impact of higher natural gas margins (primarily due to a rate increase), sales growth and a lower estimated electric earnings test refund, were more than offset by increased depreciation and interest charges.
SPS
— Earnings increased
$0.05
per share for 2016. Higher electric margins and lower O&M expenses were partially offset by an increase in depreciation and interest charges.
NSP-Wisconsin
— Earnings decreased
$0.01
per share for 2016. The positive impact of higher electric margins (primarily driven by an electric rate increase) was more than offset by higher O&M expenses and depreciation.
Equity earnings of unconsolidated subsidiaries
— Earnings of unconsolidated subsidiaries increased $0.01 per share in 2016 due to facility expansion and increased revenue at WYCO.
Xcel Energy Inc. and other
— Xcel Energy Inc. and other includes financing costs at the holding company and other items.
The decrease in earnings was primarily related to higher long-term debt levels.
Changes in Diluted EPS
The following tables summarize significant components contributing to the changes in
2017
EPS compared with the same period in
2016
and 2016 EPS compared with the same period in 2015:
|
Diluted Earnings (Loss) Per Share
|
Dec. 31
|
|||
|
GAAP and ongoing diluted EPS — 2016
|
$
|
2.21
|
|
|
|
Components of change — 2017 vs. 2016
|
||||
|
Higher electric margins
(a)
|
0.16
|
|
||
|
Lower ETR
(b)
|
0.07
|
|
||
|
Higher natural gas margins
|
0.03
|
|
||
|
Higher AFUDC — equity
|
0.03
|
|
||
|
Lower O&M expenses
|
0.03
|
|
||
|
Higher depreciation and amortization
|
(0.21
|
)
|
||
|
Higher conservation and DSM program expenses
(c)
|
(0.03
|
)
|
||
|
Higher interest charges
|
(0.02
|
)
|
||
|
Higher taxes (other than income taxes)
|
(0.02
|
)
|
||
|
Equity earnings of unconsolidated subsidiaries
|
(0.02
|
)
|
||
|
Other, net
|
0.02
|
|
||
|
GAAP diluted EPS — 2017
|
2.25
|
|
||
|
Impact of the TCJA
|
0.05
|
|
||
|
Ongoing diluted EPS — 2017
|
$
|
2.30
|
|
|
|
(a)
|
Includes an increase of $23 million in revenues from conservation and DSM programs, offset by related expenses, for the twelve months ended Dec. 31, 2017.
|
|
(b)
|
The ETR includes the impact of an additional $20 million of wind PTCs for the twelve months ended Dec. 31, 2017, which are largely flowed back to customers through electric margin, as well as the impact of the TCJA recorded in the fourth quarter of 2017.
|
|
(c)
|
Offset by higher revenues.
|
56
|
Diluted Earnings (Loss) Per Share
|
Dec. 31
|
|||
|
GAAP diluted EPS — 2015
|
$
|
1.94
|
|
|
|
Loss on Monticello LCM/EPU project
|
0.16
|
|
||
|
Ongoing diluted EPS — 2015
(a)
|
2.09
|
|
||
|
Components of change — 2016 vs. 2015
|
|
|
||
|
Higher electric margins
|
0.32
|
|
||
|
Lower ETR
|
0.06
|
|
||
|
Higher natural gas margins
|
0.04
|
|
||
|
Higher depreciation and amortization
|
(0.21
|
)
|
||
|
Higher interest charges
|
(0.06
|
)
|
||
|
Higher taxes (other than income taxes)
|
(0.02
|
)
|
||
|
Other, net
|
(0.01
|
)
|
||
|
GAAP and ongoing diluted EPS — 2016
|
$
|
2.21
|
|
|
|
(a)
|
Amounts may not add due to rounding.
|
The following tables summarize the ROE for Xcel Energy and its utility subsidiaries at Dec. 31:
|
ROE — 2017
|
NSP-Minnesota
|
PSCo
|
SPS
|
NSP-Wisconsin
|
Operating Companies
|
Xcel Energy
|
||||||||||||
|
GAAP ROE
|
9.05
|
%
|
8.90
|
%
|
7.84
|
%
|
9.41
|
%
|
8.84
|
%
|
10.21
|
%
|
||||||
|
Impact of the TCJA
|
0.45
|
|
(0.24
|
)
|
(0.30
|
)
|
0.09
|
|
0.03
|
|
0.21
|
|
||||||
|
Ongoing ROE
|
9.50
|
%
|
8.66
|
%
|
7.54
|
%
|
9.50
|
%
|
8.87
|
%
|
10.42
|
%
|
||||||
|
ROE — 2016
|
NSP-Minnesota
|
PSCo
|
SPS
|
NSP-Wisconsin
|
Operating Companies
|
Xcel Energy
|
||||||||||||
|
GAAP and ongoing ROE
|
9.29
|
%
|
8.92
|
%
|
8.14
|
%
|
8.63
|
%
|
8.94
|
%
|
10.39
|
%
|
||||||
The following tables provide reconciliations of GAAP earnings (net income) to ongoing earnings and GAAP diluted EPS to ongoing diluted EPS for the years ended Dec. 31:
|
(Millions of Dollars)
|
2017
|
2016
|
2015
|
|||||||||
|
GAAP earnings
|
$
|
1,148
|
|
$
|
1,123
|
|
$
|
985
|
|
|||
|
Estimated impact of TCJA
|
23
|
|
—
|
|
—
|
|
||||||
|
Loss on Monticello LCM/EPU project
|
—
|
|
—
|
|
79
|
|
||||||
|
Ongoing earnings
|
$
|
1,171
|
|
$
|
1,123
|
|
$
|
1,064
|
|
|||
|
Diluted Earnings Per Share
|
2017
|
2016
|
2015
|
|||||||||
|
GAAP diluted EPS
|
$
|
2.25
|
|
$
|
2.21
|
|
$
|
1.94
|
|
|||
|
Estimated impact of TCJA
|
0.05
|
|
—
|
|
—
|
|
||||||
|
Loss on Monticello LCM/EPU project
|
—
|
|
—
|
|
0.16
|
|
||||||
|
Ongoing diluted EPS
(a)
|
$
|
2.30
|
|
$
|
2.21
|
|
$
|
2.09
|
|
|||
|
(a)
|
Amounts may not add due to rounding.
|
The following discussion summarizes the items that affected the individual revenue and expense items reported in the consolidated statements of income.
Estimated Impact of Temperature Changes on Regulated Earnings
— Unusually hot summers or cold winters increase electric and natural gas sales, while mild weather reduces electric and natural gas sales. The estimated impact of weather on earnings is based on the number of customers, temperature variances and the amount of natural gas or electricity the average customer historically uses per degree of temperature. Accordingly, deviations in weather from normal levels can affect Xcel Energy’s financial performance.
57
Degree-day or Temperature-Humidity Index (THI) data is used to estimate amounts of energy required to maintain comfortable indoor temperature levels based on each day’s average temperature and humidity. Heating degree-days (HDD) is the measure of the variation in the weather based on the extent to which the average daily temperature falls below 65° Fahrenheit. Cooling degree-days (CDD) is the measure of the variation in the weather based on the extent to which the average daily temperature rises above 65° Fahrenheit. Each degree of temperature above 65° Fahrenheit is counted as one CDD, and each degree of temperature below 65° Fahrenheit is counted as one HDD. In Xcel Energy’s more humid service territories, a THI is used in place of CDD, which adds a humidity factor to CDD. HDD, CDD and THI are most likely to impact the usage of Xcel Energy’s residential and commercial customers. Industrial customers are less sensitive to weather.
Normal weather conditions are defined as either the 20-year or 30-year average of actual historical weather conditions. The historical period of time used in the calculation of normal weather differs by jurisdiction, based on regulatory practice. To calculate the impact of weather on demand, a demand factor is applied to the weather impact on sales as defined above to derive the amount of demand associated with the weather impact.
The percentage increase (decrease) in normal and actual HDD, CDD and THI are provided in the following table:
|
2017 vs.
Normal |
2016 vs.
Normal |
2017 vs.
2016 |
2015 vs.
Normal |
2016 vs.
2015 |
||||||||||
|
HDD
|
(10.0
|
)%
|
(13.4
|
)%
|
2.6
|
%
|
(7.9
|
)%
|
(5.5
|
)%
|
||||
|
CDD
|
6.5
|
|
11.1
|
|
(3.5
|
)
|
6.2
|
|
5.1
|
|
||||
|
THI
|
(11.3
|
)
|
7.7
|
|
(18.5
|
)
|
(2.3
|
)
|
10.9
|
|
||||
Weather
— The following table summarizes the estimated impact of temperature variations on EPS compared with normal weather conditions:
|
2017 vs.
Normal |
2016 vs.
Normal |
2017 vs.
2016 |
2015 vs.
Normal
|
2016 vs.
2015
|
|||||||||||||||
|
Retail electric
|
$
|
(0.036
|
)
|
$
|
0.004
|
|
$
|
(0.040
|
)
|
$
|
(0.020
|
)
|
$
|
0.024
|
|
||||
|
Firm natural gas
|
(0.023
|
)
|
(0.025
|
)
|
0.002
|
|
(0.018
|
)
|
(0.007
|
)
|
|||||||||
|
Total (excluding decoupling)
|
$
|
(0.059
|
)
|
$
|
(0.021
|
)
|
$
|
(0.038
|
)
|
$
|
(0.038
|
)
|
$
|
0.017
|
|
||||
|
Decoupling — Minnesota
|
0.022
|
|
(0.002
|
)
|
0.024
|
|
—
|
|
(0.002
|
)
|
|||||||||
|
Total (adjusted for recovery from decoupling)
|
$
|
(0.037
|
)
|
$
|
(0.023
|
)
|
$
|
(0.014
|
)
|
$
|
(0.038
|
)
|
$
|
0.015
|
|
||||
Sales Growth
(Decline)
— The following tables summarize Xcel Energy and its utility subsidiaries’ sales growth (decline) for actual and weather-normalized sales for the years ended Dec. 31, compared with the previous year:
|
2017 vs. 2016
|
|||||||||||||||
|
NSP-Minnesota
|
PSCo
|
SPS
|
NSP-Wisconsin
|
Xcel Energy
|
|||||||||||
|
Actual
|
|||||||||||||||
|
Electric residential
(a)
|
(2.1
|
)%
|
(1.8
|
)%
|
(3.5
|
)%
|
(0.8
|
)%
|
(2.1
|
)%
|
|||||
|
Electric C&I
|
(1.4
|
)
|
(0.1
|
)
|
1.3
|
|
2.2
|
|
(0.1
|
)
|
|||||
|
Total retail electric sales
|
(1.6
|
)
|
(0.6
|
)
|
0.2
|
|
1.3
|
|
(0.7
|
)
|
|||||
|
Firm natural gas sales
|
9.3
|
|
(2.2
|
)
|
N/A
|
|
11.3
|
|
2.1
|
|
|||||
|
2017 vs. 2016
|
|||||||||||||||
|
NSP-Minnesota
|
PSCo
|
SPS
|
NSP-Wisconsin
|
Xcel Energy
|
|||||||||||
|
Weather-normalized
|
|||||||||||||||
|
Electric residential
(a)
|
(0.7
|
)%
|
(1.6
|
)%
|
(1.2
|
)%
|
0.3
|
%
|
(1.0
|
)%
|
|||||
|
Electric C&I
|
(1.0
|
)
|
0.1
|
|
1.5
|
|
2.5
|
|
0.2
|
|
|||||
|
Total retail electric sales
|
(1.0
|
)
|
(0.4
|
)
|
0.9
|
|
1.8
|
|
(0.2
|
)
|
|||||
|
Firm natural gas sales
|
4.7
|
|
0.6
|
|
N/A
|
|
5.7
|
|
2.2
|
|
|||||
58
|
2017 vs. 2016 (Excluding Leap Day)
(b)
|
|||||||||||||||
|
NSP-Minnesota
|
PSCo
|
SPS
|
NSP-Wisconsin
|
Xcel Energy
|
|||||||||||
|
Weather-normalized
-
adjusted for leap day
|
|||||||||||||||
|
Electric residential
(a)
|
(0.5
|
)%
|
(1.3
|
)%
|
(1.0
|
)%
|
0.6
|
%
|
(0.8
|
)%
|
|||||
|
Electric C&I
|
(0.8
|
)
|
0.3
|
|
1.8
|
|
2.7
|
|
0.4
|
|
|||||
|
Total retail electric sales
|
(0.7
|
)
|
(0.2
|
)
|
1.1
|
|
2.1
|
|
0.1
|
|
|||||
|
Firm natural gas sales
|
5.2
|
|
1.1
|
|
N/A
|
|
6.3
|
|
2.7
|
|
|||||
(a)
Extreme weather variations, windchill and cloud cover may not be reflected in weather-normalized and actual growth (decline) estimates.
|
(b)
|
The estimated impact of the 2016 leap day is excluded to present a more comparable year-over-year presentation. The estimated impact of the additional day of sales in 2016 was approximately 0.3 percent for retail electric and 0.5 percent for firm natural gas for the twelve months ended.
|
Weather-normalized 2017 Electric Sales Growth (Decline) (Excluding Leap Day)
|
•
|
NSP-Minnesota’s residential sales decrease was a result of lower use per customer, partially offset by customer growth. The decline in commercial and industrial (C&I) sales was largely due to reduced usage, which offset an increase in the number of customers. Declines in services more than offset increased sales to large customers in manufacturing and energy industries.
|
|
•
|
PSCo’s decline in residential sales reflects lower use per customer, partially offset by customer additions. C&I growth was mainly due to an increase in customers and higher use for large C&I customers that support the mining, oil and natural gas industries, partially offset by lower use for the small C&I class.
|
|
•
|
SPS’ residential sales fell largely due to lower use per customer. The increase in C&I sales reflects customer additions and greater use for large C&I customers driven by the oil and natural gas industry in the Permian Basin.
|
|
•
|
NSP-Wisconsin’s residential sales increase was primarily attributable to higher use per customer and customer additions. C&I growth was largely due to higher use per customer and increased sales to customers in the sand mining industry and large customers in the energy and manufacturing industries.
|
Weather-normalized 2017 Natural Gas Sales Growth (Excluding Leap Day)
|
•
|
Across service territories, higher natural gas sales reflect an increase in the number of customers, partially offset by a decline in customer use.
|
Weather-normalized sales for 2018 are projected to be within a range of 0 percent to 0.5 percent over 2017 levels for retail electric customers and 0 percent to 0.5 percent below 2017 levels for firm natural gas customers.
|
2016 vs. 2015
|
|||||||||||||||
|
NSP-Minnesota
|
PSCo
|
SPS
|
NSP-Wisconsin
|
Xcel Energy
|
|||||||||||
|
Actual
|
|||||||||||||||
|
Electric residential
(a)
|
1.2
|
%
|
1.8
|
%
|
(1.6
|
)%
|
0.3
|
%
|
0.9
|
%
|
|||||
|
Electric C&I
|
(0.5
|
)
|
(0.4
|
)
|
1.1
|
|
(0.1
|
)
|
—
|
|
|||||
|
Total retail electric sales
|
—
|
|
0.4
|
|
0.7
|
|
(0.1
|
)
|
0.3
|
|
|||||
|
Firm natural gas sales
|
(4.1
|
)
|
(1.1
|
)
|
N/A
|
|
(7.4
|
)
|
(2.4
|
)
|
|||||
|
2016 vs. 2015
|
|||||||||||||||
|
NSP-Minnesota
|
PSCo
|
SPS
|
NSP-Wisconsin
|
Xcel Energy
|
|||||||||||
|
Weather-normalized
|
|||||||||||||||
|
Electric residential
(a)
|
0.1
|
%
|
1.9
|
%
|
(1.3
|
)%
|
(0.2
|
)%
|
0.5
|
%
|
|||||
|
Electric C&I
|
(0.8
|
)
|
(0.4
|
)
|
0.8
|
|
(0.2
|
)
|
(0.3
|
)
|
|||||
|
Total retail electric sales
|
(0.5
|
)
|
0.4
|
|
0.5
|
|
(0.3
|
)
|
—
|
|
|||||
|
Firm natural gas sales
|
(0.3
|
)
|
(0.2
|
)
|
N/A
|
|
(4.3
|
)
|
(0.5
|
)
|
|||||
59
|
2016 vs. 2015 (Excluding Leap Day)
(b)
|
|||||||||||||||
|
NSP-Minnesota
|
PSCo
|
SPS
|
NSP-Wisconsin
|
Xcel Energy
|
|||||||||||
|
Weather-normalized - adjusted for leap day
|
|||||||||||||||
|
Electric residential
(a)
|
(0.2
|
)%
|
1.6
|
%
|
(1.6
|
)%
|
(0.6
|
)%
|
0.3
|
%
|
|||||
|
Electric C&I
|
(1.0
|
)
|
(0.7
|
)
|
0.5
|
|
(0.5
|
)
|
(0.5
|
)
|
|||||
|
Total retail electric sales
|
(0.8
|
)
|
0.1
|
|
0.2
|
|
(0.6
|
)
|
(0.3
|
)
|
|||||
|
Firm natural gas sales
|
(0.8
|
)
|
(0.7
|
)
|
N/A
|
|
(4.8
|
)
|
(1.0
|
)
|
|||||
(a)
Extreme weather variations, windchill and cloud cover may not be reflected in weather-normalized and actual growth (decline) estimates.
|
(b)
|
The estimated impact of the 2016 leap day is excluded to present a more comparable year-over-year presentation. The estimated impact of the additional day of sales in 2016 was approximately 0.2 percent to 0.4 percent for retail electric and 0.5 percent for firm natural gas for the twelve months ended.
|
Weather-normalized 2016 Electric Sales Growth (Decline) (Excluding Leap Day)
|
•
|
NSP-Minnesota’s residential sales decreased as a result of lower use per customer, partially offset by customer additions. C&I sales declined primarily as a result of lower use by customers in the manufacturing and service industries.
|
|
•
|
PSCo’s residential growth reflects an increased number of customers. The C&I decline was mainly due to lower sales to certain large customers in the manufacturing, mining, oil and gas industries. The decline was partially offset by an increase in the number of small C&I customers.
|
|
•
|
SPS’ residential sales decline was primarily the result of lower use per customer, partially offset by an increased number of customers. The increase in C&I sales was driven by energy sector expansion in the Southeastern New Mexico, Permian Basin area as well as greater use by agricultural customers.
|
|
•
|
NSP-Wisconsin’s residential sales decrease was primarily attributable to lower use per customer, partially offset by customer additions. The C&I decline was largely due to reduced sales to small customers. The overall decrease was partially offset by an increase in the number of C&I customers as well as greater use in the large C&I class for the oil and gas industries.
|
Weather-normalized 2016 Natural Gas Sales Decline (Excluding Leap Day)
|
•
|
Across natural gas service territories, lower natural gas sales reflect a decline in customer use, partially offset by a slight increase in the number of customers.
|
Electric Revenues and Margin
Electric revenues and fuel and purchased power expenses are impacted by fluctuation in the price of natural gas, coal and uranium used in the generation of electricity. However, these price fluctuations have minimal impact on electric margin due to fuel recovery mechanisms that recover fuel expenses. The following table details the electric revenues and margin:
|
(Millions of Dollars)
|
2017
|
2016
|
2015
|
|||||||||
|
Electric revenues
|
$
|
9,676
|
|
$
|
9,500
|
|
$
|
9,276
|
|
|||
|
Electric fuel and purchased power
|
(3,757
|
)
|
(3,718
|
)
|
(3,763
|
)
|
||||||
|
Electric margin
|
$
|
5,919
|
|
$
|
5,782
|
|
$
|
5,513
|
|
|||
The following tables summarize the components of the changes in electric revenues and electric margin for the years ended Dec. 31:
Electric Revenues
|
(Millions of Dollars)
|
2017 vs. 2016
|
|||
|
Retail rate increases (Texas, Minnesota, New Mexico and Wisconsin)
|
$
|
123
|
|
|
|
Non-fuel riders
|
33
|
|
||
|
Conservation and DSM program revenues (offset by expenses)
|
23
|
|
||
|
Decoupling (weather portion — Minnesota)
|
18
|
|
||
|
Wholesale transmission revenue
|
10
|
|
||
|
Estimated impact of weather
|
(30
|
)
|
||
|
Conservation incentive
|
(18
|
)
|
||
|
Other, net
|
17
|
|
||
|
Total increase in electric revenues
|
$
|
176
|
|
|
60
Electric Margin
|
(Millions of Dollars)
|
2017 vs. 2016
|
|||
|
Retail rate increases (Texas, Minnesota, New Mexico and Wisconsin)
|
$
|
123
|
|
|
|
Non-fuel riders
|
33
|
|
||
|
Conservation and DSM revenues (offset by expenses)
|
23
|
|
||
|
Decoupling (weather portion — Minnesota)
|
18
|
|
||
|
Purchased capacity costs
|
8
|
|
||
|
Wholesale transmission revenue, net of costs
|
(38
|
)
|
||
|
Estimated impact of weather
|
(30
|
)
|
||
|
Conservation incentive
|
(18
|
)
|
||
|
Other, net
|
18
|
|
||
|
Total increase in electric margin
|
$
|
137
|
|
|
Electric Revenues
|
(Millions of Dollars)
|
2016 vs. 2015
|
|||
|
Retail rate increases
(a)
|
$
|
190
|
|
|
|
Transmission revenue
|
71
|
|
||
|
Trading
|
40
|
|
||
|
Non-fuel riders
|
28
|
|
||
|
Estimated impact of weather, excluding decoupling in Minnesota
|
19
|
|
||
|
Fuel and purchased power cost recovery
|
(127
|
)
|
||
|
Other, net
|
3
|
|
||
|
Total increase in electric revenues
|
$
|
224
|
|
|
(a)
Increase is primarily due to interim rates in Minnesota (net of estimated provision for refund) and final rates in Wisconsin and New Mexico.
Electric Margin
|
(Millions of Dollars)
|
2016 vs. 2015
|
|||
|
Retail rate increases
(a)
|
$
|
190
|
|
|
|
Non-fuel riders
|
28
|
|
||
|
Estimated impact of weather, excluding decoupling in Minnesota
|
19
|
|
||
|
Transmission revenue, net of costs
|
14
|
|
||
|
Retail sales growth, excluding weather impact
|
9
|
|
||
|
PSCo earnings test refunds
|
6
|
|
||
|
Conservation incentive
|
3
|
|
||
|
Firm wholesale
|
(12
|
)
|
||
|
Other, net
|
12
|
|
||
|
Total increase in electric margin
|
$
|
269
|
|
|
(a)
Increase is primarily due to interim rates in Minnesota (net of estimated provision for refund) and final rates in Wisconsin and New Mexico.
Natural Gas Revenues and Margin
Total natural gas expense varies with changing sales requirements and the cost of natural gas. However, fluctuations in the cost of natural gas has minimal impact on natural gas margin due to natural gas cost recovery mechanisms. The following table details natural gas revenues and margin:
|
(Millions of Dollars)
|
2017
|
2016
|
2015
|
|||||||||
|
Natural gas revenues
|
$
|
1,650
|
|
$
|
1,531
|
|
$
|
1,672
|
|
|||
|
Cost of natural gas sold and transported
|
(823
|
)
|
(733
|
)
|
(905
|
)
|
||||||
|
Natural gas margin
|
$
|
827
|
|
$
|
798
|
|
$
|
767
|
|
|||
61
The following tables summarize the components of the changes in natural gas revenues and natural gas margin for the years ended Dec. 31:
Natural Gas Revenues
|
(Millions of Dollars)
|
2017 vs. 2016
|
|||
|
Purchased natural gas adjustment clause recovery
|
$
|
88
|
|
|
|
Infrastructure and integrity riders
|
18
|
|
||
|
Conservation and DSM program revenues (offset by expenses)
|
7
|
|
||
|
Retail sales growth, excluding weather impact
|
7
|
|
||
|
Estimated impact of weather
|
1
|
|
||
|
Other, net
|
(2
|
)
|
||
|
Total increase in natural gas revenues
|
$
|
119
|
|
|
Natural Gas Margin
|
(Millions of Dollars)
|
2017 vs. 2016
|
|||
|
Infrastructure and integrity riders
|
$
|
18
|
|
|
|
Retail sales growth, excluding weather impact
|
7
|
|
||
|
Estimated impact of weather
|
1
|
|
||
|
Other, net
|
3
|
|
||
|
Total increase in natural gas margin
|
$
|
29
|
|
|
Natural Gas Revenues
|
(Millions of Dollars)
|
2016 vs. 2015
|
|||
|
Purchased natural gas adjustment clause recovery
|
$
|
(177
|
)
|
|
|
Estimated impact of weather
|
(5
|
)
|
||
|
Infrastructure and integrity riders
|
(5
|
)
|
||
|
Retail rate increases (Colorado)
|
36
|
|
||
|
Conservation and DSM program revenues (offset by expenses)
|
8
|
|
||
|
Other, net
|
2
|
|
||
|
Total decrease in natural gas revenues
|
$
|
(141
|
)
|
|
Natural Gas Margin
|
(Millions of Dollars)
|
2016 vs. 2015
|
|||
|
Retail rate increases (Colorado)
|
$
|
36
|
|
|
|
Conservation and DSM program revenues (offset by expenses)
|
8
|
|
||
|
Estimated impact of weather
|
(5
|
)
|
||
|
Infrastructure and integrity riders
|
(5
|
)
|
||
|
Other, net
|
(3
|
)
|
||
|
Total increase in natural gas margin
|
$
|
31
|
|
|
62
Non-Fuel Operating Expenses and Other Items
O&M Expenses
— O&M expenses decreased
$23 million
, or
1.0 percent
, for
2017
compared with
2016
. The significant changes are summarized in the table below:
|
(Millions of Dollars)
|
2017 vs. 2016
|
|||
|
Nuclear plant operations and amortization
|
$
|
(27
|
)
|
|
|
Plant generation costs
|
(23
|
)
|
||
|
Transmission costs
|
(2
|
)
|
||
|
Employee benefits expense
|
17
|
|
||
|
Texas 2016 electric rate case cost deferral
|
16
|
|
||
|
Electric distribution costs
|
2
|
|
||
|
Other, net
|
(6
|
)
|
||
|
Total decrease in O&M expenses
|
$
|
(23
|
)
|
|
|
•
|
Nuclear plant operations and amortization expenses are lower mostly due to reduced refueling outage costs and operating efficiencies;
|
|
•
|
Plant generation costs decreased as a result of lower expenses associated with planned outages and overhauls at a number of generation facilities; and
|
|
•
|
Employee benefits expense includes the recognition of an $8 million pension settlement expense in the fourth quarter of 2017.
|
O&M expenses decreased
$4 million
, or 0.1 percent for
2016
compared with
2015
.
Conservation and DSM Program Expenses —
Conservation and DSM program expenses increased
$28 million
, or
11.4 percent
, for
2017
compared with
2016
. The increase was due to higher customer participation in electric conservation programs and recovery rates, mostly in Minnesota. Conservation and DSM expenses, including incentives, are generally recovered in our major jurisdictions concurrently through riders and base rates. Timing of recovery may not correspond to the period in which costs were incurred.
Conservation and DSM program expenses increased
$20 million
, or
8.9 percent
, for 2016 compared with 2015. The increase is primarily attributable to more customer participation in DSM programs.
Depreciation and Amortization —
Depreciation and amortization increased
$176 million
, or
13.5 percent
, for
2017
compared with
2016
. The increase was primarily due to capital investments and prior year amortization of the excess depreciation reserve in Minnesota.
Depreciation and amortization increased
$179 million
, or
15.9 percent
, for 2016 compared with 2015. The increase was primarily attributable to capital investments, including Pleasant Valley and Border Wind Farms, reduction of the excess depreciation reserve in Minnesota and recognition of the DOE settlement credits in 2015.
Taxes (Other Than Income Taxes) —
Taxes (other than income taxes) increased
$13 million
, or
2.4 percent
, for
2017
compared with
2016
. The increase was primarily due to higher property taxes in Minnesota and Texas.
Taxes (other than income taxes) increased
$20 million
, or
4.0 percent
, for 2016 compared with 2015. The increase was primarily due to higher property taxes in Minnesota, excluding the impact of the tax deferral related to the Minnesota 2016 multi-year electric rate case.
AFUDC, Equity and Debt
— AFUDC increased
$23 million
for
2017
compared with
2016
. The increase was primarily due to higher CWIP, particularly the Rush Creek wind project in Colorado.
AFUDC increased
$5 million
for 2016 compared with 2015. The increase was primarily due to the expansion of transmission facilities and other capital expenditures.
Interest Charges —
Interest charges increased
$16 million
, or
2.5 percent
, for
2017
compared with
2016
. The increase was related to higher debt levels to fund capital investments, partially offset by refinancings at lower interest rates.
63
Interest charges increased
$52 million
, or
8.7 percent
, for 2016 compared with 2015. The increase was related to higher long-term debt levels to fund capital investments, partially offset by refinancings at lower interest rates.
Income Taxes —
Income tax expense decreased
$39 million
for
2017
compared with
2016
. The decrease was primarily driven by increased wind PTCs, a net tax benefit related to the resolution of appeals/audits in 2017, an increase in research and experimentation credits, lower pretax earnings in 2017 and a rise in permanent plant-related adjustments. PTCs are flowed back to customers and reduce electric margin. The decrease was partially offset by the estimated one-time, non-cash, income tax expense recognized in the fourth quarter related to the TCJA. The ETR was
32.1 percent
for
2017
compared with
34.1 percent
for
2016
. The lower ETR in 2017 was primarily due to the adjustments referenced above. Excluding the impact for the TCJA adjustment, the ETR would have been 30.7 percent for 2017. See Note 6 to the consolidated financial statements for further discussion.
Income tax expense increased
$38 million
for 2016 compared with 2015. The increase in income tax expense was primarily due to higher pretax earnings in 2016, partially offset by increased wind PTCs in 2016. The ETR was
34.1 percent
for 2016 compared with
35.5 percent
for 2015. The lower ETR was primarily due to the wind PTCs in 2016.
Xcel Energy Inc. and Other Results
The following tables summarize the net income and diluted EPS contributions of Xcel Energy Inc. and its nonregulated businesses:
|
Contribution to Xcel Energy’s Earnings
|
||||||||||||
|
(Millions of Dollars)
|
2017
|
2016
|
2015
|
|||||||||
|
Xcel Energy Inc. financing costs
|
$
|
(79
|
)
|
$
|
(71
|
)
|
$
|
(56
|
)
|
|||
|
Eloigne
(a)
|
2
|
|
1
|
|
—
|
|
||||||
|
Xcel Energy Inc. taxes and other results
|
(35
|
)
|
(6
|
)
|
(3
|
)
|
||||||
|
Total Xcel Energy Inc. and other costs
|
$
|
(112
|
)
|
$
|
(76
|
)
|
$
|
(59
|
)
|
|||
|
Contribution to Xcel Energy’s GAAP diluted EPS
|
||||||||||||
|
Diluted Earnings (Loss) Per Share
|
2017
|
2016
|
2015
|
|||||||||
|
Xcel Energy Inc. financing costs
|
$
|
(0.15
|
)
|
$
|
(0.14
|
)
|
$
|
(0.11
|
)
|
|||
|
Eloigne
(a)
|
—
|
|
—
|
|
—
|
|
||||||
|
Xcel Energy Inc. taxes and other results
|
(0.07
|
)
|
(0.01
|
)
|
—
|
|
||||||
|
Total Xcel Energy Inc. and other costs
|
$
|
(0.22
|
)
|
$
|
(0.15
|
)
|
$
|
(0.11
|
)
|
|||
|
(a)
|
Amounts include gains or losses associated with sales of properties held by Eloigne.
|
Xcel Energy Inc.’s results include interest charges, which are incurred at Xcel Energy Inc. and are not directly assigned to individual subsidiaries.
Factors Affecting Results of Operations
Xcel Energy’s utility revenues depend on customer usage, which varies with weather conditions, general business conditions and the cost of energy services. Various regulatory agencies approve the prices for electric and natural gas service within their respective jurisdictions and affect Xcel Energy’s ability to recover its costs from customers. The historical and future trends of Xcel Energy’s operating results have been, and are expected to be, affected by a number of factors, including those listed below.
General Economic Conditions
Economic conditions may have a material impact on Xcel Energy’s operating results. While economic growth has been improving over the past year, management cannot predict whether this trend will be sustained going forward. Other events impact overall economic conditions and management cannot predict the impact of fluctuating energy prices, terrorist activity, war or the threat of war. However, Xcel Energy could experience a material impact to its results of operations, future growth or ability to raise capital resulting from a sustained general slowdown in economic growth or a significant increase in interest rates.
64
Fuel Supply and Costs
Xcel Energy Inc.’s operating utilities have varying dependence on coal, natural gas and uranium. Changes in commodity prices are generally recovered through fuel recovery mechanisms and have very little impact on earnings. However, availability of supply, the potential implementation of a carbon tax or emissions-related generation restrictions and unanticipated changes in regulatory recovery mechanisms could impact our operations. See Item 1 for further discussion of fuel supply and costs.
Pension Plan Costs and Assumptions
Xcel Energy has significant net pension and postretirement benefit costs that are measured using actuarial valuations. Inherent in these valuations are key assumptions including discount rates and expected return on plan assets. Xcel Energy evaluates these key assumptions at least annually by analyzing current market conditions, which include changes in interest rates and market returns. Changes in the related net pension and postretirement benefits costs and funding requirements may occur in the future due to changes in assumptions. The payout of a significant percentage of pension plan liabilities in a single year due to high retirements or employees leaving Xcel Energy would trigger settlement accounting and could require Xcel Energy to recognize material incremental pension expense related to unrecognized plan losses in the year these liabilities are paid. For further discussion and a sensitivity analysis on these assumptions, see “Employee Benefits” under Critical Accounting Policies and Estimates.
Tax Reform
On Dec. 22, 2017, the TCJA was signed by the President, enacting significant changes to the IRC. The changes are generally effective for Xcel Energy federal tax returns for years following 2017, and include a reduction in the federal corporate income tax rate from 35 percent to 21 percent. The TCJA recognizes the unique nature of public utilities and contains certain provisions specific to the industry, including continuing certain interest expense deductibility and not allowing 100 percent expensing of capital investments.
2017 Impacts of Tax Reform
|
•
|
Required the revaluation of federal deferred tax assets and liabilities using the new lower tax rate. The majority of the revaluation relates to regulated utility activities and results in the recording of regulatory assets and liabilities, with no estimated income statement impact; and
|
|
•
|
Xcel Energy recognized approximately $23 million of income tax expense associated with the TCJA in the fourth quarter of 2017. This amount is considered to be non-recurring and has been excluded from Xcel Energy’s 2017 ongoing earnings.
|
Future Impacts of Tax Reform
|
•
|
Decreases annual revenue requirements by approximately $400 million;
|
|
•
|
Reduces the tax benefit from holding company interest expense by approximately $20 million in 2018, negatively impacting earnings;
|
|
•
|
Increases rate base growth for the same level of expected capital expenditures due to lower forecasted deferred tax liabilities; and
|
|
•
|
Negative impact on cash flow from operations and credit metrics, depending on regulatory actions.
|
Potential Regulatory Options
The timing of revenue requirements adjustments for both the return of excess deferred taxes and the lower tax rate are subject to regulatory actions in each of the eight states in which the regulated utilities operate, as well as the FERC. Each regulatory jurisdiction has initiated active proceedings to reflect the impacts of TCJA. In addition to lower revenue requirements, the TCJA also reduces the pre-tax credit that our customers receive from the federal PTCs; this issue will be reviewed in various resource planning and asset acquisition proceedings. Additionally, Xcel Energy has open rate cases and resource acquisition dockets pending in several states that may be impacted.
65
Xcel Energy plans to work directly with its regulators to determine the appropriate path forward in each jurisdiction. Potential regulatory options that may be appropriate to consider either as alternatives to or in a combination with flowing back the lower revenue requirements through rates include, but are not limited to:
|
•
|
Accelerating depreciation or amortization for selected assets or asset classes;
|
|
•
|
Increasing authorized equity ratios at the operating company level;
|
|
•
|
Modifying capital investments;
|
|
•
|
Avoiding or deferring future rate cases; and
|
|
•
|
Funding of certain long-dated obligations.
|
Xcel Energy believes that regulatory actions that include higher authorized operating company equity ratios and/or accelerated depreciation/amortization can preserve operating company credit metrics that otherwise degrade under the TCJA.
See Notes 6 and 12 to the consolidated financial statements for further discussion.
Regulation
FERC and State Regulation
—
The FERC and various state and local regulatory commissions regulate Xcel Energy Inc.’s utility subsidiaries, TransCo subsidiaries and WGI. Decisions by these regulators can significantly impact Xcel Energy’s results of operations. Xcel Energy expects to periodically file for rate changes based on changing operating costs, new or planned investments, fluctuations in energy markets and general economic conditions.
The electric and natural gas rates charged to customers of Xcel Energy Inc.’s utility subsidiaries are approved by the FERC or the regulatory commissions in the states in which they operate. The rates are designed to recover plant investment, operating costs and an allowed return on investment. Rates charged by Xcel Energy Inc.’s TransCo subsidiaries and WGI are approved by the FERC. Xcel Energy Inc.’s utility subsidiaries request changes in rates for utility services through filings with the governing commissions. Changes in operating costs can affect Xcel Energy’s financial results, depending on the timing of filing general rate cases and the implementation of final rates. In addition to changes in operating costs, other factors affecting rate filings are new investments, sales, conservation and DSM efforts, and the cost of capital. In addition, the regulatory commissions authorize the ROE, capital structure and depreciation rates in rate proceedings.
Wholesale Energy Market Regulation
—
Wholesale energy markets are operated by MISO in the Midwest and SPP in the South Central U.S. to centrally dispatch all regional electric generation and apply a regional transmission congestion management system. NSP-Minnesota and NSP-Wisconsin are members of MISO and SPS is a member of SPP. NSP-Minnesota, NSP-Wisconsin and SPS expect to recover RTO energy and other charges through either base rates or various recovery mechanisms. PSCo is evaluating participation in the SPP RTO energy market through the MWTG. See Item 1 and Note 12 to the consolidated financial statements for further discussion.
Capital Expenditure Regulation
—
Xcel Energy Inc.’s utility subsidiaries make substantial investments in renewable generation, plant additions to build and upgrade power plants, and expand and maintain the energy transmission and distribution systems. Xcel Energy Inc.’s utility subsidiaries to recover the costs associated with capital investments through rate case filings and through riders (in certain states). These non-fuel rate riders are expected to provide cash flows to enable recovery of costs incurred on a more timely basis. Xcel Energy has implemented formula rates for each of the utility subsidiaries that will provide annual rate changes as transmission or production investments increase in a manner similar to the retail rate riders for wholesale electric transmission and production services. Electric transmission investments owned by the TransCos are recoverable through FERC approved transmission formula rates for XETD and XEST. NSP-Minnesota and NSP-Wisconsin have no cost-based wholesale production customers and therefore have not implemented a production formula rate.
Environmental Matters
Environmental costs include accruals for nuclear plant decommissioning and payments for storage of spent nuclear fuel, disposal of hazardous materials and waste, remediation of contaminated sites, monitoring of discharges to the environment and compliance with laws and permits with respect to emissions. A trend of greater environmental awareness and increasingly stringent regulation may continue to cause higher operating expenses and capital expenditures for environmental compliance.
66
Costs charged to operating expenses for nuclear decommissioning and spent nuclear fuel disposal expenses, environmental monitoring and disposal of hazardous materials and waste were approximately:
|
•
|
$303 million in 2017;
|
|
•
|
$304 million in 2016; and
|
|
•
|
$292 million in 2015.
|
Xcel Energy estimates an average annual expense of approximately $349 million from
2018
through
2022
for similar costs. The precise timing and amount of environmental costs, including those for site remediation and disposal of hazardous materials, are unknown. Additionally, the extent to which environmental costs will be included in and recovered through rates may fluctuate.
Capital expenditures for environmental improvements at regulated facilities were approximately:
|
•
|
$61 million in 2017;
|
|
•
|
$93 million in 2016; and
|
|
•
|
$184 million in 2015.
|
See Item 7
—
Capital Requirements for further discussion.
Xcel Energy’s operations are subject to federal and state laws and regulations related to air emissions, water discharges and waste management from various sources. Such laws and regulations impose monitoring and reporting requirements and may require Xcel Energy to obtain pre-approval for the construction or modification of projects that increase air emissions, water discharges or land disposal of wastes, obtain and comply with permits that contain emission, discharge and operational limitations, or install or operate pollution control equipment at facilities. Xcel Energy will likely be required to incur capital expenditures in the future to comply with these requirements for remediation of MGP and other legacy sites and various regulations for air emissions, water intake and discharge and waste disposal. Actual expenditures could vary from the estimates presented. The scope and timing of these expenditures cannot be determined until any new or revised regulations become final or until more information is learned about the need for remediation at the legacy sites.
Pollution control equipment can be required by federal and state regulations, such as those requiring mercury emission reductions, and by state or federal implementation plans, such as those to address visibility impairment, interstate air pollution impacts or attainment of NAAQS. In 2016, the EPA adopted a federal visibility plan for Texas which imposes SO
2
emission limitations that reflect installation of dry scrubbers on Tolk Units 1 and 2, with compliance required by early 2021. This rule has been stayed by the Fifth Circuit. In March 2017, the Fifth Circuit remanded the rule to the EPA for reconsideration, while leaving the stay in effect. The Fifth Circuit is now holding the case in abeyance until the EPA completes its reconsideration of the rule.
See Note 13 to the consolidated financial statements for further discussion of Xcel Energy’s environmental contingencies.
Inflation
Inflation at its current level is not expected to materially affect Xcel Energy’s prices or returns to shareholders. However, potential future inflation could result from economic conditions or the economic and monetary policies of the U.S. Government and the Federal Reserve. This could lead to future price increases for materials and services required to deliver electric and natural gas services to customers. These potential cost increases could in turn lead to increased prices to customers. Likewise, lower oil and natural gas prices could lead to sustained deflation, that could also reduce general economic activity although it may lead to lower electric and natural gas prices to customers. Additionally, under statute, federal agencies such as the FERC now can adjust statutory penalties for inflation.
67
CRITICAL ACCOUNTING POLICIES AND ESTIMATES
Preparation of the consolidated financial statements and related disclosures in compliance with GAAP requires the application of accounting rules and guidance, as well as the use of estimates. The application of these policies involves judgments regarding future events, including the likelihood of success of particular projects, legal and regulatory challenges and anticipated recovery of costs. These judgments could materially impact the consolidated financial statements and disclosures, based on varying assumptions. In addition, the financial and operating environment also may have a significant effect on the operation of the business and on the results reported. The following is a list of accounting policies and estimates that are most significant to the portrayal of Xcel Energy’s financial condition and results, and require management’s most difficult, subjective or complex judgments. Each of these has a higher likelihood of resulting in materially different reported amounts under different conditions or using different assumptions. Each critical accounting policy has been reviewed and discussed with the Audit Committee of Xcel Energy Inc.’s Board of Directors on a quarterly basis.
Regulatory Accounting
Xcel Energy Inc. is a holding company with rate-regulated subsidiaries that are subject to the accounting for Regulated Operations
,
which provides that rate-regulated entities report assets and liabilities consistent with the recovery of those incurred costs in rates, if the competitive environment makes it probable that such rates will be charged and collected. Xcel Energy’s rates are derived through the ratemaking process, which results in the recording of regulatory assets and liabilities based on the probability of future cash flows. Regulatory assets generally represent incurred or accrued costs that have been deferred because future recovery from customers is probable. Regulatory liabilities generally represent amounts that are expected to be refunded to customers in future rates or amounts collected in current rates for future costs. In other businesses or industries, regulatory assets and regulatory liabilities would generally be charged to net income or OCI.
Each reporting period Xcel Energy assesses the probability of future recoveries and obligations associated with regulatory assets and liabilities. Factors such as the current regulatory environment, recently issued rate orders and historical precedents are considered. Decisions made by regulatory agencies can directly impact the amount and timing of cost recovery as well as the rate of return on invested capital, and may materially impact Xcel Energy’s results of operations, financial condition or cash flows.
As of Dec. 31, 2017 and 2016, Xcel Energy has recorded regulatory assets of
$3.4 billion
for both periods, and regulatory liabilities of
$5.3 billion
and $1.6 billion, respectively. Each subsidiary is subject to regulation that varies from jurisdiction to jurisdiction. If future recovery of costs in any such jurisdiction ceases to be probable, Xcel Energy would be required to charge these assets to current net income or OCI. In assessing the probability of recovery of recognized regulatory assets, Xcel Energy noted no current or anticipated proposals or changes in the regulatory environment that it expects will materially impact the probability of recovery of the assets. See Note 15 to the consolidated financial statements for further discussion of regulatory assets and liabilities and Note 12 to the consolidated financial statements for further discussion of rate matters.
Income Tax Accruals
Judgment, uncertainty, and estimates are a significant aspect of the income tax accrual process that accounts for the effects of current and deferred income taxes. Uncertainty associated with the application of tax statutes and regulations and the outcomes of tax audits and appeals require that judgment and estimates be made in the accrual process and in the calculation of the ETR.
Changes in tax laws and rates may affect recorded deferred tax assets and liabilities and our future ETR. The TCJA reduced the federal income tax rate from 35 percent to 21 percent, significantly impacting the recorded amounts of deferred tax assets and liabilities and reducing the ETR applicable to future periods. See Item 7. Management’s Discussion and Analysis of Financial Condition and Results of Operations - Tax Reform and Notes 6 and 12 to the consolidated financial statements for further discussion.
ETRs are highly impacted by assumptions. ETR calculations are revised every quarter based on best available year-end tax assumptions (income levels, deductions, credits, etc.); adjusted in the following year after returns are filed, with the tax accrual estimates being trued-up to the actual amounts claimed on the tax returns; and further adjusted after examinations by taxing authorities have been completed.
68
In accordance with the interim period reporting guidance, income tax expense for the first three quarters in a year is based on the forecasted annual ETR. The forecasted ETR reflects a number of estimates including forecasted annual income, permanent tax adjustments and tax credits.
Valuation allowances are applied to deferred tax assets if it is more likely than not that at least a portion may not be realized based on an evaluation of expected future taxable income.
Accounting for income taxes also requires that only tax benefits that meet the more likely than not recognition threshold can be recognized or continue to be recognized. The change in the unrecognized tax benefits needs to be reasonably estimated based on evaluation of the nature of uncertainty, the nature of event that could cause the change and an estimated range of reasonably possible changes.
Management will use prudent business judgment to derecognize appropriate amounts of tax benefits at any period end, and as new developments occur. Unrecognized tax benefits can be recognized as issues are favorably resolved and loss exposures decline. We may adjust our unrecognized tax benefits and interest accruals to the updated estimates as disputes with the IRS and state tax authorities are resolved. These adjustments may increase or decrease earnings. See Note 6 to the consolidated financial statements for further discussion.
Employee Benefits
Xcel Energy’s pension costs are based on an actuarial calculation that includes a number of key assumptions, most notably the annual return level that pension and postretirement health care investment assets are expected to earn in the future and the interest rate used to discount future pension benefit payments to a present value obligation. In addition, the pension cost calculation uses an asset-smoothing methodology to reduce the volatility of varying investment performance over time. See Note 9 to the consolidated financial statements for further discussion on the rate of return and discount rate used in the calculation of pension costs and obligations.
Pension costs are expected to decrease in 2018 and continue to decline in the following few years. Funding requirements in 2018 are expected to be consistent with 2017 and continue at that level in the following years. While investment returns were below the assumed levels in 2015 and 2016, investment returns exceeded the assumed levels in 2017. The pension cost calculation uses a market-related valuation of pension assets. Xcel Energy uses a calculated value method to determine the market-related value of the plan assets. The market-related value is determined by adjusting the fair market value of assets at the beginning of the year to reflect the investment gains and losses (the difference between the actual investment return and the expected investment return on the market-related value) during each of the previous five years at the rate of 20 percent per year. As these differences between the actual investment returns and the expected investment returns are incorporated into the market-related value, the differences are recognized in pension cost over the expected average remaining years of service for active employees, which was approximately 12 years in 2017.
Based on current assumptions and the recognition of past investment gains and losses, Xcel Energy currently projects the pension costs recognized for financial reporting purposes will be
$119 million
in 2018 and
$105 million
in 2019, while the actual pension costs were
$139 million
in 2017 and
$122 million
in 2016. The expected decrease in 2018 and future year costs is due primarily to reductions in loss amortizations, plan design changes and an increase in expected return on assets due to planned future contributions and expected return of current assets.
In 2014, the Society of Actuaries published a new mortality table (RP-2014) that increased the overall life expectancy of males and females. In 2014, Xcel Energy adopted this mortality table, with modifications, based on its population and specific experience. During 2017, a new projection table was released (MP-2017). Xcel Energy evaluated the updated projection table and concluded that the methodology currently in use and adopted in 2016 is consistent with the recently updated 2017 table and continues to be representative of Xcel Energy’s population.
69
At
Dec. 31, 2017
, Xcel Energy set the rate of return on assets used to measure pension costs at
6.87 percent
, which is consistent with the rate set at
Dec. 31, 2016
. The rate of return used to measure postretirement health care costs is
5.80 percent
at
Dec. 31, 2017
and this is consistent with
Dec. 31, 2016
. Xcel Energy’s ongoing pension investment strategy is based on plan-specific investments that seek to minimize potential investment and interest rate risk as a plan’s funded status increases over time. The investments result in a greater percentage of interest rate sensitive securities being allocated to specific plans having relatively higher funded status ratios and a greater percentage of growth assets being allocated to plans having relatively lower funded status ratios.
Xcel Energy set the discount rates used to value the
Dec. 31, 2017
pension at 3.63 percent and postretirement health care obligations at
3.62 percent
, which represents a 50 basis point and a 51 basis point decrease from
Dec. 31, 2016
, respectively. Xcel Energy uses a bond matching study as its primary basis for determining the discount rate used to value pension and postretirement health care obligations. The bond matching study utilizes a portfolio of high grade (Aa or higher) bonds that matches the expected cash flows of Xcel Energy’s benefit plans in amount and duration. The effective yield on this cash flow matched bond portfolio determines the discount rate for the individual plans. The bond matching study is validated for reasonableness against the Merrill Lynch Corporate 15+ Bond Index. At
Dec. 31, 2017
, this reference point supported the selected rate. In addition to this reference point, Xcel Energy also reviews general actuarial survey data to assess the reasonableness of the discount rate selected.
The following are the pension funding contributions across all four of Xcel Energy’s pension plans, both voluntary and required, for 2015 through 2018:
|
•
|
$150 million
in January 2018;
|
|
•
|
$162 million
in 2017;
|
|
•
|
$125 million
in 2016; and
|
|
•
|
$90 million
in 2015.
|
For future years, we anticipate contributions will be made as necessary. These contributions are summarized in Note 9 to the consolidated financial statements. Future year amounts are estimates and may change based on actual market performance, changes in interest rates and any changes in governmental regulations. Therefore, additional contributions could be required in the future.
If Xcel Energy were to use alternative assumptions at
Dec. 31, 2017
, a one-percent change would result in the following impact on 2017 pension costs:
|
Pension Costs
|
||||||||
|
(Millions of Dollars)
|
+1%
|
-1%
|
||||||
|
Rate of return
|
$
|
(17
|
)
|
$
|
18
|
|
||
|
Discount rate
(a)
|
(6
|
)
|
9
|
|
||||
|
(a)
|
These costs include the effects of regulation.
|
Beginning with the Dec. 31, 2017 measurement date, Xcel Energy separated its initial medical trend assumption for pre-Medicare (Pre-65) and post-Medicare (Post-65) claims costs, and assumed 7.0 percent and 5.5 percent, respectively. Xcel Energy separated the trends in order to reflect different short-term expectations based on recent experiences with Pre-65 and Post-65 claims cost increases for Xcel Energy’s retiree medical plan. The ultimate trend assumption remained at
4.5 percent
for both Pre-65 and Post-65 claims costs as similar long-term trend rates are expected for both populations. The period from initial trend rate until the ultimate rate is reached is five years. Xcel Energy bases its medical trend assumption on the long-term cost inflation expected in the health care market, considering the levels projected and recommended by industry experts, as well as recent actual medical cost experienced by Xcel Energy’s retiree medical plan.
|
•
|
Xcel Energy contributed
$20 million
,
$18 million
and
$18 million
during
2017
,
2016
and
2015
, respectively, to the postretirement health care plans.
|
|
•
|
Xcel Energy expects to contribute approximately
$12 million
during 2018.
|
70
Xcel Energy recovers employee benefits costs in its regulated utility operations consistent with accounting guidance with the exception of the areas noted below.
|
•
|
NSP-Minnesota recognizes pension expense in all regulatory jurisdictions as calculated using the aggregate normal cost actuarial method. Differences between aggregate normal cost and expense as calculated by pension accounting standards are deferred as a regulatory liability.
|
|
•
|
In 2017, the PSCW approved NSP-Wisconsin’s request for deferred accounting treatment of the 2017 pension settlement accounting expense.
|
|
•
|
Colorado, Texas, New Mexico and FERC jurisdictions allow the recovery of other postretirement benefit costs only to the extent that recognized expense is matched by cash contributions to an irrevocable trust. Xcel Energy has consistently funded at a level to allow full recovery of costs in these jurisdictions.
|
|
•
|
PSCo and SPS recognize pension expense in all regulatory jurisdictions based on expense consistent with accounting guidance. The Texas and Colorado electric retail jurisdictions and the Colorado gas retail jurisdiction, each record the difference between annual recognized pension expense and the annual amount of pension expense approved in their last respective general rate case as a deferral to a regulatory asset.
|
See Note 9 to the consolidated financial statements for further discussion.
Nuclear Decommissioning
Xcel Energy recognizes liabilities for the expected cost of retiring tangible long-lived assets for which a legal obligation exists. These AROs are recognized at fair value as incurred and are capitalized as part of the cost of the related long-lived assets. In the absence of quoted market prices, Xcel Energy estimates the fair value of its AROs using present value techniques, in which it makes various assumptions including estimates of the amounts and timing of future cash flows associated with retirement activities, credit-adjusted risk free rates and cost escalation rates. When Xcel Energy revises any assumptions used to estimate AROs, it adjusts the carrying amount of both the ARO liability and the related long-lived asset. Xcel Energy accretes ARO liabilities to reflect the passage of time using the interest method.
A significant portion of Xcel Energy’s AROs relates to the future decommissioning of NSP-Minnesota’s nuclear facilities. The total obligation for nuclear decommissioning is expected to be funded by the external decommissioning trust fund. The difference between regulatory funding (including depreciation expense less returns from the external trust fund) and expense recognized under current accounting guidance is deferred as a regulatory asset. The amounts recorded for AROs related to future nuclear decommissioning were
$1.874 billion
and
$2.249 billion
as of
Dec. 31, 2017
and
2016
, respectively. Based on their significance, the following discussion relates specifically to the AROs associated with nuclear decommissioning.
NSP-Minnesota obtains periodic cost studies in order to estimate the cost and timing of planned nuclear decommissioning activities. These independent cost studies are based on relevant information available at the time performed. Estimates of future cash flows for extended periods of time are by nature highly uncertain and may vary significantly from actual results. NSP-Minnesota is required to file a nuclear decommissioning filing every three years. The filing covers all expenses over the decommissioning period of the nuclear plants, including decontamination and removal of radioactive material. The MPUC approved NSP-Minnesota’s currently effective decommissioning filing in October 2015. The most recent filing was submitted in December 2017 and is currently pending with the MPUC, with an order expected in 2018. See Note 13 for further discussion.
The following key assumptions have a significant effect on the estimated nuclear obligation:
|
•
|
Timing
— Decommissioning cost estimates are impacted by each facility’s retirement date and the expected timing of the actual decommissioning activities. Currently, the estimated retirement dates coincide with the expiration of each unit’s operating license with the NRC (i.e., 2030 for Monticello and 2033 and 2034 for PI’s Unit 1 and 2, respectively). The estimated timing of the decommissioning activities is based upon the DECON method, which assumes prompt removal and dismantlement. The use of the DECON method is required by the MPUC. By utilizing this method, decommissioning activities are expected to begin at the end of the license date and be completed for both facilities by 2091.
|
|
•
|
Technology and Regulation
— There is limited experience with actual decommissioning of large nuclear facilities. Changes in technology and experience as well as changes in regulations regarding nuclear decommissioning could cause cost estimates to change significantly. NSP-Minnesota’s most recent nuclear decommissioning filing assumed current technology and regulations.
|
71
|
•
|
Escalation Rates
— Escalation rates represent projected cost increases over time due to both general inflation and increases in the cost of specific decommissioning activities. NSP-Minnesota used an escalation rate of 3.42 percent in calculating the ARO related to nuclear decommissioning for the Monticello facility, a rate of 3.40 percent for PI Unit 1, and a rate of 3.40 percent for PI Unit 2. These rates are weighted averages of labor and non-labor escalation factors calculated by Goldman Sachs Asset Management.
|
|
•
|
Discount Rates
— Changes in timing or estimated expected cash flows that result in upward revisions to the ARO are calculated using the then-current credit-adjusted risk-free interest rate. The credit-adjusted risk-free rate in effect when the change occurs is used to discount the revised estimate of the incremental expected cash flows of the retirement activity. If the change in timing or estimated expected cash flows results in a downward revision of the ARO, the undiscounted revised estimate of expected cash flows is discounted using the credit-adjusted risk-free rate in effect at the date of initial measurement and recognition of the original ARO. Discount rates ranging from approximately four to seven percent have been used to calculate the net present value of the expected future cash flows over time.
|
Significant uncertainties exist in estimating the future cost of nuclear decommissioning including the method to be utilized, the ultimate costs to decommission, and the planned method of disposing spent fuel. If different cost estimates, life assumptions or cost escalation rates were utilized, the AROs could change materially. However, changes in estimates have minimal impact on results of operations as NSP-Minnesota expects to continue to recover all costs in future rates.
Xcel Energy continually makes judgments and estimates related to these critical accounting policy areas, based on an evaluation of the varying assumptions and uncertainties for each area. The information and assumptions underlying many of these judgments and estimates will be affected by events beyond the control of Xcel Energy, or otherwise change over time. This may require adjustments to recorded results to better reflect the events and updated information that becomes available. The accompanying financial statements reflect management’s best estimates and judgments of the impact of these factors as of
Dec. 31, 2017
.
Derivatives, Risk Management and Market Risk
Xcel Energy Inc. and its subsidiaries are exposed to a variety of market risks in the normal course of business. Market risk is the potential loss that may occur as a result of adverse changes in the market or fair value of a particular instrument or commodity. All financial and commodity-related instruments, including derivatives, are subject to market risk. See Note 11 to the consolidated financial statements for further discussion of market risks associated with derivatives.
Xcel Energy is exposed to the impact of adverse changes in price for energy and energy-related products, which is partially mitigated by the use of commodity derivatives. In addition to ongoing monitoring and maintaining credit policies intended to minimize overall credit risk, when necessary, management takes steps to mitigate changes in credit and concentration risks associated with its derivatives and other contracts, including parental guarantees and requests of collateral. While Xcel Energy expects that the counterparties will perform under the contracts underlying its derivatives, the contracts expose Xcel Energy to some credit and non-performance risk.
Though no material non-performance risk currently exists with the counterparties to Xcel Energy’s commodity derivative contracts, distress in the financial markets may in the future impact that risk to the extent it impacts those counterparties. Distress in the financial markets may also impact the fair value of the securities in the nuclear decommissioning fund and master pension trust, as well as Xcel Energy’s ability to earn a return on short-term investments of excess cash.
Commodity Price Risk —
Xcel Energy Inc.’s utility subsidiaries are exposed to commodity price risk in their electric and natural gas operations. Commodity price risk is managed by entering into long- and short-term physical purchase and sales contracts for electric capacity, energy and energy-related products and for various fuels used in generation and distribution activities. Commodity price risk is also managed through the use of financial derivative instruments. Xcel Energy’s risk management policy allows it to manage commodity price risk within each rate-regulated operation per commission approved hedge plans.
Wholesale and Commodity Trading Risk —
Xcel Energy Inc.’s utility subsidiaries conduct various wholesale and commodity trading activities, including the purchase and sale of electric capacity, energy, energy-related instruments and natural gas-related instruments, including derivatives. Xcel Energy’s risk management policy allows management to conduct these activities within guidelines and limitations as approved by its risk management committee, which is made up of management personnel not directly involved in the activities governed by this policy.
72
At Dec. 31, 2017, the fair values by source for net commodity trading contract assets were as follows:
|
Futures / Forwards
|
|||||||||||||||||||||||
|
(Millions of Dollars)
|
Source of
Fair Value
|
Maturity
Less Than
1 Year
|
Maturity
1 to 3 Years
|
Maturity
4 to 5 Years
|
Maturity
Greater Than
5 Years
|
Total Futures /
Forwards
Fair Value
|
|||||||||||||||||
|
NSP-Minnesota
|
1
|
|
$
|
4
|
|
$
|
4
|
|
$
|
3
|
|
$
|
—
|
|
$
|
11
|
|
||||||
|
Options
|
|||||||||||||||||||||||
|
(Thousands of Dollars)
|
Source of
Fair Value
|
Maturity
Less Than
1 Year
|
Maturity
1 to 3 Years
|
Maturity
4 to 5 Years
|
Maturity
Greater Than
5 Years
|
Total Options
Fair Value
|
|||||||||||||||||
|
NSP-Minnesota
|
2
|
|
$
|
—
|
|
$
|
4
|
|
$
|
1
|
|
$
|
—
|
|
$
|
5
|
|
||||||
1 — Prices actively quoted or based on actively quoted prices.
2 — Prices based on models and other valuation methods.
Changes in the fair value of commodity trading contracts before the impacts of margin-sharing mechanisms for the years ended Dec. 31, were as follows:
|
(Millions of Dollars)
|
2017
|
2016
|
||||||
|
Fair value of commodity trading net contract assets outstanding at Jan. 1
|
$
|
10
|
|
$
|
11
|
|
||
|
Contracts realized or settled during the period
|
(5
|
)
|
(5
|
)
|
||||
|
Commodity trading contract additions and changes during the period
|
11
|
|
4
|
|
||||
|
Fair value of commodity trading net contract assets outstanding at Dec. 31
|
$
|
16
|
|
$
|
10
|
|
||
At Dec. 31, 2017, a 10 percent increase or decrease in market prices for commodity trading contracts would have an immaterial impact. At Dec. 31, 2016, a 10 percent increase in market prices for commodity trading contracts would decrease pretax income from continuing operations by approximately $1 million, whereas a 10 percent decrease would increase pretax income from continuing operations by approximately $1 million.
Xcel Energy Inc.’s utility subsidiaries’ wholesale and commodity trading operations measure the outstanding risk exposure to price changes on transactions, contracts and obligations that have been entered into, but not closed, using an industry standard methodology known as Value at Risk (VaR). VaR expresses the potential change in fair value on the outstanding transactions, contracts and obligations over a particular period of time under normal market conditions.
The VaRs for the NSP-Minnesota and PSCo commodity trading operations, calculated on a consolidated basis using a Monte Carlo simulation with a 95 percent confidence level and a one-day holding period, were as follows:
|
(Millions of Dollars)
|
Year Ended
Dec. 31
|
VaR Limit
|
Average
|
High
|
Low
|
|||||||||||||||
|
2017
|
$
|
0.18
|
|
$
|
3.00
|
|
$
|
0.21
|
|
$
|
0.66
|
|
$
|
0.04
|
|
|||||
|
2016
|
0.09
|
|
3.00
|
|
0.16
|
|
0.38
|
|
0.05
|
|
||||||||||
Nuclear Fuel Supply
— NSP-Minnesota is scheduled to take delivery of approximately 58 percent of its 2018 and approximately 24 percent of its 2019 enriched nuclear material requirements from sources that could be impacted by events in Ukraine and extended sanctions against Russia. Alternate potential sources are expected to provide the flexibility to manage NSP-Minnesota’s nuclear fuel supply to ensure that plant availability and reliability will not be negatively impacted in the near-term. Long-term, through 2024, NSP-Minnesota is scheduled to take delivery of approximately 35 percent of its average enriched nuclear material requirements from sources that could be impacted by events in Ukraine and extended sanctions against Russia. NSP-Minnesota is closely following the progression of these events and will periodically assess if further actions are required to assure a secure supply of enriched nuclear material.
73
Separately, NSP-Minnesota has enriched nuclear fuel materials in process with Westinghouse Electric Corporation (Westinghouse). Westinghouse filed for Chapter 11 bankruptcy protection in March 2017. NSP-Minnesota owns materials in Westinghouse’s inventory and has contracts in place under which Westinghouse will provide certain services during an upcoming outage at Prairie Island (PI). Westinghouse will provide nuclear fuel assemblies for the upcoming PI outage under the current nuclear fuel fabrication contract. Westinghouse has indicated its intention to continue to perform under the arrangements. Based on Westinghouse’s stated intent and the interim financing secured to fund its on-going operations, NSP-Minnesota does not expect the bankruptcy to materially impact NSP-Minnesota’s operational or financial performance. Westinghouse announced on Jan. 4, 2018 it has agreed to be acquired by Brookfield Business Partners LP and other institutional partners. Brookfield’s acquisition of Westinghouse is expected to close in the third quarter of 2018, subject to bankruptcy court and regulatory approvals. NSP-Minnesota will continue to monitor the Westinghouse acquisition process.
Interest Rate Risk
— Xcel Energy is subject to the risk of fluctuating interest rates in the normal course of business. Xcel Energy’s risk management policy allows interest rate risk to be managed through the use of fixed rate debt, floating rate debt and interest rate derivatives such as swaps, caps, collars and put or call options.
At Dec. 31, 2017 and 2016, a 100 basis point change in the benchmark rate on Xcel Energy’s variable rate debt would impact annual pretax interest expense by approximately $9 million and $4 million, respectively. See Note 11 to the consolidated financial statements for a discussion of Xcel Energy Inc. and its subsidiaries’ interest rate derivatives.
NSP-Minnesota maintains a nuclear decommissioning fund, as required by the NRC. The nuclear decommissioning fund is subject to interest rate risk and equity price risk. At Dec. 31, 2017, the fund was invested in a diversified portfolio of cash equivalents, debt securities, equity securities and other investments. These investments may be used only for activities related to nuclear decommissioning. Given the purpose and legal restrictions on the use of nuclear decommissioning fund assets, realized and unrealized gains on fund investments over the life of the fund are deferred as an offset of NSP-Minnesota’s regulatory asset for nuclear decommissioning costs. Consequently, any realized and unrealized gains and losses on securities in the nuclear decommissioning fund, including any other-than-temporary impairments, are deferred as a component of the regulatory asset for nuclear decommissioning. Since the accounting for nuclear decommissioning recognizes that costs are recovered through rates, fluctuations in equity prices or interest rates affecting the nuclear decommissioning fund do not have a direct impact on earnings.
Changes in discount rates and expected return on plan assets impact the value of pension and postretirement plan assets as well as benefit costs. For further information, see “Employee Benefits” under Critical Accounting Policies and Estimates.
Credit Risk —
Xcel Energy Inc. and its subsidiaries are also exposed to credit risk. Credit risk relates to the risk of loss resulting from counterparties’ nonperformance on their contractual obligations. Xcel Energy Inc. and its subsidiaries maintain credit policies intended to minimize overall credit risk and actively monitor these policies to reflect changes and scope of operations.
At Dec. 31, 2017, a 10 percent increase in commodity prices would have resulted in an increase in credit exposure of $26 million, while a decrease in prices of 10 percent would have resulted in an increase in credit exposure of $7 million. At Dec. 31, 2016, a 10 percent increase in commodity prices would have resulted in an increase in credit exposure of $6 million, while a decrease in prices of 10 percent would have resulted in an increase in credit exposure of $17 million.
Xcel Energy Inc. and its subsidiaries conduct standard credit reviews for all counterparties. Xcel Energy employs additional credit risk control mechanisms when appropriate, such as letters of credit, parental guarantees, standardized master netting agreements and termination provisions that allow for offsetting of positive and negative exposures. Credit exposure is monitored and, when necessary, the activity with a specific counterparty is limited until credit enhancement is provided. Distress in the financial markets could increase Xcel Energy’s credit risk.
Fair Value Measurements
Xcel Energy follows accounting and disclosure guidance on fair value measurements that contains a hierarchy for inputs used in measuring fair value and requires disclosure of the observability of the inputs used in these measurements. See Note 11 to the consolidated financial statements for further discussion of the fair value hierarchy and the amounts of assets and liabilities measured at fair value that have been assigned to Level 3.
74
Commodity Derivatives
— Xcel Energy continuously monitors the creditworthiness of the counterparties to its commodity derivative contracts and assesses each counterparty’s ability to perform on the transactions set forth in the contracts. Given this assessment and the typically short duration of these contracts, the impact of discounting commodity derivative assets for counterparty credit risk was not material to the fair value of commodity derivative assets at Dec. 31, 2017. Adjustments to fair value for credit risk of commodity trading instruments are recorded in electric revenues. Credit risk adjustments for other commodity derivative instruments are deferred as OCI or regulatory assets and liabilities. The classification as a regulatory asset or liability is based on commission approved regulatory recovery mechanisms. Xcel Energy also assesses the impact of its own credit risk when determining the fair value of commodity derivative liabilities. The impact of discounting commodity derivative liabilities for credit risk was immaterial to the fair value of commodity derivative liabilities at Dec. 31, 2017.
Commodity derivative assets and liabilities assigned to Level 3 typically consist of FTRs, as well as forward and option contracts that are long-term in nature or relate to inactive delivery locations. Level 3 commodity derivative assets and liabilities represent 1.7 percent and 4.3 percent of gross assets and liabilities, respectively, measured at fair value at Dec. 31, 2017.
Determining the fair value of FTRs requires numerous management forecasts that vary in observability, including various forward commodity prices, retail and wholesale demand, generation and resulting transmission system congestion. Given the limited observability of management’s forecasts for several of these inputs, these instruments have been assigned a Level 3. Level 3 commodity derivatives assets and liabilities included $32 million and $2 million of estimated fair values, respectively, for FTRs held at Dec. 31, 2017.
Determining the fair value of certain commodity forwards and options can require management to make use of subjective price and volatility forecasts for inactive delivery locations and for contracts that extend to periods beyond those readily observable on active exchanges or quoted by brokers. When less observable forward price and volatility forecasts are significant to determining the value of commodity forwards and options, these instruments are assigned to Level 3. There were $5 million in Level 3 commodity derivative assets and no liabilities for options held at Dec. 31, 2017. There were immaterial Level 3 commodity derivative assets and liabilities for forwards held at Dec. 31, 2017.
75
Liquidity and Capital Resources
Cash Flows
|
(Millions of Dollars)
|
2017
|
2016
|
2015
|
|||||||||
|
Net cash provided by operating activities
|
$
|
3,126
|
|
$
|
3,052
|
|
$
|
3,038
|
|
|||
Net cash provided by operating activities increased by
$74 million
for
2017
as compared to
2016
. The increase was primarily due to higher net income, excluding amounts related to non-cash operating activities (e.g., depreciation and deferred tax expenses) and the timing of customer receipts, partially offset by higher interest payments and pension contributions, refunds, timing of vendor payments and lower income tax refunds received.
Net cash provided by operating activities increased by
$14 million
for
2016
as compared to
2015
. The increase was primarily due to timing of vendor payments and higher net income, excluding amounts related to non-cash operating activities (e.g., depreciation, deferred tax expenses and a charge related to the Monticello LCM/EPU project in 2015), partially offset by timing of customer receipts, refunds and recovery of certain electric and natural gas riders and incentive programs.
|
(Millions of Dollars)
|
2017
|
2016
|
2015
|
|||||||||
|
Net cash used in investing activities
|
$
|
(3,296
|
)
|
$
|
(3,261
|
)
|
$
|
(3,623
|
)
|
|||
Net cash used in investing activities increased by
$35 million
for
2017
as compared to
2016
. The increase was mainly attributable to higher capital expenditures related to the Rush Creek wind generation facility, partially offset by lower capital expenditures related to the Courtenay wind farm and fewer rabbi trust investments.
Net cash used in investing activities decreased by
$362 million
for
2016
as compared to
2015
. The decrease was primarily attributable to the acquisition of two wind projects in 2015, partially offset by the establishment of rabbi trusts in 2016 and higher insurance proceeds received in 2015.
|
(Millions of Dollars)
|
2017
|
2016
|
2015
|
|||||||||
|
Net cash provided by financing activities
|
$
|
168
|
|
$
|
209
|
|
$
|
590
|
|
|||
Net cash provided by financing activities decreased by
$41 million
for
2017
as compared to
2016
. The decrease was primarily due to lower debt issuances and higher dividend payments, partially offset by higher short-term debt proceeds and lower repurchases of common stock in 2017.
Net cash provided by financing activities decreased by
$381 million
for
2016
as compared to
2015
. The decrease was primarily due to higher repayments of long-term and short-term debt, higher dividend payments and repurchases of common stock, partially offset by higher debt issuances in 2016.
See discussion of trends, commitments and uncertainties, and the potential future impact on cash flow and liquidity under Capital Sources.
Capital Requirements
Xcel Energy expects to meet future financing requirements by periodically issuing short-term debt, long-term debt, common stock, hybrid and other securities to maintain desired capitalization ratios.
76
Capital Expenditures —
The current estimated base capital expenditure programs of Xcel Energy’s operating companies for the years 2018 through
2022
are shown in the table below:
|
Capital Forecast
|
||||||||||||||||||||||||
|
(Millions of Dollars)
|
2018
|
2019
|
2020
|
2021
|
2022
|
2018 - 2022 Total
|
||||||||||||||||||
|
By Subsidiary
|
||||||||||||||||||||||||
|
NSP-Minnesota
|
$
|
1,370
|
|
$
|
1,910
|
|
$
|
1,450
|
|
$
|
1,590
|
|
$
|
1,500
|
|
$
|
7,820
|
|
||||||
|
PSCo
|
1,650
|
|
1,020
|
|
950
|
|
1,150
|
|
1,410
|
|
6,180
|
|
||||||||||||
|
SPS
|
1,020
|
|
1,140
|
|
710
|
|
470
|
|
540
|
|
3,880
|
|
||||||||||||
|
NSP-Wisconsin
|
250
|
|
250
|
|
240
|
|
280
|
|
290
|
|
1,310
|
|
||||||||||||
|
Other
(a)
|
20
|
|
(90
|
)
|
(90
|
)
|
(30
|
)
|
—
|
|
(190
|
)
|
||||||||||||
|
Estimated capital reduction
(b)
|
(100
|
)
|
(100
|
)
|
(100
|
)
|
(100
|
)
|
(100
|
)
|
(500
|
)
|
||||||||||||
|
Total capital expenditures
|
$
|
4,210
|
|
$
|
4,130
|
|
$
|
3,160
|
|
$
|
3,360
|
|
$
|
3,640
|
|
$
|
18,500
|
|
||||||
|
Capital Forecast
|
||||||||||||||||||||||||
|
(Millions of Dollars)
|
2018
|
2019
|
2020
|
2021
|
2022
|
2018 - 2022 Total
|
||||||||||||||||||
|
By Function
|
||||||||||||||||||||||||
|
Electric distribution
|
$
|
750
|
|
$
|
810
|
|
$
|
870
|
|
$
|
1,110
|
|
$
|
1,380
|
|
$
|
4,920
|
|
||||||
|
Renewables
|
1,410
|
|
1,860
|
|
880
|
|
270
|
|
—
|
|
4,420
|
|
||||||||||||
|
Electric transmission
|
770
|
|
540
|
|
570
|
|
860
|
|
980
|
|
3,720
|
|
||||||||||||
|
Electric generation
|
520
|
|
370
|
|
290
|
|
520
|
|
530
|
|
2,230
|
|
||||||||||||
|
Natural gas
|
460
|
|
400
|
|
410
|
|
420
|
|
510
|
|
2,200
|
|
||||||||||||
|
Other
(c)
|
400
|
|
250
|
|
240
|
|
280
|
|
340
|
|
1,510
|
|
||||||||||||
|
Estimated capital reduction
(b)
|
(100
|
)
|
(100
|
)
|
(100
|
)
|
(100
|
)
|
(100
|
)
|
(500
|
)
|
||||||||||||
|
Total capital expenditures
|
$
|
4,210
|
|
$
|
4,130
|
|
$
|
3,160
|
|
$
|
3,360
|
|
$
|
3,640
|
|
$
|
18,500
|
|
||||||
|
(a)
|
Other category includes intercompany transfers for safe harbor wind turbines.
|
|
(b)
|
Xcel Energy has reduced its capital forecast by $500 million due to the potential impact of tax reform on cash flows and credit metrics.
|
|
(c)
|
Amounts in other category are net of intercompany transfers.
|
The base capital expenditure forecast does not include the CEP, which if approved could increase the total capital investment by up to $1.5 billion, based on a preliminary estimate. The level of capital investment may decline due to lower renewable pricing and the ultimate composition of assets selected as part of the RFP process. The expected cost and potential capital investment of the CEP will be determined once a recommended portfolio is filed with the CPUC.
The capital expenditure programs of Xcel Energy are subject to continuing review and modification. Actual capital expenditures may vary from estimates due to changes in electric and natural gas projected load growth, regulatory decisions, legislative initiatives, reserve margin requirements, the availability of purchased power, alternative plans for meeting long-term energy needs, compliance with environmental requirements, RPS and merger, acquisition and divestiture opportunities.
Xcel Energy issues debt and equity securities to refinance retiring maturities, reduce short-term debt, fund capital programs, infuse equity in subsidiaries, fund asset acquisitions and for other general corporate purposes.
77
Contractual Obligations and Other Commitments
— In addition to its capital expenditure programs, Xcel Energy has contractual obligations and other commitments that will need to be funded in the future. The following is a summarized table of contractual obligations and other commercial commitments at Dec. 31,
2017
. See the statements of capitalization and additional discussion in Notes 4 and 13 to the consolidated financial statements.
|
Payments Due by Period
|
||||||||||||||||||||
|
(Millions of Dollars)
|
Total
|
Less than 1 Year
|
1 to 3 Years
|
3 to 5 Years
|
After 5 Years
|
|||||||||||||||
|
Long-term debt, principal and interest payments
(a)
|
$
|
25,510
|
|
$
|
1,073
|
|
$
|
2,808
|
|
$
|
2,368
|
|
$
|
19,261
|
|
|||||
|
Capital lease obligations
|
302
|
|
15
|
|
28
|
|
26
|
|
233
|
|
||||||||||
|
Operating leases
(b)(c)
|
3,123
|
|
238
|
|
528
|
|
527
|
|
1,830
|
|
||||||||||
|
Unconditional purchase obligations
(d)
|
7,367
|
|
1,596
|
|
1,965
|
|
1,565
|
|
2,241
|
|
||||||||||
|
Other long-term obligations, including current portion
(e)
|
111
|
|
43
|
|
57
|
|
11
|
|
—
|
|
||||||||||
|
Payments to vendors in process
|
322
|
|
322
|
|
—
|
|
—
|
|
—
|
|
||||||||||
|
Short-term debt
|
814
|
|
814
|
|
—
|
|
—
|
|
—
|
|
||||||||||
|
Total contractual cash obligations
(f)(g)(h)
|
$
|
37,549
|
|
$
|
4,101
|
|
$
|
5,386
|
|
$
|
4,497
|
|
$
|
23,565
|
|
|||||
|
(a)
|
Includes interest payments over the terms of the debt. Interest is calculated using the applicable interest rate at Dec. 31,
2017
, and outstanding principal for each investment with the terms ending at each instrument’s maturity.
|
|
(b)
|
Under some leases, Xcel Energy would have to sell or purchase the property that it leases if it chose to terminate before the scheduled lease expiration date. Most of Xcel Energy’s railcar, vehicle and equipment and aircraft leases have these terms. At Dec. 31,
2017
, the amount that Xcel Energy would have to pay if it chose to terminate these leases was approximately $28 million. In addition, at the end of the equipment lease terms, each lease must be extended, equipment purchased for the greater of the fair value or unamortized value of equipment sold to a third party with Xcel Energy making up any deficiency between the sales price and the unamortized value.
|
|
(c)
|
Included in operating lease payments are
$213 million
,
$474 million
,
$481 million
and
$1.7 billion
, for the less than 1 year, 1-3 years, 3-5 years and after 5 years categories, respectively, pertaining to PPAs that were accounted for as operating leases.
|
|
(d)
|
Xcel Energy Inc. and its subsidiaries have contracts providing for the purchase and delivery of a significant portion of its current coal, nuclear fuel and natural gas requirements. Additionally, the utility subsidiaries of Xcel Energy Inc. have entered into agreements with utilities and other energy suppliers for purchased power to meet system load and energy requirements, replace generation from company-owned units under maintenance and during outages, and meet operating reserve obligations. Certain contractual purchase obligations are adjusted on indices. The effects of price changes are mitigated through cost of energy adjustment mechanisms.
|
|
(e)
|
Other long-term obligations relate primarily to amounts associated with technology agreements as well as uncertain tax positions.
|
|
(f)
|
Xcel Energy also has outstanding authority under O&M contracts to purchase up to approximately $4.8 billion of goods and services through the year 2037, in addition to the amounts disclosed in this table.
|
|
(g)
|
In January
2018
, contributions of
$150 million
were made across four of Xcel Energy’s pension plans. Obligations of this type are dependent on several factors, including management discretion and various minimum contribution requirements determined by the Pension Protection Act, and therefore, are not included in the table.
|
|
(h)
|
Xcel Energy expects to contribute approximately
$12 million
to the postretirement health care plans during
2018
. Obligations of this type are dependent on several factors, including management discretion, and therefore, are not included in the table.
|
Common Stock Dividends —
Future dividend levels will be dependent on Xcel Energy’s results of operations, financial position, cash flows, reinvestment opportunities and other factors, and will be evaluated by the Xcel Energy Inc. Board of Directors. In February 2018, Xcel Energy announced a quarterly dividend of $0.38 per share, which represents an increase of 5.6 percent. Xcel Energy’s dividend policy balances the following:
|
•
|
Projected cash generation;
|
|
•
|
Projected capital investment;
|
|
•
|
A reasonable rate of return on shareholder investment; and
|
|
•
|
The impact on Xcel Energy’s capital structure and credit ratings.
|
In addition, there are certain statutory limitations that could affect dividend levels. Federal law places certain limits on the ability of public utilities within a holding company system to declare dividends.
Specifically, under the Federal Power Act, a public utility may not pay dividends from any funds properly included in a capital account. The utility subsidiaries’ dividends may be limited directly or indirectly by state regulatory commissions or bond indenture covenants. See Note 4 to the consolidated financial statements for further discussion of restrictions on dividend payments.
78
Regulation of Derivatives
—
In 2010, financial reform legislation was passed that provides for the regulation of derivative transactions amongst other provisions. The CFTC ruled that swap dealing activity conducted by entities for the preceding 12 months under a notional limit, initially set at $8 billion, will fall under the general de minimis threshold and will not subject an entity to registering as a swap dealer. The de minimis threshold is scheduled to be reduced to $3 billion in 2018. Xcel Energy’s current and projected swap activity is well below these de minimis thresholds. The bill also contains provisions that exempt certain derivatives end users from much of the clearing and margin requirements and Xcel Energy’s Board of Directors has renewed the end-user exemption on an annual basis. Xcel Energy is currently meeting all reporting requirements and transaction restrictions.
Pension Fund
—
Xcel Energy’s pension assets are invested in a diversified portfolio of domestic and international equity securities, short-term to long-duration fixed income securities and alternative investments, including private equity, real estate and hedge funds.
The funded status and pension assumptions are summarized in the following tables:
|
(Millions of Dollars)
|
Dec. 31, 2017
|
Dec. 31, 2016
|
||||||
|
Fair value of pension assets
|
$
|
3,088
|
|
$
|
2,856
|
|
||
|
Projected pension obligation
(a)
|
3,828
|
|
3,682
|
|
||||
|
Funded status
|
$
|
(740
|
)
|
$
|
(826
|
)
|
||
|
(a)
|
Excludes nonqualified plan of
$37 million
and
$44 million
at Dec. 31,
2017
and
2016
, respectively.
|
|
Pension Assumptions
|
2017
|
2016
|
||||
|
Discount rate
|
3.63
|
%
|
4.13
|
%
|
||
|
Expected long-term rate of return
|
6.87
|
|
6.87
|
|
||
Capital Sources
Short-Term Funding Sources —
Xcel Energy uses a number of sources to fulfill short-term funding needs, including operating cash flow, notes payable, commercial paper and bank lines of credit. The amount and timing of short-term funding needs depend in large part on financing needs for construction expenditures, working capital and dividend payments.
Short-Term Investments —
Xcel Energy Inc., NSP-Minnesota, NSP-Wisconsin, PSCo and SPS maintain cash operating and short-term investment accounts. At Dec. 31,
2017
and
2016
, there was
$3 million
and
$4 million
of cash held in these accounts, respectively.
|
•
|
$1 billion
for Xcel Energy Inc.;
|
|
•
|
$700 million
for PSCo;
|
|
•
|
$500 million
for NSP-Minnesota;
|
|
•
|
$400 million
for SPS; and
|
|
•
|
$150 million
for NSP-Wisconsin.
|
In addition, Xcel Energy Inc. has a 364-day term loan agreement to borrow up to
$500 million
. At Dec. 31,
2017
, Xcel Energy Inc. had drawn
$250 million
on the term loan.
Short-term debt outstanding for Xcel Energy was as follows:
|
(Amounts in Millions, Except Interest Rates)
|
Three Months Ended Dec. 31, 2017
|
|||
|
Borrowing limit
|
$
|
3,250
|
|
|
|
Amount outstanding at period end
|
814
|
|
||
|
Average amount outstanding
|
560
|
|
||
|
Maximum amount outstanding
|
814
|
|
||
|
Weighted average interest rate, computed on a daily basis
|
1.63
|
%
|
||
|
Weighted average interest rate at end of period
|
1.90
|
|
||
79
|
(Amounts in Millions, Except Interest Rates)
|
Year Ended Dec. 31, 2017
|
Year Ended Dec. 31, 2016
|
Year Ended Dec. 31, 2015
|
|||||||||
|
Borrowing limit
|
$
|
3,250
|
|
$
|
2,750
|
|
$
|
2,750
|
|
|||
|
Amount outstanding at period end
|
814
|
|
392
|
|
846
|
|
||||||
|
Average amount outstanding
|
644
|
|
485
|
|
601
|
|
||||||
|
Maximum amount outstanding
|
1,247
|
|
1,183
|
|
1,360
|
|
||||||
|
Weighted average interest rate, computed on a daily basis
|
1.35
|
%
|
0.74
|
%
|
0.48
|
%
|
||||||
|
Weighted average interest rate at end of period
|
1.90
|
|
0.95
|
|
0.82
|
|
||||||
Credit Agreements
—
Xcel Energy Inc., NSP-Minnesota, PSCo, and SPS each have the right to request an extension of the revolving credit facility June 2021 termination date for two additional one-year periods. NSP-Wisconsin has the right to request an extension of the revolving credit facility termination date for an additional one-year period. All extension requests are subject to majority bank group approval.
Xcel Energy Inc. entered into a 364-Day Term Loan Agreement on Dec. 5, 2017 to borrow up to $500 million. As of Dec. 31, 2017, Xcel Energy Inc. had borrowed $250 million of the Term Loan. Xcel Energy Inc. may recommit for one additional 364-day period from the December 2018 maturity date, subject to majority consent from lenders.
As of Feb. 20,
2018
, Xcel Energy Inc. and its utility subsidiaries had the following committed credit facilities available to meet liquidity needs:
|
(Millions of Dollars)
|
Facility
(a)
|
Drawn
(b)
|
Available
|
Cash
|
Liquidity
|
|||||||||||||||
|
Xcel Energy Inc.
|
$
|
1,500
|
|
$
|
877
|
|
$
|
623
|
|
$
|
—
|
|
$
|
623
|
|
|||||
|
PSCo
|
700
|
|
21
|
|
679
|
|
1
|
|
680
|
|
||||||||||
|
NSP-Minnesota
|
500
|
|
81
|
|
419
|
|
2
|
|
421
|
|
||||||||||
|
SPS
|
400
|
|
31
|
|
369
|
|
1
|
|
370
|
|
||||||||||
|
NSP-Wisconsin
|
150
|
|
3
|
|
147
|
|
1
|
|
148
|
|
||||||||||
|
Total
|
$
|
3,250
|
|
$
|
1,013
|
|
$
|
2,237
|
|
$
|
5
|
|
$
|
2,242
|
|
|||||
|
(a)
|
These credit facilities mature in June 2021, with the exception of Xcel Energy Inc.’s $500 million 364-day term loan agreement entered into in December 2017.
|
|
(b)
|
Includes outstanding commercial paper, term loan borrowings and letters of credit.
|
Money Pool —
Xcel Energy received FERC approval to establish a utility money pool arrangement with the utility subsidiaries, subject to receipt of required state regulatory approvals. The utility money pool allows for short-term investments in and borrowings between the utility subsidiaries. Xcel Energy Inc. may make investments in the utility subsidiaries at market-based interest rates; however, the money pool arrangement does not allow the utility subsidiaries to make investments in Xcel Energy Inc. The money pool balances are eliminated in consolidation.
NSP-Minnesota, PSCo and SPS participate in the money pool pursuant to approval from their respective state regulatory commissions. NSP-Wisconsin does not participate in the money pool.
Registration Statements —
Xcel Energy Inc.’s Articles of Incorporation authorize the issuance of one billion shares of $2.50 par value common stock. As of Dec. 31,
2017
and
2016
, Xcel Energy Inc. had approximately
508 million
shares and
507 million
shares of common stock outstanding, respectively. In addition, Xcel Energy Inc.’s Articles of Incorporation authorize the issuance of seven million shares of $100 par value preferred stock. Xcel Energy Inc. had no shares of preferred stock outstanding on Dec. 31,
2017
and
2016
.
Xcel Energy Inc. and its utility subsidiaries have registration statements on file with the SEC pursuant to which they may sell securities from time to time. These registration statements, which are uncapped, permit Xcel Energy Inc. and its utility subsidiaries to issue debt and other securities in the future at amounts, prices and with terms to be determined at the time of future offerings, and in the case of our utility subsidiaries, subject to commission approval.
80
Financing Plans
—
Xcel Energy Inc. and its utility subsidiaries’ 2018 debt financing plans reflect the following:
|
•
|
Xcel Energy Inc. plans to issue approximately $750 million of senior unsecured bonds;
|
|
•
|
NSP-Minnesota plans to issue approximately $300 million of first mortgage bonds;
|
|
•
|
NPS-Wisconsin plans to issue approximately $200 million of first mortgage bonds;
|
|
•
|
PSCo plans to issue approximately $750 million of first mortgage bonds; and
|
|
•
|
SPS plans to issue approximately $350 million of first mortgage bonds.
|
Xcel Energy also plans to issue approximately $300 million of incremental equity in addition to $385 million of equity to be issued through the DRIP and benefit programs during the five-year forecast time period.
Financing plans are subject to change, depending on capital expenditures, regulatory outcomes, internal cash generation, market conditions and other factors.
Long-Term Borrowings and Other Financing Instruments
—
See the consolidated statements of capitalization and a discussion of the long-term borrowings in Note 4 to the consolidated financial statements.
Off-Balance-Sheet Arrangements
Xcel Energy does not have any off-balance-sheet arrangements, other than those currently disclosed, that have or are reasonably likely to have a current or future effect on financial condition, changes in financial condition, revenues or expenses, results of operations, liquidity, capital expenditures or capital resources that is material to investors.
Earnings Guidance
Xcel Energy’s
2018
GAAP and ongoing earnings guidance is $2.37 to $2.47 per share.
(a)
Key assumptions:
|
•
|
Constructive outcomes in all rate case and regulatory proceedings.
|
|
•
|
Normal weather patterns.
|
|
•
|
Weather-normalized retail electric sales are projected to be within a range of 0 percent to 0.5 percent over 2017 levels.
|
|
•
|
Weather-normalized retail firm natural gas sales are projected to be within a range of 0 percent to 0.5 percent below 2017 levels.
|
|
•
|
Capital rider revenue is projected to increase by $30 million to $40 million over 2017 levels. PTCs are flowed back to customers, primarily through capital riders and reductions to electric margin.
|
|
•
|
O&M expenses are projected to be flat.
|
|
•
|
Depreciation expense is projected to increase approximately $150 million to $160 million over 2017 levels. Approximately $20 million of the increase in depreciation expense reflects an increased renewable development fund, which is recovered in revenue and will not have an impact on earnings.
|
|
•
|
Property taxes are projected to increase approximately $30 million to $40 million over 2017 levels.
|
|
•
|
Interest expense (net of AFUDC — debt) is projected to increase $20 million to $30 million over 2017 levels.
|
|
•
|
AFUDC — equity is projected to increase approximately $20 million to $30 million from 2017 levels.
|
|
•
|
The ETR is projected to be approximately 8 percent to 10 percent. The lower ETR for 2018 compared to 2017 reflects the lower tax rate as part of the TCJA, including excess deferred taxes and PTCs which are flowed back to customers through margin. The ETR would be approximately 21 percent to 23 percent excluding excess deferred taxes and PTCs.
|
|
(a)
|
Ongoing earnings is calculated using net income and adjusting for certain nonrecurring or infrequent items that are, in management’s view, not reflective of ongoing operations. Ongoing earnings could differ from those prepared in accordance with GAAP for unplanned and/or unknown adjustments. Xcel Energy is unable to forecast if any of these items will occur or provide a quantitative reconciliation of the guidance for ongoing diluted EPS to corresponding GAAP diluted EPS.
|
81
Long-Term EPS and Dividend Growth Rate Objectives
Long-Term EPS and Dividend Growth Rate Objectives
—
Xcel Energy expects to deliver an attractive total return to our shareholders through a combination of earnings growth and dividend yield, based on the following long-term objectives:
|
•
|
Deliver long-term annual EPS growth of 5 percent to 6 percent off of a 2017 base of $2.30 per share;
|
|
•
|
Deliver annual dividend increases of 5 percent to 7 percent;
|
|
•
|
Target a dividend payout ratio of 60 percent to 70 percent; and
|
|
•
|
Maintain senior secured debt credit ratings in the A range and senior unsecured debt credit ratings in the BBB+ to A range.
|
See Item 7, incorporated by reference.
See Item 15-1 for an index of financial statements included herein.
See Note 18 to the consolidated financial statements for summarized quarterly financial data.
82
Management Report on Internal Controls Over Financial Reporting
The management of Xcel Energy Inc. is responsible for establishing and maintaining adequate internal control over financial reporting. Xcel Energy Inc.’s internal control system was designed to provide reasonable assurance to Xcel Energy Inc.’s management and board of directors regarding the preparation and fair presentation of published financial statements.
All internal control systems, no matter how well designed, have inherent limitations. Therefore, even those systems determined to be effective can provide only reasonable assurance with respect to financial statement preparation and presentation.
In 2016, Xcel Energy Inc. implemented the general ledger modules, as well as initiated deployment of work management systems modules, of a new enterprise resource planning system. Xcel Energy Inc. implemented additional work management systems modules in 2017. Xcel Energy Inc. does not believe this implementation had an adverse effect on its internal control over financial reporting.
Xcel Energy Inc. management assessed the effectiveness of Xcel Energy Inc.’s internal control over financial reporting as of Dec. 31, 2017. In making this assessment, it used the criteria set forth by the Committee of Sponsoring Organizations of the Treadway Commission (COSO) in Internal Control — Integrated Framework (2013). Based on our assessment, we believe that, as of Dec. 31, 2017, Xcel Energy Inc.’s internal control over financial reporting is effective at the reasonable assurance level based on those criteria.
Xcel Energy Inc.’s independent registered public accounting firm has issued an audit report on the Xcel Energy Inc.’s internal control over financial reporting. Its report appears herein.
|
/s/ BEN FOWKE
|
/s/ ROBERT C. FRENZEL
|
|
|
Ben Fowke
|
Robert C. Frenzel
|
|
|
Chairman, President and Chief Executive Officer
|
Executive Vice President, Chief Financial Officer
|
|
|
Feb. 23, 2018
|
Feb. 23, 2018
|
|
83
REPORT OF INDEPENDENT REGISTERED PUBLIC ACCOUNTING FIRM
To the Board of Directors and Stockholders of
Xcel Energy Inc.
Opinion on the Financial Statements
We have audited the accompanying consolidated balance sheets of Xcel Energy Inc. and subsidiaries (the "Company") as of December 31, 2017 and 2016, the related consolidated statements of income, comprehensive income, cash flows, and common stockholders' equity, for each of the three years in the period ended December 31, 2017, and the related notes and the schedules listed in the Index at Item 15 (collectively referred to as the "financial statements"). In our opinion, the financial statements present fairly, in all material respects, the financial position of the Company as of December 31, 2017 and 2016, and the results of its operations and its cash flows for each of the three years in the period ended December 31, 2017, in conformity with accounting principles generally accepted in the United States of America.
We have also audited, in accordance with the standards of the Public Company Accounting Oversight Board (United States) (PCAOB), the Company's internal control over financial reporting as of December 31, 2017, based on criteria established in
Internal Control - Integrated Framework (2013)
issued by the Committee of Sponsoring Organizations of the Treadway Commission and our report dated February 23, 2018, expressed an unqualified opinion on the Company's internal control over financial reporting.
Basis for Opinion
These financial statements are the responsibility of the Company's management. Our responsibility is to express an opinion on the Company's financial statements based on our audits. We are a public accounting firm registered with the PCAOB and are required to be independent with respect to the Company in accordance with the U.S. federal securities laws and the applicable rules and regulations of the Securities and Exchange Commission and the PCAOB.
We conducted our audits in accordance with the standards of the PCAOB. Those standards require that we plan and perform the audit to obtain reasonable assurance about whether the financial statements are free of material misstatement, whether due to error or fraud. Our audits included performing procedures to assess the risks of material misstatement of the financial statements, whether due to error or fraud, and performing procedures that respond to those risks. Such procedures included examining, on a test basis, evidence regarding the amounts and disclosures in the financial statements. Our audits also included evaluating the accounting principles used and significant estimates made by management, as well as evaluating the overall presentation of the financial statements. We believe that our audits provide a reasonable basis for our opinion.
/s/ DELOITTE & TOUCHE LLP
Minneapolis, Minnesota
February 23, 2018
We have served as the Company's auditor since 2002.
84
REPORT OF INDEPENDENT REGISTERED PUBLIC ACCOUNTING
FIRM
To the Board of Directors and Stockholders of
Xcel Energy Inc.
Opinion on Internal Control over Financial Reporting
We have audited the internal control over financial reporting of Xcel Energy Inc. and subsidiaries (the “Company”) as of December 31, 2017, based on criteria established in
Internal Control - Integrated Framework (2013)
issued by the Committee of Sponsoring Organizations of the Treadway Commission (COSO). In our opinion, the Company maintained, in all material respects, effective internal control over financial reporting as of December 31, 2017, based on criteria established in
Internal Control - Integrated Framework (2013)
issued by COSO.
We have also audited, in accordance with the standards of the Public Company Accounting Oversight Board (United States) (PCAOB), the consolidated financial statements as of and for the year ended December 31, 2017, of the Company and our report dated February 23, 2018, expressed an unqualified opinion on those financial statements.
Basis for Opinion
The Company’s management is responsible for maintaining effective internal control over financial reporting and for its assessment of the effectiveness of internal control over financial reporting, included in the accompanying Management Report on Internal Controls over Financial Reporting. Our responsibility is to express an opinion on the Company’s internal control over financial reporting based on our audit. We are a public accounting firm registered with the PCAOB and are required to be independent with respect to the Company in accordance with the U.S. federal securities laws and the applicable rules and regulations of the Securities and Exchange Commission and the PCAOB.
We conducted our audit in accordance with the standards of the PCAOB. Those standards require that we plan and perform the audit to obtain reasonable assurance about whether effective internal control over financial reporting was maintained in all material respects. Our audit included obtaining an understanding of internal control over financial reporting, assessing the risk that a material weakness exists, testing and evaluating the design and operating effectiveness of internal control based on the assessed risk, and performing such other procedures as we considered necessary in the circumstances. We believe that our audit provides a reasonable basis for our opinion.
Definition and Limitations of Internal Control over Financial Reporting
A company’s internal control over financial reporting is a process designed to provide reasonable assurance regarding the reliability of financial reporting and the preparation of financial statements for external purposes in accordance with generally accepted accounting principles. A company’s internal control over financial reporting includes those policies and procedures that (1) pertain to the maintenance of records that, in reasonable detail, accurately and fairly reflect the transactions and dispositions of the assets of the company; (2) provide reasonable assurance that transactions are recorded as necessary to permit preparation of financial statements in accordance with generally accepted accounting principles, and that receipts and expenditures of the company are being made only in accordance with authorizations of management and directors of the company; and (3) provide reasonable assurance regarding prevention or timely detection of unauthorized acquisition, use, or disposition of the company’s assets that could have a material effect on the financial statements.
Because of its inherent limitations, internal control over financial reporting may not prevent or detect misstatements. Also, projections of any evaluation of effectiveness to future periods are subject to the risk that controls may become inadequate because of changes in conditions, or that the degree of compliance with the policies or procedures may deteriorate.
/s/ DELOITTE & TOUCHE LLP
Minneapolis, Minnesota
February 23, 2018
85
|
XCEL ENERGY INC. AND SUBSIDIARIES
CONSOLIDATED STATEMENTS OF INCOME
(
amounts in millions, except per share data)
|
||||||||||||
|
Year Ended Dec. 31
|
||||||||||||
|
2017
|
2016
|
2015
|
||||||||||
|
Operating revenues
|
||||||||||||
|
Electric
|
$
|
9,676
|
|
$
|
9,500
|
|
$
|
9,276
|
|
|||
|
Natural gas
|
1,650
|
|
1,531
|
|
1,672
|
|
||||||
|
Other
|
78
|
|
76
|
|
76
|
|
||||||
|
Total operating revenues
|
11,404
|
|
11,107
|
|
11,024
|
|
||||||
|
Operating expenses
|
||||||||||||
|
Electric fuel and purchased power
|
3,757
|
|
3,718
|
|
3,763
|
|
||||||
|
Cost of natural gas sold and transported
|
823
|
|
733
|
|
905
|
|
||||||
|
Cost of sales — other
|
34
|
|
36
|
|
36
|
|
||||||
|
Operating and maintenance expenses
|
2,303
|
|
2,326
|
|
2,330
|
|
||||||
|
Conservation and demand side management program expenses
|
273
|
|
245
|
|
225
|
|
||||||
|
Depreciation and amortization
|
1,479
|
|
1,303
|
|
1,124
|
|
||||||
|
Taxes (other than income taxes)
|
545
|
|
532
|
|
512
|
|
||||||
|
Loss on Monticello life cycle management/extended power uprate project
|
—
|
|
—
|
|
129
|
|
||||||
|
Total operating expenses
|
9,214
|
|
8,893
|
|
9,024
|
|
||||||
|
Operating income
|
2,190
|
|
2,214
|
|
2,000
|
|
||||||
|
Other income, net
|
23
|
|
8
|
|
6
|
|
||||||
|
Equity earnings of unconsolidated subsidiaries
|
30
|
|
42
|
|
34
|
|
||||||
|
Allowance for funds used during construction — equity
|
75
|
|
60
|
|
56
|
|
||||||
|
Interest charges and financing costs
|
||||||||||||
|
Interest charges — includes other financing costs of $24, $25 and
$24, respectively
|
663
|
|
647
|
|
595
|
|
||||||
|
Allowance for funds used during construction — debt
|
(35
|
)
|
(27
|
)
|
(26
|
)
|
||||||
|
Total interest charges and financing costs
|
628
|
|
620
|
|
569
|
|
||||||
|
Income before income taxes
|
1,690
|
|
1,704
|
|
1,527
|
|
||||||
|
Income taxes
|
542
|
|
581
|
|
543
|
|
||||||
|
Net income
|
$
|
1,148
|
|
$
|
1,123
|
|
$
|
984
|
|
|||
|
Weighted average common shares outstanding:
|
||||||||||||
|
Basic
|
509
|
|
509
|
|
508
|
|
||||||
|
Diluted
|
509
|
|
509
|
|
508
|
|
||||||
|
Earnings per average common share:
|
||||||||||||
|
Basic
|
$
|
2.26
|
|
$
|
2.21
|
|
$
|
1.94
|
|
|||
|
Diluted
|
2.25
|
|
2.21
|
|
1.94
|
|
||||||
|
Cash dividends declared per common share
|
$
|
1.44
|
|
$
|
1.36
|
|
$
|
1.28
|
|
|||
|
See Notes to Consolidated Financial Statements
|
||||||||||||
86
|
XCEL ENERGY INC. AND SUBSIDIARIES
CONSOLIDATED STATEMENTS OF COMPREHENSIVE INCOME
(amounts in millions)
|
||||||||||||
|
Year Ended Dec. 31
|
||||||||||||
|
2017
|
2016
|
2015
|
||||||||||
|
Net income
|
$
|
1,148
|
|
$
|
1,123
|
|
$
|
984
|
|
|||
|
Other comprehensive income (loss)
|
||||||||||||
|
Pension and retiree medical benefits:
|
||||||||||||
|
Net pension and retiree medical losses arising during the period, net of tax of $(2), $(5), and $(5), respectively
|
(3
|
)
|
(8
|
)
|
(8
|
)
|
||||||
|
Amortization of losses included in net periodic benefit cost, net of tax of $5, $2, and $2, respectively
|
7
|
|
4
|
|
3
|
|
||||||
|
4
|
|
(4
|
)
|
(5
|
)
|
|||||||
|
Derivative instruments:
|
||||||||||||
|
Reclassification of losses to net income, net of tax of $2, $2, and $2, respectively
|
3
|
|
4
|
|
3
|
|
||||||
|
Other comprehensive income (loss)
|
7
|
|
—
|
|
(2
|
)
|
||||||
|
Comprehensive income
|
$
|
1,155
|
|
$
|
1,123
|
|
$
|
982
|
|
|||
|
See Notes to Consolidated Financial Statements
|
||||||||||||
87
|
XCEL ENERGY INC. AND SUBSIDIARIES
(amounts in millions)
|
|||||||||||
|
|
Year Ended Dec. 31
|
||||||||||
|
|
2017
|
2016
|
2015
|
||||||||
|
Operating activities
|
|
|
|
||||||||
|
Net income
|
$
|
1,148
|
|
$
|
1,123
|
|
$
|
984
|
|
||
|
Adjustments to reconcile net income to cash provided by operating activities:
|
|||||||||||
|
Depreciation and amortization
|
1,495
|
|
1,319
|
|
1,143
|
|
|||||
|
Conservation and demand side management program amortization
|
2
|
|
4
|
|
5
|
|
|||||
|
Nuclear fuel amortization
|
114
|
|
117
|
|
106
|
|
|||||
|
Deferred income taxes
|
640
|
|
587
|
|
536
|
|
|||||
|
Amortization of investment tax credits
|
(5
|
)
|
(5
|
)
|
(5
|
)
|
|||||
|
Allowance for equity funds used during construction
|
(75
|
)
|
(60
|
)
|
(56
|
)
|
|||||
|
Equity earnings of unconsolidated subsidiaries
|
(30
|
)
|
(42
|
)
|
(34
|
)
|
|||||
|
Dividends from unconsolidated subsidiaries
|
41
|
|
46
|
|
40
|
|
|||||
|
Provision for bad debts
|
39
|
|
39
|
|
36
|
|
|||||
|
Share-based compensation expense
|
57
|
|
41
|
|
45
|
|
|||||
|
Loss on Monticello life cycle management/extended power uprate project
|
—
|
|
—
|
|
129
|
|
|||||
|
Net realized and unrealized hedging and derivative transactions
|
2
|
|
8
|
|
22
|
|
|||||
|
Other, net
|
(3
|
)
|
(1
|
)
|
(1
|
)
|
|||||
|
Changes in operating assets and liabilities:
|
|||||||||||
|
Accounts receivable
|
(60
|
)
|
(83
|
)
|
66
|
|
|||||
|
Accrued unbilled revenues
|
(34
|
)
|
(75
|
)
|
74
|
|
|||||
|
Inventories
|
(3
|
)
|
1
|
|
(11
|
)
|
|||||
|
Other current assets
|
9
|
|
61
|
|
9
|
|
|||||
|
Accounts payable
|
43
|
|
118
|
|
(120
|
)
|
|||||
|
Net regulatory assets and liabilities
|
(16
|
)
|
(19
|
)
|
102
|
|
|||||
|
Other current liabilities
|
(38
|
)
|
20
|
|
78
|
|
|||||
|
Pension and other employee benefit obligations
|
(133
|
)
|
(91
|
)
|
(69
|
)
|
|||||
|
Change in other noncurrent assets
|
(1
|
)
|
(16
|
)
|
11
|
|
|||||
|
Change in other noncurrent liabilities
|
(66
|
)
|
(40
|
)
|
(52
|
)
|
|||||
|
Net cash provided by operating activities
|
3,126
|
|
3,052
|
|
3,038
|
|
|||||
|
Investing activities
|
|
|
|
|
|||||||
|
Utility capital/construction expenditures
|
(3,319
|
)
|
(3,256
|
)
|
(3,683
|
)
|
|||||
|
Allowance for equity funds used during construction
|
75
|
|
61
|
|
56
|
|
|||||
|
Proceeds from insurance recoveries
|
—
|
|
5
|
|
27
|
|
|||||
|
Purchases of investment securities
|
(1,697
|
)
|
(547
|
)
|
(1,258
|
)
|
|||||
|
Proceeds from the sale of investment securities
|
1,669
|
|
479
|
|
1,237
|
|
|||||
|
Investments in unconsolidated subsidiaries and other
|
(17
|
)
|
(4
|
)
|
(2
|
)
|
|||||
|
Other, net
|
(7
|
)
|
1
|
|
—
|
|
|||||
|
Net cash used in investing activities
|
(3,296
|
)
|
(3,261
|
)
|
(3,623
|
)
|
|||||
|
Financing activities
|
|||||||||||
|
Proceeds from (repayments of) short-term borrowings, net
|
422
|
|
(454
|
)
|
(174
|
)
|
|||||
|
Proceeds from issuance of long-term debt
|
1,518
|
|
2,424
|
|
1,626
|
|
|||||
|
Repayments of long-term debt, including reacquisition premiums
|
(1,030
|
)
|
(1,036
|
)
|
(251
|
)
|
|||||
|
Proceeds from issuance of common stock
|
—
|
|
—
|
|
7
|
|
|||||
|
Repurchases of common stock
|
(3
|
)
|
(32
|
)
|
—
|
|
|||||
|
Dividends paid
|
(721
|
)
|
(681
|
)
|
(607
|
)
|
|||||
|
Other
|
(18
|
)
|
(12
|
)
|
(11
|
)
|
|||||
|
Net cash provided by financing activities
|
168
|
|
209
|
|
590
|
|
|||||
|
Net change in cash and cash equivalents
|
(2
|
)
|
—
|
|
5
|
|
|||||
|
Cash and cash equivalents at beginning of period
|
85
|
|
85
|
|
80
|
|
|||||
|
Cash and cash equivalents at end of period
|
$
|
83
|
|
$
|
85
|
|
$
|
85
|
|
||
|
Supplemental disclosure of cash flow information:
|
|
|
|
|
|||||||
|
Cash paid for interest (net of amounts capitalized)
|
$
|
(616
|
)
|
$
|
(592
|
)
|
$
|
(543
|
)
|
||
|
Cash received for income taxes, net
|
44
|
|
62
|
|
58
|
|
|||||
|
Supplemental disclosure of non-cash investing and financing transactions:
|
|
|
|
|
|||||||
|
Property, plant and equipment additions in accounts payable
|
$
|
415
|
|
$
|
254
|
|
$
|
322
|
|
||
|
Issuance of common stock for reinvested dividends and equity awards
|
31
|
|
29
|
|
53
|
|
|||||
|
See Notes to Consolidated Financial Statements
|
|||||||||||
88
|
XCEL ENERGY INC. AND SUBSIDIARIES
(amounts in millions, except share and per share data)
|
||||||||
|
Dec. 31
|
||||||||
|
2017
|
2016
|
|||||||
|
Assets
|
||||||||
|
Current assets
|
||||||||
|
Cash and cash equivalents
|
$
|
83
|
|
$
|
85
|
|
||
|
Accounts receivable, net
|
797
|
|
776
|
|
||||
|
Accrued unbilled revenues
|
764
|
|
730
|
|
||||
|
Inventories
|
610
|
|
604
|
|
||||
|
Regulatory assets
|
424
|
|
364
|
|
||||
|
Derivative instruments
|
44
|
|
38
|
|
||||
|
Prepaid taxes
|
68
|
|
107
|
|
||||
|
Prepayments and other
|
183
|
|
138
|
|
||||
|
Total current assets
|
2,973
|
|
2,842
|
|
||||
|
Property, plant and equipment, net
|
34,329
|
|
32,842
|
|
||||
|
Other assets
|
||||||||
|
Nuclear decommissioning fund and other investments
|
2,397
|
|
2,092
|
|
||||
|
Regulatory assets
|
3,005
|
|
3,081
|
|
||||
|
Derivative instruments
|
48
|
|
50
|
|
||||
|
Deposits and other
|
278
|
|
248
|
|
||||
|
Total other assets
|
5,728
|
|
5,471
|
|
||||
|
Total assets
|
$
|
43,030
|
|
$
|
41,155
|
|
||
|
Liabilities and Equity
|
||||||||
|
Current liabilities
|
||||||||
|
Current portion of long-term debt
|
$
|
457
|
|
$
|
255
|
|
||
|
Short-term debt
|
814
|
|
392
|
|
||||
|
Accounts payable
|
1,243
|
|
1,045
|
|
||||
|
Regulatory liabilities
|
239
|
|
221
|
|
||||
|
Taxes accrued
|
448
|
|
457
|
|
||||
|
Accrued interest
|
174
|
|
173
|
|
||||
|
Dividends payable
|
183
|
|
172
|
|
||||
|
Derivative instruments
|
29
|
|
27
|
|
||||
|
Other
|
501
|
|
505
|
|
||||
|
Total current liabilities
|
4,088
|
|
3,247
|
|
||||
|
Deferred credits and other liabilities
|
||||||||
|
Deferred income taxes
|
3,845
|
|
6,784
|
|
||||
|
Deferred investment tax credits
|
58
|
|
63
|
|
||||
|
Regulatory liabilities
|
5,083
|
|
1,383
|
|
||||
|
Asset retirement obligations
|
2,475
|
|
2,782
|
|
||||
|
Derivative instruments
|
126
|
|
148
|
|
||||
|
Customer advances
|
193
|
|
195
|
|
||||
|
Pension and employee benefit obligations
|
1,042
|
|
1,112
|
|
||||
|
Other
|
145
|
|
225
|
|
||||
|
Total deferred credits and other liabilities
|
12,967
|
|
12,692
|
|
||||
|
Commitments and contingencies
|
|
|
|
|
||||
|
Capitalization
|
||||||||
|
Long-term debt
|
14,520
|
|
14,195
|
|
||||
|
Common stock — 1,000,000,000 shares authorized of $2.50 par value; 507,762,881 and 507,222,795 shares outstanding at Dec. 31, 2017 and 2016, respectively
|
1,269
|
|
1,268
|
|
||||
|
Additional paid in capital
|
5,898
|
|
5,881
|
|
||||
|
Retained earnings
|
4,413
|
|
3,982
|
|
||||
|
Accumulated other comprehensive loss
|
(125
|
)
|
(110
|
)
|
||||
|
Total common stockholders’ equity
|
11,455
|
|
11,021
|
|
||||
|
Total liabilities and equity
|
$
|
43,030
|
|
$
|
41,155
|
|
||
|
See Notes to Consolidated Financial Statements
|
||||||||
89
|
XCEL ENERGY INC. AND SUBSIDIARIES
CONSOLIDATED STATEMENTS OF COMMON STOCKHOLDERS’ EQUITY
(amounts in millions, shares in thousands)
|
||||||||||||||||||||||
|
Common Stock Issued
|
Accumulated Other
Comprehensive Loss
|
Total Common Stockholders’ Equity
|
||||||||||||||||||||
|
Shares
|
Par Value
|
Additional
Paid In
Capital
|
Retained
Earnings
|
|||||||||||||||||||
|
Balance at Dec. 31, 2014
|
505,733
|
|
$
|
1,264
|
|
$
|
5,837
|
|
$
|
3,221
|
|
$
|
(108
|
)
|
$
|
10,214
|
|
|||||
|
Net income
|
984
|
|
984
|
|
||||||||||||||||||
|
Other comprehensive loss
|
(2
|
)
|
(2
|
)
|
||||||||||||||||||
|
Dividends declared on common stock
|
(652
|
)
|
(652
|
)
|
||||||||||||||||||
|
Issuances of common stock
|
1,803
|
|
5
|
|
28
|
|
33
|
|
||||||||||||||
|
Share-based compensation
|
|
|
|
|
24
|
|
24
|
|
||||||||||||||
|
Balance at Dec. 31, 2015
|
507,536
|
|
$
|
1,269
|
|
$
|
5,889
|
|
$
|
3,553
|
|
$
|
(110
|
)
|
$
|
10,601
|
|
|||||
|
Net income
|
1,123
|
|
1,123
|
|
||||||||||||||||||
|
Dividends declared on common stock
|
(694
|
)
|
(694
|
)
|
||||||||||||||||||
|
Issuances of common stock
|
486
|
|
1
|
|
15
|
|
16
|
|
||||||||||||||
|
Repurchases of common stock
|
(799
|
)
|
(2
|
)
|
(30
|
)
|
(32
|
)
|
||||||||||||||
|
Share-based compensation
|
7
|
|
7
|
|
||||||||||||||||||
|
Balance at Dec. 31, 2016
|
507,223
|
|
$
|
1,268
|
|
$
|
5,881
|
|
$
|
3,982
|
|
$
|
(110
|
)
|
$
|
11,021
|
|
|||||
|
Net income
|
1,148
|
|
1,148
|
|
||||||||||||||||||
|
Other comprehensive income
|
7
|
|
7
|
|
||||||||||||||||||
|
Dividends declared on common stock
|
(736
|
)
|
(736
|
)
|
||||||||||||||||||
|
Issuances of common stock
|
611
|
|
1
|
|
4
|
|
5
|
|
||||||||||||||
|
Repurchases of common stock
|
(71
|
)
|
—
|
|
(3
|
)
|
(3
|
)
|
||||||||||||||
|
Share-based compensation
|
16
|
|
(3
|
)
|
13
|
|
||||||||||||||||
|
Adoption of ASU No. 2018-02
|
22
|
|
(22
|
)
|
—
|
|
||||||||||||||||
|
Balance at Dec. 31, 2017
|
507,763
|
|
$
|
1,269
|
|
$
|
5,898
|
|
$
|
4,413
|
|
$
|
(125
|
)
|
$
|
11,455
|
|
|||||
|
See Notes to Consolidated Financial Statements
|
||||||||||||||||||||||
90
|
XCEL ENERGY INC. AND SUBSIDIARIES
CONSOLIDATED STATEMENTS OF CAPITALIZATION
(amounts in millions, except share and per share data)
|
||||||||
|
Dec. 31
|
||||||||
|
2017
|
2016
|
|||||||
|
Long-Term Debt
|
||||||||
|
NSP-Minnesota
|
||||||||
|
First Mortgage Bonds, Series due:
|
||||||||
|
March 1, 2018, 5.25%
|
$
|
—
|
|
$
|
500
|
|
||
|
Aug. 15, 2020, 2.2%
|
300
|
|
300
|
|
||||
|
Aug. 15, 2022, 2.15%
|
300
|
|
300
|
|
||||
|
May 15, 2023, 2.6%
|
400
|
|
400
|
|
||||
|
July 1, 2025, 7.125%
|
250
|
|
250
|
|
||||
|
March 1, 2028, 6.5%
|
150
|
|
150
|
|
||||
|
July 15, 2035, 5.25%
|
250
|
|
250
|
|
||||
|
June 1, 2036, 6.25%
|
400
|
|
400
|
|
||||
|
July 1, 2037, 6.2%
|
350
|
|
350
|
|
||||
|
Nov. 1, 2039, 5.35%
|
300
|
|
300
|
|
||||
|
Aug. 15, 2040, 4.85%
|
250
|
|
250
|
|
||||
|
Aug. 15, 2042, 3.4%
|
500
|
|
500
|
|
||||
|
May 15, 2044, 4.125%
|
300
|
|
300
|
|
||||
|
Aug. 15, 2045, 4.0%
|
300
|
|
300
|
|
||||
|
May 15, 2046, 3.6%
|
350
|
|
350
|
|
||||
|
Sept. 15, 2047, 3.6%
|
600
|
|
—
|
|
||||
|
Unamortized discount
|
(22
|
)
|
(17
|
)
|
||||
|
Unamortized debt expense
|
(45
|
)
|
(40
|
)
|
||||
|
Total NSP-Minnesota long-term debt
|
$
|
4,933
|
|
$
|
4,843
|
|
||
|
PSCo
|
|
|
|
|
||||
|
First Mortgage Bonds, Series due:
|
|
|
|
|
||||
|
Aug. 1, 2018, 5.8%
|
$
|
300
|
|
$
|
300
|
|
||
|
June 1, 2019, 5.125%
|
400
|
|
400
|
|
||||
|
Nov. 15, 2020, 3.2%
|
400
|
|
400
|
|
||||
|
Sept. 15, 2022, 2.25%
|
300
|
|
300
|
|
||||
|
March 15, 2023, 2.5%
|
250
|
|
250
|
|
||||
|
May 15, 2025, 2.9%
|
250
|
|
250
|
|
||||
|
Sept. 1, 2037, 6.25%
|
350
|
|
350
|
|
||||
|
Aug. 1, 2038, 6.5%
|
300
|
|
300
|
|
||||
|
Aug. 15, 2041, 4.75%
|
250
|
|
250
|
|
||||
|
Sept. 15, 2042, 3.6%
|
500
|
|
500
|
|
||||
|
March 15, 2043, 3.95%
|
250
|
|
250
|
|
||||
|
March 15, 2044, 4.30%
|
300
|
|
300
|
|
||||
|
June 15, 2046, 3.55%
|
250
|
|
250
|
|
||||
|
June 15, 2047, 3.8%
|
400
|
|
—
|
|
||||
|
Capital lease obligations, through 2060, 11.2% — 14.3%
|
151
|
|
156
|
|
||||
|
Unamortized discount
|
(13
|
)
|
(13
|
)
|
||||
|
Unamortized debt expense
|
(29
|
)
|
(27
|
)
|
||||
|
Total
|
4,609
|
|
4,216
|
|
||||
|
Less current maturities
|
306
|
|
5
|
|
||||
|
Total PSCo long-term debt
|
$
|
4,303
|
|
$
|
4,211
|
|
||
|
SPS
|
|
|
|
|
||||
|
First Mortgage Bonds, Series due:
|
||||||||
|
June 15, 2024, 3.3%
|
$
|
350
|
|
$
|
350
|
|
||
|
Aug. 15, 2041, 4.5%
|
400
|
|
400
|
|
||||
|
Aug. 15, 2046, 3.4%
|
300
|
|
300
|
|
||||
|
Aug. 15, 2047, 3.7%
|
450
|
|
—
|
|
||||
|
Unsecured Senior G Notes, due Dec. 1, 2018, 8.75%
|
—
|
|
250
|
|
||||
|
Unsecured Senior C and D Notes, due Oct. 1, 2033, 6%
|
100
|
|
100
|
|
||||
|
Unsecured Senior F Notes, due Oct. 1, 2036, 6%
|
250
|
|
250
|
|
||||
|
Unamortized discount
|
(2
|
)
|
—
|
|
||||
|
Unamortized debt expense
|
(18
|
)
|
(14
|
)
|
||||
|
Total SPS long-term debt
|
$
|
1,830
|
|
$
|
1,636
|
|
||
91
|
XCEL ENERGY INC. AND SUBSIDIARIES
CONSOLIDATED STATEMENTS OF CAPITALIZATION
—
(Continued)
(amounts in millions, except share and per share data)
|
||||||||
|
Dec. 31
|
||||||||
|
2017
|
2016
|
|||||||
|
NSP-Wisconsin
|
||||||||
|
First Mortgage Bonds, Series due:
|
||||||||
|
Oct. 1, 2018, 5.25%
|
$
|
150
|
|
$
|
150
|
|
||
|
June 15, 2024, 3.3%
|
200
|
|
200
|
|
||||
|
Sept. 1, 2038, 6.375%
|
200
|
|
200
|
|
||||
|
Oct. 1, 2042, 3.7%
|
100
|
|
100
|
|
||||
|
Dec. 1, 2047, 3.75%
|
100
|
|
—
|
|
||||
|
City of La Crosse Resource Recovery Bond, Series due Nov. 1, 2021, 6%
(a)
|
19
|
|
19
|
|
||||
|
Other
|
2
|
|
2
|
|
||||
|
Unamortized discount
|
(3
|
)
|
(3
|
)
|
||||
|
Unamortized debt expense
|
(7
|
)
|
(5
|
)
|
||||
|
Total
|
761
|
|
663
|
|
||||
|
Less current maturities
|
151
|
|
1
|
|
||||
|
Total NSP-Wisconsin long-term debt
|
$
|
610
|
|
$
|
662
|
|
||
|
Other Subsidiaries
|
||||||||
|
Various Eloigne Co. Affordable Housing Project Notes, due 2018-2052, 0% — 7.05%
|
$
|
28
|
|
$
|
31
|
|
||
|
Less current maturities
|
2
|
|
1
|
|
||||
|
Total other subsidiaries long-term debt
|
$
|
26
|
|
$
|
30
|
|
||
|
Xcel Energy Inc.
|
||||||||
|
Unsecured Senior Notes, Series due:
|
||||||||
|
June 1, 2017, 1.2%
|
$
|
—
|
|
$
|
250
|
|
||
|
May 15, 2020, 4.7%
|
550
|
|
550
|
|
||||
|
March 15, 2021, 2.4%
|
400
|
|
400
|
|
||||
|
March 15, 2022, 2.6%
|
300
|
|
300
|
|
||||
|
June 1, 2025, 3.3%
|
600
|
|
600
|
|
||||
|
Dec. 1, 2026, 3.35%
|
500
|
|
500
|
|
||||
|
July 1, 2036, 6.5%
|
300
|
|
300
|
|
||||
|
Sept. 15, 2041, 4.8%
|
250
|
|
250
|
|
||||
|
Elimination of PSCo capital lease obligation with affiliates
|
(62
|
)
|
(64
|
)
|
||||
|
Unamortized discount
|
(2
|
)
|
(2
|
)
|
||||
|
Unamortized debt expense
|
(20
|
)
|
(23
|
)
|
||||
|
Total
|
2,816
|
|
3,061
|
|
||||
|
Less current maturities (including elimination of PSCo capital lease obligation)
|
(2
|
)
|
248
|
|
||||
|
Total Xcel Energy Inc. long-term debt
|
2,818
|
|
2,813
|
|
||||
|
Total long-term debt
|
$
|
14,520
|
|
$
|
14,195
|
|
||
|
Common Stockholders’ Equity
|
||||||||
|
Common stock — 1,000,000,000 shares authorized of $2.50 par value; 507,762,881 and
507,222,795 shares outstanding at Dec. 31, 2017 and 2016, respectively |
$
|
1,269
|
|
$
|
1,268
|
|
||
|
Additional paid in capital
|
5,898
|
|
5,881
|
|
||||
|
Retained earnings
|
4,413
|
|
3,982
|
|
||||
|
Accumulated other comprehensive loss
|
(125
|
)
|
(110
|
)
|
||||
|
Total common stockholders’ equity
|
$
|
11,455
|
|
$
|
11,021
|
|
||
|
(a)
|
Resource recovery financing.
|
See Notes to Consolidated Financial Statements
92
XCEL ENERGY INC. AND SUBSIDIARIES
Notes to Consolidated Financial Statements
|
1.
|
Summary of Significant Accounting Policies
|
Business and System of Accounts —
Xcel Energy Inc.’s utility subsidiaries are engaged in the regulated generation, purchase, transmission, distribution and sale of electricity and in the regulated purchase, transportation, distribution and sale of natural gas. Xcel Energy’s consolidated financial statements and disclosures are presented in accordance with GAAP. All of the utility subsidiaries’ underlying accounting records also conform to the FERC uniform system of accounts or to systems required by various state regulatory commissions, which are the same in all material respects.
Principles of Consolidation —
In 2017, Xcel Energy’s operations included the activity of NSP-Minnesota, NSP-Wisconsin, PSCo and SPS. These utility subsidiaries serve electric and natural gas customers in portions of Colorado, Michigan, Minnesota, New Mexico, North Dakota, South Dakota, Texas and Wisconsin. Also included in Xcel Energy’s operations are WGI, an interstate natural gas pipeline company, and WYCO, a joint venture with CIG to develop and lease natural gas pipelines, storage and compression facilities.
Xcel Energy Inc.’s nonregulated subsidiaries include Eloigne and Capital Services. Eloigne invests in rental housing projects that qualify for low-income housing tax credits. Capital Services procures equipment for construction of renewable generation facilities at other subsidiaries. Xcel Energy Inc. owns the following additional direct subsidiaries, some of which are intermediate holding companies with additional subsidiaries: Xcel Energy Wholesale Group Inc., Xcel Energy Markets Holdings Inc., Xcel Energy Ventures Inc., Xcel Energy Retail Holdings Inc., Xcel Energy Communications Group, Inc., Xcel Energy International Inc., Xcel Energy Transmission Holding Company, LLC, Nicollet Holdings Company, LLC, Nicollet Project Holdings LLC and Xcel Energy Services Inc. Xcel Energy Inc. and its subsidiaries collectively are referred to as Xcel Energy.
Xcel Energy’s consolidated financial statements include its wholly-owned subsidiaries and VIEs for which it is the primary beneficiary. In the consolidation process, all intercompany transactions and balances are eliminated. Xcel Energy uses the equity method of accounting for its investment in WYCO. Xcel Energy’s equity earnings in WYCO are included on the consolidated statements of income as equity earnings of unconsolidated subsidiaries. Xcel Energy has investments in several plants and transmission facilities jointly owned with nonaffiliated utilities. Xcel Energy’s proportionate share of jointly owned facilities is recorded as property, plant and equipment on the consolidated balance sheets, and Xcel Energy’s proportionate share of the operating costs associated with these facilities is included in its consolidated statements of income. See Note 5 for further discussion of jointly owned generation, transmission and gas facilities, and related ownership percentages.
Xcel Energy evaluates its arrangements and contracts with other entities, including investments, PPAs and fuel contracts, to determine if the other party is a VIE, if Xcel Energy has a variable interest and if Xcel Energy is the primary beneficiary. Xcel Energy follows accounting guidance for VIEs which requires consideration of the activities that most significantly impact an entity’s financial performance and power to direct those activities, when determining whether Xcel Energy is a VIE’s primary beneficiary. See Note 13 for further discussion of VIEs.
Use of Estimates —
In recording transactions and balances resulting from business operations, Xcel Energy uses estimates based on the best information available. Estimates are used for such items as plant depreciable lives or potential disallowances, AROs, certain regulatory assets and liabilities, tax provisions, uncollectible amounts, environmental costs, unbilled revenues, jurisdictional fuel and energy cost allocations and actuarially determined benefit costs. The recorded estimates are revised when better information becomes available or when actual amounts can be determined. Those revisions can affect operating results.
Regulatory Accounting —
Our regulated utility subsidiaries account for certain income and expense items in accordance with accounting guidance for regulated operations. Under this guidance:
|
•
|
Certain costs, which would otherwise be charged to expense or OCI, are deferred as regulatory assets based on the expected ability to recover the costs in future rates; and
|
|
•
|
Certain credits, which would otherwise be reflected as income or OCI, are deferred as regulatory liabilities based on the expectation the amounts will be returned to customers in future rates, or because the amounts were collected in rates prior to the costs being incurred.
|
Estimates of recovering deferred costs and returning deferred credits are based on specific ratemaking decisions or precedent for each item. Regulatory assets and liabilities are amortized consistent with the treatment in the rate setting process.
93
If restructuring or other changes in the regulatory environment occur, regulated utility subsidiaries may no longer be eligible to apply this accounting treatment, and may be required to eliminate regulatory assets and liabilities from their balance sheets. Such changes could have a material effect on Xcel Energy’s financial condition, results of operations and cash flows. See Note 15 for further discussion of regulatory assets and liabilities.
Revenue Recognition —
Revenues related to the sale of energy are generally recorded when service is rendered or energy is delivered to customers. However, the determination of the energy sales to individual customers is based on the reading of their meter, which occurs on a systematic basis throughout the month. At the end of each month, amounts of energy delivered to customers since the date of the last meter reading are estimated and the corresponding unbilled revenue is recognized. Xcel Energy presents its revenues net of any excise or other fiduciary-type taxes or fees.
NSP-Minnesota participates in MISO, and SPS participates in SPP. Xcel Energy’s utility subsidiaries recognize sales to both native load and other end use customers on a gross basis. Revenues and charges for short term wholesale sales of excess energy transacted through RTOs are recorded on a gross basis in electric revenues and cost of sales. Other revenues and charges related to participating and transacting in RTOs are recorded on a net basis in cost of sales.
Xcel Energy Inc.’s utility subsidiaries have various rate-adjustment mechanisms in place that provide for the recovery of natural gas, electric fuel and purchased energy costs. These cost-adjustment tariffs may increase or decrease the level of revenue collected from customers and are revised periodically for differences between the total amount collected under the clauses and the costs incurred. When applicable, under governing regulatory commission rate orders, fuel cost over-recoveries (the excess of fuel revenue billed to customers over fuel costs incurred) are deferred as regulatory liabilities and under-recoveries (the excess of fuel costs incurred over fuel revenues billed to customers) are deferred as regulatory assets.
Certain rate rider mechanisms qualify as alternative revenue programs under GAAP. These mechanisms arise from costs imposed upon the utility by action of a regulator or legislative body related to an environmental, public safety or other mandate. When certain criteria are met, revenue is recognized equal to the revenue requirement, including return on rate base items, for the qualified mechanisms. The mechanisms are revised periodically for differences between the total amount collected under the riders and the revenue recognized, which may increase or decrease the level of revenue collected from customers.
Conservation Programs
—
Xcel Energy Inc.’s utility subsidiaries have implemented programs in many of their retail jurisdictions to assist customers in reducing peak demand and conserving energy on the electric and natural gas systems. These programs include efficiency and redesign programs, as well as rebates for the purchase of items such as high efficiency lighting.
The costs incurred for DSM and CIP programs are deferred if it is probable future revenue will be provided to permit recovery of the incurred cost. Recorded revenues for incentive programs designed for recovery of lost margins and/or conservation performance incentives are limited to amounts expected to be collected within
24 months
from the annual period in which they are earned.
For PSCo, SPS and NSP-Minnesota, DSM and CIP program costs are recovered through a combination of base rate revenue and rider mechanisms. The revenue billed to customers recovers incurred costs for conservation programs and also incentive amounts that are designed to encourage Xcel Energy’s achievement of energy conservation goals and compensate for related lost sales margin. For these utility subsidiaries, regulatory assets are recognized to reflect the amount of costs or earned incentives that have not yet been collected from customers. NSP-Wisconsin recovers approved conservation program costs in base rate revenue.
Property, Plant and Equipment and Depreciation —
Property, plant and equipment is stated at original cost. The cost of plant includes direct labor and materials, contracted work, overhead costs and AFUDC. The cost of plant retired is charged to accumulated depreciation and amortization. Amounts recovered in rates for future removal costs are recorded as regulatory liabilities. Significant additions or improvements extending asset lives are capitalized, while repairs and maintenance costs are charged to expense as incurred. Maintenance and replacement of items determined to be less than a unit of property are charged to operating expenses as incurred. Planned major maintenance activities are charged to operating expense unless the cost represents the acquisition of an additional unit of property or the replacement of an existing unit of property. Property, plant and equipment also includes costs associated with property held for future use. The depreciable lives of certain plant assets are reviewed annually and revised, if appropriate.
94
Property, plant and equipment is tested for impairment when it is determined that the carrying value of the assets may not be recoverable. A loss is recognized in the current period if it becomes probable that part of a cost of a plant under construction or recently completed plant will be disallowed for recovery from customers and a reasonable estimate of the disallowance can be made. See Note 12 for a discussion of the loss recognized in 2015 related to the Monticello LCM/EPU project. For investments in property, plant and equipment that are abandoned and not expected to go into service, incurred costs and related deferred tax amounts are compared to the discounted estimated future rate recovery, and a loss is recognized, if necessary.
Xcel Energy records depreciation expense related to its plant using the straight-line method over the plant’s useful life. Actuarial life studies are performed and submitted to the state and federal commissions for review. Upon acceptance by the various commissions, the resulting lives and net salvage rates are used to calculate depreciation. Depreciation expense, expressed as a percentage of average depreciable property, was approximately
3.1
,
2.9
, and
2.8
percent for the years ended Dec. 31, 2017, 2016 and 2015, respectively.
Leases
— Xcel Energy evaluates a variety of contracts for lease classification at inception, including PPAs and rental arrangements for office space, vehicles and equipment. Contracts determined to contain a lease because of per unit pricing that is other than fixed or market price, terms regarding the use of a particular asset, and other factors are evaluated further to determine if the arrangement is a capital lease. See Note 13 for further discussion of leases.
AFUDC —
AFUDC represents the cost of capital used to finance utility construction activity. AFUDC is computed by applying a composite financing rate to qualified CWIP. The amount of AFUDC capitalized as a utility construction cost is credited to other nonoperating income (for equity capital) and interest charges (for debt capital). AFUDC amounts capitalized are included in Xcel Energy’s rate base for establishing utility service rates.
Generally, AFUDC costs are recovered from customers as the related property is depreciated. However, in some cases commissions have approved a more current recovery of the cost of capital associated with large capital projects, resulting in a lower recognition of AFUDC. In other cases, some commissions have allowed an AFUDC calculation greater than the FERC-defined AFUDC rate, resulting in higher recognition of AFUDC.
AROs
—
Xcel Energy Inc.’s utility subsidiaries account for AROs under accounting guidance that requires a liability for the fair value of an ARO to be recognized in the period in which it is incurred if it can be reasonably estimated, with the offsetting associated asset retirement costs capitalized as a long-lived asset. The liability is generally increased over time by applying the effective interest method of accretion, and the capitalized costs are depreciated over the useful life of the long-lived asset. Changes resulting from revisions to the timing or amount of expected asset retirement cash flows are recognized as an increase or a decrease in the ARO. Xcel Energy Inc.’s utility subsidiaries also recover through rates certain future plant removal costs in addition to AROs. The accumulated removal costs for these obligations are reflected in the balance sheets as a regulatory liability. See Note 13 for further discussion of AROs.
Nuclear Decommissioning —
Nuclear decommissioning studies estimate NSP-Minnesota’s ultimate costs of decommissioning its nuclear power plants and are performed at least every
three years
and submitted to the MPUC and other state commissions for approval. NSP-Minnesota’s most recent triennial nuclear decommissioning studies were filed with the MPUC in December 2017. These studies reflect NSP-Minnesota’s plans for dismantlement of the Monticello and PI facilities. These studies assume that NSP-Minnesota will store spent fuel on site pending removal to a U.S. government facility.
For rate making purposes, NSP-Minnesota recovers the total decommissioning costs related to its nuclear power plants over each facility’s expected service life based on the triennial decommissioning studies filed with the MPUC and other state commissions. The studies consider estimated future costs of decommissioning and the market value of investments in trust funds, and recommend annual funding amounts. Amounts collected in rates are deposited in the trust funds. See Note 14 for further discussion of the approved nuclear decommissioning studies and funded amounts. For financial reporting purposes, NSP-Minnesota accounts for nuclear decommissioning as an ARO as described above.
Restricted funds for the payment of future decommissioning expenditures for NSP-Minnesota’s nuclear facilities are included in nuclear decommissioning fund and other assets on the consolidated balance sheets. See Note 11 for further discussion of the nuclear decommissioning fund.
Nuclear Fuel Expense —
Nuclear fuel expense, which is recorded as NSP-Minnesota’s nuclear generating plants use fuel, includes the cost of fuel used in the current period (including AFUDC) and costs associated with the end-of-life fuel segments.
95
Nuclear Refueling Outage Costs
—
Xcel Energy uses a deferral and amortization method for nuclear refueling O&M costs. This method amortizes refueling outage costs over the period between refueling outages consistent with how the costs are recovered ratably in electric rates.
Income Taxes —
Xcel Energy accounts for income taxes using the asset and liability method, which requires the recognition of deferred tax assets and liabilities for the expected future tax consequences of events that have been included in the financial statements. Xcel Energy defers income taxes for all temporary differences between pretax financial and taxable income, and between the book and tax bases of assets and liabilities. Xcel Energy uses the tax rates that are scheduled to be in effect when the temporary differences are expected to reverse. The effect of a change in tax rates on deferred tax assets and liabilities is recognized in the period that includes the enactment date.
The effects of tax rate changes that are attributable to the regulated utility subsidiaries are generally subject to a normalization method of accounting. Therefore, the revaluation of most of the utility subsidiaries’ net deferred taxes upon a tax rate reduction results in the establishment of a net regulatory liability which will be refundable to utility customers over the remaining life of the related assets. A tax rate increase would result in the establishment of a similar regulatory asset. Due to the effects of past regulatory practices, when deferred taxes were not required to be recorded due to the use of flow through accounting for ratemaking purposes, the reversal of some temporary differences are accounted for as current income tax expense. Tax credits are recorded when earned unless there is a requirement to defer the benefit and amortize it over the book depreciable lives of the related property. The requirement to defer and amortize tax credits only applies to federal ITCs related to public utility property. Utility rate regulation also has resulted in the recognition of certain regulatory assets and liabilities related to income taxes, which are summarized in Note 15.
Deferred tax assets are reduced by a valuation allowance if it is more likely than not that some portion or all of the deferred tax asset will not be realized. In making such a determination, all available evidence is considered, including scheduled reversals of deferred tax liabilities, projected future taxable income, tax planning strategies and recent financial operations.
Xcel Energy follows the applicable accounting guidance to measure and disclose uncertain tax positions that it has taken or expects to take in its income tax returns. Xcel Energy recognizes a tax position in its consolidated financial statements when it is more likely than not that the position will be sustained upon examination based on the technical merits of the position. Recognition of changes in uncertain tax positions are reflected as a component of income tax.
Xcel Energy reports interest and penalties related to income taxes within the other income and interest charges sections in the consolidated statements of income.
Xcel Energy Inc. and its subsidiaries file consolidated federal income tax returns as well as combined or separate state income tax returns. Federal income taxes paid by Xcel Energy Inc. are allocated to Xcel Energy Inc.’s subsidiaries based on separate company computations of tax. A similar allocation is made for state income taxes paid by Xcel Energy Inc. in connection with combined state filings. Xcel Energy Inc. also allocates its own income tax benefits to its direct subsidiaries based on the relative positive tax liabilities of the subsidiaries.
See Note 6 for further discussion of income taxes.
Types of and Accounting for Derivative Instruments —
Xcel Energy uses derivative instruments in connection with its interest rate, utility commodity price, vehicle fuel price and commodity trading activities, including forward contracts, futures, swaps and options. All derivative instruments not designated and qualifying for the normal purchases and normal sales exception, as defined by the accounting guidance for derivatives and hedging, are recorded on the consolidated balance sheets at fair value as derivative instruments. This includes certain instruments used to mitigate market risk for the utility operations including transmission in organized markets and all instruments related to the commodity trading operations. The classification of changes in fair value for those derivative instruments is dependent on the designation of a qualifying hedging relationship. Changes in fair value of derivative instruments not designated in a qualifying hedging relationship are reflected in current earnings or as a regulatory asset or liability. The classification as a regulatory asset or liability is based on commission approved regulatory recovery mechanisms.
Gains or losses on commodity trading transactions are recorded as a component of electric operating revenues; hedging transactions for vehicle fuel costs are recorded as a component of capital projects and O&M costs; and interest rate hedging transactions are recorded as a component of interest expense. Certain utility subsidiaries are allowed to recover in electric or natural gas rates the costs of certain financial instruments purchased to reduce commodity cost volatility. For further information on derivatives entered to mitigate commodity price risk on behalf of electric and natural gas customers, see Note 11.
96
Cash Flow Hedges
— Certain qualifying hedging relationships are designated as a hedge of a forecasted transaction, or future cash flow (cash flow hedge). Changes in the fair value of a derivative designated as a cash flow hedge, to the extent effective, are included in OCI or deferred as a regulatory asset or liability based on recovery mechanisms until earnings are affected by the hedged transaction.
Normal Purchases and Normal Sales
— Xcel Energy enters into contracts for the purchase and sale of commodities for use in its business operations. Derivatives and hedging accounting guidance requires a company to evaluate these contracts to determine whether the contracts are derivatives. Certain contracts that meet the definition of a derivative may be exempted from derivative accounting if designated as normal purchases or normal sales.
Xcel Energy evaluates all of its contracts at inception to determine if they are derivatives and if they meet the normal purchases and normal sales designation requirements. None of the contracts entered into within the commodity trading operations qualify for a normal purchases and normal sales designation.
See Note 11 for further discussion of Xcel Energy’s risk management and derivative activities.
Commodity Trading Operations —
All applicable gains and losses related to commodity trading activities, whether or not settled physically, are shown on a net basis in electric operating revenues in the consolidated statements of income.
Xcel Energy’s commodity trading operations are primarily conducted by NSP-Minnesota and PSCo. Commodity trading activities are not associated with energy produced from Xcel Energy’s generation assets or energy and capacity purchased to serve native load. Commodity trading contracts are recorded at fair market value and commodity trading results include the impact of all margin-sharing mechanisms. See Note 11 for further discussion.
Fair Value Measurements
— Xcel Energy presents cash equivalents, interest rate derivatives, commodity derivatives and nuclear decommissioning fund assets at estimated fair values in its consolidated financial statements. Cash equivalents are recorded at cost plus accrued interest; money market funds are measured using quoted NAVs. For interest rate derivatives, quoted prices based primarily on observable market interest rate curves are used as a primary input to establish fair value. For commodity derivatives, the most observable inputs available are generally used to determine the fair value of each contract. In the absence of a quoted price for an identical contract in an active market, Xcel Energy may use quoted prices for similar contracts or internally prepared valuation models to determine fair value. For the pension and postretirement plan assets and the nuclear decommissioning fund, published trading data and pricing models, generally using the most observable inputs available, are utilized to estimate fair value for each security. See Notes 9 and 11 for further discussion.
Cash and Cash Equivalents —
Xcel Energy considers investments in certain instruments, including commercial paper and money market funds, with a remaining maturity of
three months
or less at the time of purchase, to be cash equivalents.
Accounts Receivable and Allowance for Bad Debts —
Accounts receivable are stated at the actual billed amount net of an allowance for bad debts. Xcel Energy establishes an allowance for uncollectible receivables based on a policy that reflects its expected exposure to the credit risk of customers.
Inventory —
All inventory is recorded at average cost.
RECs —
RECs are marketable environmental instruments that represent proof that energy was generated from eligible renewable energy sources. RECs are awarded upon delivery of the associated energy and can be bought and sold. RECs are typically used as a form of measurement of compliance to RPS enacted by those states that are encouraging construction and consumption from renewable energy sources, but can also be sold separately from the energy produced. Utility subsidiaries acquire RECs from the generation or purchase of renewable power.
When RECs are purchased or acquired in the course of generation they are recorded as inventory at cost. The cost of RECs that are utilized for compliance purposes is recorded as electric fuel and purchased power expense. In certain jurisdictions, as a result of state regulatory orders, Xcel Energy reduces recoverable fuel costs for the cost of certain RECs and records that cost as a regulatory asset when the amount is recoverable in future rates.
97
Sales of RECs that are purchased or acquired in the course of generation are recorded in electric utility operating revenues on a gross basis. The cost of these RECs, related transaction costs, and amounts credited to customers under margin-sharing mechanisms are recorded in electric fuel and purchased power expense.
Emission Allowances —
Emission allowances, including the annual SO
2
and NOx emission allowance entitlement received from the EPA, are recorded at cost plus associated broker commission fees. Xcel Energy follows the inventory accounting model for all emission allowances. Sales of emission allowances are included in electric utility operating revenue and the operating activities section of the consolidated statements of cash flows.
Environmental Costs —
Environmental costs are recorded when it is probable Xcel Energy is liable for remediation costs and the liability can be reasonably estimated. Costs are deferred as a regulatory asset if it is probable that the costs will be recovered from customers in future rates. Otherwise, the costs are expensed. If an environmental expense is related to facilities currently in use, such as emission-control equipment, the cost is capitalized and depreciated over the life of the plant.
Estimated remediation costs, excluding inflationary increases, are recorded based on experience, an assessment of the current situation and the technology currently available for use in the remediation. The recorded costs are regularly adjusted as estimates are revised and remediation proceeds. If other participating PRPs exist and acknowledge their potential involvement with a site, costs are estimated and recorded only for Xcel Energy’s expected share of the cost.
Any future costs of restoring sites where operation may extend indefinitely are treated as a capitalized cost of plant retirement. The depreciation expense levels recoverable in rates include a provision for removal expenses, which may include final remediation costs. Removal costs recovered in rates before the related costs are incurred are classified as a regulatory liability.
See Note 13 for further discussion of environmental costs.
Benefit Plans and Other Postretirement Benefits
— Xcel Energy maintains pension and postretirement benefit plans for eligible employees. Recognizing the cost of providing benefits and measuring the projected benefit obligation of these plans under applicable accounting guidance requires management to make various assumptions and estimates.
Based on the regulatory recovery mechanisms of Xcel Energy Inc.’s utility subsidiaries, certain unrecognized actuarial gains and losses and unrecognized prior service costs or credits are recorded as regulatory assets and liabilities, rather than OCI.
See Note 9 for further discussion of benefit plans and other postretirement benefits.
Guarantees —
Xcel Energy recognizes, upon issuance or modification of a guarantee, a liability for the fair market value of the obligation that has been assumed in issuing the guarantee. This liability includes consideration of specific triggering events and other conditions which may modify the ongoing obligation to perform under the guarantee.
The obligation recognized is reduced over the term of the guarantee as Xcel Energy is released from risk under the guarantee. See Note 13 for specific details of issued guarantees.
Subsequent Events
—
Management has evaluated the impact of events occurring after
Dec. 31, 2017
up to the date of issuance of these consolidated financial statements. These statements contain all necessary adjustments and disclosures resulting from that evaluation.
2. Accounting Pronouncements
Recently Issued
Revenue Recognition
—
In May 2014, the FASB issued
Revenue from Contracts with Customers, Topic 606 (ASU No. 2014-09)
, which provides a new framework for the recognition of revenue. As the appropriate timing of recognition of revenue from contracts with customers in our regulated operations continues to generally be based on the delivery of electricity and natural gas, Xcel Energy’s adoption will primarily result in increased disclosures regarding sources of revenues, including alternative revenue programs. The guidance is effective for interim and annual periods beginning after Dec. 15, 2017. Xcel Energy is implementing the standard on a modified retrospective basis, which requires application to contracts with customers effective Jan. 1, 2018.
98
Classification and Measurement of Financial Instruments —
In January 2016, the FASB issued
Recognition and Measurement of Financial Assets and Financial Liabilities, Subtopic 825-10 (ASU No. 2016-01)
, which eliminates the available-for-sale classification for marketable equity securities and also replaces the cost method of accounting for non-marketable equity securities with a model for recognizing impairments and observable price changes. Under the new standard, other than when the consolidation or equity method of accounting is utilized, changes in the fair value of equity securities are to be recognized in earnings. This guidance is effective for interim and annual reporting periods beginning after Dec. 15, 2017. As a result of application of accounting principles for rate regulated entities, changes in the fair value of the securities in the nuclear decommissioning fund, historically classified as available-for-sale, will continue to be deferred to a regulatory asset, and the overall impacts of the Jan. 1, 2018 adoption will not be material.
Leases —
I
n February 2016, the FASB issued
Leases, Topic 842 (ASU No. 2016-02)
, which for lessees requires balance sheet recognition of right-of-use assets and lease liabilities for most leases. This guidance will be effective for interim and annual reporting periods beginning after Dec. 15, 2018. Xcel Energy has not yet fully determined the impacts of implementation. However, adoption is expected to occur on Jan. 1, 2019 utilizing the practical expedients provided by the standard and proposed in
Targeted Improvements, Topic 842
(Proposed ASU 2018-200). As such, agreements entered prior to Jan. 1, 2019 that are currently considered leases are expected to be recognized on the consolidated balance sheet, including contracts for use of office space, equipment and natural gas storage assets, as well as certain purchased power agreements (PPAs) for natural gas-fueled generating facilities. Xcel Energy expects that similar agreements entered after Dec. 31, 2018 will generally qualify as leases under the new standard.
Presentation of Net Periodic Benefit Cost —
I
n March 2017, the FASB issued
Improving the Presentation of Net Periodic Pension Cost and Net Periodic Postretirement Benefit Cost, Topic 715 (ASU No. 2017-07)
, which establishes that only the service cost element of pension cost may be presented as a component of operating income in the income statement. Also under the guidance, only the service cost component of pension cost is eligible for capitalization. As a result of application of accounting principles for rate regulated entities, a similar amount of pension cost, including non-service components, will be recognized consistent with the historical ratemaking treatment and the impacts of adoption will be limited to changes in classification of non-service costs in the consolidated statement of income. This guidance is effective for interim and annual reporting periods beginning after Dec. 15, 2017.
Recently Adopted
Stock Compensation —
In March 2016, the FASB issued
Improvements to Employee Share-Based Payment Accounting, Topic 718 (ASU No. 2016-09),
which simplifies accounting and financial statement presentation for share-based payment transactions. The guidance requires that the difference between the tax deduction available upon settlement of share-based equity awards and the tax benefit accumulated over the vesting period be recognized as an adjustment to income tax expense. Xcel Energy adopted the guidance in 2016, resulting in immaterial 2016 adjustments to income tax expense and changes in classification of cash flows related to tax withholding in the consolidated statements of cash flows for 2016 and prior presented periods.
Accounting for the TCJA
—
In December 2017, the SEC staff issued Staff Accounting Bulletin No. 118
Income Tax Accounting Implications of the Tax Cuts and Jobs Act
(SAB 118), to supplement the accounting requirements of ASC Topic 740
Income Taxes
(ASC Topic 740) as it relates to assessing and recognizing the impacts of the TCJA in the period of enactment. SAB 118 allows an entity to recognize provisional amounts in its financial statements in circumstances in which the entity’s assessment is incomplete, but for which a reasonable estimate can be made. Provisional amounts recognized are subject to adjustment for up to one year from the enactment date. For further details, see Note 6 to the consolidated financial statements.
Reporting Comprehensive Income —
In February 2018, the FASB issued
Reclassification of Certain Tax Effects from Accumulated Other Comprehensive Income, Topic 220 (ASU No. 2018-02),
which addresses the stranded amounts of accumulated OCI which may result from enactment of a new tax law. Though accumulated OCI is presented on a net-of-tax basis, ASC Topic 740 requires that the effects of new tax laws on items in accumulated OCI be recognized without a corresponding adjustment to accumulated OCI, and instead recorded to income tax expense. ASU No. 2018-02 permits stranded amounts of accumulated OCI specifically resulting from the TCJA to be removed from accumulated OCI and reclassified to retained earnings, if elected. Xcel Energy adopted the guidance in the fourth quarter of 2017, and elected to recognize a
$22 million
increase to accumulated other comprehensive loss and retained earnings in the consolidated financial statements for the year ended Dec. 31, 2017, related to a revaluation of deferred income tax assets and liabilities for items in accumulated other comprehensive loss, at the TCJA federal tax rate.
99
|
3.
|
Selected Balance Sheet Data
|
|
(Millions of Dollars)
|
Dec. 31, 2017
|
Dec. 31, 2016
|
||||||
|
Accounts receivable, net
|
||||||||
|
Accounts receivable
|
$
|
849
|
|
$
|
827
|
|
||
|
Less allowance for bad debts
|
(52
|
)
|
(51
|
)
|
||||
|
$
|
797
|
|
$
|
776
|
|
|||
|
(Millions of Dollars)
|
Dec. 31, 2017
|
Dec. 31, 2016
|
||||||
|
Inventories
|
||||||||
|
Materials and supplies
|
$
|
311
|
|
$
|
312
|
|
||
|
Fuel
|
186
|
|
182
|
|
||||
|
Natural gas
|
113
|
|
110
|
|
||||
|
$
|
610
|
|
$
|
604
|
|
|||
|
(Millions of Dollars)
|
Dec. 31, 2017
|
Dec. 31, 2016
|
||||||
|
Property, plant and equipment, net
|
||||||||
|
Electric plant
|
$
|
39,016
|
|
$
|
38,221
|
|
||
|
Natural gas plant
|
5,800
|
|
5,318
|
|
||||
|
Common and other property
|
2,013
|
|
1,888
|
|
||||
|
Plant to be retired
(a)
|
11
|
|
32
|
|
||||
|
CWIP
|
2,087
|
|
1,373
|
|
||||
|
Total property, plant and equipment
|
48,927
|
|
46,832
|
|
||||
|
Less accumulated depreciation
|
(15,000
|
)
|
(14,381
|
)
|
||||
|
Nuclear fuel
|
2,697
|
|
2,572
|
|
||||
|
Less accumulated amortization
|
(2,295
|
)
|
(2,181
|
)
|
||||
|
$
|
34,329
|
|
$
|
32,842
|
|
|||
|
(a)
|
In the third quarter of 2017, PSCo early retired Valmont Unit 5 and converted Cherokee Unit 4 from a coal-fueled generating facility to natural gas. PSCo also expects Craig Unit 1 to be early retired in approximately 2025. Amounts are presented net of accumulated depreciation.
|
|
4.
|
Borrowings and Other Financing Instruments
|
Short-Term Borrowings
Money Pool
—
Xcel Energy Inc. and its utility subsidiaries have established a money pool arrangement that allows for short-term investments in and borrowings between the utility subsidiaries. NSP-Wisconsin does not participate in the money pool. Xcel Energy Inc. may make investments in the utility subsidiaries at market-based interest rates; however, the money pool arrangement does not allow the utility subsidiaries to make investments in Xcel Energy Inc. The money pool balances are eliminated in consolidation.
Short-Term Debt —
Xcel Energy Inc. and its utility subsidiaries meet their short-term liquidity requirements primarily through the issuance of commercial paper and borrowings under their credit facilities and term loan. Commercial paper and term loan borrowings outstanding for Xcel Energy were as follows:
|
(Amounts in Millions, Except Interest Rates)
|
Three Months Ended Dec. 31, 2017
|
|||
|
Borrowing limit
|
$
|
3,250
|
|
|
|
Amount outstanding at period end
|
814
|
|
||
|
Average amount outstanding
|
560
|
|
||
|
Maximum amount outstanding
|
814
|
|
||
|
Weighted average interest rate, computed on a daily basis
|
1.63
|
%
|
||
|
Weighted average interest rate at period end
|
1.90
|
|
||
100
|
Year Ended Dec. 31
|
||||||||||||
|
(Amounts in Millions, Except Interest Rates)
|
2017
|
2016
|
2015
|
|||||||||
|
Borrowing limit
|
$
|
3,250
|
|
$
|
2,750
|
|
$
|
2,750
|
|
|||
|
Amount outstanding at period end
|
814
|
|
392
|
|
846
|
|
||||||
|
Average amount outstanding
|
644
|
|
485
|
|
601
|
|
||||||
|
Maximum amount outstanding
|
1,247
|
|
1,183
|
|
1,360
|
|
||||||
|
Weighted average interest rate, computed on a daily basis
|
1.35
|
%
|
0.74
|
%
|
0.48
|
%
|
||||||
|
Weighted average interest rate at end of period
|
1.90
|
|
0.95
|
|
0.82
|
|
||||||
Letters of Credit
— Xcel Energy Inc. and its subsidiaries use letters of credit, generally with terms of
one year
, to provide financial guarantees for certain operating obligations. As of Dec. 31,
2017
and
2016
, there were
$30 million
and
$19 million
of letters of credit outstanding, respectively, under the credit facilities. The contract amounts of these letters of credit approximate their fair value and are subject to fees.
Credit Facilities —
In order to use their commercial paper programs to fulfill short-term funding needs, Xcel Energy Inc. and its utility subsidiaries must have revolving credit facilities in place at least equal to the amount of their respective commercial paper borrowing limits and cannot issue commercial paper in an aggregate amount exceeding available capacity under these credit facilities. The lines of credit provide short-term financing in the form of notes payable to banks, letters of credit and back-up support for commercial paper borrowings.
NSP-Minnesota, PSCo, SPS, and Xcel Energy Inc. each have the right to request an extension of the
June 2021
termination date for
two
additional
one
-year periods. NSP-Wisconsin has the right to request an extension of the termination date for an additional
one
-year period. All extension requests are subject to majority bank group approval.
Other features of the credit facilities include:
|
•
|
Xcel Energy Inc. may increase its credit facility by up to
$200 million
, NSP-Minnesota and PSCo may each increase their credit facilities by
$100 million
and SPS may increase its credit facility by
$50 million
. The NSP-Wisconsin credit facility cannot be increased.
|
|
•
|
Each credit facility has a financial covenant requiring that the debt-to-total capitalization ratio of each entity be less than or equal to
65 percent
. Each entity was in compliance as of Dec. 31,
2017
and
2016
, respectively, as evidenced by the table below:
|
|
Debt-to-Total Capitalization Ratio
|
||||||
|
2017
|
2016
|
|||||
|
Xcel Energy Inc.
|
58
|
%
|
57
|
%
|
||
|
NSP-Wisconsin
|
47
|
|
47
|
|
||
|
NSP-Minnesota
|
48
|
|
48
|
|
||
|
SPS
|
46
|
|
47
|
|
||
|
PSCo
|
44
|
|
45
|
|
||
|
•
|
If Xcel Energy Inc. or any of its utility subsidiaries do not comply with the covenant, an event of default may be declared, and if not remedied, any outstanding amounts due under the facility can be declared due by the lender.
|
|
•
|
The Xcel Energy Inc. credit facility has a cross-default provision that provides Xcel Energy Inc. will be in default on its borrowings under the facility if it or any of its subsidiaries, except NSP-Wisconsin as long as its total assets do not comprise more than
15 percent
of Xcel Energy’s consolidated total assets, default on certain indebtedness in an aggregate principal amount exceeding
$75 million
.
|
|
•
|
Xcel Energy Inc. and its subsidiaries were in compliance with all financial covenants in their debt agreements as of Dec. 31, 2017 and 2016.
|
Xcel Energy Inc. entered into a
364
-day term loan agreement on Dec. 5, 2017 to borrow up to
$500 million
. As of Dec. 31, 2017, Xcel Energy Inc. had borrowed
$250 million
of the Term Loan. Xcel Energy Inc. may recommit for
one
additional
364
-day period from the
December 2018
maturity date, subject to majority consent from lenders.
101
As of Dec. 31,
2017
, Xcel Energy Inc. and its utility subsidiaries had the following committed credit facilities available:
|
(Millions of Dollars)
|
Credit Facility
(a)
|
Drawn
(b)
|
Available
|
|||||||||
|
Xcel Energy Inc.
|
$
|
1,500
|
|
$
|
783
|
|
$
|
717
|
|
|||
|
PSCo
|
700
|
|
3
|
|
697
|
|
||||||
|
NSP-Minnesota
|
500
|
|
44
|
|
456
|
|
||||||
|
SPS
|
400
|
|
2
|
|
398
|
|
||||||
|
NSP-Wisconsin
|
150
|
|
11
|
|
139
|
|
||||||
|
Total
|
$
|
3,250
|
|
$
|
843
|
|
$
|
2,407
|
|
|||
|
(a)
|
These credit facilities mature in
June 2021
, with the exception of Xcel Energy Inc.’s
$500 million
364
-day term loan agreement entered into in December 2017.
|
|
(b)
|
Includes outstanding commercial paper, term loan borrowings and letters of credit.
|
All credit facility bank borrowings, outstanding letters of credit, term loan borrowings and outstanding commercial paper reduce the available capacity under the respective credit facilities. Xcel Energy Inc. and its subsidiaries had
no
direct advances on the credit facilities outstanding as of Dec. 31,
2017
and
2016
.
Long-Term Borrowings and Other Financing Instruments
Generally, all real and personal property of NSP-Minnesota, NSP-Wisconsin, PSCo and SPS are subject to the liens of their first mortgage indentures. Debt premiums, discounts and expenses are amortized over the life of the related debt. The premiums, discounts and expenses associated with refinanced debt are deferred and amortized over the life of the related new issuance, in accordance with regulatory guidelines.
Maturities of long-term debt are as follows:
|
(Millions of Dollars)
|
||||
|
2018
|
$
|
457
|
|
|
|
2019
|
405
|
|
||
|
2020
|
1,256
|
|
||
|
2021
|
425
|
|
||
|
2022
|
905
|
|
||
During 2017, Xcel Energy Inc. and its utility subsidiaries completed the following financings:
|
•
|
PSCo issued
$400 million
of
3.80 percent
first mortgage bonds due
June 15, 2047
;
|
|
•
|
SPS issued
$450 million
of
3.70 percent
first mortgage bonds due
Aug. 15, 2047
;
|
|
•
|
NSP-Minnesota issued
$600 million
of
3.60 percent
first mortgage bonds due
Sept. 15, 2017
;
|
|
•
|
NSP-Wisconsin issued
$100 million
of
3.75 percent
first mortgage bonds due
Dec. 1, 2047
; and
|
|
•
|
Xcel Energy Inc. entered into a
$500 million
364
-Day Term Loan Agreement.
|
During 2016, Xcel Energy Inc. and its utility subsidiaries completed the following financings:
|
•
|
Xcel Energy Inc. issued
$400 million
of
2.40 percent
senior notes due
March 15, 2021
and
$350 million
of
3.30 percent
senior notes due
June 1, 2025
;
|
|
•
|
NSP-Minnesota issued
$350 million
of
3.60 percent
first mortgage bonds due
May 15, 2046
;
|
|
•
|
PSCo issued
$250 million
of
3.55 percent
first mortgage bonds due
June 15, 2046
;
|
|
•
|
SPS issued
$300 million
of
3.40 percent
first mortgage bonds due
Aug. 15, 2046
; and
|
|
•
|
Xcel Energy Inc. issued
$300 million
of
2.60 percent
senior notes due
March 15, 2022
and
$500 million
of
3.35 percent
senior notes due
Dec. 1, 2026
.
|
Deferred Financing Costs —
Deferred financing costs of approximately
$119 million
and
$109 million
, net of amortization, are presented as a deduction from the carrying amount of long-term debt as of Dec. 31,
2017
and
2016
, respectively. Xcel Energy is amortizing these financing costs over the remaining maturity periods of the related debt.
102
Capital Stock —
Xcel Energy Inc. has
7,000,000
shares of preferred stock authorized to be issued with a
$100
par value. As of Dec. 31,
2017
and
2016
, there were
no
shares of preferred stock outstanding.
The charters of PSCo and SPS authorize each subsidiary to issue
10,000,000
shares of preferred stock with par values of
$0.01
and
$1.00
per share, respectively. As of Dec. 31,
2017
and
2016
, there were
no
preferred shares of subsidiaries outstanding.
Xcel Energy Inc. has
1 billion
shares of common stock authorized to be issued with a
$2.50
par value. Outstanding shares as of Dec. 31,
2017
and
2016
were
507,762,881
and
507,222,795
, respectively.
Dividend and Other Capital-Related Restrictions —
Xcel Energy depends on its subsidiaries to pay dividends. All of Xcel Energy Inc.’s utility subsidiaries’ dividends are subject to the FERC’s jurisdiction, which prohibits the payment of dividends out of capital accounts; payment of dividends is allowed out of retained earnings only. Due to certain restrictive covenants, Xcel Energy Inc. is required to be current on particular interest payments before dividends can be paid.
The most restrictive dividend limitations for NSP-Minnesota, NSP-Wisconsin and SPS are imposed by their respective state regulatory commission. PSCo’s dividends are subject to the FERC’s jurisdiction.
Only NSP-Minnesota has a first mortgage indenture which places certain restrictions on the amount of cash dividends it can pay to Xcel Energy Inc., the holder of its common stock. Even with this restriction, NSP-Minnesota could have paid more than
$1.9 billion
and
$1.7 billion
in additional cash dividends to Xcel Energy Inc. as of Dec. 31,
2017
and
2016
, respectively.
NSP-Minnesota’s state regulatory commissions indirectly limit the amount of dividends NSP-Minnesota can pay by requiring an equity-to-total capitalization ratio between
47.2 percent
and
57.6 percent
. NSP-Minnesota’s equity-to-total capitalization ratio was
52.1 percent
at Dec. 31,
2017
and
$1.1 billion
in retained earnings was not restricted. Total capitalization for NSP-Minnesota was
$10.4 billion
at Dec. 31,
2017
, which did not exceed the limit of
$11.2 billion
.
NSP-Wisconsin cannot pay annual dividends in excess of approximately
$53 million
if its calendar year average equity-to-total capitalization ratio is or falls below the state commission authorized level as calculated by PSCW requirements. NSP-Wisconsin’s calendar year average equity ratio calculated on this basis was
53.1 percent
as of Dec. 31,
2017
and
$19 million
in retained earnings was not restricted. NSP-Wisconsin’s authorized equity ratio was
52.5 percent
for 2016 and 2017, but will be
51.5 percent
for 2018.
SPS’ state regulatory commissions indirectly limit the amount of dividends that SPS can pay Xcel Energy Inc. by requiring an equity-to-total capitalization ratio (excluding short-term debt) between
45.0 percent
and
55.0 percent
. In addition, SPS may not pay a dividend that would cause it to lose its investment grade bond rating. SPS’ equity ratio (excluding short-term debt) was
53.8 percent
as of Dec. 31,
2017
and
$542 million
in retained earnings was not restricted.
The issuance of securities by Xcel Energy Inc. generally is not subject to regulatory approval. However, utility financings and certain intra-system financings are subject to the jurisdiction of the applicable state regulatory commissions and/or the FERC. As of Dec. 31,
2017
:
|
•
|
PSCo has authorization to issue up to an additional
$1.8 billion
of long-term debt and up to
$800 million
of short-term debt.
|
|
•
|
SPS has authorization to issue up to
$500 million
of short-term debt and SPS will file for additional long-term debt authorization.
|
|
•
|
NSP-Wisconsin has authorization to issue an additional
$250 million
of long-term debt and up to
$150 million
of short-term debt.
|
|
•
|
NSP-Minnesota has authorization to issue long-term securities provided the equity-to-total capitalization ratio remains between
47.2 percent
and
57.6 percent
and to issue short-term debt provided it does not exceed
15 percent
of total capitalization. Total capitalization for NSP-Minnesota cannot exceed
$11.2 billion
.
|
Xcel Energy believes these authorizations are adequate and seeks additional authorization as necessary.
103
|
5.
|
Joint Ownership of Generation, Transmission and Gas Facilities
|
Following are the investments by Xcel Energy Inc.’s utility subsidiaries in jointly owned generation, transmission and gas facilities and the related ownership percentages as of Dec. 31,
2017
:
|
(Millions of Dollars)
|
Plant in
Service
|
Accumulated
Depreciation
|
CWIP
|
Ownership %
|
|||||||||||
|
NSP-Minnesota
|
|||||||||||||||
|
Electric Generation:
|
|||||||||||||||
|
Sherco Unit 3
|
$
|
612
|
|
$
|
411
|
|
$
|
1
|
|
59
|
%
|
||||
|
Sherco Common Facilities Units 1, 2 and 3
|
145
|
|
99
|
|
1
|
|
80
|
|
|||||||
|
Sherco Substation
|
5
|
|
3
|
|
—
|
|
59
|
|
|||||||
|
Electric Transmission:
|
|||||||||||||||
|
Grand Meadow Line and Substation
|
11
|
|
2
|
|
—
|
|
50
|
|
|||||||
|
CapX2020 Transmission
|
1,039
|
|
138
|
|
2
|
|
51
|
|
|||||||
|
Total NSP-Minnesota
|
$
|
1,812
|
|
$
|
653
|
|
$
|
4
|
|
||||||
|
(Millions of Dollars)
|
Plant in
Service
|
Accumulated
Depreciation
|
CWIP
|
Ownership %
|
|||||||||||
|
NSP-Wisconsin
|
|||||||||||||||
|
Electric Transmission:
|
|||||||||||||||
|
CapX2020 Transmission
|
$
|
162
|
|
$
|
12
|
|
$
|
103
|
|
81
|
%
|
||||
|
La Crosse, Wis. to Madison, Wis.
|
—
|
|
—
|
|
102
|
|
37
|
|
|||||||
|
Total NSP-Wisconsin
|
$
|
162
|
|
$
|
12
|
|
$
|
205
|
|
||||||
|
(Millions of Dollars)
|
Plant in
Service
|
Accumulated
Depreciation
|
CWIP
|
Ownership %
|
|||||||||||
|
PSCo
|
|||||||||||||||
|
Electric Generation:
|
|||||||||||||||
|
Hayden Unit 1
|
$
|
150
|
|
$
|
72
|
|
$
|
1
|
|
76
|
%
|
||||
|
Hayden Unit 2
|
149
|
|
65
|
|
—
|
|
37
|
|
|||||||
|
Hayden Common Facilities
|
39
|
|
20
|
|
—
|
|
53
|
|
|||||||
|
Craig Units 1 and 2
|
81
|
|
39
|
|
—
|
|
10
|
|
|||||||
|
Craig Common Facilities 1, 2 and 3
|
39
|
|
20
|
|
—
|
|
7
|
|
|||||||
|
Comanche Unit 3
|
890
|
|
118
|
|
—
|
|
67
|
|
|||||||
|
Comanche Common Facilities
|
24
|
|
2
|
|
3
|
|
82
|
|
|||||||
|
Electric Transmission:
|
|||||||||||||||
|
Transmission and other facilities, including substations
|
177
|
|
67
|
|
1
|
|
Various
|
|
|||||||
|
Gas Transportation:
|
|||||||||||||||
|
Rifle, Colo. to Avon, Colo.
|
22
|
|
8
|
|
—
|
|
60
|
|
|||||||
|
Gas Transportation Compressor
|
8
|
|
1
|
|
—
|
|
50
|
|
|||||||
|
Total PSCo
|
$
|
1,579
|
|
$
|
412
|
|
$
|
5
|
|
||||||
NSP-Minnesota and PSCo have approximately
517
MW and
816
MW of jointly owned generating capacity, respectively. Each Company’s share of operating expenses and construction expenditures are included in the applicable utility accounts. Each of the respective owners is responsible for providing its own financing.
104
|
6.
|
Income Taxes
|
Federal Tax Reform
—
In December 2017, the TCJA was signed into law. While the legislation will require interpretations and regulations to be issued by the IRS, the key provisions impacting Xcel Energy, generally beginning in 2018, include:
|
•
|
Corporate federal tax rate reduction from
35 percent
to
21 percent
;
|
|
•
|
Normalization of resulting plant-related excess deferred taxes;
|
|
•
|
Elimination of the corporate alternative minimum tax;
|
|
•
|
Continued interest expense deductibility and discontinued bonus depreciation for regulated public utilities;
|
|
•
|
Limitations on certain executive compensation deductions;
|
|
•
|
Limitations on certain deductions for NOLs arising after Dec. 31, 2017 (limited to
80 percent
of taxable income);
|
|
•
|
Repeal of the section 199 manufacturing deduction; and
|
|
•
|
Reduced deductions for meals and entertainment as well as state and local lobbying.
|
Entities are required under ASC Topic 740 to recognize the accounting impacts of a tax law change, including the impacts of a change in tax rates on deferred tax assets and liabilities, in the period including the date of the tax law enactment. The SEC staff issued guidance in SAB 118 that supplements the accounting requirements of ASC Topic 740 if elements of the TCJA assessment are not complete, and provides for up to a one year period to finalize the required accounting. Xcel Energy has estimated the effects of the TCJA, which have been reflected in the Dec. 31, 2017 consolidated financial statements. Issuance of U.S. Treasury regulations interpreting the TCJA, other U.S. Treasury and IRS guidance or interpretations of the application of ASC Topic 740 may result in changes to these estimates.
Overall for Xcel Energy, reductions in deferred tax assets and liabilities due to the reduction in corporate federal tax rates result in a net tax benefit. However, as a result of IRS requirements and past regulatory treatment of deferred taxes in the determination of regulated rates of the utility subsidiaries, including deferred taxes related to regulated plant and certain other deferred tax assets and liabilities, the impact was primarily recognized as a regulatory liability refundable to utility customers.
The fourth quarter 2017 estimated accounting impacts of the December 2017 enactment of the new tax law at Xcel Energy included:
|
•
|
$2.7 billion
(
$3.8 billion
grossed-up for tax) of reclassifications of plant-related excess deferred taxes to regulatory liabilities upon valuation at the new
21 percent
federal rate. The regulatory liabilities will be amortized consistent with IRS normalization requirements, resulting in customer refunds over an estimated weighted average period of approximately
30
years;
|
|
•
|
$254 million
and
$174 million
of reclassifications (grossed-up for tax) of excess deferred taxes for non-plant related deferred tax assets and liabilities, respectively, to regulatory assets and liabilities; and
|
|
•
|
$23 million
of total estimated income tax expense related to the tax rate change on certain non-plant deferred taxes and all other 2017 income statement impacts of the federal tax reform.
|
Xcel Energy has accounted for the state tax impacts of federal tax reform based on currently enacted state tax laws. Any future state tax law changes related to the TCJA will be accounted for in the periods state laws are enacted.
Consolidated Appropriations Act, 2016
—
In December 2015, the Consolidated Appropriations Act, 2016 (Act) was signed into law. The Act provided for the following:
|
•
|
Immediate expensing, or “bonus depreciation,” of
50 percent
for property placed in service in 2015, 2016, and 2017;
|
|
•
|
PTCs at
100 percent
of the applicable rate for wind energy projects that begin construction by the end of 2016;
80 percent
of the credit rate for projects that begin construction in 2017;
60 percent
of the credit rate for projects that begin construction in 2018; and
40 percent
of the credit rate for projects that begin construction in 2019. The wind energy PTC was not extended for projects that begin construction after 2019;
|
|
•
|
ITCs at
30 percent
for commercial solar projects that begin construction by the end of 2019;
26 percent
for projects that begin construction in 2020;
22 percent
for projects that begin construction in 2021; and
10 percent
for projects thereafter;
|
|
•
|
R&E credit was permanently extended; and
|
|
•
|
Delay of
two
years (until 2020) of the excise tax on certain employer-provided health insurance plans.
|
105
The accounting related to the Act was recorded beginning in the fourth quarter of 2015 because a change in tax law is accounted for beginning in the period of enactment. The fourth quarter 2015 accounting impacts included:
|
•
|
Recognition of additional tax deductions for bonus depreciation of
$1.2 billion
, and as a result, recognition of
$5 million
benefit related to a carryback claim (see additional discussion below) and
$4 million
expense related to valuation allowances and expirations of charitable contribution carryforwards; and
|
|
•
|
Recognition of
$7 million
benefit for federal R&E credits.
|
Federal Tax Loss Carryback Claims
— In 2012-2015, Xcel Energy identified certain expenses related to 2009, 2010, 2011, 2013, 2014 and 2015 that qualify for an extended carryback beyond the typical
two
-year carryback period. As a result of a higher tax rate in prior years, Xcel Energy recognized a tax benefit of approximately
$5 million
in 2015,
$17 million
in 2014,
$12 million
in 2013 and
$15 million
in 2012.
Federal Audit
—
Xcel Energy files a consolidated federal income tax return. The statute of limitations applicable to Xcel Energy’s federal income tax returns expire as follows:
|
Tax Year(s)
|
Expiration
|
|
|
2009 - 2011
|
June 2018
|
|
|
2012 - 2013
|
October 2018
|
|
|
2014
|
September 2018
|
|
|
2015
|
September 2019
|
|
|
2016
|
September 2020
|
|
In 2012, the IRS commenced an examination of tax years
2010 and 2011
, including the
2009
carryback claim. The IRS proposed an adjustment to the federal tax loss carryback claims that would have resulted in
$14 million
of income tax expense for the 2009 through 2011 claims, and the 2013 through 2015 claims. In the fourth quarter of 2015, the IRS forwarded the issue to the Office of Appeals (“Appeals”). In the third quarter of 2017, Xcel Energy and Appeals reached an agreement and the benefit related to the agreed upon portions was recognized. As of Dec. 31, 2017, the case has been forwarded to the Joint Committee on Taxation.
In the third quarter of 2015, the IRS commenced an examination of tax years
2012 and 2013
. In the third quarter of 2017, the IRS concluded the audit of tax years
2012 and 2013
and proposed an adjustment that would impact Xcel Energy’s NOL and ETR. After evaluating the proposed adjustment, Xcel Energy filed a protest with the IRS. Xcel Energy anticipates the issue will be forwarded to Appeals. As of Dec. 31, 2017, Xcel Energy has recognized its best estimate of income tax expense that will result from a final resolution of this issue; however, the outcome and timing of a resolution is uncertain.
State Audits
—
Xcel Energy files consolidated state tax returns based on income in its major operating jurisdictions of Colorado, Minnesota, Texas, and Wisconsin, and various other state income-based tax returns. As of Dec. 31, 2017, Xcel Energy’s earliest open tax years that are subject to examination by state taxing authorities in its major operating jurisdictions were as follows:
|
State
|
Year
|
|
|
Colorado
|
2009
|
|
|
Minnesota
|
2009
|
|
|
Texas
|
2009
|
|
|
Wisconsin
|
2012
|
|
In 2016, Minnesota began an audit of years
2010 through 2014
. As of Dec. 31, 2017, Minnesota had not proposed any material adjustments.
In 2016, Texas began an audit of years
2009 and 2010
, and in September 2017, began an audit of year 2011. In the fourth quarter of 2017, Texas concluded these audits and Xcel Energy recognized the related benefit.
In 2016, Wisconsin began an audit of years
2012 and 2013
. As of Dec. 31, 2017, Wisconsin had not proposed any material adjustments.
As of Dec. 31, 2017, there were no other state income tax audits in progress.
106
Unrecognized Tax Benefits
— The unrecognized tax benefit balance includes permanent tax positions, which if recognized would affect the annual ETR. In addition, the unrecognized tax benefit balance includes temporary tax positions for which the ultimate deductibility is highly certain but for which there is uncertainty about the timing of such deductibility. A change in the period of deductibility would not affect the ETR but would accelerate the payment of cash to the taxing authority to an earlier period.
A reconciliation of the amount of unrecognized tax benefit is as follows:
|
(Millions of Dollars)
|
Dec. 31, 2017
|
Dec. 31, 2016
|
||||||
|
Unrecognized tax benefit — Permanent tax positions
|
$
|
20
|
|
$
|
30
|
|
||
|
Unrecognized tax benefit — Temporary tax positions
|
19
|
|
104
|
|
||||
|
Total unrecognized tax benefit
|
$
|
39
|
|
$
|
134
|
|
||
A reconciliation of the beginning and ending amount of unrecognized tax benefit is as follows:
|
(Millions of Dollars)
|
2017
|
2016
|
2015
|
|||||||||
|
Balance at Jan. 1
|
$
|
134
|
|
$
|
121
|
|
$
|
67
|
|
|||
|
Additions based on tax positions related to the current year
|
6
|
|
8
|
|
27
|
|
||||||
|
Reductions based on tax positions related to the current year
|
(4
|
)
|
—
|
|
(5
|
)
|
||||||
|
Additions for tax positions of prior years
|
15
|
|
10
|
|
35
|
|
||||||
|
Reductions for tax positions of prior years
|
(105
|
)
|
(5
|
)
|
(3
|
)
|
||||||
|
Settlements with taxing authorities
|
(7
|
)
|
—
|
|
—
|
|
||||||
|
Balance at Dec. 31
|
$
|
39
|
|
$
|
134
|
|
$
|
121
|
|
|||
The unrecognized tax benefit amounts were reduced by the tax benefits associated with NOL and tax credit carryforwards. The amounts of tax benefits associated with NOL and tax credit carryforwards are as follows:
|
(Millions of Dollars)
|
Dec. 31, 2017
|
Dec. 31, 2016
|
||||||
|
NOL and tax credit carryforwards
|
$
|
(31
|
)
|
$
|
(44
|
)
|
||
It is reasonably possible that Xcel Energy’s amount of unrecognized tax benefits could significantly change in the next 12 months as the IRS Appeals progresses and audits resume, the Minnesota and Wisconsin audits progress, and other state audits resume. As the IRS Appeals, Minnesota and Wisconsin audits progress, it is reasonably possible that the amount of unrecognized tax benefit could decrease up to approximately
$15 million
.
The payable for interest related to unrecognized tax benefits is partially offset by the interest benefit associated with NOL and tax credit carryforwards. A reconciliation of the beginning and ending amount of the payable for interest related to unrecognized tax benefits reported are as follows:
|
(Millions of Dollars)
|
2017
|
2016
|
||||||
|
Payable for interest related to unrecognized tax benefits at Jan. 1
|
$
|
(3
|
)
|
$
|
—
|
|
||
|
Interest income (expense) income related to unrecognized tax benefits
|
3
|
|
(3
|
)
|
||||
|
Payable for interest related to unrecognized tax benefits at Dec. 31
|
$
|
—
|
|
$
|
(3
|
)
|
||
The payable for interest related to unrecognized tax benefits was immaterial for 2015.
No amounts were accrued for penalties related to unrecognized tax benefits as of Dec. 31, 2017, 2016 or 2015.
107
Other Income Tax Matters —
NOL amounts represent the amount of the tax loss that is carried forward and tax credits represent the deferred tax asset. NOL and tax credit carryforwards as of Dec. 31 were as follows:
|
(Millions of Dollars)
|
2017
|
2016
|
||||||
|
Federal NOL carryforward
|
$
|
1,072
|
|
$
|
1,916
|
|
||
|
Federal tax credit carryforwards
|
517
|
|
424
|
|
||||
|
Valuation allowances for federal credit carryforwards
|
(5
|
)
|
—
|
|
||||
|
State NOL carryforwards
|
1,592
|
|
1,949
|
|
||||
|
Valuation allowances for state NOL carryforwards
|
(55
|
)
|
(59
|
)
|
||||
|
State tax credit carryforwards, net of federal detriment
(a)
|
90
|
|
74
|
|
||||
|
Valuation allowances for state credit carryforwards, net of federal benefit
(b)
|
(68
|
)
|
(54
|
)
|
||||
|
(a)
|
State tax credit carryforwards are net of federal detriment of
$24 million
and
$40 million
as of Dec. 31, 2017 and 2016, respectively.
|
|
(b)
|
Valuation allowances for state tax credit carryforwards were net of federal benefit of
$18 million
and
$29 million
as of Dec. 31, 2017 and 2016, respectively.
|
The federal carryforward periods expire between
2021
and
2037
. The state carryforward periods expire between
2018
and
2037
.
Total income tax expense from operations differs from the amount computed by applying the statutory federal income tax rate to income before income tax expense. The following reconciles such differences for the years ending Dec. 31:
|
2017
|
2016
(b)
|
2015
(b)
|
||||||
|
Federal statutory rate
|
35.0
|
%
|
35.0
|
%
|
35.0
|
%
|
||
|
State income tax on pretax income, net of federal tax effect
|
3.9
|
%
|
3.9
|
%
|
3.9
|
%
|
||
|
Increases (decreases) in tax from:
|
||||||||
|
Wind production tax credits recognized
|
(4.7
|
)
|
(3.4
|
)
|
(1.8
|
)
|
||
|
Other tax credits recognized, net of federal income tax expense
|
(1.0
|
)
|
(0.8
|
)
|
(0.9
|
)
|
||
|
Tax reform
|
1.4
|
|
—
|
|
—
|
|
||
|
Regulatory differences - effects of rate changes
(a)
|
(0.1
|
)
|
(0.1
|
)
|
(0.1
|
)
|
||
|
Regulatory differences - other utility plant items
|
(0.7
|
)
|
(0.5
|
)
|
(0.9
|
)
|
||
|
Change in unrecognized tax benefits
|
(0.6
|
)
|
0.2
|
|
0.6
|
|
||
|
NOL carryback
|
—
|
|
—
|
|
(0.3
|
)
|
||
|
Other, net
|
(1.1
|
)
|
(0.2
|
)
|
—
|
|
||
|
Effective income tax rate
|
32.1
|
%
|
34.1
|
%
|
35.5
|
%
|
||
|
(a)
|
The amortization of excess deferred taxes.
|
|
(b)
|
The prior periods included in this footnote have been reclassified to conform to current year presentation.
|
The components of Xcel Energy’s income tax expense for the years ending Dec. 31 were:
|
(Millions of Dollars)
|
2017
|
2016
|
2015
|
|||||||||
|
Current federal tax expense (benefit)
|
$
|
1
|
|
$
|
(3
|
)
|
$
|
(36
|
)
|
|||
|
Current state tax (benefit) expense
|
(11
|
)
|
(4
|
)
|
2
|
|
||||||
|
Current change in unrecognized tax (benefit) expense
|
(83
|
)
|
6
|
|
46
|
|
||||||
|
Deferred federal tax expense
|
460
|
|
477
|
|
480
|
|
||||||
|
Deferred state tax expense
|
107
|
|
112
|
|
92
|
|
||||||
|
Deferred change in unrecognized tax expense (benefit)
|
73
|
|
(2
|
)
|
(36
|
)
|
||||||
|
Deferred investment tax credits
|
(5
|
)
|
(5
|
)
|
(5
|
)
|
||||||
|
Total income tax expense
|
$
|
542
|
|
$
|
581
|
|
$
|
543
|
|
|||
108
The components of deferred income tax expense for the years ending Dec. 31 were:
|
(Millions of Dollars)
|
2017
|
2016
|
2015
|
|||||||||
|
Deferred tax (benefit) expense excluding items below
|
$
|
(2,939
|
)
|
$
|
631
|
|
$
|
547
|
|
|||
|
Amortization and adjustments to deferred income taxes on income tax regulatory assets and liabilities
|
3,583
|
|
(45
|
)
|
(12
|
)
|
||||||
|
Tax (expense) benefit allocated to other comprehensive income, net of adoption of ASU No. 2018-02, and other
|
(4
|
)
|
1
|
|
1
|
|
||||||
|
Deferred tax expense
|
$
|
640
|
|
$
|
587
|
|
$
|
536
|
|
|||
The components of Xcel Energy’s net deferred tax liability at Dec. 31 were as follows:
|
(Millions of Dollars)
|
2017
|
2016
(a)
|
||||||
|
Deferred tax liabilities:
|
|
|
|
|
||||
|
Differences between book and tax bases of property
|
$
|
4,989
|
|
$
|
7,697
|
|
||
|
Regulatory assets
|
565
|
|
152
|
|
||||
|
Pension expense
|
199
|
|
298
|
|
||||
|
Other
|
69
|
|
89
|
|
||||
|
Total deferred tax liabilities
|
$
|
5,822
|
|
$
|
8,236
|
|
||
|
Deferred tax assets:
|
|
|
|
|
||||
|
Regulatory liabilities
|
$
|
886
|
|
$
|
(132
|
)
|
||
|
Tax credit carryforward
|
607
|
|
498
|
|
||||
|
NOL carryforward
|
293
|
|
754
|
|
||||
|
NOL and tax credit valuation allowances
|
(77
|
)
|
(57
|
)
|
||||
|
Other employee benefits
|
132
|
|
205
|
|
||||
|
Deferred investment tax credits
|
17
|
|
27
|
|
||||
|
Deferred fuel costs
|
12
|
|
11
|
|
||||
|
Rate refund
|
10
|
|
33
|
|
||||
|
Other
|
97
|
|
113
|
|
||||
|
Total deferred tax assets
|
$
|
1,977
|
|
$
|
1,452
|
|
||
|
Net deferred tax liability
|
$
|
3,845
|
|
$
|
6,784
|
|
||
|
(a)
|
The prior period included in this footnote has been reclassified to conform to current year presentation.
|
|
7.
|
Earnings Per Share
|
Basic EPS was computed by dividing the earnings available to Xcel Energy Inc.’s common shareholders by the weighted average number of common shares outstanding during the period. Diluted EPS was computed by dividing the earnings available to Xcel Energy Inc.’s common shareholders by the diluted weighted average number of common shares outstanding during the period. Diluted EPS reflects the potential dilution that could occur if securities or other agreements to issue common stock (i.e., common stock equivalents) were settled. The weighted average number of potentially dilutive shares outstanding used to calculate Xcel Energy Inc.’s diluted EPS is calculated using the treasury stock method.
Common Stock Equivalents
—
Xcel Energy Inc. currently has common stock equivalents related to certain equity awards in share-based compensation arrangements. Common stock equivalents causing a dilutive impact to EPS include commitments to issue common stock related to time based equity compensation awards. Effective August 2015, 401(k) matching contributions are settled in cash for all Xcel Energy employee groups.
Stock equivalent units granted to Xcel Energy Inc.’s Board of Directors are included in common shares outstanding upon grant date as there is no further service, performance or market condition associated with these awards. Restricted stock, granted to settle amounts due to certain employees under the Xcel Energy Inc. Executive Annual Incentive Award Plan, is included in common shares outstanding when granted.
109
Share-based compensation arrangements for which there is currently no dilutive impact to EPS include the following:
|
•
|
Equity awards subject to a performance condition; included in common shares outstanding when all necessary conditions for settlement have been satisfied by the end of the reporting period.
|
|
•
|
Liability awards subject to a performance condition; any portions settled in shares are included in common shares outstanding upon settlement.
|
The dilutive impact of common stock equivalents affecting EPS was as follows:
|
2017
|
2016
|
2015
|
|||||||||||||||||||||||||||||||
|
(Amounts in millions, except per share data)
|
Income
|
Shares
|
Per
Share
Amount
|
Income
|
Shares
|
Per
Share
Amount
|
Income
|
Shares
|
Per
Share
Amount
|
||||||||||||||||||||||||
|
Net income
|
$
|
1,148
|
|
$
|
1,123
|
|
$
|
984
|
|
||||||||||||||||||||||||
|
Basic EPS:
|
|||||||||||||||||||||||||||||||||
|
Earnings available to common shareholders
|
1,148
|
|
508.5
|
|
$
|
2.26
|
|
1,123
|
|
508.8
|
|
$
|
2.21
|
|
984
|
|
507.8
|
|
$
|
1.94
|
|
||||||||||||
|
Effect of dilutive securities:
|
|||||||||||||||||||||||||||||||||
|
Equity awards
|
—
|
|
0.6
|
|
—
|
|
0.7
|
|
—
|
|
0.4
|
|
|||||||||||||||||||||
|
Diluted EPS:
|
|||||||||||||||||||||||||||||||||
|
Earnings available to common shareholders
|
$
|
1,148
|
|
509.1
|
|
$
|
2.25
|
|
$
|
1,123
|
|
509.5
|
|
$
|
2.21
|
|
$
|
984
|
|
508.2
|
|
$
|
1.94
|
|
|||||||||
Dividend Reinvestment and Stock Purchase Plan and Stock Compensation Settlements —
In 2015, the Xcel Energy Inc. Board of Directors authorized open market purchases by the plan administrator as the source of shares for the dividend reinvestment program as well as market purchases of up to
3.0 million
shares for stock compensation plan settlements. In 2017, Xcel Energy Inc. repurchased approximately
0.1 million
shares of common stock in the open market at a total cost of approximately
$3 million
.
|
8.
|
Share-Based Compensation
|
Restricted Stock
— Certain employees may elect to receive shares of common or restricted stock under the Xcel Energy Inc. Executive Annual Incentive Award Plan and the 2015 Omnibus Incentive Plan (effective May 20, 2015). Restricted stock is treated as an equity award and vests and settles in equal annual installments over a
three
-year period. Xcel Energy Inc. reinvests dividends on the restricted stock while restrictions are in place. Restrictions also apply to the additional shares of restricted stock acquired through dividend reinvestment. If the restricted shares are forfeited, the employee is not entitled to the dividends on those shares. Restricted stock has a fair value equal to the market trading price of Xcel Energy Inc.’s stock at the grant date.
Xcel Energy Inc. granted shares of restricted stock for the years ended Dec. 31 as follows:
|
(Shares in Thousands)
|
2017
|
2016
|
2015
|
|||||||||
|
Granted shares
|
15
|
|
20
|
|
42
|
|
||||||
|
Grant date fair value
|
$
|
42.00
|
|
$
|
38.82
|
|
$
|
35.00
|
|
|||
A summary of the changes of nonvested restricted stock for the year ended 2017 were as follows:
|
(Shares in Thousands)
|
Shares
|
Weighted Average
Grant Date Fair Value |
|||||
|
Nonvested restricted stock at Jan. 1, 2017
|
67
|
|
$
|
35.43
|
|
||
|
Granted
|
15
|
|
42.00
|
|
|||
|
Forfeited
|
—
|
|
—
|
|
|||
|
Vested
|
(40
|
)
|
33.36
|
|
|||
|
Dividend equivalents
|
2
|
|
44.69
|
|
|||
|
Nonvested restricted stock at Dec. 31, 2017
|
44
|
|
39.71
|
|
|||
110
Other Equity Awards
— Xcel Energy Inc.’s Board of Directors has granted equity awards under the Xcel Energy Inc. 2005 Long-Term Incentive Plan (as amended and restated in 2010) and the 2015 Omnibus Incentive Plan (effective May 20, 2015). These plans allow the attachment of various vesting conditions and performance goals to the awards granted. The vesting conditions and performance goals may vary by plan year. At the end of the restricted period, such grants will be awarded if the vesting conditions and/or performance goals are met.
Commencing in 2014, certain employees were granted equity awards with one portion of shares subject only to service conditions, and the other portion subject to performance conditions. Inclusive of other grants of time-based awards, a total of
0.3 million
time-based equity shares subject only to service conditions were granted annually in 2017, 2016, and 2015, respectively. Other than shares associated with these time-based awards and restricted stock, payout of all other employee equity awards and the lapsing of restrictions on the transfer of units are based on the achievement of performance criteria.
The performance conditions for a portion of the awards granted from 2015 to 2017 are based on relative TSR, measured identically to TSR liability awards granted in those years, and measurement of performance for a portion of units awarded from 2011 to 2013 is based on EPS growth with an additional condition that Xcel Energy Inc.’s annual dividend paid on its common stock remains at a specified amount per share or greater. The performance conditions for the remaining employee equity awards are based on environmental goals. Equity awards with performance conditions awarded from 2011 to 2017, plus associated dividend equivalents, will be settled or forfeited and the restricted period will lapse after
three years
, with potential payouts ranging from
zero
to
150 percent
for 2011 to 2013 grants, and
zero
to
200 percent
for 2014 to 2017 grants, depending on the level of achievement.
|
•
|
The 2012 awards measured on EPS growth and the 2012 environmental awards met their targets as of Dec. 31, 2014, and were settled in shares in February 2015.
|
|
•
|
The 2013 awards measured on EPS growth, the 2013 environmental awards and the 2013 time-based awards met their targets as of Dec. 31, 2015, and were settled in shares in February 2016.
|
|
•
|
The 2014 environmental awards and the 2014 time-based awards met their targets as of Dec. 31, 2016, and were settled in shares in February 2017.
|
|
•
|
The 2015 environmental awards and the 2015 time-based awards met their targets as of Dec. 31, 2017, and will be settled in shares in February 2018.
|
Equity award units granted to employees, excluding restricted stock, for the years ended Dec. 31 were as follows:
|
(Units in Thousands)
|
2017
|
2016
|
2015
|
|||||||||
|
Granted units
|
503
|
|
522
|
|
496
|
|
||||||
|
Weighted average grant date fair value
|
$
|
41.02
|
|
$
|
36.00
|
|
$
|
36.09
|
|
|||
Approximately
0.5 million
of these units vested during 2017 at a total fair value of
$22 million
. Approximately
0.5 million
of these units vested during 2016 at a total fair value of
$22 million
. Approximately
0.8 million
of these units vested during 2015 at a total fair value of
$27 million
.
A summary of the changes in the nonvested portion of these equity award units for the year ended 2017, were as follows:
|
(Units in Thousands)
|
Units
|
Weighted Average
Grant Date Fair Value |
|||||
|
Nonvested Units at Jan. 1, 2017
|
984
|
|
$
|
36.05
|
|
||
|
Granted
|
503
|
|
41.02
|
|
|||
|
Forfeited
|
(70
|
)
|
37.12
|
|
|||
|
Vested
|
(467
|
)
|
36.17
|
|
|||
|
Dividend equivalents
|
45
|
|
37.20
|
|
|||
|
Nonvested Units at Dec. 31, 2017
|
995
|
|
38.48
|
|
|||
The total fair value of these nonvested equity awards as of Dec. 31, 2017 was
$48 million
and the weighted average remaining contractual life was
1.7 years
.
111
Stock Equivalent Units —
Non-employee members of the Xcel Energy Inc. Board of Directors receive annual awards of stock equivalent units, with each unit having a value equal to
one
share of Xcel Energy Inc. common stock. The annual grants are vested as of the date of each member’s election to the Board of Directors; there is no further service or other condition attached to the annual grants. Additionally, directors may elect to receive their fees in stock equivalent units in lieu of cash. Dividends on Xcel Energy Inc.’s common stock are converted to stock equivalent units and granted based on the number of stock equivalent units held by each participant as of the dividend date. The stock equivalent units are payable as a distribution of Xcel Energy Inc.’s common stock upon a director’s termination of service.
The stock equivalent units granted for the years ended Dec. 31 were as follows:
|
(Units in Thousands)
|
2017
|
2016
|
2015
|
|||||||||
|
Granted units
|
51
|
|
49
|
|
60
|
|
||||||
|
Grant date fair value
|
$
|
46.05
|
|
$
|
40.68
|
|
$
|
34.58
|
|
|||
A summary of the stock equivalent unit changes for the year ended 2017 are as follows:
|
(Units in Thousands)
|
Units
|
Weighted Average
Grant Date Fair Value |
|||||
|
Stock equivalent units at Jan. 1, 2017
|
750
|
|
$
|
27.39
|
|
||
|
Granted
|
51
|
|
46.05
|
|
|||
|
Units distributed
|
(71
|
)
|
20.52
|
|
|||
|
Dividend equivalents
|
23
|
|
45.24
|
|
|||
|
Stock equivalent units at Dec. 31, 2017
|
753
|
|
29.83
|
|
|||
TSR Liability Awards
— Xcel Energy Inc.’s Board of Directors has granted TSR liability awards under the Xcel Energy Inc. 2005 Long-Term Incentive Plan (as amended and restated effective in 2010) and 2015 Omnibus Incentive Plan. The plans allow Xcel Energy to attach various performance goals to the awards granted. The liability awards granted have been historically dependent on a single measure of performance, Xcel Energy Inc.’s relative TSR measured over a
three
-year period. For 2017, 2016 and 2015 awards, Xcel Energy Inc.’s TSR is compared to the TSR of other companies in a
22
-member utilities peer group. At the end of the
three
-year period, potential payouts of the awards range from
zero
to
200 percent
, depending on Xcel Energy Inc.’s TSR compared to the applicable peer group or index.
The TSR liability awards granted for the years ended Dec. 31 were as follows:
|
(In Thousands)
|
2017
|
2016
|
2015
|
||||||
|
Awards granted
|
240
|
|
264
|
|
224
|
|
|||
The total amounts of TSR liability awards settled during the years ended Dec. 31 were as follows:
|
(In Thousands)
|
2017
|
2016
|
2015
|
|||||||||
|
Awards settled
|
454
|
|
354
|
|
—
|
|
||||||
|
Settlement amount (cash, common stock and deferred amounts)
|
$
|
19,083
|
|
$
|
13,724
|
|
$
|
—
|
|
|||
The amount of cash used to settle Xcel Energy’s TSR liability awards was
$7 million
in 2017.
Share-Based Compensation Expense
— Other than for restricted stock, the vesting of employee equity awards is generally predicated on the achievement of a performance condition, which is the achievement of a TSR, EPS or environmental measures target. Additionally, approximately
0.3 million
of equity award units were granted annually in 2017, 2016, and 2015, respectively, with vesting subject only to service conditions for periods of
three
years. Generally, all of these instruments are considered to be equity awards since the plan settlement determination (shares or cash) resides with Xcel Energy and not the participants. In addition, these awards have not been previously settled in cash and Xcel Energy plans to continue electing share settlement. The grant date fair value of equity awards is expensed over the service period as employees vest in their rights to those awards.
The TSR liability awards have been historically settled partially in cash, and do not qualify as equity awards, but rather are accounted for as liabilities. As liability awards, the fair value on which ratable expense is based, as employees vest in their rights to those awards, is remeasured each period based on the current stock price and performance achievement, and final expense is based on the market value of the shares on the date the award is settled.
112
The compensation costs related to share-based awards for the years ended Dec. 31 were as follows:
|
(Millions of Dollars)
|
2017
|
2016
|
2015
|
|||||||||
|
Compensation cost for share-based awards
(a)
|
$
|
57
|
|
$
|
41
|
|
$
|
45
|
|
|||
|
Tax benefit recognized in income
|
22
|
|
16
|
|
18
|
|
||||||
|
(a)
|
Compensation costs for share-based payment arrangements are included in O&M expense in the consolidated statements of income.
|
The maximum aggregate number of shares of common stock available for issuance under the Xcel Energy Inc. 2015 Omnibus Incentive Plan (effective May 20, 2015) is
7.0 million
shares. The maximum aggregate number of shares of common stock available for issuance under the Xcel Energy Inc. 2005 Long-Term Incentive Plan (as amended and restated effective Feb. 17, 2010) is
8.3 million
shares. Under the Xcel Energy Inc. Executive Annual Incentive Award Plan (as amended and restated effective Feb. 17, 2010), the total number of shares approved for issuance is
1.2 million
shares.
As of Dec. 31, 2017 and 2016, there was approximately
$44 million
and
$29 million
, respectively, of total unrecognized compensation cost related to nonvested share-based compensation awards. Xcel Energy expects to recognize the amount unrecognized at Dec. 31, 2017 over a weighted average period of
1.7 years
.
9. Benefit Plans and Other Postretirement Benefits
Xcel Energy offers various benefit plans to its employees. Approximately
46 percent
of employees that receive benefits are represented by several local labor unions under several collective-bargaining agreements. As of
Dec. 31, 2017
:
|
•
|
NSP-Minnesota had
1,858
and NSP-Wisconsin had
383
bargaining employees covered under a collective-bargaining agreement, which expires in December 2019. NSP-Minnesota also had an additional
248
nuclear operation bargaining employees covered under several collective-bargaining agreements. These agreements expire in 2018 and 2019.
|
|
•
|
PSCo had
1,835
bargaining employees covered under a collective-bargaining agreement, which expired in May 2017. While collective bargaining is ongoing, the terms and conditions of the agreement are automatically extended.
|
|
•
|
SPS had
791
bargaining employees covered under a collective-bargaining agreement, which expires in October 2019.
|
The plans invest in various instruments which are disclosed under the accounting guidance for fair value measurements which establishes a hierarchical framework for disclosing the observability of the inputs utilized in measuring fair value. The three levels in the hierarchy and examples of each level are as follows:
Level 1 — Quoted prices are available in active markets for identical assets as of the reporting date. The types of assets included in Level 1 are highly liquid and actively traded instruments with quoted prices.
Level 2 — Pricing inputs are other than quoted prices in active markets, but are either directly or indirectly observable as of the reporting date. The types of assets included in Level 2 are typically either comparable to actively traded securities or contracts, or priced with models using highly observable inputs.
Level 3 — Significant inputs to pricing have little or no observability as of the reporting date. The types of assets included in Level 3 are those with inputs requiring significant management judgment or estimation.
Specific valuation methods include the following:
Cash equivalents
—
The fair values of cash equivalents are generally based on cost plus accrued interest; money market funds are measured using quoted NAVs.
Insurance contracts
— Insurance contract fair values take into consideration the value of the investments in separate accounts of the insurer, which are priced based on observable inputs.
113
Investments in commingled funds, equity securities and other funds
— Equity securities are valued using quoted prices in active markets. The fair values for commingled funds are measured using NAVs, which take into consideration the value of underlying fund investments, as well as the other accrued assets and liabilities of a fund, in order to determine a per share market value. The investments in commingled funds may be redeemed for NAV with proper notice. Proper notice varies by fund and can range from daily with a few days’ notice to annually with
90 days
’ notice. Private equity investments require approval of the fund for any unscheduled redemption, and such redemptions may be approved or denied by the fund at its sole discretion. Depending on the fund, unscheduled distributions from real estate investments may require approval of the fund or may be redeemed with proper notice, which is typically quarterly with
45
-
90 days
’ notice; however, withdrawals from real estate investments may be delayed or discounted as a result of fund illiquidity.
Investments in debt securities
— Fair values for debt securities are determined by a third party pricing service using recent trades and observable spreads from benchmark interest rates for similar securities.
Derivative Instruments
—
Fair values for foreign currency derivatives are determined using pricing models based on the prevailing forward exchange rate of the underlying currencies. The fair values of interest rate derivatives are based on broker quotes that utilize current market interest rate forecasts.
Pension Benefits
Xcel Energy has several noncontributory, defined benefit pension plans that cover almost all employees. Generally, benefits are based on a combination of years of service, the employee’s average pay and, in some cases, social security benefits. Xcel Energy’s policy is to fully fund into an external trust the actuarially determined pension costs recognized for ratemaking and financial reporting purposes, subject to the limitations of applicable employee benefit and tax laws.
In addition to the qualified pension plans, Xcel Energy maintains a supplemental executive retirement plan (SERP) and a nonqualified pension plan. The SERP is maintained for certain executives that were participants in the plan in 2008, when the SERP was closed to new participants. The nonqualified pension plan provides unfunded, nonqualified benefits for compensation that is in excess of the limits applicable to the qualified pension plans, with distributions funded by Xcel Energy’s consolidated operating cash flows. The total obligations of the SERP and nonqualified plan as of
Dec. 31, 2017
and
2016
were
$37 million
and
$44 million
, respectively. In
2017
and
2016
, Xcel Energy recognized net benefit cost for financial reporting for the SERP and nonqualified plans of
$5 million
and
$8 million
, respectively.
In 2016, Xcel Energy established rabbi trusts to provide partial funding for future distributions of the SERP and its deferred compensation plan, supplemented by Xcel Energy’s consolidated operating cash flows as determined necessary. For more information regarding the funding of rabbi trusts, see Note 11 to the consolidated financial statements. Also in 2016, Xcel Energy amended the deferred compensation plan to provide eligible participants the ability to diversify deferred settlements of equity awards, other than time-based equity awards, into various fund options.
Xcel Energy bases the investment-return assumption on expected long-term performance for each of the investment types included in its pension asset portfolio. Xcel Energy considers the historical returns achieved by its asset portfolio over the past
20
-year or longer period, as well as the long-term return levels projected and recommended by investment experts. Xcel Energy continually reviews its pension assumptions. The pension cost determination assumes a forecasted mix of investment types over the long-term.
|
•
|
Investment returns in 2017 were above the assumed level of
6.87 percent
;
|
|
•
|
Investment returns in 2016 were below the assumed level of
6.87 percent
;
|
|
•
|
Investment returns in 2015 were below the assumed level of
7.09 percent
; and
|
|
•
|
In
2018
, Xcel Energy’s expected investment-return assumption is
6.87 percent
.
|
114
The assets are invested in a portfolio according to Xcel Energy’s return, liquidity and diversification objectives to provide funding for plan obligations and minimize contributions to the plan, within appropriate levels of risk. The principal mechanism for achieving these objectives is the projected asset allocation given the long-term risk, return, and liquidity characteristics of each particular asset class. There were no significant concentrations of risk in any particular industry, index, or entity. Market volatility can impact even well-diversified portfolios and significantly affect the return levels achieved by pension assets in any year.
The following table presents the target pension asset allocations for Xcel Energy at Dec. 31 for the upcoming year:
|
2017
|
2016
|
|||||
|
Domestic and international equity securities
|
36
|
%
|
38
|
%
|
||
|
Long-duration fixed income and interest rate swap securities
|
27
|
|
27
|
|
||
|
Short-to-intermediate fixed income securities
|
20
|
|
16
|
|
||
|
Alternative investments
|
15
|
|
17
|
|
||
|
Cash
|
2
|
|
2
|
|
||
|
Total
|
100
|
%
|
100
|
%
|
||
Xcel Energy’s ongoing investment strategy is based on plan-specific investment recommendations that seek to minimize potential investment and interest rate risk as a plan’s funded status increases over time. The investment recommendations result in a greater percentage of long-duration fixed income securities being allocated to specific plans having relatively higher funded status ratios and a greater percentage of growth assets being allocated to plans having relatively lower funded status ratios. The aggregate projected asset allocation presented in the table above for the master pension trust results from the plan-specific strategies.
Pension Plan Assets
The following tables present, for each of the fair value hierarchy levels, Xcel Energy’s pension plan assets that are measured at fair value as of
Dec. 31, 2017
and
2016
:
|
Dec. 31, 2017
|
||||||||||||||||||||
|
(Millions of Dollars)
|
Level 1
|
Level 2
|
Level 3
|
Investments Measured at NAV
|
Total
|
|||||||||||||||
|
Cash equivalents
|
$
|
196
|
|
$
|
—
|
|
$
|
—
|
|
$
|
—
|
|
$
|
196
|
|
|||||
|
Commingled funds:
|
||||||||||||||||||||
|
U.S. equity funds
|
513
|
|
—
|
|
—
|
|
—
|
|
513
|
|
||||||||||
|
Non U.S. equity funds
|
92
|
|
—
|
|
—
|
|
199
|
|
291
|
|
||||||||||
|
U.S. corporate bond funds
|
369
|
|
—
|
|
—
|
|
—
|
|
369
|
|
||||||||||
|
Emerging market equity funds
|
—
|
|
—
|
|
—
|
|
314
|
|
314
|
|
||||||||||
|
Emerging market debt funds
|
75
|
|
—
|
|
—
|
|
166
|
|
241
|
|
||||||||||
|
Private equity investments
|
—
|
|
—
|
|
—
|
|
84
|
|
84
|
|
||||||||||
|
Real estate
|
—
|
|
—
|
|
—
|
|
195
|
|
195
|
|
||||||||||
|
Other commingled funds
|
5
|
|
—
|
|
—
|
|
117
|
|
122
|
|
||||||||||
|
Debt securities:
|
||||||||||||||||||||
|
Government securities
|
—
|
|
356
|
|
—
|
|
—
|
|
356
|
|
||||||||||
|
U.S. corporate bonds
|
—
|
|
272
|
|
—
|
|
—
|
|
272
|
|
||||||||||
|
Non U.S. corporate bonds
|
—
|
|
45
|
|
—
|
|
—
|
|
45
|
|
||||||||||
|
Equity securities:
|
||||||||||||||||||||
|
U.S. equities
|
114
|
|
—
|
|
—
|
|
—
|
|
114
|
|
||||||||||
|
Other
|
(29
|
)
|
4
|
|
—
|
|
1
|
|
(24
|
)
|
||||||||||
|
Total
|
$
|
1,335
|
|
$
|
677
|
|
$
|
—
|
|
$
|
1,076
|
|
$
|
3,088
|
|
|||||
115
|
Dec. 31, 2016
|
|||||||||||||||||||||
|
(Millions of Dollars)
|
Level 1
|
Level 2
|
Level 3
|
Investments Measured at NAV
|
Total
|
||||||||||||||||
|
Cash equivalents
|
$
|
113
|
|
$
|
—
|
|
$
|
—
|
|
$
|
—
|
|
$
|
113
|
|
||||||
|
U.S. equity funds
|
491
|
|
—
|
|
—
|
|
—
|
|
491
|
|
|||||||||||
|
Non U.S. equity funds
|
167
|
|
—
|
|
—
|
|
202
|
|
369
|
|
|||||||||||
|
U.S. corporate bond funds
|
268
|
|
—
|
|
—
|
|
—
|
|
268
|
|
|||||||||||
|
Emerging market equity funds
|
—
|
|
—
|
|
—
|
|
194
|
|
194
|
|
|||||||||||
|
Emerging market debt funds
|
79
|
|
—
|
|
—
|
|
85
|
|
164
|
|
|||||||||||
|
Commodity funds
|
—
|
|
—
|
|
—
|
|
21
|
|
21
|
|
|||||||||||
|
Private equity investments
|
—
|
|
—
|
|
—
|
|
101
|
|
101
|
|
|||||||||||
|
Real estate
|
—
|
|
—
|
|
—
|
|
184
|
|
—
|
|
184
|
|
|||||||||
|
Other commingled funds
|
—
|
|
—
|
|
—
|
|
210
|
|
210
|
|
|||||||||||
|
Debt securities:
|
|||||||||||||||||||||
|
Government securities
|
—
|
|
364
|
|
—
|
|
—
|
|
364
|
|
|||||||||||
|
U.S. corporate bonds
|
—
|
|
238
|
|
—
|
|
—
|
|
238
|
|
|||||||||||
|
Non U.S. corporate bonds
|
—
|
|
38
|
|
—
|
|
—
|
|
38
|
|
|||||||||||
|
Mortgage-backed securities
|
—
|
|
6
|
|
—
|
|
—
|
|
6
|
|
|||||||||||
|
Asset-backed securities
|
—
|
|
3
|
|
—
|
|
—
|
|
3
|
|
|||||||||||
|
Equity securities:
|
|||||||||||||||||||||
|
U.S. equities
|
89
|
|
—
|
|
—
|
|
—
|
|
89
|
|
|||||||||||
|
Other
|
—
|
|
3
|
|
—
|
|
—
|
|
3
|
|
|||||||||||
|
Total
|
$
|
1,207
|
|
$
|
652
|
|
$
|
—
|
|
$
|
997
|
|
$
|
2,856
|
|
||||||
There were no assets transferred in or out of Level 3 for the years ended Dec. 31, 2017, 2016 or 2015.
Benefit Obligations —
A comparison of the actuarially computed pension benefit obligation and plan assets for Xcel Energy is presented in the following table:
|
(Millions of Dollars)
|
2017
|
2016
|
||||||
|
Accumulated Benefit Obligation at Dec. 31
|
$
|
3,612
|
|
$
|
3,489
|
|
||
|
Change in Projected Benefit Obligation:
|
|
|
|
|
||||
|
Obligation at Jan. 1
|
$
|
3,682
|
|
$
|
3,568
|
|
||
|
Service cost
|
94
|
|
92
|
|
||||
|
Interest cost
|
147
|
|
160
|
|
||||
|
Plan amendments
|
(13
|
)
|
2
|
|
||||
|
Actuarial loss
|
259
|
|
186
|
|
||||
|
Benefit payments
(a)
|
(341
|
)
|
(326
|
)
|
||||
|
Obligation at Dec. 31
|
$
|
3,828
|
|
$
|
3,682
|
|
||
|
(Millions of Dollars)
|
2017
|
2016
|
||||||
|
Change in Fair Value of Plan Assets:
|
||||||||
|
Fair value of plan assets at Jan. 1
|
$
|
2,856
|
|
$
|
2,884
|
|
||
|
Actual return on plan assets
|
411
|
|
172
|
|
||||
|
Employer contributions
|
162
|
|
125
|
|
||||
|
Benefit payments
(a)
|
(341
|
)
|
(325
|
)
|
||||
|
Fair value of plan assets at Dec. 31
|
$
|
3,088
|
|
$
|
2,856
|
|
||
|
(Millions of Dollars)
|
2017
|
2016
|
||||||
|
Funded Status of Plans at Dec. 31:
|
||||||||
|
Funded status
(b)
|
$
|
(740
|
)
|
$
|
(826
|
)
|
||
|
(a)
|
2017 amount includes approximately
$174 million
of lump-sum benefit payments used in the determination of a settlement charge.
|
|
(b)
|
Amounts are recognized in noncurrent liabilities on Xcel Energy’s consolidated balance sheets.
|
116
|
(Millions of Dollars)
|
2017
|
2016
|
||||||
|
Amounts Not Yet Recognized as Components of Net Periodic Benefit Cost:
|
||||||||
|
Net loss
|
$
|
1,709
|
|
$
|
1,836
|
|
||
|
Prior service credit
|
(25
|
)
|
(5
|
)
|
||||
|
Total
|
$
|
1,684
|
|
$
|
1,831
|
|
||
|
(Millions of Dollars)
|
2017
|
2016
|
||||||
|
Amounts Not Yet Recognized as Components of Net Periodic Benefit Cost Have Been Recorded as Follows Based Upon Expected Recovery in Rates:
|
||||||||
|
Current regulatory assets
|
$
|
100
|
|
$
|
101
|
|
||
|
Noncurrent regulatory assets
|
1,511
|
|
1,650
|
|
||||
|
Deferred income taxes
|
19
|
|
31
|
|
||||
|
Net-of-tax accumulated OCI
|
54
|
|
49
|
|
||||
|
Total
|
$
|
1,684
|
|
$
|
1,831
|
|
||
|
Measurement date
|
Dec. 31, 2017
|
Dec. 31, 2016
|
||
|
2017
|
2016
|
|||||
|
Significant Assumptions Used to Measure Benefit Obligations:
|
||||||
|
Discount rate for year-end valuation
|
3.63
|
%
|
4.13
|
%
|
||
|
Expected average long-term increase in compensation level
|
3.75
|
|
3.75
|
|
||
|
Mortality table
|
RP-2014
|
|
RP-2014
|
|
||
Mortality
— In 2014, the Society of Actuaries published a new mortality table (RP-2014) that increased the overall life expectancy of males and females. In 2014, Xcel Energy adopted this mortality table, with modifications, based on its population and specific experience. During 2017, a new projection table was released (MP-2017). Xcel Energy evaluated the updated projection table and concluded that the methodology currently in use and adopted in 2016 is consistent with the recently updated 2017 table and continues to be representative of Xcel Energy’s population.
Cash Flows —
Cash funding requirements can be impacted by changes to actuarial assumptions, actual asset levels and other calculations prescribed by the funding requirements of income tax and other pension-related regulations. Required contributions were made in 2015 through 2018 to meet minimum funding requirements.
Total voluntary and required pension funding contributions across all
four
of Xcel Energy’s pension plans were as follows:
|
•
|
$150 million
in January 2018;
|
|
•
|
$162 million
in 2017;
|
|
•
|
$125 million
in 2016; and
|
|
•
|
$90 million
in 2015.
|
For future years, Xcel Energy anticipates contributions will be made as necessary.
Plan Amendments —
Xcel Energy amended the Xcel Energy Pension Plan and Xcel Energy Inc. Nonbargaining Pension Plan (South) in 2017 to reduce supplemental benefits for non-bargaining participants as well as to allow the transfer of a portion of non-qualified pension obligations into the qualified plans. In 2016, the Xcel Energy Pension Plan was amended to change the discount rate basis for lump-sum conversion to annuity participants and annuity conversion to lump-sum participants. Additionally in 2016, the annual credits contributed to the PSCo Bargaining Plan retirement spending account increased.
117
Benefit Costs —
The components of Xcel Energy’s net periodic pension cost were:
|
(Millions of Dollars)
|
2017
|
2016
|
2015
|
|||||||||
|
Service cost
|
$
|
94
|
|
$
|
92
|
|
$
|
99
|
|
|||
|
Interest cost
|
147
|
|
160
|
|
149
|
|
||||||
|
Expected return on plan assets
|
(209
|
)
|
(210
|
)
|
(214
|
)
|
||||||
|
Amortization of prior service credit
|
(2
|
)
|
(2
|
)
|
(2
|
)
|
||||||
|
Amortization of net loss
|
107
|
|
97
|
|
125
|
|
||||||
|
Settlement charge
(a)
|
81
|
|
—
|
|
—
|
|
||||||
|
Net periodic pension cost
|
218
|
|
137
|
|
|
157
|
|
|||||
|
Costs not recognized due to effects of regulation
|
(79
|
)
|
(15
|
)
|
(29
|
)
|
||||||
|
Net benefit cost recognized for financial reporting
|
$
|
139
|
|
$
|
122
|
|
$
|
128
|
|
|||
|
(a)
|
A settlement charge is required when the amount of all lump-sum distributions during the year is greater than the sum of the service and interest cost components of the annual net periodic pension cost. In the fourth quarter of 2017 as a result of lump-sum distributions during the 2017 plan year, Xcel Energy recorded a total pension settlement charge of
$81 million
, the majority of which was not recognized due to the effects of regulation. A total of
$8 million
of that amount was recorded in O&M expenses in the fourth quarter of 2017.
|
|
2017
|
2016
|
2015
|
|||||||
|
Significant Assumptions Used to Measure Costs:
|
|||||||||
|
Discount rate
|
4.13
|
%
|
4.66
|
%
|
4.11
|
%
|
|||
|
Expected average long-term increase in compensation level
|
3.75
|
|
4.00
|
|
3.75
|
|
|||
|
Expected average long-term rate of return on assets
|
6.87
|
|
6.87
|
|
7.09
|
|
|||
Pension costs include an expected return impact for the current year that may differ from actual investment performance in the plan. The return assumption used for
2018
pension cost calculations is
6.87 percent
.
Defined Contribution Plans
Xcel Energy maintains 401(k) and other defined contribution plans that cover substantially all employees. Total expense to these plans was approximately
$37 million
in
2017
,
$36 million
in
2016
and
$34 million
in
2015
.
Postretirement Health Care Benefits
Xcel Energy has a contributory health and welfare benefit plan that provides health care and death benefits to certain Xcel Energy retirees.
|
•
|
NSP-Minnesota and NSP-Wisconsin discontinued contributing toward health care benefits for non-bargaining employees retiring after 1998 and for bargaining employees who retired after 1999.
|
|
•
|
Xcel Energy discontinued contributing toward health care benefits for nonbargaining employees of the former NCE who retired after June 30, 2003 and for PSCo bargaining employees hired on or after July 1, 2003.
|
|
•
|
Xcel Energy discontinued contributing toward health care benefits for SPS bargaining employees hired on or after Jan. 1, 2012.
|
Plan Assets —
Certain state agencies that regulate Xcel Energy Inc.’s utility subsidiaries also have issued guidelines related to the funding of postretirement benefit costs. SPS is required to fund postretirement benefit costs for Texas and New Mexico jurisdictional amounts collected in rates. PSCo is required to fund postretirement benefit costs in irrevocable external trusts that are dedicated to the payment of these postretirement benefits. These assets are invested in a manner consistent with the investment strategy for the pension plan.
The following table presents the target postretirement asset allocations for Xcel Energy at Dec. 31 for the upcoming year:
|
2017
|
2016
|
|||||
|
Domestic and international equity securities
|
24
|
%
|
25
|
%
|
||
|
Short-to-intermediate fixed income securities
|
60
|
|
57
|
|
||
|
Alternative investments
|
9
|
|
13
|
|
||
|
Cash
|
7
|
|
5
|
|
||
|
Total
|
100
|
%
|
100
|
%
|
||
118
Xcel Energy bases its investment-return assumption for the postretirement health care fund assets on expected long-term performance for each of the investment types included in its asset portfolio. The assets are invested in a portfolio according to Xcel Energy’s return, liquidity and diversification objectives to provide a source of funding for plan obligations and minimize contributions to the plan, within appropriate levels of risk. The principal mechanism for achieving these objectives is the projected asset allocation given the long-term risk, return, correlation and liquidity characteristics of each particular asset class. There were no significant concentrations of risk in any particular industry, index, or entity. Market volatility can impact even well-diversified portfolios and significantly affect the return levels achieved by postretirement health care assets in any year.
The following tables present, for each of the fair value hierarchy levels, Xcel Energy’s postretirement benefit plan assets that are measured at fair value as of
Dec. 31, 2017
and
2016
:
|
Dec. 31, 2017
|
||||||||||||||||||||
|
(Millions of Dollars)
|
Level 1
|
Level 2
|
Level 3
|
Investments Measured at NAV
|
Total
|
|||||||||||||||
|
Cash equivalents
|
$
|
29
|
|
$
|
—
|
|
$
|
—
|
|
$
|
—
|
|
$
|
29
|
|
|||||
|
Insurance contracts
|
—
|
|
50
|
|
—
|
|
—
|
|
50
|
|
||||||||||
|
Commingled funds:
|
||||||||||||||||||||
|
U.S. equity funds
|
74
|
|
—
|
|
—
|
|
—
|
|
74
|
|
||||||||||
|
U.S fixed income funds
|
34
|
|
—
|
|
—
|
|
—
|
|
34
|
|
||||||||||
|
Emerging market debt funds
|
40
|
|
—
|
|
—
|
|
—
|
|
40
|
|
||||||||||
|
Debt securities:
|
||||||||||||||||||||
|
Government securities
|
—
|
|
57
|
|
—
|
|
—
|
|
57
|
|
||||||||||
|
U.S. corporate bonds
|
—
|
|
63
|
|
—
|
|
—
|
|
63
|
|
||||||||||
|
Non U.S. corporate bonds
|
—
|
|
21
|
|
—
|
|
—
|
|
21
|
|
||||||||||
|
Asset-backed securities
|
—
|
|
23
|
|
—
|
|
—
|
|
23
|
|
||||||||||
|
Mortgage-backed securities
|
—
|
|
34
|
|
—
|
|
—
|
|
34
|
|
||||||||||
|
Equity securities:
|
||||||||||||||||||||
|
Non U.S. equities
|
35
|
|
—
|
|
—
|
|
—
|
|
35
|
|
||||||||||
|
Other
|
—
|
|
1
|
|
—
|
|
—
|
|
1
|
|
||||||||||
|
Total
|
$
|
212
|
|
$
|
249
|
|
$
|
—
|
|
$
|
—
|
|
$
|
461
|
|
|||||
|
Dec. 31, 2016
|
||||||||||||||||||||
|
(Millions of Dollars)
|
Level 1
|
Level 2
|
Level 3
|
Investments Measured at NAV
|
Total
|
|||||||||||||||
|
Cash equivalents
|
$
|
21
|
|
$
|
—
|
|
$
|
—
|
|
$
|
—
|
|
$
|
21
|
|
|||||
|
Insurance contracts
|
—
|
|
47
|
|
—
|
|
—
|
|
47
|
|
||||||||||
|
Commingled funds:
|
||||||||||||||||||||
|
U.S. equity funds
|
54
|
|
—
|
|
—
|
|
—
|
|
54
|
|
||||||||||
|
U.S fixed income funds
|
27
|
|
—
|
|
—
|
|
—
|
|
27
|
|
||||||||||
|
Emerging market debt funds
|
30
|
|
—
|
|
—
|
|
—
|
|
30
|
|
||||||||||
|
Other commingled funds
|
—
|
|
—
|
|
—
|
|
55
|
|
55
|
|
||||||||||
|
Debt securities:
|
||||||||||||||||||||
|
Government securities
|
—
|
|
38
|
|
—
|
|
—
|
|
38
|
|
||||||||||
|
U.S. corporate bonds
|
—
|
|
62
|
|
—
|
|
—
|
|
62
|
|
||||||||||
|
Non U.S. corporate bonds
|
—
|
|
17
|
|
—
|
|
—
|
|
17
|
|
||||||||||
|
Asset-backed securities
|
—
|
|
19
|
|
—
|
|
—
|
|
19
|
|
||||||||||
|
Mortgage-backed securities
|
—
|
|
29
|
|
—
|
|
—
|
|
29
|
|
||||||||||
|
Equity securities:
|
||||||||||||||||||||
|
Non U.S. equities
|
41
|
|
—
|
|
—
|
|
—
|
|
41
|
|
||||||||||
|
Other
|
—
|
|
2
|
|
—
|
|
—
|
|
2
|
|
||||||||||
|
Total
|
$
|
173
|
|
$
|
214
|
|
$
|
—
|
|
$
|
55
|
|
$
|
442
|
|
|||||
There were no assets transferred in or out of Level 3 for the years ended Dec. 31,
2017
,
2016
or
2015
.
119
Benefit Obligations —
A comparison of the actuarially computed benefit obligation and plan assets for Xcel Energy is presented in the following table:
|
(Millions of Dollars)
|
2017
|
2016
|
||||||
|
Change in Projected Benefit Obligation:
|
||||||||
|
Obligation at Jan. 1
|
$
|
603
|
|
$
|
584
|
|
||
|
Service cost
|
2
|
|
2
|
|
||||
|
Interest cost
|
24
|
|
26
|
|
||||
|
Medicare subsidy reimbursements
|
1
|
|
2
|
|
||||
|
Plan participants’ contributions
|
8
|
|
7
|
|
||||
|
Actuarial loss
|
33
|
|
33
|
|
||||
|
Benefit payments
|
(50
|
)
|
(51
|
)
|
||||
|
Obligation at Dec. 31
|
$
|
621
|
|
$
|
603
|
|
||
|
(Millions of Dollars)
|
2017
|
2016
|
||||||
|
Change in Fair Value of Plan Assets:
|
||||||||
|
Fair value of plan assets at Jan. 1
|
$
|
442
|
|
$
|
448
|
|
||
|
Actual return on plan assets
|
41
|
|
20
|
|
||||
|
Plan participants’ contributions
|
8
|
|
7
|
|
||||
|
Employer contributions
|
20
|
|
18
|
|
||||
|
Benefit payments
|
(50
|
)
|
(51
|
)
|
||||
|
Fair value of plan assets at Dec. 31
|
$
|
461
|
|
$
|
442
|
|
||
|
(Millions of Dollars)
|
2017
|
2016
|
||||||
|
Funded Status of Plans at Dec. 31:
|
||||||||
|
Funded status
|
$
|
(160
|
)
|
$
|
(161
|
)
|
||
|
Current liabilities
|
(3
|
)
|
(6
|
)
|
||||
|
Noncurrent liabilities
|
(157
|
)
|
(155
|
)
|
||||
|
Net postretirement amounts recognized on consolidated balance sheets
|
$
|
(160
|
)
|
$
|
(161
|
)
|
||
|
(Millions of Dollars)
|
2017
|
2016
|
||||||
|
Amounts Not Yet Recognized as Components of Net Periodic Benefit Cost:
|
||||||||
|
Net loss
|
$
|
147
|
|
$
|
136
|
|
||
|
Prior service credit
|
(44
|
)
|
(54
|
)
|
||||
|
Total
|
$
|
103
|
|
$
|
82
|
|
||
|
(Millions of Dollars)
|
2017
|
2016
|
||||||
|
Amounts Not Yet Recognized as Components of Net Periodic Benefit Cost Have Been Recorded as Follows Based Upon Expected Recovery in Rates:
|
||||||||
|
Noncurrent regulatory assets
|
$
|
107
|
|
$
|
91
|
|
||
|
Current regulatory liabilities
|
(1
|
)
|
(1
|
)
|
||||
|
Noncurrent regulatory liabilities
|
(10
|
)
|
(14
|
)
|
||||
|
Deferred income taxes
|
2
|
|
2
|
|
||||
|
Net-of-tax accumulated OCI
|
5
|
|
4
|
|
||||
|
Total
|
$
|
103
|
|
$
|
82
|
|
||
|
Measurement date
|
Dec. 31, 2017
|
Dec. 31, 2016
|
||
|
2017
|
2016
|
|||||
|
Significant Assumptions Used to Measure Benefit Obligations:
|
||||||
|
Discount rate for year-end valuation
|
3.62
|
%
|
4.13
|
%
|
||
|
Mortality table
|
RP 2014
|
|
RP 2014
|
|
||
|
Health care costs trend rate — initial: Pre-65
|
7.00
|
%
|
5.50
|
%
|
||
|
Health care costs trend rate — initial: Post-65
|
5.50
|
%
|
5.50
|
%
|
||
120
Beginning with the Dec. 31, 2017 measurement, Xcel Energy Inc. separated its initial medical trend assumption for pre-Medicare (Pre-65) and post-Medicare (Post-65) claims costs in order to reflect different short-term expectations based on recent experience differences. The Post-65 initial medical trend rate was set at
5.5 percent
. The Pre-65 initial medical trend rate was set at
7.0 percent
. The ultimate trend assumption remained at
4.5 percent
for both groups. The period until the ultimate rate is reached is
five years
. Xcel Energy bases its medical trend assumption on the long-term cost inflation expected in the health care market, considering the levels projected and recommended by industry experts, as well as recent actual medical cost increases experienced by Xcel Energy’s retiree medical plan.
A one-percent change in the assumed health care cost trend rate would have the following effects on Xcel Energy:
|
One-Percentage Point
|
||||||||
|
(Millions of Dollars)
|
Increase
|
Decrease
|
||||||
|
APBO
|
$
|
60
|
|
$
|
(51
|
)
|
||
|
Service and interest components
|
3
|
|
(2
|
)
|
||||
Cash Flows —
The postretirement health care plans have no funding requirements under income tax and other retirement-related regulations other than fulfilling benefit payment obligations, when claims are presented and approved under the plans. Additional cash funding requirements are prescribed by certain state and federal rate regulatory authorities. Xcel Energy contributed
$20 million
during
2017
,
$18 million
during
2016
,
$18 million
during
2015
and expects to contribute approximately
$12 million
during
2018
.
Plan Amendments —
In 2017 and 2016, there were no plan amendments made which affected the benefit obligation.
Benefit Costs —
The components of Xcel Energy’s net periodic postretirement benefit costs were:
|
(Millions of Dollars)
|
2017
|
2016
|
2015
|
|||||||||
|
Service cost
|
$
|
2
|
|
$
|
2
|
|
$
|
2
|
|
|||
|
Interest cost
|
24
|
|
26
|
|
25
|
|
||||||
|
Expected return on plan assets
|
(25
|
)
|
(25
|
)
|
(26
|
)
|
||||||
|
Amortization of prior service credit
|
(11
|
)
|
(11
|
)
|
(11
|
)
|
||||||
|
Amortization of net loss
|
7
|
|
4
|
|
6
|
|
||||||
|
Net periodic postretirement (credit) cost
|
$
|
(3
|
)
|
$
|
(4
|
)
|
$
|
(4
|
)
|
|||
|
2017
|
2016
|
2015
|
|||||||
|
Significant Assumptions Used to Measure Costs:
|
|||||||||
|
Discount rate
|
4.13
|
%
|
4.65
|
%
|
4.08
|
%
|
|||
|
Expected average long-term rate of return on assets
|
5.80
|
|
5.80
|
|
5.80
|
|
|||
Projected Benefit Payments
The following table lists Xcel Energy’s projected benefit payments for the pension and postretirement benefit plans:
|
(Millions of Dollars)
|
Projected
Pension Benefit Payments |
Gross Projected
Postretirement Health Care Benefit Payments |
Expected
Medicare Part D Subsidies |
Net Projected
Postretirement Health Care Benefit Payments |
||||||||||||
|
2018
|
$
|
307
|
|
$
|
47
|
|
$
|
2
|
|
$
|
45
|
|
||||
|
2019
|
262
|
|
47
|
|
2
|
|
45
|
|
||||||||
|
2020
|
261
|
|
47
|
|
2
|
|
45
|
|
||||||||
|
2021
|
261
|
|
47
|
|
3
|
|
44
|
|
||||||||
|
2022
|
266
|
|
46
|
|
3
|
|
43
|
|
||||||||
|
2023-2027
|
1,274
|
|
212
|
|
14
|
|
198
|
|
||||||||
121
Multiemployer Plans
NSP-Minnesota and NSP-Wisconsin each contribute to several union multiemployer pension and other postretirement benefit plans, none of which are individually significant. These plans provide pension and postretirement health care benefits to certain union employees who may perform services for multiple employers and do not participate in the NSP-Minnesota and NSP-Wisconsin sponsored pension and postretirement health care plans. Contributing to these types of plans creates risk that differs from providing benefits under NSP-Minnesota and NSP-Wisconsin sponsored plans, in that if another participating employer ceases to contribute to a multiemployer plan, additional unfunded obligations may need to be funded over time by remaining participating employers.
Contributions to multiemployer plans were as follows for the years ended
Dec. 31, 2017
,
2016
and
2015
. The average number of NSP-Minnesota union employees covered by the multiemployer pension plans decreased to approximately
576
in
2017
from
700
in
2016
. There were no other significant changes to the nature or magnitude of the participation of NSP-Minnesota and NSP-Wisconsin in multiemployer plans for the years presented:
|
(Millions of Dollars)
|
2017
|
2016
|
2015
|
|||||||||
|
Multiemployer pension contributions:
|
||||||||||||
|
NSP-Minnesota
|
$
|
12
|
|
$
|
14
|
|
$
|
17
|
|
|||
|
NSP-Wisconsin
|
—
|
|
1
|
|
1
|
|
||||||
|
Total
|
$
|
12
|
|
$
|
15
|
|
$
|
18
|
|
|||
|
10.
|
Other Income, Net
|
Other income, net for the years ended Dec. 31 consisted of the following:
|
(Millions of Dollars)
|
2017
|
2016
|
2015
|
|||||||||
|
Interest income
|
$
|
19
|
|
$
|
8
|
|
$
|
6
|
|
|||
|
Other nonoperating income
|
7
|
|
3
|
|
4
|
|
||||||
|
Insurance policy expense
|
(3
|
)
|
(3
|
)
|
(4
|
)
|
||||||
|
Other income, net
|
$
|
23
|
|
$
|
8
|
|
$
|
6
|
|
|||
11. Fair Value of Financial Assets and Liabilities
Fair Value Measurements
The accounting guidance for fair value measurements and disclosures provides a single definition of fair value and requires certain disclosures about assets and liabilities measured at fair value. A hierarchical framework for disclosing the observability of the inputs utilized in measuring assets and liabilities at fair value is established by this guidance. The three levels in the hierarchy are as follows:
Level 1
—
Quoted prices are available in active markets for identical assets or liabilities as of the reporting date. The types of assets and liabilities included in Level 1 are highly liquid and actively traded instruments with quoted prices.
Level 2
—
Pricing inputs are other than quoted prices in active markets, but are either directly or indirectly observable as of the reporting date. The types of assets and liabilities included in Level 2 are typically either comparable to actively traded securities or contracts, or priced with models using highly observable inputs.
Level 3
—
Significant inputs to pricing have little or no observability as of the reporting date. The types of assets and liabilities included in Level 3 are those valued with models requiring significant management judgment or estimation.
Specific valuation methods include the following:
Cash equivalents
—
The fair values of cash equivalents are generally based on cost plus accrued interest; money market funds are measured using quoted NAV.
122
Investments in equity securities and other funds
—
Equity securities are valued using quoted prices in active markets. The fair values for commingled funds are measured using NAVs, which take into consideration the value of underlying fund investments, as well as the other accrued assets and liabilities of a fund, in order to determine a per-share market value. The investments in commingled funds may be redeemed for NAV with proper notice. Proper notice varies by fund and can range from daily with
one
or two days notice to annually with
90
days notice. Private equity investments require approval of the fund for any unscheduled redemption, and such redemptions may be approved or denied by the fund at its sole discretion. Unscheduled distributions from real estate investments may be redeemed with proper notice, which is typically quarterly with
45
-
90
days notice; however, withdrawals from real estate investments may be delayed or discounted as a result of fund illiquidity.
Investments in debt securities
—
Fair values for debt securities are determined by a third party pricing service using recent trades and observable spreads from benchmark interest rates for similar securities.
Interest rate derivatives
—
The fair values of interest rate derivatives are based on broker quotes that utilize current market interest rate forecasts.
Commodity derivatives
—
The methods used to measure the fair value of commodity derivative forwards and options utilize forward prices and volatilities, as well as pricing adjustments for specific delivery locations, and are generally assigned a Level 2 classification. When contractual settlements relate to inactive delivery locations or extend to periods beyond those readily observable on active exchanges or quoted by brokers, the significance of the use of less observable forecasts of forward prices and volatilities on a valuation is evaluated, and may result in Level 3 classification.
Electric commodity derivatives held by NSP-Minnesota and SPS include transmission congestion instruments, generally referred to as FTRs. FTRs purchased from a RTO are financial instruments that entitle or obligate the holder to monthly revenues or charges based on transmission congestion across a given transmission path. The value of an FTR is derived from, and designed to offset, the cost of transmission congestion. In addition to overall transmission load, congestion is also influenced by the operating schedules of power plants and the consumption of electricity pertinent to a given transmission path. Unplanned plant outages, scheduled plant maintenance, changes in the relative costs of fuels used in generation, weather and overall changes in demand for electricity can each impact the operating schedules of the power plants on the transmission grid and the value of an FTR.
If forecasted costs of electric transmission congestion increase or decrease for a given FTR path, the value of that particular FTR instrument will likewise increase or decrease. Given the limited observability of important inputs to the value of FTRs between auction processes, including expected plant operating schedules and retail and wholesale demand, fair value measurements for FTRs have been assigned a Level 3. Non-trading monthly FTR settlements are included in fuel and purchased energy cost recovery mechanisms as applicable in each jurisdiction, and therefore changes in the fair value of the yet to be settled portions of most FTRs are deferred as a regulatory asset or liability. Given this regulatory treatment and the limited magnitude of FTRs relative to the electric utility operations of NSP-Minnesota and SPS, the numerous unobservable quantitative inputs pertinent to the value of FTRs are insignificant to the consolidated financial statements of Xcel Energy.
Non-Derivative Instruments Fair Value Measurements
The NRC requires NSP-Minnesota to maintain a portfolio of investments to fund the costs of decommissioning its nuclear generating plants. Together with all accumulated earnings or losses, the assets of the nuclear decommissioning fund are legally restricted for the purpose of decommissioning the Monticello and PI nuclear generating plants. The fund contains cash equivalents, debt securities, equity securities and other investments – all classified as available-for-sale. NSP-Minnesota plans to reinvest matured securities until decommissioning begins. NSP-Minnesota uses the MPUC approved asset allocation for the escrow and investment targets by asset class for both the escrow and qualified trust.
NSP-Minnesota recognizes the costs of funding the decommissioning of its nuclear generating plants over the lives of the plants, assuming rate recovery of all costs. Given the purpose and legal restrictions on the use of nuclear decommissioning fund assets, realized and unrealized gains on fund investments over the life of the fund are deferred as an offset of NSP-Minnesota’s regulatory asset for nuclear decommissioning costs. Consequently, any realized and unrealized gains and losses on securities in the nuclear decommissioning fund, including any other-than-temporary impairments, are deferred as a component of the regulatory asset for nuclear decommissioning.
Unrealized gains for the nuclear decommissioning fund were
$560 million
and
$379 million
as of
Dec. 31, 2017
and
2016
, respectively, and unrealized losses and amounts recorded as other-than-temporary impairments were
$7 million
and
$47 million
as of
Dec. 31, 2017
and
2016
, respectively.
123
The following tables present the cost and fair value of Xcel Energy’s non-derivative instruments with recurring fair value measurements in the nuclear decommissioning fund as of
Dec. 31, 2017
and
2016
:
|
Dec. 31, 2017
|
||||||||||||||||||||||||
|
Fair Value
|
||||||||||||||||||||||||
|
(Millions of Dollars)
|
Cost
|
Level 1
|
Level 2
|
Level 3
|
Investments Measured at NAV
|
Total
|
||||||||||||||||||
|
Nuclear decommissioning fund
(a)
|
||||||||||||||||||||||||
|
Cash equivalents
|
$
|
29
|
|
$
|
29
|
|
$
|
—
|
|
$
|
—
|
|
$
|
—
|
|
$
|
29
|
|
||||||
|
Commingled funds:
|
||||||||||||||||||||||||
|
Non U.S. equities
|
264
|
|
217
|
|
—
|
|
—
|
|
90
|
|
307
|
|
||||||||||||
|
Emerging market debt funds
|
156
|
|
—
|
|
—
|
|
—
|
|
166
|
|
166
|
|
||||||||||||
|
Private equity investments
|
141
|
|
—
|
|
—
|
|
—
|
|
198
|
|
198
|
|
||||||||||||
|
Real estate
|
131
|
|
—
|
|
—
|
|
—
|
|
202
|
|
202
|
|
||||||||||||
|
Other commingled funds
|
9
|
|
6
|
|
—
|
|
—
|
|
3
|
|
9
|
|
||||||||||||
|
Debt securities:
|
||||||||||||||||||||||||
|
Government securities
|
68
|
|
—
|
|
69
|
|
—
|
|
—
|
|
69
|
|
||||||||||||
|
U.S. corporate bonds
|
320
|
|
—
|
|
322
|
|
—
|
|
—
|
|
322
|
|
||||||||||||
|
Non U.S. corporate bonds
|
50
|
|
—
|
|
50
|
|
—
|
|
—
|
|
50
|
|
||||||||||||
|
Equity securities:
|
||||||||||||||||||||||||
|
U.S. equities
|
271
|
|
557
|
|
—
|
|
—
|
|
—
|
|
557
|
|
||||||||||||
|
Non U.S. equities
|
152
|
|
234
|
|
—
|
|
—
|
|
—
|
|
234
|
|
||||||||||||
|
Total
|
$
|
1,591
|
|
$
|
1,043
|
|
$
|
441
|
|
$
|
—
|
|
$
|
659
|
|
$
|
2,143
|
|
||||||
|
(a)
|
Reported in nuclear decommissioning fund and other investments on the consolidated balance sheet, which also includes
$140 million
of equity investments in unconsolidated subsidiaries and
$114 million
of rabbi trust assets and miscellaneous investments.
|
|
Dec. 31, 2016
|
||||||||||||||||||||||||
|
Fair Value
|
||||||||||||||||||||||||
|
(Millions of Dollars)
|
Cost
|
Level 1
|
Level 2
|
Level 3
|
Investments Measured at NAV
|
Total
|
||||||||||||||||||
|
Nuclear decommissioning fund
(a)
|
||||||||||||||||||||||||
|
Cash equivalents
|
$
|
20
|
|
$
|
20
|
|
$
|
—
|
|
$
|
—
|
|
$
|
—
|
|
$
|
20
|
|
||||||
|
Commingled funds:
|
||||||||||||||||||||||||
|
Non U.S. equities
|
261
|
|
133
|
|
—
|
|
—
|
|
112
|
|
245
|
|
||||||||||||
|
Emerging market debt funds
|
93
|
|
—
|
|
—
|
|
—
|
|
98
|
|
98
|
|
||||||||||||
|
Commodity funds
|
106
|
|
—
|
|
—
|
|
—
|
|
92
|
|
92
|
|
||||||||||||
|
Private equity investments
|
132
|
|
—
|
|
—
|
|
—
|
|
190
|
|
190
|
|
||||||||||||
|
Real estate
|
129
|
|
—
|
|
—
|
|
—
|
|
188
|
|
188
|
|
||||||||||||
|
Other commingled funds
|
151
|
|
—
|
|
—
|
|
—
|
|
160
|
|
160
|
|
||||||||||||
|
Debt securities:
|
||||||||||||||||||||||||
|
Government securities
|
33
|
|
—
|
|
32
|
|
—
|
|
—
|
|
32
|
|
||||||||||||
|
U.S. corporate bonds
|
105
|
|
—
|
|
106
|
|
—
|
|
—
|
|
106
|
|
||||||||||||
|
Non U.S. corporate bonds
|
22
|
|
—
|
|
21
|
|
—
|
|
—
|
|
21
|
|
||||||||||||
|
Municipal bonds
|
14
|
|
—
|
|
14
|
|
—
|
|
—
|
|
14
|
|
||||||||||||
|
Mortgage-backed securities
|
3
|
|
—
|
|
3
|
|
—
|
|
—
|
|
3
|
|
||||||||||||
|
Equity securities:
|
||||||||||||||||||||||||
|
U.S. equities
|
271
|
|
474
|
|
—
|
|
—
|
|
—
|
|
474
|
|
||||||||||||
|
Non U.S. equities
|
189
|
|
218
|
|
—
|
|
—
|
|
—
|
|
218
|
|
||||||||||||
|
Total
|
$
|
1,529
|
|
$
|
845
|
|
$
|
176
|
|
$
|
—
|
|
$
|
840
|
|
$
|
1,861
|
|
||||||
|
(a)
|
Reported in nuclear decommissioning fund and other investments on the consolidated balance sheet, which also includes
$133 million
of equity investments in unconsolidated subsidiaries and
$98 million
of rabbi trust assets and miscellaneous investments.
|
For the years ended Dec. 31, 2017 and 2016 there were no Level 3 nuclear decommissioning fund investments and no transfers of amounts between levels.
124
The following table summarizes the final contractual maturity dates of the debt securities in the nuclear decommissioning fund, by asset class, as of
Dec. 31, 2017
:
|
Final Contractual Maturity
|
||||||||||||||||||||
|
(Millions of Dollars)
|
Due in 1 Year
or Less
|
Due in 1 to 5
Years
|
Due in 5 to 10
Years
|
Due after 10
Years
|
Total
|
|||||||||||||||
|
Government securities
|
$
|
—
|
|
$
|
2
|
|
$
|
—
|
|
$
|
67
|
|
$
|
69
|
|
|||||
|
U.S. corporate bonds
|
5
|
|
85
|
|
174
|
|
58
|
|
322
|
|
||||||||||
|
Non U.S. corporate bonds
|
—
|
|
15
|
|
31
|
|
4
|
|
50
|
|
||||||||||
|
Debt securities
|
$
|
5
|
|
$
|
102
|
|
$
|
205
|
|
$
|
129
|
|
$
|
441
|
|
|||||
Rabbi Trusts
In June 2016, Xcel Energy established rabbi trusts to provide partial funding for future distributions of its supplemental executive retirement plan and deferred compensation plan. The following table presents the cost and fair value of the assets held in rabbi trusts as of Dec. 31, 2017 and 2016:
|
Dec. 31, 2017
|
||||||||||||||||||||
|
Fair Value
|
||||||||||||||||||||
|
(Millions of Dollars)
|
Cost
|
Level 1
|
Level 2
|
Level 3
|
Total
|
|||||||||||||||
|
Rabbi Trusts
(a)
|
||||||||||||||||||||
|
Cash equivalents
|
$
|
12
|
|
$
|
12
|
|
$
|
—
|
|
$
|
—
|
|
$
|
12
|
|
|||||
|
Mutual funds
|
47
|
|
50
|
|
—
|
|
—
|
|
50
|
|
||||||||||
|
Total
|
$
|
59
|
|
$
|
62
|
|
$
|
—
|
|
$
|
—
|
|
$
|
62
|
|
|||||
|
Dec. 31, 2016
|
||||||||||||||||||||
|
Fair Value
|
||||||||||||||||||||
|
(Millions of Dollars)
|
Cost
|
Level 1
|
Level 2
|
Level 3
|
Total
|
|||||||||||||||
|
Rabbi Trusts
(a)
|
||||||||||||||||||||
|
Cash equivalents
|
$
|
48
|
|
$
|
48
|
|
$
|
—
|
|
$
|
—
|
|
$
|
48
|
|
|||||
|
Mutual funds
|
2
|
|
2
|
|
—
|
|
—
|
|
2
|
|
||||||||||
|
Total
|
$
|
50
|
|
$
|
50
|
|
$
|
—
|
|
$
|
—
|
|
$
|
50
|
|
|||||
|
(a)
|
Reported in nuclear decommissioning fund and other investments on the consolidated balance sheet.
|
Derivative Instruments Fair Value Measurements
Xcel Energy enters into derivative instruments, including forward contracts, futures, swaps and options, for trading purposes and to manage risk in connection with changes in interest rates, utility commodity prices and vehicle fuel prices.
Interest Rate Derivatives —
Xcel Energy enters into various instruments that effectively fix the interest payments on certain floating rate debt obligations or effectively fix the yield or price on a specified benchmark interest rate for an anticipated debt issuance for a specific period. These derivative instruments are generally designated as cash flow hedges for accounting purposes.
As of Dec. 31, 2017, accumulated other comprehensive losses related to interest rate derivatives included
$3 million
of net losses expected to be reclassified into earnings during the next 12 months as the related hedged interest rate transactions impact earnings, including forecasted amounts for unsettled hedges, as applicable.
Wholesale and Commodity Trading Risk —
Xcel Energy Inc.’s utility subsidiaries conduct various wholesale and commodity trading activities, including the purchase and sale of electric capacity, energy, energy-related instruments and natural gas-related instruments, including derivatives. Xcel Energy’s risk management policy allows management to conduct these activities within guidelines and limitations as approved by its risk management committee, which is made up of management personnel not directly involved in the activities governed by this policy.
125
Commodity Derivatives —
Xcel Energy enters into derivative instruments to manage variability of future cash flows from changes in commodity prices in its electric and natural gas operations, as well as for trading purposes. This could include the purchase or sale of energy or energy-related products, natural gas to generate electric energy, natural gas for resale, FTRs, vehicle fuel and weather derivatives.
As of Dec. 31, 2017, Xcel Energy had various vehicle fuel contracts designated as cash flow hedges extending through December 2018. Xcel Energy enters into derivative instruments that mitigate commodity price risk on behalf of electric and natural gas customers, but may not be designated as qualifying hedging transactions. Changes in the fair value of non-trading commodity derivative instruments are recorded in OCI or deferred as a regulatory asset or liability. The classification as a regulatory asset or liability is based on commission approved regulatory recovery mechanisms. Xcel Energy recorded immaterial amounts to income related to the ineffectiveness of cash flow hedges for the years ended Dec. 31, 2017 and 2016.
As of Dec. 31, 2017, net gains related to commodity derivative cash flow hedges recorded as a component of accumulated other comprehensive losses included immaterial net gains expected to be reclassified into earnings during the next 12 months as the hedged transactions occur.
Additionally, Xcel Energy enters into commodity derivative instruments for trading purposes not directly related to commodity price risks associated with serving its electric and natural gas customers. Changes in the fair value of these commodity derivatives are recorded in electric operating revenues, net of amounts credited to customers under margin-sharing mechanisms.
The following table details the gross notional amounts of commodity forwards, options and FTRs as of Dec. 31:
|
(Amounts in Millions)
(a)(b)
|
2017
|
2016
|
||||
|
MWh of electricity
|
68
|
|
47
|
|
||
|
MMBtu of natural gas
|
37
|
|
122
|
|
||
|
(a)
|
Amounts are not reflective of net positions in the underlying commodities.
|
|
(b)
|
Notional amounts for options are included on a gross basis, but are weighted for the probability of exercise.
|
Consideration of Credit Risk and Concentrations —
Xcel Energy continuously monitors the creditworthiness of the counterparties to its interest rate derivatives and commodity derivative contracts prior to settlement, and assesses each counterparty’s ability to perform on the transactions set forth in the contracts. Given this assessment, as well as an assessment of the impact of Xcel Energy’s own credit risk when determining the fair value of derivative liabilities, the impact of credit risk was immaterial to the fair value of unsettled commodity derivatives presented in the consolidated balance sheets.
Xcel Energy Inc. and its subsidiaries employ additional credit risk control mechanisms when appropriate, such as letters of credit, parental guarantees, standardized master netting agreements and termination provisions that allow for offsetting of positive and negative exposures. Credit exposure is monitored and, when necessary, the activity with a specific counterparty is limited until credit enhancement is provided.
Xcel Energy’s utility subsidiaries’ most significant concentrations of credit risk with particular entities or industries are contracts with counterparties to their wholesale, trading and non-trading commodity activities. As of Dec. 31, 2017,
four
of Xcel Energy’s
10
most significant counterparties for these activities, comprising
$45 million
or
29 percent
of this credit exposure, had investment grade credit ratings from S&P’s, Moody’s or Fitch Ratings.
Five
of the
10
most significant counterparties, comprising
$30 million
or
19 percent
of this credit exposure, were not rated by these external agencies, but based on Xcel Energy’s internal analysis, had credit quality consistent with investment grade. Another of these significant counterparties, comprising
$7 million
or
5 percent
of this credit exposure, had credit quality less than investment grade, based on ratings from external analysis.
Eight
of these significant counterparties are municipal or cooperative electric entities or other utilities.
126
Financial Impact of Qualifying Cash Flow Hedges —
The impact of qualifying interest rate and vehicle fuel cash flow hedges on Xcel Energy’s accumulated other comprehensive loss, included in the consolidated statements of common stockholders’ equity and in the consolidated statements of comprehensive income, is detailed in the following table:
|
(Millions of Dollars)
|
2017
|
2016
|
2015
|
|||||||||
|
Accumulated other comprehensive loss related to cash flow hedges at Jan. 1
|
$
|
(51
|
)
|
$
|
(55
|
)
|
$
|
(58
|
)
|
|||
|
After-tax net realized losses on derivative transactions reclassified into earnings
|
3
|
|
4
|
|
3
|
|
||||||
|
Accumulated other comprehensive loss related to cash flow hedges at Dec. 31
|
$
|
(48
|
)
|
$
|
(51
|
)
|
$
|
(55
|
)
|
|||
The following tables detail the impact of derivative activity during the years ended Dec. 31, 2017, 2016 and 2015, on accumulated other comprehensive loss, regulatory assets and liabilities, and income:
|
Year Ended Dec. 31, 2017
|
|||||||||||||||||||||
|
Pre-Tax Fair Value
Gains (Losses) Recognized
During the Period in:
|
Pre-Tax (Gains) Losses
Reclassified into Income
During the Period from:
|
Pre-Tax Gains
(Losses) Recognized
During the Period in Income |
|||||||||||||||||||
|
(Millions of Dollars)
|
Accumulated
Other Comprehensive Loss |
Regulatory
(Assets) and Liabilities |
Accumulated
Other Comprehensive Loss |
Regulatory
Assets and (Liabilities) |
|||||||||||||||||
|
Derivatives designated as cash flow hedges
|
|||||||||||||||||||||
|
Interest rate
|
$
|
—
|
|
$
|
—
|
|
$
|
5
|
|
(a)
|
$
|
—
|
|
$
|
—
|
|
|||||
|
Total
|
$
|
—
|
|
$
|
—
|
|
$
|
5
|
|
$
|
—
|
|
$
|
—
|
|
||||||
|
Other derivative instruments
|
|||||||||||||||||||||
|
Commodity trading
|
$
|
—
|
|
$
|
—
|
|
$
|
—
|
|
$
|
—
|
|
$
|
10
|
|
(b)
|
|||||
|
Electric commodity
|
—
|
|
10
|
|
—
|
|
(15
|
)
|
(c)
|
—
|
|
||||||||||
|
Natural gas commodity
|
—
|
|
(13
|
)
|
—
|
|
3
|
|
(d)
|
(6
|
)
|
(d)
|
|||||||||
|
Total
|
$
|
—
|
|
$
|
(3
|
)
|
$
|
—
|
|
$
|
(12
|
)
|
$
|
4
|
|
||||||
|
Year Ended Dec. 31, 2016
|
|||||||||||||||||||||
|
Pre-Tax Fair Value
Gains Recognized
During the Period in:
|
Pre-Tax (Gains) Losses
Reclassified into Income
During the Period from:
|
Pre-Tax Gains (Losses) Recognized
During the Period in Income |
|||||||||||||||||||
|
(Millions of Dollars)
|
Accumulated
Other Comprehensive Loss |
Regulatory
(Assets) and Liabilities |
Accumulated
Other Comprehensive Loss |
Regulatory
Assets and (Liabilities) |
|||||||||||||||||
|
Derivatives designated as cash flow hedges
|
|||||||||||||||||||||
|
Interest rate
|
$
|
—
|
|
$
|
—
|
|
$
|
6
|
|
(a)
|
$
|
—
|
|
$
|
—
|
|
|||||
|
Total
|
$
|
—
|
|
$
|
—
|
|
$
|
6
|
|
$
|
—
|
|
$
|
—
|
|
||||||
|
Other derivative instruments
|
|||||||||||||||||||||
|
Commodity trading
|
$
|
—
|
|
$
|
—
|
|
$
|
—
|
|
$
|
—
|
|
$
|
2
|
|
(b)
|
|||||
|
Electric commodity
|
—
|
|
17
|
|
—
|
|
(8
|
)
|
(c)
|
—
|
|
||||||||||
|
Natural gas commodity
|
—
|
|
1
|
|
—
|
|
15
|
|
(d)
|
(8
|
)
|
(d)
|
|||||||||
|
Total
|
$
|
—
|
|
$
|
18
|
|
$
|
—
|
|
$
|
7
|
|
$
|
(6
|
)
|
||||||
127
|
Year Ended Dec. 31, 2015
|
|||||||||||||||||||||
|
Pre-Tax Fair Value
Losses Recognized
During the Period in:
|
Pre-Tax Losses
Reclassified into Income
During the Period from:
|
Pre-Tax Losses Recognized
During the Period in Income |
|||||||||||||||||||
|
(Millions of Dollars)
|
Accumulated
Other Comprehensive Loss |
Regulatory
(Assets) and Liabilities |
Accumulated
Other Comprehensive Loss |
Regulatory
Assets and (Liabilities) |
|||||||||||||||||
|
Derivatives designated as cash flow hedges
|
|||||||||||||||||||||
|
Interest rate
|
$
|
—
|
|
$
|
—
|
|
$
|
5
|
|
(a)
|
$
|
—
|
|
$
|
—
|
|
|||||
|
Total
|
$
|
—
|
|
$
|
—
|
|
$
|
5
|
|
$
|
—
|
|
$
|
—
|
|
||||||
|
Other derivative instruments
|
|||||||||||||||||||||
|
Commodity trading
|
$
|
—
|
|
$
|
—
|
|
$
|
—
|
|
$
|
—
|
|
$
|
(7
|
)
|
(b)
|
|||||
|
Electric commodity
|
—
|
|
(19
|
)
|
—
|
|
16
|
|
(c)
|
—
|
|
||||||||||
|
Natural gas commodity
|
—
|
|
(16
|
)
|
—
|
|
16
|
|
(d)
|
(12
|
)
|
(d)
|
|||||||||
|
Total
|
$
|
—
|
|
$
|
(35
|
)
|
$
|
—
|
|
$
|
32
|
|
$
|
(19
|
)
|
||||||
|
(a)
|
Amounts are recorded to interest charges.
|
|
(b)
|
Amounts are recorded to electric operating revenues. Portions of these gains and losses are subject to sharing with electric customers through margin-sharing mechanisms and deducted from gross revenue, as appropriate.
|
|
(c)
|
Amounts are recorded to electric fuel and purchased power. These derivative settlement gains and losses are shared with electric customers through fuel and purchased energy cost-recovery mechanisms, and reclassified out of income as regulatory assets or liabilities, as appropriate.
|
|
(d)
|
Certain derivatives are utilized to mitigate natural gas price risk for electric generation and are recorded to electric fuel and purchased power, subject to cost-recovery mechanisms and reclassified to a regulatory asset, as appropriate. Amounts for the years ended Dec. 31, 2017 and Dec. 31, 2016 included immaterial settlement gains and losses. Amounts for the year ended Dec. 31, 2015 included
$1 million
of settlement losses. The remaining settlement losses for the years ended Dec. 31, 2017, 2016 and 2015 relate to natural gas operations and are recorded to cost of natural gas sold and transported. These losses are subject to cost-recovery mechanisms and reclassified out of income to a regulatory asset, as appropriate.
|
Xcel Energy had
no
derivative instruments designated as fair value hedges during the years ended Dec. 31, 2017, 2016 and 2015. Therefore,
no
gains or losses from fair value hedges or related hedged transactions were recognized for these periods.
Credit Related Contingent Features
—
Contract provisions for derivative instruments that the utility subsidiaries enter, including those accounted for as normal purchase-normal sale contracts and therefore not reflected on the consolidated balance sheets, may require the posting of collateral or settlement of the contracts for various reasons, including if the applicable utility subsidiary’s credit ratings are downgraded below its investment grade credit rating by any of the major credit rating agencies or for cross default contractual provisions that could result in the settlement of such contracts if there was a failure under other financing arrangements related to payment terms or other covenants. As of Dec. 31, 2017 and 2016, there were
no
derivative instruments in a material liability position with such underlying contract provisions.
Certain derivative instruments are also subject to contract provisions that contain adequate assurance clauses. These provisions allow counterparties to seek performance assurance, including cash collateral, in the event that a given utility subsidiary’s ability to fulfill its contractual obligations is reasonably expected to be impaired. Xcel Energy had
no
collateral posted related to adequate assurance clauses in derivative contracts as of Dec. 31, 2017 and 2016.
128
Recurring Fair Value Measurements
— The following table presents for each of the fair value hierarchy levels, Xcel Energy’s derivative assets and liabilities measured at fair value on a recurring basis as of Dec. 31, 2017:
|
Dec. 31, 2017
|
||||||||||||||||||||||||
|
Fair Value
|
Fair Value Total
|
Counterparty
Netting
(b)
|
||||||||||||||||||||||
|
(Millions of Dollars)
|
Level 1
|
Level 2
|
Level 3
|
Total
|
||||||||||||||||||||
|
Current derivative assets
|
||||||||||||||||||||||||
|
Commodity trading
|
$
|
2
|
|
$
|
22
|
|
$
|
—
|
|
$
|
24
|
|
$
|
(15
|
)
|
$
|
9
|
|
||||||
|
Electric commodity
|
—
|
|
—
|
|
32
|
|
32
|
|
(2
|
)
|
30
|
|
||||||||||||
|
Total current derivative assets
|
$
|
2
|
|
$
|
22
|
|
$
|
32
|
|
$
|
56
|
|
$
|
(17
|
)
|
39
|
|
|||||||
|
PPAs
(a)
|
5
|
|
||||||||||||||||||||||
|
Current derivative instruments
|
$
|
44
|
|
|||||||||||||||||||||
|
Noncurrent derivative assets
|
||||||||||||||||||||||||
|
Other derivative instruments:
|
||||||||||||||||||||||||
|
Commodity trading
|
$
|
—
|
|
$
|
31
|
|
$
|
5
|
|
$
|
36
|
|
$
|
(7
|
)
|
$
|
29
|
|
||||||
|
Total noncurrent derivative assets
|
$
|
—
|
|
$
|
31
|
|
$
|
5
|
|
$
|
36
|
|
$
|
(7
|
)
|
29
|
|
|||||||
|
PPAs
(a)
|
19
|
|
||||||||||||||||||||||
|
Noncurrent derivative instruments
|
$
|
48
|
|
|||||||||||||||||||||
|
Dec. 31, 2017
|
||||||||||||||||||||||||
|
Fair Value
|
Fair Value Total
|
Counterparty
Netting
(b)
|
||||||||||||||||||||||
|
(Millions of Dollars)
|
Level 1
|
Level 2
|
Level 3
|
Total
|
||||||||||||||||||||
|
Current derivative liabilities
|
||||||||||||||||||||||||
|
Other derivative instruments:
|
||||||||||||||||||||||||
|
Commodity trading
|
$
|
2
|
|
$
|
18
|
|
$
|
—
|
|
$
|
20
|
|
$
|
(15
|
)
|
$
|
5
|
|
||||||
|
Electric commodity
|
—
|
|
—
|
|
2
|
|
2
|
|
(2
|
)
|
—
|
|
||||||||||||
|
Natural gas commodity
|
—
|
|
1
|
|
—
|
|
1
|
|
—
|
|
1
|
|
||||||||||||
|
Total current derivative liabilities
|
$
|
2
|
|
$
|
19
|
|
$
|
2
|
|
$
|
23
|
|
$
|
(17
|
)
|
6
|
|
|||||||
|
PPAs
(a)
|
23
|
|
||||||||||||||||||||||
|
Current derivative instruments
|
$
|
29
|
|
|||||||||||||||||||||
|
Noncurrent derivative liabilities
|
||||||||||||||||||||||||
|
Other derivative instruments:
|
||||||||||||||||||||||||
|
Commodity trading
|
$
|
—
|
|
$
|
24
|
|
$
|
—
|
|
$
|
24
|
|
$
|
(10
|
)
|
$
|
14
|
|
||||||
|
Total noncurrent derivative liabilities
|
$
|
—
|
|
$
|
24
|
|
$
|
—
|
|
$
|
24
|
|
$
|
(10
|
)
|
14
|
|
|||||||
|
PPAs
(a)
|
112
|
|
||||||||||||||||||||||
|
Noncurrent derivative instruments
|
$
|
126
|
|
|||||||||||||||||||||
|
(a)
|
During 2006, Xcel Energy qualified these contracts under the normal purchase exception. Based on this qualification, the contracts are no longer adjusted to fair value and the previous carrying value of these contracts will be amortized over the remaining contract lives along with the offsetting regulatory assets and liabilities.
|
|
(b)
|
Xcel Energy nets derivative instruments and related collateral in its consolidated balance sheet when supported by a legally enforceable master netting agreement, and all derivative instruments and related collateral amounts were subject to master netting agreements as of Dec. 31, 2017. At Dec. 31, 2017, derivative assets and liabilities include
no
obligations to return cash collateral and rights to reclaim cash collateral of
$3 million
. The counterparty netting amounts presented exclude settlement receivables and payables and non-derivative amounts that may be subject to the same master netting agreements.
|
129
The following table presents for each of the fair value hierarchy levels, Xcel Energy’s derivative assets and liabilities measured at fair value on a recurring basis as of Dec. 31, 2016:
|
Dec. 31, 2016
|
||||||||||||||||||||||||
|
|
Fair Value
|
Fair Value Total
|
Counterparty
Netting
(b)
|
|
||||||||||||||||||||
|
(Millions of Dollars)
|
Level 1
|
Level 2
|
Level 3
|
Total
|
||||||||||||||||||||
|
Current derivative assets
|
||||||||||||||||||||||||
|
Other derivative instruments:
|
||||||||||||||||||||||||
|
Commodity trading
|
$
|
13
|
|
$
|
14
|
|
$
|
—
|
|
$
|
27
|
|
$
|
(20
|
)
|
$
|
7
|
|
||||||
|
Electric commodity
|
—
|
|
—
|
|
19
|
|
19
|
|
(2
|
)
|
17
|
|
||||||||||||
|
Natural gas commodity
|
—
|
|
9
|
|
—
|
|
9
|
|
—
|
|
9
|
|
||||||||||||
|
Total current derivative assets
|
$
|
13
|
|
$
|
23
|
|
$
|
19
|
|
$
|
55
|
|
$
|
(22
|
)
|
33
|
|
|||||||
|
PPAs
(a)
|
5
|
|
||||||||||||||||||||||
|
Current derivative instruments
|
$
|
38
|
|
|||||||||||||||||||||
|
Noncurrent derivative assets
|
||||||||||||||||||||||||
|
Other derivative instruments:
|
||||||||||||||||||||||||
|
Commodity trading
|
$
|
—
|
|
$
|
31
|
|
$
|
—
|
|
$
|
31
|
|
$
|
(7
|
)
|
$
|
24
|
|
||||||
|
Natural gas commodity
|
—
|
|
2
|
|
—
|
|
2
|
|
—
|
|
2
|
|
||||||||||||
|
Total noncurrent derivative assets
|
$
|
—
|
|
$
|
33
|
|
$
|
—
|
|
$
|
33
|
|
$
|
(7
|
)
|
26
|
|
|||||||
|
PPAs
(a)
|
24
|
|
||||||||||||||||||||||
|
Noncurrent derivative instruments
|
$
|
50
|
|
|||||||||||||||||||||
|
Dec. 31, 2016
|
||||||||||||||||||||||||
|
|
Fair Value
|
Fair Value Total
|
Counterparty
Netting
(b)
|
|
||||||||||||||||||||
|
(Millions of Dollars)
|
Level 1
|
Level 2
|
Level 3
|
Total
|
||||||||||||||||||||
|
Current derivative liabilities
|
||||||||||||||||||||||||
|
Other derivative instruments:
|
||||||||||||||||||||||||
|
Commodity trading
|
$
|
14
|
|
$
|
11
|
|
$
|
—
|
|
$
|
25
|
|
$
|
(21
|
)
|
$
|
4
|
|
||||||
|
Electric commodity
|
—
|
|
—
|
|
2
|
|
2
|
|
(2
|
)
|
—
|
|
||||||||||||
|
Total current derivative liabilities
|
$
|
14
|
|
$
|
11
|
|
$
|
2
|
|
$
|
27
|
|
$
|
(23
|
)
|
4
|
|
|||||||
|
PPAs
(a)
|
23
|
|
||||||||||||||||||||||
|
Current derivative instruments
|
$
|
27
|
|
|||||||||||||||||||||
|
Noncurrent derivative liabilities
|
||||||||||||||||||||||||
|
Other derivative instruments:
|
||||||||||||||||||||||||
|
Commodity trading
|
$
|
—
|
|
$
|
24
|
|
$
|
—
|
|
$
|
24
|
|
$
|
(11
|
)
|
$
|
13
|
|
||||||
|
Total noncurrent derivative liabilities
|
$
|
—
|
|
$
|
24
|
|
$
|
—
|
|
$
|
24
|
|
$
|
(11
|
)
|
13
|
|
|||||||
|
PPAs
(a)
|
135
|
|
||||||||||||||||||||||
|
Noncurrent derivative instruments
|
$
|
148
|
|
|||||||||||||||||||||
|
(a)
|
During 2006, Xcel Energy qualified these contracts under the normal purchase exception. Based on this qualification, the contracts are no longer adjusted to fair value and the previous carrying value of these contracts will be amortized over the remaining contract lives along with the offsetting regulatory assets and liabilities.
|
|
(b)
|
Xcel Energy nets derivative instruments and related collateral in its consolidated balance sheet when supported by a legally enforceable master netting agreement, and all derivative instruments and related collateral amounts were subject to master netting agreements as of Dec. 31, 2016. At Dec. 31, 2016, derivative assets and liabilities include
no
obligations to return cash collateral and rights to reclaim cash collateral of
$4 million
. The counterparty netting amounts presented exclude settlement receivables and payables and non-derivative amounts that may be subject to the same master netting agreements.
|
130
The following table presents the changes in Level 3 commodity derivatives for the years ended Dec. 31, 2017, 2016 and 2015:
|
Year Ended Dec. 31
|
||||||||||||
|
(Millions of Dollars)
|
2017
|
2016
|
2015
|
|||||||||
|
Balance at Jan. 1
|
$
|
17
|
|
$
|
18
|
|
$
|
56
|
|
|||
|
Purchases
|
82
|
|
35
|
|
64
|
|
||||||
|
Settlements
|
(97
|
)
|
(89
|
)
|
(70
|
)
|
||||||
|
Net transactions recorded during the period:
|
||||||||||||
|
Gains recognized in earnings
(a)
|
5
|
|
—
|
|
2
|
|
||||||
|
Net gains (losses) recognized as regulatory assets and liabilities
|
28
|
|
53
|
|
(34
|
)
|
||||||
|
Balance at Dec. 31
|
$
|
35
|
|
$
|
17
|
|
$
|
18
|
|
|||
|
(a)
|
These amounts relate to commodity derivatives held at the end of the period.
|
Xcel Energy recognizes transfers between levels as of the beginning of each period. There were
no
transfers of amounts between levels for derivative instruments for the years ended Dec. 31, 2017, 2016 and 2015.
Fair Value of Long-Term Debt
As of Dec. 31,
2017
and
2016
, other financial instruments for which the carrying amount did not equal fair value were as follows:
|
2017
|
2016
|
|||||||||||||||
|
(Millions of Dollars)
|
Carrying Amount
|
Fair Value
|
Carrying Amount
|
Fair Value
|
||||||||||||
|
Long-term debt, including current portion
|
$
|
14,976
|
|
$
|
16,531
|
|
$
|
14,450
|
|
$
|
15,513
|
|
||||
The fair value of Xcel Energy’s long-term debt is estimated based on recent trades and observable spreads from benchmark interest rates for similar securities. The fair value estimates are based on information available to management as of Dec. 31,
2017
and
2016
, and given the observability of the inputs to these estimates, the fair values presented for long-term debt have been assigned a Level 2.
12. Rate Matters
Tax Reform
—
Regulatory Proceedings
The specific impacts of the TCJA on retail customer rates are subject to regulatory approval. Xcel Energy is in the process of quantifying the rate impacts of the TCJA and addressing these impacts in its open and recently concluded proceedings focused on retail base rate impacts for its utility subsidiaries. In addition, several states have opened dockets on the impact of tax reform, with the expectation that currently effective rates in those jurisdictions will be adjusted.
NSP-Minnesota
— A docket has been opened in Minnesota. NSP-Minnesota will provide a detailed filing to the MPUC by March 2, 2018, which will estimate the impact of the TCJA on the latest electric and natural gas rate case filings and corporate forecasts.
Dockets have also been opened in North Dakota and South Dakota. In February 2018, NSP-Minnesota provided the NDPSC a preliminary quantification of the impact of the TCJA on electric and natural gas revenue requirements. NSP-Minnesota proposed multi-year moratoriums on electric and natural gas rate case filings. NSP-Minnesota also filed comments with the SDPUC and proposed using the reduced revenue requirements from the TCJA to defer planned future rate filings.
NSP-Wisconsin
— In January 2018, the PSCW issued an order requiring public utilities to apply deferred accounting for the impacts of the TCJA. The PSCW has also requested that utilities provide responses to questions on tax reform and its impact on electric and natural gas revenue requirements. In February 2018, NSP-Wisconsin proposed levelizing upcoming rate cases, advancing infrastructure investments and buying down assets such as the regulatory asset for Ashland clean-up.
131
PSCo
— The impacts associated with the TCJA on PSCO’s retail customer rates are being addressed in several proceedings, which include the following:
|
•
|
Colorado Statewide TCJA Proceeding
— On Jan. 31, 2018, the CPUC opened a statewide TCJA proceeding and ordered deferred accounting for all investor-owned utilities. On Feb. 21, 2017, PSCo filed a response with the CPUC related to the deferred accounting order and statewide TCJA proceeding, addressing the estimated impacts along with other considerations given PSCo’s pending natural gas and electric rate cases.
|
|
•
|
Colorado 2017 Multi-Year Natural Gas Rate Case
— On Feb. 14, 2018, the ALJ approved PSCo and CPUC Staff’s non-unanimous settlement agreement which addresses the impacts of the TCJA in 2018. This settlement agreement includes a
$20 million
reduction to provisional rates effective March 1, 2018, with future true-ups to be determined later in 2018 once a full analysis of the comprehensive impacts of tax reform is performed, including any outcomes associated with statewide proceeding. The final true-up would provide customers the full net benefit of the TCJA effective Jan. 1, 2018.
|
|
•
|
Colorado 2017 Multi-Year Electric Rate Case
— On Feb. 16, 2018, the CPUC denied the proposed settlement agreement between PSCo and several intervenors, in favor of the state TCJA proceeding. In the second quarter of 2018, PSCo plans to file a revised rate request that will include the impacts of the TCJA. Provisional rates, subject to refund with interest, are expected to be effective June 1, 2018. The appropriate test year and the final approved revenue requirement will be determined in the pending rate case, discussed below. PSCo expects to defer the TCJA net benefits for the first
five months
of 2018, prior to provisional rates.
|
The CPUC is expected to rule on the regulatory treatment of the TCJA, the natural gas rate case and the electric rate case later in 2018.
SPS
— On Jan. 25, 2018, the PUCT issued an order requiring utilities to apply deferred accounting for the impacts of the TCJA. On Feb. 16, 2018, SPS provided the PUCT supplemental testimony on the impacts of the TCJA for its ongoing Texas 2017 electric rate case, including increasing its equity ratio to
58 percent
to offset the negative impact of the TCJA on its credit metrics and potentially its credit ratings.
In February 2018, SPS provided the NMPRC a preliminary quantification of the impacts of the TCJA on its ongoing New Mexico 2017 electric rate case. SPS also recommended increasing its equity ratio to
58 percent
to offset the negative impact of the TCJA on its credit metrics and potentially its credit ratings. In a separate NMPRC investigation into the impacts of the TCJA on regulated utilities in New Mexico, SPS provided additional information on the impacts of the TCJA on 2018 operations on Feb. 23, 2018.
FERC Formula Rates
— The FERC has not yet issued guidance on how and when utilities should reflect the impacts of the TCJA in formula rates. However, FERC-approved formula rates for wholesale customers are generally adjusted on an annual basis for certain changes in rate base and actual operating expenses, including income taxes. As a result, these revenues would be subject to an automatic reduction for the effect of the TCJA tax rate change, absent specific FERC action.
NSP-Minnesota and NSP-Wisconsin were parties to a February 2018 FERC filing by MISO and MISO TOs proposing to early commence reductions to transmission formula rates in 2018 for tax rate impacts of the TCJA. Also in February 2018, PSCo made a filing with FERC similarly requesting early reductions in its transmission and production formula rates in 2018 for tax rate impacts of the TCJA. For SPS, as the TCJA tax rate change largely offsets a depreciation rate change that was effective Jan. 1, 2018 in its wholesale production rates, SPS has notified FERC that it will continue to charge rates established in 2017, subject to refund. FERC has not issued any orders on these matters, or commenced any formula rate proceedings related the impacts of the TCJA.
NSP-Minnesota
Pending and Recently Concluded Regulatory Proceedings — MPUC
Minnesota 2016 Multi-Year Electric Rate Case
— In June 2017, the MPUC issued a written order approving an estimated total rate increase of approximately
$240 million
over the four-year period covering 2016-2019.
132
Key terms:
|
•
|
Four
-year period covering 2016-2019;
|
|
•
|
Annual sales true-up with decoupling subject to a
3 percent
cap on surcharges;
|
|
•
|
In February 2018, NSP-Minnesota reported the 2017 sales true-up and revenue decoupling surcharge amounts of
$22 million
and
$27 million
, respectively, to be collected beginning April 1, 2018 through March 31, 2019.
|
|
•
|
ROE of
9.2 percent
and an equity ratio of
52.5 percent
;
|
|
•
|
Nuclear related costs will not be considered provisional;
|
|
•
|
Continued use of all existing electric riders, however no new electric riders may be utilized during the
four
-year term;
|
|
•
|
Deferral of incremental 2016 property tax expense above a fixed threshold to 2018 and 2019;
|
|
•
|
Four
-year stay out provision for rate cases;
|
|
•
|
Property tax true-up mechanism for 2017-2019; and
|
|
•
|
Capital expenditure true-up mechanism for 2016-2019.
|
|
(Millions of Dollars, incremental)
|
2016
|
2017
|
2018
|
2019
|
Total
|
|||||||||||||||
|
Revenues
|
$
|
75
|
|
$
|
55
|
|
$
|
—
|
|
$
|
50
|
|
$
|
180
|
|
|||||
|
NSP-Minnesota’s sales true-up
|
60
|
|
—
|
|
—
|
|
—
|
|
60
|
|
||||||||||
|
Total rate impact
|
$
|
135
|
|
$
|
55
|
|
$
|
—
|
|
$
|
50
|
|
$
|
240
|
|
|||||
Monticello Prudence Investigation
— In 2013, NSP-Minnesota completed the Monticello LCM/EPU project. The multi-year project extended the life of the facility and increased the capacity from
600
to
671
MW in 2015. The Monticello LCM/EPU project expenditures were approximately
$665 million
. Total capitalized costs were approximately
$748 million
, which includes AFUDC. In 2008, project expenditures were initially estimated at approximately
$320 million
, excluding AFUDC.
In 2015, the MPUC voted to allow for full recovery, including a return, on
$415 million
of the total plant costs (inclusive of AFUDC), but only allow recovery of the remaining
$333 million
of costs with no return on this portion of the investment. As a result, Xcel Energy recorded a pre-tax loss of
$129 million
in the first quarter of 2015, after which the remaining book value of the Monticello project represented the present value of the estimated future cash flows.
2017 and 2018 TCR Filing
— In November 2017, NSP-Minnesota submitted a TCR filing with the MPUC, requesting a combined recovery of approximately
$110 million
of transmission investment costs not included in electric base rates for 2017 and 2018. In accordance with NSP-Minnesota’s most recent electric rate case,
three
CapX2020 transmission projects currently included in the TCR rider remain in the rider through the multi-year plan period. NSP-Minnesota has also proposed recovery of
one
additional project related to grid modernization. An MPUC decision is expected in 2018.
Electric, Purchased Gas and Resource Adjustment Clauses
CIP and CIP Rider
— CIP expenses are recovered through base rates and a rider that is adjusted annually. The estimated electric and natural gas incentives for 2017 are expected to be
$32 million
and
$3 million
, respectively, based on the approved savings goals in NSP-Minnesota’s CIP Triennial Plan. The plan sets an annual electric goal of saving the equivalent of
1.5 percent
of the volume of electric energy sales and an annual natural gas goal of saving
1.0 percent
of the volume of gas energy sales. In 2017 the MPUC approved the following for NSP-Minnesota:
|
•
|
The 2016 CIP electric and natural gas financial incentives totaling
$48 million
and
$6 million
, respectively; and
|
|
•
|
The proposed 2017 electric and natural gas CIP riders with estimated 2017 recovery of
$59 million
of electric CIP expenses and
$18 million
of natural gas CIP expenses. The proposed recovery through the riders is in addition to an estimated
$89 million
and
$4 million
through electric and gas base rates, respectively.
|
GUIC Rider
— In February 2018, the MPUC approved a 2017 revenue requirement of approximately
$20 million
for GUIC investments. New rates are expected to be in effect in March 2018. In November 2017, NSP-Minnesota filed the 2018 GUIC rider with the MPUC requesting recovery of approximately
$28 million
from Minnesota gas utility customers. Costs in both filings include funding for pipeline assessments as well as deferred costs from NSP-Minnesota’s existing sewer separation and pipeline integrity management programs. The MPUC is currently considering the 2018 petition.
133
Annual Automatic Adjustment of Fuel Clause Charges
—
In May 2017, the MPUC voted to disallow approximately
$4 million
of replacement energy costs for the PI nuclear facility outages allocated to the Minnesota jurisdiction in 2015. This disallowance was recognized in the second quarter of 2017. In December 2017, the MPUC issued an order to hold utilities responsible for incremental costs of replacement power incurred due to unplanned outages under certain circumstances. In January 2018, NSP-Minnesota filed a petition for clarification of the order. The outcome of the petition is uncertain.
NSP-Wisconsin
Recently Concluded Regulatory Proceedings — PSCW
Wisconsin 2018 Electric and Gas Rate Case
—
In May 2017, NSP-Wisconsin filed a request with the PSCW
to increase electric rates by
$25 million
, or
3.6 percent
, and natural gas rates by
$12 million
, or
10.1 percent
, effective Jan. 1, 2018. The rate filing was based on a 2018 FTY, a ROE of
10.0 percent
, an equity ratio of
52.53 percent
and a forecasted rate base of approximately
$1.2 billion
for the electric utility and
$138 million
for the natural gas utility.
In December 2017, the PSCW approved electric and natural gas rate increases of approximately
$9 million
, or
1.4 percent
, and
$10 million
, or
8.3 percent
, respectively, based on a
9.8 percent
ROE and an equity ratio of
51.45 percent
. New rates went into effect on Jan. 1, 2018.
PSCo
Pending Regulatory Proceedings — CPUC
Colorado 2017 Multi-Year Electric Rate Case
— In October 2017, PSCo filed a multi-year request with the CPUC seeking to increase electric rates approximately
$245 million
over
four years
. The request, summarized below, is based on FTY ending Dec. 31, a
10.0 percent
ROE and an equity ratio of
55.25 percent
.
|
Revenue Request (Millions of Dollars)
|
2018
|
2019
|
2020
|
2021
|
Total
|
|||||||||||||||
|
Revenue request
|
$
|
74
|
|
$
|
75
|
|
$
|
60
|
|
$
|
36
|
|
$
|
245
|
|
|||||
|
CACJA revenue conversion to base rates
(a)
|
90
|
|
—
|
|
—
|
|
—
|
|
90
|
|
||||||||||
|
TCA revenue conversion to base rates
(a)
|
43
|
|
—
|
|
—
|
|
—
|
|
43
|
|
||||||||||
|
Total
(b)
|
$
|
207
|
|
$
|
75
|
|
$
|
60
|
|
$
|
36
|
|
$
|
378
|
|
|||||
|
Expected year-end rate base (billions of dollars)
(b)
|
$
|
6.8
|
|
$
|
7.1
|
|
$
|
7.3
|
|
$
|
7.4
|
|
||||||||
|
(a)
|
The roll-in of the TCA and CACJA rider revenues into base rates will not have an impact on customer bills or revenue as these costs are already being recovered through a rider. Transmission investments for 2019-2021 will be recovered through the TCA rider.
|
|
(b)
|
This base rate request does not include the impacts of the RESA and ECA for the Rush Creek wind investments or the proposed CEP.
|
Key dates in the procedural schedule are as follows:
|
•
|
Supplemental direct testimony — April 16, 2018;
|
|
•
|
Answer testimony — May 31, 2018;
|
|
•
|
Rebuttal and cross-answer testimony — July 10, 2018;
|
|
•
|
Hearings — Aug. 21 - 31, 2018; and
|
|
•
|
Statement of position — Sept. 28, 2018.
|
Interim rates, subject to refund and interest, are to be effective on June 1, 2018. PSCo also proposed a stay-out provision and earnings test through 2021. On Jan. 31, 2018, the CPUC ordered deferred accounting for the impacts of TCJA and opened a statewide TCJA proceeding, as discussed above. In the second quarter of 2018, PSCo plans to file a revised rate request that will include the impacts of the TCJA. The CPUC is expected to rule on the regulatory treatment of the TCJA and the electric rate case later in 2018.
134
Colorado 2017 Multi-Year Natural Gas Rate Case
— In June 2017, PSCo filed a multi-year request with the CPUC seeking to increase retail natural gas rates approximately
$139 million
over
three years
. The request, detailed below, is based on FTYs, a
10.0 percent
ROE and an equity ratio of
55.25 percent
.
|
Revenue Request (Millions of Dollars)
|
2018
|
2019
|
2020
|
Total
|
||||||||||||
|
Revenue request
|
$
|
63
|
|
$
|
33
|
|
$
|
43
|
|
$
|
139
|
|
||||
|
PSIA revenue conversion to base rates
(a)
|
—
|
|
94
|
|
—
|
|
94
|
|
||||||||
|
Total
|
$
|
63
|
|
$
|
127
|
|
$
|
43
|
|
$
|
233
|
|
||||
|
Expected year-end rate base (billions of dollars)
(b)
|
$
|
1.5
|
|
$
|
2.3
|
|
$
|
2.4
|
|
|||||||
|
(a)
|
The roll-in of PSIA rider revenue into base rates will not have an impact on customer bills or revenue as these costs are already being recovered through the rider. The recovery of incremental PSIA related investments in 2019 and 2020 are included in the base rate request.
|
|
(b)
|
The additional rate base in 2019 predominantly reflects the roll-in of capital associated with the PSIA rider.
|
In October 2017, several parties filed answer testimony. The CPUC Staff (Staff) and the OCC, recommended a single 2016 HTY, based on an average
13
-month rate base, and opposed a multi-year request. The Staff and OCC recommended an equity capital structure of
48.73 percent
and
51.2 percent
, respectively. Both the Staff and the OCC recommended the existing PSIA rider expire with the 2018 rates rolled into base rates beginning Jan. 1, 2019. Planned investments in 2019 and 2020 would be recoverable through base rates, subject to a future rate case. The final positions of the Staff and OCC provide for a recommended 2018 rate increase of approximately
$30 million
and
$39 million
, respectively.
In December 2017, hearings before an ALJ were held and the evidentiary record for the case was closed. Provisional rates, subject to refund, were implemented on Jan. 1, 2018. As discussed above, PSCo and the CPUC Staff filed a non-unanimous settlement agreement to address the impacts of the TCJA on rates to be effective in 2018, which was approved by the ALJ. On Jan. 31, 2018, the CPUC ordered deferred accounting for the impacts of TCJA and opened a statewide TCJA proceeding, as discussed above. The CPUC is expected to rule on the regulatory treatment of the TCJA and the natural gas rate case later in 2018.
Annual Electric Earnings Test
— PSCo must share with customers earnings that exceed the authorized ROE of
9.83 percent
for 2015 through 2017, as part of an annual earnings test. PSCo estimates the 2017 earnings test will not result in a customer refund obligation. PSCo will file its 2017 earnings test with the CPUC in April 2018. The final sharing obligation, if any, will be based on the CPUC approved tariff and could vary from the current estimate.
Electric, Purchased Gas and Resource Adjustment Clauses
DSM and the DSMCA riders
— Energy efficiency and DSM costs are recovered through a combination of the DSMCA riders and base rates. DSMCA riders are adjusted biannually to capture program costs, performance incentives, and any over- or under-recoveries are trued-up in the following year. Performance incentives are awarded in the year following plan achievements. PSCo is able to earn
$5 million
upon reaching its annual savings goal along with an incentive on
five percent
of net economic benefits up to a maximum annual incentive of
$30 million
. In 2017, PSCo earned an electric and natural gas DSM incentive of
$11 million
and
$3 million
, respectively, for achieving its 2016 electric and natural gas savings goals. For 2018, the electric energy savings goal is
400
GWh with a spending limit of
$84 million
.
135
SPS
Pending and Recently Concluded Regulatory Proceedings — PUCT
Appeal of the Texas 2015 Electric Rate Case Decision
— In 2014, SPS had requested an overall retail electric revenue rate increase of
$42 million
. In 2015, the PUCT approved an overall rate decrease of approximately
$4 million
, net of rate case expenses. In April 2016, SPS filed an appeal with the Texas State District Court (District Court) challenging the PUCT’s order that had denied SPS’ request for rehearing on certain items in SPS’ Texas 2015 electric rate case related to capital structure, incentive compensation and wholesale load reductions. In March 2017, the District Court denied SPS’ appeal. In April 2017, SPS appealed the District Court’s decision to the Court of Appeals. A decision is pending.
Texas 2017 Electric Rate Case
— In 2017, SPS filed a
$55 million
, or
5.8 percent
, retail electric, non-fuel base rate increase case in Texas with each of its Texas municipalities and the PUCT. The request was based on the
12
-month period ended June 30, 2017, with the final
three months
based on estimates, a requested ROE of
10.25 percent
, a Texas retail electric rate base of approximately
$1.9 billion
and an equity ratio of
53.97 percent
.
The following table summarizes SPS’ rate increase request:
|
Revenue Request (Millions of Dollars)
|
||||
|
Incremental revenue request
|
$
|
69
|
|
|
|
TCRF revenue conversion to base rates
(a)
|
(14
|
)
|
||
|
Net revenue increase request
|
$
|
55
|
|
|
|
(a)
|
The roll-in of the TCRF rider revenue into base rates will not have an impact on customer bills or revenue as these costs are already being recovered through the rider. SPS can request another TCRF rider after the conclusion of this rate case to recover transmission investments subsequent to June 30, 2017.
|
Key dates in the revised procedural schedule are as follows:
|
•
|
Intervenors’ direct testimony — April 25, 2018;
|
|
•
|
PUCT Staff direct testimony — May 2, 2018;
|
|
•
|
PUCT Staff and intervenors’ cross-rebuttal testimony — May 14, 2018;
|
|
•
|
SPS’ rebuttal testimony — May 23, 2018; and
|
|
•
|
Hearings — June 4 - 14, 2018.
|
The final rates are expected to be effective retroactive to Jan. 23, 2018 through a customer surcharge. A PUCT decision is expected in the fourth quarter of 2018. As discussed above, the PUCT has opened a docket on the impact of the TCJA, which may have a significant impact on this rate case. On Feb. 16, 2018, SPS provided additional information on the impacts of the TCJA.
Pending Regulatory Proceedings — NMPRC
Appeal of the New Mexico 2016 Electric Rate Case Dismissal
— In November 2016, SPS filed an electric rate case with the NMPRC seeking an increase in base rates of approximately
$41 million
, representing a total revenue increase of approximately
10.9 percent
. The rate filing was based on a requested ROE of
10.1 percent
, an equity ratio of
53.97 percent
, an electric rate base of approximately
$832 million
and a FTY ending June 30, 2018. In April 2017, the NMPRC dismissed SPS’ rate case. In May 2017, SPS filed a notice of appeal to the New Mexico Supreme Court. A decision is pending.
New Mexico 2017 Electric Rate Case
— In October 2017, SPS filed an electric rate case with the NMPRC seeking an increase in retail electric base rates of approximately
$43 million
. The request is based on a HTY ended June 30, 2017, a ROE of
10.25 percent
, an equity ratio of
53.97 percent
and a jurisdictional rate base of approximately
$885 million
, including rate base additions through Nov. 30, 2017. This rate case also takes into account the decline in sales of
380
MW in 2017 from certain wholesale customers and seeks to adjust the life of SPS’ Tolk power plant (Unit 1 from 2042 to 2032 and Unit 2 from 2045 to 2032).
136
Key dates in the procedural schedule are as follows:
|
•
|
Staff and intervenor direct testimony — April 13, 2018;
|
|
•
|
SPS’ rebuttal testimony — May 2, 2018; and
|
|
•
|
Hearings — May 15 - 25, 2018.
|
SPS anticipates a decision and implementation of final rates in the second half of 2018. As discussed above, the NMPRC has opened a docket on the impact of the TCJA, which may have a significant impact on this rate case.
Pending Regulatory Proceedings — FERC
MISO ROE Complaints/ROE Adder
— In November 2013, a group of customers filed a complaint at the FERC against MISO TOs, including NSP-Minnesota and NSP-Wisconsin. The complaint argued for a reduction in the ROE in transmission formula rates in the MISO region from
12.38 percent
to
9.15 percent
, and the removal of ROE adders (including those for RTO membership), effective Nov. 12, 2013.
In December 2015, an ALJ recommended the FERC approve a base ROE of
10.32 percent
for the MISO TOs. The ALJ found the existing
12.38 percent
ROE to be unjust and unreasonable. The recommended
10.32 percent
ROE applied a FERC ROE policy adopted in a June 2014 order (Opinion 531). The FERC approved the ALJ recommended
10.32 percent
base ROE in an order issued in September 2016. This ROE would be applicable for Nov. 12, 2013 to Feb. 11, 2015, and prospectively from the date of the FERC order. The total prospective ROE would be
10.82 percent
, including a
50
basis point adder for RTO membership. Various parties requested rehearing of the September 2016 order. The requests are pending FERC action.
In February 2015, a second complaint seeking to reduce the MISO ROE from
12.38 percent
to
8.67 percent
prior to any adder was filed with the FERC, resulting in a second period of potential refund from Feb. 12, 2015 to May 11, 2016. In June 2016, the ALJ recommended a ROE of
9.7 percent
, applying the methodology adopted by the FERC in Opinion 531. In April 2017, the D.C. Circuit vacated and remanded Opinion 531. It is unclear how the D.C. Circuit’s opinion to vacate and remand Opinion 531 will affect the September 2016 FERC order or the timing and outcome of the second ROE complaint. In September 2017, certain MISO TOs (not including NSP-Minnesota and NSP-Wisconsin) filed a motion to dismiss the second ROE complaint. The motion to dismiss is pending FERC action.
As of Dec. 31, 2017, NSP-Minnesota has processed the refunds for the Nov. 12, 2013 to Feb. 11, 2015 complaint period based on the
10.32 percent
ROE. NSP-Minnesota has also recognized a current refund liability consistent with the best estimate of the final ROE for the Feb. 12, 2015 to May 11, 2016 complaint period.
SPP OATT Upgrade Costs
— Under the SPP OATT, costs of participant-funded, or “sponsored,” transmission upgrades may be recovered from other SPP customers whose transmission service depends on capacity enabled by the upgrade. The SPP OATT has allowed SPP to charge for these upgrades since 2008, but SPP had not been charging its customers for these upgrades. In 2016, the FERC granted SPP’s request to recover the charges not billed since 2008. SPP subsequently billed SPS approximately
$13 million
for these charges. SPP is also billing SPS ongoing charges of approximately
$0.5 million
per month. SPS is currently seeking recovery of these SPP charges in its pending Texas and New Mexico base rate cases.
In October 2017, SPS filed a complaint against SPP regarding the amounts billed asserting that SPP has assessed upgrade charges to SPS even where SPS’ transmission service was not dependent upon the upgrade as required by the SPP OATT. If SPS’ complaint results in additional charges or refunds, SPS will seek to recover or refund the differential in future rate proceedings.
137
13. Commitments and Contingencies
Commitments
Capital Commitments —
Xcel Energy has made commitments in connection with a portion of its projected capital expenditures. Xcel Energy’s capital commitments primarily relate to the following major projects:
NSP-Minnesota Upper Midwest Wind Projects
—
NSP-Minnesota has gained approval to build and own
1,150
MW of new wind generation in the Upper Midwest. NSP-Minnesota is also seeking approval from the MPUC to build and own the Dakota Range project, a
300
MW wind project in South Dakota.
PSCo Advanced Grid Intelligence and Security Initiative
—
PSCo is pursuing projects to update and advance its electric distribution grid to increase reliability and security standards, meet customer expectations, offer additional customer choice and control over energy usage and implement new rate structures.
PSCo Rush Creek Wind Farm
—
PSCo has gained approval to build, own and operate a
600
MW wind generation facility and proposed transmission line in Colorado.
PSCo Gas Transmission Integrity Management Programs
—
PSCo is proactively identifying and addressing the safety and reliability of natural gas transmission pipelines. The pipeline integrity efforts include primarily pipeline assessment and maintenance projects.
PSCo Electric Distribution Integrity Management Programs
—
PSCo is assessing aging infrastructure for distribution assets and replacing worn components to increase system performance.
SPS Transmission NTC
—
SPS has accepted NTCs for several hundred miles of transmission line and related substation projects based on needs identified through SPP’s various planning processes, including those associated with economics, reliability, generator interconnection and the load addition processes. Most significant are the
345
KV transmission line from TUCO to Yoakum County to Hobbs Plant and the Hobbs Plant to China Draw
345
KV transmission lines.
SPS New Mexico and Texas Wind Projects
—
SPS is seeking approval from the NMPRC and the PUCT to build, own and operate
1,000
MW of new wind generation through the addition of two wind generation facilities in New Mexico and Texas.
Fuel Contracts —
Xcel Energy has entered into various long-term commitments for the purchase and delivery of a significant portion of its current coal, nuclear fuel and natural gas requirements. These contracts expire in various years between
2018
and
2060
. Xcel Energy is required to pay additional amounts depending on actual quantities shipped under these agreements.
The estimated minimum purchases for Xcel Energy under these contracts as of
Dec. 31, 2017
are as follows:
|
(Millions of Dollars)
|
Coal
|
Nuclear fuel
|
Natural gas supply
|
Natural gas
storage and
transportation
|
||||||||||||
|
2018
|
$
|
655
|
|
$
|
61
|
|
$
|
391
|
|
$
|
263
|
|
||||
|
2019
|
255
|
|
118
|
|
288
|
|
251
|
|
||||||||
|
2020
|
146
|
|
34
|
|
277
|
|
237
|
|
||||||||
|
2021
|
59
|
|
85
|
|
280
|
|
227
|
|
||||||||
|
2022
|
59
|
|
66
|
|
127
|
|
217
|
|
||||||||
|
Thereafter
|
186
|
|
379
|
|
57
|
|
1,046
|
|
||||||||
|
Total
|
$
|
1,360
|
|
$
|
743
|
|
$
|
1,420
|
|
$
|
2,241
|
|
||||
Additional expenditures for fuel and natural gas storage and transportation will be required to meet expected future electric generation and natural gas needs. Xcel Energy’s risk of loss, in the form of increased costs from market price changes in fuel, is mitigated through the use of natural gas and energy cost-rate adjustment mechanisms, which provide for pass-through of most fuel, storage and transportation costs to customers.
138
PPAs
—
NSP Minnesota, PSCo and SPS have entered into PPAs with other utilities and energy suppliers with expiration dates through
2039
for purchased power to meet system load and energy requirements and meet operating reserve obligations. In general, these agreements provide for energy payments, based on actual energy delivered and capacity payments. Certain PPAs accounted for as executory contracts also contain minimum energy purchase commitments. Capacity and energy payments are typically contingent on the IPPs meeting contract obligations, including plant availability requirements. Contractual payments are adjusted based on market indices. The effects of price adjustments on our financial results are mitigated through purchased energy cost recovery mechanisms.
Included in electric fuel and purchased power expenses for PPAs accounted for as executory contracts were payments for capacity of
$168 million
,
$191 million
and
$231 million
in
2017
,
2016
and
2015
, respectively. At Dec. 31,
2017
, the estimated future payments for capacity and energy that the utility subsidiaries of Xcel Energy are obligated to purchase pursuant to these executory contracts, subject to availability, are as follows:
|
(Millions of Dollars)
|
Capacity
|
Energy
(a)
|
||||||
|
2018
|
$
|
133
|
|
$
|
93
|
|
||
|
2019
|
87
|
|
99
|
|
||||
|
2020
|
68
|
|
105
|
|
||||
|
2021
|
73
|
|
140
|
|
||||
|
2022
|
77
|
|
155
|
|
||||
|
Thereafter
|
205
|
|
368
|
|
||||
|
Total
|
$
|
643
|
|
$
|
960
|
|
||
|
(a)
|
Excludes contingent energy payments for renewable energy PPAs.
|
Additional energy payments under these PPAs and PPAs accounted for as operating leases will be required to meet expected future electric demand.
Leases —
Xcel Energy leases a variety of equipment and facilities.
Three
of these leases are accounted for as capital leases. The assets and liabilities at the inception of a capital lease are recorded at the lower of fair market value or the present value of future lease payments and are amortized over the term of the contract.
WYCO is a joint venture with CIG to develop and lease natural gas pipeline, storage, and compression facilities. Xcel Energy Inc. has a
50 percent
ownership interest in WYCO. WYCO generally leases its facilities to CIG, and CIG operates the facilities, providing natural gas storage services to PSCo under separate service agreements.
PSCo accounts for its Totem natural gas storage service arrangement with CIG as a capital lease. As a result, PSCo had
$124 million
and
$127 million
of capital lease obligations as of Dec. 31,
2017
and
2016
, respectively. Xcel Energy Inc. eliminates
50 percent
of the capital lease obligation related to WYCO in the consolidated balance sheet along with an equal amount of Xcel Energy Inc.’s equity investment in WYCO.
PSCo records amortization for its capital leases as cost of natural gas sold and transported on the consolidated statements of income. Total amortization expenses under capital lease assets were approximately
$5 million
,
$8 million
and
$8 million
for
2017
,
2016
and
2015
, respectively. Following is a summary of property held under capital leases:
|
(Millions of Dollars)
|
Dec. 31, 2017
|
Dec. 31, 2016
|
||||||
|
Gas storage facilities
|
$
|
201
|
|
$
|
201
|
|
||
|
Gas pipeline
|
21
|
|
21
|
|
||||
|
Property held under capital leases
|
222
|
|
222
|
|
||||
|
Accumulated depreciation
|
(71
|
)
|
(66
|
)
|
||||
|
Total property held under capital leases, net
|
$
|
151
|
|
$
|
156
|
|
||
The remainder of the leases, primarily for office space, railcars, generating facilities, natural gas pipeline transportation, vehicles, aircraft and power-operated equipment, are accounted for as operating leases. Total expenses under operating lease obligations for Xcel Energy were approximately
$246 million
,
$255 million
and
$265 million
for
2017
,
2016
and
2015
, respectively. These expenses include capacity payments for PPAs accounted for as operating leases of
$210 million
,
$216 million
and
$224 million
in
2017
,
2016
and
2015
, respectively, recorded to electric fuel and purchased power expenses.
139
Included in the future commitments under operating leases are estimated future capacity payments under PPAs that have been accounted for as operating leases in accordance with the applicable accounting guidance. Future commitments under operating and capital leases are:
|
(Millions of Dollars)
|
Operating
Leases
|
PPA
(a) (b)
Operating
Leases
|
Total
Operating
Leases
|
Capital Leases
|
|||||||||||||
|
2018
|
$
|
25
|
|
$
|
213
|
|
$
|
238
|
|
$
|
15
|
|
|||||
|
2019
|
30
|
|
230
|
|
260
|
|
14
|
|
|||||||||
|
2020
|
24
|
|
244
|
|
268
|
|
14
|
|
|||||||||
|
2021
|
24
|
|
246
|
|
270
|
|
14
|
|
|||||||||
|
2022
|
22
|
|
235
|
|
257
|
|
12
|
|
|||||||||
|
Thereafter
|
148
|
|
1,682
|
|
1,830
|
|
233
|
|
|||||||||
|
Total minimum obligation
|
302
|
|
|||||||||||||||
|
Interest component of obligation
|
(213
|
)
|
|||||||||||||||
|
Present value of minimum obligation
|
$
|
89
|
|
(c)
|
|||||||||||||
|
(a)
|
Amounts do not include PPAs accounted for as executory contracts.
|
|
(b)
|
PPA operating leases contractually expire through
2039
.
|
|
(c)
|
Future commitments exclude certain amounts related to Xcel Energy’s
50 percent
ownership interest in WYCO.
|
Variable Interest Entities
— The accounting guidance for consolidation of VIEs requires enterprises to consider the activities that most significantly impact an entity’s financial performance, and power to direct those activities, when determining whether an enterprise is a VIE’s primary beneficiary.
PPAs
—
Under certain PPAs, NSP-Minnesota, PSCo and SPS purchase power from IPPs for which the utility subsidiaries are required to reimburse natural gas or biomass fuel costs, or to participate in tolling arrangements under which the utility subsidiaries procure the natural gas required to produce the energy that they purchase. In addition, certain solar PPAs provide the utility subsidiaries with an option to purchase emission allowances or sharing provisions related to production credits generated by the solar facility under contract. These specific PPAs create a variable interest in the IPP.
Xcel Energy has determined that certain IPPs are VIEs. Xcel Energy is not subject to risk of loss from the operations of these entities, and no significant financial support has been, or is required to be provided other than contractual payments for energy and capacity set forth in the PPAs.
Xcel Energy has evaluated each of these VIEs for possible consolidation, including review of qualitative factors such as the length and terms of the contract, control over O&M, control over dispatch of electricity, historical and estimated future fuel and electricity prices, and financing activities. Xcel Energy has concluded that these entities are not required to be consolidated in its consolidated financial statements because it does not have the power to direct the activities that most significantly impact the entities’ economic performance. Xcel Energy’s utility subsidiaries had approximately
3,537
MW of capacity under long-term PPAs at both Dec. 31,
2017
and
2016
with entities that have been determined to be VIEs. These agreements have expiration dates through the year
2041
.
Fuel Contracts
— SPS purchases all of its coal requirements for its Harrington and Tolk electric generating stations from TUCO under contracts for those facilities that will expire in December
2022
. TUCO arranges for the purchase, receiving, transporting, unloading, handling, crushing, weighing, and delivery of coal to meet SPS’ requirements. TUCO is responsible for negotiating and administering contracts with coal suppliers, transporters and handlers.
No significant financial support has been, or is required to be provided to TUCO by SPS, other than contractual payments for delivered coal. However, the fuel contracts create a variable interest in TUCO due to SPS’ reimbursement of certain fuel procurement costs. SPS has determined that TUCO is a VIE. SPS has concluded that it is not the primary beneficiary of TUCO because SPS does not have the power to direct the activities that most significantly impact TUCO’s economic performance.
140
Low-Income Housing Limited Partnerships
— Eloigne and NSP-Wisconsin have entered into limited partnerships for the construction and operation of affordable rental housing developments which qualify for low-income housing tax credits. Xcel Energy Inc. has determined Eloigne and NSP-Wisconsin’s low-income housing limited partnerships to be VIEs primarily due to contractual arrangements within each limited partnership that establish sharing of ongoing voting control and profits and losses that does not consistently align with the partners’ proportional equity ownership. Xcel Energy Inc. has determined that Eloigne and NSP-Wisconsin have the power to direct the activities that most significantly impact these entities’ economic performance, and therefore Xcel Energy Inc. consolidates these limited partnerships in its consolidated financial statements.
Equity financing for these entities has been provided by Eloigne, NSP-Wisconsin and the general partner of each limited partnership. Xcel Energy’s risk of loss is limited to its capital contributions, adjusted for any distributions and its share of undistributed profits and losses; no significant additional financial support has been, or is required to be provided to the limited partnerships by Eloigne or NSP-Wisconsin. Obligations of the limited partnerships are generally secured by the housing properties of each limited partnership, and the creditors of each limited partnership have no significant recourse to Xcel Energy Inc. or its subsidiaries. Likewise, the assets of the limited partnerships may only be used to settle obligations of the limited partnerships, and not those of Xcel Energy Inc. or its subsidiaries.
Amounts reflected in Xcel Energy’s consolidated balance sheets for the Eloigne and NSP-Wisconsin low-income housing limited partnerships include the following:
|
(Millions of Dollars)
|
Dec. 31, 2017
|
Dec. 31, 2016
|
||||||
|
Current assets
|
$
|
6
|
|
$
|
7
|
|
||
|
Property, plant and equipment, net
|
46
|
|
50
|
|
||||
|
Other noncurrent assets
|
1
|
|
1
|
|
||||
|
Total assets
|
$
|
53
|
|
$
|
58
|
|
||
|
Current liabilities
|
$
|
9
|
|
$
|
8
|
|
||
|
Mortgages and other long-term debt payable
|
26
|
|
30
|
|
||||
|
Other noncurrent liabilities
|
1
|
|
1
|
|
||||
|
Total liabilities
|
$
|
36
|
|
$
|
39
|
|
||
Technology Agreements
— Xcel Energy has a contract that extends through December
2022
with International Business Machines Corp. (IBM) for information technology services. The contract is cancelable at Xcel Energy’s option, although Xcel Energy would be obligated to pay
50 percent
of the contract value for early termination. Xcel Energy capitalized or expensed
$98 million
,
$119 million
and
$109 million
associated with the IBM contract in
2017
,
2016
and
2015
, respectively.
Xcel Energy’s contract with Accenture for information technology services extends through December
2020
. The contract is cancelable at Xcel Energy’s option, although there are financial penalties for early termination. Xcel Energy capitalized or expensed
$16 million
,
$35 million
and
$17 million
associated with the Accenture contract in
2017
,
2016
and
2015
, respectively.
Committed minimum payments under these obligations are as follows:
|
(Millions of Dollars)
|
IBM
Agreement
|
Accenture
Agreement
|
||||||
|
2018
|
$
|
26
|
|
$
|
11
|
|
||
|
2019
|
26
|
|
11
|
|
||||
|
2020
|
8
|
|
11
|
|
||||
|
2021
|
8
|
|
—
|
|
||||
|
2022
|
3
|
|
—
|
|
||||
|
Thereafter
|
—
|
|
—
|
|
||||
141
Guarantees and Indemnifications
Xcel Energy Inc. and its subsidiaries provide guarantees and bond indemnities under specified agreements or transactions, which guarantee payment or performance. Xcel Energy Inc.’s exposure is based upon the net liability of the relevant subsidiary under the specified agreements or transactions. Most of the guarantees and bond indemnities issued by Xcel Energy Inc. and its subsidiaries limit the exposure to a maximum stated amount. As of Dec. 31,
2017
and
2016
, Xcel Energy Inc. and its subsidiaries had
no
assets held as collateral related to their guarantees, bond indemnities and indemnification agreements.
Guarantees and Surety Bonds
The following table presents guarantees and bond indemnities issued and outstanding as of Dec. 31,
2017
:
|
(Millions of Dollars)
|
Guarantor
|
Guarantee
Amount
|
Current
Exposure
|
Triggering
Event
|
||||||||
|
Guarantee of customer loans for the Farm Rewiring Program
(a)
|
NSP-Wisconsin
|
$
|
1.0
|
|
$
|
—
|
|
(f)
|
||||
|
Guarantee of the indemnification obligations of Xcel Energy Services Inc. under the aircraft leases
(b)
|
Xcel Energy Inc.
|
12.0
|
|
—
|
|
(g)
|
||||||
|
Guarantee of residual value of assets under the Bank of Tokyo-Mitsubishi Capital Corporation Equipment Leasing Agreement
(c)
|
NSP-Minnesota
|
4.8
|
|
—
|
|
(h)
|
||||||
|
Guarantee of loan for Hiawatha Collegiate High School
(d)
|
Xcel Energy Inc.
|
1.0
|
|
—
|
|
(g)
|
||||||
|
Total guarantees issued
|
$
|
18.8
|
|
$
|
—
|
|
||||||
|
Guarantee performance and payment of surety bonds for Xcel Energy Inc.’s utility subsidiaries
(e)
|
Xcel Energy Inc.
|
$
|
53.1
|
|
(j)
|
(i)
|
||||||
|
(a)
|
The term of this guarantee expires in
2020
, which is the final scheduled repayment date for the loans. As of Dec. 31, 2017,
no
claims had been made by the lender.
|
|
(b)
|
The terms of this guarantee expires in
2021
and
2023
when the associated leases expire.
|
|
(c)
|
The term of this guarantee expires in
2019
when the associated lease expires.
|
|
(d)
|
The term of this guarantee expires the earlier of
2024
or full repayment of the loan.
|
|
(e)
|
The surety bonds primarily relate to workers compensation benefits and utility projects. The workers compensation bonds are renewed annually and the project based bonds expire in conjunction with the completion of the related projects.
|
|
(f)
|
The debtor becomes the subject of bankruptcy or other insolvency proceedings.
|
|
(g)
|
Nonperformance and/or nonpayment.
|
|
(h)
|
Actual fair value of leased assets is less than the guaranteed residual value amount at the end of the lease term.
|
|
(i)
|
Failure of any one of Xcel Energy Inc.’s utility subsidiaries to perform under the agreement that is the subject of the relevant bond. In addition, per the indemnity agreement between Xcel Energy Inc. and the various surety companies, the surety companies have the discretion to demand that collateral be posted.
|
|
(j)
|
Due to the magnitude of projects associated with the surety bonds, the total current exposure of this indemnification cannot be determined. Xcel Energy Inc. believes the exposure to be significantly less than the total amount of the outstanding bonds.
|
Indemnification Agreements
Xcel Energy Inc. and its subsidiaries provide indemnifications through contracts entered into in the normal course of business. These are primarily indemnifications against adverse litigation outcomes in connection with underwriting agreements, as well as breaches of representations and warranties, including corporate existence, transaction authorization and income tax matters with respect to assets sold. Xcel Energy Inc.’s and its subsidiaries’ obligations under these agreements may be limited in terms of duration and amount. The maximum future payments under these indemnifications cannot be reasonably estimated as the dollar amounts are often not explicitly stated.
Environmental Contingencies
Xcel Energy has been or is currently involved with the cleanup of contamination from certain hazardous substances at several sites. In many situations, the subsidiary involved believes it will recover some portion of these costs through insurance claims. Additionally, where applicable, the subsidiary involved is pursuing, or intends to pursue, recovery from other PRPs and through the regulated rate process. New and changing federal and state environmental mandates can also create added financial liabilities for Xcel Energy, which are normally recovered through the regulated rate process. To the extent any costs are not recovered through the options listed above, Xcel Energy would be required to recognize an expense.
142
Site Remediation
—
Various federal and state environmental laws impose liability, without regard to the legality of the original conduct, where hazardous substances or other regulated materials have been released to the environment. Xcel Energy Inc.’s subsidiaries may sometimes pay all or a portion of the cost to remediate sites where past activities of their predecessors or other parties have caused environmental contamination. Environmental contingencies could arise from various situations, including sites of former MGPs operated by Xcel Energy Inc.’s subsidiaries or their predecessors, or other entities; and third-party sites, such as landfills, for which one or more of Xcel Energy Inc.’s subsidiaries are alleged to be a PRP that sent wastes to that site.
MGP Sites
Ashland MGP Site
— NSP-Wisconsin was named a PRP for contamination at a site in Ashland, Wis. The Ashland/Northern States Power Lakefront Superfund Site (the Site) includes NSP-Wisconsin property, previously operated as a MGP facility (the Upper Bluff), and
two
other properties: an adjacent city lakeshore park area (Kreher Park); and an area of Lake Superior’s Chequamegon Bay adjoining the park.
In 2012, NSP-Wisconsin agreed to remediate the Phase I Project Area (which includes the Upper Bluff and Kreher Park areas of the Site), under a settlement agreement with the EPA. In January 2017, NSP-Wisconsin agreed to remediate the Phase II Project Area (the Sediments), under a settlement agreement with the EPA. The settlement agreements were approved by the U.S. District Court for the Western District of Wisconsin. NSP-Wisconsin initiated a full scale wet dredge remedy of the Sediments in 2017. Going forward, NSP-Wisconsin anticipates completion of restoration activities of the Sediments in 2018 with finalization of Phase I Project Area construction and restoration activities in 2019. Groundwater treatment activities at the Site will continue.
The current cost estimate for the entire site (both Phase I Project Area and the Sediments) is approximately
$168 million
, of which approximately
$138 million
has been spent. As of Dec. 31, 2017 and 2016, NSP-Wisconsin had recorded a total liability of
$30 million
and
$64 million
, respectively, for the entire site.
NSP-Wisconsin has deferred the unrecovered portion of the estimated Site remediation costs as a regulatory asset. The PSCW has authorized NSP-Wisconsin rate recovery for all remediation costs incurred at the Site. In 2012, the PSCW agreed to allow NSP-Wisconsin to pre-collect certain costs, to amortize costs over a
ten
-year period and to apply a
three percent
carrying cost to the unamortized regulatory asset. In December 2017, the PSCW approved an NSP-Wisconsin natural gas rate case, which included recovery of additional expenses associated with remediating the Site. The annual recovery of MGP clean-up costs will increase from
$12 million
in 2017 to
$18 million
in 2018.
Fargo, N.D. MGP Site
— In May 2015, underground pipes, tars and impacted soils were discovered in a right-of-way in Fargo, N.D. that appeared to be associated with a former MGP operated by NSP-Minnesota or prior companies. NSP-Minnesota removed impacted soils and other materials and commenced an investigation of the historic MGP and adjacent properties (the Fargo MGP Site). The North Dakota Department of Health approved NSP-Minnesota’s proposed cleanup plan in January 2017, which involves targeted source removal of impacted soils and historic MGP infrastructure. It is anticipated that remediation activities will be performed in 2018. NSP-Minnesota has also initiated insurance recovery litigation in North Dakota. The U.S. District Court for the District of North Dakota agreed to the parties’ request for a stay of the litigation until May 31, 2018.
NSP-Minnesota had recorded an estimated liability of
$16 million
as of Dec. 31, 2017, and
$11 million
as of Dec. 31, 2016, for the Fargo MGP Site. The current cost estimate for the remediation of the site is approximately
$23 million
, of which approximately
$7 million
has been spent. NSP-Minnesota has deferred Fargo MGP Site costs allocable to the North Dakota jurisdiction, or approximately
88 percent
of all remediation costs, as approved by the NDPSC. In December 2017, NSP-Minnesota filed a request with the MPUC to defer post-2017 expenditures allocable to the Minnesota jurisdiction.
Other MGP, Landfill or Disposal Sites
—
Xcel Energy is currently involved in investigating and/or remediating several MGP, landfill or other disposal sites. Xcel Energy has identified
twelve
sites across its service territories in addition to the sites in Ashland and Fargo, where contamination is present and where investigation and/or remediation activities are currently underway. Other parties may have responsibility for some portion of the investigation and/or remediation activities that are underway. Xcel Energy anticipates that these investigation or remediation activities will continue through at least 2018. Xcel Energy had accrued
$4 million
as of
Dec. 31, 2017
and
$2 million
as of Dec. 31, 2016 for all of these sites. There may be insurance recovery and/or recovery from other PRPs that will offset any costs incurred. Xcel Energy anticipates that any amounts spent will be fully recovered from customers.
143
Environmental Requirements
Water and Waste
Asbestos Removal —
Some of Xcel Energy’s facilities contain asbestos. Most asbestos will remain undisturbed until the facilities that contain it are demolished or removed. Xcel Energy has recorded an estimate for final removal of the asbestos as an ARO. It may be necessary to remove some asbestos to perform maintenance or make improvements to other equipment. The cost of removing asbestos as part of other work is not expected to be material and is recorded as incurred as operating expenses for maintenance projects, capital expenditures for construction projects or removal costs for demolition projects.
Coal Ash Regulation
—
Xcel Energy’s operations are subject to federal and state laws that impose requirements for handling, storage, treatment and disposal of solid waste. In 2015, the EPA published a final rule regulating the management, storage, and disposal of coal combustion residuals (CCRs) as a nonhazardous waste (CCR Rule). Industry and environmental non-governmental organizations sought judicial review of the final CCR Rule, but a final decision has not been issued in that litigation. The EPA announced in late 2017 its intent to revise the CCR Rule. It is anticipated that the EPA will publish the revised rule in the first quarter of 2018.
Under the CCR Rule, utilities were required to complete groundwater sampling around their CCR landfills and surface impoundments and to analyze the results by early 2018 to determine if there were any statistically significant increases (SSIs) above background levels of certain constituents in the groundwater. Xcel Energy has identified SSIs at several sites located in Colorado and
one
site in Minnesota. Going forward, Xcel Energy will either conduct additional groundwater sampling to determine whether another source besides plant operations is impacting groundwater and/or to determine if corrective action is needed. Several Xcel Energy sites where SSIs were identified were already undergoing cessation of coal operations and closure of the on-site coal units and therefore no further corrective action is expected at those sites.
Until a final decision is reached in the litigation, the EPA publishes its revised rule, and Xcel Energy completes additional groundwater sampling, it is uncertain what impact, if any, there will be on the operations, financial position or cash flows of Xcel Energy. Xcel Energy believes that any associated costs would be recoverable through regulatory mechanisms.
Federal CWA Waters of the United States Rule
—
In 2015, the EPA and the U.S. Army Corps of Engineers (Corps) published a final rule that significantly expanded the types of water bodies regulated under the CWA and broadened the scope of waters subject to federal jurisdiction. In October 2015, the U.S. Court of Appeals for the Sixth Circuit issued a nationwide stay of the final rule and subsequently ruled that it, rather than the federal district courts, had jurisdiction over challenges to the rule. In January 2017, the U.S. Supreme Court agreed to resolve the dispute as to which court should hear challenges to the rule. A ruling is expected in 2018.
In February 2017, President Trump issued an executive order requiring the EPA and the Corps to review and revise the final rule. In June 2017, the agencies issued a proposed rule that rescinds the final rule and reinstates the prior definition of “Water of the U.S.” The agencies are also undertaking a rulemaking to develop a new definition of “Waters of the U.S.”
Federal CWA Effluent Limitations Guidelines (ELG)
— In 2015, the EPA issued a final ELG rule for power plants that use coal, natural gas, oil or nuclear materials as fuel and discharge treated effluent to surface waters as well as utility-owned landfills that receive coal combustion residuals. In 2017, the EPA delayed the compliance date for flue gas desulfurization wastewater and bottom ash transport until November 2020 while the agency conducts a rulemaking process to potentially revise the effluent limitations and pretreatment standards for these waste streams.
Federal CWA Section 316(b)
— The federal CWA requires the EPA to regulate cooling water intake structures to assure that these structures reflect the best technology available for minimizing adverse environmental impacts to aquatic species. The EPA published the final 316(b) rule in 2014. The rule prescribes technology for protecting fish that get stuck on plant intake screens (known as impingement) and describes a process for site-specific determinations by each state for sites that must protect the small aquatic organisms that pass through the intake screens into the plant cooling systems (known as entrainment). For Xcel Energy, these requirements will primarily impact plants at NSP-Minnesota. Xcel Energy estimates the likely cost for complying with impingement requirements may be incurred between 2018 and 2027 and is approximately
$41 million
with the majority needed for NSP-Minnesota. Xcel Energy believes at least
six
NSP-Minnesota plants and
two
NSP-Wisconsin plants could be required by state regulators to make improvements to reduce entrainment. The exact total cost of the entrainment improvements is uncertain, but could be up to
$192 million
. Xcel Energy anticipates these costs will be fully recoverable in rates.
144
Air
GHG Emission Standard for Existing Sources (CPP)
— In 2015, the EPA issued its final CPP rule for existing power plants. Among other things, the CPP requires that state plans include enforceable measures to ensure emissions from existing power plants achieve the EPA’s state-specific interim and final emission performance targets.
The CPP was challenged by multiple parties in the D.C. Circuit Court. In February 2016, the U.S. Supreme Court issued an order staying the final CPP rule. The stay will remain in effect until the D.C. Circuit Court reaches its decision and the U.S. Supreme Court either declines to review the lower court’s decision or reaches a decision of its own.
In March 2017, President Trump signed an executive order requiring the EPA Administrator to review the CPP rule and if appropriate publish proposed rules suspending, revising or rescinding it. Accordingly, the EPA requested that the D.C. Circuit Court hold the litigation in abeyance until the EPA completes its work under the executive order. The D.C. Circuit granted the EPA’s request and is holding the litigation in abeyance, while considering briefs by the parties on whether the court should remand the challenges to the EPA rather than holding them in abeyance, determining whether and how the court continues or ends the stay that currently applies to the CPP.
In October 2017, the EPA published a proposed rule to repeal the CPP, based on an analysis that the CPP exceeds the EPA’s statutory authority under the CAA. In the proposal, the EPA stated it has not yet determined whether it will promulgate a new rule to regulate GHG emissions from existing EGUs. In December 2017, the EPA issued an Advanced Notice of Proposed Rulemaking to take and consider comments on whether to issue a future rule and what such a rule should include.
CSAPR
— CSAPR addresses long range transport of PM and ozone by requiring reductions in SO
2
and NOx from utilities in the eastern half of the United States using an emissions trading program. For Xcel Energy, the rule applies in Minnesota, Wisconsin and Texas.
CSAPR was adopted to address interstate emissions impacting downwind states’ attainment of the ozone and particulate NAAQS. As the EPA revises NAAQS, it will consider whether to make any further reductions to CSAPR emission budgets and whether to change which states are included in the emissions trading program.
In September 2017, the EPA adopted a final rule that withdraws Texas from the CSAPR particle program and determines that further emission reductions in Texas are not needed to address interstate particle transport. Texas is no longer subject to the annual SO
2
and NO
X
emission budgets under CSAPR. In November 2017, the National Parks Conservation Association and Sierra Club appealed this rule to the D.C. Circuit Court. In January 2018, the Court granted SPS’ motion to intervene in support of the EPA’s final rule.
Regional Haze Rules
— The regional haze program requires SO
2
, NO
X
and PM emission controls at power plants and other industrial facilities to reduce visibility impairment in national parks and wilderness areas. The program is divided into two parts: BART and reasonable further progress. The requirements of the first regional haze plans developed by Minnesota and Colorado that apply to NSP-Minnesota and PSCo have been fully approved and implemented. Texas’ first regional haze plan has undergone federal review as described below.
BART Determination for Texas:
The EPA published a proposed BART rule for Texas in January 2017 that could have required installation of dry scrubbers to reduce SO
2
emissions from Harrington Units 1 and 2. Investment costs associated with dry scrubbers for Harrington Units 1 and 2 could have been approximately
$400 million
. In October 2017, the EPA issued a revised final rule adopting a BART alternative Texas only SO
2
trading program that applies to all Harrington and Tolk units. Under the trading program, SPS expects the allowance allocations to be sufficient for SO
2
emissions from units in 2019 and future years. The anticipated costs of compliance are not expected to have a material impact on the results of operations, financial position or cash flows; and SPS believes that compliance costs would be recoverable through regulatory mechanisms.
Several parties have challenged whether the final rule issued by the EPA should be considered to have met the requirements imposed in a Consent Decree entered the United States District Court for the District of Columbia that established deadlines for the EPA to take final action on state regional haze plan submissions. The matter is now submitted to the court.
In December 2017, the National Parks Conservation Association, Sierra Club, and Environmental Defense Fund appealed the EPA’s October 2017 final BART rule to the Fifth Circuit, and filed a petition for administrative reconsideration of the final rule with the EPA. In January 2018, the court granted SPS’ motion to intervene in the Fifth Circuit litigation in support of the EPA’s final rule.
145
Reasonable Progress Rule:
In January 2016, the EPA adopted a final rule establishing a federal implementation plan for reasonable further progress under the regional haze program for the state of Texas. The rule imposes SO
2
emission limitations that would require the installation of dry scrubbers on Tolk Units 1 and 2, with compliance required by February 2021. Investment costs associated with dry scrubbers could be approximately
$600 million
. SPS appealed the EPA’s decision and obtained a stay of the final rule. In March 2017, the Fifth Circuit remanded the rule to the EPA for reconsideration, leaving the stay in effect. In a future rulemaking, the EPA will address whether SO
2
emission reductions beyond those required in the BART alternative rule are needed at Tolk under the “reasonable progress” requirements of the regional haze program. The risk of these controls being imposed along with the risk of investments to provide additional cooling water to Tolk have caused SPS to seek to decrease the remaining depreciable life of the Tolk units. The EPA has not announced a schedule for acting on the remanded rule.
Implementation of the NAAQS for SO
2
— The EPA adopted a more stringent NAAQS for SO
2
in 2010, and evaluated areas in
three
phases. In December 2017, the EPA adopted a final rule that completed its initial designations of areas attaining or not attaining the standard. The EPA’s final actions designate all areas near Xcel Energy’s generating plants as meeting the SO
2
NAAQS with two exceptions. In June 2016, the EPA issued final designations which found the areas near the SPS Harrington and PSCo Pawnee plants as “unclassifiable.” The area near the Harrington plant is to be monitored for
three years
and a final designation is expected to be made by December 2020. Since the 2016 “unclassifiable” designation, the Colorado Department of Public Health and Environment has prepared and submitted air dispersion modeling to the EPA demonstrating that the area near the Pawnee plant meets the SO
2
NAAQS. The EPA has not yet completed its evaluation of the Pawnee plant.
If the area near the Harrington plant is designated nonattainment in 2020, the Texas Commission on Environmental Quality (TCEQ) will need to develop an implementation plan, which would be due by 2022, designed to achieve the NAAQS by 2025. The TCEQ could require additional SO
2
controls at Harrington as part of such a plan. Xcel Energy cannot evaluate the impacts until the final designation is made and any required state plans are developed. Xcel Energy believes that should SO
2
control systems be required or require upgrades for a plant, compliance costs or the costs of alternative cost-effective generation will be recoverable through regulatory mechanisms and therefore does not expect a material impact on results of operations, financial position or cash flows.
Revisions to the NAAQS for Ozone
— In 2015, the EPA revised the NAAQS for ozone by lowering the
eight
-hour standard from
75
parts per billion (ppb) to
70
ppb. In November 2017, the EPA published final designations of areas that meet the 2015 ozone standard. Xcel Energy meets the 2015 ozone standard in all areas where its generating units operate, except for the Denver Metropolitan Area. PSCo’s scheduled retirement of coal fired plants in Denver that began in 2011 and was completed in August 2017, should help in any plan to mitigate non-attainment. The EPA has not yet taken final action on the designation, but notified the State of Colorado in December 2017 that it intends to designate the parts of the Denver Metropolitan Area that currently do not attain the 2008 ozone standards as also not attaining the more stringent 2015 ozone standard.
Asset Retirement Obligations
Recorded AROs —
AROs have been recorded for property related to the following: electric production (nuclear, steam, wind, other and hydro), electric distribution and transmission, natural gas production, natural gas transmission and distribution, natural gas storage, thermal and general property. The electric production obligations include asbestos, processed water and ash-containment facilities, radiation sources, storage tanks, control panels and decommissioning. The asbestos recognition associated with electric production includes certain plants at NSP-Minnesota, NSP-Wisconsin, PSCo and SPS. AROs also have been recorded for NSP-Minnesota, NSP-Wisconsin, PSCo and SPS steam production related to processed water and ash-containment facilities such as ash ponds, evaporation ponds and solid waste landfills. NSP-Minnesota and PSCo have also recorded AROs for the retirement and removal of assets at certain wind production facilities for which the land is leased and removal is required by contract.
Xcel Energy has recognized AROs for the retirement costs of natural gas mains and lines at NSP-Minnesota, NSP-Wisconsin and PSCo and AROs for the retirement of above ground gas gathering equipment, impoundments at gas extraction sites and wells related to gas storage facilities at PSCo. In addition, an ARO was recognized for the removal of electric transmission and distribution equipment at NSP-Minnesota, NSP-Wisconsin, PSCo and SPS, which consists of obligations associated with polychlorinated biphenyl, mineral oil, lithium batteries, mercury and street lighting lamps. The common general AROs include obligations related to storage tanks, radiation sources and office buildings.
For the nuclear assets, the ARO is associated with the decommissioning of the NSP-Minnesota nuclear generating plants, Monticello and PI. See Note 14 for further discussion of nuclear obligations.
146
A reconciliation of Xcel Energy’s AROs for the years ended
Dec. 31, 2017
and
2016
is as follows:
|
(Millions of Dollars)
|
Beginning
Balance
Jan. 1, 2017
|
Liabilities
Recognized
|
Liabilities
Settled
(a)
|
Accretion
|
Cash Flow Revisions
(b)
|
Ending
Balance
Dec. 31, 2017
|
||||||||||||||||||
|
Electric plant
|
||||||||||||||||||||||||
|
Nuclear production decommissioning
|
$
|
2,249
|
|
$
|
—
|
|
$
|
—
|
|
$
|
114
|
|
$
|
(489
|
)
|
$
|
1,874
|
|
||||||
|
Steam and other production ash containment
|
117
|
|
—
|
|
(16
|
)
|
5
|
|
9
|
|
115
|
|
||||||||||||
|
Wind production
|
92
|
|
—
|
|
—
|
|
4
|
|
—
|
|
96
|
|
||||||||||||
|
Steam, hydro and other production asbestos
|
88
|
|
1
|
|
(13
|
)
|
4
|
|
(3
|
)
|
77
|
|
||||||||||||
|
Electric distribution
|
20
|
|
—
|
|
—
|
|
1
|
|
—
|
|
21
|
|
||||||||||||
|
Other
|
5
|
|
—
|
|
—
|
|
—
|
|
—
|
|
5
|
|
||||||||||||
|
Natural gas plant
|
||||||||||||||||||||||||
|
Gas transmission and distribution
|
205
|
|
—
|
|
—
|
|
8
|
|
69
|
|
282
|
|
||||||||||||
|
Other
|
4
|
|
—
|
|
—
|
|
—
|
|
—
|
|
4
|
|
||||||||||||
|
Common and other property
|
||||||||||||||||||||||||
|
Common general plant asbestos
|
1
|
|
—
|
|
(1
|
)
|
—
|
|
—
|
|
—
|
|
||||||||||||
|
Common miscellaneous
|
1
|
|
—
|
|
—
|
|
—
|
|
—
|
|
1
|
|
||||||||||||
|
Total liability
|
$
|
2,782
|
|
$
|
1
|
|
$
|
(30
|
)
|
$
|
136
|
|
$
|
(414
|
)
|
$
|
2,475
|
|
||||||
|
(a)
|
The liabilities settled relate to asbestos abatement projects, the closure of certain ash containment facilities, and removal and proper disposal of storage tanks and other above ground equipment.
|
|
(b)
|
In 2017, AROs were revised for changes in estimated cash flows and the timing of those cash flows. The nuclear decommissioning ARO decreased due to updated assumptions in the nuclear triennial filing. Changes in the gas transmission and distribution AROs were mainly related to increased labor costs.
|
The aggregate fair value of NSP-Minnesota’s legally restricted assets, for purposes of funding future nuclear decommissioning, was
$2.1 billion
as of
Dec. 31, 2017
, consisting of external investment funds.
|
(Millions of Dollars)
|
Beginning
Balance
Jan. 1, 2016
|
Liabilities
Recognized
|
Liabilities
Settled
|
Accretion
|
Cash Flow Revisions
(b)
|
Ending
Balance
Dec. 31, 2016
|
||||||||||||||||||
|
Electric plant
|
||||||||||||||||||||||||
|
Nuclear production decommissioning
|
$
|
2,141
|
|
$
|
—
|
|
$
|
—
|
|
$
|
108
|
|
$
|
—
|
|
$
|
2,249
|
|
||||||
|
Steam and other production ash containment
|
132
|
|
—
|
|
(6
|
)
|
5
|
|
(14
|
)
|
117
|
|
||||||||||||
|
Steam, hydro and other production asbestos
|
84
|
|
—
|
|
—
|
|
4
|
|
—
|
|
88
|
|
||||||||||||
|
Wind production
|
72
|
|
17
|
|
(a)
|
—
|
|
3
|
|
—
|
|
92
|
|
|||||||||||
|
Electric distribution
|
13
|
|
—
|
|
—
|
|
1
|
|
6
|
|
20
|
|
||||||||||||
|
Other
|
4
|
|
1
|
|
—
|
|
—
|
|
—
|
|
5
|
|
||||||||||||
|
Natural gas plant
|
||||||||||||||||||||||||
|
Gas transmission and distribution
|
156
|
|
—
|
|
—
|
|
7
|
|
42
|
|
205
|
|
||||||||||||
|
Other
|
4
|
|
—
|
|
—
|
|
—
|
|
—
|
|
4
|
|
||||||||||||
|
Common and other property
|
||||||||||||||||||||||||
|
Common general plant asbestos
|
1
|
|
—
|
|
—
|
|
—
|
|
—
|
|
1
|
|
||||||||||||
|
Common miscellaneous
|
2
|
|
—
|
|
—
|
|
—
|
|
(1
|
)
|
1
|
|
||||||||||||
|
Total liability
|
$
|
2,609
|
|
$
|
18
|
|
$
|
(6
|
)
|
$
|
128
|
|
$
|
33
|
|
$
|
2,782
|
|
||||||
|
(a)
|
The liability recognized relates to the NSP-Minnesota Courtenay Wind Farm which was placed in service during 2016.
|
|
(b)
|
In 2016, AROs were revised for changes in estimated cash flows and the timing of those cash flows. Changes in the gas transmission and distribution AROs were mainly related to increased miles of gas mains.
|
The aggregate fair value of NSP-Minnesota’s legally restricted assets, for purposes of funding future nuclear decommissioning, was
$1.9 billion
as of
Dec. 31, 2016
, consisting of external investment funds.
147
Indeterminate AROs —
Outside of the known and recorded asbestos AROs, other plants or buildings may contain asbestos due to the age of many of Xcel Energy’s facilities, but no confirmation or measurement of the amount of asbestos or cost of removal could be determined as of Dec. 31, 2017. Therefore, an ARO has not been recorded for these facilities.
Removal Costs —
Xcel Energy records a regulatory liability for the plant removal costs of generation, transmission and distribution facilities of its utility subsidiaries that are recovered currently in rates. Generally, the accrual of future non-ARO removal obligations is not required. However, long-standing ratemaking practices approved by applicable state and federal regulatory commissions have allowed provisions for such costs in historical depreciation rates. These removal costs have accumulated over a number of years based on varying rates as authorized by the appropriate regulatory entities. Given the long time periods over which the amounts were accrued and the changing of rates over time, the utility subsidiaries have estimated the amount of removal costs accumulated through historic depreciation expense based on current factors used in the existing depreciation rates.
The accumulated balances by entity were as follows at
Dec. 31
:
|
(Millions of Dollars)
|
2017
|
2016
|
||||||
|
NSP-Minnesota
|
$
|
442
|
|
$
|
419
|
|
||
|
PSCo
|
346
|
|
367
|
|
||||
|
SPS
|
197
|
|
209
|
|
||||
|
NSP-Wisconsin
|
146
|
|
140
|
|
||||
|
Total Xcel Energy
|
$
|
1,131
|
|
$
|
1,135
|
|
||
Nuclear Insurance
NSP-Minnesota’s public liability for claims resulting from any nuclear incident is limited to
$13.4 billion
under the Price-Anderson amendment to the Atomic Energy Act. NSP-Minnesota has secured
$450 million
of coverage for its public liability exposure with a pool of insurance companies. The remaining
$13.0 billion
of exposure is funded by the Secondary Financial Protection Program, available from assessments by the federal government in case of a nuclear incident. NSP-Minnesota is subject to assessments of up to
$127 million
per reactor-incident for each of its
three
licensed reactors, to be applied for public liability arising from a nuclear incident at any licensed nuclear facility in the United States. The maximum funding requirement is
$19 million
per reactor per incident during any one year. These maximum assessment amounts are both subject to inflation adjustment by the NRC and state premium taxes. The NRC’s last adjustment was effective September 2013.
NSP-Minnesota purchases insurance for property damage and site decontamination cleanup costs from Nuclear Electric Insurance Ltd. (NEIL) and European Mutual Association for Nuclear Insurance (EMANI). The coverage limits are
$2.3 billion
for each of NSP-Minnesota’s
two
nuclear plant sites. NEIL also provides business interruption insurance coverage, including the cost of replacement power obtained during certain prolonged accidental outages of nuclear generating units. Premiums are expensed over the policy term. All companies insured with NEIL are subject to retroactive premium adjustments if losses exceed accumulated reserve funds. Capital has been accumulated in the reserve funds of NEIL and EMANI to the extent that NSP-Minnesota would have no exposure for retroactive premium assessments in case of a single incident under the business interruption and the property damage insurance coverage. However, in each calendar year, NSP-Minnesota could be subject to maximum assessments of approximately
$19 million
for business interruption insurance and
$41 million
for property damage insurance if losses exceed accumulated reserve funds.
Legal Contingencies
Xcel Energy is involved in various litigation matters that are being defended and handled in the ordinary course of business. The assessment of whether a loss is probable or is a reasonable possibility, and whether the loss or a range of loss is estimable, often involves a series of complex judgments about future events. Management maintains accruals for such losses that are probable of being incurred and subject to reasonable estimation. Management is sometimes unable to estimate an amount or range of a reasonably possible loss in certain situations, including but not limited to when (1) the damages sought are indeterminate, (2) the proceedings are in the early stages, or (3) the matters involve novel or unsettled legal theories. In such cases, there is considerable uncertainty regarding the timing or ultimate resolution of such matters, including a possible eventual loss. For current proceedings not specifically reported herein, management does not anticipate that the ultimate liabilities, if any, arising from such current proceedings would have a material effect on Xcel Energy’s financial statements. Unless otherwise required by GAAP, legal fees are expensed as incurred.
148
Employment, Tort and Commercial Litigation
Gas Trading Litigation —
e prime inc. (e prime) is a wholly owned subsidiary of Xcel Energy Inc. e prime was in the business of natural gas trading and marketing but has not engaged in natural gas trading or marketing activities since 2003.
Thirteen
lawsuits were commenced against e prime and Xcel Energy (and NSP-Wisconsin, in
two
instances) between 2003 and 2009 alleging fraud and anticompetitive activities in conspiring to restrain the trade of natural gas and manipulate natural gas prices.
e prime, Xcel Energy Inc. and its other affiliates were sued along with several other gas marketing companies. These cases were all consolidated in the U.S. District Court in Nevada.
Six
of the cases remain active, which includes a multi-district litigation (MDL) matter consisting of a Colorado class (Breckenridge), a Wisconsin class (Arandell Corp.), a Missouri class, a Kansas class, and
two
other cases identified as “Sinclair Oil” and “Farmland.” In March 2017, summary judgment was granted by the MDL judge in favor of Xcel Energy and e prime in the Sinclair Oil and Farmland cases. In November 2017, the U.S District Court in Nevada granted summary judgment against
two
plaintiffs in the Arandell Corp. case in favor of Xcel Energy and NSP-Wisconsin, leaving only
three
individual plaintiffs remaining in the litigation. In addition, the plaintiffs’ motions for class certification and remand back to originating courts in these cases were denied in March 2017. Plaintiffs have appealed the summary judgment motions granted in the Farmland and Sinclair Oil cases and the denial of class certification and remand to the U.S. Court of Appeals for the Ninth Circuit (Ninth Circuit). Oral arguments were heard before the Ninth Circuit in February 2018. A final decision is expected by the end of the first quarter of 2019. Xcel Energy, NSP-Wisconsin and e prime have concluded that a loss is remote.
Line Extension Disputes
— In December 2015, Development Recovery Company (DRC) filed a lawsuit in the Denver District Court, stating PSCo failed to award proper allowances and refunds for line extensions to new developments pursuant to the terms of electric and gas service agreements entered into by PSCo and various developers. The dispute involves claims by over
fifty
developers. In May 2016, the Denver District Court granted PSCo’s motion to dismiss the lawsuit, concluding that jurisdiction over this dispute resides with the CPUC. In June 2016, DRC appealed the Denver District Court’s dismissal of the lawsuit, and the Colorado Court of Appeals affirmed the lower court decision in favor of PSCo. In July 2017, DRC filed a petition to appeal the decision with the Colorado Supreme Court. In February 2018, the Colorado Supreme Court denied DRC’s petition effectively terminating this litigation.
In January 2018, DRC filed a new lawsuit in Boulder County District Court, asserting a single claim that PSCo was required to file its line extension agreements with the CPUC but failed to do so. This claim is substantially similar to the arguments previously raised by DRC. Dates for this proceeding have not been scheduled.
PSCo has concluded that a loss is remote with respect to both of these matters as the service agreements were developed to implement CPUC approved tariffs and PSCo has complied with the tariff provisions. Also, if a loss were sustained, PSCo believes it would be allowed to recover these costs through traditional regulatory mechanisms. The amount or range in dispute is presently unknown and
no
accrual has been recorded for this matter.
Other Contingencies
See Note 12 for further discussion.
|
14.
|
Nuclear Obligations
|
Fuel Disposal
— NSP-Minnesota is responsible for temporarily storing used or spent nuclear fuel from its nuclear plants. The DOE is responsible for permanently storing spent fuel from U.S. nuclear plants, but no such facility is yet available. NSP-Minnesota has funded its portion of the DOE’s permanent disposal program since 1981. Through May 2014, the fuel disposal fees were based on a charge of
0.1 cent
per KWh sold to customers from nuclear generation. Since that time, the DOE has set the fee to
zero
. There were
no
DOE fuel disposal assessments in
2017
or
2016
.
NSP-Minnesota has its own temporary on-site storage facilities for spent fuel at its Monticello and PI nuclear plants, which consist of storage pools and dry cask facilities at both sites. The amount of spent fuel storage capacity is determined by the NRC and the MPUC. The Monticello dry-cask storage facility currently stores
16
of the
30
authorized canisters, and the PI dry-cask storage facility currently stores
40
of the
64
authorized casks.
Regulatory Plant Decommissioning Recovery
— Decommissioning activities related to NSP-Minnesota’s nuclear facilities are planned to begin at the end of each unit’s operating license and be completed by 2091. NSP-Minnesota’s current operating licenses allow continued use of its Monticello nuclear plant until 2030 and its PI nuclear plant until 2033 for Unit 1 and 2034 for Unit 2.
Future decommissioning costs of nuclear facilities are estimated through triennial periodic studies that assess the costs and timing of planned nuclear decommissioning activities for each unit. The MPUC most recently approved NSP-Minnesota’s 2014 nuclear decommissioning study in October 2015. This cost study quantified decommissioning costs in 2014 dollars and utilized escalation rates of
4.36 percent
per year for plant removal activities, and
3.36 percent
for spent fuel management and site restoration activities over a
60
-year decommissioning scenario.
The total obligation for decommissioning is expected to be funded
100 percent
by the external decommissioning trust fund when decommissioning commences. NSP-Minnesota’s most recently approved decommissioning study resulted in an annual funding requirement of
$14 million
to be recovered in utility customer rates which started in 2016. This cost study assumes the external decommissioning fund will earn an after-tax return between
5.23 percent
and
6.30 percent
. Realized and unrealized gains on fund investments are deferred as an offset of NSP-Minnesota’s regulatory asset for nuclear decommissioning costs.
As of
Dec. 31, 2017
, NSP-Minnesota has accumulated
$2.1 billion
of assets held in external decommissioning trusts. The following table summarizes the funded status of NSP-Minnesota’s decommissioning obligation based on parameters established in the most recently approved decommissioning study. Xcel Energy believes future decommissioning costs, if necessary, will continue to be recovered in customer rates. The amounts presented below were prepared on a regulatory basis, and are not recorded in the financial statements for the ARO.
|
Regulatory Basis
|
||||||||
|
(Millions of Dollars)
|
2017
|
2016
|
||||||
|
Estimated decommissioning cost obligation from most recently approved study (in 2014 dollars)
|
$
|
3,012
|
|
$
|
3,012
|
|
||
|
Effect of escalating costs (to 2017 and 2016 dollars, respectively, at 4.36/3.36 percent)
|
396
|
|
258
|
|
||||
|
Estimated decommissioning cost obligation (in current dollars)
|
3,408
|
|
3,270
|
|
||||
|
Effect of escalating costs to payment date (4.36/3.36 percent)
|
7,797
|
|
7,935
|
|
||||
|
Estimated future decommissioning costs (undiscounted)
|
11,205
|
|
11,205
|
|
||||
|
Effect of discounting obligation (using average risk-free interest rate of 2.80 percent and 3.25 percent for 2017 and 2016, respectively)
|
(6,398
|
)
|
(7,068
|
)
|
||||
|
Discounted decommissioning cost obligation
|
$
|
4,807
|
|
$
|
4,137
|
|
||
|
Assets held in external decommissioning trust
|
$
|
2,143
|
|
$
|
1,861
|
|
||
|
Underfunding of external decommissioning fund compared to the discounted decommissioning obligation
|
2,664
|
|
2,276
|
|
||||
149
Calculations and data used by the regulator in approving NSP-Minnesota’s rates are useful in assessing future cash flows. The regulatory basis information is a means to reconcile amounts previously provided to the MPUC and utilized for regulatory purposes to amounts used for financial reporting. The following table provides a reconciliation of the discounted decommissioning cost obligation - regulated basis to the ARO recorded in accordance with GAAP:
|
(Millions of Dollars)
|
2017
|
2016
|
||||||
|
Discounted decommissioning cost obligation - regulated basis
|
$
|
4,807
|
|
$
|
4,137
|
|
||
|
Differences in discount rate and market risk premium
|
(1,403
|
)
|
(1,044
|
)
|
||||
|
O&M costs not included for GAAP
|
(1,041
|
)
|
(844
|
)
|
||||
|
ARO differences between 2017 and 2014 cost studies
|
(489
|
)
|
—
|
|
||||
|
Nuclear production decommissioning ARO - GAAP
|
$
|
1,874
|
|
$
|
2,249
|
|
||
Decommissioning expenses recognized as a result of regulation for the years ending Dec. 31 were:
|
(Millions of Dollars)
|
2017
|
2016
|
2015
|
|||||||||
|
Annual decommissioning recorded as depreciation expense:
(a) (b)
|
$
|
20
|
|
$
|
20
|
|
$
|
7
|
|
|||
|
(a)
|
Decommissioning expense does not include depreciation of the capitalized nuclear asset retirement costs.
|
|
(b)
|
Decommissioning expenses in 2017 and 2016 include Minnesota’s retail jurisdiction annual funding requirement of approximately $14 million. The 2015 expense was offset by the DOE settlement refund.
|
The 2014 nuclear decommissioning filing approved in 2015 has been used for the regulatory presentation for both 2017 and 2016. The most recent triennial filing was submitted in December 2017 and is currently pending with the MPUC, with an order expected in 2018.
|
15.
|
Regulatory Assets and Liabilities
|
Xcel Energy prepares its consolidated financial statements in accordance with the applicable accounting guidance, as discussed in Note 1. Under this guidance, regulatory assets and liabilities are created for amounts that regulators may allow to be collected, or may require to be paid back to customers in future electric and natural gas rates. Any portion of Xcel Energy’s business that is not regulated cannot establish regulatory assets and liabilities. If changes in the utility industry or the business of Xcel Energy no longer allow for the application of regulatory accounting guidance under GAAP, Xcel Energy would be required to recognize the write-off of regulatory assets and liabilities in net income or OCI.
150
The components of regulatory assets shown on the consolidated balance sheets at
Dec. 31, 2017
and
2016
are:
|
(Millions of Dollars)
|
See Note(s)
|
Remaining
Amortization Period |
Dec. 31, 2017
|
Dec. 31, 2016
|
|||||||||||||||||
|
Regulatory Assets
|
Current
|
Noncurrent
|
Current
|
Noncurrent
|
|||||||||||||||||
|
Pension and retiree medical obligations
(a)
|
9
|
|
Various
|
$
|
91
|
|
$
|
1,499
|
|
$
|
89
|
|
$
|
1,549
|
|
||||||
|
Net AROs
(b)
|
1, 13, 14
|
|
Plant lives
|
—
|
|
301
|
|
—
|
|
379
|
|
||||||||||
|
Excess deferred taxes - TCJA
|
6
|
|
Various
|
—
|
|
254
|
|
—
|
|
—
|
|
||||||||||
|
Recoverable deferred taxes on AFUDC recorded
in plant
(c)
|
1
|
|
Plant lives
|
—
|
|
244
|
|
—
|
|
424
|
|
||||||||||
|
Environmental remediation costs
|
1, 13
|
|
Various
|
16
|
|
165
|
|
11
|
|
165
|
|
||||||||||
|
Contract valuation adjustments
(d)
|
1, 11
|
|
Term of related contract
|
21
|
|
93
|
|
18
|
|
111
|
|
||||||||||
|
Depreciation differences
|
1
|
|
One to fourteen years
|
20
|
|
69
|
|
15
|
|
90
|
|
||||||||||
|
Purchased power contract costs
|
13
|
|
Term of related contract
|
3
|
|
67
|
|
2
|
|
70
|
|
||||||||||
|
PI EPU
|
12
|
|
Seventeen years
|
3
|
|
58
|
|
3
|
|
62
|
|
||||||||||
|
Losses on reacquired debt
|
4
|
|
Term of related debt
|
5
|
|
48
|
|
4
|
|
23
|
|
||||||||||
|
Conservation programs
(e)
|
1
|
|
One to two years
|
50
|
|
32
|
|
48
|
|
48
|
|
||||||||||
|
State commission adjustments
|
1
|
|
Plant lives
|
1
|
|
29
|
|
1
|
|
27
|
|
||||||||||
|
Property tax
|
Various
|
8
|
|
24
|
|
9
|
|
2
|
|
||||||||||||
|
Nuclear refueling outage costs
|
1
|
|
One to two years
|
49
|
|
20
|
|
49
|
|
16
|
|
||||||||||
|
Deferred purchased natural gas and electric energy costs
|
1
|
|
Various
|
21
|
|
13
|
|
18
|
|
16
|
|
||||||||||
|
Sales true up and revenue decoupling
|
One to two years
|
37
|
|
12
|
|
—
|
|
—
|
|
||||||||||||
|
Gas pipeline inspection and remediation costs
|
12
|
|
One to two years
|
24
|
|
12
|
|
7
|
|
14
|
|
||||||||||
|
Renewable resources and environmental initiatives
|
13
|
|
One to three years
|
48
|
|
10
|
|
34
|
|
23
|
|
||||||||||
|
Other
|
Various
|
27
|
|
55
|
|
56
|
|
62
|
|
||||||||||||
|
Total regulatory assets
|
$
|
424
|
|
$
|
3,005
|
|
$
|
364
|
|
$
|
3,081
|
|
|||||||||
|
(a)
|
Includes
$179 million
and
$241 million
for the regulatory recognition of the NSP-Minnesota pension expense, of which
$9 million
and
$15 million
is included in the current asset at
Dec. 31, 2017
and
2016
, respectively. Also included are
$8 million
and
$11 million
of regulatory assets related to the nonqualified pension plan, of which
$1 million
and
$3 million
is included in the current asset at
Dec. 31, 2017
and
2016
, respectively.
|
|
(b)
|
Includes amounts recorded for future recovery of AROs, less amounts recovered through nuclear decommissioning accruals and gains from decommissioning investments.
|
|
(c)
|
Includes a write-down of
$202 million
as a result of the revaluation of deferred tax gross up at the new federal tax rate at Dec. 31, 2017.
|
|
(d)
|
Includes the fair value of certain long-term PPAs used to meet energy capacity requirements and valuation adjustments on natural gas commodity purchases.
|
|
(e)
|
Includes costs for conservation programs, as well as incentives allowed in certain jurisdictions.
|
The components of regulatory liabilities shown on the consolidated balance sheets at
Dec. 31, 2017
and
2016
are:
|
(Millions of Dollars)
|
See Note(s)
|
Remaining
Amortization Period |
Dec. 31, 2017
|
Dec. 31, 2016
|
||||||||||||||||
|
Regulatory Liabilities
|
Current
|
Noncurrent
|
Current
|
Noncurrent
|
||||||||||||||||
|
Excess deferred taxes - TCJA
(a)
|
6
|
Various
|
$
|
—
|
|
$
|
3,733
|
|
$
|
—
|
|
$
|
—
|
|
||||||
|
Plant removal costs
|
1, 13
|
Plant lives
|
—
|
|
1,131
|
|
—
|
|
1,135
|
|
||||||||||
|
Renewable resources and environmental initiatives
|
12, 13
|
Various
|
19
|
|
56
|
|
5
|
|
71
|
|
||||||||||
|
ITC deferrals
|
1, 6
|
Various
|
—
|
|
42
|
|
—
|
|
45
|
|
||||||||||
|
Deferred income tax adjustment
|
1, 6
|
Various
|
—
|
|
38
|
|
—
|
|
48
|
|
||||||||||
|
Deferred electric, natural gas and steam production costs
|
1
|
Less than one year
|
104
|
|
—
|
|
98
|
|
—
|
|
||||||||||
|
Contract valuation adjustments
(b)
|
1, 11
|
Term of related contract
|
30
|
|
—
|
|
22
|
|
2
|
|
||||||||||
|
Conservation programs
(c)
|
1, 12
|
Less than one year
|
23
|
|
—
|
|
25
|
|
—
|
|
||||||||||
|
DOE settlement
|
|
Less than one year
|
18
|
|
—
|
|
20
|
|
—
|
|
||||||||||
|
Other
|
Various
|
45
|
|
83
|
|
51
|
|
82
|
|
|||||||||||
|
Total regulatory liabilities
(d)
|
$
|
239
|
|
$
|
5,083
|
|
$
|
221
|
|
$
|
1,383
|
|
||||||||
|
(a)
|
Primarily relates to the revaluation of recoverable/regulated plant ADIT and
$174 million
revaluation impact of non-plant ADIT at Dec. 31, 2017.
|
|
(b)
|
Includes the fair value of certain long-term PPAs used to meet energy capacity requirements and valuation adjustments on natural gas commodity purchases.
|
|
(c)
|
Includes costs for conservation programs, as well as incentives allowed in certain jurisdictions.
|
|
(d)
|
Revenue subject to refund of
$15 million
and
$46 million
for 2017 and 2016, respectively, is included in other current liabilities.
|
151
At
Dec. 31, 2017
and
2016
, approximately
$250 million
and
$166 million
of Xcel Energy’s regulatory assets represented past expenditures not currently earning a return, respectively. This amount primarily includes recoverable purchased natural gas and electric energy costs and certain expenditures associated with pension and renewable resources and environmental initiatives.
|
16.
|
Other Comprehensive Income
|
Changes in accumulated other comprehensive (loss), net of tax, for the years ended
Dec. 31, 2017
and
2016
were as follows:
|
Year Ended Dec. 31, 2017
|
||||||||||||
|
(Millions of Dollars)
|
Gains and
Losses on Cash Flow Hedges
|
Defined Benefit
Pension and
Postretirement
Items
|
Total
|
|||||||||
|
Accumulated other comprehensive loss at Jan. 1
|
$
|
(51
|
)
|
$
|
(59
|
)
|
$
|
(110
|
)
|
|||
|
Other comprehensive loss before reclassifications
|
—
|
|
(3
|
)
|
(3
|
)
|
||||||
|
Losses reclassified from net accumulated other comprehensive loss
|
3
|
|
7
|
|
10
|
|
||||||
|
Net current period other comprehensive income
|
3
|
|
4
|
|
7
|
|
||||||
|
Adoption of ASU No. 2018-02
(a)
|
(10
|
)
|
(12
|
)
|
(22
|
)
|
||||||
|
Accumulated other comprehensive loss at Dec. 31
|
$
|
(58
|
)
|
$
|
(67
|
)
|
$
|
(125
|
)
|
|||
|
(a)
|
In 2017, Xcel Energy implemented ASU No. 2018-02 related to the TCJA, which resulted in reclassification of certain credit balances within net accumulated other comprehensive loss to retained earnings. For further information, see Note 2.
|
|
Year Ended Dec. 31, 2016
|
||||||||||||
|
(Millions of Dollars)
|
Gains and
Losses on Cash Flow Hedges |
Defined Benefit
Pension and Postretirement Items |
Total
|
|||||||||
|
Accumulated other comprehensive loss at Jan. 1
|
$
|
(55
|
)
|
$
|
(55
|
)
|
$
|
(110
|
)
|
|||
|
Other comprehensive loss before reclassifications
|
—
|
|
(8
|
)
|
(8
|
)
|
||||||
|
Losses reclassified from net accumulated other comprehensive loss
|
4
|
|
4
|
|
8
|
|
||||||
|
Net current period other comprehensive income (loss)
|
4
|
|
(4
|
)
|
—
|
|
||||||
|
Accumulated other comprehensive loss at Dec. 31
|
$
|
(51
|
)
|
$
|
(59
|
)
|
$
|
(110
|
)
|
|||
Reclassifications from accumulated other comprehensive loss for the years ended
Dec. 31, 2017
and
2016
were as follows:
|
Amounts Reclassified
from Accumulated
Other Comprehensive
Loss
|
|||||||||
|
(Millions of Dollars)
|
Year Ended
Dec. 31, 2017
|
Year Ended
Dec. 31, 2016
|
|||||||
|
Losses (gains) on cash flow hedges:
|
|||||||||
|
Interest rate derivatives
|
$
|
5
|
|
(a)
|
$
|
6
|
|
(a)
|
|
|
Total, pre-tax
|
5
|
|
6
|
|
|||||
|
Tax benefit
|
(2
|
)
|
(2
|
)
|
|||||
|
Total, net of tax
|
3
|
|
4
|
|
|||||
|
Defined benefit pension and postretirement losses (gains):
|
|||||||||
|
Amortization of net losses
|
12
|
|
(b)
|
6
|
|
(b)
|
|||
|
Total, pre-tax
|
12
|
|
6
|
|
|||||
|
Tax benefit
|
(5
|
)
|
(2
|
)
|
|||||
|
Total, net of tax
|
7
|
|
4
|
|
|||||
|
Total amounts reclassified, net of tax
|
$
|
10
|
|
$
|
8
|
|
|||
|
(a)
|
Included in interest charges.
|
|
(b)
|
Included in the computation of net periodic pension and postretirement benefit costs. See Note 9 for detail regarding these benefit plans.
|
17. Segments and Related Information
The regulated electric utility operating results of NSP-Minnesota, NSP-Wisconsin, PSCo and SPS, as well as the regulated natural gas utility operating results of NSP-Minnesota, NSP-Wisconsin and PSCo are each separately and regularly reviewed by Xcel Energy’s chief operating decision maker. Xcel Energy evaluates performance by each utility subsidiary based on profit or loss generated from the product or service provided. These segments are managed separately because the revenue streams are dependent upon regulated rate recovery, which is separately determined for each segment.
Xcel Energy has the following reportable segments: regulated electric utility, regulated natural gas utility and all other.
|
•
|
Xcel Energy’s regulated electric utility segment generates, transmits and distributes electricity in Minnesota, Wisconsin, Michigan, North Dakota, South Dakota, Colorado, Texas and New Mexico. In addition, this segment includes sales for resale and provides wholesale transmission service to various entities in the United States. Regulated electric utility also includes wholesale commodity and trading operations.
|
|
•
|
Xcel Energy’s regulated natural gas utility segment transports, stores and distributes natural gas primarily in portions of Minnesota, Wisconsin, North Dakota, Michigan and Colorado.
|
|
•
|
Revenues from operating segments not included above are below the necessary quantitative thresholds and are therefore included in the all other category. Those primarily include steam revenue, appliance repair services, nonutility real estate activities, revenues associated with processing solid waste into refuse-derived fuel and investments in rental housing projects that qualify for low-income housing tax credits.
|
Xcel Energy had equity investments in unconsolidated subsidiaries of
$140 million
and
$133 million
as of Dec. 31,
2017
and
2016
, respectively, included in the natural gas utility and all other segments.
Asset and capital expenditure information is not provided for Xcel Energy’s reportable segments because as an integrated electric and natural gas utility, Xcel Energy operates significant assets that are not dedicated to a specific business segment, and reporting assets and capital expenditures by business segment would require arbitrary and potentially misleading allocations which may not necessarily reflect the assets that would be required for the operation of the business segments on a stand-alone basis.
To report income from operations for regulated electric and regulated natural gas utility segments, the majority of costs are directly assigned to each segment. However, some costs, such as common depreciation, common O&M expenses and interest expense are allocated based on cost causation allocators. A general allocator is used for certain general and administrative expenses, including office supplies, rent, property insurance and general advertising.
The accounting policies of the segments are the same as those described in Note 1.
152
|
(Millions of Dollars)
|
Regulated
Electric
|
Regulated
Natural Gas
|
All Other
|
Reconciling
Eliminations
|
Consolidated
Total
|
|||||||||||||||
|
2017
|
||||||||||||||||||||
|
Operating revenues from external customers
|
$
|
9,676
|
|
$
|
1,650
|
|
$
|
78
|
|
$
|
—
|
|
$
|
11,404
|
|
|||||
|
Intersegment revenues
|
2
|
|
1
|
|
—
|
|
(3
|
)
|
—
|
|
||||||||||
|
Total revenues
|
$
|
9,678
|
|
$
|
1,651
|
|
$
|
78
|
|
$
|
(3
|
)
|
$
|
11,404
|
|
|||||
|
Depreciation and amortization
|
$
|
1,298
|
|
$
|
174
|
|
$
|
7
|
|
$
|
—
|
|
$
|
1,479
|
|
|||||
|
Interest charges and financing costs
|
449
|
|
57
|
|
122
|
|
—
|
|
628
|
|
||||||||||
|
Income tax expense (benefit)
|
528
|
|
23
|
|
(9
|
)
|
—
|
|
542
|
|
||||||||||
|
Net income (loss)
|
1,066
|
|
182
|
|
(100
|
)
|
—
|
|
1,148
|
|
||||||||||
|
(Millions of Dollars)
|
Regulated
Electric
|
Regulated
Natural Gas
|
All Other
|
Reconciling
Eliminations
|
Consolidated
Total
|
|||||||||||||||
|
2016
|
||||||||||||||||||||
|
Operating revenues from external customers
|
$
|
9,500
|
|
$
|
1,531
|
|
$
|
76
|
|
$
|
—
|
|
$
|
11,107
|
|
|||||
|
Intersegment revenues
|
1
|
|
1
|
|
—
|
|
(2
|
)
|
—
|
|
||||||||||
|
Total revenues
|
$
|
9,501
|
|
$
|
1,532
|
|
$
|
76
|
|
$
|
(2
|
)
|
$
|
11,107
|
|
|||||
|
Depreciation and amortization
|
$
|
1,136
|
|
$
|
160
|
|
$
|
7
|
|
$
|
—
|
|
$
|
1,303
|
|
|||||
|
Interest charges and financing costs
|
450
|
|
54
|
|
116
|
|
—
|
|
620
|
|
||||||||||
|
Income tax expense (benefit)
|
567
|
|
76
|
|
(62
|
)
|
—
|
|
581
|
|
||||||||||
|
Net income (loss)
|
1,067
|
|
124
|
|
(68
|
)
|
—
|
|
1,123
|
|
||||||||||
|
(Millions of Dollars)
|
Regulated
Electric
|
Regulated
Natural Gas
|
All Other
|
Reconciling
Eliminations
|
Consolidated
Total
|
|||||||||||||||
|
2015
|
||||||||||||||||||||
|
Operating revenues from external customers
|
$
|
9,276
|
|
$
|
1,672
|
|
$
|
76
|
|
$
|
—
|
|
$
|
11,024
|
|
|||||
|
Intersegment revenues
|
2
|
|
1
|
|
—
|
|
(3
|
)
|
—
|
|
||||||||||
|
Total revenues
|
$
|
9,278
|
|
$
|
1,673
|
|
$
|
76
|
|
$
|
(3
|
)
|
$
|
11,024
|
|
|||||
|
Depreciation and amortization
|
$
|
963
|
|
$
|
155
|
|
$
|
6
|
|
$
|
—
|
|
$
|
1,124
|
|
|||||
|
Interest charges and financing costs
|
426
|
|
50
|
|
93
|
|
—
|
|
569
|
|
||||||||||
|
Income tax expense (benefit)
|
509
|
|
60
|
|
(26
|
)
|
—
|
|
543
|
|
||||||||||
|
Net income (loss)
|
921
|
|
106
|
|
(43
|
)
|
—
|
|
984
|
|
||||||||||
|
18.
|
Summarized Quarterly Financial Data (Unaudited)
|
|
Quarter Ended
|
||||||||||||||||
|
(Amounts in millions, except per share data)
|
March 31, 2017
|
June 30, 2017
|
Sept. 30, 2017
|
Dec. 31, 2017
|
||||||||||||
|
Operating revenues
|
$
|
2,946
|
|
$
|
2,645
|
|
$
|
3,017
|
|
$
|
2,796
|
|
||||
|
Operating income
|
486
|
|
460
|
|
818
|
|
426
|
|
||||||||
|
Net income
|
239
|
|
227
|
|
492
|
|
189
|
|
||||||||
|
EPS total — basic
|
$
|
0.47
|
|
$
|
0.45
|
|
$
|
0.97
|
|
$
|
0.37
|
|
||||
|
EPS total — diluted
|
0.47
|
|
0.45
|
|
0.97
|
|
0.37
|
|
||||||||
|
Cash dividends declared per common share
|
0.36
|
|
0.36
|
|
0.36
|
|
0.36
|
|
||||||||
153
|
Quarter Ended
|
||||||||||||||||
|
(Amounts in millions, except per share data)
|
March 31, 2016
|
June 30, 2016
|
Sept. 30, 2016
|
Dec. 31, 2016
|
||||||||||||
|
Operating revenues
|
$
|
2,772
|
|
$
|
2,500
|
|
$
|
3,040
|
|
$
|
2,795
|
|
||||
|
Operating income
|
490
|
|
432
|
|
827
|
|
465
|
|
||||||||
|
Net income
|
241
|
|
197
|
|
458
|
|
227
|
|
||||||||
|
EPS total — basic
|
$
|
0.47
|
|
$
|
0.39
|
|
$
|
0.90
|
|
$
|
0.45
|
|
||||
|
EPS total — diluted
|
0.47
|
|
0.39
|
|
0.90
|
|
0.45
|
|
||||||||
|
Cash dividends declared per common share
|
0.34
|
|
0.34
|
|
0.34
|
|
0.34
|
|
||||||||
None.
Item 9A
—
Controls and Procedures
Disclosure Controls and Procedures
Xcel Energy maintains a set of disclosure controls and procedures designed to ensure that information required to be disclosed in reports that it files or submits under the Securities Exchange Act of 1934 is recorded, processed, summarized, and reported within the time periods specified in SEC rules and forms. In addition, the disclosure controls and procedures ensure that information required to be disclosed is accumulated and communicated to management, including the chief executive officer (CEO) and chief financial officer (CFO), allowing timely decisions regarding required disclosure. As of Dec. 31, 2017, based on an evaluation carried out under the supervision and with the participation of Xcel Energy’s management, including the CEO and CFO, of the effectiveness of its disclosure controls and the procedures, the CEO and CFO have concluded that Xcel Energy’s disclosure controls and procedures were effective.
Internal Control Over Financial Reporting
No change in Xcel Energy’s internal control over financial reporting has occurred during the most recent fiscal quarter that has materially affected, or is reasonably likely to materially affect, Xcel Energy’s internal control over financial reporting. Xcel Energy maintains internal control over financial reporting to provide reasonable assurance regarding the reliability of the financial reporting.
Xcel Energy has evaluated and documented its controls in process activities, general computer activities, and on an entity-wide level. During the year and in preparation for issuing its report for the year ended Dec. 31, 2017 on internal controls under section 404 of the Sarbanes-Oxley Act of 2002, Xcel Energy conducted testing and monitoring of its internal control over financial reporting. Based on the control evaluation, testing and remediation performed, Xcel Energy did not identify any material control weaknesses, as defined under the standards and rules issued by the Public Company Accounting Oversight Board and as approved by the SEC and as indicated in Management Report on Internal Controls herein.
In 2016, Xcel Energy implemented the general ledger modules, as well as initiated deployment of work management systems modules, of a new enterprise resource planning system to improve certain financial and related transaction processes. Xcel Energy implemented additional work management systems modules in 2017. Xcel Energy updated its internal control over financial reporting, as necessary, to accommodate modifications to its business processes and accounting systems. Xcel Energy does not believe that this implementation had an adverse effect on its internal control over financial reporting.
None.
154
Information required under this Item with respect to Directors and Corporate Governance is set forth in Xcel Energy Inc.’s Proxy Statement for its
2018
Annual Meeting of Shareholders, which is incorporated by reference. Information with respect to Executive Officers is included in Item 1 to this report.
Information required under this Item is set forth in Xcel Energy Inc.’s Proxy Statement for its
2018
Annual Meeting of Shareholders, which is incorporated by reference.
Information required under this Item is contained in Xcel Energy Inc.’s Proxy Statement for its
2018
Annual Meeting of Shareholders, which is incorporated by reference.
Information required under this Item is contained in Xcel Energy Inc.’s Proxy Statement for its
2018
Annual Meeting of Shareholders, which is incorporated by reference.
Information required under this Item is contained in Xcel Energy Inc.’s Proxy Statement for its 2018 Annual Meeting of Shareholders, which is incorporated by reference.
|
1.
|
Consolidated Financial Statements:
|
||||||||||
|
|
Management Report on Internal Controls Over Financial Reporting — For the year ended Dec. 31, 2017.
|
||||||||||
|
|
Report of Independent Registered Public Accounting Firm — Financial Statements
|
||||||||||
|
|
Report of Independent Registered Public Accounting Firm — Internal Controls Over Financial Reporting
|
||||||||||
|
|
Consolidated Statements of Income — For the three years ended Dec. 31, 2017, 2016, and 2015.
|
||||||||||
|
Consolidated Statements of Comprehensive Income — For the three years ended Dec. 31, 2017, 2016, and 2015.
|
|||||||||||
|
|
Consolidated Statements of Cash Flows — For the three years ended Dec. 31, 2017, 2016, and 2015.
|
||||||||||
|
|
Consolidated Balance Sheets — As of Dec. 31, 2017 and 2016.
|
||||||||||
|
Consolidated Statements of Common Stockholders’ Equity — For the three years ended Dec. 31, 2017, 2016, and 2015.
|
|||||||||||
|
Consolidated Statements of Capitalization — As of Dec. 31, 2017 and 2016.
|
|||||||||||
|
|
|
||||||||||
|
2.
|
Schedule I — Condensed Financial Information of Registrant.
|
||||||||||
|
|
Schedule II — Valuation and Qualifying Accounts and Reserves for the years ended Dec. 31, 2017, 2016 and 2015.
|
||||||||||
|
|
|
||||||||||
|
3.
|
Exhibits
|
||||||||||
|
*
|
Indicates incorporation by reference
|
||||||||||
|
+
|
Executive Compensation Arrangements and Benefit Plans Covering Executive Officers and Directors
|
||||||||||
|
Xcel Energy Inc.
|
|||||||||||
|
3.01
*
|
|||||||||||
|
3.02
*
|
|||||||||||
|
Xcel Energy Inc.
|
|||||||||||
155
156
157
158
159
160
|
101
|
The following materials from Xcel Energy Inc.’s Annual Report on Form 10-K for the year ended Dec. 31, 2017 are formatted in XBRL (eXtensible Business Reporting Language): (i) the Consolidated Statements of Income, (ii) the Consolidated Statements of Comprehensive Income, (iii) the Consolidated Statements of Cash Flows, (iv) the Consolidated Balance Sheets, (v) the Consolidated Statements of Common Stockholders’ Equity, (vi) Consolidated Statements of Capitalization, (vii) Notes to Consolidated Financial Statements, (viii) document and entity information, (ix) Schedule I, and (x) Schedule II.
|
||||||||||
161
SCHEDULE I
|
XCEL ENERGY INC.
CONDENSED STATEMENTS OF INCOME AND COMPREHENSIVE INCOME
(amounts in millions, except per share data)
|
|||||||||||
|
Year Ended Dec. 31
|
|||||||||||
|
2017
|
2016
|
2015
|
|||||||||
|
Income
|
|||||||||||
|
Equity earnings of subsidiaries
|
$
|
1,263
|
|
$
|
1,199
|
|
$
|
1,046
|
|
||
|
Total income
|
1,263
|
|
1,199
|
|
1,046
|
|
|||||
|
Expenses and other deductions
|
|||||||||||
|
Operating expenses
|
30
|
|
22
|
|
20
|
|
|||||
|
Other income
|
(6
|
)
|
(3
|
)
|
(1
|
)
|
|||||
|
Interest charges and financing costs
|
128
|
|
116
|
|
91
|
|
|||||
|
Total expenses and other deductions
|
152
|
|
135
|
|
110
|
|
|||||
|
Income before income taxes
|
1,111
|
|
1,064
|
|
936
|
|
|||||
|
Income tax benefit
|
(37
|
)
|
(59
|
)
|
(48
|
)
|
|||||
|
Net income
|
$
|
1,148
|
|
$
|
1,123
|
|
$
|
984
|
|
||
|
Other Comprehensive Income
|
|||||||||||
|
Pension and retiree medical benefits, net of tax of $3, $(3), and $(3) respectively
|
$
|
4
|
|
$
|
(4
|
)
|
$
|
(5
|
)
|
||
|
Derivative instruments, net of tax of $2, $2, and $2, respectively
|
3
|
|
4
|
|
3
|
|
|||||
|
Other comprehensive income (loss)
|
7
|
|
—
|
|
(2
|
)
|
|||||
|
Comprehensive income
|
$
|
1,155
|
|
$
|
1,123
|
|
$
|
982
|
|
||
|
Weighted average common shares outstanding:
|
|||||||||||
|
Basic
|
509
|
|
509
|
|
508
|
|
|||||
|
Diluted
|
509
|
|
509
|
|
508
|
|
|||||
|
Earnings per average common share:
|
|||||||||||
|
Basic
|
$
|
2.26
|
|
$
|
2.21
|
|
$
|
1.94
|
|
||
|
Diluted
|
2.25
|
|
2.21
|
|
1.94
|
|
|||||
|
Cash dividends declared per common share
|
1.44
|
|
1.36
|
|
1.28
|
|
|||||
|
See Notes to Condensed Financial Statements
|
|||||||||||
162
|
XCEL ENERGY INC.
CONDENSED STATEMENTS OF CASH FLOWS
(amounts in millions)
|
|||||||||||
|
Year Ended Dec. 31
|
|||||||||||
|
2017
|
2016
|
2015
|
|||||||||
|
Operating activities
|
|||||||||||
|
Net cash provided by operating activities
|
$
|
1,208
|
|
$
|
817
|
|
$
|
705
|
|
||
|
Investing activities
|
|||||||||||
|
Capital contributions to subsidiaries
|
(849
|
)
|
(414
|
)
|
(820
|
)
|
|||||
|
Investments in the utility money pool
|
(1,258
|
)
|
(1,880
|
)
|
(971
|
)
|
|||||
|
Return of investments in the utility money pool
|
1,173
|
|
1,880
|
|
987
|
|
|||||
|
Net cash used in investing activities
|
(934
|
)
|
(414
|
)
|
(804
|
)
|
|||||
|
Financing activities
|
|||||||||||
|
Proceeds from (repayment of) short-term borrowings, net
|
715
|
|
(516
|
)
|
204
|
|
|||||
|
Proceeds from issuance of long-term debt
|
—
|
|
1,539
|
|
495
|
|
|||||
|
Repayment of long-term debt
|
(250
|
)
|
(704
|
)
|
—
|
|
|||||
|
Proceeds from issuance of common stock
|
—
|
|
—
|
|
7
|
|
|||||
|
Repurchase of common stock
|
(3
|
)
|
(32
|
)
|
—
|
|
|||||
|
Dividends paid
|
(721
|
)
|
(681
|
)
|
(607
|
)
|
|||||
|
Other
|
(14
|
)
|
(9
|
)
|
(1
|
)
|
|||||
|
Net cash (used in) provided by financing activities
|
(273
|
)
|
(403
|
)
|
98
|
|
|||||
|
Net change in cash and cash equivalents
|
1
|
|
—
|
|
(1
|
)
|
|||||
|
Cash and cash equivalents at beginning of period
|
—
|
|
—
|
|
1
|
|
|||||
|
Cash and cash equivalents at end of period
|
$
|
1
|
|
$
|
—
|
|
$
|
—
|
|
||
|
See Notes to Condensed Financial Statements
|
|||||||||||
163
|
XCEL ENERGY INC.
CONDENSED BALANCE SHEETS
(amounts in millions)
|
|||||||
|
Dec. 31
|
|||||||
|
2017
|
2016
|
||||||
|
Assets
|
|||||||
|
Cash and cash equivalents
|
$
|
1
|
|
$
|
—
|
|
|
|
Accounts receivable from subsidiaries
|
302
|
|
364
|
|
|||
|
Other current assets
|
1
|
|
10
|
|
|||
|
Total current assets
|
304
|
|
374
|
|
|||
|
Investment in subsidiaries
|
14,932
|
|
13,904
|
|
|||
|
Other assets
|
103
|
|
163
|
|
|||
|
Total other assets
|
15,035
|
|
14,067
|
|
|||
|
Total assets
|
$
|
15,339
|
|
$
|
14,441
|
|
|
|
Liabilities and Equity
|
|||||||
|
Current portion of long-term debt
|
$
|
—
|
|
$
|
250
|
|
|
|
Dividends payable
|
183
|
|
172
|
|
|||
|
Short-term debt
|
783
|
|
68
|
|
|||
|
Other current liabilities
|
11
|
|
18
|
|
|||
|
Total current liabilities
|
977
|
|
508
|
|
|||
|
Other liabilities
|
29
|
|
37
|
|
|||
|
Total other liabilities
|
29
|
|
37
|
|
|||
|
Commitments and contingencies
|
|
|
|
|
|||
|
Capitalization
|
|||||||
|
Long-term debt
|
2,878
|
|
2,875
|
|
|||
|
Common stockholders’ equity
|
11,455
|
|
11,021
|
|
|||
|
Total capitalization
|
14,333
|
|
13,896
|
|
|||
|
Total liabilities and equity
|
$
|
15,339
|
|
$
|
14,441
|
|
|
|
See Notes to Condensed Financial Statements
|
|||||||
164
NOTES TO CONDENSED FINANCIAL STATEMENTS
Incorporated by reference are Xcel Energy’s consolidated statements of common stockholders’ equity and OCI in Part II, Item 8.
Basis of Presentation
— The condensed financial information of Xcel Energy Inc. is presented to comply with Rule 12-04 of Regulation S-X. Xcel Energy Inc.’s investments in subsidiaries are presented under the equity method of accounting. Under this method, the assets and liabilities of subsidiaries are not consolidated. The investments in net assets of the subsidiaries are recorded in the balance sheets. The income from operations of the subsidiaries is reported on a net basis as equity in income of subsidiaries.
As a holding company with no business operations, Xcel Energy Inc.’s assets consist primarily of investments in its utility subsidiaries. Xcel Energy Inc.’s material cash inflows are only from dividends and other payments received from its utility subsidiaries and the proceeds raised from the sale of debt and equity securities. The ability of its utility subsidiaries to make dividend and other payments is subject to the availability of funds after taking into account their respective funding requirements, the terms of their respective indebtedness, the regulations of the FERC under the Federal Power Act, and applicable state laws. Management does not expect maintaining these requirements to have an impact on Xcel Energy Inc.’s ability to pay dividends at the current level in the foreseeable future. Each of its utility subsidiaries, however, is legally distinct and has no obligation, contingent or otherwise, to make funds available to Xcel Energy Inc.
Related Party Transactions
— Xcel Energy Inc. presents its related party receivables net of payables. Accounts receivable and payable with affiliates at Dec. 31 were:
|
|
2017
|
2016
|
||||||||||||||
|
(Millions of Dollars)
|
Accounts Receivable
|
Accounts Payable
|
Accounts Receivable
|
Accounts Payable
|
||||||||||||
|
NSP-Minnesota
|
$
|
68
|
|
$
|
—
|
|
$
|
59
|
|
$
|
—
|
|
||||
|
NSP-Wisconsin
|
13
|
|
—
|
|
14
|
|
—
|
|
||||||||
|
PSCo
|
69
|
|
—
|
|
132
|
|
—
|
|
||||||||
|
SPS
|
26
|
|
—
|
|
31
|
|
—
|
|
||||||||
|
Xcel Energy Services Inc.
|
95
|
|
—
|
|
93
|
|
—
|
|
||||||||
|
Xcel Energy Ventures Inc.
|
14
|
|
—
|
|
17
|
|
—
|
|
||||||||
|
Other subsidiaries of Xcel Energy Inc.
|
17
|
|
—
|
|
18
|
|
—
|
|
||||||||
|
|
$
|
302
|
|
$
|
—
|
|
$
|
364
|
|
$
|
—
|
|
||||
Dividends
— Cash dividends paid to Xcel Energy Inc. by its subsidiaries were
$1,063 million
,
$923 million
and
$784 million
for the years ended
Dec. 31, 2017
,
2016
and
2015
, respectively. These cash receipts are included in operating cash flows of the condensed statements of cash flows.
Money Pool
—
Xcel Energy received FERC approval to establish a utility money pool arrangement with the utility subsidiaries, subject to receipt of required state regulatory approvals. The utility money pool allows for short-term investments in and borrowings between the utility subsidiaries. Xcel Energy Inc. may make investments in the utility subsidiaries at market-based interest rates; however, the money pool arrangement does not allow the utility subsidiaries to make investments in Xcel Energy Inc. The following tables present money pool lending for Xcel Energy Inc.:
|
(Amounts in Millions, Except Interest Rates)
|
Three Months Ended Dec. 31, 2017
|
|||
|
Loan outstanding at period end
|
85
|
|
||
|
Average loan outstanding
|
36
|
|
||
|
Maximum loan outstanding
|
85
|
|
||
|
Weighted average interest rate, computed on a daily basis
|
1.15
|
%
|
||
|
Weighted average interest rate at end of period
|
1.18
|
%
|
||
|
Money pool interest income
|
$
|
0.1
|
|
|
165
|
(Amounts in Millions, Except Interest Rates)
|
Year Ended
Dec. 31, 2017
|
Year Ended
Dec. 31, 2016
|
Year Ended
Dec. 31, 2015
|
|||||||||
|
Loan outstanding at period end
|
85
|
|
—
|
|
—
|
|
||||||
|
Average loan outstanding
|
38
|
|
66
|
|
27
|
|
||||||
|
Maximum loan outstanding
|
226
|
|
211
|
|
141
|
|
||||||
|
Weighted average interest rate, computed on a daily basis
|
1.13
|
%
|
0.69
|
%
|
0.42
|
%
|
||||||
|
Weighted average interest rate at end of period
|
1.18
|
%
|
N/A
|
|
N/A
|
|
||||||
|
Money pool interest income
|
$
|
0.4
|
|
$
|
0.5
|
|
$
|
0.1
|
|
|||
See Xcel Energy’s notes to the consolidated financial statements in Part II, Item 8 for other disclosures.
166
SCHEDULE II
|
XCEL ENERGY INC. AND SUBSIDIARIES
VALUATION AND QUALIFYING ACCOUNTS
YEARS ENDED DEC. 31, 2017, 2016 AND 2015
(amounts in millions)
|
|||||||||||||||||||
|
Additions
|
|||||||||||||||||||
|
Balance at
Jan. 1
|
Charged to
Costs and
Expenses
|
Charged to
Other
Accounts
(a)
|
Deductions from
Reserves
(b)
|
Balance at
Dec. 31
|
|||||||||||||||
|
Allowance for bad debts:
|
|||||||||||||||||||
|
2017
|
$
|
51
|
|
$
|
39
|
|
$
|
10
|
|
$
|
48
|
|
$
|
52
|
|
||||
|
2016
|
52
|
|
39
|
|
11
|
|
51
|
|
51
|
|
|||||||||
|
2015
|
58
|
|
36
|
|
12
|
|
54
|
|
52
|
|
|||||||||
|
NOL and tax credit valuation allowances:
|
|||||||||||||||||||
|
2017
|
$
|
58
|
|
$
|
9
|
|
$
|
22
|
|
$
|
12
|
|
$
|
77
|
|
||||
|
2016
|
28
|
|
3
|
|
35
|
|
8
|
|
58
|
|
|||||||||
|
2015
|
3
|
|
2
|
|
25
|
|
2
|
|
28
|
|
|||||||||
|
(a)
|
Accrual of valuation allowance for North Dakota ITC, offset to regulatory liability.
|
|
(b)
|
Reductions to valuation allowances for North Dakota ITC carryforwards primarily due to a consolidated adjustment to the regulatory liability accrual referenced above. Reductions to valuation allowances for NOL carryforwards primarily due to changes in forecasted taxable income.
|
None.
167
SIGNATURES
Pursuant to the requirements of Section 13 or 15(d) of the Securities Exchange Act of 1934, the registrant has duly caused this annual report to be signed on its behalf by the undersigned thereunto duly authorized.
|
XCEL ENERGY INC.
|
||
|
|
|
|
|
Feb. 23, 2018
|
By:
|
/s/ ROBERT C. FRENZEL
|
|
Robert C. Frenzel
|
||
|
Executive Vice President, Chief Financial Officer
|
||
|
(Principal Financial Officer)
|
||
Pursuant to the requirements of the Securities Exchange Act of 1934, this report has been signed below by the following persons on behalf of the registrant and in the capacities on the date indicated above.
|
/s/ BEN FOWKE
|
Chairman, President, Chief Executive Officer and Director
|
||
|
Ben Fowke
|
(Principal Executive Officer)
|
||
|
|
|
||
|
/s/ ROBERT C. FRENZEL
|
Executive Vice President, Chief Financial Officer
|
||
|
Robert C. Frenzel
|
(Principal Financial Officer)
|
||
|
|
|
||
|
/s/ JEFFREY S. SAVAGE
|
Senior Vice President, Controller
|
||
|
Jeffrey S. Savage
|
(Principal Accounting Officer)
|
||
|
|
|
||
|
|
|
||
|
*
|
Director
|
||
|
Richard K. Davis
|
|||
|
|
|
|
|
|
*
|
Director
|
||
|
Richard T. O’Brien
|
|||
|
|
|
|
|
|
*
|
Director
|
||
|
David K. Owens
|
|||
|
*
|
Director
|
||
|
Christopher J. Policinski
|
|||
|
*
|
Director
|
||
|
James Prokopanko
|
|||
|
|
|
|
|
|
*
|
Director
|
||
|
A. Patricia Sampson
|
|||
|
|
|
|
|
|
*
|
Director
|
||
|
James J. Sheppard
|
|||
|
|
|
|
|
|
*
|
Director
|
||
|
David A. Westerlund
|
|||
|
|
|
|
|
|
*
|
Director
|
||
|
Kim Williams
|
|||
|
|
|
|
|
|
*
|
Director
|
||
|
Timothy V. Wolf
|
|||
|
|
|
|
|
|
*
|
Director
|
||
|
Daniel Yohannes
|
|||
|
|
|
|
|
|
*By:
|
/s/ ROBERT C. FRENZEL
|
Attorney-in-Fact
|
|
|
Robert C. Frenzel
|
|||
168
TABLE OF CONTENTS
Part IItem 1 BusinessItem 1A Risk FactorsItem 1B Unresolved Staff CommentsItem 2 PropertiesItem 3 Legal ProceedingsItem 4 Mine Safety DisclosuresPart IIItem 5 Market For Registrant S Common Equity, Related Stockholder Matters and Issuer Purchases Of Equity SecuritiesItem 6 Selected Financial DataItem 7 Management S Discussion and Analysis Of Financial Condition and Results Of OperationsItem 7A Quantitative and Qualitative Disclosures About Market RiskItem 8 Financial Statements and Supplementary DataItem 9 Changes in and Disagreements with Accountants on Accounting and Financial DisclosureItem 9A Controls and ProceduresItem 9B Other InformationPart IIIItem 10 Directors, Executive Officers and Corporate GovernanceItem 11 Executive CompensationItem 12 Security Ownership Of Certain Beneficial Owners and Management and Related Stockholder MattersItem 13 Certain Relationships and Related Transactions, and Director IndependenceItem 14 Principal Accountant Fees and ServicesPart IVItem 15 Exhibits, Financial Statement SchedulesItem 16 Form 10-k Summary