XILINX INC
10-Ks and 10-Qs
|
|
|
|
|
|
|
|
|
|
|
|
|
|
|
|
|
|
|
|
|
|
|
|
|
|
|
|
|
|
|
|
|
|
|
United States
Securities and Exchange Commission
Washington, D.C. 20549
FORM
10-K
|
(Mark One)
|
|
|
|
Annual report pursuant to Section 13 or 15(d) of the Securities Exchange Act of 1934
|
For the fiscal year ended
March 28, 2020
|
|
Transition report pursuant to section 13 or 15(d) of the Securities Exchange Act of 1934
|
For the transition period from ___________ to ____________.
Commission File Number
000-18548
(Exact name of registrant as specified in its charter)
|
|
|
|
|
|
|
(State or other jurisdiction of
incorporation or organization)
|
|
|
|
(I.R.S. Employer
Identification No.)
|
|
|
|
|
||
|
(Address of principal executive offices)
|
(Zip Code)
|
|||
(Registrant's telephone number, including area code)
(
408
)
559-7778
Securities registered pursuant to Section 12(b) of the Act:
|
Title of each class
|
Trading Symbol
|
Name of each exchange on which registered
|
|
|
|
|
Securities registered pursuant to Section 12(g) of the Act: None
Indicate by check mark if the registrant is a well-known seasoned issuer, as defined in Rule 405 of the Securities Act.
Yes
þ
No
o
Indicate by check mark if the registrant is not required to file reports pursuant to Section 13 or Section 15(d) of the Act. Yes
o
No
þ
Indicate by check mark whether the registrant (1) has filed all reports required to be filed by Section 13 or 15(d) of the Securities Exchange Act of 1934 during the preceding 12 months (or for such shorter period that the registrant was required to file such reports), and (2) has been subject to such filing requirements for the past 90 days.
Yes
þ
No
o
Indicate by check mark whether the registrant has submitted electronically every Interactive Data File required to be submitted pursuant to Rule 405 of Regulation S-T (§ 232.405) during the preceding 12 months (or for such shorter period that the registrant was required to submit such files).
Yes
þ
No
o
Indicate by check mark whether the registrant is a large accelerated filer, an accelerated filer, a non-accelerated filer, a smaller reporting company or an emerging growth company. See the definitions of "large accelerated filer," "accelerated filer", "smaller reporting company" and "emerging growth company" in Rule 12b-2 of the Exchange Act.
|
|
þ
|
Accelerated filer
|
o
|
Non-accelerated filer
|
o
|
|
Smaller reporting company
|
|
Emerging growth company
|
|
||
|
If an emerging growth company, indicate by check mark if the registrant has elected not to use the extended transition period for complying with any new or revised financial accounting standards provided pursuant to Section 13(a) of the Exchange Act.
|
o
|
||||
Indicate by check mark whether the registrant has filed a report on and attestation to its management’s assessment of the effectiveness of its internal control over financial reporting under Section 404(b) of the Sarbanes-Oxley Act (15 U.S.C. 7262(b)) by the registered public accounting firm that prepared or issued its audit report
þ
Indicate by check mark whether the registrant is a shell company (as defined in Rule 12b-2 of the Act). Yes
☐
No
þ
The aggregate market value of the voting stock held by non-affiliates of the registrant based upon the closing price of the registrant's common stock on
September 28, 2019
as reported on the Nasdaq Global Select Market was approximately
$
19,724,323,000
. Shares of common stock held by each executive officer and director and by each person who owns 5% or more of the outstanding common stock have been excluded in that such persons may be deemed affiliates. This determination of affiliate status is not necessarily a conclusive determination for other purposes.
As of
April 24, 2020
, the registrant had approximately
243,846,000
shares of Common Stock outstanding.
DOCUMENTS INCORPORATED BY REFERENCE
Parts of the Proxy Statement for the Registrant's Annual Meeting of Stockholders to be held on August 5, 2020 are incorporated by reference into Part III of this Annual Report on Form 10-K.
Xilinx, Inc.
Form 10-K
For the Fiscal Year Ended
March 28, 2020
TABLE OF CONTENTS
2
FORWARD-LOOKING STATEMENTS
This Annual Report on Form 10-K contains forward-looking statements
within the meaning of the Private Securities Litigation Reform Act of 1995. Forward-looking statements may be found throughout this Annual Report, which may include discussions concerning our development efforts, strategy, new product introductions, backlog, litigation and other matters, including potential risks and other statements regarding the COVID-19 pandemic. Forward-looking statements involve numerous known and unknown risks and uncertainties and are based on current expectations that could cause actual results to differ materially and adversely from those expressed or implied. Such risks include, but are not limited to, those discussed throughout this document as well as in Item 1A "Risk Factors" and elsewhere in this document. Often, forward-looking statements can be identified by the use of forward-looking words, such as "may," "will," "could," "should," "expect," "believe," "anticipate," "estimate," "continue," "plan," "would," "intend," "project" and other similar terminology, or the negative of such terms. We disclaim any responsibility to update or revise any forward-looking statement provided in this Annual Report or in any of our other communications for any reason.
|
ITEM 1.
|
BUSINESS
|
Xilinx, Inc. (Xilinx, the Registrant, the Company or we) designs and develops programmable devices and associated technologies, including:
|
•
|
integrated circuits (ICs) in the form of programmable logic devices (PLDs), including programmable System on Chips (SoCs), three-dimensional ICs (3D ICs) and Adaptive Compute Acceleration Platform (ACAP): a highly integrated multi-core heterogeneous compute platform;
|
|
•
|
software design tools to program the PLDs;
|
|
•
|
software development environments and embedded platforms;
|
|
•
|
targeted reference designs;
|
|
•
|
printed circuit boards; and
|
|
•
|
intellectual property (IP), which consists of Xilinx and various third-party verification and IP cores.
|
In addition to its programmable platforms, Xilinx provides design services, customer training, field engineering and technical support.
Xilinx develops highly flexible and adaptive processing platforms that enable rapid innovation across a variety of technologies –from the endpoint to the edge to the cloud. Xilinx is the inventor of field programmable gate arrays (FPGA), hardware programmable SoCs and ACAP, designed to deliver the most dynamic processor technology in the industry and enable the adaptable, intelligent and connected world of the future. Our product portfolio is designed to provide high integration and quick time-to-market for electronic equipment manufacturers in sub-markets such as data center, wireless, wireline, aerospace and defense, test, measurement and emulation, industrial, scientific and medical, automotive, audio, video and broadcast and consumer.
We sell our products and services through independent domestic and foreign distributors and through direct sales to original equipment manufacturers (OEMs) and electronic manufacturing service providers (EMS). Sales are generated by these independent distributors, independent sales representatives or our direct sales organization.
Xilinx was founded and incorporated in California in February 1984. In April 1990, the Company was reincorporated in Delaware. Our corporate facilities and executive offices are located at 2100 Logic Drive, San Jose, California 95124, and our website address is www.xilinx.com.
Please also see the discussion in Item 7. "Management's Discussion and Analysis of Financial Condition and Results of Operations" as well as in Item 1A "Risk Factors" for further information regarding the COVID-19 pandemic declared by the World Health Organization in March 2020.
Industry Overview
Several silicon architectures including microprocessors, graphics processing units (GPUs), application specific standard products (ASSPs), and custom application specific integrated circuits (ASICs) are used for compute in most digital electronic systems today. Central processing units (CPUs) historically have been the most common platform used by software developers but have limitations when used for modern compute tasks ranging from real-time control to machine learning. Fixed function acceleration and heterogeneous systems ranging from GPUs, ASSPs, and custom ASICs meet some of these compute demands but with a limited range of flexibility.
3
Xilinx develops adaptable hardware platforms that enable hardware acceleration and rapid innovation across a variety of technologies - from the endpoint to the edge to the cloud. Xilinx is the inventor of the FPGA, hardware programmable SoCs and the ACAP, all designed to deliver the most dynamic processor technology for adaptable systems. In particular, the ACAP draws on the strengths of CPUs, FPGAs, and fixed function accelerators to accelerate any workload with ease-of-use for software and hardware developers alike.
Other advantages of Xilinx adaptable platforms include:
|
•
|
Faster time-to-market and increased design flexibility. Both advantages are enabled by Xilinx development tools which allow users to implement and revise their designs quickly. In contrast, ASICs and ASSPs require significant development time and offer limited, if any, flexibility to make design changes.
|
|
•
|
Xilinx adaptable platforms are standard components. This means that the same device can be sold to many different users for a myriad of applications. In sharp contrast, ASICs and ASSPs are customized for an individual user or a specific application.
|
Hardware adaptable platforms are generally disadvantaged in terms of relative device size when compared to devices that are designed to perform a fixed function in a single or small set of applications. ASICs and ASSPs tend to be smaller than FPGAs, hardware programmable SoCs, and ACAPs performing the same fixed function, resulting in a lower unit cost.
However, there is a high fixed cost associated with ASIC and ASSP development that is not applicable to customers of hardware programmable ICs. This fixed cost of ASIC and ASSP development significantly increases for every next generation technology node. From a total cost of development perspective, ASICs and ASSPs have generally been more cost effective when used in high-volume production, and hardware programmable platforms have generally been more cost effective when used in low- to mid-volume production. However, we expect hardware adaptable platforms to be able to address higher volume applications and gain market share from ASIC and ASSP suppliers as the fixed cost of ASIC and ASSP development increases on next generation technology nodes.
4
An overview of PLD and market applications for our products is shown in the following table:
|
End Markets
|
Sub-Markets
|
Applications
|
||
|
A&D, Industrial and TME
|
Aerospace and Defense
|
•
Secure Communications
|
||
|
•
Avionics
|
||||
|
Industrial, Scientific and Medical
|
•
Factory Automation
|
|||
|
• Medical Imaging
|
||||
|
• Machine Vision
|
||||
|
Test, Measurement and Emulation
|
•
Semiconductor Test and Measurement Equipment
|
|||
|
•
Semiconductor Emulation and Prototyping
|
||||
|
Automotive, Broadcast and
|
Automotive
|
•
Driver Assistance Systems
|
||
|
Consumer
|
•
Driver Information Systems
|
|||
|
|
•
Infotainment Systems
|
|||
|
Audio, Video and Broadcast
|
• Post Production Equipment
|
|||
|
|
• "Prosumer" Video Equipment
|
|||
|
Consumer
|
• Digital Projectors
|
|||
|
|
• Multifunction printers
|
|||
|
Wired and Wireless
|
Wireless
|
•
3G/4G/5G Base Stations/Antennas
|
||
|
|
•
Wireless Backhaul
|
|||
|
|
Wired
|
•
Enterprise Routers and Switches
|
||
|
•
Metro Optical Networks
|
||||
|
Data Center
|
Data Center
|
•
Compute, Networking and Storage
|
||
Strategy and Competition
Our strategy for growth is to displace ASICs, ASSPs and traditional PLDs in next generation electronic systems. Additionally, we focus on enabling “building the adaptable intelligent world" with an emphasis on the three major elements described below.
|
•
|
Data center first: Xilinx is ramping up its efforts with key data center customers, ecosystem partners and software application developers, to further enable innovation and deployments in compute acceleration, computational storage and network acceleration.
|
|
•
|
Accelerated growth in core markets: core markets consist of automotive; wireless infrastructure; wired communications; audio, video and broadcast; aerospace and defense; industrial, scientific and medical; test, measurement and emulation; and consumer technologies where the Company has leadership technology and substantial market traction. These core markets and customers are central to Xilinx, and Xilinx continues to drive and enable innovation in these areas.
|
|
•
|
Drive adaptive computing with the introduction of ACAP: in March 2018, we announced ACAP, which we believe is a breakthrough product category. ACAP is a highly integrated multi-core heterogeneous compute platform that can be programmed at the hardware level to adapt to the needs of a wide range of applications and workloads. An ACAP's adaptability, which can be done dynamically in milliseconds during operation, delivers levels of performance and performance per-watt that is unmatched by CPUs or GPUs.
|
The costs and risks associated with application-specific devices can only be justified for high-volume or highly-specialized commodity products. Programmable platforms, alternatively, are becoming critical for our customers to meet increasingly stringent product requirements – cost, power, performance and density – in a business environment characterized by increased complexity, shrinking market windows, rapidly changing market demands, capped engineering budgets, escalating ASIC and ASSP engineering costs and increased economic and development risk.
5
With every new generation of our products, our strategy is to increase the performance, density and system-level functionality and integration, while driving down cost and power consumption at each manufacturing process node. This enables us to provide simpler, smarter programmable platforms and design methodologies allowing our customers to focus on innovation and differentiation of their products. Our strategy includes expanding our user base by making our platforms more accessible to users who don’t have prior experience with hardware programmable devices.
Our products now compete in several areas of the semiconductor industry that are intensely competitive and characterized by rapid technological change, increasing levels of integration, product obsolescence and continuous price erosion. We expect continued competition from our primary PLD competitors such as Intel Corporation (Intel), Lattice Semiconductor Corporation (Lattice) and Microsemi Corporation (Microsemi, acquired by Microchip), and from ASSP vendors such as Broadcom Corporation (Broadcom), Marvell Technology Group, Ltd. (Marvell) and Texas Instruments Incorporated (Texas Instruments), as well as from companies such as NVIDIA with whom we historically have not competed. In addition, we expect continued competition from the ASIC market, which has been ongoing since the inception of FPGAs. Other competitors include manufacturers of:
|
•
|
high-density programmable logic products characterized by FPGA-type architectures;
|
|
•
|
high-volume and low-cost FPGAs as programmable replacements for ASICs and ASSPs;
|
|
•
|
ASICs and ASSPs with incremental amounts of embedded programmable logic;
|
|
•
|
high-speed, low-density complex programmable logic devices (CPLDs);
|
|
•
|
high-performance digital signal processing (DSP) devices;
|
|
•
|
products with embedded processors;
|
|
•
|
products with embedded multi-gigabit transceivers;
|
|
•
|
discrete general-purpose GPUs targeting data center and automotive applications; and
|
|
•
|
other new or emerging programmable logic products.
|
We believe that important competitive factors in the logic IC industry include:
|
•
|
product pricing;
|
|
•
|
time-to-market;
|
|
•
|
product performance, reliability, quality, power consumption and density;
|
|
•
|
field upgradability;
|
|
•
|
adaptability of products to specific applications;
|
|
•
|
ease of use and functionality of software design tools;
|
|
•
|
availability and functionality of predefined IP;
|
|
•
|
completeness of applicable software solutions;
|
|
•
|
adherence to industry-standard programming environments;
|
|
•
|
inventory and supply chain management;
|
|
•
|
access to leading-edge process technology and assembly capacity;
|
|
•
|
ability to provide timely customer service and support; and
|
|
•
|
access to advanced packaging technology.
|
Silicon Product Overview
A brief overview of the silicon product offerings is listed in the table below. These products make up most of our revenues. Additionally, some of our more mature product families have been excluded from the table, even though they continue to generate revenues. We operate and track our results in one operating segment.
6
Product Families
|
Boards/PLDs/Devices
|
Date Introduced
|
|
Versal
|
September 2019
|
|
Alveo
|
October 2018
|
|
Zynq UltraScale+ RFSoCs
|
February 2017
|
|
Spartan-7
|
September 2016
|
|
Virtex UltraScale+
|
January 2016
|
|
Kintex UltraScale+
|
December 2015
|
|
Zynq UltraScale+
|
September 2015
|
|
Virtex
UltraScale
|
May 2014
|
|
Kintex
UltraScale
|
November 2013
|
|
Zynq-7000
|
March 2011
|
|
Virtex-7
|
June 2010
|
|
Kintex-7
|
June 2010
|
|
Artix-7
|
June 2010
|
|
Virtex-6
|
February 2009
|
|
Spartan-6
|
February 2009
|
See information under the caption "Results of Operations - Net Revenues" in Item 7. "Management's Discussion and Analysis of Financial Condition and Results of Operations" for information about our revenues from our product families. See also "Note 15. Segment Information" to our consolidated financial statements included in Item 8. "Financial Information and Supplementary Data" for information regarding segments.
Versal ACAP Products
Versal, the first ACAP, is a fully software-programmable, heterogeneous compute platform that combines Scalar Engines, Adaptable Engines, and Intelligent Engines to achieve dramatic performance improvements over today's fastest FPGA and CPU implementations for data center, wired network, 5G wireless, automotive driver assist applications and will be used in nearly all markets that we serve over time.
Alveo Board Products
The Alveo accelerator cards provide optimized acceleration for a broad range of workloads spanning compute, networking, and storage and are available for deployment in servers from the edge to the cloud. As a real-time computing platform, Alveo is built for maximum application-specific performance and low-latency and is built on our latest FPGA architectures with the industry’s fastest memory, networking connectivity, and PCIe interconnect. Customers can develop accelerated applications on Alveo using tools like the Vitis Developer Environment or choose from a broad range of pre-built accelerated applications via a large and growing ecosystem of software partners. Scale-out architectures are made easy through Alveo support for Docker containers and Kubernetes orchestration.
7
UltraScale+ Product Families
The UltraScale+ portfolio consists of three product families and is manufactured using Taiwan Semiconductor Manufacturing Company Limited's (TSMC) 16 nanometer (nm) Fin Field Effect Transistor+ (FinFET+) process. The UltraScale+ portfolio includes FPGAs, 3D IC technology, Multi- Processing System on a Chip (MPSoCs) products, combining new memory, 3D on 3D and multiprocessing SoC technologies, and the industry’s first All Programmable SoC architecture with integrated radio frequency (RF) data converters.
|
•
|
Zynq UltraScale+ RFSoCs integrate RF data converters into an All Programmable SoC architecture. Complete with an ARM Cortex-A53 processing subsystem, UltraScale+ programmable logic, and the highest signal processing bandwidth in a Zynq UltraScale+ device, the new family provides a comprehensive RF signal chain for wireless, cable access, test and measurement, early warning/radar, and other high-performance RF applications.
|
|
•
|
Virtex UltraScale+ FPGAs, which include industry-leading capabilities such as 58G Transceivers, Peripheral Component Interconnect Express (PCIe) Gen 4 integrated cores, and UltraRam on-chip memory technology, provide the required performance and integration needed for next generation data center, 400G and terabit wireline, test and measurement, and aerospace and defense applications. We have recently expanded the Virtex portfolio to include devices with integrated High Bandwidth Memory (HBM) for the highest on chip memory density, and also added the industry’s highest capacity FPGA , the VU19P for ASIC prototyping and emulation applications.
|
|
•
|
Kintex UltraScale+ devices provide a strong price/performance watt balance in a FinFET node, delivering a very cost-effective solution for high-end capabilities including transceiver and memory interface line rates, as well as 100G connectivity cores. These devices are ideal for both packet processing and DSP-intensive functions and are well suited for applications ranging from wireless technology to high-speed wired networking and data center.
|
|
•
|
The Zynq UltraScale+ MPSoC product family represents the Company's second generation All Programmable SoC family. This new family combines seven user programmable processors cores including a 64-bit quad-core ARM Cortex A53 Application Processing Unit, a 32-bit dual-core ARM Cortex R5 Real Time Processing Unit, and an ARM Mali 400 Graphics Processing Unit. These devices enable the development of next generation embedded vision, automotive, industrial Internet of things (IoT) and communication systems by providing significant increases in system level performance/watt and any-to-any connectivity with the security and safety required for next generation systems.
|
UltraScale Product Families
These devices deliver an ASIC-class advantage, based on the UltraScale architecture and utilizing TSMC's 20nm gate density process. These devices deliver next generation routing, ASIC-like clocking, and enhancements to logic and fabric to eliminate interconnect bottlenecks while supporting consistent device utilization.
|
•
|
Kintex UltraScale FPGAs represent the Company's second-generation mid-range FPGA family. These devices offer high price-performance at the lowest power. Kintex UltraScale devices are designed to meet the requirements for the growing number of key applications including next generation wireline and wireless communications and ultra-high definition displays and equipment.
|
|
•
|
Virtex UltraScale FPGAs provide advanced levels of performance, system integration and bandwidth on a single chip. The largest family member delivers 4.4M logic cells, more than doubling our largest 28nm device and delivering 50M equivalent ASIC gates. Virtex UltraScale devices are used in the industry's most challenging applications including: 400G communication applications, high-performance computing, surveillance and reconnaissance systems, and ASIC emulation and prototyping.
|
28nm Product Families
The 28nm product families are fabricated on a high-K metal gate, high-performance and low power 28nm process technology. These product families are
based on a scalable and optimized architecture, which enables design, IP portability and re-use across all families as well as provides designers the ability to achieve the appropriate combination of input/output (I/O) support, performance, feature quantities, packaging and power consumption to address a wide range of applications. The 28nm product families include:
8
|
•
|
Virtex-7 FPGAs, including 3D ICs, are optimized for applications requiring the highest capacity, performance, DSP and serial connectivity with transceivers operating up to 28G. Target applications include 400G and 100G line cards, high-performance computing and test and measurement applications.
|
|
•
|
Kintex-7 FPGAs represent Xilinx's first mid-range FPGA family. These devices maximize price-performance and performance per watt. Target applications include wireless Long Term Evolution (LTE) infrastructure, video display technology and medical imaging.
|
|
•
|
Artix-7 FPGAs offer the lowest power and system cost at higher performance than alternative high-volume FPGAs. These devices are targeted to high-volume applications such as handheld portable ultrasound devices, multi-function printers and software defined radios.
|
|
•
|
The Zynq-7000 family is the first family of Xilinx programmable SoCs. This class of product combines an industry-standard ARM dual-core Cortex-A9 MPCore processing system with Xilinx 28nm architecture. There are five devices in the Zynq-7000 SoC family that allow designers to target cost sensitive as well as high-performance applications from a single platform using industry-standard tools. These devices are designed to enable incremental market opportunities in applications such as industrial motor control, driver assistance and smart surveillance systems, and smart heterogeneous wireless networks.
|
|
•
|
Spartan-7 FPGAs offer the best performance and power consumption in their class, along with small form factor packaging to meet the most stringent requirements. These devices are ideally suited for industrial, consumer, and automotive applications including any-to-any connectivity, sensor fusion, and embedded vision.
|
40nm and 45nm Product Families
The Virtex-6 FPGA family consists of 13 devices and is the sixth generation in the Virtex series of FPGAs. Virtex-6 FPGAs are fabricated on a high-performance 40nm process technology. There are three Virtex-6 families, and each is optimized to deliver different feature mixes to address a variety of markets.
The Spartan-6 FPGA family is fabricated on a low-power 45nm process technology. The Spartan-6 family is the PLD industry's only 45nm high-volume FPGA family, consisting of 11 devices in two product families.
Other Product Families
Prior generation Virtex families include Virtex-5, Virtex-4, Virtex-II Pro, Virtex-II and the original Virtex family.
Spartan family FPGAs include Spartan-3 FPGAs, the Spartan-3E family and the Spartan-3A family. Prior generation Spartan families include Spartan-IIE, Spartan-II, Spartan XL and the original Spartan family.
CPLDs operate on the lowest end of the programmable logic density spectrum. CPLDs are single-chip, nonvolatile solutions characterized by instant-on and universal interconnect. CPLDs combine the advantages of ultra-low power consumption with the benefits of high performance and low cost. Prior generations of CPLDs include the CoolRunner and XC9500 product families.
Design Platforms and Services
Adaptable Platforms
We offer three types of platforms that support our customers' designs and reduce their development efforts: FPGAs, hardware programmable SoCs, and ACAPs. All devices feature adaptable hardware that enable our customers to implement domain-specific architectures on the same physical device. With both hardware-accelerated performance and flexibility beyond what CPUs, GPUs, ASSPs, and ASICs can offer, customers can introduce new innovations to the market quickly.
FPGAs feature reconfigurable hardware as well as integrated memory, digital signal processing, analog mixed signal, high-speed serial transceivers, and networking cores coupled with advanced software for a broad range of applications in all of Xilinx’s end markets.
9
Our hardware programmable SoCs feature multi-core processors with integrated programmable hardware fabric targeting autonomous embedded systems needing real-time control, analytics, sensor fusion, and adaptable hardware for differentiation and acceleration. Our Zynq UltraScale+ RFSoCs feature integrated high-performance RF data converters targeting wireless, radar, and cable access applications. Enabled by both hardware and software design tools and an extensive operating system, middleware, software stack, and IP ecosystem, Xilinx SoC platforms target software developers as well as traditional hardware designers.
ACAPs are the most recent addition to the silicon portfolio and represent a new device category. Versal (the industry’s first ACAP) combines Scalar Processing Engines, Adaptable Hardware Engines, and Intelligent Engines with leading-edge memory and interfacing technologies to deliver powerful heterogeneous acceleration for any application. ACAPs are ideally suited to accelerate a broad set of applications in the emerging era of big data and artificial intelligence. Versal ACAP's hardware and software can be programmed and optimized by software developers, data scientists, and hardware developers alike, enabled by a host of tools, software, libraries, IP, middleware, and frameworks that enable industry-standard design flows.
The Versal Prime series and Versal AI Core series became available in the second half of 2019. We are currently engaged with multiple key customers through its early access program and have already recognized some sampling revenues from this family of devices.
Software Development Platform
To accommodate hardware designers, as well as software developers and AI scientists, we provide design tools and software stacks tailored to each user profile.
In 2012, we introduced the next-generation hardware design environment with the Vivado Design Suite, aimed at improving designer productivity. Vivado supplies hardware design teams with the tools and methodology needed to leverage C-based functions, optimized IP reuse, system integration automation, functional verification and accelerated design closure. When coupled with the UltraFast Design Methodology, this unique combination is proven to accelerate productivity by an order of magnitude compared with traditional hardware design methodologies, by enabling designers to work at a high level of abstraction.
In 2015, we introduced the SDx development environment, which expanded our user base to include a broad community of software developers in both existing and new markets. The SDSoC and SDAccel environments respectively offered familiar embedded and accelerated server-based application development environments, for C++ and Open Computing Language (OpenCL) developers.
In 2019, we introduced the Vitis unified software platform. Vitis enables the development and deployment of embedded software and accelerated applications, on our heterogeneous platforms, including FPGAs, SoCs, and Versal ACAPs. It provides a unified programming model for accelerating End-point, Edge, Cloud, and Hybrid computing applications. Vitis includes a rich set of hardware-accelerated open-source libraries optimized for our platforms. It also integrates with domain-specific software frameworks such as TensorFlow for AI inference, GATK for genome analysis, FFmpeg for video transcoding, Apache Storm for streaming analytics, etc. This enables a growing, multi-domain ecosystem developing applications accelerated on our hardware platforms, in appliances or as Software-as-a-Service in the Cloud. Applications powered by our platforms range from 5G wireless, automotive, networking, storage and various computing applications.
Intellectual Property
Xilinx and various third parties offer hundreds of no charge and fee-bearing IP core licenses covering Ethernet, memory controllers, Interlaken and peripheral component interconnect express (PCIe) interfaces, as well as an abundance of domain-specific IP in the areas of embedded, DSP and connectivity, and market-specific IP cores. In addition, our products and technology leverage industry standards such as ARM
AMBA AXI-4 interconnect technology, IP-XACT and Institute of Electrical and Electronics Engineers (IEEE) P1735 encryption to facilitate plug-and-play FPGA design and take advantage of the large ecosystem of ARM IP developers.
Alveo Board Products
Our Alveo accelerator cards provide an ideal platform for developing applications and solutions for deployment in the data center, at the edge or the cloud. To make it highly accessible for developers, Alveo is available on most major OEM server platforms, as well as a growing presence across all major cloud providers as FPGA-as-a-Service. A wealth of developer tools is available for Alveo through Vitis accelerated libraries, as well as developer articles on our website.
10
Development Boards, Kits and Configuration Products
In addition to the broad selection of legacy development boards presently offered, we have introduced a new unified board strategy that enables the creation of a standardized and coordinated set of base boards available both from Xilinx and our ecosystem vendors, all utilizing the industry-standard extensions that enable customization for market specific applications. Adopting this standard for all our base boards enables the creation of a scalable and extensible delivery mechanism for all Xilinx programmable platforms.
We also offer comprehensive development kits including hardware, design tools, IP and reference designs that are designed to streamline and accelerate the development of domain-specific and market-specific applications.
Finally, we offer a range of configuration products including one-time programmable and in-system programmable storage devices to configure our FPGAs. These programmable read-only memory (PROM) products support all our FPGA devices.
Third-Party Alliances
We and certain third parties have developed and continue to offer a robust ecosystem of IP, boards, tools, services and support through our alliance program. We also work with these third parties to promote our programmable platforms through third-party tools, IP, software, boards and design services.
In May 2016, we led the formation of the very broad Cache Coherent Interconnect Acceleration (CCIX) consortium with the singular goal of bringing a high-performance, open acceleration framework to the data center market. As of March
2020
, this consortium had approximately 40 members, ranging from silicon providers to a rich ecosystem of partners including design, foundry, verification, software and system vendors.
Engineering Services
Our engineering services provide customers with engineering resources to augment their design teams and to provide expert design-specific advice. We tailor our engineering services to the needs of its customers, ranging from hands-on training to full design creation and implementation.
Research and Development
Our research and development (R&D) activities are primarily directed towards the design of new ICs and the development of products, containing design automation tools for hardware, embedded software, optimized software tools and libraries that extend the reach of our platforms to software developers, the design of logic IP, the adoption of advanced semiconductor manufacturing processes for ongoing cost reductions, performance and signal integrity improvements and lowering PLD power consumption. We are also actively contributing to numerous industry open source software initiatives across a broad range of technologies.
As a result of our R&D efforts, we have introduced a number of new products during the past several years including the Virtex and Kintex UltraScale and UltraScale+, Zynq UltraScale+MPSoC, Zynq UltraScale+ RFSoCs, Alveo board and Versal ACAP families. We have enhanced our IP core offerings and software design suite (Vivado) as well as introduced our unified software platform (Vitis). Through process technology collaboration with our foundry suppliers along with strategic investment in Electronic Design Automation tools and improved design techniques, we were the first PLD company to ship 45nm, 28nm, 20nm and 16nm FPGA devices in high volume. Additionally, our investment in R&D has allowed us to ship the industry's first 28nm and 16nm and 7nm devices with embedded ARM technology, the industry's first All Programmable SoC with integrated RF Data Converters, as well as the industry's first 3D Stacked Silicon Interconnect Technology IC devices on the 28nm, 20nm and 16nm process nodes.
The COVID-19 pandemic did not have any significant impact on our R&D activities and efforts in fiscal 2020. Although almost all of our employees have been working remotely since March 16, 2020, we have long had a business continuity plan and invested in technologies and tools that would support our employees in effectively working remotely. We believe technical leadership and innovation are essential to our future success, and we will continue to invest in our technology.
Sales and Distribution
We sell our products to OEMs, EMS and to electronic components distributors who resell these products to OEMs and EMS. We are also developing a network of Value Added Resellers (VARs) and Integrated Solution Vendors (ISVs) for our Alveo products. We characterize distributors, VARs and ISVs as our distribution channel.
11
We use a dedicated global sales and marketing organization, and to a lesser extent, independent sales representatives, to generate sales. In general, we focus our direct demand creation efforts on key accounts. Our distribution channel and independent sales representatives create demand within the balance of our customer base in defined territories or for markets aligned with their focus. The distributor channel also provides inventory, value-added services and logistics for a wide range of OEM or end customers.
As discussed under the caption "We are subject to regulatory and operational risks associated with conducting business operations outside of the U.S. which could adversely affect our business." in Item 1A "Risk Factors," how, where and to whom we sell our products is affected by an evolving regulatory environment, among other factors. Even when specific regulatory changes – such as the April 2020 announcement by the Bureau of Industry and Security (BIS) of the U.S. Department of Commerce of the elimination of the license exception CIV (civil end-users), which had permitted certain national security-controlled items to be exported to certain destinations, such as China, without a license, and the expansion of controls over items for military end-uses in China, Russia and Venezuela – are not ultimately expected to have a material adverse effect on our business, financial condition and/or operating results, they nonetheless require substantial management and operational resources in order to maintain compliance.
Whether Xilinx, the distributor, or the independent sales representative identifies the sales opportunity, a local distributor will process and fulfill the majority of all customer orders. In such situations, distributors are the sellers of the products and as such they bear most legal and financial risks generally related to the sale of commercial goods, including such risks as credit loss, inventory shrinkage, theft and foreign currency fluctuations, but excluding certain indemnity and warranty liabilities.
In accordance with our distribution agreements and industry practice, we have granted our authorized distributors the contractual right to return certain amounts of unsold product on a periodic basis and also receive price adjustments for unsold product in the case of a change in list prices subsequent to the initial sale. Revenues from sales to our distributors and non-distributors are recognized upon the transfer of control, which typically occurs at shipment.
Avnet, Inc. (Avnet) distributes our products worldwide. Avnet's revenue accounted for
42%
,
45%
and
43%
of our worldwide net revenues in fiscal
2020
,
2019
and
2018
, respectively. As of
March 28, 2020
and
March 30, 2019
, Avnet accounted for
31%
and
37%
, respectively, of our total net accounts receivable. We expect our accounts receivable to fluctuate as we partner with our distributors to manage their inventory requirements. We also use other regional distributors throughout the world. We believe distributors provide a cost-effective means of reaching a broad range of customers while providing efficient logistics services. Since PLDs are standard products, they do not carry many of the inventory risks posed by ASICs. From time to time, we may add or terminate distributors in specific geographies, or move customers to a direct support or fulfillment model as we deem appropriate given our strategies, the level of distributor business activity and distributor performance and financial condition. See "Note 2. Summary of Significant Accounting Policies and Concentrations of Risk" to our consolidated financial statements, included in Item 8. "Financial Statements and Supplementary Data," for information about concentrations of credit risk and "Note 15. Segment Information" for information about our revenues from external customers and domestic and international operations.
No
other distributor or end customer accounted for more than
10%
of our net revenues in fiscal
2020
,
2019
or
2018
.
As most of our employees, and those of our customers, are currently working remotely in response to the COVID-19 pandemic, we may experience some delays in processing orders and deliveries in fiscal 2021 for the duration of the pandemic.
Backlog
As of
March 28, 2020
, our backlog from OEM customers and backlog from end customers reported by our distributors scheduled for delivery within the next three months was $503.0 million, compared to $644.0 million as of
March 30, 2019
. Orders from end customers to our distributors are subject to changes in delivery schedules or to cancellation without significant penalty. As a result, backlog from both OEM customers and end customers reported by our distributors as of any particular period may not be a reliable indicator of revenue for any future period.
Wafer Fabrication
As a fabless semiconductor company, we do not manufacture wafers used for our IC products or PROMs. Rather, we purchase our wafers from independent foundries including TSMC, United Microelectronics Corporation (UMC) and Samsung Electronics Co., Ltd. (Samsung). TSMC manufactures the wafers for our Advanced Products.
Precise terms with respect to the volume and timing of wafer production and the pricing of wafers produced by the semiconductor foundries are determined by periodic negotiations with each wafer foundry.
12
Our strategy is to focus our resources on market development and creating new ICs, board products and supporting software ecosystem rather than on wafer fabrication. We continuously evaluate opportunities to enhance foundry relationships and/or obtain additional capacity from our main suppliers as well as other suppliers of wafers manufactured with leading-edge process technologies, and we adjust loadings at particular foundries to meet our business needs.
While we did not experience any manufacturing or supply disruption in fiscal 2020, wafer deliveries may be delayed in the future if the pandemic is not contained and our employees continue to work remotely.
Sort, Assembly and Test
Wafers are sorted by the foundry or independent sort subcontractors. Sorted die are assembled by subcontractors. During the assembly process, the wafers are separated into individual die, which are then assembled into various package types. Following assembly, the packaged units are generally tested by independent test subcontractors or by Xilinx personnel. We purchase most of our assembly services from Siliconware Precision Industries Ltd. and most of our test services from King Yuan Electronics Company in Taiwan.
Generally, the COVID-19 pandemic and related business closures have not disrupted our sorting, testing and packaging activities to date. However, if the pandemic is not contained and its social, economic and business impact broadens, we may experience delay in deliveries by business partners and, as a result, a material adverse impact on our operations and financial conditions.
Quality Certification
Xilinx has achieved and currently maintains quality management system certification to ISO9001 for our facilities in San Jose, California; Longmont, Colorado; Singapore; and Hyderabad, India. In addition, Xilinx achieved and currently maintains ISO 14001 and OHSAS 18001 environmental health and safety management system certifications in the San Jose and Singapore locations.
Intellectual Property and Licenses
While our various proprietary intellectual property rights (including patents, copyrights, trade secrets, and trademarks) are important to our success, we believe our business as a whole is not materially dependent on any particular patent or license, or any particular group of patents or licenses. As of
March 28, 2020
, we held over 4,800 issued patents, which vary in duration, and over 1,300 pending patent applications relating to our proprietary technology in various jurisdictions around the world. We maintain an active program of filing for additional patents in the areas of, but not limited to, circuits, software, applications, system and platform architecture, IP cores, testing methodologies, semiconductor manufacturing and other technologies relating to our products and business. We licensed portions of our patent portfolio to certain external parties and obtained patent licenses from certain third-parties as well.
We have acquired various licenses from third parties to certain technologies that are implemented in IP cores or embedded in our devices, such as processors. These licenses support our continuing ability to make and sell our products. We have also acquired various licenses to certain third-party proprietary software, open-source software, and related technologies, such as compilers, for our design tools. Continued use of such software and technology is important to the operation of the design tools upon which customers depend.
Xilinx, the Xilinx logo, Alveo, Artix, CoolRunner, ISE, Kintex, Spartan, Versal, Vitis, Virtex, Vivado, Zynq are trademarks of Xilinx in the United States and/or other countries. Maintaining these trademarks, and the goodwill associated with them, is important to our business. We have also obtained the rights to use certain trademarks owned by consortiums and other trademark owners that are related to our products and business.
We intend to continue to protect our intellectual property vigorously. We believe that failure to enforce our intellectual property rights or failure to protect our trade secrets effectively could have an adverse effect on our financial condition and results of operations. We incurred, and in the future we may continue to incur, litigation expenses to defend against claims of infringement and to enforce our intellectual property rights against third parties. However, any such litigation may or may not be successful.
Corporate Responsibility
Xilinx places a high level of importance on corporate responsibility. Through senior-level sponsorship, regular environmental, health and safety assessments and company-wide performance targets, we strive to achieve a culture that emphasizes contribution to local and global communities through a number of key initiatives:
13
Company
We strive to meet or exceed industry and regulatory standards for ethical business practices, product responsibility, and supplier management. All of Xilinx's directors, officers and employees are required to comply not only with the letter of the laws, rules and regulations that govern the conduct of our business, but also with the spirit of those laws.
Environment
We continually monitor regulatory requirement and resource trends in order to identify, manage and control activities that have an environmental impact. We focus on the conservation of energy and natural resources, reducing the solid and chemical waste of our operations, avoiding and preventing pollution and minimizing our overall environmental impact with regards to the communities around us and consistent with global climate change efforts.
Community
We are committed to growing strategic relationships with a wide range of local organizations and programs that are designed to develop and strengthen communities located around the world. Xilinx develops local community relationships at key sites through funding and involvement that encourages active participation, teamwork, and volunteerism. Xilinx supports opportunities initiated by its employees and that involve participation and empowerment of its employees. We are committed to charitable giving programs that work towards systemic change and measurable results.
Workplace
We provide a safe and healthy work environment for all employees. Employee diversity and inclusion are embraced and opportunities for training, growth, and advancement are strongly encouraged. The Xilinx Code of Social Responsibility outlines standards to ensure that working conditions at Xilinx are safe and that workers are treated with respect, fairness and dignity.
To support the health and well-being of our employees, customers, partners and communities from the COVID-19 pandemic, almost all of our employees have been working remotely since mid-March 2020. We have long had a business continuity plan in place for unforeseeable situations and, over the years, have invested in technology that would provide our employees the flexibility and security to work effectively and remotely in case of business disruptions.
Employees
As of
March 28, 2020
, we had 4,891 employees compared to 4,433 as of the end of the prior fiscal year. None of our employees are represented by a labor union. We have not experienced any work stoppages and believe we maintain good employee relations.
Information about our Executive Officers
Certain information regarding the executive officers and persons chosen to become executive officers of Xilinx as of
May 8, 2020
is set forth below:
14
|
Name
|
Age
|
Position
|
||
|
Victor Peng
|
60
|
President and Chief Executive Officer (CEO)
|
||
|
Brice Hill
|
53
|
Executive Vice President and Chief Financial Officer (CFO)
|
||
|
Vamsi Boppana
|
47
|
Senior Vice President, Central Products Group
|
||
|
Sumeet Gagneja
|
50
|
Chief Accounting Officer, Corporate Vice President Finance and Corporate Controller
|
||
|
Catia Hagopian
|
48
|
Senior Vice President, General Counsel and Secretary
|
||
|
William Christopher Madden
|
61
|
Executive Vice President and General Manager, Wired and Wireless Group
|
||
|
Salil Raje
|
50
|
Executive Vice President and General Manager, Data Center Group
|
||
|
Vincent L. Tong
|
58
|
Executive Vice President, Global Operations and Quality
|
||
|
Mark David Wadlington
|
58
|
Senior Vice President, Core Markets Group
|
||
There are no family relationships among the executive officers of the Company or the Board of Directors.
Victor Peng
joined the Company in April 2008 and currently serves as President and Chief Executive Officer, a position he has held since February 2018. From April 2017 to February 2018, Mr. Peng served as Chief Operating Officer. From July 2014 to April 2017, he served as Executive Vice President and General Manager of Products. From May 2013 through July 2014, Mr. Peng served as Senior Vice President and General Manager of the Programmable Platforms Group. From May 2012 through April 2013, he served as Senior Vice President of the Programmable Platforms Group. From November 2008 through April 2012, he served as Senior Vice President of the Programmable Platforms Development Group. Prior to joining the Company, Mr. Peng served as Corporate Vice President, Graphics Products Group at Advanced Micro Devices (AMD), a provider of processing solutions, from November 2005 to April 2008. Prior to joining AMD, Mr. Peng served in a variety of executive engineering positions at companies in the semiconductor and processor industries. Mr. Peng is also a director of KLA Corporation, a global capital equipment company serving the semiconductor industry.
Brice Hill
joined the Company in April 2020 and currently serves as Executive Vice President and Chief Financial Officer. From
April 2015 to April 2020, he served as Corporate Vice President and Chief Financial Officer and Chief Operating Officer, Technology, Systems and Core Engineering Group at Intel Corporation (Intel). Prior to that, Mr. Hill held a series of other positions with Intel, including Vice President, Corporate Strategy and Business Group Finance from 2013 to 2015, Vice President, Sales and Marketing Controller from 2010 to 2013, and Corporate Finance Controller from 2005 to 2010.
Vamsi Boppana
joined the Company in October 2008 and currently serves as Senior Vice President, Central Products Group, a position he has held since February 2020. From February 2019 to February 2020, he served as Senior Vice President, Central Engineering. From January 2017 to January 2019, he served as Corporate Vice President, Silicon and Systems Development. From July 2013 to December 2016, Mr. Boppana served as Vice President, Processor and Development. From October 2008 to June 2013, he served as Senior Director in various engineering positions. Prior to joining the Company, Mr. Boppana managed technology development at Open-Silicon, Inc., a fabless chip maker, and served as Vice President, Engineering at Zenasis Technologies, a company which he co-founded.
Sumeet Gagneja
joined the Company in March 2019 and currently serves as the Company’s Chief Accounting Officer, a position that he has held since September 2019, and as Corporate Vice President Finance and Corporate Controller. Prior to joining the Company, Mr. Gagneja served as Vice President and Principal Accounting Officer at Maxim Integrated Products, Inc. (Maxim Integrated) from August 2017 to March 2019, and Corporate Controller from August 2016 to March 2019. Prior to that, at Maxim Integrated, he served as Managing Director of Internal Audit from November 2013 to August 2016, Managing Director of Finance from September 2013 to November 2013, and Executive Director of Finance from January 2011 to August 2013. Prior to joining Maxim Integrated, Mr. Gagneja held various finance positions at Broadcom Limited (previously Avago Technologies) and Intel Corporation.
15
Catia Hagopian
joined the Company in February 2007 and currently serves as Senior Vice President, General Counsel and Secretary, a position she has held since March 2018. Ms. Hagopian is responsible for the Company’s legal operations globally covering matters such as commercial transactions, corporate activities and policies, corporate governance, employment, export compliance, intellectual property and litigation. From April 2012 to March 2018, Ms. Hagopian served as the Company’s Vice President, Legal Affairs, Global Compensation and Benefits. From February 2007 to April 2012, Ms. Hagopian held various senior positions in the Company’s Legal Department. Prior to joining the Company, Ms. Hagopian served as a law clerk for the U.S. District Court, Eastern District of California and worked at several law firms, including DLA Piper LLP (US).
William Christopher Madden
joined the Company in May 2008 and currently serves as Executive Vice President and General Manager, Wired and Wireless Group, a position he has held since April 2019. From June 2018 to March 2019, he served as Executive Vice President, Hardware and Systems Product Development. From July 2017 to May 2018, he served as Senior Vice President, Hardware and Systems Product Development. From October 2010 to June 2017, Mr. Madden served as Corporate Vice President, FPGA Development and Silicon Technology. From May 2008 to September 2010, Mr. Madden served as Vice President of Silicon Technology. Prior to joining the Company, Mr. Madden served as a Senior Fellow at AMD where he drove AMD’s next generation chip integration methodology. Mr. Madden is also a Fellow of the Institute of Engineers Ireland and a Board Member of Science Foundation Ireland.
Salil Raje
joined the Company in June 2004 and currently serves as Executive Vice President and General Manager, Data Center Group, a position he has held since April 2019. From June 2018 to March 2019, he served as Executive Vice President, Software and IP Products. From April 2017 to May 2018, he served as Senior Vice President, Software and IP Products. From June 2012 to April 2017, Mr. Raje served as Corporate Vice President, Software and IP Products Group. He has also served as Vice President, FPGA Software from January 2009 to June 2012, and as Director, Software Development from June 2004 to January 2009. Prior to joining the Company, Mr. Raje served as Chief Technology Officer and Chief Executive Officer of Hier Design, Inc., a company he co-founded in 2001 until it was acquired by the Company in June 2004.
Vincent L. Tong
joined the Company in May 1990 and currently serves as Executive Vice President, Global Operations & Quality, a position he has held since May 2016. From January 2015 to May 2016, Mr. Tong served as Senior Vice President, Global Operations and Quality. He also has served as Executive Leader, Asia Pacific since October 2011. Mr. Tong previously served as Senior Vice President, Worldwide Quality and New Product Introductions from June 2008 to January 2015. He has also served as Vice President, Worldwide Quality and Reliability from August 2006 to June 2008 and prior to that as Vice President of Product Technology from May 2001 to July 2006. Prior to joining the Company, Mr. Tong served in a variety of engineering and management positions at Monolithic Memories, a producer of logic devices, and AMD. He holds seven U.S. patents.
Mark David Wadlington
joined the Company in March 2018 and currently serves as Senior Vice President, Core Markets Group. From March 2018 to February 2020, he served as Senior Vice President, Global Sales. Prior to joining the Company, Mr. Wadlington was Senior Vice President, Worldwide Sales at Synaptics Incorporated from April 2017 to March 2018. Prior to joining Synaptics, from February 2013 to March 2017, Mr. Wadlington held executive positions at Lattice Semiconductor, including serving as Corporate Vice President and General Manager, Mobile and Consumer Division at Lattice Semiconductor and Corporate Vice President of Worldwide Sales. Prior to Lattice, Mr. Wadlington was Vice President of Worldwide Sales at Applied Micro Circuits Corporation (AMCC) from March 2011 to November 2012. Prior to AMCC, Mr. Wadlington served as the Vice President of America’s Sales at the Company, Vice President of Worldwide MCP (media communications processor) Sales at NVIDIA and held various senior-level positions at LSI Logic during his 21-year tenure there, including serving as LSI Logic’s Vice President of Worldwide Semiconductor Sales.
Additional Information
We make available, via a link through our investor relations website located at www.investor.xilinx.com, access to our Annual Report on Form 10-K, quarterly reports on Form 10-Q, current reports on Form 8-K and any amendments to those reports filed or furnished pursuant to Section 13(a) or 15(d) of the Securities Exchange Act of 1934, as amended (Exchange Act) as soon as reasonably practicable after they are electronically filed with or furnished to the Securities and Exchange Commission (SEC). All such filings on our investor relations website are available free of charge. The SEC maintains an Internet site that contains reports, proxy and information statements and other information regarding our filings at http://www.sec.gov. The content on any website referred to in this filing is not incorporated by reference into this filing unless expressly noted otherwise.
This annual report includes trademarks and service marks of Xilinx and other companies that are unregistered and registered in the U.S. and other countries.
|
ITEM 1A.
|
RISK FACTORS
|
16
The following risk factors and other information included in this Annual Report on Form 10-K should be carefully considered. The risks and uncertainties described below are not the only risks to the Company. Our business operations or financial condition could be impaired by risks and uncertainties not presently known to the Company, or that the Company's management does not currently consider material. If any of the risks described below were to occur, our business, financial condition, operating results and cash flows could be materially adversely affected.
The recent COVID-19 pandemic could have a material adverse effect on our business, financial condition and results of operations.
The COVID-19 outbreak, which has been declared a global pandemic, has led to severe disruptions in the market and the global and U.S. economies that may continue for a prolonged duration. In response, various governmental bodies and private enterprises have implemented numerous measures to contain the outbreak, such as travel bans and restrictions, quarantines, shelter-in-place orders, and factory and office shutdowns. These measures and other public and private responses to the outbreak have impacted, and may further impact, our workforce and operations, and those of our customers, partners, vendors and suppliers.
The manufacture of product components, the final assembly of our products and other critical operations are concentrated in certain geographic locations, including the U.S., Singapore, South Korea, and Taiwan. Each of these countries has been affected by the outbreak and has taken measures to try to contain it, and there is considerable uncertainty regarding the impact and duration of such measures and potential future measures. Restrictions on our access to our manufacturing facilities or on our support operations or workforce, similar limitations for our vendors and suppliers, and disruptions of transportation, such as reduced availability of air transport, port closures and increased border controls or closures, could limit our capacity to meet customer demand.
Due to the spread of COVID-19, we have modified our business practices, including employee travel restrictions, employee work locations, and cancellation of physical participation in non-critical meetings, events and conferences pursuant to applicable government guidelines. There is no certainty that such measures will be sufficient to mitigate the risks posed by COVID-19, which could adversely impact our ability to perform critical functions, such as the research and development of new products, the manufacture of product components, the final assembly of our products, and the distribution and sale of our products.
The current outbreak and the efforts to control it have slowed economic activity and may trigger a recession or a period of economic slowdown. Customer demand may be reduced to the extent customers experience shortages of other necessary materials and are forced to slow production of their end products (with a corresponding decline in the rate at which they purchase materials from us), or to the extent our customers experience reduced consumer demand for their end-products as consumers curtail purchases.
The full extent and nature of the impact of the COVID-19 pandemic and related containment measures on our business and financial performance are highly uncertain, as the situation continues to evolve. An extended period of disruption to global supply chain and economic activities due to the pandemic, as well as other factors that are currently unforeseeable, could have a material adverse impact on our ability to access sources of liquidity, as well as our financial condition and results of operations. A prolonged impact of the pandemic also could heighten many of the other risks, such as those relating to disruptions on our operations and our reliance on customers and other third parties, described in this Annual Report on Form 10-K.
Our success depends on our ability to develop and introduce new products and our failure to do so would have a material adverse impact on our financial condition and results of operations.
Our success depends in large part on our ability to develop and introduce new products that address customer requirements and compete effectively on the basis of price, density, functionality, power consumption and performance. Consolidation in our industry may increasingly result in our competitors having greater resources, or other synergies, that provide them with a competitive advantage in those regards. The success of new product introductions is dependent upon several factors, including:
|
•
|
timely completion of new product designs;
|
|
•
|
ability to generate new design opportunities and design wins;
|
|
•
|
availability of specialized field application engineering resources supporting demand creation and customer adoption of new products;
|
|
•
|
ability to utilize advanced manufacturing process technologies on circuit geometries of 28nm and smaller;
|
|
•
|
achieving acceptable yields;
|
|
•
|
ability to obtain adequate production capacity from our wafer foundries and assembly and test subcontractors;
|
|
•
|
ability to obtain advanced packaging;
|
|
•
|
availability and completeness of supporting software design tools;
|
|
•
|
utilization of predefined IP logic;
|
|
•
|
customer acceptance of advanced features in our new products;
|
17
|
•
|
ability of our customers to complete their product designs and bring them to market; and
|
|
•
|
market acceptance of our customers' products.
|
Our product development efforts may not be successful, our new products may not achieve industry acceptance, or we may not achieve the necessary volume of production that would lead to further per unit cost reductions. Revenues relating to our mature products are expected to decline in the future, which is normal for our product life cycles. As a result, we may become increasingly dependent on revenues derived from design wins for our newer products as well as anticipated cost reductions in the manufacture of our current products. We rely primarily on obtaining yield improvements and corresponding cost reductions in the manufacture of existing products, and on introducing new products that incorporate advanced features and other price/performance factors that enable us to increase revenues while maintaining consistent margins. To the extent that such cost reductions and new product introductions do not occur in a timely manner, or to the extent that our products do not achieve market acceptance at prices with higher margins, our financial condition and results of operations could be materially adversely affected.
We rely on independent foundries for the manufacture of all of our products and a manufacturing problem or insufficient foundry capacity could adversely affect our operations.
Most of our wafers are manufactured in Taiwan by TSMC and UMC. We also have wafers manufactured in South Korea by Samsung Electronics Co., Ltd. Terms with respect to the volume and timing of wafer production and the pricing of wafers produced by the semiconductor foundries are determined through periodic negotiations with these wafer foundries, which usually result in short-term agreements that do not provide for long-term supply or allocation commitments. We are dependent on these foundries to supply the substantial majority of our wafers. We rely on TSMC, UMC and our other foundries to produce wafers with competitive performance attributes. Therefore, the foundries, particularly TSMC which manufactures our newest products, must be able to transition to advanced manufacturing process technologies and increased wafer sizes, produce wafers at acceptable yields and deliver them in a timely manner. Furthermore, we cannot guarantee that the foundries that supply our wafers will offer us competitive pricing terms or other commercial terms important to our business.
We cannot guarantee that our foundries will not experience manufacturing problems, including delays in the realization of advanced manufacturing process technologies or difficulties due to limitations of new and existing process technologies. For example, we may experience supply shortages due to the difficulties foundries may encounter if they must rapidly increase their production capacities from low utilization levels to high utilization levels because of an unexpected increase in demand. Furthermore, we cannot guarantee that the foundries will be able to manufacture sufficient quantities of our products or that they will continue to manufacture a given product for the full life of the product. We could also experience supply shortages due to very strong demand for our products, or a surge in demand for semiconductors in general, which may lead to tightening of foundry capacity across the industry. Further, public health crises such as an outbreak of contagious diseases like COVID-19 may affect the operations of our foundries. In addition, weak economic conditions may adversely impact the financial health and viability of the foundries and result in their insolvency or their inability to meet their commitments to us. The insolvency of a foundry or any significant manufacturing problem or insufficient foundry capacity would disrupt our operations and negatively impact our financial condition and results of operations.
We are subject to regulatory and operational risks associated with conducting business operations outside of the U.S. which could adversely affect our business.
In addition to international sales and support operations and development activities, we purchase our wafers from foreign foundries, have our commercial products assembled, packaged and tested by subcontractors located outside the U.S. and utilize third party warehouse operators to store and manage inventory levels for certain of our products. All of these activities are subject to the uncertainties associated with international business operations, including global laws and regulations, trade barriers, economic sanctions, tax regulations, import and export regulations, duties and tariffs and other trade restrictions, changes in trade policies, anti-corruption laws, foreign governmental regulations, potential vulnerability of and reduced protection for IP, longer receivable collection periods, disruptions or delays in production or shipments and the impact from a global pandemic, such as COVID-19 and responsive government measures, any of which could have a material adverse effect on our business, financial condition and/or operating results.
18
In 2018, U.S. and China began to impose partial tariffs on each other's products, leading to concerns of an escalating trade war, which, if it were to fully materialize, could result in general economic downturn or otherwise have a material adverse effect on our business. For example, ZTE Corporation (ZTE) has been subject to trade restrictions under two denial orders issued by the Bureau of Industry and Security (BIS) of the U.S. Department of Commerce in recent years and although ZTE was granted temporary relief from these denial orders and is not currently subject to restrictions, it may become subject to additional denial orders in the future. Also, in May 2019, BIS added Huawei Technologies Co., Ltd. (Huawei) and several affiliates to the Entity List, which imposes restrictions on the supply of certain U.S. and non-U.S. items and product support to listed Huawei entities. As a result, we, along with others in the semi-conductor industry, are unable to sell certain products to Huawei without a license grant, and our ability to do business with Huawei has been adversely impacted. Further geopolitical and regulatory changes may result in shifting regulatory barriers, tax regulations and other trade restrictions that could further negatively impact our business, financial condition and/or operating results. In April 2020, for example, BIS announced further export control regulations effective on June 29, 2020, specifically the elimination of the license exception CIV (civil end-users), which had permitted certain national security-controlled items to be exported to certain destinations, such as China, without a license and the expansion of controls over items for military end-uses in China, Russia and Venezuela. BIS also proposed modifications to the license exception APR (additional permissible reexports), which, if enacted, will impose a licensing requirement on items to be reexported to certain destinations. Furthermore, BIS reportedly is considering other regulatory changes, such as modifications to the de minimis and foreign direct product rules set forth in the Export Administration Regulations, that could impact our business. We are dependent upon our ability to obtain export licenses, or exceptions to export license requirements, from US and other foreign regulatory agencies. There is no assurance that we will be issued these licenses or be granted exceptions, and failure to obtain such licenses or exceptions could limit our ability to sell our products into certain countries and negatively impact our business, financial condition and/or operating results.
Additional factors that could adversely affect us due to our international operations include volatility in oil prices and increased costs, or limited supply of other natural resources. Moreover, our financial condition and results of operations could be adversely affected in the event of political conflicts, economic crises or changes in international relations affecting countries where our main wafer providers, warehouses, end customers, and contract manufacturers who provide assembly and test services worldwide, are located. For example, the United Kingdom's recent exit from the European Union, commonly referred to as "Brexit," has led to significant instability and uncertainty in such regions, which could have a material adverse effect on our business.
Earthquakes, other natural disasters or public health crises could disrupt our operations and have a material adverse effect on our financial condition and results of operations.
Our worldwide operations could be disrupted by earthquakes or other natural disasters such as typhoons, tsunamis, volcano eruptions, fires or floods, public health crises such as an outbreak of contagious diseases like COVID-19, as well as disruptions in access to adequate supplies of electricity, natural gas or water. The independent foundries, upon which we rely to manufacture our products, as well as our California and Singapore facilities, are located in regions that are subject to earthquakes, wildfires or other natural disasters. TSMC's and UMC's foundries in Taiwan and our assembly and test partners in other regions as well as many of our operations in California are located in areas that have been seismically active in the past and some of these areas have also been affected by other natural disasters such as typhoons. Disruption of operations at these foundries and our facilities could cause delays in manufacturing and shipments of our products, and could have a material adverse effect on our results of operations. Any catastrophic event in these locations would disrupt our operations, and our insurance may not cover losses resulting from such disruptions of our operations, thereby materially adversely affecting our financial condition and results of operations. Furthermore, natural disasters can also indirectly impact us. For example, our customers' supply of other complimentary products may be disrupted by a natural disaster and may cause them to delay orders of our products. More vertically-integrated competitors may be less exposed to some or all of these and other risks.
The semiconductor industry is characterized by cyclical market patterns and a significant industry downturn could adversely affect our operating results.
The semiconductor industry is highly cyclical and our financial performance has been affected by downturns in the industry. Down cycles are generally characterized by price erosion and weaker demand for our products. Weaker demand for our products resulting from economic conditions in the end markets we serve and reduced capital spending by our customers can result, and in the past has resulted, in excess and obsolete inventories and corresponding inventory write-downs. We attempt to identify changes in market conditions as soon as possible; however, the dynamics of the market in which we operate make prediction of and timely reaction to such events difficult. Due to these and other factors, our past results are not reliable predictors of our future results.
19
The nature of our business makes our revenues difficult to predict which could have an adverse impact on our business.
In addition to the challenging market conditions we may face, we have limited visibility into the demand for our products, particularly new products, because demand for our products depends upon our products being designed into our end customers' products and those products achieving market acceptance. Due to the complexity of our customers' designs, the design to volume production process for our customers requires a substantial amount of time, frequently longer than a year. In addition, other factors may affect our end customers' demand for our products, including, but not limited to, end customer program delays and the ability of end customers to secure other complementary products. We also are dependent upon "turns," orders received and turned for shipment in the same quarter. These factors make it difficult for us to forecast future sales and project quarterly revenues. The difficulty in forecasting future sales impairs our ability to project our inventory requirements, which could result, and in the past has resulted, in inventory write-downs or failure to meet customer product demands in a timely manner. In addition, difficulty in forecasting revenues compromises our ability to provide forward-looking revenue and earnings guidance.
If we are not able to compete successfully in our industry, our financial results and future prospects will be adversely affected.
Our products now compete in several areas of the semiconductor industry, an industry that is intensely competitive and characterized by rapid technological change, increasing levels of integration, product obsolescence and continual price erosion. We expect continued competition from our primary PLD competitors such as Intel Corporation (Intel), Lattice Semiconductor Corporation (Lattice) and Microsemi Corporation (Microsemi, acquired by Microchip), and from ASSP vendors such as Broadcom Corporation (Broadcom), Marvell Technology Group, Ltd. (Marvell) and Texas Instruments Incorporated (Texas Instruments), as well as from companies such as NVIDIA with whom we historically have not competed. In addition, we expect continued competition from the ASIC market, which has been ongoing since the inception of FPGAs. We believe that important competitive factors in the logic IC industry include:
|
•
|
product pricing;
|
|
•
|
time-to-market;
|
|
•
|
product performance, reliability, quality, power consumption and density;
|
|
•
|
field upgradeability;
|
|
•
|
adaptability of products to specific applications;
|
|
•
|
ease of use and functionality of software design tools;
|
|
•
|
availability and functionality of predefined IP logic;
|
|
•
|
completeness of applicable software solutions;
|
|
•
|
adherence to industry-standard programming environments;
|
|
•
|
inventory and supply chain management;
|
|
•
|
access to leading-edge process technology and assembly capacity;
|
|
•
|
ability to provide timely customer service and support; and
|
|
•
|
access to advanced packaging technology.
|
Our strategy for expansion in the logic market includes continued introduction of new product architectures that address high-volume, low-cost and low-power applications as well as high-performance, high-density applications. However, we may not be successful in executing this strategy. In addition, we anticipate continued pressure from our customers to reduce prices, which may outpace our ability to lower the cost for established products.
Other competitors include manufacturers of:
|
•
|
high-density programmable logic products characterized by FPGA-type architectures;
|
|
•
|
high-volume and low-cost FPGAs as programmable replacements for ASICs and ASSPs;
|
|
•
|
ASICs and ASSPs with incremental amounts of embedded programmable logic;
|
|
•
|
high-speed, low-density complex programmable logic devices;
|
|
•
|
high-performance digital signal processing devices;
|
|
•
|
products with embedded processors;
|
|
•
|
products with embedded multi-gigabit transceivers;
|
|
•
|
discrete general-purpose GPUs targeting data center and automotive applications; and
|
|
•
|
other new or emerging programmable logic products.
|
20
Several companies have introduced products that compete with ours or have announced their intention to sell PLD products. To the extent that our efforts to compete are not successful, our financial condition and results of operations could be materially adversely affected.
The benefits of programmable logic have attracted a number of competitors to this segment. We recognize that different applications require different programmable technologies, and we are developing architectures, processes and products to meet these varying customer needs. Recognizing the increasing importance of standard software solutions, we have developed common software design tools that support the full range of our IC products. We believe that automation and ease of design are significant competitive factors in this segment.
We could also face competition from our licensees. In the past we have granted limited rights to other companies with respect to certain aspects of our older technology, and we may do so in the future. Granting such rights may enable these companies to manufacture and market products that may be competitive with some of our older products.
Increased costs of wafers and materials, or shortages in wafers and materials, could adversely impact our gross margins and lead to reduced revenues.
If greater demand for wafers is not offset by an increase in foundry capacity, market demand for wafers or production and assembly materials increases, or if a supplier of our wafers or other materials ceases or suspends operations, for example due to shutdown measures implemented in response to the COVID-19 outbreak, our supply of wafers and other materials could become limited. Such shortages raise the likelihood of potential wafer price increases, wafer shortages or shortages in materials at production and test facilities, resulting in potential inability to address customer product demands in a timely manner. For example, in 2011, when certain suppliers located in Japan were forced to temporarily halt production as the result of a natural disaster, this resulted in a tightening of supply for those materials. Such shortages of wafers and materials as well as increases in wafer or materials prices could adversely affect our gross margins and would adversely affect our ability to meet customer demands and lead to reduced revenue.
We depend on distributors, primarily Avnet, to generate a significant portion of our sales and complete order fulfillment.
Avnet's revenue accounted for
42%
of our worldwide net revenues in fiscal
2020
, and, as of
March 28, 2020
, Avnet accounted for
31%
of our total net accounts receivable. Any adverse change to our relationship with Avnet or our other distributors could have a material impact on our business. Furthermore, if a key distributor materially defaulted on a contract or otherwise failed to perform, our business and financial results would suffer. In addition, we are subject to concentrations of credit risk in our trade accounts receivable, which includes accounts of our distributors. A significant reduction of effort by a distributor to sell our products or a material change in our relationship with one or more distributors may reduce our access to certain end customers and adversely affect our ability to sell our products.
In addition, the financial health of our distributors and our continuing relationships with them are important to our success. Unpredictable economic conditions may adversely impact the financial health of some of these distributors, particularly our smaller distributors. This could increase our credit risk exposure relating to the insolvency of certain distributors, the inability of distributors to obtain credit to finance the purchase of our products, or delayed payment for such purchases. Our business could be harmed if the financial health of these distributors impaired their performance and we were unable to secure alternate distributors.
We are dependent on independent subcontractors for most of our assembly and test services, and unavailability or disruption of these services could negatively impact our financial condition and results of operations.
We are dependent on subcontractors to provide semiconductor assembly, substrate, test and shipment services. Any (i) prolonged inability to obtain wafers with competitive performance and cost attributes, adequate yields or timely delivery, (ii) disruption in assembly, test or shipment services, (iii) delays in stabilizing manufacturing processes and ramping up volume for new products, (iv) transitions to new service providers, or (v) other circumstance that would require us to seek alternative sources of supply, could delay shipments and have a material adverse effect on our ability to meet customer demands. In addition, unpredictable economic conditions may adversely impact the financial health and viability of these subcontractors and result in their insolvency or their inability to meet their commitments to us. These factors would result in reduced net revenues and could negatively impact our financial condition and results of operations.
21
A number of factors, including our inventory strategy, can impact our gross margins.
A number of factors can cause our gross margins to fluctuate, including yield, wafer pricing, product mix, market acceptance of our new products, competitive pricing dynamics, licensing costs, geographic and/or market segment pricing strategies. In addition, forecasting our gross margins is difficult because a significant portion of our business is based on turns within the same quarter.
While our overall inventory levels fluctuate over time, the inventory of newer product lines may be higher than other products due to a planned increase in safety stock in anticipation of future revenue growth. In the event demand does not materialize, we may be subject to incremental obsolescence costs. In addition, future product cost reductions could have impact on our inventory valuation as well as our operating results.
Reductions in the average selling prices of our products could have a negative impact on our gross margins.
The average selling prices of our products generally decline as the products mature. We seek to offset the decrease in selling prices through yield improvement, manufacturing cost reductions and increased unit sales. We also continue to develop higher value products or product features that increase the average selling prices of our products, or slow the decline of such prices. However, there is no guarantee that our ongoing efforts will be successful or that they will keep pace with the decline in selling prices of our products, which could ultimately lead to a decline in our revenues and gross margins.
General negative economic conditions and any related deterioration in the global business environment could have a material adverse effect on our business, operating results and financial condition.
If weak economic conditions happen, there may be a number of negative effects on our business, including customers or potential customers reducing or delaying orders, the insolvency of key suppliers, potentially causing production delays, the inability of customers to obtain credit, and the insolvency of one or more customers. Any of these effects could impact our ability to effectively manage inventory levels and collect receivables and ultimately decrease our net revenues and profitability.
Because we have international business and operations, we are vulnerable to the economic conditions of the countries in which we operate and currency fluctuations could have a material adverse effect on our business and negatively impact our financial condition and results of operations.
In addition to our U.S. operations, we also have significant international operations, including foreign sales offices to support our international customers and distributors, our regional headquarters in Ireland and Singapore and an R&D site in India. Sales and operations outside of the U.S. subject us to the risks associated with conducting business in foreign economic and regulatory environments. Our financial condition and results of operations could be adversely affected by unfavorable economic conditions in countries in which we do significant business or by changes in foreign currency exchange rates affecting those countries. We derive more than half of our revenues from international sales, primarily in the Asia Pacific region, Europe and Japan where economic weaknesses have adversely affected our revenues in the past. Sales to all direct OEMs and distributors are denominated in U.S. dollars. While the recent movements of the Euro and Yen exchange rates against the U.S. dollar did not have a material impact on our business, increased volatility could impact our European and Japanese customers. Currency instability and volatility and disruptions in the credit and capital markets may increase credit risks for some of our customers and may impair our customers' ability to repay existing obligations. For example, the United Kingdom's "Brexit" transition has created economic uncertainty and currency volatility in the European Union. Increased currency volatility could also positively or negatively impact our foreign-currency-denominated costs, assets and liabilities. In addition, any devaluation of the U.S. dollar relative to other foreign currencies may increase the operating expenses of our foreign subsidiaries adversely affecting our results of operations. Furthermore, because we are increasingly dependent on the global economy, instability in worldwide economic environments occasioned, for example, directly or indirectly by political instability (such as due to Brexit), terrorist activity, U.S. or other military actions, changes to U.S. domestic and foreign policy and international sanctions or other diplomatic actions (potentially including sanctions adopted or under consideration by the U.S. or European Union with respect to Russia or Russian individuals or businesses), could adversely impact economic activity and lead to a contraction of capital spending by our customers generally or in specific regions. Any or all of these factors could adversely affect our financial condition and results of operations in the future.
22
We are exposed to fluctuations in interest rates and changes in credit risk which could have a material adverse impact on our financial condition and results of operations as it relates to the market value of our investment portfolio and interest rate swap contracts.
Our cash, short-term and long-term investments represent significant assets that may be subject to fluctuating or even negative returns depending upon interest rate movements, changes in credit risk and financial market conditions. Global credit market disruptions and economic slowdown and uncertainty have in the past negatively impacted the values of various types of investment and non-investment grade securities. The global credit and capital markets may again experience significant volatility and disruption due to instability in the global financial system, uncertainty related to global economic conditions and concerns regarding sovereign financial stability.
Therefore, there is a risk that we may incur other-than-temporary impairment charges for certain types of investments should credit market conditions deteriorate or the underlying assets fail to perform as anticipated. Our future investment income may fall short of expectations due to changes in interest rates or if the decline in fair values of our debt securities was judged to be other than temporary. Furthermore, we may suffer losses in principal on our investments, including our interest rate swap contracts, if we are forced to sell securities that have declined in market value due to changes in interest rates or financial market conditions.
Our failure to protect and defend our IP could impair our ability to compete effectively.
We rely upon patent, copyright, trade secret, mask work and trademark laws to protect our IP. We cannot provide assurance that such IP rights can be successfully asserted in the future or will not be invalidated, violated, circumvented or challenged. From time to time, third parties, including our competitors, have asserted against us patent, copyright or other IP rights to technologies that are important to us. Third parties may attempt to misappropriate our IP through electronic or other means or assert infringement claims against us or parties we have agreed to indemnify. Such assertions by third parties may result in costly litigation, indemnity claims or other legal actions, and we may not prevail in such matters or be able to license any valid and infringed patents from third parties on commercially reasonable terms. This could result in the loss of our ability to import and sell our products or require us to pay costly royalties to third parties in connection with sales of our products. Any infringement claim, indemnification claim, or impairment or loss of use of our IP could materially adversely affect our financial condition and results of operations.
Our ability to design and introduce new products in a timely manner is dependent upon third-party IP.
In the design and development of new products and product enhancements, we rely on third-party intellectual property such as software development tools and hardware testing tools. Furthermore, certain product features may rely on intellectual property acquired from third parties, including hardware and software tools and products. The design requirements necessary to meet future consumer demands for more features and greater functionality from semiconductor products may exceed the capabilities of the third-party intellectual property or development tools that are available to us. In addition, hardware and software tools and products procured from third parties may contain design or manufacturing defects, including flaws that could unexpectedly interfere with the operation of our products. If the third-party intellectual property that we use becomes unavailable or fails to produce designs that meet consumer demands, our business could be adversely affected.
Any failure of our information technology systems to function properly could result in business disruption.
We rely in part on various information technology (IT) systems to manage our operations, including, but not limited to, financial reporting, and we regularly evaluate these systems and make changes to improve them as necessary. Consequently, we periodically implement new, or upgrade or enhance existing, operational and IT systems, procedures and controls. Any delay in the implementation of, or disruption in the transition to, new or enhanced systems, procedures or controls, could harm our ability to record and report financial, management, or operational information on a timely and accurate basis. In addition, hardware and software tools and products procured from third parties included in our IT systems could contain design or manufacturing defects, including flaws that could unexpectedly interfere with the operation of our IT systems. These systems are also subject to power and telecommunication outages or other general system failures. Failure of our IT systems or difficulties in managing them could result in business disruption.
23
Cyber-attacks and data breaches could have an adverse effect on our business and reputation and negatively impact our financial condition and results of operations.
Security breaches, including cyber-attacks, phishing attacks or attempts to misappropriate or compromise confidential or proprietary information or sabotage enterprise IT systems, are becoming increasingly frequent and more sophisticated. We depend on the uninterrupted operation of our IT systems to manage our operations, store and retrieve business and financial data and facilitate internal communications and communications with customers, subcontractors, suppliers and distribution partners. We experience security incidents of varying degrees on an ongoing basis. We take steps to detect and investigate any security incidents and prevent their recurrence, but, in some cases, we might be unaware of an incident or its magnitude and effects. Because the techniques used to obtain unauthorized access to or sabotage networks and systems change frequently, we may be unable to anticipate these techniques or to implement adequate protections. These security incidents may involve unauthorized access, misuse or disclosure of intellectual property or confidential or proprietary information regarding our business or that of our customers or business partners. We also may be subject to unauthorized access to our IT systems through a security breach or cyber-attack. In the past there have been attempts by third parties to penetrate and/or infect our network and systems with malicious software in an effort to gain access to our network and systems. Recently, several large organizations have been infected by “ransomware,” through which an attacker gains access to the organization’s computer files, renders them temporarily inaccessible and threatens to permanently delete them if a cash ransom is not paid by a specified deadline. Third parties may continue to attempt to fraudulently induce employees, users, or customers to disclose sensitive information in order to gain access to our network and systems. The IT systems of our remote internet-connected third party server providers (sometimes called the "cloud"), customers, suppliers, and distribution partners and the links between our IT systems and our customers are subject to the same risks as those of our IT systems. The costs to us to prevent, detect or alleviate cyber- or other security problems, bugs, viruses, worms, malicious software programs and security vulnerabilities could be significant, and our efforts to address these problems may not be successful. In the event of a security breach, our business and reputation could be harmed and we could be subject to legal and regulatory claims which could negatively impact our financial condition and results of operations.
Acquisitions and strategic investments present risks, and we may not realize the goals that were contemplated at the time of a transaction.
We have acquired technology companies whose products complement our products. We also have made a number of strategic investments in other technology companies. We may make similar acquisitions and strategic investments in the future, which present risks, including:
|
•
|
our ongoing business may be disrupted and our management's attention may be diverted by investment, acquisition, transition or integration activities;
|
|
•
|
an acquisition or strategic investment may not further our business strategy as we expected, and we may not integrate an acquired company or technology as successfully as we expected;
|
|
•
|
our operating results or financial condition may be adversely impacted by claims or liabilities that we assume from an acquired company or technology or that are otherwise related to an acquisition;
|
|
•
|
we may have difficulty incorporating acquired technologies or products with our existing product lines;
|
|
•
|
we may have higher than anticipated costs in continuing support and development of acquired products, and in general and administrative functions that support such products;
|
|
•
|
our strategic investments may not perform as expected, and we may be required to recognize a loss on any or all of our strategic investments; and
|
|
•
|
we may experience unexpected changes in how we are required to account for our acquisitions and strategic investments pursuant to U.S. generally accepted accounting principles (GAAP).
|
The occurrence of any of these risks could have a material adverse effect on our business, results of operations, financial condition or cash flows, particularly in the case of a larger acquisition or several concurrent acquisitions or strategic investments.
If we are unable to maintain effective internal controls, our stock price could be adversely affected.
We are subject to the ongoing internal control provisions of Section 404 of the Sarbanes-Oxley Act of 2002 (the Sarbanes-Oxley Act). Our controls necessary for continued compliance with the Sarbanes-Oxley Act may not operate effectively at all times and may result in a material weakness disclosure. The identification of material weaknesses in internal control, if any, could indicate a lack of proper controls to generate accurate financial statements and could cause investors to lose confidence and our stock price to drop.
24
We compete with others to attract and retain key personnel, and any loss of, or inability to attract, such personnel would harm us.
We depend on the efforts and abilities of certain key members of management and other technical personnel. Our future success depends, in part, upon our ability to retain, develop and transition such personnel and attract and retain other highly qualified personnel, particularly product engineers. Competition for such personnel is intense and we may not be successful in hiring or retaining new or existing qualified personnel. Changes to the U.S. immigration laws may also impact the availability of qualified personnel. From time to time we have effected restructurings that eliminate a number of positions. For example, during the fourth quarter of fiscal 2020, we announced cost-saving measures designed to drive structural operating efficiencies across the Company by reducing our global workforce by approximately 5% through a targeted global workforce reduction in force. Even if such personnel are not directly affected by the restructuring effort, such terminations can have a negative impact on morale and our ability to attract and hire new qualified personnel in the future. If we are unable to retain or develop existing qualified personnel or are unable to hire new qualified personnel, as needed, our business, financial condition and results of operations could be seriously harmed. Further, changes to our qualified personnel, including key members of management, may be disruptive to our business, and any failure to successfully assimilate key new hires, or to successfully retain, develop and transition promoted employees, could adversely affect our business and results of operations.
Unfavorable results of legal proceedings could adversely affect our financial condition and operating results.
From time to time we are subject to various legal proceedings and claims that arise out of the ordinary conduct of our business. The amount of damages alleged in certain legal claims may be significant. Certain other claims involving the Company are not yet resolved, including those that are discussed under "Note 16. Litigation Settlement and Contingencies" to our consolidated financial statements, included in Item 8. "Financial Statements and Supplementary Data" of this Form 10-K, and additional claims may arise in the future. Results of legal proceedings cannot be predicted with certainty. Regardless of its merit, litigation may be both time-consuming and disruptive to our operations and cause significant expense and diversion of management attention and we may enter into material settlements to avoid these risks. Entering into settlements may result in payment of significant amounts which may materially and adversely affect our financial condition and operation results. Should we fail to prevail in certain matters, or should several of these matters be resolved against us, we may be faced with significant monetary damages or injunctive relief against us that would materially and adversely affect a portion of our business and might materially and adversely affect our financial condition and operating results.
Our products could have defects which could result in reduced revenues and claims against us.
We develop complex and evolving products that include both hardware and software. Despite our testing efforts and those of our subcontractors, defects may be discovered in existing or new products. Such defects may cause us to incur significant warranty, support and repair or replacement costs, divert the attention of our engineering personnel from our product development efforts and harm our relationships with customers. Subject to certain terms and conditions, we have agreed to compensate certain customers for limited specified costs they actually incur in the event our hardware products experience epidemic failure. As a result, epidemic failure and other performance problems could result in claims against us or the delay or loss of market acceptance of our products and would likely harm our business. Our customers could also seek damages from us for their losses.
In addition, we could be subject to product liability claims. A product liability claim brought against us, even if unsuccessful, would likely be time-consuming and costly to defend. Product liability risks are particularly significant with respect to aerospace, automotive and medical applications because of the risk of serious harm to users of these products. Any product liability claim, whether or not determined in our favor, could result in significant expense, divert the efforts of our technical and management personnel, and harm our business.
25
In preparing our financial statements, we make good faith estimates and judgments that may change or turn out to be erroneous.
In preparing our financial statements in conformity with accounting principles generally accepted in the U.S., we must make estimates and judgments in applying our critical accounting policies. Those estimates and judgments have a significant impact on the results we report in our consolidated financial statements. The most difficult estimates and subjective judgments that we make concern valuation of marketable and non-marketable securities, revenue recognition, inventories, long-lived assets including acquisition-related intangibles, goodwill, taxes and stock-based compensation. We base our estimates on historical experience, input from outside experts and various other assumptions that we believe to be reasonable under the circumstances, the results of which form the basis for making judgments about the carrying values of assets and liabilities that are not readily apparent from other sources. We also have other key accounting policies that are not as subjective, and therefore, their application would not require us to make estimates or judgments that are as difficult, but which nevertheless could significantly affect our financial reporting. Actual results may differ materially from these estimates. If these estimates or their related assumptions change, our operating results for the periods in which we revise our estimates or assumptions could be adversely and materially affected.
Our failure to comply with the requirements of the Export Administration Regulations (EAR) and the International Traffic and Arms Regulations (ITAR) could have a material adverse effect on our financial condition and results of operations.
Our FPGAs and related technologies are subject to EAR, which are administered by the U.S. Department of Commerce. In addition, we may, from time to time, receive technical data from third parties that is subject to the ITAR, which are administered by the U.S. Department of State. EAR and ITAR govern the export and re-export of these FPGAs, the transfer of related technologies, whether in the U.S. or abroad, and the provision of services. We are required to maintain an internal compliance program and security infrastructure to meet EAR and ITAR requirements.
An inability to obtain the required export licenses, or to predict when they will be granted, increases the difficulties of forecasting shipments. In addition, security or compliance program failures that could result in penalties or a loss of export privileges, as well as stringent licensing restrictions that may make our products less attractive to overseas customers, could have a material adverse effect on our business, financial condition and/or operating results.
Our inability to effectively control the sale of our products on the gray market could have a material adverse effect on our business or results of operations.
We market and sell our products directly to OEMs and through authorized third-party distributors which helps to ensure that products delivered to our customers are authentic and properly handled. From time to time, customers may purchase products bearing our name from the unauthorized "gray market." These parts may be counterfeit, salvaged or re-marked parts, or parts that have been altered, mishandled, or damaged. Gray market products result in shadow inventory that is not visible to us, thus making it difficult to forecast supply or demand. Also, when gray market products enter the market, we and our authorized distributors may compete with brokers of these discounted products, which can adversely affect demand for our products and negatively impact our margins. In addition, our reputation with customers may be negatively impacted when gray market products bearing our name fail or are found to be substandard.
The conflict minerals provisions of the Dodd-Frank Wall Street Reform and Consumer Protection Act could result in additional costs and liabilities.
In accordance with the Dodd-Frank Wall Street Reform and Consumer Protection Act, the SEC established disclosure and reporting requirements for companies whose products incorporate "conflict" minerals mined from the Democratic Republic of Congo and adjoining countries, regardless of whether such products are manufactured by those companies or by third parties. These requirements could affect the sourcing and availability of minerals used in the manufacture of our semiconductor products. The costs associated with complying with the disclosure requirements include those for due diligence in regard to the sources of any conflict minerals used in our products, remediation and other changes to products, processes, or sources of supply as a consequence of such verification activities. We may face reputational challenges if we are unable to sufficiently verify the origins for all minerals used in our products through the due diligence process we implement. Moreover, some of our customers may require that all of the components of our products are certified as conflict-free, and we may be unable to verify the origin of the raw materials used in our products to the extent necessary to make this certification.
26
Exposure to greater-than-anticipated income tax liabilities, changes in tax rules and regulations, changes in interpretation of tax rules and regulations, or unfavorable assessments from tax audits could affect our effective tax rates, financial condition and results of operations.
We are a U.S.-based multinational company subject to tax in multiple U.S. and foreign tax jurisdictions. Our income tax obligations could be affected by many factors, including but not limited to changes to our corporate operating structure, intercompany arrangements and tax planning strategies.
Our income tax expense is computed based on tax rates at the time of the respective financial period. Our future effective tax rates, financial condition and results from operations could be unfavorably affected by changes in the tax rates in jurisdictions where our income is earned, by changes in the tax rules and regulations or the interpretation of tax rules and regulations in the jurisdictions in which we do business or by changes in the valuation of our deferred tax assets.
The Tax Cuts and Jobs Act (TCJA) enacted in December 2017 had a significant impact on our tax obligations. Amendments or technical corrections to the TCJA could also meaningfully affect our tax obligations and our effective tax rate in the period enacted. A significant portion of our earnings are earned by our subsidiaries outside the U.S. Changes to the taxation of certain foreign earnings as provided in the TCJA, along with the state tax impact of these changes, may have an adverse effect on our effective tax rate. Furthermore, changes to the taxation of undistributed foreign earnings could change our future intentions regarding reinvestment of such earnings. The foregoing items could have a material effect on our business, cash flow, results of operations or financial condition.
In addition, we are subject to examinations of our income tax returns by domestic and foreign tax authorities. We regularly assess the likelihood of outcomes resulting from these examinations to determine the adequacy of our provision for income taxes and have reserved for potential adjustments that may result from the current examinations. There can be no assurance that the final determination of any of these examinations will not have an adverse effect on our effective tax rates, financial condition and results of operations.
Considerable amounts of shares of our common stock are available for issuance under our equity incentive plans, and significant issuances in the future may adversely impact the market price of our common stock.
As of
March 28, 2020
, we had 2.00 billion authorized shares of common stock, of which
243.8 million
shares were outstanding. In addition, 34.5 million shares of common stock were reserved for issuance pursuant to our equity incentive plans and Amended and Restated 1990 Employee Qualified Stock Purchase Plan (ESPP). The availability of substantial amounts of our common stock resulting from the exercise or settlement of equity awards outstanding under our equity incentive plans, which would be dilutive to existing stockholders, could adversely affect the prevailing market price of our common stock and could impair our ability to raise additional capital through the sale of equity securities.
We have indebtedness that could adversely affect our financial condition and prevent
us from fulfilling our debt obligations.
The aggregate amount of our consolidated indebtedness as of
March 28, 2020
was $1.25 billion (principal amount), which consists of $500.0 million in aggregate principal amount of our 3.000% Notes due 2021 (2021 Notes) and $750.0 million principal amount of our 2.950% senior notes due 2024 (2024 Notes). We also may incur additional indebtedness in the future. Our indebtedness may:
|
•
|
make it difficult for us to satisfy our financial obligations, including making scheduled principal and interest payments on the notes and our other indebtedness;
|
|
•
|
limit our ability to borrow additional funds for working capital, capital expenditures, acquisitions or other general corporate purposes;
|
|
•
|
limit our ability to use our cash flow or obtain additional financing for future working capital, capital expenditures, acquisitions or other general business purposes;
|
|
•
|
require us to use a portion of our cash flow from operations to make debt service payments;
|
|
•
|
limit our flexibility to plan for, or react to, changes in our business and industry;
|
|
•
|
place us at a competitive disadvantage compared to our less leveraged competitors; and
|
|
•
|
increase our vulnerability to the impact of adverse economic and industry conditions.
|
Our ability to meet our debt service obligations will depend on our future performance, which will be subject to financial, business and other factors affecting our operations, many of which are beyond our control.
27
The agreements governing our debt obligations contain covenants that may adversely affect our ability to operate our business.
The indentures governing the 2021 Notes and 2024 Notes contain, and the agreements governing any future debt obligations may contain, various covenants limiting our and our subsidiaries' ability to, among other things:
|
•
|
create certain liens on principal property or the capital stock of certain subsidiaries;
|
|
•
|
enter into certain sale and leaseback transactions with respect to principal property; and
|
|
•
|
consolidate or merge with, or convey, transfer or lease all or substantially all our assets, taken as a whole, to another person.
|
A failure to comply with these covenants or other provisions in these agreements could result in events of default under the agreements, which could permit acceleration of the related debt obligations, as well as other debt obligations. Any required repayment as a result of such acceleration could have a material adverse effect on our business, results of operations, financial condition or cash flows.
|
ITEM 1B.
|
UNRESOLVED STAFF COMMENTS
|
Not applicable.
|
ITEM 2.
|
PROPERTIES
|
Our corporate offices, which include the administrative, sales, customer support, marketing, R&D and manufacturing and testing groups, are located in San Jose, California. This main site consists of adjacent buildings providing 588,000 square feet of space, which we own. We also own one parcel of land totaling approximately 84 acres in South San Jose near our corporate facility. At present, we do not have any plans to develop the land.
We own a 228,000 square foot facility in the metropolitan area of Dublin, Ireland, which serves as our regional headquarters in Europe. The Irish facility is primarily used for service and support for our customers in Europe, R&D, marketing and IT support.
We own a 222,000 square foot facility in Singapore, which serves as our Asia Pacific regional headquarters. We own the building but the land is subject to a 30-year lease expiring in November 2035. The Singapore facility is primarily used for manufacturing support and testing of our products and services for our customers in Asia Pacific/Japan, coordination and management of certain third parties in our supply chain and R&D. Excess space in the facility is leased to tenants under long-term lease agreements.
We own a 130,000 square foot facility in Longmont, Colorado. The Longmont facility serves as a primary location and data center for our software efforts in the areas of R&D, manufacturing and quality control. In addition, we own a 200,000 square foot facility and 40 acres of land adjacent to the Longmont facility for future expansion. The facility is partially leased to tenants under long-term lease agreements and partially used by us.
We lease office facilities for our engineering design centers in Hyderabad, India and smaller offices in other regions.
|
ITEM 3.
|
LEGAL PROCEEDINGS
|
For information regarding our legal proceedings, see "Note 16. Litigation Settlements and Contingencies" to our consolidated financial statements, included in Item 8. "Financial Statements and Supplementary Data", which is incorporated herein by reference.
|
ITEM 4.
|
MINE SAFETY DISCLOSURES
|
Not applicable.
28
|
ITEM 5.
|
MARKET FOR REGISTRANT'S COMMON EQUITY, RELATED STOCKHOLDER MATTERS AND ISSUER PURCHASES OF EQUITY SECURITIES
|
Our common stock trades on the Nasdaq Global Select Market under the symbol XLNX. As of May 1, 2020, there were approximately 520 stockholders of record, which does not include beneficial owner of stock held in street name (i.e., through a brokerage firm, bank, broker-dealer, trust or other similar organization).
On
April 20, 2020
, our Board of Directors declared a cash dividend of
$0.38
per common share for the
first
quarter of fiscal
2021
. The dividend is payable on
June 3, 2020
to stockholders of record as of
May 13, 2020
.
Securities Authorized for Issuance Under Equity Compensation Plans
See "Equity Compensation Plan Information," included in Item 12. "Security Ownership of Certain Beneficial Owners and Management and Related Stockholder Matters" in Part III of this Form 10-K for information regarding our equity compensation plans.
Issuer Purchases of Equity Securities
The following table summarizes the Company's repurchase of its common stock during the fourth quarter of fiscal
2020
.
|
Total Number
of Shares
Purchased
|
Average
Price Paid
per Share
|
Total Number of
Shares Purchased
as Part of Publicly
Announced Program
|
Approximate
Dollar Value of
Shares that May
Yet Be Purchased
Under the Program
|
|||||||||||
|
(In thousands, except per share amounts)
|
||||||||||||||
|
Period
|
||||||||||||||
|
December 29, 2019 to February 1, 2020
|
651
|
|
$
|
99.01
|
|
651
|
|
$
|
743,720
|
|
||||
|
February 2, 2020 to February 29, 2020
|
2,395
|
|
$
|
87.67
|
|
2,395
|
|
$
|
533,732
|
|
||||
|
March 1, 2020 to March 28, 2020
|
2,625
|
|
$
|
74.79
|
|
2,625
|
|
$
|
337,412
|
|
||||
|
Total for the Quarter
|
5,671
|
|
5,671
|
|
||||||||||
In October 2019, the Board authorized a repurchase program to repurchase the Company's common stock and debentures up to
$1.00 billion
(2019 Repurchase Program). Through
March 28, 2020
, the Company had used
$662.6 million
of the
$1.00 billion
authorized under the 2019 Repurchase Program, leaving a balance of
$337.4 million
available for future repurchases. The Company's current policy is to retire all repurchased shares, and consequently,
no
treasury shares were held as of
March 28, 2020
and
March 30, 2019
.
See "Note 13. Stockholders' Equity" to our consolidated financial statements, included in Item 8. "Financial Statements and Supplementary Data" for information regarding our stock repurchase plans.
Company Stock Price Performance
The following graph shows a comparison of cumulative total return for our common stock, the Standard & Poor's 500 Stock Index (S&P 500 Index), and the Standard & Poor's 500 Semiconductors Index (S&P 500 Semiconductors Index). The graph covers the period from March 27, 2015, the last trading day before our fiscal 2015, to March 27, 2020, the last trading day of our fiscal 2020. The graph and table assume that $100 was invested on March 27, 2015 in our common stock, the S&P 500 Index and the S&P 500 Semiconductors Index and that all dividends were reinvested.
29
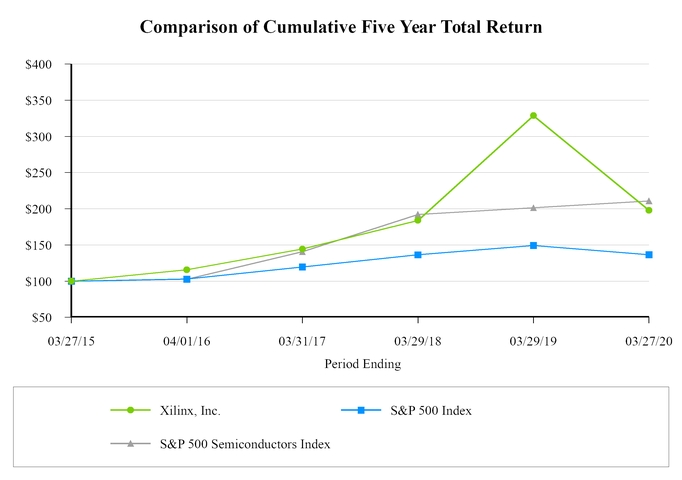
|
Company / Index
|
03/27/15
|
04/01/16
|
03/31/17
|
03/29/18
|
03/29/19
|
03/27/20
|
|||||||||||
|
Xilinx, Inc.
|
100.00
|
|
115.65
|
|
144.34
|
|
183.94
|
|
328.57
|
|
197.86
|
|
|||||
|
S&P 500 Index
|
100.00
|
|
102.79
|
|
119.68
|
|
136.43
|
|
149.38
|
|
136.61
|
|
|||||
|
S&P 500 Semiconductors Index
|
100.00
|
|
102.58
|
|
140.76
|
|
192.13
|
|
201.41
|
|
210.86
|
|
|||||
Note:
Stock price performance and indexed returns for our common stock are historical and are not indicators of future price performance or future investment returns.
30
|
ITEM 6.
|
SELECTED FINANCIAL DATA
|
Five years ended
March 28, 2020
(In thousands, except per share amounts)
|
March 28, 2020
(1)
|
March 30, 2019
|
March 31, 2018
(2)
|
April 1, 2017
|
April 2, 2016
(3)
|
||||||||||||||||
|
Net revenues
|
$
|
3,162,666
|
|
$
|
3,059,040
|
|
$
|
2,467,023
|
|
$
|
2,356,742
|
|
$
|
2,213,881
|
|
|||||
|
Operating income
|
791,888
|
|
956,799
|
|
686,022
|
|
706,390
|
|
669,881
|
|
||||||||||
|
Income before income taxes
|
833,984
|
|
968,332
|
|
691,379
|
|
698,076
|
|
636,825
|
|
||||||||||
|
Provision for income taxes
|
41,263
|
|
78,582
|
|
227,398
|
|
69,943
|
|
85,958
|
|
||||||||||
|
Net income
|
792,721
|
|
889,750
|
|
463,981
|
|
628,133
|
|
550,867
|
|
||||||||||
|
Net income per common share:
|
||||||||||||||||||||
|
Basic
|
$
|
3.15
|
|
$
|
3.52
|
|
$
|
1.86
|
|
$
|
2.49
|
|
$
|
2.14
|
|
|||||
|
Diluted
|
$
|
3.11
|
|
$
|
3.47
|
|
$
|
1.80
|
|
$
|
2.34
|
|
$
|
2.05
|
|
|||||
|
Shares used in per share calculations:
|
||||||||||||||||||||
|
Basic
|
251,732
|
|
252,762
|
|
249,595
|
|
252,301
|
|
257,184
|
|
||||||||||
|
Diluted
|
254,943
|
|
256,434
|
|
257,960
|
|
268,813
|
|
268,667
|
|
||||||||||
|
Cash dividends per common share
|
$
|
1.48
|
|
|
$
|
1.44
|
|
$
|
1.40
|
|
$
|
1.32
|
|
$
|
1.24
|
|
||||
|
(1)
|
Fiscal 2020 consolidated statement of income data included restructuring charges of $28,362.
|
|
(2)
|
Fiscal 2018 consolidated statement of income data included executive transition costs of $33,351 and the impact of the US tax law changes of $190,503.
|
|
(3)
|
Fiscal 2016 balances are presented in accordance with Accounting Standards Codification 605, Revenue Recognition.
|
Five years ended
March 28, 2020
(In thousands)
|
2020
|
2019
|
2018
|
2017
|
2016
(1)
|
||||||||||||||||
|
Working capital
|
$
|
1,823,460
|
|
$
|
3,416,942
|
|
$
|
3,242,643
|
|
$
|
3,077,311
|
|
$
|
2,972,261
|
|
|||||
|
Total assets
|
4,693,334
|
|
5,151,348
|
|
5,060,547
|
|
4,777,434
|
|
4,819,269
|
|
||||||||||
|
Long-term debt
|
747,110
|
|
1,234,807
|
|
1,214,440
|
|
995,247
|
|
993,639
|
|
||||||||||
|
Other long-term liabilities
|
545,494
|
|
579,996
|
|
573,809
|
|
351,890
|
|
278,446
|
|
||||||||||
|
Stockholders' equity
|
2,315,049
|
|
2,861,509
|
|
2,360,353
|
|
2,586,151
|
|
2,589,893
|
|
||||||||||
|
(1)
|
Fiscal 2016 balances are presented in accordance with Accounting Standards Codification 605, Revenue Recognition.
|
31
|
ITEM 7.
|
MANAGEMENT'S DISCUSSION AND ANALYSIS OF FINANCIAL CONDITION AND RESULTS OF OPERATIONS
|
This discussion and analysis of financial condition and results of operations should be read in conjunction with our consolidated financial statements and accompanying notes included in Item 8. "Financial Statements and Supplementary Data."
Nature of Operations
We design, develop and market programmable devices and associated technologies, including advanced ICs in the form of PLDs, boards, software design tools and predefined system functions delivered as IP. In addition to our programmable platforms, we provide design services, customer training, field engineering and technical support. Our PLDs include FPGAs, CPLDs and programmable SoCs. These devices are standard products that our customers program to perform desired logic functions. Our products are designed to provide high integration and quick time-to-market for electronic equipment manufacturers in end markets such as Aerospace & Defense (A&D), Industrial Test and Measurement and Emulation (TME), Automotive, Broadcast and Consumer, Wired and Wireless and Data Center. We sell our products globally through an independent domestic and foreign distributor channel and through direct sales to OEMs by selected independent sales representative firms and by a direct sales management organization.
Impact of COVID-19
In March 2020, the World Health Organization declared the outbreak of COVID-19 a pandemic, and various governmental authorities throughout the U.S. and the world have implemented numerous measures to contain the virus, including travel bans and restrictions, quarantines, shelter-in-place orders, and business limitations and shutdowns. Currently we are unable to accurately predict the full impact that COVID-19 will have on our future results from operations, financial condition, liquidity and cash flows due to numerous uncertainties, including the duration and severity of the pandemic and containment measures. Our compliance with these measures has impacted, and could continue to impact, our business and operations, as well as those of our key customers, suppliers (including contract manufacturers) and other counterparties, for an indefinite period of time. To support the health and well-being of our employees, customers, partners and communities, almost all of our employees have been working remotely since March 16, 2020. In addition, employees of many of our customers are also working remotely, which may delay the timing of some orders and deliveries expected in fiscal 2021.
We believe these disruptions are likely to be temporary logistical challenges and that our business would eventually resume
some degree of normalcy if the pandemic is contained and social distancing requirements are eased. However, our business may continue to be adversely impacted as a result of the pandemic’s global economic impact, and we will continue to closely monitor the associated effects, such as our ability to collect receivables from those customers significantly impacted by COVID-19 related closures and disruptions as well as changes in orders in a given period likely to affect our revenues in future periods, particularly if experienced on a sustained basis. We will continue to monitor and evaluate the nature and extent of the impact of COVID-19 to our business.
We currently expect that current cash and cash equivalent balances and cash flows that are generated from operations will be sufficient to meet our domestic and international working capital needs and other capital and liquidity requirements in the foreseeable future.
32
Critical Accounting Policies and Estimates
The methods, estimates and judgments we use in applying our most critical accounting policies have a significant impact on the results we report in our consolidated financial statements. The SEC has defined critical accounting policies as those that are most important to the portrayal of our financial condition and results of operations and require us to make our most difficult and subjective judgments, often as a result of the need to make estimates of matters that are inherently uncertain. Based on this definition, our critical accounting policies include: valuation of marketable securities, which impacts losses on debt and equity securities when we record impairments; revenue recognition, which impacts the recording of revenues; and valuation of inventories, which impacts cost of revenues and gross margin. Our critical accounting policies also include: the assessment of impairment of long-lived assets, which impacts their valuation; the assessment of the recoverability of goodwill, which impacts goodwill impairment; accounting for income taxes, which impacts the provision or benefit recognized for income taxes, as well as the valuation of deferred tax assets recorded on our consolidated balance sheet; and accounting for business combinations, which impacts the valuation of tangible and intangible assets recognized and liabilities assumed. Below, we discuss these policies further, as well as the estimates and judgments involved. We also have other key accounting policies that are not as subjective, and therefore, their application would not require us to make estimates or judgments that are as difficult, but which nevertheless could significantly affect our financial reporting.
Due to the COVID-19 pandemic, there has been uncertainty and disruption in the global economy and financial markets. We are not currently aware of any specific event or circumstance that would require an update to our estimates or judgments or a revision of the carrying value of our assets or liabilities as of March 28, 2020. These estimates may change, as new events occur and additional information is obtained. Actual results could differ materially from these estimates under different assumptions or conditions.
Revenue Recognition
Revenue from sales to our distributors is recognized upon the transfer of control, which typically occurs at shipment, and is reduced by estimated allowances for distributor price adjustments and rights of return. The distributor price adjustments are estimated using the expected value method based on an analysis of actual and forecasted ship and debit claims, at the distributor and part level to account for current pricing and business trends. For fiscal
2020
, approximately
53%
of our net revenues were from products sold to distributors primarily for subsequent resale to OEMs or their subcontract manufacturers.
Revenue from sales to our non-distributor customers is recognized net of sales incentives (if any) upon transfer of control to the customer, which typically occurs at shipment. Sales returns and allowances on product sales are recorded as a reduction of revenue.
Revenue from software license agreements and renewals is recognized at commencement date. Revenue from support services is recognized when the service is performed. Revenue from software licenses and support services was approximately
1%
or less of net revenues for all of the periods presented.
Valuation of Inventories
Inventories are stated at the lower of actual cost (determined using the first-in, first-out method) or market (estimated net realizable value). The valuation of inventory requires us to estimate excess or obsolete inventory as well as inventory that is not of salable quality. We review and set standard costs quarterly to approximate current actual manufacturing costs. Our manufacturing overhead standards for product costs are calculated assuming full absorption of actual spending over actual volumes. Given the cyclicality of the market, the obsolescence of technology and product lifecycles, we write down inventory based on forecasted demand and technological obsolescence. These forecasts are developed based on inputs from our customers, including bookings and extended but uncommitted demand forecasts, and internal analyses such as customer historical purchasing trends and actual and anticipated design wins, as well as market and economic conditions, technology changes, new product introductions and changes in strategic direction. These factors require estimates that may include uncertain elements. The estimates of future demand that we use in the valuation of inventory are the basis for our published revenue forecasts, which are also consistent with our short-term manufacturing plans. The differences between our demand forecast and the actual demand in the recent past have not resulted in any material write down in our inventory. If our demand forecast for specific products is greater than actual demand and we fail to reduce manufacturing output accordingly, we could be required to write down additional inventory, which would have a negative impact on our gross margin.
Valuation of Marketable Securities and Non-marketable Securities
Our short-term and long-term investments consist of primarily marketable debt, and to a lesser extent, equity securities. As of
March 28, 2020
, we had marketable debt securities with a fair value of
$1.48 billion
.
33
We determine the fair values for marketable debt and equity securities using industry standard pricing services, data providers and other third-party sources and by internally performing valuation testing and analysis. See "Note 3. Fair Value Measurements" to our consolidated financial statements, included in Item 8. "Financial Statements and Supplementary Data," for details of the valuation methodologies. In determining if and when a decline in value below the adjusted cost of marketable debt securities is other than temporary, we evaluate on an ongoing basis the market conditions, trends of earnings, financial condition, credit ratings, any underlying collateral and other key measures for our investments. We did not record any other-than-temporary impairment for marketable debt securities in fiscal
2020
,
2019
or
2018
. Marketable equity securities are measured and recorded at fair value on a recurring basis with changes in fair value, whether realized or unrealized, recorded through the consolidated statements of income beginning in fiscal 2019 after the adoption of Accounting Standards Update (ASU) 2016-01.
Our investments in non-marketable equity securities of private companies are accounted for under the measurement alternative upon the adoption of ASU 2016-01. The carrying value is measured at cost, less any impairment, plus or minus changes resulting from observable price changes in orderly transactions for the identical or a similar investment of the same issuer. Determining whether an observed transaction is similar to a security within our portfolio requires judgment based on the rights and obligations of the securities. Our periodic assessment of impairment is made by considering available evidence, including the general market conditions in the investee’s industry, the investee’s product development status and subsequent rounds of financing and the related valuation and/or our participation in such financings. We also assess the investee’s ability to meet business milestones and the financial condition and near-term prospects of the individual investee, including the rate at which the investee is using its cash, the investee’s need for possible additional funding at a lower valuation and any bona fide offer to purchase the investee from a prospective acquirer. The valuation methodology for determining the fair value of non-marketable equity securities is based on the factors noted above which require management judgment and are Level 3 inputs. See “Note 3. Fair Value Measurements” to our consolidated financial statements, included in Item 8. “Financial Statements and Supplementary Data,” for additional information. When a decline in value is deemed to be other than temporary, we recognize an impairment loss in the current period’s operating results to the extent of the decline. The impairments loss for non-marketable equity securities were not material during all periods presented.
Impairment of Long-Lived Assets
Long-lived assets to be held and used are reviewed for impairment if indicators of potential impairment exist. Impairment indicators are reviewed on a quarterly basis. Assets are grouped and evaluated for impairment at the lowest level of identifiable cash flows.
When indicators of impairment exist and assets are held for use, we estimate future undiscounted cash flows attributable to the related assets groups. In the event such cash flows are not expected to be sufficient to recover the recorded value of the assets, the assets are written down to their estimated fair values based on the expected discounted future cash flows attributable to the asset group or based on appraisals. Factors affecting impairment of assets held for use include the ability of the specific assets to generate separately identifiable positive cash flows.
When assets are removed from operations and held for sale, we estimate impairment losses as the excess of the carrying value of the assets over their fair value. Market conditions are amongst the factors affecting impairment of assets held for sale. Changes in any of these factors could necessitate impairment recognition in future periods for assets held for use or assets held for sale.
Long-lived assets such as property, plant and equipment are considered non-financial assets, and are only measured at fair value when indicators of impairment exist.
Goodwill
Goodwill is not amortized but is subject to impairment tests on an annual basis, or more frequently if indicators of potential impairment exist, and goodwill is written down when it is determined to be impaired. We perform an annual impairment review in the fourth quarter of each fiscal year and compare the fair value of the reporting unit in which the goodwill resides to its carrying value. If the carrying value exceeds the fair value, the goodwill of the reporting unit is potentially impaired. For purposes of impairment testing, Xilinx operates as a single reporting unit. We use the quoted market price method to determine the fair value of the reporting unit. Based on the impairment review performed during the fourth quarter of fiscal
2020
, there was no impairment of goodwill in fiscal
2020
. Unless there are indicators of impairment, our next impairment review for goodwill will be performed and completed in the fourth quarter of fiscal
2021
. To date, no impairment indicators have been identified.
34
Accounting for Income Taxes
Xilinx is a multinational corporation operating in multiple tax jurisdictions. We must determine the allocation of income to each of these jurisdictions based on estimates and assumptions and apply the appropriate tax rates for these jurisdictions. We undergo routine audits by taxing authorities regarding the timing and amount of deductions and the allocation of income among various tax jurisdictions. Tax audits often require an extended period of time to resolve and may result in income tax adjustments if changes to the allocation are required between jurisdictions with different tax rates.
In determining income for financial statement purposes, we must make certain estimates and judgments. These estimates and judgments occur in the calculation of certain tax liabilities and in the determination of the recoverability of certain deferred tax assets, which arise from temporary differences between the tax and financial statement recognition of revenue and expense. Additionally, we must estimate the amount and likelihood of potential losses arising from audits or deficiency notices issued by taxing authorities. The taxing authorities' positions and our assessment can change over time resulting in a material effect on the provision for income taxes in periods when these changes occur.
We must also assess the likelihood that we will be able to recover our deferred tax assets. If recovery is not likely, we must increase our provision for taxes by recording a reserve in the form of a valuation allowance for the deferred tax assets that we estimate will not ultimately be recoverable.
We perform a two-step approach to recognize and measure uncertain tax positions relating to accounting for income taxes. The first step is to evaluate the tax position for recognition by determining if the weight of available evidence indicates that it is more likely than not that the position will be sustained on audit, including resolution of related appeals or litigation processes, if any. The second step is to measure the tax benefit as the largest amount that is more than 50% likely of being ultimately realized.
Business Combinations
We use the acquisition method of accounting and allocate the fair value of purchase consideration to the assets acquired and liabilities assumed from the acquiree based on their respective fair values as of the acquisition date. The excess of the fair value of purchase consideration over the fair value of these assets acquired and liabilities assumed is recorded as goodwill. When determining the fair values of assets acquired and liabilities assumed, we make significant estimates and assumptions, especially with respect to intangible assets. Critical estimates in valuing intangible assets include, but are not limited to, expected future cash flows, which includes consideration of future growth and margins, future changes in technology, expected cost and time to develop in-process research and development, brand awareness and discount rates. Fair value estimates are based on the assumptions that we believe a market participant would use in pricing the asset or liability.
Results of Operations
The following table sets forth statement of income data as a percentage of net revenues for the fiscal years indicated.
35
|
|
2020
|
2019
|
2018
|
|||||
|
Net revenues
|
100.0
|
%
|
100.0
|
%
|
100.0
|
%
|
||
|
Cost of revenues:
|
||||||||
|
Cost of products sold
|
32.4
|
|
31.2
|
|
30.1
|
|
||
|
Amortization of acquisition-related intangibles
|
0.7
|
|
—
|
|
—
|
|
||
|
Total cost of revenues
|
33.1
|
|
31.2
|
|
30.1
|
|
||
|
Gross margin
|
66.9
|
|
68.8
|
|
69.9
|
|
||
|
Operating expenses:
|
|
|
|
|
|
|||
|
Research and development
|
26.9
|
|
24.3
|
|
25.9
|
|
||
|
Selling, general and administrative
|
13.7
|
|
13.0
|
|
14.7
|
|
||
|
Amortization of acquisition-related intangibles
|
0.3
|
|
0.2
|
|
0.1
|
|
||
|
Restructuring charges and executive transition costs
|
0.9
|
|
—
|
|
1.4
|
|
||
|
Total operating expenses
|
41.8
|
|
37.5
|
|
42.1
|
|
||
|
Operating income
|
25.1
|
|
31.3
|
|
27.8
|
|
||
|
Interest and other income (expense), net
|
1.3
|
|
0.4
|
|
0.2
|
|
||
|
Income before income taxes
|
26.4
|
|
31.7
|
|
28.0
|
|
||
|
Provision for income taxes
|
1.3
|
|
2.6
|
|
9.2
|
|
||
|
Net income
|
25.1
|
%
|
29.1
|
%
|
18.8
|
%
|
||
Net Revenues
|
(In millions)
|
2020
|
Change
|
2019
|
Change
|
2018
|
||||||||||||
|
Net revenues
|
$
|
3,162.7
|
|
3
|
%
|
$
|
3,059.0
|
|
24
|
%
|
$
|
2,467.0
|
|
||||
Net revenues in fiscal
2020
were
$3.16 billion
, an increase of
3%
as compared to fiscal
2019
. Revenues from Advanced Products increased
15%
in fiscal
2020
but were offset by declines from our Core Products. The increase in Advanced Products was due to higher Advanced Products sales across several end markets, particularly in Data Center. Net revenues in fiscal
2019
were
$3.06 billion
, an increase of
24%
as compared to fiscal
2018
. Revenues from Advanced Products increased
43%
in fiscal
2019
while revenues from our Core Products remained relatively stable. The fiscal
2019
increase in Advanced Products was due to higher Advanced Products sales across all end markets, particularly in Wired and Wireless. See also "Net Revenues by Product" and "Net Revenues by End Markets" below for more information on our product and end market categories.
Except for Avnet,
no
other distributor or end customer accounted for more than
10%
of net revenues for any of the periods presented.
Net Revenues by Product
We sell our products to global manufacturers of electronic products in end markets such as A&D, Industrial and TME, Automotive, Broadcast and Consumer, Wired and Wireless and Data Center. The vast majority of our net revenues are generated from sales of our semiconductor products, but we also generate sales from support products. We classify our product offerings into two categories: Advanced Products and Core Products:
|
•
|
Advanced Products are our most recent product offerings and include the UltraScale+, UltraScale and 7-series product families, and our Alveo boards business.
|
|
•
|
Core Products are all other product families.
|
These product categories are modified on a periodic basis to better reflect the maturity of the products and advances in technology. The most recent modification was made on April 3, 2016, which was the beginning of our fiscal 2017, whereby we reclassified our product categories to be consistent with how these categories are analyzed and reviewed internally. Specifically, we have grouped the products manufactured at the 28nm, 20nm and 16nm nodes into a category named Advanced Products while all other products are included in a category named Core Products.
Net revenues by product categories for the fiscal years indicated were as follows:
36
|
(In millions)
|
2020
|
% of Total
|
% Change
|
2019
|
% of Total
|
% Change
|
2018
|
||||||||||||||||
|
Advanced Products
|
$
|
2,239.5
|
|
71
|
|
15
|
|
$
|
1,952.4
|
|
64
|
|
43
|
|
$
|
1,362.8
|
|
||||||
|
Core Products
|
923.2
|
|
29
|
|
(17
|
)
|
1,106.6
|
|
36
|
|
—
|
|
1,104.2
|
|
|||||||||
|
Total net revenues
|
$
|
3,162.7
|
|
100
|
|
3
|
|
$
|
3,059.0
|
|
100
|
|
24
|
|
$
|
2,467.0
|
|
||||||
Net revenues from Advanced Products increased in fiscal
2020
driven by strong sales growth in 16nm product families but were partially offset by declines in sales from our 20nm and 28nm products families. Sales from our 16nm products were over $1.08 billion, while sales from our 20nm and 28nm products exceeded $300.0 million and $800.0 million, respectively, during fiscal
2020
. In fiscal
2019
, net revenues from Advanced Products increased significantly driven by sales growth in 28nm, 20nm and, in particular, 16nm product families. Sales from our 16nm products were over $500.0 million, while sales from our 20nm and 28nm products exceeded $400.0 million and $900.0 million, respectively, during fiscal
2019
. We expect sales of Advanced Products to continue to grow as more customer programs enter into volume production with our 16nm products.
Net revenues from Core Products decreased in fiscal
2020
while net revenues were flat in fiscal
2019
from the comparable prior year periods. The decrease in fiscal
2020
was largely driven by the decline in sales from our Virtex-6, Spartan-6 and Virtex-5 product families.
Net Revenues by End Markets
Our end market revenue data is derived from our understanding of our end customers’ primary markets, which is based on reports provided by distributors and our internal records. To provide additional visibility, starting March 31, 2019, we classify our end markets into businesses with similar market drivers: A&D, Industrial and TME; Automotive, Broadcast and Consumer; Wired and Wireless and Data Center. Additionally, we classify revenue recognized from shipments to distributors but not yet subsequently sold to the end markets as Channel Revenue. The Channel Revenue in the table below represents the difference between the shipments to distributors and what the distributors subsequently sold to the end customers within the same period. The percentage change calculation in the table below represents the year-to-year dollar change in each end market.
Net revenues by end markets for fiscal years indicated were as follows:
|
(% of total net revenues)
|
2020
|
% Change in Dollars
|
2019
|
% Change in Dollars
|
2018
|
||||||||
|
A&D, Industrial and TME
|
41
|
%
|
5
|
|
41
|
%
|
6
|
48
|
%
|
||||
|
Automotive, Broadcast and Consumer
|
16
|
|
8
|
|
15
|
|
17
|
16
|
|
||||
|
Wired and Wireless
|
34
|
|
(1
|
)
|
36
|
|
34
|
33
|
|
||||
|
Data Center
|
9
|
|
22
|
|
7
|
|
40
|
6
|
|
||||
|
Channel Revenue
|
—
|
|
nm*
|
|
1
|
|
nm*
|
(3
|
)
|
||||
|
Total net revenues
|
100
|
%
|
3
|
|
100
|
%
|
24
|
100
|
%
|
||||
*not meaningful
Net revenues from A&D, Industrial and TME increased, in terms of absolute dollars, in both fiscal
2020
and
2019
from the comparable prior year periods. The increases in fiscal
2020
and
2019
were primarily due to higher sales from A&D business.
Net revenues from Automotive, Broadcast & Consumer increased, in terms of absolute dollars, in both fiscal
2020
and
2019
from the comparable prior year periods. The increases in fiscal
2020
and
2019
were primarily due to higher sales from Automotive business. However, we started seeing revenue negatively impacted by the COVID-19 pandemic midway through the fourth quarter of fiscal 2020. The impact on revenue was more pronounced in our Automotive business, as car sales in China and around the globe declined significantly. We also experienced lower than expected growth in Broadcast and China channel businesses in the fourth quarter of fiscal 2020.
Net revenues from Wired and Wireless decreased in fiscal
2020
from the comparable prior year period. The decrease was due to lower sales from Wired business, but was partially offset by the increase from Wireless business with particular strength coming from the continued deployment of 4G Long Term Evolution (LTE) networks and the accelerated global deployment ramp of 5G wireless networks. In fiscal
2019
, net revenues from Wired and Wireless increased in fiscal 2019 from the comparable prior year period. The increase was primarily due to higher sales from all sub-markets, with particular strength coming from Wireless business driven by both the continued deployment of 4G LTE networks and the accelerated global deployment ramp of 5G wireless networks.
37
Net revenues from Data Center increased, in terms of absolute dollars, in both fiscal
2020
and
2019
from the comparable prior year periods. The increases in both fiscal
2020
and
2019
were due to higher sales from networking business.
Channel revenue represents the net change in distribution inventory and was immaterial for all of the periods presented.
Net Revenues by Geography
Geographic revenue information reflects the geographic location of the distributors, OEMs or contract manufacturers who purchased our products. This may differ from the geographic location of the end customers. Net revenues by geography for the fiscal years indicated were as follows:
|
(In millions)
|
2020
|
% of Total
|
% Change
|
2019
|
% of Total
|
% Change
|
2018
|
||||||||||||||||
|
North America
|
$
|
915.0
|
|
29
|
|
8
|
|
$
|
848.7
|
|
28
|
|
13
|
|
$
|
748.9
|
|
||||||
|
Asia Pacific
|
1,475.2
|
|
46
|
|
6
|
|
1,385.6
|
|
45
|
|
37
|
|
1,008.5
|
|
|||||||||
|
Europe
|
534.0
|
|
17
|
|
(9
|
)
|
586.9
|
|
19
|
|
17
|
|
501.0
|
|
|||||||||
|
Japan
|
238.5
|
|
8
|
|
—
|
|
237.8
|
|
8
|
|
14
|
|
208.6
|
|
|||||||||
|
Total net revenues
|
$
|
3,162.7
|
|
100
|
|
3
|
|
$
|
3,059.0
|
|
100
|
|
24
|
|
$
|
2,467.0
|
|
||||||
Net revenues in North America increased in both fiscal
2020
and
2019
from the comparable prior year periods. The increase in fiscal 2020 was primarily due to higher sales from A&D and TME businesses, while the increase in fiscal
2019
was primarily due to higher sales from Data Center and Wired businesses.
Net revenues in Asia Pacific increased in both fiscal
2020
and
2019
from the comparable prior year periods. The increase in fiscal 2020 was primarily due to higher sales from Wireless business, and to a lesser extent, from TME business, while the increase in fiscal
2019
was primarily driven by higher sales from Wireless business, and to a lesser extent from Industrial, Scientific and Medical business.
Net revenues in Europe decreased in fiscal
2020
but increased in fiscal
2019
from the comparable prior year periods. In fiscal
2020
, the decrease was primarily due to lower sales from TME business, while the increase in fiscal
2019
was driven by higher sales from Automotive business.
Net revenues in Japan were flat in fiscal
2020
, while increased in
2019
from the comparable prior year periods. The increase in fiscal 2019 was primarily driven by higher sales in TME and Audio, Video and Broadcast businesses.
Gross Margin
|
(In millions)
|
2020
|
Change
|
2019
|
Change
|
2018
|
||||||||||||
|
Gross margin
|
$
|
2,115.0
|
|
1
|
%
|
$
|
2,103.2
|
|
22
|
%
|
$
|
1,723.6
|
|
||||
|
Percentage of net revenues
|
66.9
|
%
|
|
68.8
|
%
|
|
69.9
|
%
|
|||||||||
Gross margin was lower by 1.9 percentage points in fiscal
2020
and lower by 1.1 percentage points in fiscal
2019
, from the comparable prior year periods. The decrease in gross margin in fiscal
2020
was primarily due to end-market mix, as the percentage of revenue derived from Wireless business (which has relatively lower gross margin) increased significantly. Lower gross margin was also affected, to a lesser extent, by higher amortization of acquisition-related intangibles as we continued to acquire more businesses during fiscal
2020
.The decrease in gross margin in fiscal 2019 was primarily due to end-market mix, as the percentage of revenue derived from Wireless business (which has relatively lower gross margin) increased significantly.
Gross margin may be affected in the future due to multiple factors, including but not limited to, those set forth above in "Risk Factors," included in Part I of this Form 10-K, shifts in the mix of customers and products, COVID-19 pandemic, competitive-pricing pressure, manufacturing-yield issues and wafer pricing. While we expect to mitigate any adverse impacts from these factors by continuing to improve yields on our Advanced Products, improve manufacturing efficiencies and improve average selling price management, continuing growth in Wireless driven by both the continued deployment of 4G Long Term Evolution (LTE) networks and the ramp up global deployment of 5G wireless networks would negatively impact gross margin in the future.
38
In order to compete effectively, we pass manufacturing cost reductions to our customers in the form of reduced prices to the extent that we can maintain acceptable margins. Price erosion is common in the semiconductor industry, as advances in both product architecture and manufacturing process technology permit continual reductions in unit cost. We have historically been able to offset much of this revenue decline in our mature products with increased revenues from newer products.
Research and Development
|
(In millions)
|
2020
|
Change
|
2019
|
Change
|
2018
|
||||||||||||
|
Research and development
|
$
|
853.6
|
|
15
|
%
|
$
|
743.0
|
|
16
|
%
|
$
|
639.8
|
|
||||
|
Percentage of net revenues
|
27
|
%
|
|
24
|
%
|
|
26
|
%
|
|||||||||
R&D spending increased by $110.6 million or
15%
during fiscal
2020
, and by $103.2 million or
16%
during fiscal
2019
, from the comparable prior year periods. The increases were primarily attributable to higher employee compensation (including stock-based compensation), as we increased headcount to support the development of new products during fiscal
2020
and
2019
.
The COVID-19 pandemic that began in March 2020 did not have any significant impact on our R&D activities and efforts in fiscal 2020. Although almost all of our employees have been working remotely since March 16, 2020, we have long had a business continuity plan and invested in technologies and tools that would enable the employees to work effectively and remotely. These investments have helped to minimize disruptions but may not be sufficient to eliminate them. Nevertheless, we currently do not believe our R&D activities and efforts would be severely impacted by the COVID-19 pandemic.
We plan to continue to selectively invest in R&D efforts in areas such as new products and more advanced process development, IP cores and software development environments. We may also consider acquisitions to complement our strategy for technology leadership and engineering resources in critical areas.
Selling, General and Administrative
|
(In millions)
|
2020
|
Change
|
2019
|
Change
|
2018
|
||||||||||||
|
Selling, general and administrative
|
$
|
432.3
|
|
9
|
%
|
$
|
398.4
|
|
10
|
%
|
$
|
362.3
|
|
||||
|
Percentage of net revenues
|
14
|
%
|
|
13
|
%
|
|
15
|
%
|
|||||||||
SG&A expenses increased by $33.9 million or
9%
during fiscal
2020
, and by $36.1 million or
10%
during fiscal
2019
, from the comparable prior year periods. The increase in fiscal
2020
was primarily due to higher employee compensation (including stock-based compensation) from increased headcount, as well as expenses related to merger and acquisition activities. The increase in fiscal
2019
was primarily due to higher variable spending associated with higher revenue and operating margin such as sales commission and incentive compensation expense, as well as expenses related to merger and acquisition activities.
The COVID-19 pandemic that began in March 2020 did not have any material effect on our SG&A expenses in fiscal 2020. If the pandemic is not contained and our revenue is adversely impacted, our variable spending, such as sales commission and incentive compensation expenses, may decline.
Restructuring Charges and Executive Transition Costs
During the fourth quarter of fiscal 2020, we announced cost-saving measures designed to drive structural operating efficiencies across the Company, including a targeted global workforce reduction in force. This impacted approximately
238
positions, or
5%
of our global workforce, in various geographies and functions worldwide. The reorganization plan is expected to be substantially completed by the end of the first quarter of fiscal 2021. We recorded total restructuring charges of
$28.4
million in fiscal 2020, primarily related to severance pay expenses and separately presented on the consolidated statements of income. As of the end of fiscal 2020, there was a
$13.5
million accrual for severance and other benefits that are expected to be paid during fiscal 2021.
The COVID-19 pandemic did not influence our decision to execute these cost-savings measures as these measures were already planned and announced in January 2020, before the pandemic declared in March 2020.
39
The following table summarizes the restructuring accrual activity for fiscal 2020:
|
(In millions)
|
Employee severance and benefits
|
Others
|
Total
|
|||||||||
|
Restructuring charges
|
$
|
27.7
|
|
$
|
0.7
|
|
$
|
28.4
|
|
|||
|
Cash payments
|
(14.6
|
)
|
(0.1
|
)
|
(14.7
|
)
|
||||||
|
Non-cash charges
|
(0.2
|
)
|
—
|
|
(0.2
|
)
|
||||||
|
Balance as of March 28, 2020
|
$
|
12.9
|
|
$
|
0.6
|
|
$
|
13.5
|
|
|||
During the fourth quarter of fiscal 2018, we announced the transition of our President and Chief Executive Officer position, whereby Moshe Gavrielov resigned from those roles and Victor Peng assumed these roles. Additionally, we also implemented restructuring measures to realign resources and drive overall operating efficiencies, which impacted approximately
60
positions in various geographies and functions worldwide. We recorded total transition charges of
$33.4 million
in the fourth quarter of fiscal 2018, primarily related to severance pay expenses and other benefits. As of the end of fiscal 2020 and 2019, the remaining accrual balance for severance and other benefits was immaterial.
Stock-Based Compensation
|
(In millions)
|
2020
|
Change
|
2019
|
Change
|
2018
|
||||||||||||
|
Stock-based compensation included in:
|
|
|
|
|
|
|
|
|
|
|
|||||||
|
Cost of revenues
|
$
|
10.0
|
|
14
|
%
|
$
|
8.8
|
|
4
|
%
|
$
|
8.5
|
|
||||
|
Research and development
|
115.0
|
|
33
|
%
|
86.4
|
|
13
|
%
|
76.8
|
|
|||||||
|
Selling, general and administrative
|
61.5
|
|
17
|
%
|
52.7
|
|
2
|
%
|
51.9
|
|
|||||||
|
Restructuring charges and executive transition costs
|
0.2
|
|
nm*
|
|
—
|
|
(100
|
)%
|
16.6
|
|
|||||||
|
|
$
|
186.7
|
|
26
|
%
|
$
|
147.9
|
|
(4
|
)%
|
$
|
153.8
|
|
||||
*not meaningful
Excluding the restructuring charges and executive transition costs portion, stock-based compensation increased by $38.6 million and $10.7 million in fiscal
2020
and
2019
, respectively, as compared to the prior year periods. The increases were primarily related to higher expenses associated with restricted stock units, which had a higher fair value in the recent years.
Interest and Other Income (Expense), Net
|
(In millions)
|
2020
|
Change
|
2019
|
Change
|
2018
|
||||||||||||
|
Interest and other income (expense), net
|
$
|
42.1
|
|
265
|
%
|
$
|
11.5
|
|
115
|
%
|
$
|
5.4
|
|
||||
|
Percentage of net revenues
|
1
|
%
|
|
—
|
%
|
|
—
|
%
|
|||||||||
Net interest and other income were
$42.1 million
in fiscal
2020
as compared to
$11.5 million
in fiscal
2019
. The increase was primarily due to higher gains from the investment portfolio, and to a lesser extent, lower interest expenses from the maturity of the $500.0 million principal amount of 2.125% Notes issued in March 2014. Net interest and other income were
$11.5 million
in fiscal
2019
as compared to
$5.4 million
in fiscal
2018
. The increase was primarily due to higher interest income from the investment portfolio.
Provision for Income Taxes
|
(In millions)
|
2020
|
Change
|
2019
|
Change
|
2018
|
||||||||||||
|
Provision for income taxes
|
$
|
41.3
|
|
(47
|
)%
|
$
|
78.6
|
|
(65
|
)%
|
$
|
227.4
|
|
||||
|
Percentage of net revenues
|
1
|
%
|
|
3
|
%
|
|
9
|
%
|
|||||||||
|
Effective tax rate
|
5
|
%
|
|
8
|
%
|
|
33
|
%
|
|||||||||
The difference between the U.S. federal statutory tax rate of 21% and our effective tax rate in fiscal 2020 and 2019 was primarily due to the favorable impact of income earned in lower tax rate jurisdictions, which was partially offset by tax on the global intangible low-taxed income (GILTI) of foreign subsidiaries.
40
The decrease in the effective tax rate for fiscal 2020 compared with fiscal 2019 was primarily due to an increase in excess tax benefits with respect to stock-based compensation.
The decrease in the effective tax rate for fiscal 2019 compared with fiscal 2018 was primarily due to the U.S. federal one-time transition tax of $590.2 million recognized in fiscal 2018, partially offset by the reversal of deferred tax liabilities related to U.S. federal income tax on a portion of unremitted foreign earnings that had been accrued through fiscal 2017 in the amount of $381.7 million.
On December 22, 2017, the TCJA was enacted into law. It made significant tax law changes and modifications including the reduction of the U.S. federal corporate income tax rate from 35% to 21%, the requirement for companies to pay a one-time transition tax on earnings of certain foreign subsidiaries that were previously tax deferred and the creation of a GILTI tax on foreign subsidiaries. Some provisions of the TCJA began to impact us in fiscal 2018, while other provisions impacted us beginning in fiscal 2019.
Staff Accounting Bulletin (SAB) 118 allowed companies to record provisional amounts and recognize the effect of the tax law changes during a measurement period. We recorded provisional income tax expense of $214.7 million in our fiscal 2018 results. During fiscal 2019, we recorded income tax expense of $2.4 million as measurement period adjustments to the provisional amounts recorded in fiscal 2018. The measurement period ended in the third quarter of fiscal 2019.
On July 27, 2015, the United States Tax Court (Tax Court) issued an opinion in Altera Corp. v. Commissioner, and, in a 15-0 decision, concluded that related parties in a cost sharing arrangement are not required to share expenses related to stock-based compensation. The Commissioner appealed the Tax Court decision to the Ninth Circuit Court of Appeals (Ninth Circuit). The Ninth Circuit overturned the Tax Court’s decision in an opinion issued on July 24, 2018, but subsequently withdrew it. After rehearing the arguments on October 16, 2018, the Ninth Circuit issued a subsequent opinion on June 7, 2019. In a 2-1 decision, the Ninth Circuit overturned the Tax Court’s decision. On July 22, 2019, Altera filed a petition for an
en banc
rehearing with the Ninth Circuit. On November 12, 2019, the Ninth Circuit issued an order denying Altera's petition. On February 10, 2020, Altera filed a
writ of certiorari
with the U.S. Supreme Court for review of the case. As such, the decision is not final. We have concluded that the law is unsettled and continue to record tax benefits as we exclude stock-based compensation costs from our cost sharing arrangement. As of March 28, 2020, the cumulative potential impact of a final adverse decision to the consolidated statement of income was $55 million to $60 million for taxes and interest. We will continue to monitor developments in the Altera case and the potential effect on our consolidated financial statements.
We have manufacturing operations in Singapore for which we have been granted "Pioneer Status" effective through fiscal 2021. The Pioneer Status reduces our local tax on Singapore income from a statutory rate of 17% to zero percent. Without obtaining a further Singapore incentive, the tax rate on Singapore income would increase to 17% beginning in fiscal 2022. During the quarter ended September 28, 2019, we received awards from the Singapore Economic Development Board for a Development and Expansion Incentive that will reduce our local tax on Singapore income from a statutory rate of 17% to 5%, effective for fiscal years 2022 through 2031.
Financial Condition, Liquidity and Capital Resources
We have historically used a combination of cash flows from operations and equity and debt financing to support ongoing business activities, acquire or invest in critical or complementary technologies, purchase facilities and capital equipment, repurchase our common stock and debentures under our repurchase program, pay dividends and finance working capital. Additionally, our investments in debt securities are liquid and available for future business needs.
To date, COVID-19 has not had a significant impact on our liquidity, cash flows or capital resources. However, the continued spread of COVID-19 has led to disruption and volatility in the global capital markets, which, depending on future developments, could impact our capital resources and liquidity in the future.
Fiscal
2020
Compared to Fiscal
2019
Cash, Cash Equivalents and Short-term and Long-term Investments
The combination of cash, cash equivalents and short-term and long-term investments as of
March 28, 2020
and
March 30, 2019
totaled
$2.27 billion
and
$3.23 billion
, respectively. As of
March 28, 2020
, we had cash, cash equivalents and short-term investments of
$2.27 billion
and working capital of
$1.82 billion
. As of
March 30, 2019
, cash, cash equivalents and short-term investments were
$3.18 billion
and working capital was
$3.42 billion
.
41
As of
March 28, 2020
, we had
$986.8 million
of cash, cash equivalents and short-term investments held by our non-U.S. entities. Substantially all $986.8 million of cash, cash equivalents and short-term investments held by our non-U.S. entities will be available for use in the U.S. without incurring additional U.S. federal income taxes.
During fiscal
2020
, our operations generated net cash flow of
$1.19 billion
, which was
$99.6 million
higher than the
$1.09 billion
generated during fiscal
2019
. The net cash flow from operations generated during fiscal
2020
was primarily from net income as adjusted for non-cash related items and decreases in accounts receivable, inventory and income taxes payable. These items were partially offset by decreases in accrued liabilities and accounts payable.
Net cash provided by investing activities was
$680.2 million
during fiscal
2020
as compared to net cash used in investing activities of
$690.5 million
in fiscal
2019
. Net cash provided by investing activities during fiscal
2020
consisted of
$1.29 billion
of net proceeds of available-for-sale and equity securities, which were partially offset by
$454.7 million
of net cash paid in connection with the acquisitions,
$129.3 million
of purchases of property, plant and equipment and software and
$27.8 million
of other investing activities.
Net cash used in financing activities was
$1.64 billion
in fiscal
2020
, as compared to
$1.04 billion
in fiscal
2019
. Net cash used in financing activities during fiscal
2020
consisted of
$1.21 billion
of payment to repurchase common stock,
$371.8 million
of dividend payments to stockholders and
$80.7 million
of taxes paid related to net share settlement of restricted stock units, which were partially offset by
$53.3 million
from issuance of common stock under employee stock plans.
Accounts Receivable
Accounts receivable decreased by
$62.1 million
and days sales outstanding (DSO) decreased to 31 days at
March 28, 2020
from 40 days at
March 30, 2019
. The decrease in accounts receivable was primarily due to strong collections during the year as well as timing of customer shipments. Our accounts receivable was primarily current.
Inventories
Inventories decreased to
$304.3 million
as of
March 28, 2020
from
$315.4 million
as of
March 30, 2019
, while inventory days at Xilinx decreased to 106 days at
March 28, 2020
from 120 days at
March 30, 2019
. We attempt to maintain sufficient levels of inventory in various product, package and speed configurations in order to keep lead times short and to meet forecasted customer demand as well as address potential supply constraints. Conversely, we also attempt to minimize the handling costs associated with maintaining higher inventory levels and to fully realize the opportunities for cost reductions associated with architecture and manufacturing process advancements. We continually strive to balance these two objectives to provide excellent customer response at a competitive cost.
Property, Plant and Equipment and Software
During fiscal
2020
, we invested
$129.3 million
in property, plant and equipment and other intangibles, as compared to
$89.0 million
in fiscal
2019
. Primary investments in fiscal
2020
were for machinery and equipment, building improvements, software, computer equipment and equipment related to the support of our new products development and infrastructures.
Current Liabilities
Current liabilities increased to
$1.09 billion
at the end of fiscal
2020
from
$475.0 million
at the end of fiscal
2019
. The changes were primarily due to the reclassification of the short-term portion of the long-term debt, as our 2021 Notes of
$499.3 million
will mature in March 2021, as well as an increase of
$135.1 million
in our other accrued liabilities. These increases were partially offset by decreases of
$15.8 million
in accrued payroll and related liabilities and
$15.4 million
in accounts payable.
42
Stockholders' Equity
Stockholders' equity decreased
$546.5 million
to
$2.32 billion
during fiscal
2020
from
$2.86 billion
in fiscal
2019
. The decrease was primarily due to repurchase of common stock of approximately
$1.21 billion
and
$371.8 million
of payment of dividends to stockholders, partially offset by
$792.7 million
in net income for fiscal
2020
,
$186.7 million
of stock-based compensation and
$81.9 million
of additional tax benefit recognized relating to fiscal 2014 redemption of convertible debt.
Fiscal 2019 Compared to Fiscal 2018
For discussion related to the results of operations and liquidity and capital resources for fiscal 2019 compared to fiscal 2018, please refer to Item 7. Management's Discussion and Analysis of Financial Condition and Results of Operations" included in our Form 10-K for the year ended March 30, 2019 filed with the SEC.
Liquidity and Capital Resources
To date, COVID-19 has not had a significant impact on our liquidity, cash flows or capital resources. However, the continued spread of COVID-19 has led to disruption and volatility in the global capital markets, which, depending on future developments, could impact our capital resources and liquidity in the future.
Cash generated from operations is used as our primary source of liquidity and capital resources. Our investment portfolio is also available for future cash requirements as is our
$400.0 million
revolving credit facility entered into in December 2016 (expiring in
December 2021
). We are not aware of any lack of access to the revolving credit facility; however, we can provide no assurance that access to the credit facility will not be impacted by adverse conditions in the financial markets. Our credit facility is not reliant upon a single bank. There have been
no
borrowings to date under our existing revolving credit facility.
We repurchased
12.9 million
shares of our common stock for approximately
$1.21 billion
during fiscal
2020
. During fiscal
2019
, we repurchased
2.4 million
shares of common stock for approximately
$161.6 million
. During fiscal
2020
, we paid
$371.8 million
in cash dividends to stockholders, representing $1.48 per common share. During fiscal
2019
, we paid
$364.2 million
in cash dividends to stockholders, representing $1.44 per common share. On
April 20, 2020
, our Board of Directors declared a cash dividend of
$0.38
per common share for the
first
quarter of fiscal
2021
. The dividend is payable on
June 3, 2020
to stockholders of record as of
May 13, 2020
. Our common stock and debentures repurchase program and dividend policy could be impacted by, among other items, our views on potential future capital requirements relating to R&D, investments and acquisitions, legal risks, principal and interest payments on our debentures and other strategic investments.
We anticipate that existing sources of liquidity and cash flows from operations will be sufficient to satisfy our cash needs for the foreseeable future. We will continue to evaluate opportunities for investments to obtain additional wafer capacity, to procure additional capital equipment and facilities, to develop new products, and to potentially acquire technologies or businesses that could complement our business. However, certain risks and other factors, including those discussed in Item 1A and below, could affect our cash positions adversely.
Contractual Obligations
The following table summarizes our significant contractual obligations as of
March 28, 2020
and the effect such obligations are expected to have on our liquidity and cash flows in future periods.
43
|
Payments Due by Period
|
||||||||||||||||||||
|
(In millions)
|
Total
|
Less than 1 year
|
1-3 years
|
3-5 years
|
More than 5 years
|
|||||||||||||||
|
Inventory and manufacturing-related purchase obligations (1)
|
$
|
142.4
|
|
$
|
142.4
|
|
$
|
—
|
|
$
|
—
|
|
$
|
—
|
|
|||||
|
Other ongoing operations (2)
|
42.9
|
|
34.6
|
|
7.8
|
|
0.1
|
|
0.4
|
|
||||||||||
|
Operating leases (3)
|
76.7
|
|
13.8
|
|
20.2
|
|
13.1
|
|
29.6
|
|
||||||||||
|
2021 Notes-principal and interest (4)
|
515.0
|
|
515.0
|
|
—
|
|
—
|
|
—
|
|
||||||||||
|
2024 Notes-principal and interest (4)
|
849.6
|
|
22.1
|
|
44.3
|
|
783.2
|
|
—
|
|
||||||||||
|
Other long-term liabilities (5)
|
76.8
|
|
41.1
|
|
35.7
|
|
—
|
|
—
|
|
||||||||||
|
Tax obligations (6)
|
453.3
|
|
43.2
|
|
86.3
|
|
188.9
|
|
134.9
|
|
||||||||||
|
Total
|
$
|
2,156.7
|
|
$
|
812.2
|
|
$
|
194.3
|
|
$
|
985.3
|
|
$
|
164.9
|
|
|||||
|
(1)
|
Due to the nature of our business, we depend entirely upon subcontractors to manufacture our silicon wafers and provide assembly and some test services. The lengthy subcontractor lead times require us to order the materials and services in advance, and we are obligated to pay for the materials and services when completed. We expect to receive and pay for these materials and services in the next three to six months, as the products meet delivery and quality specifications.
|
|
(2)
|
As of
March 28, 2020
, we had
$41.3 million
in commitments primarily related to open purchase orders from ordinary operations and
$1.6 million
related to renovation of three of our properties.
|
|
(3)
|
Operating lease obligations represent undiscounted lease payments under non-cancelable leases as of
March 28, 2020
. See "Note 8. Leases and Commitments" to our consolidated financial statements, included in Item 8. "Financial Statements and Supplementary Data," for additional information about our operating lease obligations.
|
|
(4)
|
For purposes of this table we have assumed the outstanding principal of our debentures will be paid on maturity dates, March 15, 2021 for the 2021 Notes and June 1, 2024 for the 2024 Notes. See "Note 12. Debt and Credit Facility" to our consolidated financial statements, included in Item 8. "Financial Statements and Supplementary Data," for additional information about our debentures.
|
|
(5)
|
Other long-term liabilities primarily represent future fixed and non-cancellable cash payments associated with software license contracts, including the payments due within the next 12 months.
|
|
(6)
|
Tax obligations represent future cash payments related to the one-time transition tax that resulted from the enactment of the TCJA. See “Note 14. Income Taxes” to our consolidated financial statements, included in Item 8. "Financial Statements and Supplementary Data.”
|
As of
March 28, 2020
,
$447.4 million
of liabilities were classified as long-term income taxes payable in the consolidated balance sheets. Of the $447.4 million, $410.2 million was the estimated long-term portion of the one-time transition tax that resulted from the enactment of the TCJA offset by $3.7 million of adjustments from amended returns. The remaining $40.9 million of the long-term income taxes payable was for uncertain tax positions and related interest and penalties.
Off-Balance-Sheet Arrangements
As of
March 28, 2020
, we did not have any significant off-balance-sheet arrangements, as defined in Item 303(a)(4)(ii) of SEC Regulation S-K.
Recent Accounting Pronouncements
See "Note 2. Summary of Significant Accounting Policies and Concentrations of Risk" to our consolidated financial statements, included in Item 8. "Financial Statements and Supplementary Data," for information about recent accounting pronouncements, including the expected dates of adoption and estimated effects, if any, on our consolidated financial statements.
|
ITEM 7A.
|
QUANTITATIVE AND QUALITATIVE DISCLOSURES ABOUT MARKET RISK
|
Interest Rate Risk
Our exposure to interest rate risk relates to certain types of investments, which consists of fixed income securities with a fair value of approximately
$1.48 billion
as of
March 28, 2020
. The fixed income investments include mortgage-backed securities, commercial mortgage-backed securities, financial institution securities, non-financial institution securities, U.S. and foreign government and agency securities and asset-backed securities. Our primary aim with our investment portfolio is to invest available cash while preserving principal and meeting liquidity needs. In accordance with our investment policy, we place investments with
44
high credit quality issuers and limit the amount of credit exposure to any one issuer based upon the issuer's credit rating. These securities are subject to interest rate risk and will decrease in value if market interest rates increase. A hypothetical 100 basis-point (one percentage point) increase or decrease in interest rates compared to rates at
March 28, 2020
and
March 30, 2019
would have affected the fair value of our investment portfolio by approximately
$8.0 million
and
$31.0 million
, respectively.
Credit Market Risk
The global credit markets may experience adverse conditions that negatively impact the values of various types of investment and non-investment grade securities. The global credit and capital markets may experience significant volatility and disruption due to instability in the global financial system, uncertainty related to global economic conditions and concerns regarding sovereign financial stability and uncertainty over the COVID-19 pandemic. Therefore, there is a risk that we may incur other-than-temporary impairment charges for certain types of investments should credit market conditions deteriorate. See "Note 4. Financial Instruments" to our consolidated financial statements, included in Item 8. "Financial Statements and Supplementary Data."
Foreign Currency Exchange Risk
Substantially all sales are denominated in U.S. dollars.
Gains and losses on foreign currency forward contracts that are designated as hedges of anticipated transactions, for which a firm commitment has been attained and the hedged relationship has been effective, are deferred and included in income or expenses in the same period that the underlying transaction is settled. Gains and losses on any instruments not meeting the above criteria are recognized in income or expenses in the consolidated statements of income as they are incurred.
We enter into forward currency exchange contracts to hedge our overseas operating expenses and other liabilities when deemed appropriate. As of
March 28, 2020
and
March 30, 2019
, we had the following outstanding forward currency exchange contracts (in notional amount):
|
(In millions and U.S. dollars)
|
March 28, 2020
|
|
March 30, 2019
|
||||
|
Singapore Dollar
|
$
|
28.9
|
|
|
$
|
29.4
|
|
|
Euro
|
33.5
|
|
|
39.4
|
|
||
|
Indian Rupee
|
76.0
|
|
|
78.0
|
|
||
|
British Pound
|
20.2
|
|
|
10.6
|
|
||
|
Japanese Yen
|
2.4
|
|
|
3.8
|
|
||
|
Chinese Yuan
|
26.3
|
|
|
34.4
|
|
||
|
|
$
|
187.3
|
|
|
$
|
195.6
|
|
As part of our strategy to reduce volatility of operating expenses due to foreign exchange rate fluctuations, we employ a hedging program with forward outlook of up to two years for major foreign-currency-denominated operating expenses. The outstanding forward currency exchange contracts expire at various dates through
February 2022
. The net unrealized losses, which approximate the fair market value of the forward currency exchange contracts, are expected to be recognized in the consolidated statements of income within the next two years.
Our investments in several of our wholly-owned subsidiaries are recorded in currencies other than the U.S. dollar. As the financial statements of these subsidiaries are translated at each quarter end during consolidation, fluctuations of exchange rates between the foreign currency and the U.S. dollar increase or decrease the value of those investments. These fluctuations are recorded within stockholders' equity as a component of accumulated other comprehensive income (loss). Other monetary foreign-denominated assets and liabilities are revalued on a monthly basis with gains and losses on revaluation reflected in net income. A hypothetical 10% favorable or unfavorable change in foreign currency exchange rates at
March 28, 2020
and
March 30, 2019
would have affected the annualized foreign-currency-denominated operating expenses of our foreign subsidiaries by less than $16.0 million for each year. In addition, a hypothetical 10% favorable or unfavorable change in foreign currency exchange rates compared to rates at
March 28, 2020
and
March 30, 2019
would have affected the value of foreign-currency-denominated cash and investments by less than $14.0 million as of each date.
45
|
ITEM 8.
|
FINANCIAL STATEMENTS AND SUPPLEMENTARY DATA
|
XILINX, INC.
CONSOLIDATED STATEMENTS OF INCOME
|
|
Years Ended
|
||||||||||
|
(In thousands, except per share amounts)
|
March 28, 2020
|
March 30, 2019
|
March 31, 2018
|
||||||||
|
Net revenues
|
$
|
|
|
$
|
|
|
$
|
|
|
||
|
Cost of revenues:
|
|
|
|
|
|
|
|||||
|
Cost of products sold
|
|
|
|
|
|
|
|||||
|
Amortization of acquisition-related intangibles
|
|
|
|
|
|
|
|||||
|
Total cost of revenues
|
|
|
|
|
|
|
|||||
|
Gross margin
|
|
|
|
|
|
|
|||||
|
Operating expenses:
|
|
|
|
||||||||
|
Research and development
|
|
|
|
|
|
|
|||||
|
Selling, general and administrative
|
|
|
|
|
|
|
|||||
|
Amortization of acquisition-related intangibles
|
|
|
|
|
|
|
|||||
|
Restructuring charges and executive transition costs
|
|
|
|
|
|
|
|||||
|
Total operating expenses
|
|
|
|
|
|
|
|||||
|
Operating income
|
|
|
|
|
|
|
|||||
|
Interest and other income (expense), net
|
|
|
|
|
|
|
|||||
|
Income before income taxes
|
|
|
|
|
|
|
|||||
|
Provision for income taxes
|
|
|
|
|
|
|
|||||
|
Net income
|
$
|
|
|
$
|
|
|
$
|
|
|
||
|
Net income per common share:
|
|
|
|
||||||||
|
Basic
|
$
|
|
|
$
|
|
|
$
|
|
|
||
|
Diluted
|
$
|
|
|
$
|
|
|
$
|
|
|
||
|
Shares used in per share calculations:
|
|
|
|||||||||
|
Basic
|
|
|
|
|
|
|
|||||
|
Diluted
|
|
|
|
|
|
|
|||||
See notes to consolidated financial statements.
46
XILINX, INC.
CONSOLIDATED STATEMENTS OF COMPREHENSIVE INCOME
|
Years Ended
|
|||||||||||
|
(In thousands)
|
March 28, 2020
|
March 30, 2019
|
|
March 31, 2018
|
|||||||
|
Net income
|
$
|
|
|
$
|
|
|
$
|
|
|
||
|
Other comprehensive income (loss), net of tax:
|
|
|
|
|
|
|
|||||
|
Net change in unrealized gains (losses) on available-for-sale securities
|
|
|
|
|
(
|
)
|
|||||
|
Reclassification adjustment for (gains) losses on available-for-sale securities
|
(
|
)
|
(
|
)
|
|
|
|||||
|
Net change in unrealized (losses) gains on hedging transactions
|
(
|
)
|
(
|
)
|
|
|
|||||
|
Reclassification adjustment for losses (gains) on hedging transactions
|
|
|
|
|
(
|
)
|
|||||
|
Cumulative translation adjustment, net
|
(
|
)
|
(
|
)
|
|
|
|||||
|
Other comprehensive income (loss)
|
|
|
|
|
(
|
)
|
|||||
|
Total comprehensive income
|
$
|
|
|
$
|
|
|
$
|
|
|
||
See notes to consolidated financial statements.
47
XILINX, INC.
CONSOLIDATED BALANCE SHEETS
|
(In thousands, except par value amounts)
|
March 28, 2020
|
March 30, 2019
|
|||||
|
ASSETS
|
|
|
|||||
|
Current assets:
|
|
|
|||||
|
Cash and cash equivalents
|
$
|
|
|
$
|
|
|
|
|
Short-term investments
|
|
|
|
|
|||
|
Accounts receivable, net of allowances for doubtful accounts of $3,239 and $3,170 in 2020 and 2019, respectively
|
|
|
|
|
|||
|
Inventories
|
|
|
|
|
|||
|
Prepaid expenses and other current assets
|
|
|
|
|
|||
|
Total current assets
|
|
|
|
|
|||
|
Property, plant and equipment, at cost:
|
|
|
|
|
|||
|
Land
|
|
|
|
|
|||
|
Buildings
|
|
|
|
|
|||
|
Machinery and equipment
|
|
|
|
|
|||
|
Furniture and fixtures
|
|
|
|
|
|||
|
|
|
|
|
|
|||
|
Accumulated depreciation and amortization
|
(
|
)
|
(
|
)
|
|||
|
Net property, plant and equipment
|
|
|
|
|
|||
|
Long-term investments
|
|
|
|
|
|||
|
Goodwill
|
|
|
|
|
|||
|
Acquisition-related intangibles, net
|
|
|
|
|
|||
|
Other assets
|
|
|
|
|
|||
|
Total Assets
|
$
|
|
|
$
|
|
|
|
|
LIABILITIES AND STOCKHOLDERS’ EQUITY
|
|
|
|||||
|
Current liabilities:
|
|
|
|||||
|
Accounts payable
|
$
|
|
|
$
|
|
|
|
|
Accrued payroll and related liabilities
|
|
|
|
|
|||
|
Income taxes payable
|
|
|
|
|
|||
|
Other accrued liabilities
|
|
|
|
|
|||
|
Current portion of long-term debt
|
|
|
|
|
|||
|
Total current liabilities
|
|
|
|
|
|||
|
Long-term debt
|
|
|
|
|
|||
|
Long-term income taxes payable
|
|
|
|
|
|||
|
Other long-term liabilities
|
|
|
|
|
|||
|
Commitments and contingencies (Note 8 and Note 16)
|
|
|
|||||
|
Stockholders' equity:
|
|
|
|||||
|
Preferred stock, $.01 par value; 2,000 shares authorized; none issued and outstanding
|
|
|
|
|
|||
|
Common stock, $.01 par value; 2,000,000 shares authorized; 243,810 and 253,891 shares issued and outstanding in 2020 and 2019, respectively
|
|
|
|
|
|||
|
Additional paid-in capital
|
|
|
|
|
|||
|
Retained earnings
|
|
|
|
|
|||
|
Accumulated other comprehensive loss
|
(
|
)
|
(
|
)
|
|||
|
Total stockholders’ equity
|
|
|
|
|
|||
|
Total Liabilities and Stockholders’ Equity
|
$
|
|
|
$
|
|
|
|
See notes to consolidated financial statements.
48
XILINX, INC.
|
Years Ended
|
|||||||||||
|
(In thousands)
|
March 28, 2020
|
March 30, 2019
|
March 31, 2018
|
||||||||
|
Cash flows from operating activities:
|
|
|
|||||||||
|
Net income
|
$
|
|
|
$
|
|
|
$
|
|
|
||
|
Adjustments to reconcile net income to net cash provided by operating activities:
|
|
|
|
||||||||
|
Depreciation and amortization of software
|
|
|
|
|
|
|
|||||
|
Amortization - others
|
|
|
|
|
|
|
|||||
|
Stock-based compensation
|
|
|
|
|
|
|
|||||
|
Amortization of debt discount
|
|
|
|
|
|
|
|||||
|
Provision for deferred income taxes
|
|
|
(
|
)
|
(
|
)
|
|||||
|
Others
|
(
|
)
|
|
|
|
|
|||||
|
Changes in assets and liabilities:
|
|
|
|
||||||||
|
Accounts receivable, net
|
|
|
|
|
(
|
)
|
|||||
|
Inventories
|
|
|
(
|
)
|
(
|
)
|
|||||
|
Prepaid expenses and other current assets
|
|
|
(
|
)
|
(
|
)
|
|||||
|
Other assets
|
(
|
)
|
(
|
)
|
(
|
)
|
|||||
|
Accounts payable
|
(
|
)
|
|
|
(
|
)
|
|||||
|
Accrued liabilities (including restructuring charges)
|
(
|
)
|
|
|
|
|
|||||
|
Income taxes payable
|
|
|
(
|
)
|
|
|
|||||
|
Net cash provided by operating activities
|
|
|
|
|
|
|
|||||
|
Cash flows from investing activities:
|
|
|
|
||||||||
|
Purchases of available-for-sale securities
|
(
|
)
|
(
|
)
|
(
|
)
|
|||||
|
Proceeds from sale of available-for-sale and equity securities
|
|
|
|
|
|
|
|||||
|
Proceeds from maturity of available-for-sale securities
|
|
|
|
|
|
|
|||||
|
Purchases of property, plant, equipment and software
|
(
|
)
|
(
|
)
|
(
|
)
|
|||||
|
Acquisition of businesses, net of cash acquired
|
(
|
)
|
(
|
)
|
(
|
)
|
|||||
|
Other investing activities, net
|
(
|
)
|
(
|
)
|
(
|
)
|
|||||
|
Net cash provided by (used in) investing activities
|
|
|
(
|
)
|
|
|
|||||
|
Cash flows from financing activities:
|
|
|
|
||||||||
|
Repurchases of common stock
|
(
|
)
|
(
|
)
|
(
|
)
|
|||||
|
Taxes paid related to net share settlement of restricted stock units
|
(
|
)
|
(
|
)
|
(
|
)
|
|||||
|
Proceeds from issuance of common stock through various stock plans
|
|
|
|
|
|
|
|||||
|
Payment of dividends to stockholders
|
(
|
)
|
(
|
)
|
(
|
)
|
|||||
|
Repayment of debt
|
|
|
(
|
)
|
(
|
)
|
|||||
|
Proceeds from issuance of long-term debts
|
|
|
|
|
|
|
|||||
|
Other financing activities
|
(
|
)
|
(
|
)
|
(
|
)
|
|||||
|
Net cash used in financing activities
|
(
|
)
|
(
|
)
|
(
|
)
|
|||||
|
Net increase (decrease) in cash and cash equivalents
|
|
|
(
|
)
|
|
|
|||||
|
Cash and cash equivalents at beginning of period
|
|
|
|
|
|
|
|||||
|
Cash and cash equivalents at end of period
|
$
|
|
|
$
|
|
|
$
|
|
|
||
|
Supplemental disclosure of cash flow information:
|
|
|
|
||||||||
|
Interest paid
|
$
|
|
|
$
|
|
|
$
|
|
|
||
|
Income taxes paid, net
|
$
|
|
|
$
|
|
|
$
|
|
|
||
|
Unsettled investment receivables
|
$
|
|
|
$
|
|
|
$
|
|
|
||
|
Unsettled investment payables
|
$
|
|
|
$
|
|
|
$
|
|
|
||
|
Capital expenditures included in accounts payable and accrued liabilities
|
$
|
|
|
$
|
|
|
$
|
|
|
||
See notes to consolidated financial statements.
49
XILINX, INC.
CONSOLIDATED STATEMENTS OF STOCKHOLDERS' EQUITY
|
Common Stock
Outstanding
|
Additional
Paid-in
Capital
|
Retained
Earnings
|
Accumulated
Other Comprehensive
Income (Loss)
|
Total
Stockholders' Equity |
||||||||||||||||||
|
(In thousands, except per share amounts)
|
Shares
|
Amount
|
||||||||||||||||||||
|
Balance as of April 1, 2017
|
|
|
$
|
|
|
$
|
|
|
$
|
|
|
$
|
(
|
)
|
$
|
|
|
|||||
|
Components of comprehensive income:
|
|
|
|
|
|
|
||||||||||||||||
|
Net income
|
—
|
|
—
|
|
—
|
|
|
|
—
|
|
|
|
||||||||||
|
Other comprehensive loss
|
—
|
|
—
|
|
—
|
|
—
|
|
(
|
)
|
(
|
)
|
||||||||||
|
Reclassification of stranded tax effects
|
—
|
|
—
|
|
—
|
|
|
|
(
|
)
|
—
|
|
||||||||||
|
Issuance of common shares under employee stock plans, net
|
|
|
|
|
(
|
)
|
—
|
|
—
|
|
(
|
)
|
||||||||||
|
Repurchase and retirement of common stock
|
(
|
)
|
(
|
)
|
(
|
)
|
(
|
)
|
—
|
|
(
|
)
|
||||||||||
|
Stock-based compensation expense
|
—
|
|
—
|
|
|
|
—
|
|
—
|
|
|
|
||||||||||
|
Stock-based compensation capitalized in inventory
|
—
|
|
—
|
|
(
|
)
|
—
|
|
—
|
|
(
|
)
|
||||||||||
|
Temporary equity reclassification
|
—
|
|
—
|
|
|
|
—
|
|
—
|
|
|
|
||||||||||
|
Exercise of warrants
|
|
|
|
|
(
|
)
|
—
|
|
—
|
|
|
|
||||||||||
|
Cash dividends declared ($1.40 per common share)
|
—
|
|
—
|
|
—
|
|
(
|
)
|
—
|
|
(
|
)
|
||||||||||
|
Balance as of March 31, 2018
|
|
|
|
|
|
|
|
|
(
|
)
|
|
|
||||||||||
|
Components of comprehensive income:
|
|
|
|
|
|
|
||||||||||||||||
|
Net income
|
—
|
|
—
|
|
—
|
|
|
|
—
|
|
|
|
||||||||||
|
Other comprehensive income
|
—
|
|
—
|
|
—
|
|
—
|
|
|
|
|
|
||||||||||
|
Cumulative-effect of equity investments adoption
|
—
|
|
—
|
|
—
|
|
(
|
)
|
|
|
—
|
|
||||||||||
|
Issuance of common shares under employee stock plans, net
|
|
|
|
|
|
|
—
|
|
—
|
|
|
|
||||||||||
|
Repurchase and retirement of common stock
|
(
|
)
|
(
|
)
|
(
|
)
|
(
|
)
|
—
|
|
(
|
)
|
||||||||||
|
Stock-based compensation expense
|
—
|
|
—
|
|
|
|
—
|
|
—
|
|
|
|
||||||||||
|
Cumulative-effect of deferred tax from intra-entity asset transfer adoption
|
—
|
|
—
|
|
—
|
|
(
|
)
|
—
|
|
(
|
)
|
||||||||||
|
Cash dividends declared ($1.44 per common share)
|
—
|
|
—
|
|
—
|
|
(
|
)
|
—
|
|
(
|
)
|
||||||||||
|
Balance as of March 30, 2019
|
|
|
|
|
|
|
|
|
(
|
)
|
|
|
||||||||||
|
Components of comprehensive income:
|
|
|
|
|
|
|
||||||||||||||||
|
Net income
|
—
|
|
—
|
|
—
|
|
|
|
—
|
|
|
|
||||||||||
|
Other comprehensive income
|
—
|
|
—
|
|
—
|
|
—
|
|
|
|
|
|
||||||||||
|
Issuance of common shares under employee stock plans, net
|
|
|
|
|
(
|
)
|
—
|
|
—
|
|
(
|
)
|
||||||||||
|
Repurchase and retirement of common stock
|
(
|
)
|
(
|
)
|
(
|
)
|
(
|
)
|
—
|
|
(
|
)
|
||||||||||
|
Stock-based compensation expense
|
—
|
|
—
|
|
|
|
—
|
|
—
|
|
|
|
||||||||||
|
Stock-based compensation capitalized in inventory
|
—
|
|
—
|
|
|
|
—
|
|
—
|
|
|
|
||||||||||
|
Additional tax benefit recognized relating to fiscal 2014 redemption of convertible debt
|
—
|
|
|
—
|
|
|
|
|
|
—
|
|
—
|
|
|
|
|
||||||
|
Cash dividends declared ($1.48 per common share)
|
—
|
|
—
|
|
—
|
|
(
|
)
|
—
|
|
(
|
)
|
||||||||||
|
Balance as of March 28, 2020
|
|
|
$
|
|
|
$
|
|
|
$
|
|
|
$
|
(
|
)
|
$
|
|
|
|||||
See notes to consolidated financial statements.
50
XILINX, INC.
NOTES TO CONSOLIDATED FINANCIAL STATEMENTS
Xilinx, Inc. (Xilinx or the Company) designs, develops and markets programmable devices and associated technologies, including advanced ICs in the form of PLDs, boards, software design tools and predefined system functions delivered as IP. In addition to its programmable platforms, the Company provides design services, customer training, field engineering and technical support. The wafers used to manufacture its products are obtained primarily from independent wafer manufacturers located in Taiwan and Korea. The Company is dependent on these foundries to produce and deliver silicon wafers on a timely basis. The Company is also dependent on subcontractors, primarily located in the Asia Pacific region, to provide semiconductor assembly, test and shipment services. Xilinx is a global company with sales offices throughout the world. The Company derives over
one-half
of its revenues from international sales, primarily in the Asia Pacific region, Europe and Japan.
|
Note 2.
|
Summary of Significant Accounting Policies and Concentrations of Risk
|
Basis of Presentation
The accompanying consolidated financial statements include the accounts of Xilinx and its wholly-owned subsidiaries after elimination of all intercompany transactions. The Company uses a
52
- to
53
-week fiscal year ending on the Saturday nearest March 31. Fiscal
2020
,
2019
and
2018
were 52-week years ended on
March 28, 2020
,
March 30, 2019
and
March 31, 2018
, respectively. Fiscal
2021
will be a 53-week year ending on April 3, 2021.
Use of Estimates
The preparation of financial statements in conformity with accounting principles generally accepted in the U.S. requires management to make estimates and assumptions that affect the reported amounts of assets and liabilities and disclosure of contingent liabilities at the date of the financial statements and the reported amounts of net revenues and expenses during the reporting period. Such estimates relate to, among others, the useful lives of assets, assessment of recoverability of property, plant and equipment, long-lived assets and goodwill, inventory write-downs, allowances for doubtful accounts, valuation of intangible assets, customer returns, deferred tax assets, stock-based compensation, potential reserves relating to litigation and tax matters, valuation of certain investments and derivative financial instruments as well as other accruals or reserves. Actual results may differ from those estimates and such differences may be material to the financial statements.
Due to the COVID-19 pandemic, there has been uncertainty and disruption in the global economy and financial markets. The Company is not currently aware of any specific event or circumstance that would require an update to its estimates or judgments or a revision of the carrying value of its assets or liabilities as of March 28, 2020. These estimates may change, as new events occur and additional information is obtained. Actual results could differ materially from these estimates under different assumptions or conditions.
Cash Equivalents and Investments
Cash equivalents consist of highly liquid investments with original maturities from the date of purchase of three months or less. These investments consist of money market funds, non-financial institution securities, U.S. and foreign government and agency securities and financial institution securities. Short-term investments consist of mortgage-backed securities, non-financial institution securities, U.S. and foreign government and agency securities, financial institution securities, asset-backed securities, commercial mortgage-backed securities and debt mutual funds with original maturities greater than three months and remaining maturities less than one year from the balance sheet date. Long-term investments consist of debt mutual funds. Long-term investments are investments with remaining maturities greater than one year, unless the investments are specifically identified to fund current operations, in which case they are classified as short-term investments. Equity investments are also classified as long-term investments if they are not intended to fund current operations.
51
The Company maintains its cash balances with various banks with high quality ratings, and with investment banking and asset management institutions. The Company manages its liquidity risk by investing in a variety of money market funds, high-grade commercial paper, corporate bonds, U.S. and foreign government and agency securities, asset-backed securities, mortgage-backed securities, commercial mortgage-backed securities, bank time deposits and debt mutual funds. This diversification of investments is consistent with its policy to maintain liquidity and ensure the ability to collect principal. The Company maintains an offshore investment portfolio denominated in U.S. dollars. All investments are made pursuant to corporate investment policy guidelines. Investments include Euro commercial paper, Euro dollar bonds, Euro dollar floating rate notes, offshore time deposits, U.S. and foreign government and agency securities, asset-backed securities, commercial mortgage-backed securities, debt mutual funds and mortgage-backed securities issued by U.S. government-sponsored enterprises and agencies.
Management classifies investments as available-for-sale or held-to-maturity at the time of purchase and re-evaluates such designation at each balance sheet date, although classification is not generally changed. Securities are classified as held-to-maturity when the Company has the positive intent and the ability to hold the securities until maturity. Held-to-maturity securities are carried at cost adjusted for amortization of premiums and accretion of discounts to maturity. Such amortization, as well as any interest on the securities, is included in interest income.
No
investments were classified as held-to-maturity as of
March 28, 2020
or
March 30, 2019
. Available-for-sale securities are carried at fair value with the unrealized gains or losses, net of tax, included as a component of accumulated other comprehensive income (loss) in stockholders' equity. See "Note 3. Fair Value Measurements" for information relating to the determination of fair value. Realized gains and losses on available-for-sale securities and declines in value judged to be other than temporary are included in interest and other expense, net. In determining if and when a decline in value below the adjusted cost of available for sale securities is other than temporary, we evaluate on an ongoing basis the market conditions, trends of earnings, financial condition, credit ratings, any underlying collateral and other key measures for our investments. The cost of securities matured or sold is based on the specific identification method.
The Company's investments in non-marketable equity securities of private companies are accounted for under the measurement alternative method upon the adoption of ASU 2016-01. The carrying value is measured at cost, less any impairment, plus or minus changes resulting from observable price changes in orderly transactions for the identical or a similar investment of the same issuer. Determining whether an observed transaction is similar to a security within the Company's portfolio requires judgment based on the rights and obligations of the securities. The Company's periodic assessment of impairment is made by considering available evidence, including the general market conditions in the investee’s industry, the investee’s product development status and subsequent rounds of financing and the related valuation and/or company's participation in such financings. The Company also assesses the investee’s ability to meet business milestones and the financial condition and near-term prospects of the individual investee, including the rate at which the investee is using its cash, the investee’s need for possible additional funding at a lower valuation and any bona fide offer to purchase the investee from a prospective acquirer.
Accounts Receivable
The allowance for doubtful accounts reflects the Company's best estimate of probable losses inherent in the accounts receivable balance. The Company determines the allowance based on the aging of Xilinx's accounts receivable, historical experience, known troubled accounts, management judgment and other currently available evidence. Xilinx writes off accounts receivable against the allowance when Xilinx determines a balance is uncollectible and no longer actively pursues collection of the receivable. The amounts of accounts receivable written off were insignificant for all periods presented.
Inventories
Inventories are stated at the lower of actual cost (determined using the first-in, first-out method), or market (estimated net realizable value) and are comprised of the following:
|
(In thousands)
|
March 28, 2020
|
March 30, 2019
|
|||||
|
Raw materials
|
$
|
|
|
$
|
|
|
|
|
Work-in-process
|
|
|
|
|
|||
|
Finished goods
|
|
|
|
|
|||
|
$
|
|
|
$
|
|
|
||
52
The Company reviews and sets standard costs quarterly to approximate current actual manufacturing costs. The Company's manufacturing overhead standards for product costs are calculated assuming full absorption of actual spending over actual volumes. Given the cyclicality of the market, the obsolescence of technology and product lifecycles, the Company writes down inventory based on forecasted demand and technological obsolescence. These forecasts are developed based on inputs from the Company's customers, including bookings and extended but uncommitted demand forecasts, and internal analyses such as customer historical purchasing trends and actual and anticipated design wins, as well as market and economic conditions, technology changes, new product introductions and changes in strategic direction. These factors require estimates that may include uncertain elements. The estimates of future demand that the Company uses in the valuation of inventory are the basis for its published revenue forecasts, which are also consistent with our short-term manufacturing plans. The differences between the Company's demand forecast and the actual demand in the recent past have not resulted in any material write down in the Company's inventory. If the Company's demand forecast for specific products is greater than actual demand and the Company fails to reduce manufacturing output accordingly, the Company could be required to write down additional inventory, which would have a negative impact on the Company's gross margin.
Property, Plant and Equipment
Property, plant and equipment are recorded at cost, net of accumulated depreciation. Depreciation for financial reporting purposes is computed using the straight-line method over the estimated useful lives of the assets of three to
five years
for machinery, equipment, furniture and fixtures and
15
to
30
years for buildings. Depreciation expense totaled
$
60.7
million
,
$
53.3
million
and
$
46.4
million
for fiscal
2020
,
2019
and
2018
, respectively.
Impairment of Long-Lived Assets
Goodwill
Goodwill is not amortized but is subject to impairment tests on an annual basis, or more frequently if indicators of potential impairment exist, using a fair-value-based approach. Based on the impairment review performed during the fourth quarter of fiscal
2020
, there was
no
impairment of goodwill in fiscal
2020
. Unless there are indicators of impairment, the Company's next impairment review for goodwill will be performed and completed in the
fourth
quarter of fiscal
2021
. To date, no impairment indicators have been identified.
Revenue Recognition
Revenue from sales to the Company's distributors is recognized upon the transfer of control, which typically occurs at shipment, and is reduced by estimated allowances for distributor price adjustments and rights of return. The distributor price adjustments are estimated using the expected value method based on an analysis of actual and forecasted ship and debit claims, at the distributor and part level to account for current pricing and business trends. For fiscal
2020
, approximately
53
%
of the Company's net revenues were from products sold to distributors for subsequent resale to OEMs or their subcontract manufacturers.
Revenue from sales to the Company's non-distributors is recognized net of sales incentives (if any) upon transfer of control to the customer, which typically occurs at shipment. Sales returns and allowances on product sales are recorded as a reduction of revenue.
Revenue from software license agreements and renewals is recognized at point of sales. Revenue from support services is recognized when the service is performed. Revenue from software licenses and support services sales was approximately
1
%
or less of net revenues for all of the periods presented.
53
Foreign Currency Translation
The U.S. dollar is the functional currency for the Company's Ireland and Singapore subsidiaries. Monetary assets and liabilities that are not denominated in the functional currency are remeasured into U.S. dollars, and the resulting gains or losses are included in the consolidated statements of income under interest and other expense, net. The remeasurement gains or losses were immaterial for all fiscal periods presented.
The local currency is the functional currency for each of the Company's other wholly-owned foreign subsidiaries. Assets and liabilities are translated from foreign currencies into U.S. dollars at month-end exchange rates and statements of income are translated at the average monthly exchange rates. Exchange gains or losses arising from translation of foreign currency denominated assets and liabilities (i.e., cumulative translation adjustment) are included as a component of accumulated other comprehensive income (loss) in stockholders' equity.
Derivative Financial Instruments
To reduce financial risk, the Company periodically enters into financial arrangements as part of the Company's ongoing asset and liability management activities. Xilinx uses derivative financial instruments to hedge fair values of underlying assets and liabilities or future cash flows which are exposed to interest rate, foreign currency or commodity price fluctuations. The Company does not enter into derivative financial instruments for trading or speculative purposes. See "Note 5. Derivative Financial Instruments" for detailed information about the Company's derivative financial instruments.
Research and Development Expenses
Research and development costs are current period expenses and charged to expense as incurred.
Stock-Based Compensation
The Company has equity incentive plans that are more fully discussed in "Note 6. Stock-Based Compensation Plans." The authoritative guidance of accounting for share-based payment requires the Company to measure the cost of all employee equity awards (that are expected to be exercised or vested) based on the grant-date fair value of those awards, and to record that cost as compensation expense over the period during which the employee is required to perform service in exchange for the award (over the vesting period of the award). Additionally, the Company's ESPP is deemed to be a compensatory plan under the authoritative guidance of accounting for share-based payments. Accordingly, the ESPP is included in the computation of stock-based compensation expense.
The Company uses the straight-line attribution method to recognize stock-based compensation costs over the requisite service period of the award. Upon exercise, cancellation or expiration of stock options, deferred tax assets for options with multiple vesting dates are eliminated for each vesting period on a first-in, first-out basis as if each award had a separate vesting period.
Income Taxes
All income tax amounts reflect the use of the liability method
under the accounting for income taxes, as interpreted by Financial Accounting Standards Board (FASB) authoritative guidance for measuring uncertain tax positions
.
Under this method, deferred tax assets and liabilities are determined based on the expected future tax consequences of temporary differences between the carrying amounts of assets and liabilities for financial and income tax reporting purposes.
The TCJA introduced GILTI, which subjects a U.S. shareholder to current tax on income earned by certain foreign subsidiaries. The FASB allows companies to either (1) recognize deferred taxes for temporary differences that are expected to reverse as GILTI in future years (deferred method) or (2) account for taxes on GILTI as period costs in the year the tax is incurred (period method). The Company elected the deferred method.
54
Business Combinations
We use the acquisition method of accounting and allocate the fair value of purchase consideration to the assets acquired and liabilities assumed from the acquiree based on their respective fair values as of the acquisition date. The excess of the fair value of purchase consideration over the fair value of these assets acquired and liabilities assumed is recorded as goodwill. When determining the fair values of assets acquired and liabilities assumed, management makes significant estimates and assumptions, especially with respect to intangible assets. Critical estimates in valuing intangible assets include, but are not limited to, expected future cash flows, which includes consideration of future growth and margins, future changes in technology, expected cost and time to develop in-process research and development, brand awareness and discount rates. Fair value estimates are based on the assumptions that management believes a market participant would use in pricing the asset or liability.
Product Warranty and Indemnification
The Company generally sells products with a limited warranty for product quality. The Company provides an accrual for known product issues if a loss is probable and can be reasonably estimated. As of the end of both fiscal
2020
and
2019
, the accrual balance of the product warranty liability was immaterial.
The Company offers, subject to certain terms and conditions, to indemnify customers and distributors for costs and damages awarded against these parties in the event the Company's hardware products are found to infringe third-party intellectual property rights, including patents, copyrights or trademarks, and to compensate certain customers for limited specified costs they actually incur in the event our hardware products experience epidemic failure. To a lesser extent, the Company may from time-to-time offer limited indemnification with respect to its software products. The terms and conditions of these indemnity obligations are limited by contract, which obligations are typically perpetual from the effective date of the agreement. The Company has historically received only a limited number of requests for indemnification under these provisions and has not made any significant payments pursuant to these provisions. The Company cannot estimate the maximum amount of potential future payments, if any, that the Company may be required to make as a result of these obligations due to the limited history of indemnification claims and the unique facts and circumstances that are likely to be involved in each particular claim and indemnification provision. However, there can be no assurances that the Company will not incur any material financial liabilities in the future as a result of these obligations.
Concentrations of Credit Risk
Avnet, one of the Company's distributors, distributes the Company's products worldwide. As of
March 28, 2020
and
March 30, 2019
, Avnet accounted for
31
%
and
37
%
of the Company's total net accounts receivable, respectively. We expect our accounts receivable to fluctuate as we partner with our distributors to manage their inventory requirements. Avnet 's revenue accounted for
42
%
,
45
%
and
43
%
of the Company's worldwide net revenues in fiscal
2020
,
2019
and
2018
, respectively. The percentage of worldwide net revenues from Avnet is consistent with historical patterns.
Xilinx is subject to concentrations of credit risk primarily in its trade accounts receivable and investments in debt securities to the extent of the amounts recorded on the consolidated balance sheet. The Company attempts to mitigate the concentration of credit risk in its trade receivables through its credit evaluation process, collection terms and distributor sales to diverse end customers and through geographical dispersion of sales. Xilinx generally does not require collateral for receivables from its end customers or from distributors.
The Company mitigates concentrations of credit risk in its investments in debt securities by currently investing more than
94
%
of its portfolio in AA (or its equivalent) or higher-grade securities as rated by Standard & Poor's or Moody's Investors Service equivalent. The Company's methods to arrive at investment decisions are not solely based on the rating agencies' credit ratings. Xilinx also performs additional credit due diligence and conducts regular portfolio credit reviews, including a review of counterparty credit risk related to the Company's forward currency exchange contracts. Additionally, Xilinx limits its investments in the debt securities of a single issuer based upon the issuer's credit rating and attempts to further mitigate credit risk by diversifying risk across geographies and type of issuer.
As of
March 28, 2020
, all of the mortgage-backed securities in the investment portfolio were issued by U.S. government-sponsored enterprises and agencies and are rated AA+ by Standard & Poor's and Aaa by Moody's Investors Service.
55
The global credit markets may experience adverse conditions that negatively impact the values of various types of investment and non-investment grade securities. The global credit and capital markets may experience significant volatility and disruption due to instability in the global financial system, uncertainty related to global economic conditions and concerns regarding sovereign financial stability. Therefore, there is a risk that we may incur other-than-temporary impairment charges for certain types of investments should credit market conditions deteriorate. See "Note 4. Financial Instruments" for a table of the Company's available-for-sale securities.
Recent Accounting Pronouncements Adopted
Leases
In February 2016, the FASB issued authoritative guidance on leases. The new authoritative guidance requires the recognition of assets and liabilities arising from lease transactions on the balance sheet and additional disclosures about the amount, timing and uncertainty of cash flows from leases. Accordingly, a lessee recognizes a lease asset for its right to use the underlying asset and a lease liability for the corresponding lease obligation. The Company determines if an arrangement is a lease, or contains a lease, at the inception of the arrangement. On the commencement date, leases are evaluated for classification, and assets and liabilities are recognized based on the present value of lease payments over the lease term. The Company uses the incremental borrowing rate based on the information available at commencement in determining the present value of lease payments. Operating lease expense is generally recognized on a straight-line basis over the lease term. The Company adopted this authoritative guidance using the modified retrospective method during first quarter of fiscal 2020 and resulted in the recognition of right-of-use assets of approximately
$
50.0
million
and lease liabilities for operating leases of approximately
$
50.0
million
on March 31, 2019, the beginning of fiscal 2020. The Company elected the practical expedients to not separate lease and non-lease components within lease transactions, and not to record on the balance sheet leases with a term of 12 months or less. The Company also has elected the package of practical expedients, which allows the Company not to reassess (1) whether any expired or existing contracts as of the adoption date are or contain a lease, (2) lease classification for any expired or existing leases as of the adoption date and (3) initial direct costs for any existing leases as of the adoption date. The Company did not elect to apply the hindsight practical expedient when determining lease term and assessing impairment of right-of-use assets.
The Company recognizes its operating leases within its other assets, other accrued liabilities and other long-term liabilities on the Company's consolidated balance sheets. The Company's finance leases were immaterial.
Recent Accounting Pronouncements Not Yet Adopted
Credit Loss
In June 2016, the FASB issued authoritative guidance to replace the incurred loss impairment methodology under current GAAP with a methodology that reflects expected credit losses and requires consideration of a broader range of reasonable and supportable information to inform credit loss estimates. The Company will be required to use a forward-looking expected credit loss model for financial assets. For public entities, the guidance is effective for fiscal years beginning after December 15, 2019, and interim periods within those fiscal years, which for Xilinx would be the first quarter of fiscal 2021. The Company does not expect a material impact on its consolidated financial statements upon adoption of this authoritative guidance.
Goodwill
In January 2017, the FASB issued authoritative guidance that simplifies the accounting for goodwill impairment. The authoritative guidance removes Step 2 of the goodwill impairment test, which requires a hypothetical purchase price allocation. Goodwill impairment will now be the amount by which a reporting unit’s carrying value exceeds its fair value, not to exceed the carrying amount of goodwill. All other goodwill impairment guidance will remain largely unchanged. Entities will continue to have the option to perform a qualitative assessment to determine if a quantitative impairment test is necessary. For public entities, the guidance is effective for fiscal years beginning after December 15, 2019, and interim periods within those fiscal years, which for Xilinx would be the first quarter of fiscal 2021. The Company does not expect a material impact on its consolidated financial statements upon adoption of this authoritative guidance.
56
Cloud Computing Arrangements
In August 2018, the FASB issued new guidance requiring a customer in a cloud computing arrangement (i.e., hosting arrangement) that is a service contract to follow the internal-use software guidance to determine which implementation costs to capitalize as assets or expense as incurred. Capitalized implementation costs related to a hosting arrangement that is a service contract will be amortized over the term of the hosting arrangement, beginning when the module or component of the hosting arrangement is ready for its intended use. For public entities, the guidance is effective for fiscal years beginning after December 15, 2019, and interim periods within those fiscal years, which for Xilinx would be the first quarter of fiscal 2021. The Company does not expect a material impact on its consolidated financial statements upon adoption of this authoritative guidance.
Income Taxes
In December 2019, the FASB issued authoritative guidance that simplifies the accounting for income taxes as part of the overall initiative to reduce complexity in accounting standards. Amendments include removal of certain exceptions to the general principles of Accounting Standards Codification 740, Income Taxes. The amendments also include simplification in several other areas, such as recognition of deferred tax assets on step-up in tax basis in goodwill and accounting for franchise tax that is partially based on income. For public entities, the guidance is effective for fiscal years beginning after December 15, 2020, and interim periods within those fiscal years, which for Xilinx would be the first quarter of fiscal 2022. Early adoption is permitted in any interim or annual period, with any adjustments reflected as of the beginning of the fiscal year of adoption. The Company has decided not to early adopt this new authoritative guidance and is currently evaluating the impact of this authoritative guidance on its consolidated financial statements.
|
Note 3.
|
Fair Value Measurements
|
The guidance for fair value measurements established by the FASB defines fair value as the exchange price that would be received from selling an asset or paid to transfer a liability (an exit price) in an orderly transaction between market participants at the measurement date. When determining the fair value measurements for assets and liabilities required or permitted to be recorded at fair value, the Company considers the principal or most advantageous market in which Xilinx would transact and also considers assumptions that market participants would use when pricing the asset or liability, such as inherent risk, transfer restrictions and risk of nonperformance.
The Company determines the fair value for marketable debt and equity securities using industry standard pricing services, data providers and other third-party sources and by internally performing valuation testing and analysis. The Company primarily uses a consensus price or weighted-average price for its fair value assessment. The Company determines the consensus price using market prices from a variety of industry standard pricing services, data providers, security master files from large financial institutions and other third party sources and uses those multiple prices as inputs into a distribution-curve-based algorithm to determine the daily market value. The pricing services use multiple inputs to determine market prices, including reportable trades, benchmark yield curves, credit spreads and broker/dealer quotes as well as other industry and economic events. For certain securities with short maturities, such as discount commercial paper and certificates of deposit, the security is accreted from purchase price to face value at maturity. If a subsequent transaction on the same security is observed in the marketplace, the price on the subsequent transaction is used as the current daily market price and the security will be accreted to face value based on the revised price.
The Company validates the consensus prices by taking random samples from each asset type and corroborating those prices using reported trade activity, benchmark yield curves, binding broker/dealer quotes or other relevant price information. There have not been any changes to the Company's fair value methodology during fiscal
2020
and the Company did not adjust or override any fair value measurements as of
March 28, 2020
.
Fair Value Hierarchy
The fair value framework requires the categorization of assets and liabilities into three levels based upon the assumptions (inputs) used to price the assets or liabilities. The guidance for fair value measurements requires that assets and liabilities carried at fair value be classified and disclosed in one of the following categories:
Level 1 — Quoted (unadjusted) prices in active markets for identical assets or liabilities.
Level 2 — Observable inputs other than quoted prices included in Level 1, such as quoted prices for similar assets or liabilities in active markets; quoted prices for identical or similar assets or liabilities in markets that are not active; or other inputs that are observable or can be corroborated by observable market data for substantially the full term of the asset or liability.
57
Level 3 — Unobservable inputs to the valuation methodology that are supported by little or no market activity and that are significant to the measurement of the fair value of the assets or liabilities. Level 3 assets and liabilities include those whose fair value measurements are determined using pricing models, discounted cash flow methodologies or similar valuation techniques, as well as significant management judgment or estimation.
Assets and Liabilities Measured at Fair Value on a Recurring Basis
In instances where the inputs used to measure fair value fall into different levels of the fair value hierarchy, the fair value measurement has been determined based on the lowest level input that is significant to the fair value measurement in its entirety. The Company's assessment of the significance of a particular item to the fair value measurement in its entirety requires judgment, including the consideration of inputs specific to the asset or liability.
The following tables present information about the Company's assets and liabilities measured at fair value on a recurring basis as of
March 28, 2020
and
March 30, 2019
:
|
March 28, 2020
|
||||||||||||||||
|
(In thousands)
|
Level 1 |
Level 2 |
Level 3 |
Total Fair
Value |
||||||||||||
|
Assets
|
||||||||||||||||
|
Cash equivalents:
|
||||||||||||||||
|
Money market funds
|
$
|
|
|
$
|
|
|
$
|
|
|
$
|
|
|
||||
|
Financial institution securities
|
|
|
|
|
|
|
|
|
||||||||
|
Non-financial institution securities
|
|
|
|
|
|
|
|
|
||||||||
|
U.S. government and agency securities
|
|
|
|
|
|
|
|
|
||||||||
|
Foreign government and agency securities
|
|
|
|
|
|
|
|
|
||||||||
|
Short-term investments:
|
||||||||||||||||
|
Financial institution securities
|
|
|
|
|
|
|
|
|
||||||||
|
Non-financial institution securities
|
|
|
|
|
|
|
|
|
||||||||
|
U.S. government and agency securities
|
|
|
|
|
|
|
|
|
||||||||
|
Foreign government and agency securities
|
|
|
|
|
|
|
|
|
||||||||
|
Mortgage-backed securities
|
|
|
|
|
|
|
|
|
||||||||
|
Asset-backed securities
|
|
|
|
|
|
|
|
|
||||||||
|
Commercial mortgage-backed securities
|
|
|
|
|
|
|
|
|
||||||||
|
Total assets measured at fair value
|
$
|
|
|
$
|
|
|
$
|
|
|
$
|
|
|
||||
|
Liabilities
|
||||||||||||||||
|
Derivative financial instruments, net
|
$
|
|
|
$
|
|
|
$
|
|
|
$
|
|
|
||||
|
Total liabilities measured at fair value
|
$
|
|
|
$
|
|
|
$
|
|
|
$
|
|
|
||||
|
Net assets measured at fair value
|
$
|
|
|
$
|
|
|
$
|
|
|
$
|
|
|
||||
58
|
March 30, 2019
|
||||||||||||||||
|
(In thousands)
|
Level 1 |
Level 2 |
Level 3 |
Total Fair
Value |
||||||||||||
|
Assets
|
||||||||||||||||
|
Cash equivalents:
|
||||||||||||||||
|
Money market funds
|
|
$
|
|
|
|
$
|
|
|
|
$
|
|
|
|
$
|
|
|
|
Financial institution securities
|
|
|
|
|
|
|
|
|
|
|
|
|
||||
|
Non-financial institution securities
|
|
|
|
|
|
|
|
|
|
|
|
|
||||
|
U.S. government and agency securities
|
|
|
|
|
|
|
|
|
|
|
|
|
||||
|
Foreign government and agency securities
|
|
|
|
|
|
|
|
|
|
|
|
|
||||
|
Short-term investments:
|
|
|
|
|
||||||||||||
|
Financial institution securities
|
|
|
|
|
|
|
|
|
|
|
|
|
||||
|
Non-financial institution securities
|
|
|
|
|
|
|
|
|
|
|
|
|
||||
|
U.S. government and agency securities
|
|
|
|
|
|
|
|
|
|
|
|
|
||||
|
Foreign government and agency securities
|
|
|
|
|
|
|
|
|
||||||||
|
Mortgage-backed securities
|
|
|
|
|
|
|
|
|
|
|
|
|
||||
|
Debt mutual fund
|
|
|
|
|
|
|
|
|
||||||||
|
Asset-backed securities
|
|
|
|
|
|
|
|
|
|
|
|
|
||||
|
Commercial mortgage-backed securities
|
|
|
|
|
|
|
|
|
|
|
|
|
||||
|
Long-term investments:
|
|
|
|
|
||||||||||||
|
Debt mutual fund
|
|
|
|
|
|
|
|
|
|
|
|
|
||||
|
Total assets measured at fair value
|
|
$
|
|
|
|
$
|
|
|
|
$
|
|
|
|
$
|
|
|
|
Liabilities
|
||||||||||||||||
|
Derivative financial instruments, net
|
$
|
|
|
$
|
|
|
$
|
|
|
$
|
|
|
||||
|
Total liabilities measured at fair value
|
$
|
|
|
$
|
|
|
$
|
|
|
$
|
|
|
||||
|
Net assets measured at fair value
|
$
|
|
|
$
|
|
|
$
|
|
|
$
|
|
|
||||
For certain of the Company’s financial instruments, including cash held in banks, accounts receivable and accounts payable, the carrying amounts approximate fair value due to their short maturities, and are therefore excluded from the fair value tables above.
Financial Instruments Not Recorded at Fair Value on a Recurring Basis
The Company's
$
500.0
million
principal amount of
3.000
%
notes due
March 15, 2021
(2021 Notes) and
$
750.0
million
principal amount of
2.950
%
senior notes due
June 1, 2024
(2024 Notes) are measured at fair value on a quarterly basis for disclosure purposes. The fair values of the 2021 Notes and 2024 Notes as of
March 28, 2020
were approximately,
$
496.7
million
and
$
753.1
million
, respectively, based on the last trading price of the respective debentures for the period (classified as Level 2 in fair value hierarchy due to relatively low trading volume).
Assets and Liabilities Measured at Fair Value on a Non-Recurring Basis
As of
March 28, 2020
, the Company had non-marketable equity securities in private companies of
$
101.0
million
, which were classified as Level 3 assets. The Company’s investments in non-marketable securities of private companies are also recorded at fair value if the Company recognizes an observable price adjustment or an impairment. Such impairment losses or observable price adjustments were not material during all periods presented. The Company’s investments in non-financial assets such as property, plant and equipment, goodwill and acquisition-related intangibles, are recorded at cost (net of accumulated depreciation or amortization, where applicable). These non-financial assets are only measured at fair value when indicators of impairment exist.
59
|
Note 4.
|
Financial Instruments
|
The following is a summary of cash equivalents and available-for-sale securities as of the end of the periods presented:
|
|
March 28, 2020
|
March 30, 2019
|
||||||||||||||||||||||||||||||
|
(In thousands)
|
Amortized Cost
|
Gross Unrealized Gains
|
Gross Unrealized Losses
|
Estimated Fair Value
|
Amortized Cost
|
Gross Unrealized Gains
|
Gross Unrealized Losses
|
Estimated Fair Value
|
||||||||||||||||||||||||
|
Money market funds
|
$
|
|
|
$
|
|
|
$
|
|
|
$
|
|
|
$
|
|
|
$
|
|
|
$
|
|
|
$
|
|
|
||||||||
|
Financial institution
|
|
|
|
|
|
|
|
|
|
|
|
|
|
|
|
|
||||||||||||||||
|
securities
|
|
|
|
|
|
|
|
|
|
|
|
|
|
|
|
|
||||||||||||||||
|
Non-financial institution
|
|
|
|
|
|
|
|
|
|
|
|
|
|
|
|
|
||||||||||||||||
|
securities
|
|
|
|
|
|
|
|
|
|
|
|
|
(
|
)
|
|
|
||||||||||||||||
|
U.S. government and
|
||||||||||||||||||||||||||||||||
|
agency securities
|
|
|
|
|
|
|
|
|
|
|
|
|
(
|
)
|
|
|
||||||||||||||||
|
Foreign government and
|
|
|
|
|
|
|
|
|
|
|
||||||||||||||||||||||
|
agency securities
|
|
|
|
|
(
|
)
|
|
|
|
|
|
|
|
|
|
|
||||||||||||||||
|
Mortgage-backed securities
|
|
|
|
|
(
|
)
|
|
|
|
|
|
|
(
|
)
|
|
|
||||||||||||||||
|
Asset-backed securities
|
|
|
|
|
(
|
)
|
|
|
|
|
|
|
(
|
)
|
|
|
||||||||||||||||
|
Commercial mortgage-
|
|
|
|
|
|
|
|
|
|
|
|
|
|
|
|
|
||||||||||||||||
|
backed securities
|
|
|
|
|
(
|
)
|
|
|
|
|
|
|
(
|
)
|
|
|
||||||||||||||||
|
|
$
|
|
|
$
|
|
|
$
|
(
|
)
|
$
|
|
|
$
|
|
|
$
|
|
|
$
|
(
|
)
|
$
|
|
|
||||||||
Financial institution securities include securities issued or managed by financial institutions in various forms, such as commercial paper and time deposits. Substantially all time deposits were issued by institutions outside the U.S. as of
March 28, 2020
and
March 30, 2019
.
The following tables show the fair values and gross unrealized losses of the Company's investments, aggregated by investment category, for individual securities that have been in a continuous unrealized loss position for the length of time specified, as of
March 28, 2020
and
March 30, 2019
:
|
|
March 28, 2020
|
||||||||||||||||||||||
|
|
Less Than 12 Months
|
|
12 Months or Greater
|
|
Total
|
||||||||||||||||||
|
(In thousands)
|
Fair Value
|
|
Gross Unrealized Losses
|
|
Fair Value
|
|
Gross Unrealized Losses
|
|
Fair Value
|
|
Gross Unrealized Losses
|
||||||||||||
|
Mortgage-backed securities
|
$
|
|
|
|
$
|
(
|
)
|
|
$
|
|
|
|
$
|
(
|
)
|
|
$
|
|
|
|
$
|
(
|
)
|
|
Asset-backed securities
|
|
|
(
|
)
|
|
|
|
|
|
|
(
|
)
|
|||||||||||
|
Foreign government and
|
|||||||||||||||||||||||
|
agency securities
|
|
|
(
|
)
|
|
|
|
|
|
|
(
|
)
|
|||||||||||
|
Commercial mortgage-
|
|||||||||||||||||||||||
|
backed securities
|
|
|
(
|
)
|
|
|
(
|
)
|
|
|
(
|
)
|
|||||||||||
|
|
$
|
|
|
|
$
|
(
|
)
|
|
$
|
|
|
|
$
|
(
|
)
|
|
$
|
|
|
|
$
|
(
|
)
|
60
|
|
March 30, 2019
|
||||||||||||||||||||||
|
|
Less Than 12 Months
|
12 Months or Greater
|
Total
|
||||||||||||||||||||
|
(In thousands)
|
Fair Value
|
Gross Unrealized Losses
|
Fair Value
|
Gross Unrealized Losses
|
Fair Value
|
Gross Unrealized Losses
|
|||||||||||||||||
|
Non-financial institution securities
|
$
|
|
|
$
|
(
|
)
|
$
|
|
|
$
|
(
|
)
|
$
|
|
|
$
|
(
|
)
|
|||||
|
U.S. government and
|
|
|
|
|
|
|
|
|
|||||||||||||||
|
agency securities
|
|
|
|
|
|
|
(
|
)
|
|
|
(
|
)
|
|||||||||||
|
Mortgage-backed securities
|
|
|
(
|
)
|
|
|
(
|
)
|
|
|
(
|
)
|
|||||||||||
|
Asset-backed securities
|
|
|
|
|
|
|
(
|
)
|
|
|
(
|
)
|
|||||||||||
|
Commercial mortgage-
|
|||||||||||||||||||||||
|
backed securities
|
|
|
(
|
)
|
|
|
(
|
)
|
|
|
(
|
)
|
|||||||||||
|
|
$
|
|
|
$
|
(
|
)
|
$
|
|
|
$
|
(
|
)
|
$
|
|
|
$
|
(
|
)
|
|||||
The Company reviewed the investment portfolio and determined that the gross unrealized losses on these investments as of
March 28, 2020
and
March 30, 2019
were temporary in nature as evidenced by the fluctuations in the gross unrealized losses within the investment categories. The marketable debt securities (financial institution securities, non-financial institution securities, U.S. and foreign government and agency securities, asset-back securities, mortgage-backed securities and commercial mortgage-backed securities) are highly rated by the credit rating agencies, there have been no defaults on any of these securities and the Company has received interest payments as they become due. Therefore, the Company believes that it will be able to collect both principal and interest amounts due to the Company. Additionally, in the past several years a portion of the Company's investment in mortgage-backed securities was redeemed or prepaid by the debtors at par. Furthermore, the aggregate of individual unrealized losses that had been outstanding for twelve months or more was not significant as of
March 28, 2020
and
March 30, 2019
. The Company neither intends to sell these marketable debt securities nor concludes that it is more-likely-than-not that it will have to sell them until recovery of their carrying values.
The amortized cost and estimated fair value of marketable debt securities, by contractual maturity, are shown in the table below. Actual maturities may differ from contractual maturities because issuers may have the right to call or prepay obligations without call or prepayment penalties.
|
|
March 28, 2020
|
||||||
|
(In thousands)
|
Amortized
Cost |
|
Estimated
Fair Value |
||||
|
Due in one year or less
|
$
|
|
|
|
$
|
|
|
|
Due after one year through five years
|
|
|
|
|
|
||
|
Due after five years through ten years
|
|
|
|
|
|
||
|
Due after ten years
|
|
|
|
|
|
||
|
|
$
|
|
|
|
$
|
|
|
As of
March 28, 2020
,
$
209.5
million
of marketable debt securities with contractual maturities of greater than one year were classified as short-term investments. Additionally, the above table does not include investments in money market funds because these investments do not have specific contractual maturities.
Certain information related to available-for-sale securities is as follows:
|
Years Ended
|
|||||||||||
|
(In thousands)
|
March 28, 2020
|
|
March 30, 2019
|
|
March 31, 2018
|
||||||
|
Proceeds from sale of available-for-sale and equity securities
|
$
|
|
|
|
$
|
|
|
|
$
|
|
|
|
Gross realized gains on sale of available-for-sale securities
|
$
|
|
|
|
$
|
|
|
$
|
|
|
|
|
Gross realized losses on sale of available-for-sale securities
|
(
|
)
|
|
(
|
)
|
(
|
)
|
||||
|
Net realized gains (losses) on sale of available-for-sale securities
|
$
|
|
|
|
$
|
|
|
$
|
(
|
)
|
|
|
Amortization of premiums on available-for-sale securities
|
$
|
|
|
|
$
|
|
|
$
|
|
|
|
61
The cost of securities matured or sold is based on the specific identification method.
|
Note 5.
|
Derivative Financial Instruments
|
The Company's primary objective for holding derivative financial instruments is to manage foreign currency exchange rate risk and interest rate risk. As a result of the use of derivative financial instruments, the Company is exposed to the risk that counterparties to derivative contracts may fail to meet their contractual obligations. The Company manages counterparty credit risk in derivative contracts by reviewing counterparty creditworthiness on a regular basis, establishing collateral requirement and limiting exposure to any single counterparty. The right of set-off that exists with certain transactions enables the Company to net amounts due to and from the counterparty, reducing the maximum loss from credit risk in the event of counterparty default.
The Company entered into interest rate swap contracts with certain independent financial institutions to manage interest rate risks related to fixed interest rate expenses from its 2024 Notes and floating interest rate income from its investments in marketable debt securities. See “Note 10. Debt and Credit Facility” for more discussion related to interest rate swap contracts. The interest rate swap contracts were designated and qualified as fair value hedges of the 2024 Notes and were separately accounted for as a derivative. The interest rate swap contracts and the 2024 Notes were initially measured at fair value. Any subsequent changes in fair values of the interest rate swap contracts and the 2024 Notes will be recorded in the Company’s consolidated balance sheets. During the first quarter of fiscal 2020, the Company sold the interest rate swap contracts for an immaterial gain. The gain has been amortized as a reduction to interest expense over the remaining life of the 2024 Notes. As a result of the sale, the Company recorded the net change in fair value of the interest rate swap contracts of
$
11.7
million
in the Company's consolidated balance sheets. See “Note 12. Debt and Credit Facility” for more discussion related to interest rate swap contracts. There was no ineffectiveness during all periods presented.
During the fourth quarter of fiscal 2020, the Company entered into interest rate swap contracts with an independent financial institution to reduce the risk of changes in benchmark interest rate from future debt issuance. The interest rate swap contracts were designated and qualified as cash flow hedges. The interest rate swap contracts were initially measured at fair value and subsequent changes in fair values recorded in other comprehensive income (loss). As a result, the aggregate fair values of the outstanding interest rate swap contracts as of
March 28, 2020
was
$
3.3
million
and recorded in other long-term liabilities. An unrealized loss, net of tax, of
$
2.6
million
was deferred in accumulated other comprehensive income (loss) at
March 28, 2020
. The interest rate swap contracts will be reclassified into net income in the same period during which the hedged transaction affects earnings. There was no ineffectiveness during the period presented.
As of
March 28, 2020
and
March 30, 2019
, the Company had the following outstanding forward currency exchange contracts (in notional amount), which were derivative financial instruments:
|
(In thousands and U.S. dollars)
|
March 28, 2020
|
|
March 30, 2019
|
||||
|
Singapore Dollar
|
$
|
|
|
|
$
|
|
|
|
Euro
|
|
|
|
|
|
||
|
Indian Rupee
|
|
|
|
|
|
||
|
British Pound
|
|
|
|
|
|
||
|
Japanese Yen
|
|
|
|
|
|
||
|
Chinese Yuan
|
|
|
|
|
|
||
|
|
$
|
|
|
|
$
|
|
|
As part of the Company's strategy to reduce volatility of operating expenses due to foreign exchange rate fluctuations, the Company employs a hedging program with a forward outlook of up to
two years
for major foreign-currency-denominated operating expenses. The outstanding forward currency exchange contracts expire at various dates through
February 2022
. The net unrealized losses, which approximate the fair market value of the outstanding forward currency exchange contracts, are expected to be recognized in the consolidated statements of income within the next
two years
.
As of
March 28, 2020
, all of the forward foreign currency exchange contracts were designated and qualified as cash flow hedges and the effective portion of the gain or loss on the forward contracts was reported as a component of other comprehensive income (loss) and reclassified into net income in the same period during which the hedged transaction affects earnings. The estimated amount of such gains or losses as of
March 28, 2020
that is expected to be reclassified into earnings was not material. The ineffective portion of the gains or losses on the forward contracts was included in the net income for all periods presented.
62
The Company may enter into forward foreign currency exchange contracts to hedge firm commitments such as acquisitions and capital expenditures. Gains and losses on foreign currency forward contracts that are designated as hedges of anticipated transactions, for which a firm commitment has been attained and the hedged relationship has been effective, are deferred and included in income or expenses in the same period that the underlying transaction is settled. Gains and losses on any instruments not meeting the above criteria are recognized in income or expenses in the consolidated statements of income as they are incurred.
The Company had the following derivative instruments as of
March 28, 2020
and
March 30, 2019
, located on the consolidated balance sheet, utilized for risk management purposes detailed above:
|
Foreign Exchange Contracts
|
|||||||||
|
Asset Derivatives
|
|
Liability Derivatives
|
|||||||
|
(In thousands)
|
Balance Sheet Location
|
Fair Value
|
|
Balance Sheet Location
|
Fair Value
|
||||
|
March 28, 2020
|
Prepaid expenses and other current assets
|
$
|
|
|
|
Other accrued liabilities
|
$
|
|
|
|
March 30, 2019
|
Prepaid expenses and other current assets
|
|
|
|
Other accrued liabilities
|
|
|
||
The Company does not offset or net the fair value amounts of derivative financial instruments in its consolidated balance sheets. The potential effect of rights of set-off associated with the derivative financial instruments was not material to the Company's consolidated balance sheet for all periods presented.
The following table summarizes the effect of derivative instruments on the consolidated statements of income for fiscal
2020
and
2019
:
|
Foreign Exchange Contracts
|
|||||||
|
Years Ended
|
|||||||
|
(In thousands)
|
March 28, 2020
|
|
March 30, 2019
|
|
|||
|
Amount of (losses)/gains recognized in other comprehensive income on derivative (effective portion of cash flow hedging)
|
$
|
(
|
)
|
$
|
(
|
)
|
|
|
Amount of (losses)/gains reclassified from accumulated other comprehensive income into income (effective portion) *
|
(
|
)
|
(
|
)
|
|||
|
Amount of losses recorded (ineffective portion) *
|
(
|
)
|
(
|
)
|
|||
*
Recorded in interest and other expense, net within the consolidated statements of income.
|
Note 6.
|
|
The Company's equity incentive plans are broad-based, long-term retention programs that cover employees, consultants and non-employee directors of the Company. These plans are intended to attract and retain talented employees, consultants and non-employee directors and to provide such persons with a proprietary interest in the Company.
63
Stock-Based Compensation
The following table summarizes stock-based compensation expense related to stock awards granted under the Company's equity incentive plans and rights to acquire stock granted under the Company's Amended and Restated 1990 Employee Qualified Stock Purchase Plan (ESPP):
|
Years Ended
|
|||||||||||
|
(In thousands)
|
March 28, 2020
|
March 30, 2019
|
March 31, 2018
|
||||||||
|
Stock-based compensation included in:
|
|
|
|
||||||||
|
Cost of revenues
|
$
|
|
|
$
|
|
|
$
|
|
|
||
|
Research and development
|
|
|
|
|
|
|
|||||
|
Selling, general and administrative
|
|
|
|
|
|
|
|||||
|
Restructuring charges and Executive transition costs
|
|
|
|
|
|
|
|||||
|
Stock-based compensation effect on income before taxes
|
|
|
|
|
|
|
|||||
|
Income tax effect
|
(
|
)
|
(
|
)
|
(
|
)
|
|||||
|
Net stock-based compensation effect on net income
|
$
|
|
|
$
|
|
|
$
|
|
|
||
The Company adjusts stock-based compensation on a quarterly basis for changes to the estimate of expected equity award forfeitures based on actual forfeiture experience. The effect of adjusting the forfeiture rate for all expense amortization was recognized in the period the forfeiture estimate was changed and was not material for all periods presented.
As of
March 28, 2020
and
March 30, 2019
, the ending inventory balances included
$
3.0
million
and
$
2.1
million
of capitalized stock-based compensation. During fiscal
2020
,
2019
and
2018
, the tax benefit realized for the tax deduction from restricted stock units (RSUs) and other awards totaled
$
72.7
million
,
$
44.4
million
and
$
60.6
million
, respectively. The tax deduction includes amounts credited to income tax expense.
The fair values of ESPP were estimated as of the grant date using the Black-Scholes option pricing model. The Company's expected stock price volatility assumption is estimated using implied volatility of the Company's traded options. The expected life of options granted is based on the historical exercise activity as well as the expected disposition of all options outstanding. The expected life of options granted also considers the actual contractual term.
The weighted-average fair value per share of stock purchase rights granted under the ESPP during fiscal
2020
,
2019
and
2018
were
$
31.97
,
$
26.57
and
$
17.95
, respectively.
These fair values per share were estimated at the date of grant using the following weighted-average assumptions:
|
|
Employee Stock Purchase Plan
|
|||||||
|
Fiscal 2020
|
Fiscal 2019
|
Fiscal 2018
|
||||||
|
Expected life of options (years)
|
|
|
|
|
|
|
||
|
Expected stock price volatility
|
|
|
|
|
|
|
||
|
Risk-free interest rate
|
|
%
|
|
%
|
|
%
|
||
|
Dividend yield
|
|
%
|
|
%
|
|
%
|
||
|
|
Fiscal 2020
|
Fiscal 2019
|
Fiscal 2018
|
|||||
|
Risk-free interest rate
|
|
%
|
|
%
|
|
%
|
||
|
Dividend yield
|
|
%
|
|
%
|
|
%
|
||
As of
March 28, 2020
, total unrecognized stock-based compensation costs related to ESPP was
$
33.4
million
. The total unrecognized stock-based compensation cost for ESPP is expected to be recognized over a weighted-average period of
1.1
years
.
64
Equity Incentive Plans
As of
March 28, 2020
,
15.0
million
shares are available for future grants under the 2007 Equity Incentive Plan (2007 Equity Plan). The contractual term for stock awards granted under the 2007 Equity Plan is
seven years
from the grant date. Stock awards granted to existing and newly hired employees generally vest over a four-year period from the date of grant.
A summary of shares available for grant under the 2007 Equity Plan is as follows:
|
(Shares in thousands)
|
Shares Available for Grant
|
||
|
April 1, 2017
|
|
|
|
|
Additional shares reserved
|
|
|
|
|
RSUs granted
|
(
|
)
|
|
|
RSUs cancelled
|
|
|
|
|
March 31, 2018
|
|
|
|
|
Additional shares reserved
|
|
|
|
|
RSUs granted
|
(
|
)
|
|
|
RSUs cancelled
|
|
|
|
|
March 30, 2019
|
|
|
|
|
Additional shares reserved
|
|
|
|
|
RSUs granted
|
(
|
)
|
|
|
RSUs cancelled
|
|
|
|
|
March 28, 2020
|
|
|
|
The types of awards allowed under the 2007 Equity Plan include incentive stock options, non-qualified stock options, RSUs, restricted stock and stock appreciation rights. To date, the Company has issued a mix of non-qualified stock options and RSUs under the 2007 Equity Plan.
The total pre-tax intrinsic value of options exercised during fiscal
2020
and
2019
was
$
331
thousand
and
$
475
thousand
, respectively. This intrinsic value represents the difference between the exercise price and the fair market value of the Company's common stock on the date of exercise.
Since the Company adopted the policy of retiring all repurchased shares of its common stock, new shares are issued upon employees' exercise of their stock options.
65
RSU Awards
A summary of the Company's RSU activity and related information is as follows:
|
|
RSUs Outstanding
|
|||||||||
|
(Shares and intrinsic value in thousands)
|
Number of Shares
|
|
Weighted-Average Grant-Date Fair Value Per Share
|
|
Weighted Average Remaining Contractual Term (Years)
|
|
Aggregate Intrinsic Value
(1)
|
|||
|
April 1, 2017
|
|
|
$
|
|||||||
|
Granted
|
|
|
$
|
|||||||
|
Vested
(2)
|
(
|
)
|
$
|
|||||||
|
Cancelled
|
(
|
)
|
$
|
|||||||
|
March 31, 2018
|
|
|
$
|
|||||||
|
Granted
|
|
|
$
|
|||||||
|
Vested
(2)
|
(
|
)
|
$
|
|||||||
|
Cancelled
|
(
|
)
|
$
|
|||||||
|
March 30, 2019
|
|
|
$
|
|||||||
|
Granted
|
|
|
$
|
|||||||
|
Vested
(2)
|
(
|
)
|
$
|
|||||||
|
Cancelled
|
(
|
)
|
$
|
|||||||
|
March 28, 2020
|
|
|
$
|
|
$
|
|
|
|||
|
|
|
|
|
|
|
|
||||
|
Expected to vest as of March 28, 2020
|
|
|
$
|
|
$
|
|
|
|||
|
(1)
|
Aggregate intrinsic value for RSUs represents the closing price per share of Xilinx's stock on
March 28, 2020
of
$
|
|
(2)
|
The number of RSUs vested includes shares that the Company withheld on behalf of employees to satisfy the statutory tax withholding requirements.
|
RSUs with a fair value of
$
155.8
million
vested during fiscal
2020
. As of
March 28, 2020
, total unrecognized stock-based compensation costs related to non-vested RSUs was
$
352.4
million
. The total unrecognized stock-based compensation cost for RSUs is expected to be recognized over a weighted-average period of
2.6
years
.
Employee Stock Purchase Plan
Under the Company's ESPP, qualified employees can obtain a
24
-month purchase right to purchase the Company's common stock at the end of each six-month exercise period. Participation is limited to
15
%
of the employee's annual earnings up to a maximum of
$
21
thousand
in a calendar year. Approximately
86
%
of all eligible employees participated in the ESPP. The purchase price of the stock is
85
%
of the lower of the fair market value at the beginning of the
24
-month offering period or at the end of each six-month exercise period. Employees purchased
719
thousand
shares for
$
53.0
million
in fiscal
2020
,
1.0
million
shares for
$
48.3
million
in fiscal 2019, and
918
thousand
shares for
$
44.3
million
in fiscal 2018. The next scheduled purchase under the ESPP is in the second quarter of fiscal
2021
. As of
March 28, 2020
,
12.6
million
shares were available for future issuance.
The following tables disclose the current liabilities and other assets that individually exceed 5% of the respective consolidated balance sheet amounts in each fiscal year. Individual balances that are less than 5% of the respective consolidated balance sheet amounts are aggregated and disclosed as "other."
66
|
(In thousands)
|
March 28, 2020
|
|
March 30, 2019
|
|
|||
|
Accrued payroll and related liabilities:
|
|
|
|||||
|
Accrued compensation
|
$
|
|
|
$
|
|
|
|
|
Deferred compensation plan liability
|
|
|
|
|
|||
|
Others
|
|
|
|
|
|||
|
|
$
|
|
|
$
|
|
|
|
|
(In thousands)
|
March 28, 2020
|
|
March 30, 2019
|
|
|||
|
Other accrued liabilities:
|
|||||||
|
Interest payable
|
$
|
|
|
$
|
|
|
|
|
Accruals related to software licenses
|
|
|
|
|
|||
|
Unsettled investment transactions
|
|
|
|
|
|||
|
Restructuring accruals
|
|
|
|
|
|||
|
Lease liabilities
|
|
|
—
|
|
|||
|
Others
|
|
|
|
|
|||
|
|
$
|
|
|
$
|
|
|
|
|
(In thousands)
|
March 28, 2020
|
|
March 30, 2019
|
|
|||
|
Other assets:
|
|||||||
|
Deferred tax asset
|
$
|
|
|
$
|
|
|
|
|
Trust asset (deferred compensation plan)
|
|
|
|
|
|||
|
Lease assets
|
|
|
—
|
|
|||
|
Investments in non-marketable equity securities
|
|
|
|
|
|||
|
Software license contracts
|
|
|
|
|
|||
|
Others
|
|
|
|
|
|||
|
$
|
|
|
$
|
|
|
||
67
|
Note 8.
|
Leases and Commitments
|
Xilinx leases some of its facilities and office buildings under non-cancelable operating leases that expire at various dates through
August 2029
. Additionally, Xilinx entered into a land lease in conjunction with the Company's building in Singapore, which will expire in
November 2035
and the lease cost was settled in an up-front payment in June 2006. Some of the operating leases for facilities and office buildings require payment of operating costs, including property taxes, repairs, maintenance and insurance. Most of the Company's leases contain renewal options for varying terms.
T
hese renewal terms can extend the lease term from
1
to
15
years
and are included in the lease term when it is reasonably certain that the Company will exercise the option.
The following table presents the maturities of lease liabilities as of
March 28, 2020
:
|
Fiscal
|
(In thousands)
|
||
|
2021
|
$
|
|
|
|
2022
|
|
|
|
|
2023
|
|
|
|
|
2024
|
|
|
|
|
2025
|
|
|
|
|
Thereafter
|
|
|
|
|
Total lease payments
|
|
|
|
|
Less: Imputed interest
|
(
|
)
|
|
|
Total lease liabilities
|
$
|
|
|
The Company's leases were included as a component of the following consolidated balance sheet lines:
|
(In thousands)
|
March 28, 2020
|
||
|
Other assets
|
$
|
|
|
|
Other accrued liabilities
|
|
|
|
|
Other long-term liabilities
|
|
|
|
The components of lease costs were as follows:
|
(In thousands)
|
March 28, 2020
|
||
|
Operating lease cost
|
$
|
|
|
|
Lease income
|
(
|
)
|
|
|
Total lease cost
|
$
|
|
|
Other information related to leases was as follows:
|
(In thousands)
|
March 28, 2020
|
||
|
Cash paid for operating leases included in operating cash flows
|
$
|
|
|
|
March 28, 2020
|
||
|
Weighted-average remaining lease term - operating leases (in years)
|
|
|
|
Weighted-average remaining discount rate - operating leases
|
|
%
|
68
Other commitments as of
March 28, 2020
totaled
$
142.4
million
and consisted of purchases of inventory and other non-cancelable purchase obligations related to subcontractors that manufacture silicon wafers and provide assembly and test services. The Company expects to receive and pay for these materials and services in the next three to
six months
, as the products meet delivery and quality specifications. Additionally, as of
March 28, 2020
, the Company had
$
41.3
million
in commitments primarily related to open purchase orders from ordinary operations and
$
1.6
million
related to renovation of three of its properties. These commitments expire at various dates through
April 2025
.
As of
March 30, 2019
, prior to the adoption of the new authoritative guidance on leases, future minimum lease payments under non-cancelable operating leases were as follows:
|
Fiscal
|
(In thousands)
|
||
|
2020
|
$
|
|
|
|
2021
|
|
|
|
|
2022
|
|
|
|
|
2023
|
|
|
|
|
2024
|
|
|
|
|
Thereafter
|
|
|
|
|
Total
|
$
|
|
|
|
Note 9.
|
|
The computation of basic net income per common share for all periods presented is derived from the information on the consolidated statements of income, and there are no reconciling items in the numerator used to compute diluted net income per common share.
The following table summarizes the computation of basic and diluted net income per common share:
|
Years Ended
|
|||||||||||
|
(In thousands, except per share amounts)
|
March 28, 2020
|
|
March 30, 2019
|
|
March 31, 2018
|
|
|||||
|
Net income available to common stockholders
|
$
|
|
|
$
|
|
|
$
|
|
|
||
|
Weighted average common shares outstanding-basic
|
|
|
|
|
|
|
|||||
|
Dilutive effect of employee equity incentive plans
|
|
|
|
|
|
|
|||||
|
Dilutive effect of 2017 Convertible Notes and warrants
|
|
|
|
|
|
|
|
||||
|
Weighted average common shares outstanding-diluted
|
|
|
|
|
|
|
|||||
|
Basic earnings per common share
|
$
|
|
|
$
|
|
|
$
|
|
|
||
|
Diluted earnings per common share
|
$
|
|
|
$
|
|
|
$
|
|
|
||
The total shares used in the denominator of the diluted net income per common share calculation include potentially dilutive common equivalent shares outstanding that are not included in basic net income per common share calculation. The diluted shares were calculated by applying the treasury stock method to the impact of the equity incentive plans, the incremental shares issuable assuming conversion of the Company's
$
600.0
million
principal amount of
2.625
%
convertible notes issued in June 2010 (2017 Convertible Notes), before its maturity on June 15, 2017, and exercise of warrants on a weighted-average outstanding basis, before the final settlements during the third quarter of fiscal 2018. The 2017 Convertible Notes matured during the first quarter of fiscal 2018, and the Company exercised its call options to neutralize the dilutive effect of the incremental shares from the 2017 Convertible Notes. Because the number of diluted shares in the above table for the 12 months ended March 31, 2018 was calculated based on a weighted-average outstanding basis, it included approximately
1.5
million
shares of dilutive impact from the 2017 Convertible Notes through the maturity date and
4.1
million
shares of dilutive impact from warrants before the settlement.
Certain shares of outstanding stock options and RSUs were excluded from diluted net income per common share calculation by applying the treasury stock method, as their inclusion would have been antidilutive. These options and RSUs were immaterial for fiscal
2020
,
2019
and
2018
. but could be dilutive in the future if the Company's average share price increases and is greater than the combined exercise prices and the unamortized fair values of these options and RSUs.
69
|
Note 10.
|
|
The components of interest and other income (expense), net are as follows:
|
Years Ended
|
|||||||||||
|
(In thousands)
|
March 28, 2020
|
March 30, 2019
|
March 31, 2018
|
||||||||
|
Interest income
|
$
|
|
|
$
|
|
|
$
|
|
|
||
|
Interest expense
|
(
|
)
|
(
|
)
|
(
|
)
|
|||||
|
Other income (expense), net
|
|
|
(
|
)
|
(
|
)
|
|||||
|
|
$
|
|
|
$
|
|
|
$
|
|
|
||
|
Note 11.
|
|
Comprehensive loss is defined as the change in equity of a company during a period from transactions and other events and circumstances from non-owner sources.
The components of accumulated other comprehensive loss are as follows:
|
(In thousands)
|
March 28, 2020
|
|
March 30, 2019
|
|
|||
|
Accumulated unrealized gains (losses) on available-for-sale securities, net of tax
|
$
|
|
|
$
|
(
|
)
|
|
|
Accumulated unrealized gains (losses) on hedging transactions, net of tax
|
(
|
)
|
|
|
|||
|
Accumulated cumulative translation adjustment, net of tax
|
(
|
)
|
(
|
)
|
|||
|
Accumulated other comprehensive loss
|
$
|
(
|
)
|
$
|
(
|
)
|
|
The related tax effects of other comprehensive loss were not material for all periods presented.
|
Note 12.
|
|
2021 Notes
On March 12, 2014, the Company issued the 2021 Notes at a discounted price of
99.281
%
of par. Interest on the 2021 Notes is payable semi-annually on March 15 and September 15. The effective interest rate of the 2021 Notes is
3.12
%
.
The Company received net proceeds of
$
495.4
million
from issuance of the 2021 Notes, after the debt discounts and deduction of debt issuance costs. The debt discounts and issuance costs are amortized to interest expense over the term of the 2021 Notes. As of
March 28, 2020
, the remaining term of the 2021 Notes is
1.0
years.
The following table summarizes the carrying value of the 2021 Notes in the Company's consolidated balance sheets:
|
(In thousands)
|
March 28, 2020
|
|
March 30, 2019
|
|
||||
|
Principal amount of the 2021 Notes
|
$
|
|
|
$
|
|
|
||
|
Unamortized discount of the 2021 Notes
|
(
|
)
|
(
|
)
|
||||
|
Unamortized debt issuance costs associated with the 2021 Notes
|
(
|
)
|
(
|
)
|
||||
|
Carrying value of the 2021 Notes
|
$
|
|
|
$
|
|
|
||
Interest expense related to the 2021 Notes was included in interest and other income (expense), net on the consolidated statements of income as follows:
|
Years Ended
|
||||||||||||
|
(In thousands)
|
March 28, 2020
|
March 30, 2019
|
March 31, 2018
|
|||||||||
|
Contractual coupon interest
|
$
|
|
|
$
|
|
|
$
|
|
|
|||
|
Amortization of debt issuance costs
|
|
|
|
|
|
|
||||||
|
Amortization of debt discount, net
|
|
|
|
|
|
|
||||||
|
Total interest expense related to the 2021 Notes
|
$
|
|
|
$
|
|
|
$
|
|
|
|||
70
2024 Notes
On
May 30, 2017
, the Company issued the 2024 Notes at a discounted price of
99.887
%
of par. Interest on the 2024 Notes is payable semi-annually on June 1 and December 1. The effective interest rate of the 2024 Notes is
2.97
%
.
The Company received net proceeds of
$
745.2
million
from the issuance of the 2024 Notes, after the debt discount and deduction of debt issuance costs. The debt discounts and issuance costs are amortized to interest expense over the term of the 2024 Notes. As of
March 28, 2020
, the remaining term of the 2024 Notes is approximately
4.2
years.
In relation to the issuance of the 2024 Notes, the Company entered into interest rate swap contracts with certain independent financial institutions, whereby the Company pays on a semi-annual basis, a variable interest rate equal to the t
hree-month London Interbank Offered Rate (LIBOR) plus 91.43 bps
, and receives on a semi-annual basis, interest income at a fixed interest rate of
2.950
%
. The Company incurred a net interest expense of
$
923.0
thousand
during the twelve months ended
March 28, 2020
and incurred a net interest expense of
$
3.8
million
during the twelve months ended
March 30, 2019
, respectively, from the interest rate swap contracts, which was included in interest and other income (expense), net on the consolidated statements of income. During the first quarter of fiscal 2020, the Company sold the interest rate swap contracts for an immaterial gain. The gain is being amortized as a reduction to interest expense over the remaining life of the 2024 Notes.
The following table summarizes the carrying value of the 2024 Notes in the Company's consolidated balance sheets:
|
(In thousands)
|
March 28, 2020
|
|
March 30, 2019
|
|
||||
|
Principal amount of the 2024 Notes
|
$
|
|
|
$
|
|
|
||
|
Unamortized discount of the 2024 Notes
|
(
|
)
|
(
|
)
|
||||
|
Unamortized debt issuance costs associated with the 2024 Notes
|
(
|
)
|
(
|
)
|
||||
|
Carrying value of the 2024 Notes
|
|
|
|
|
||||
|
Fair value hedge adjustment - interest rate swap contracts
|
|
|
(
|
)
|
||||
|
Net carrying value of the 2024 Notes
|
$
|
|
|
$
|
|
|
||
Interest expense related to the 2024 Notes was included in interest and other income (expense), net on the consolidated statements of income as follows:
|
Years Ended
|
||||||||||||
|
(In thousands)
|
March 28, 2020
|
|
March 30, 2019
|
March 31, 2018
|
||||||||
|
Contractual coupon interest
|
$
|
|
|
|
$
|
|
|
$
|
|
|
||
|
Amortization of debt issuance costs
|
|
|
|
|
|
|
|
|||||
|
Amortization of debt discount
|
|
|
|
|
|
|
|
|||||
|
Total interest expense related to the 2024 Notes
|
|
$
|
|
|
|
$
|
|
|
|
$
|
|
|
Revolving Credit Facility
71
Preferred Stock
The Company's Certificate of Incorporation authorized
2.0
million
shares of undesignated preferred stock. The preferred stock may be issued in one or more series. The Board of Directors is authorized to determine or alter the rights, preferences, privileges and restrictions granted to, or imposed upon, any wholly unissued series of preferred stock. As of
March 28, 2020
and
March 30, 2019
,
no
preferred shares were issued or outstanding.
Common Stock and Debentures Repurchase Programs
The Board of Directors has approved stock repurchase programs enabling the Company to repurchase its common stock in the open market or through negotiated transactions with independent financial institutions. On October 22, 2019, the Board authorized a repurchase program to repurchase the Company's common stock and debentures up to
$
1.00
billion
(2019 Repurchase Program). The 2019 Repurchase Program has no stated expiration date.
Through
March 28, 2020
, the Company has used
$
662.6
million
of the
$
1.00
billion
authorized under the 2019 Repurchase Program, leaving
$
337.4
million
available for future repurchases. The Company's current policy is to retire all repurchased shares, and consequently,
no
treasury shares were held as of
March 28, 2020
and
March 30, 2019
.
During fiscal
2020
, the Company repurchased
12.9
million
shares of common stock in the open market and through accelerated share repurchase agreements with independent financial institutions for a total of
$
1.21
billion
. During fiscal
2019
, the Company repurchased
2.4
million
in the open market with independent financial institutions for a total of
$
161.6
million
.
|
Note 14.
|
|
The provision for income taxes consists of the following:
|
Years Ended
|
||||||||||||
|
(In thousands)
|
March 28, 2020
|
March 30, 2019
|
March 31, 2018
|
|||||||||
|
Federal:
|
|
|
|
|||||||||
|
Current
|
$
|
(
|
)
|
$
|
|
|
$
|
|
|
|||
|
Deferred
|
|
|
(
|
)
|
(
|
)
|
||||||
|
|
|
|
|
|
|
|
||||||
|
State:
|
|
|
|
|||||||||
|
Current
|
|
|
|
|
|
|
||||||
|
Deferred
|
|
|
|
|
|
|
||||||
|
|
|
|
|
|
|
|
||||||
|
Foreign:
|
|
|
|
|||||||||
|
Current
|
|
|
|
|
|
|
||||||
|
Deferred
|
(
|
)
|
(
|
)
|
(
|
)
|
||||||
|
|
|
|
|
|
|
|
||||||
|
Total
|
$
|
|
|
$
|
|
|
$
|
|
|
|||
The domestic and foreign components of income before income taxes were as follows:
|
(In thousands)
|
|
March 28, 2020
|
March 30, 2019
|
March 31, 2018
|
||||||||
|
Domestic
|
|
$
|
|
|
$
|
|
|
$
|
|
|
||
|
Foreign
|
|
|
|
|
|
|
|
|||||
|
Income before income taxes
|
|
$
|
|
|
$
|
|
|
$
|
|
|
||
72
On December 22, 2017, the TCJA was enacted into law. It made significant tax law changes and modifications including the reduction of the U.S. federal corporate income tax rate from 35% to 21%, the requirement for companies to pay a one-time transition tax on earnings of certain foreign subsidiaries that were previously tax deferred and the creation of new taxes on certain foreign-sourced earnings. Some provisions of the TCJA began to impact the Company in fiscal 2018, while other provisions impacted the Company beginning in fiscal 2019.
SAB 118 allows companies to record provisional amounts and recognize the effect of the tax law changes during a measurement period. The Company recorded provisional income tax expense of
$
214.7
million
in its fiscal 2018 results. During fiscal 2019, the Company recorded income tax expense of
$
2.4
million
as measurement period adjustments to the provisional amounts recorded in fiscal 2018. The measurement period adjustments include the impact of the Company's accounting policy election to recognize deferred taxes for temporary basis differences that are expected to reverse as GILTI income in future years. The measurement period ended in the third quarter of fiscal 2019.
The Company recorded excess tax benefits associated with stock-based compensation of
$
37.4
million
,
$
14.2
million
, and
$
21.5
million
in the provision for income taxes during fiscal 2020, 2019, and 2018 respectively.
As of
March 28, 2020
, the Company had federal net operating loss carryforwards of
$
195.8
million
from acquisition activity. The net operating loss carryforwards have expirations between fiscal 2021 and fiscal 2037 and some are subject to change of ownership limitations provided by the Internal Revenue Code. As of
March 28, 2020
, the Company had state net operating loss carryforwards of
$
186.5
million
primarily from acquisition activity. The state net operating loss carryforwards include
$
175.6
million
which is not likely to be recovered and has been reduced by a valuation allowance.
As of
March 28, 2020
, the Company had state research tax credit carryforwards of approximately
$
215.3
million
. The credits have no expiration date. Some of the state credit carryforwards are subject to change of ownership limitations provided by state provisions similar to that of the Internal Revenue Code. The state credit carryforwards include
$
172.6
million
that is not likely to be recovered and has been reduced by a valuation allowance. As of
March 28, 2020
, the Company had foreign credit carryforwards of
$
2.3
million
, all of which is not likely to be recovered and has been reduced by a valuation allowance.
The provision for income taxes reconciles to the amount derived by applying the federal statutory income tax rate to income before provision for taxes as follows:
|
Years Ended
|
||||||||||||
|
(In thousands)
|
March 28, 2020
|
March 30, 2019
|
March 31, 2018
|
|||||||||
|
Income before provision for taxes
|
$
|
|
|
$
|
|
|
$
|
|
|
|||
|
Federal statutory tax rate
|
|
%
|
|
%
|
|
%
|
||||||
|
Computed expected tax
|
|
|
|
|
|
|
||||||
|
State taxes, net of federal benefit
|
|
|
|
|
|
|
||||||
|
Foreign earnings at lower tax rates
|
(
|
)
|
(
|
)
|
(
|
)
|
||||||
|
Tax credits
|
(
|
)
|
(
|
)
|
(
|
)
|
||||||
|
Transition tax
|
|
|
|
|
|
|
||||||
|
Deferred tax remeasurement
|
|
|
|
|
|
|
||||||
|
Excess benefits from stock-based compensation
|
(
|
)
|
(
|
)
|
(
|
)
|
||||||
|
Fiscal 2014 amended returns*
|
(
|
)
|
|
|
|
|
||||||
|
Other
|
|
|
(
|
)
|
(
|
)
|
||||||
|
Provision for income taxes
|
$
|
|
|
$
|
|
|
$
|
|
|
|||
*Interest income on refunds and release of unrecognized tax benefits for related research credits. Refer to gross unrecognized tax benefits discussion below for more detail.
The Company has manufacturing operations in Singapore where the Company has been granted "Pioneer Status" that is effective through fiscal 2021. The Pioneer Status reduces the Company's tax on the majority of Singapore income from
17
%
to
zero
percent. During the quarter ended September 28, 2019, the Company received awards from the Singapore Economic Development Board for a Development and Expansion Incentive that will reduce its local tax on Singapore income from a statutory rate of 17% to 5% for the fiscal years 2022 through 2031. The benefits of Pioneer Status in Singapore for fiscal
2020
, fiscal
2019
and fiscal
2018
were approximately
$
42.3
million
(
$
0.17
per diluted share),
$
48.0
million
(
$
0.19
per diluted share), and
$
61.5
million
(
$
0.24
per
73
diluted share), respectively. The tax effect of operations in low tax jurisdictions on the Company's overall tax rate is reflected in the table above.
The major components of deferred tax assets and liabilities consisted of the following:
|
(In thousands)
|
March 28, 2020
|
|
March 30, 2019
|
|
||||
|
Deferred tax assets:
|
|
|
||||||
|
Stock-based compensation
|
$
|
|
|
$
|
|
|
||
|
Accrued expenses
|
|
|
|
|
||||
|
Tax credit carryforwards
|
|
|
|
|
||||
|
Deferred compensation plan
|
|
|
|
|
||||
|
Low income housing and other investments
|
|
|
|
|
||||
|
GILTI deferred taxes
|
|
|
|
|
||||
|
Tax loss carryforwards
|
|
|
|
|
|
|||
|
Intangible assets
|
|
|
|
|
||||
|
Operating leases
|
|
|
—
|
|
||||
|
Other
|
|
|
|
|
||||
|
Subtotal
|
|
|
|
|
||||
|
Valuation allowance
|
(
|
)
|
(
|
)
|
||||
|
Total deferred tax assets
|
|
|
|
|
||||
|
Deferred tax liabilities:
|
|
|
||||||
|
Unremitted foreign earnings
|
(
|
)
|
(
|
)
|
||||
|
Intangible assets
|
|
|
(
|
)
|
||||
|
Distributor price adjustments
|
(
|
)
|
(
|
)
|
||||
|
Operating leases
|
(
|
)
|
—
|
|
||||
|
Other
|
(
|
)
|
(
|
)
|
||||
|
Total deferred tax liabilities
|
(
|
)
|
(
|
)
|
||||
|
Total net deferred tax assets
|
$
|
|
|
$
|
|
|
||
Long-term deferred tax assets of
$
149.4
million
and
$
126.7
million
as of
March 28, 2020
and
March 30, 2019
, respectively, were included in other assets on the consolidated balance sheet.
As of
March 28, 2020
and
March 30, 2019
, gross deferred tax assets were offset by valuation allowances of
$
150.9
million
and
$
118.8
million
, respectively, which were primarily associated with federal and state net operating losses and state tax credit carryforwards.
The aggregate changes in the balance of gross unrecognized tax benefits were as follows:
|
(In thousands)
|
March 28, 2020
|
|
March 30, 2019
|
|||||
|
Balance as of beginning of fiscal year
|
$
|
|
|
$
|
|
|
||
|
Increases in tax positions for prior years
|
|
|
|
|
||||
|
Decreases in tax positions for prior years
|
(
|
)
|
(
|
)
|
||||
|
Increases in tax positions for current year
|
|
|
|
|
||||
|
Settlements
|
|
|
|
|
||||
|
Lapses in statutes of limitation
|
(
|
)
|
(
|
)
|
||||
|
Balance as of end of fiscal year
|
$
|
|
|
$
|
|
|
||
The Company’s total gross unrecognized tax benefits decreased by
$
58.8
million
during fiscal 2020. Of the net change in uncertain tax benefits during the year, there was an
$
85.5
million
decrease related to an additional deduction claimed on federal and state
74
amended tax returns (refund claim) for fiscal 2014 for redemption premium paid in that year in connection with the early redemption of the Company’s 3.125% Junior Convertible debenture due March 15, 2037. During the third quarter of fiscal 2020, the Company received written notification from the Internal Revenue Service that the Joint Committee on Taxation had completed its review of the Company's refund claim and had taken no exception. The tax benefit of the refund claim, net of state tax adjustments, of
$
81.9
million
was recognized as an increase to additional paid-in capital in the third quarter of fiscal 2020. The decrease in gross unrecognized tax benefits was partially offset by new gross unrecognized tax benefits associated with acquisition and post-acquisition restructuring activities. If the remaining balance of
$
88.8
million
and
$
147.6
million
of unrecognized tax benefits as of
March 28, 2020
and
March 30, 2019
, respectively, were realized in a future period, it would result in a tax benefit of
$
47.4
million
and
$
35.3
million
, respectively, thereby reducing the effective tax rate.
The Company's policy is to include interest and penalties related to income tax liabilities within the provision for income taxes on the consolidated statements of income. The balances of accrued interest and penalties recorded in the consolidated balance sheets and the amounts of interest and penalties included in the Company's provisions for income taxes were not material for any period presented.
The statutes of limitations have closed for U.S. federal income tax purposes for years through fiscal 2014 as well as fiscal 2016, for U.S. state income tax purposes for years through fiscal 2010, and for Ireland income tax purposes for years through fiscal 2015.
The Company believes its provision for unrecognized tax benefits is adequate for adjustments that may result from tax audits. However, the outcome of tax audits cannot be predicted with certainty. If any issues addressed in the Company's tax audits are resolved in a manner not consistent with management's expectations, the Company could be required to adjust its provision for income taxes in the period such resolution occurs. It is reasonably possible that changes to the Company's unrecognized tax benefits could be significant in the next twelve months due to tax audit settlements and lapses of statutes of limitation. As a result of uncertainties regarding tax audits and their possible outcomes, an estimate of the range of increase or decrease that could occur in the next twelve months cannot be made at this time.
On July 27, 2015, the United States Tax Court (Tax Court) issued an opinion in Altera Corp. v. Commissioner, and, in a 15-0 decision, concluded that related parties in a cost sharing arrangement are not required to share expenses related to stock-based compensation. The Commissioner appealed the Tax Court decision to the Ninth Circuit Court of Appeals (Ninth Circuit). The Ninth Circuit overturned the Tax Court’s decision in an opinion issued on July 24, 2018, but subsequently withdrew it. After rehearing the arguments on October 16, 2018, the Ninth Circuit issued a subsequent opinion on June 7, 2019. In a 2-1 decision, the Ninth Circuit overturned the Tax Court’s decision. On July 22, 2019, Altera filed a petition for an
en banc
rehearing with the Ninth Circuit. On November 12, 2019, the Ninth Circuit issued an order denying Altera's petition. On February 10, 2020, Altera filed a
writ of certiorari
with the U.S. Supreme Court for review of the case. As such, the decision is not final. The Company has concluded that the law is unsettled and continue to record tax benefits as we exclude stock-based compensation costs from our cost sharing arrangement. As of March 28, 2020, the cumulative potential impact of a final adverse decision to the consolidated statement of income was
$
55
million
to
$
60
million
for taxes and interest. The Company will continue to monitor developments in the Altera case and the potential effect on our consolidated financial statements.
Xilinx designs, develops and markets programmable logic semiconductor devices and the related software design tools. The Company operates and tracks its results in
one
operating segment. Xilinx sells its products to OEMs and to electronic components distributors who resell these products to OEMs or subcontract manufacturers.
Geographic revenue information for fiscal
2020
,
2019
and
2018
reflects the geographic location of the distributors or OEMs who purchased the Company's products. This may differ from the geographic location of the end customers. Long-lived assets include property, plant and equipment, which were based on the physical location of the asset as of the end of each fiscal year.
75
Net revenues by geographic region were as follows:
|
Years Ended
|
|||||||||||
|
(In thousands)
|
March 28, 2020
|
March 30, 2019
|
March 31, 2018
|
||||||||
|
North America:
|
|
|
|
||||||||
|
United States
|
$
|
|
|
$
|
|
|
$
|
|
|
||
|
Other (individual countries less than 10%)
|
|
|
|
|
|
|
|||||
|
Total North America
|
|
|
|
|
|
|
|||||
|
|
|
|
|
||||||||
|
Asia Pacific:
|
|
|
|
||||||||
|
China
|
|
|
|
|
|
|
|||||
|
Other (individual countries less than 10%)
|
|
|
|
|
|
|
|||||
|
Total Asia Pacific
|
|
|
|
|
|
|
|||||
|
|
|
|
|
||||||||
|
Europe (individual countries less than 10%)
|
|
|
|
|
|
|
|||||
|
Japan
|
|
|
|
|
|
|
|||||
|
Total Foreign
|
|
|
|
|
|
|
|||||
|
Worldwide Total
|
$
|
|
|
$
|
|
|
$
|
|
|
||
Net long-lived assets by country at fiscal year-ends were as follows:
|
Years Ended
|
|||||||||||
|
(In thousands)
|
March 28, 2020
|
March 30, 2019
|
March 31, 2018
|
||||||||
|
United States
|
$
|
|
|
$
|
|
|
$
|
|
|
||
|
Foreign:
|
|
|
|
||||||||
|
Ireland
|
|
|
|
|
|
|
|||||
|
Singapore
|
|
|
|
|
|
|
|||||
|
India
|
|
|
|
|
|
|
|||||
|
Other (individual countries less than 10%)
|
|
|
|
|
|
|
|||||
|
Total foreign
|
|
|
|
|
|
|
|||||
|
Worldwide total
|
$
|
|
|
$
|
|
|
$
|
|
|
||
|
Note 16.
|
|
Patent Litigation
On October 18, 2019, a patent infringement lawsuit was filed by Arbor Global Strategies LLC (Arbor) against the Company in the U.S. District Court in Delaware (Arbor Global Strategies LLC, v. Xilinx, Inc., Case No. 1:19-cv-01986). The lawsuit pertains to four patents and Arbor seeks unspecified damages, interest, attorneys’ fees, and costs. The Company filed a motion to dismiss the case on December 19, 2019. This motion is still pending. No schedule has been set in the case. The Company is unable to estimate its range of possible loss, if any, in this matter at this time.
On December 5, 2019, Analog Devices, Inc. (ADI) filed a patent infringement lawsuit against the Company in the United States District Court for the District of Delaware (Analog Devices, Inc. v. Xilinx, Inc., Case No. 1-19-cv-02225). The lawsuit pertains to eight patents and ADI seeks unspecified damages, interest, attorneys’ fees, costs, and a permanent injunction. The Company filed its answer and counterclaims alleging infringement by ADI of eight patents on January 21, 2020. ADI filed a motion to dismiss the Company’s willful infringement claims on March 20, 2020. The Company filed amended counterclaims on April 3, 2020. The parties’ claims are set for back-to-back trials beginning January 24, 2022 for ADI’s claims and January 31, 2022 for the Company’s claims. The Company is unable to estimate its range of possible loss, if any, in this matter at this time.
76
On April 30, 2020, a patent infringement lawsuit was filed by FG SRC LLC (SRC) against the Company in the U.S. District Court in Delaware (FG SRC LLC v. Xilinx, Inc., Case No. 1:20-cv-00601). The lawsuit pertains to two patents and SRC seeks unspecified damages, interest, and an on-going royalty. No schedule has been set in the case. The Company is unable to estimate its range of possible loss, if any, in this matter at this time.
The Company intends to continue to protect and defend its IP vigorously.
Other Matters
On June 11, 2015, John P. Neblett, as Chapter 7 Trustee of Valley Forge Composite Technologies, Inc., filed a complaint against Xilinx and others in the U.S. Bankruptcy Court for the Middle District of Pennsylvania (Bankruptcy No. 1:13-bk-05253-JJT). The complaint alleges causes of actions against Xilinx for negligence and civil conspiracy relating to alleged violations of U.S. export laws. It seeks at least
$
50.0
million
in damages, together with punitive damages, from the defendants. On September 21, 2015, the action was withdrawn from the U.S. Bankruptcy Court for the Middle District of Pennsylvania and transferred to the U.S. District Court for the Eastern District of Kentucky. On November 2, 2015, Xilinx, along with other defendants, filed a motion to dismiss the complaint. On November 3, 2015, Xilinx filed a motion for sanctions pursuant to Federal Rule of Civil Procedure 11. On June 27, 2016, the Court denied both motions. On September 11, 2017, Xilinx, along with other defendants, filed motions for summary judgment seeking to dispose of all claims against them. On July 3, 2018, the Court granted both of Xilinx’s Motions for Summary Judgment, disposing of all claims asserted against Xilinx. On August 1, 2018, the Trustee filed a Notice of Appeal. On August 9, 2018, the Court of Appeals for the Sixth Circuit issued an Order to Show Cause requesting that the appellant address a possible jurisdictional defect. On August 29, 2018, the appellant responded to the Order to Show Cause. On September 10, 2018, appellees, including Xilinx, filed a joint reply. On January 7, 2019, the Court of Appeals issued an order dismissing the appeal for lack of jurisdiction. On February 19, 2019, the District Court issued an order permitting any party seeking to certify the case for appeal to file a motion. On March 11, 2019, defendant Avnet filed a motion to certify the case for appeal. On May 14, 2019 the Court denied Avnet’s motion. On June 4, 2019, Avnet and the counterclaim and crossclaim defendants stipulated to dismissal of Avnet’s remaining counterclaims and crossclaims. The Court entered final judgment on June 25, 2019. On July 22, 2019, the Trustee filed his notice of appeal and filed his opening appellate brief on September 17, 2019. On October 30, 2019, Xilinx filed its appellee brief. On November 20, 2019, the Trustee filed his reply brief. On April 7, 2020, the Sixth Circuit affirmed the District Court’s judgment which granted both of Xilinx’s Motions for Summary Judgment, disposing of all claims asserted against Xilinx. On April 14, 2020, the Trustee filed a motion to extend the time for filing a petition for rehearing, and the Sixth Circuit granted the motion extending the due date until May 14, 2020.
From time to time, the Company is involved in various disputes and litigation matters that arise in the ordinary course of its business. These include disputes and lawsuits related to intellectual property, mergers and acquisitions, licensing, contract law, tax, regulatory, distribution arrangements, employee relations and other matters. Periodically, the Company reviews the status of each matter and assesses its potential financial exposure. If the potential loss from any claim or legal proceeding is considered probable and a range of possible losses can be estimated, the Company accrues a liability for the estimated loss. Legal proceedings are subject to uncertainties, and the outcomes are difficult to predict. Because of such uncertainties, accruals are based only on the best information available at the time. As additional information becomes available, the Company continues to reassess the potential liability related to pending claims and litigation and may revise estimates.
77
|
Note 17.
|
|
Summaries of goodwill and acquisitions-related intangibles balances as of
March 28, 2020
and
March 30, 2019
were as follows:
|
(In thousands)
|
March 30, 2019
|
Acquisitions
|
Other
|
March 28, 2020
|
|||||||||
|
Goodwill
|
$
|
|
|
|
|
(
|
)
|
$
|
|
|
|||
|
|
|
|
|
|
Weighted-Average
|
||||
|
(In thousands)
|
March 28, 2020
|
|
March 30, 2019
|
|
Amortization Life
|
||||
|
Core technology, gross
|
$
|
|
|
$
|
|
|
|
||
|
Less accumulated amortization
|
(
|
)
|
(
|
)
|
|
||||
|
Core technology, net
|
|
|
|
|
|
||||
|
Other intangibles, gross
|
|
|
|
|
|
||||
|
Less accumulated amortization
|
(
|
)
|
(
|
)
|
|
||||
|
Other intangibles, net
|
|
|
|
|
|
||||
|
In-process research and development
|
|
|
|
|
|||||
|
Total acquisition-related intangibles, gross
|
|
|
|
|
|
||||
|
Less accumulated amortization
|
(
|
)
|
(
|
)
|
|
||||
|
Total acquisition-related intangibles, net
|
$
|
|
|
$
|
|
|
|
||
During the second quarter of fiscal 2020, the Company recorded
$
237.2
million
of goodwill and
$
106.0
million
of intangibles attributable to the acquisition of Solarflare Communications, Inc. (Solarflare). See "Note 20. Business Combination" to the Company's consolidated financial statements.
Based on the carrying value of acquisition-related intangibles recorded as of
March 28, 2020
, and assuming no subsequent impairment of the underlying assets, the annual amortization expense for acquisition-related intangibles is expected to be as follows:
|
Fiscal
|
(In thousands)
|
||
|
2021
|
$
|
|
|
|
2022
|
|
|
|
|
2023
|
|
|
|
|
2024
|
|
|
|
|
2025
|
|
|
|
|
Total
|
$
|
|
|
78
Xilinx offers various retirement benefit plans for U.S. and non-U.S. employees. Total contributions to these plans were
$
16.5
million
,
$
15.1
million
and
$
14.7
million
in fiscal
2020
,
2019
and
2018
, respectively. For employees in the U.S., Xilinx instituted a Company matching program pursuant to which the Company will match contributions to Xilinx's 401(k) Plan (the 401(k) Plan) based on the amount of salary deferral contributions the participant makes to the 401(k) Plan. Xilinx will match up to
50
%
of the first
8
%
of an employee's compensation that the employee contributed to their 401(k) accounts. The maximum Company contribution per year is
$
4,500
per employee. As permitted under Section 401(k) of the Internal Revenue Code, the 401(k) Plan allows tax deferred salary deductions for eligible employees. The Compensation Committee of the Board of Directors administers the 401(k) Plan. Participants in the 401(k) Plan may make salary deferrals of up to
75
%
of the eligible annual salary, limited by the maximum dollar amount allowed by the Internal Revenue Code. Participants who have reached the age of
50
before the close of the plan year may be eligible to make catch-up salary deferral contributions, up to
75
%
of eligible annual salary, limited by the maximum dollar amount allowed by the Internal Revenue Code.
The Company allows its U.S.-based officers, director-level employees and its board members to defer a portion of their compensation under the Deferred Compensation Plan (the Plan). The Compensation Committee administers the Plan. As of
March 28, 2020
, there were
258
participants in the Plan who self-direct their contributions into a menu of hypothetical investment options offered by the Plan that tracks a portfolio of various deemed investment funds. The Plan does not allow Plan participants to invest directly in Xilinx's stock. In the event Xilinx becomes insolvent, Plan assets are subject to the claims of the Company's general creditors. There are no Plan provisions that provide for any guarantees or minimum return on investments. As of
March 28, 2020
, Plan assets of
$
111.1
million
were included in other assets within the consolidated balance sheet and obligations of
$
121.9
million
were included in accrued payroll and related liabilities. As of
March 30, 2019
, Plan assets were
$
109.3
million
and obligations were
$
118.6
million
.
During the fourth quarter of fiscal 2020, the Company announced cost-saving measures designed to drive structural operating efficiencies across the Company, including a targeted global workforce reduction in force. The reorganization plan is expected to be substantially completed by the end of the first quarter of fiscal 2021. The Company recorded restructuring charges of
$
28.4
million in fiscal 2020, primarily related to severance pay expenses and separately presented on the consolidated statements of income. As of the end of fiscal 2020, there was
$
13.5
million accrual for severance and other benefits that are expected to be paid primarily during fiscal 2021.
The following table summarizes the restructuring accrual activity for fiscal 2020:
|
(In thousands)
|
Employee severance and benefits
|
Others
|
Total
|
|||||||||
|
Restructuring charges
|
$
|
|
|
$
|
|
|
$
|
|
|
|||
|
Cash payments
|
(
|
)
|
(
|
)
|
(
|
)
|
||||||
|
Non-cash charges
|
(
|
)
|
|
|
(
|
)
|
||||||
|
Balance as of March 28, 2020
|
$
|
|
|
$
|
|
|
$
|
|
|
|||
During the fourth quarter of fiscal 2018, the Company announced the transition of its President and Chief Executive Officer position, whereby Moshe Gavrielov resigned from those roles and Victor Peng assumed these roles. Additionally, the Company also implemented restructuring measures to realign resources and drive overall operating efficiencies. The Company recorded total transition charges of
$
33.4
million
in the fourth quarter of fiscal 2018, primarily related to severance pay expenses and other benefits. As of the end of fiscal 2020 and 2019, the remaining accrual for severance and other benefits related to executive transition costs was immaterial.
In July 2019, the Company completed the acquisition of Solarflare by acquiring all of its outstanding ordinary shares. Solarflare is a leading provider of high-performance, low latency networking solutions for customers spanning FinTech to cloud computing. This acquisition enables the Company to combine its industry leading solutions with Solarflare's ultra-low latency network interface card (NIC) technology and onload application acceleration software, to enable new converged SmartNIC solutions.
79
Total purchase consideration to acquire Solarflare was approximately
$
400.0
million
, including
$
8.4
million
of fair value from the Company's preexisting investment in Solarflare and net of
$
6.8
million
of cash acquired. The Company incurred
$
4.2
million
of acquisition related costs, which was recorded as operating expenses in its consolidated statements of income. Additionally, the Company was required to assess the fair value of its preexisting investment in Solarflare and, as a result, recorded an immaterial gain in its consolidated statements of income as part of interest and other income (expense), net.
Subsequent to the acquisition, the financial results for Solarflare are included in the Company's consolidated financial statements. Prior to the acquisition, the financial results for Solarflare were not significant for pro forma financial information.
The Company allocated the purchase price to tangible and identified intangible assets acquired and liabilities assumed based on estimated fair values. As additional information becomes available, such as the finalization of the estimated fair value of tax-related items, the Company may further update the preliminary purchase price allocation during the remainder of the measurement period (up to one year from the acquisition date).
The preliminary fair values of the assets acquired and liabilities assumed in the acquisition of Solarflare, by major class, were recognized as follows:
|
Amount
|
|||
|
(In thousands)
|
|||
|
Cash and cash equivalents
|
$
|
|
|
|
Tangible assets
|
|
|
|
|
Identifiable intangible assets
|
|
|
|
|
Goodwill
|
|
|
|
|
Deferred tax assets
|
|
|
|
|
Current liabilities
|
(
|
)
|
|
|
Non-current liabilities
|
(
|
)
|
|
|
Total
|
$
|
|
|
The goodwill of
$
237.2
million
arising from the acquisition is attributed to the expected synergies and other benefits that will be generated from the combination of the Company and Solarflare. The goodwill recognized is not deductible for tax purposes.
The identified intangible assets assumed in the acquisition of Solarflare were recognized as follows, based upon the preliminary fair values as of the closing date of the acquisition.
|
Amount
|
Amortization Life
|
||||
|
(In thousands)
|
|||||
|
Trade Names & Trademarks
|
$
|
|
|
|
|
|
Developed Technology
|
|
|
|
||
|
Customer Relationships
|
|
|
|
||
|
In-Process Research and Development
|
|
|
N/A
|
||
|
Total identifiable intangible assets
|
$
|
|
|
||
During fiscal
2020
, the Company acquired Airrays GmbH, a German-based company that develops a game-changing radio antenna technology in mobile communications for approximately
$
29.0
million
. This acquisition is part of the Company’s wireless strategy to build end-to-end radio reference designs, allowing the Company to maximize the value in its RFSoC technology. The Company recognized
$
14.1
million
of goodwill and
$
18.2
million
of acquisition-related intangibles from this acquisition.
During fiscal
2020
, the Company acquired NGCodec, Inc., a leader in cloud video business for approximately
$
54.0
million
. This acquisition accelerates the Company's strategic roadmap to help advance the key verticals within the data center. The Company recognized
$
28.9
million
of goodwill and
$
26.7
million
of acquisition-related intangibles from this acquisition.
The COVID-19 pandemic did not have any impact on the integrations of the Solarflare and other acquisitions as the integrations were completed by mid-February 2020, before the social distancing requirements were in place and the Company mandated its employees to work from home starting in mid-March 2020.
80
81
REPORT OF INDEPENDENT REGISTERED PUBLIC ACCOUNTING FIRM
To the Stockholders and the Board of Directors of Xilinx, Inc.
Opinion on the Financial Statements
We have audited the accompanying consolidated balance sheets of Xilinx, Inc. (the Company) as of March 28, 2020 and March 30, 2019, the related consolidated statements of income, comprehensive income, stockholders' equity and cash flows for each of the three years in the period ended March 28, 2020, and the related notes and financial statement schedule listed in the Index at Item 15(a)(2) (collectively referred to as the “consolidated financial statements”). In our opinion, the consolidated financial statements present fairly, in all material respects, the financial position of the Company at March 28, 2020 and March 30, 2019, and the results of its operations and its cash flows for each of the three years in the period ended March 28, 2020, in conformity with U.S. generally accepted accounting principles.
We also have audited, in accordance with the standards of the Public Company Accounting Oversight Board (United States) (PCAOB), the Company's internal control over financial reporting as of March 28, 2020, based on criteria established in Internal Control-Integrated Framework issued by the Committee of Sponsoring Organizations of the Treadway Commission (2013 framework) and our report dated May 8, 2020 expressed an unqualified opinion thereon.
Basis for Opinion
These financial statements are the responsibility of the Company's management. Our responsibility is to express an opinion on the Company’s financial statements based on our audits. We are a public accounting firm registered with the PCAOB and are required to be independent with respect to the Company in accordance with the U.S. federal securities laws and the applicable rules and regulations of the Securities and Exchange Commission and the PCAOB.
We conducted our audits in accordance with the standards of the PCAOB. Those standards require that we plan and perform the audit to obtain reasonable assurance about whether the financial statements are free of material misstatement, whether due to error or fraud. Our audits included performing procedures to assess the risks of material misstatement of the financial statements, whether due to error or fraud, and performing procedures that respond to those risks. Such procedures included examining, on a test basis, evidence regarding the amounts and disclosures in the financial statements. Our audits also included evaluating the accounting principles used and significant estimates made by management, as well as evaluating the overall presentation of the financial statements. We believe that our audits provide a reasonable basis for our opinion.
Critical Audit Matters
The critical audit matters communicated below are matters arising from the current period audit of the financial statements that were communicated or required to be communicated to the audit committee and that: (1) relate to accounts or disclosures that are material to the financial statements and (2) involved our especially challenging, subjective or complex judgments. The communication of critical audit matters does not alter in any way our opinion on the consolidated financial statements, taken as a whole, and we are not, by communicating the critical audit matters below, providing separate opinions on the critical audit matters or on the accounts or disclosures to which they relate.
82
|
Inventory Valuation
|
|
|
Description of the Matter
|
At March 28, 2020, the Company’s inventory balance was $304 million. As discussed in Note 2 to the consolidated financial statements, the Company assesses the valuation of inventories, including raw materials, work-in-process, and finished goods, in each reporting period. Obsolete inventory or inventory in excess of management’s forecasted demand is written down to its estimated net realizable value if less than cost.
Auditing management’s estimates for excess and obsolete inventory involved subjective auditor judgment because the estimates rely on a number of factors that are affected by market and economic conditions outside the Company’s control. In particular, the excess and obsolete inventory calculations are sensitive to significant assumptions, including forecasted demand for the Company’s products.
|
|
How We Addressed the Matter in Our Audit
|
We obtained an understanding, evaluated the design, and tested the operating effectiveness of internal controls over the Company's excess and obsolete inventory reserve process. This included controls over management's assessment of the forecasted demand for their products and the completeness and accuracy of the data underlying the excess and obsolete inventory valuation.
Our audit procedures included, among others, evaluating the significant assumptions including forecasted demand for the Company’s products and consideration of factors that affect forecasted demand (e.g., technology changes, new product introductions, expected economic and market conditions, possible alternative uses of inventory, and changes in strategic direction). We evaluated inventory levels compared to forecasted demand and historical sales and specific product considerations such as technology changes or alternative uses, and we tested the accuracy and completeness of underlying data used in management’s excess and obsolete inventory valuation assessment. We also assessed the historical accuracy of management’s estimates and performed sensitivity analyses over the significant assumptions to evaluate the changes in the excess and obsolete inventory estimates that would result from changes in the underlying assumptions.
|
83
|
Accounting for acquisition of Solarflare Communications, Inc.
|
|
|
Description of the Matter
|
As described in Note 20 to the consolidated financial statements, the Company completed its acquisition of Solarflare Communications, Inc. (“Solarflare”) for total purchase consideration of approximately $400 million during the year ended March 28, 2020. The transaction was accounted for as a business combination.
Auditing the Company's accounting for its acquisition of Solarflare was complex due to the significant estimation required by management to determine the fair value of identified intangible assets of $106 million, primarily related to developed technology, customer relationships, and in-process research and development. The significant estimation was primarily due to the sensitivity of the respective fair values to underlying assumptions about the future performance of the acquired business. The Company used a discounted cash flow model to measure the developed technology, customer relationships, and in-process research and development intangible assets. The significant assumptions used to estimate the value of the intangible assets included discount rates and certain assumptions that form the basis of the forecasted results including revenue growth rates, technology migration curves, royalty rates and customer attrition rates. These assumptions are forward looking and could be affected by future economic and market conditions.
|
|
How We Addressed the Matter in Our Audit
|
We obtained an understanding, evaluated the design and tested the operating effectiveness of internal controls over the Company’s process for accounting for the acquisition. For example, we tested controls over management’s review of the valuation of intangible assets, including the review of the valuation model and significant assumptions used in the valuation.
To test the estimated fair value of the developed technology, customer relationships, and in-process research and development intangible assets, we performed audit procedures that included, among others, evaluating the Company's selection of the valuation methodology, evaluating significant assumptions used by the Company including discount rates, revenue growth rates, technology migration curves, royalty rates and customer attrition rates, and performing sensitivity analyses over the significant assumptions to evaluate the change in fair values resulting from changes in the assumptions. For example, we compared the significant assumptions to current industry, market and economic trends and historical results of the acquired business. We tested the completeness and accuracy of the underlying data used in the valuation. We also involved our valuation specialists to assist with our evaluation of the valuation methodology and significant assumptions used by the Company.
|
/s/ Ernst & Young LLP
We have served as the Company’s auditor since 1984.
San Jose, California
May 8, 2020
84
REPORT OF INDEPENDENT REGISTERED PUBLIC ACCOUNTING FIRM
To the Stockholders and the Board of Directors of Xilinx, Inc.
Opinion on Internal Control over Financial Reporting
We have audited Xilinx, Inc.'s internal control over financial reporting as of March 28, 2020, based on criteria established in Internal Control-Integrated Framework issued by the Committee of Sponsoring Organizations of the Treadway Commission (2013 framework) (the COSO criteria). In our opinion, Xilinx, Inc. (the Company) maintained, in all material respects, effective internal control over financial reporting as of March 28, 2020, based on the COSO criteria.
We also have audited, in accordance with the standards of the Public Company Accounting Oversight Board (United States) (PCAOB), the consolidated balance sheets of the Company as of March 28, 2020 and March 30, 2019, the related consolidated statements of income, comprehensive income, stockholders' equity and cash flows for each of the three years in the period ended March 28, 2020, and the related notes and financial statement schedule listed in the Index at Item 15(a)(2) and our report dated May 8, 2020 expressed an unqualified opinion thereon.
Basis for Opinion
The Company’s management is responsible for maintaining effective internal control over financial reporting and for its assessment of the effectiveness of internal control over financial reporting included in the accompanying Management's Report on Internal Control Over Financial Reporting. Our responsibility is to express an opinion on the Company’s internal control over financial reporting based on our audit. We are a public accounting firm registered with the PCAOB and are required to be independent with respect to the Company in accordance with the U.S. federal securities laws and the applicable rules and regulations of the Securities and Exchange Commission and the PCAOB.
We conducted our audit in accordance with the standards of the PCAOB. Those standards require that we plan and perform the audit to obtain reasonable assurance about whether effective internal control over financial reporting was maintained in all material respects.
Our audit included obtaining an understanding of internal control over financial reporting, assessing the risk that a material weakness exists, testing and evaluating the design and operating effectiveness of internal control based on the assessed risk, and performing such other procedures as we considered necessary in the circumstances. We believe that our audit provides a reasonable basis for our opinion.
Definition and Limitations of Internal Control over Financial Reporting
A company’s internal control over financial reporting is a process designed to provide reasonable assurance regarding the reliability of financial reporting and the preparation of financial statements for external purposes in accordance with generally accepted accounting principles. A company’s internal control over financial reporting includes those policies and procedures that (1) pertain to the maintenance of records that, in reasonable detail, accurately and fairly reflect the transactions and dispositions of the assets of the company; (2) provide reasonable assurance that transactions are recorded as necessary to permit preparation of financial statements in accordance with generally accepted accounting principles, and that receipts and expenditures of the company are being made only in accordance with authorizations of management and directors of the company; and (3) provide reasonable assurance regarding prevention or timely detection of unauthorized acquisition, use, or disposition of the company’s assets that could have a material effect on the financial statements.
Because of its inherent limitations, internal control over financial reporting may not prevent or detect misstatements. Also, projections of any evaluation of effectiveness to future periods are subject to the risk that controls may become inadequate because of changes in conditions, or that the degree of compliance with the policies or procedures may deteriorate.
/s/ Ernst & Young LLP
San Jose, California
May 8, 2020
85
XILINX, INC.
SCHEDULE II
VALUATION AND QUALIFYING ACCOUNTS
|
(In thousands)
|
|
|
||||||||||||||
|
Description
|
Beginning
of Year |
Additions
|
Deductions
|
End of Year
|
||||||||||||
|
For the year ended March 31, 2018:
|
|
|
|
|
||||||||||||
|
Allowance for doubtful accounts
|
$
|
|
|
$
|
|
|
$
|
|
|
$
|
|
|
||||
|
Valuation allowance for deferred tax assets
|
$
|
|
|
$
|
|
|
$
|
|
|
$
|
|
|
||||
|
For the year ended March 30, 2019:
|
|
|
|
|
||||||||||||
|
Allowance for doubtful accounts
|
$
|
|
|
$
|
|
|
$
|
|
|
$
|
|
|
||||
|
Valuation allowance for deferred tax assets
|
$
|
|
|
$
|
|
|
$
|
|
|
$
|
|
|
||||
|
For the year ended March 28, 2020:
|
|
|
|
|
||||||||||||
|
Allowance for doubtful accounts
|
$
|
|
|
$
|
|
|
$
|
|
|
$
|
|
|
||||
|
Valuation allowance for deferred tax assets
|
$
|
|
|
$
|
|
|
$
|
|
|
$
|
|
|
||||
Supplementary Financial Data
Quarterly Data (Unaudited)
|
(In thousands, except per share amounts)
|
||||||||||||||||
|
Year ended March 28, 2020
(1)
|
First
Quarter |
Second
Quarter |
Third
Quarter |
Fourth
Quarter |
||||||||||||
|
Net revenues
|
$
|
|
|
$
|
|
|
$
|
|
|
$
|
|
|
||||
|
Gross margin
|
|
|
|
|
|
|
|
|
||||||||
|
Income before income taxes
|
|
|
|
|
|
|
|
|
||||||||
|
Net income
|
|
|
|
|
|
|
|
|
||||||||
|
Net income per common share:
(2)
|
|
|
|
|
||||||||||||
|
Basic
|
$
|
|
|
$
|
|
|
$
|
|
|
$
|
|
|
||||
|
Diluted
|
$
|
|
|
$
|
|
|
$
|
|
|
$
|
|
|
||||
|
Shares used in per share calculations:
|
|
|
|
|
||||||||||||
|
Basic
|
|
|
|
|
|
|
|
|
||||||||
|
Diluted
|
|
|
|
|
|
|
|
|
||||||||
|
Cash dividends declared per common share
|
$
|
|
|
$
|
|
|
$
|
|
|
$
|
|
|
||||
|
(1)
|
Xilinx uses a
52
- to
53
-week fiscal year ending on the Saturday nearest March 31. Fiscal
2020
was a 52-week year and each quarter was a
13
-week quarter.
|
|
(2)
|
Net income per common share is computed independently for each of the quarters presented. Therefore, the sum of the quarterly per common share information may not equal the annual net income per common share.
|
86
|
(In thousands, except per share amounts)
|
||||||||||||||||
|
Year ended March 30, 2019
|
First
Quarter |
Second
Quarter |
Third
Quarter |
Fourth
Quarter |
||||||||||||
|
Net revenues
|
$
|
|
|
$
|
|
|
$
|
|
|
$
|
|
|
||||
|
Gross margin
|
|
|
|
|
|
|
|
|
||||||||
|
Income before income taxes
|
|
|
|
|
|
|
|
|
||||||||
|
Net income (loss)
|
|
|
|
|
|
|
|
|
||||||||
|
Net income (loss) per common share: (2)
|
|
|
|
|
||||||||||||
|
Basic
|
$
|
|
|
$
|
|
|
$
|
|
|
$
|
|
|
||||
|
Diluted
|
$
|
|
|
$
|
|
|
$
|
|
|
$
|
|
|
||||
|
Shares used in per share calculations:
|
|
|
|
|
||||||||||||
|
Basic
|
|
|
|
|
|
|
|
|
||||||||
|
Diluted
|
|
|
|
|
|
|
|
|
||||||||
|
Cash dividends declared per common share
|
$
|
|
|
$
|
|
|
$
|
|
|
$
|
|
|
||||
|
(1)
|
Xilinx uses a 52- to 53-week fiscal year ending on the Saturday nearest March 31. Fiscal
2019
was a 52-week year and each quarter was a 13-week quarter.
|
|
(2)
|
Net income per common share is computed independently for each of the quarters presented. Therefore, the sum of the quarterly per common share information may not equal the annual net income per common share.
|
|
ITEM 9.
|
CHANGES IN AND DISAGREEMENTS WITH ACCOUNTANTS ON ACCOUNTING AND FINANCIAL DISCLOSURE
|
Not applicable.
87
|
ITEM 9A.
|
CONTROLS AND PROCEDURES
|
Evaluation of Disclosure Controls and Procedures
An evaluation was carried out, under the supervision of and with the participation of the Company's management, including our principal executive officer (PEO), who also serves as our principal financial officer (PFO), collectively referred to herein as the PEO/PFO, of the effectiveness of the Company's disclosure controls and procedures (as defined in Rules 13a-15(e) and 15d-15(e) under the Exchange Act) as of the end of the period covered by this report. Based upon this evaluation, our PEO/PFO has concluded that, as of the end of the period covered by this Form 10-K, the Company's disclosure controls and procedures are effective to provide reasonable assurance that information required to be disclosed in our Exchange Act reports is recorded, processed, summarized and reported within the time periods specified in the SEC rules and forms, and is accumulated and communicated to our management, including our PEO/PFO, as appropriate to allow timely decisions regarding required disclosure.
Changes in Internal Control Over Financial Reporting
There were no changes in our internal control over financial reporting (as defined in Rules 13a-15(f) and 15d-15(f) under the Exchange Act) during the fiscal quarter ended
March 28, 2020
that materially affected, or are reasonably likely to materially affect, our internal control over financial reporting.
Management's Report on Internal Control Over Financial Reporting
Management is responsible for establishing and maintaining adequate internal control over financial reporting (as defined in Rules 13a-15(f) and 15d-15(f) under the Exchange Act) to provide reasonable assurance regarding the reliability of financial reporting and the preparation of financial statements for external purposes in accordance with U.S. generally accepted accounting principles. This system of internal control is designed to provide reasonable assurance that assets are safeguarded and transactions are properly recorded and executed in accordance with management's authorization. The design, monitoring and revision of the system of internal control over financial reporting involve, among other things, management's judgments with respect to the relative cost and expected benefits of specific control measures. The effectiveness of the system of internal control over financial reporting is supported by the selection, retention and training of qualified personnel and an organizational structure that provides an appropriate division of responsibility and formalized procedures. The system of internal control is periodically reviewed and modified in response to changing conditions.
Because of its inherent limitations, no matter how well designed, a system of internal control over financial reporting can provide only reasonable assurance and may not prevent or detect all misstatements or all fraud. Further, because of changes in conditions, the effectiveness of internal control over financial reporting may vary over time. Our system contains self-monitoring mechanisms, and actions are taken to correct deficiencies as they are identified.
Management has used the criteria established in the Report "
Internal Control — Integrated Framework"
issued by the Committee of Sponsoring Organizations of the Treadway Commission (COSO) (2013 Framework) to evaluate the effectiveness of our internal control over financial reporting. Based on this evaluation, management has concluded that the Company's internal control over financial reporting was effective as of
March 28, 2020
.
The effectiveness of the Company's internal control over financial reporting as of
March 28, 2020
has been audited by Ernst & Young LLP, an independent registered public accounting firm, as stated in their report which is included in Part II, Item 8 of this Form 10-K.
|
ITEM 9B.
|
OTHER INFORMATION
|
None.
88
Certain information required by Part III is omitted from this Report in that the Registrant will file a definitive proxy statement pursuant to Regulation 14A under the Exchange Act (the Proxy Statement) not later than 120 days after the end of the fiscal year covered by this Report, and certain information included therein is incorporated herein by reference. Only those sections of the Proxy Statement that specifically address the items set forth herein are incorporated by reference.
|
ITEM 10.
|
DIRECTORS, EXECUTIVE OFFICERS AND CORPORATE GOVERNANCE
|
The information required by this item pursuant to Item 401(b), (d), (e) and (f) of Regulation S-K concerning the Company's executive officers is incorporated herein by reference to Item 1. "Business — Executive Officers of the Registrant" within this Form 10-K.
The information required by this item pursuant to Item 401(a), (d), (e), and (f) and Items 406 and 407 of Regulation S-K concerning the Company's directors, the code of ethics and corporate governance matters is incorporated herein by reference to the sections entitled "Proposal One — Election of Directors" "Board Independence" and "Corporate Governance Principles" in our Proxy Statement.
|
ITEM 11.
|
EXECUTIVE COMPENSATION
|
The information required by this item pursuant to Item 402 of Regulation S-K concerning executive compensation is incorporated herein by reference to the sections entitled "Compensation of Directors" and "Executive Compensation" in our Proxy Statement.
The information required by this item pursuant to Item 407(e)(4) of Regulation S-K is incorporated herein by reference to the section entitled "Compensation Committee Interlocks and Insider Participation" in our Proxy Statement.
The information required by this item pursuant to Item 407(e)(5) of Regulation S-K is incorporated herein by reference to the section entitled "Compensation Committee Report" in our Proxy Statement.
|
ITEM 12.
|
SECURITY OWNERSHIP OF CERTAIN BENEFICIAL OWNERS AND MANAGEMENT AND RELATED STOCKHOLDER MATTERS
|
The information required by this item pursuant to Item 403 of Regulation S-K is incorporated herein by reference to the section entitled "Security Ownership of Certain Beneficial Owners and Management" in our Proxy Statement. The information required by Item 201(d) of Regulation S-K is set forth below.
Equity Compensation Plan Information
The table below sets forth certain information as of fiscal year ended
March 28, 2020
about the Company's common stock that may be issued upon the exercise of options, RSUs, warrants and rights under all of our existing equity compensation plans including the ESPP:
|
(Shares in thousands)
|
A
|
|
B
|
|
C
|
|
|||||
|
Plan Category
|
Number of Securities to be Issued upon
Exercise of Outstanding Options, Warrants and Rights |
|
Weighted-average
Exercise Price of Outstanding Options, Warrants and Rights |
|
Number of Securities Remaining
Available for Future Issuance under Equity Compensation Plans (excluding securities reflected in Column A) |
|
|||||
|
Equity Compensation Plans Approved by Security Holders
|
|||||||||||
|
2007 Equity Plan
|
6,668
|
|
(1)
|
$
|
—
|
|
(2)
|
15,049
|
|
(3)
|
|
|
Employee Stock Purchase Plan
|
N/A
|
|
|
N/A
|
|
|
12,644
|
|
|
||
|
Total-Approved Plans
|
6,668
|
|
|
$
|
—
|
|
|
27,693
|
|
|
|
|
Equity Compensation Plans Not Approved by Security Holders
|
—
|
|
$
|
—
|
|
—
|
|
||||
|
Total-All Plans
|
6,668
|
|
|
$
|
—
|
|
|
27,693
|
|
|
|
|
(1)
|
Includes approximately 6.7 million shares issuable upon vesting of RSUs that the Company granted under the 2007 Equity Plan.
|
89
|
(2)
|
No outstanding options, warrants and rights exist as of fiscal year ended
March 28, 2020
.
|
|
(3)
|
On July 26, 2006, the stockholders approved the adoption of the 2007 Equity Plan and authorized 10.0 million shares to be reserved for issuance thereunder. The 2007 Equity Plan, which became effective on January 1, 2007, replaced both the Company's 1997 Stock Plan (which expired on May 8, 2007) and the Supplemental Stock Option Plan. On August 9, 2007, August 14, 2008, August 12, 2009, August 11, 2010, August 10, 2011, August 8, 2012, August 14, 2013, August 13, 2014, August 10, 2016, August 9, 2017, August 1, 2018, and August 8, 2019, our stockholders authorized the reserve of an additional 5.0 million shares, 4.0 million shares, 5.0 million shares, 4.5 million shares, 4.5 million shares, 3.5 million shares, 2.0 million shares, 3.0 million shares, 2.5 million shares, 1.9 million shares, 3.0 million shares, and 6.0 million shares respectively. All of the shares reserved for issuance under the 2007 Equity Plan may be granted as stock options, stock appreciation rights, restricted stock or RSUs.
|
|
ITEM 13.
|
CERTAIN RELATIONSHIPS AND RELATED TRANSACTIONS, AND DIRECTOR INDEPENDENCE
|
The information required by this item concerning related party transactions pursuant to Item 404 of Regulation S-K is incorporated herein by reference to the section entitled "Related Transactions" in our Proxy Statement.
The information required by this item concerning director independence pursuant to Item 407(a) of Regulation S-K is incorporated herein by reference to the section entitled "Board Independence" in our Proxy Statement.
|
ITEM 14.
|
PRINCIPAL ACCOUNTANT FEES AND SERVICES
|
The information required by this Item is incorporated herein by reference to the sections entitled "Proposal Three — Ratification of Appointment of External Auditors" and "Fees Paid to Ernst & Young LLP" in our Proxy Statement.
90
|
ITEM 15.
|
EXHIBIT AND FINANCIAL STATEMENT SCHEDULES
|
|
(a)
|
(1)
|
The financial statements required by Item 15(a) are included in Item 8 of this Annual Report on Form 10-K.
|
|
(2)
|
The financial statement schedule required by Item 15(a) (Schedule II, Valuation and Qualifying Accounts) is included in Item 8 of this Annual Report on Form 10-K.
|
|
|
Schedules not filed have been omitted because they are not applicable, are not required or the information required to be set forth therein is included in the financial statements or notes thereto.
|
||
|
(3)
|
The exhibits listed below in (b) are filed or incorporated by reference as part of this Annual Report on Form 10-K.
|
|
|
(b)
|
Exhibits
|
|
EXHIBIT LIST
|
|
Incorporated by Reference
|
|||||||||||||
|
Exhibit No
|
|
Exhibit Title
|
Form
|
File No.
|
Exhibit
|
Filing
Date
|
Filed
Herewith
|
|||||||
|
3.1
|
|
10-K
|
000-18548
|
3.1
|
|
5/30/2007
|
||||||||
|
3.2
|
|
8-K
|
000-18548
|
3.2
|
|
12/7/2018
|
||||||||
|
4.1
|
|
|
X
|
|||||||||||
|
4.2
|
|
10-K
|
000-18548
|
4.1
|
|
5/30/2007
|
||||||||
|
4.3
|
|
10-Q
|
000-18548
|
4.2
|
|
8/9/2010
|
||||||||
|
4.4
|
|
S-3
|
333-143769
|
4.4
|
|
6/15/2007
|
||||||||
|
4.5
|
|
8-K
|
000-18548
|
4.01
|
|
3/13/2014
|
||||||||
|
4.6
|
|
8-K
|
000-18548
|
4.01
|
|
5/30/2017
|
||||||||
|
4.7
|
|
8-K
|
000-18548
|
99.1
|
|
9/1/2017
|
||||||||
|
10.1
|
|
*
|
DEF 14A
|
000-18548
|
Appendix A
|
|
6/21/2019
|
|||||||
|
10.2
P
|
|
*
|
Form of Indemnification Agreement between the Company and its officers and directors
|
S-1
|
333-34568
|
10.17
|
|
4/27/1990
|
||||||
|
10.3
|
|
*
|
DEF 14A
|
000-18548
|
Appendix B
|
|
6/21/2019
|
|||||||
91
|
|
Incorporated by Reference
|
|||||||||||||
|
Exhibit No
|
|
Exhibit Title
|
Form
|
File No.
|
Exhibit
|
Filing
Date
|
Filed
Herewith
|
|||||||
|
10.4
|
|
*
|
10-K
|
000-18548
|
10.24
|
|
5/30/2007
|
|||||||
|
10.5
|
|
*
|
10-K
|
000-18548
|
10.25
|
|
5/30/2007
|
|||||||
|
10.6
|
|
*
|
|
10-Q
|
000-18548
|
10.1
|
|
7/26/2019
|
|
|||||
|
10.7
|
|
*
|
10-Q
|
000-18548
|
10.15
|
|
8/9/2011
|
|
||||||
|
10.8
|
|
*
|
10-Q
|
000-18548
|
10.16
|
|
8/9/2011
|
|||||||
|
10.9
|
|
+
|
10-K
|
000-18548
|
10.18
|
|
5/16/2014
|
|||||||
|
10.10
|
|
*
|
8-K
|
000-18548
|
N/A
|
|
5/13/2019
|
|||||||
|
10.11
|
|
*
|
8-K
|
000-18548
|
10.2
|
|
1/20/2016
|
|||||||
|
10.12
|
|
*
|
8-K
|
000-18548
|
10.1
|
|
4/12/2017
|
|||||||
|
10.13
|
|
10-K
|
000-18548
|
10.15
|
|
5/15/2017
|
||||||||
|
10.14
|
|
+
|
10-K
|
000-18548
|
10.16
|
|
5/15/2017
|
|||||||
|
10.15
|
|
+
|
10-K
|
000-18548
|
10.17
|
|
5/15/2017
|
|||||||
|
10.16
|
|
10-K
|
000-18548
|
10.18
|
|
5/15/2017
|
||||||||
|
10.17
|
|
+
|
10-Q
|
000-18548
|
10.1
|
|
7/28/2017
|
|||||||
|
10.18
|
|
8-K
|
000-18548
|
10.1
|
|
1/5/2018
|
||||||||
|
10.19
|
|
+
|
10-Q
|
000-18548
|
10.1
|
|
10/25/2019
|
|||||||
|
10.20
|
|
|
X
|
|||||||||||
|
21.1
|
|
|
|
|
|
|
|
X
|
||||||
|
23.1
|
|
|
|
|
|
|
|
X
|
||||||
|
24.1
|
|
|
Power of Attorney (included in the signature page)
|
|
|
|
|
|
X
|
|||||
92
|
|
Incorporated by Reference
|
|||||||||||||
|
Exhibit No
|
|
Exhibit Title
|
Form
|
File No.
|
Exhibit
|
Filing
Date
|
Filed
Herewith
|
|||||||
|
31.1
|
|
|
|
|
|
|
|
X
|
||||||
|
31.2
|
|
|
|
|
|
|
|
X
|
||||||
|
32.1
|
|
|
|
|
|
|
|
X
|
||||||
|
32.2
|
|
|
|
|
|
|
X
|
|||||||
|
101.INS
|
|
XBRL Instance Document
|
|
|
|
|
X
|
|||||||
|
101.SCH
|
|
XBRL Taxonomy Extension Schema Document
|
|
|
|
|
X
|
|||||||
|
101.CAL
|
|
XBRL Taxonomy Extension Calculation Linkbase Document
|
|
|
|
|
X
|
|||||||
|
101.LAB
|
|
XBRL Taxonomy Extension Label Linkbase Document
|
|
|
|
|
X
|
|||||||
|
101.PRE
|
|
XBRL Taxonomy Extension Presentation Linkbase Document
|
|
|
|
|
X
|
|||||||
|
101.DEF
|
|
XBRL Taxonomy Extension Definition Linkbase Document
|
|
|
|
|
X
|
|||||||
|
104
|
|
Cover Page Interactive Data File (formatted as Inline XBRL and contained in Exhibit 101)
|
X
|
|||||||||||
|
+
|
Portions of this Exhibit have been omitted pursuant to a request for confidential treatment.
|
|
|
*
|
Management contract or compensatory plan or arrangement.
|
|
|
P
|
Filed on Paper
|
|
93
None.
SIGNATURES
Pursuant to the requirements of Section 13 or 15(d) of the Securities Exchange Act of 1934, the Registrant has duly caused this report to be signed on its behalf by the undersigned, thereunto duly authorized.
Date: May 8, 2020
|
|
XILINX, INC.
|
||
|
|
By:
|
/s/ Victor Peng
|
|
|
|
|
Victor Peng
|
|
|
|
|
President and Chief Executive Officer
|
|
94
POWER OF ATTORNEY
KNOW ALL PERSONS BY THESE PRESENTS, that each person whose signature appears below constitutes and appoints Victor Peng and Sumeet Gagneja, jointly and severally, his/her attorneys-in-fact, each with the power of substitution, for him/her in any and all capacities, to sign any amendments to this Annual Report on Form 10-K, and to file the same, with exhibits thereto and other documents in connection therewith, with the Securities and Exchange Commission, hereby ratifying and confirming all that each of said attorneys-in-fact, or his substitute or substitutes, may do or cause to be done by virtue hereof.
Pursuant to the requirements of the Securities Exchange Act of 1934, this Annual Report on Form 10-K has been signed below by the following persons on behalf of the Registrant in the capacities and on the dates indicated.
|
Signature
|
Title
|
Date
|
||
|
/s/ Victor Peng
|
President and Chief Executive Officer
(Principal Executive Officer and Principal Financial Officer) and Director
|
May 8, 2020
|
||
|
(Victor Peng)
|
||||
|
/s/ Sumeet Gagneja
|
Chief Accounting Officer
(Principal Accounting Officer)
|
May 8, 2020
|
||
|
(Sumeet Gagneja)
|
||||
|
/s/ Dennis Segers
|
Chairman of the Board of Directors
|
May 8, 2020
|
||
|
(Dennis Segers)
|
|
|
||
|
/s/ Raman K. Chitkara
|
Director
|
May 8, 2020
|
||
|
(Raman K. Chitkara)
|
||||
|
/s/ Saar Gillai
|
Director
|
May 8, 2020
|
||
|
(Saar Gillai)
|
||||
|
/s/ Ronald S. Jankov
|
Director
|
May 8, 2020
|
||
|
(Ronald S. Jankov)
|
||||
|
/s/ Mary Louise Krakauer
|
Director
|
May 8, 2020
|
||
|
(Mary Louise Krakauer)
|
||||
|
/s/ Thomas H. Lee
|
Director
|
May 8, 2020
|
||
|
(Thomas H. Lee)
|
||||
|
/s/ J. Michael Patterson
|
Director
|
May 8, 2020
|
||
|
(J. Michael Patterson)
|
||||
|
/s/ Marshall C. Turner
|
Director
|
May 8, 2020
|
||
|
(Marshall C. Turner)
|
||||
|
/s/ Elizabeth W. Vanderslice
|
Director
|
May 8, 2020
|
||
|
(Elizabeth W. Vanderslice)
|
||||
95
TABLE OF CONTENTS
Part IItem 1. BusinessItem 1A. Risk FactorsItem 1B. Unresolved Staff CommentsItem 2. PropertiesItem 3. Legal ProceedingsItem 4. Mine Safety DisclosuresPart IIItem 5. Market For Registrant's Common Equity, Related Stockholder Matters and Issuer Purchases Of Equity SecuritiesItem 6. Selected Financial DataItem 7. Management's Discussion and Analysis Of Financial Condition and Results Of OperationsItem 7A. Quantitative and Qualitative Disclosures About Market RiskItem 8. Financial Statements and Supplementary DataNote 1. Nature Of OperationsNote 2. Summary Of Significant Accounting Policies and Concentrations Of RiskNote 3. Fair Value MeasurementsNote 4. Financial InstrumentsNote 5. Derivative Financial InstrumentsNote 6. Stock-based Compensation PlansNote 7. Supplemental Financial InformationNote 8. Leases and CommitmentsNote 9. Net Income Per Common ShareNote 10. Interest and Other Income (expense), NetNote 11. Accumulated Other Comprehensive LossNote 12. Debt and Credit FacilityNote 13. Stockholders' EquityNote 14. Income TaxesNote 15. Segment InformationNote 16. Litigation Settlements and ContingenciesNote 17. Goodwill and Acquisition-related IntangiblesNote 18. Employee Benefit PlansNote 19. Restructuring Charges and Executive Transition CostsNote 20. Business CombinationsNote 21. Subsequent EventItem 9. Changes in and Disagreements with Accountants on Accounting and Financial DisclosureItem 9A. Controls and ProceduresItem 9B. Other InformationPart IIIItem 10. Directors, Executive Officers and Corporate GovernanceItem 11. Executive CompensationItem 12. Security Ownership Of Certain Beneficial Owners and Management and Related Stockholder MattersItem 13. Certain Relationships and Related Transactions, and Director IndependenceItem 14. Principal Accountant Fees and ServicesPart IVItem 15. Exhibit and Financial Statement SchedulesItem 16. Form 10-k Summary