XYLEM INC.
10-Ks and 10-Qs
|
|
|
|
|
|
|
|
|
|
|
|
|
|
|
|
|
|
|
|
|
|
|
|
|
|
|
|
|
|
|
|
|
|
|
|
|
|
|
|
|
|
|
|
UNITED STATES SECURITIES AND EXCHANGE COMMISSION
WASHINGTON, D.C. 20549
FORM 10-K
(Mark One)
|
þ
|
|
ANNUAL REPORT PURSUANT TO SECTION 13 OR 15(d) OF THE
SECURITIES EXCHANGE ACT OF 1934
|
|
|
|
|
For the fiscal year ended December 31, 2013
|
|
||
|
|
or
|
|
||
|
¨
|
|
TRANSITION REPORT PURSUANT TO SECTION 13 OR 15(d) OF THE
SECURITIES EXCHANGE ACT OF 1934
|
|
|
For the transition period from to
Commission file number: 1-35229
Xylem Inc.
(Exact name of registrant as specified in its charter)
|
Indiana
|
|
45-2080495
|
|
(State or other jurisdiction of incorporation or
organization)
|
|
(I.R.S. Employer Identification No.)
|
|
1 International Drive, Rye Brook, NY 10573
|
||
|
(address of principal executive offices and zip code)
|
||
|
(914) 323-5700
|
||
|
(Registrant's telephone number, including area code)
|
||
|
Securities registered pursuant to Section 12(b) of the Act:
|
||
|
Title of each class
|
|
Name of each exchange on which registered
|
|
Common Stock, par value $0.01 per share
|
|
New York Stock Exchange
|
|
Securities registered pursuant to Section 12(g) of the Act: None
|
||
Indicate by check mark if the registrant is a well-known seasoned issuer, as defined in Rule 405 of the Securities Act. Yes
þ
No
¨
Indicate by check mark if the registrant is not required to file reports pursuant to Section 13 or Section 15(d) of the Act. Yes
¨
No
þ
Indicate by check mark whether the registrant (1) has filed all reports required to be filed by Section 13 or 15(d) of the Securities Exchange Act of 1934 during the preceding 12 months (or for such shorter period that the registrant was required to file such reports), and (2) has been subject to such filing requirements for the past 90 days. Yes
þ
No
¨
Indicate by check mark whether the registrant has submitted electronically and posted on its corporate Website, if any, every Interactive Data File required to be submitted and posted pursuant to Rule 405 of Regulation S-T (§232.405 of this chapter) during the preceding 12 months (or for such shorter period that the registrant was required to submit and post such files). Yes
þ
No
¨
Indicate by check mark if disclosure of delinquent filers pursuant to Item 405 of Regulation S-K is not contained herein, and will not be contained, to the best of registrant’s knowledge, in definitive proxy or information statements incorporated by reference in Part III of this Form 10-K or any amendment to this Form 10-K.
¨
Indicate by check mark whether the registrant is a large accelerated filer, an accelerated filer, a non-accelerated filer, or a smaller reporting company. See definitions of “large accelerated filer,” “accelerated filer,” and “smaller reporting company” in Rule 12b-2 of the Exchange Act. (Check one):
Large Accelerated Filer
þ
Accelerated Filer
¨
Non-Accelerated Filer
¨
Smaller reporting company
¨
(Do not check if a smaller reporting company)
Indicate by check mark whether the registrant is a shell company (as defined in Rule 12b-2 of the Act). Yes
¨
No
þ
The aggregate market value of the common stock of the registrant held by non-affiliates of the registrant as of June 30,
2013
was approximately $
5.0 billion
. As of January 31,
2014
, there were
184,681,473
outstanding shares of the registrant’s common stock, par value $0.01 per share.
DOCUMENTS INCORPORATED BY REFERENCE
The information required by Part III of this Report is incorporated herein by reference from the registrant’s definitive proxy statement relating to its annual meeting of shareholders to be held in May
2014
.
Xylem Inc.
ANNUAL REPORT ON FORM 10-K
For the fiscal year ended
December 31, 2013
Table of Contents
|
ITEM
|
PAGE
|
|
|
PART I
|
||
|
1
|
||
|
1A.
|
||
|
1B.
|
||
|
2
|
||
|
3
|
||
|
4
|
||
|
*
|
||
|
PART II
|
||
|
5
|
||
|
6
|
||
|
7
|
||
|
7A.
|
||
|
8
|
||
|
9
|
||
|
9A.
|
||
|
9B.
|
||
|
PART III
|
||
|
10
|
||
|
11
|
||
|
12
|
||
|
13
|
||
|
14
|
||
|
PART IV
|
||
|
15
|
||
|
*
|
Included pursuant to Instruction 3 of Item 401(b) of Regulation S-K.
|
2
The following discussion should be read in conjunction with the consolidated and combined financial statements, including the notes thereto, included in this Annual Report on Form 10-K (this "Report"). Xylem Inc. was incorporated in Indiana on May 4, 2011. Except as otherwise indicated or unless the context otherwise requires, “Xylem,” “we,” “us,” “our” and “the Company” refer to Xylem Inc. and its subsidiaries. References in the consolidated and combined financial statements to “ITT” or “parent” refers to ITT Corporation and its consolidated subsidiaries (other than Xylem Inc.), former parent of Xylem.
Forward-Looking Statements
This Report contains
“
forward-looking statements
”
within the meaning of the Private Securities Litigation Act of 1995 that are based on our current expectations and assumptions. Forward-looking statements by their nature address matters that are, to different degrees, uncertain. Generally, the words
“
anticipate,
”
“
estimate,
”
“
expect,
”
“
project,
”
“
intend,
”
“
plan,
”
“
strategy,
”
“
may,
”
“
will,
”
“
believe,
”
“
target
”
and similar expressions identify forward-looking statements, which generally are not historical in nature. However, the absence of these words or similar expressions does not mean that a statement is not forward-looking.
Forward-looking statements include, but are not limited to, statements about the capitalization of the Company, the Company's restructuring and realignment, our future strategic plans and other statements that describe the Company
’
s business strategy, outlook, objectives, plans, intentions or goals, and any discussion of future operating or financial performance. All statements that address performance, events or developments that we expect or anticipate will occur in the future
-
including statements relating to orders, sales, operating margins and earnings per share growth, cash flows, and statements expressing general views about future operating results
-
are forward-looking statements.
Caution should be taken not to place undue reliance on any such forward-looking statements because they involve risks, uncertainties and other factors that could cause actual results to differ materially from those expressed or implied in, or reasonably inferred from, such statements. The Company undertakes no obligation to publicly update or revise any forward-looking statements, whether as a result of new information, future events or otherwise, except as required by law. In addition, forward-looking statements are subject to certain risks and uncertainties that could cause actual results to differ materially from the Company
’
s historical experience and its present expectations or projections. These risks and uncertainties include, but are not limited to, those set forth below under
“
Item 1A. Risk Factors
”
and those described from time to time in subsequent filings with the U.S. Securities and Exchange Commission ("SEC").
Business Overview
Xylem, with
2013
revenue of
$3.8 billion
and more than 12,500 employees, is a world leader in the design, manufacturing, and application of highly engineered technologies for the water industry. We are a leading equipment and service provider for water and wastewater applications with a broad portfolio of products and services addressing the full cycle of water, from collection, distribution and use to the return of water to the environment. We have leading market positions among equipment and service providers in the core application areas of the water equipment industry: transport, treatment, test, building services, industrial processing and irrigation. Our Company’s brands, such as Bell & Gossett and Flygt, are well known throughout the industry and have served the water market for many years.
We serve a global customer base across diverse end markets while offering localized expertise. We sell our products in more than 150 countries through a balanced distribution network consisting of our direct sales force and independent channel partners. In
2013
,
62%
of our revenue was generated outside the United States, with
36%
of revenue generated in Europe.
We initiated an organizational redesign during the fourth quarter of 2013, shifting from individually managed businesses to an integrated approach within geographical regions. We expect that this will enable us to leverage the breadth of the Company’s product and services portfolio to better serve our customers and address market opportunities as well as effectively utilize internal support organizations to realize economies of scale and efficient use of resources. This organizational redesign has implications on how we will manage the business and the
3
related measurement system by which we will hold our management team accountable. We are in the process of changing our measurement system, including our underlying accounting system, which we expect to complete by the middle of 2014.
Our Industry
Our planet faces a serious water challenge. Less than 1% of the total water available on earth is fresh water, and this percentage is declining due to factors such as the draining of aquifers, increased pollution and climate change. In addition, demand for fresh water is rising rapidly due to population growth, industrial expansion, and increased agricultural development, with consumption estimated to double every 20 years. By 2025, more than 30% of the world’s population is expected to live in areas without adequate water supply. Even in developed countries with sufficient supply, existing infrastructure for water supply is relatively underfunded and aging. In the United States, degrading pipe systems leak one out of every six gallons of water, on average, on its way from a treatment plant to the customer. These challenges are driving opportunities for growth in the global water industry, which we estimate to have a total market size of approximately
$550 billion
.
The water industry supply chain is comprised of Equipment and Services companies, Design and Build service providers, and Water Utilities. Equipment and Service providers serve distinct customer types. The utilities type supply water through an infrastructure network. Companies that operate on this side of the supply chain provide single, or sometimes combined, functions from equipment manufacturing and services to facility design (engineering, procurement and construction, or “EPC” firms) to plant operations (utilities), as depicted below in Figure 1. The utility and EPC customers are looking for technology and application expertise from their Equipment and Services providers, due to trends such as rising pollution, stricter regulations, and the increased outsourcing of process knowledge. The customer type serves the end users of water and comprises a wide array of entities, including farms, mines, power plants, industrial facilities and residential homes. These customers are predominately served through specialized distributors and original equipment manufacturers (“OEMs”).
Figure 1: Water Industry Supply Chain
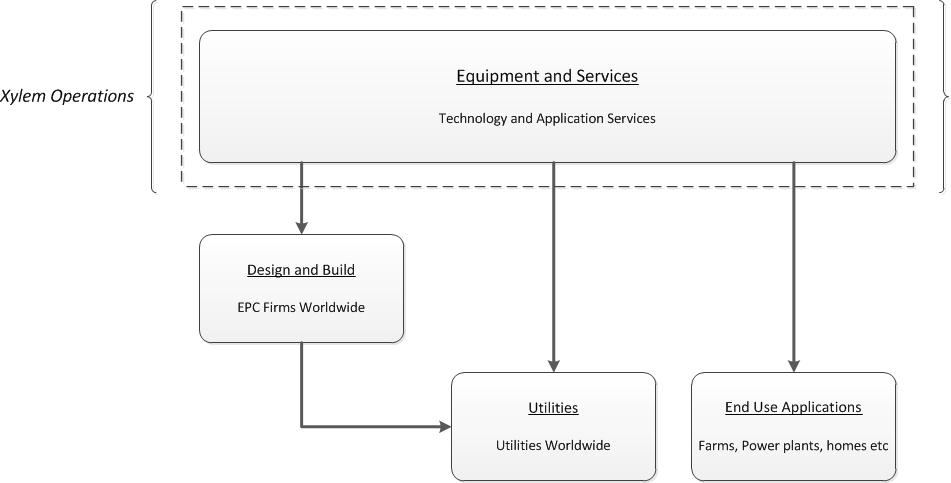
Our business focuses on the beginning of the supply chain by providing technology-intensive equipment and services. We sell our equipment and services via direct and indirect channels that serve the needs of each customer type. On the utility side, we provide the majority of our sales direct to customers with strong application expertise, with the remaining amount going through distribution partners. To end users of water, we provide the majority of our sales through long-standing relationships with the world’s leading distributors, with the remainder going direct to customers.
4
The Equipment and Services market addresses the key processes of the water industry, which are best illustrated through the cycle of water, as depicted in Figure 2, below. We believe this industry has two distinct sectors within the cycle of water: Water Infrastructure and Usage Applications. The key processes of this cycle begin when raw water is extracted by pumps, which provide the necessary pressure and flow, to move, or transport, this water from natural sources, such as oceans, ground water, lakes and rivers, through pipes to treatment facilities. Treatment facilities can provide many forms of treatment, such as filtration, disinfection and desalination, to remove solids, bacteria, and salt, respectively. Throughout each of these stages, analytical instruments test the treated water to ensure regulatory requirements are met so that it can be utilized by end-use customers. A network of pipes and pumps again transports this clean water to where it is needed, such as to crops for irrigation, to power plants to provide cooling in industrial water, or to an apartment building as drinking water in residential and commercial buildings. After usage, the wastewater is collected by a separate network of pipes and pumps and transported to a wastewater treatment facility, where processes such as digestion deactivate and reduce the volume of solids, and disinfection purifies effluent water. Once treated, analytical instruments test the treated water to ensure regulatory requirements are met so that it can be discharged back to the environment, thereby completing the cycle.
Figure 2: Cycle of Water

In the Water Infrastructure sector, two primary end markets exist: public utility and industrial. The public utility market comprises public, private and public-private institutions that handle water and wastewater for mostly residential and commercial purposes. The industrial market involves the supply of water and removal of wastewater for industrial facilities. We view the main macro drivers of this sector to be water quality, the desire for energy-efficient products, water scarcity, regulatory requirements and infrastructure needs, for both the repair of aging systems in developed countries as well as new installations in emerging markets.
In the Usage Applications sector, end-use customers fall into four main markets: residential, commercial, industrial and agricultural. Homeowners represent the end users in the residential market. Owners and managers of properties such as apartment buildings, retail stores, restaurants, hospitals, and hotels are examples of end users in the commercial market. The industrial market is wide ranging, involving developers and managers of facilities operated by electrical power generators, chemical manufacturers, machine shops, clothing manufacturers, beverage production and dispensing firms, and car washes. The agricultural market end users are owners and operators of businesses such as crop and livestock farms, aquaculture, golf courses, and other turf applications. We believe population growth, urbanization and regulatory requirements are the primary macro drivers of these markets, as these trends drive the need for housing, food, community services and retail goods within growing city centers. Water reuse and conservation are driving the need for new technologies.
5
Business Strategy
Our strategy is to enhance shareholder value by providing distinctive solutions for our customers' most important water challenges, enabling us to grow revenue, organically and through strategic acquisitions, as we streamline our cost structure. Key elements of our strategy are summarized below:
|
•
|
Advance our High Performance Organization.
We plan to continue to operate with an emphasis on speed, simplicity and accountability. We focus on attracting, developing and managing talent within the Company. Further, we align individual performance to the objectives of the Company in order to ensure accountability, standardization and alignment of all key business processes, and to ensure a seamless transition from strategy to execution.
|
|
•
|
Drive Profitable Growth.
To achieve our goal of accelerating growth, we have identified the following four priorities:
|
|
◦
|
Leverage Integrated Front End Resources
-
We plan to drive more sales growth through our regionally integrated sales organization. We will enhance our marketing and sales capabilities with the assistance of digital marketing and automation. We will implement technologies we believe will accelerate our growth, including a customer relationship management system that will enable us to have a view of all customer touch points and to share leads and expertise.
|
|
◦
|
Accelerate Innovation and Product Renewal
- We plan to focus our research and development on products designed to offer specialized advantages to customers; multi-product packages; and integrated offers that leverage Xylem's intelligent analytics and monitoring and control technologies.
|
|
◦
|
Accelerate International Expansion
- We plan to target fast-growing markets for additional investment and resource allocation, including the expansion of distribution and sales channels. We plan to customize product offerings based upon local needs.
|
|
◦
|
Expand Industrial End-Market Presence
- We plan to build upon our current capabilities to serve industrial end-markets through the development of key vertical strategies, including channel development and market-specific offerings.
|
|
•
|
Improve Operational Excellence.
We will focus on growth in our operating margins to make the Company more profitable. To accomplish this, we will build on our global strategic sourcing capability to maximize leverage from global spend and reinvigorate lean capabilities. We are committed to optimizing our cost structure by eliminating unnecessary costs and inefficient overhead, as well as by simplifying the business by streamlining product relationships across our businesses. We have been executing our plan to simplify our business through restructuring and realignment actions which we believe will better position the Company for the future and enable us to re-prioritize investments to high-priority areas. We will also continue to align the Company to leverage our existing cost structure and broad product portfolio into a greater competitive advantage. We will implement additional cost reductions in an effort to further reduce manufacturing, selling and general and administrative costs.
|
|
•
|
Optimize Capital Deployment.
We plan to continue to allocate capital strategically in an effort to drive strong returns for shareholders, taking decisive action to pivot our portfolio composition and future growth investments in order to create the greatest value. These investments include share repurchases, dividend payments and acquisitions. We intend to continue to execute on our share repurchase programs. We recently announced a 10% increase in our quarterly dividend to shareholders. Finally, although we announced a slow down in acquisitions during 2013 as we focused on growth and operational efficiency, we will continue to selectively evaluate and pursue acquisitions that will broaden our core product portfolio, expand our geographic footprint and enhance our position in strategic markets.
|
Business Segments
We operate in two business segments that are aligned with the cycle of water and the key strategic market applications they provide: Water Infrastructure (collection, distribution, return) and Applied Water (usage). See
Note 21
, “Industry Segment and Geographic Data,” in our consolidated and combined financial statements for financial information about segments and geographic areas.
6
The table and descriptions below provide an overview of our business segments.
|
Market
Applications
|
2013 Revenue
|
%
Revenue
|
Major Products
|
Primary Brands
|
|||||||||
|
Water Infrastructure
|
Transport
|
$
|
1,812
|
|
74
|
%
|
• Water and wastewater pumps
• Filtration, disinfection and biological treatment equipment
• Test equipment
• Controls
|
• Flygt
• WEDECO
• Godwin Pumps
• WTW
• Sanitaire
• YSI
• Leopold
|
|||||
|
Treatment
|
329
|
|
14
|
%
|
|||||||||
|
Test
|
298
|
|
12
|
%
|
|||||||||
|
|
|
||||||||||||
|
$
|
2,439
|
|
100
|
%
|
|||||||||
|
|
|
||||||||||||
|
Applied Water
|
Building Services
|
$
|
696
|
|
50
|
%
|
• Pumps
• Valves
• Heat exchangers
• Controls
• Dispensing
equipment systems
|
• Goulds Water Technology
• Bell & Gossett
• AC Fire
• Standard
• Lowara
• Jabsco
• Flojet
• Flowtronex
|
|||||
|
Industrial Water
|
600
|
|
43
|
%
|
|||||||||
|
Irrigation
|
102
|
|
7
|
%
|
|||||||||
|
|
|
||||||||||||
|
$
|
1,398
|
|
100
|
%
|
|||||||||
|
|
|
||||||||||||
Water Infrastructure
Water Infrastructure involves the process that collects water from a source and distributes it to users, and then returns the wastewater responsibly to the environment. Within the Water Infrastructure segment, our pump systems transport water from oceans, groundwater, lakes and rivers. From there, our filtration, ultraviolet and ozone systems provide treatment, making the water fit for use. After consumption, our pump lift stations move the wastewater to treatment facilities where our mixers, biological treatment, monitoring, and control systems provide the primary functions in the treatment process. Throughout each of these stages, our analytical systems test to ensure quality of water for consumption as well as for its return to nature. Water Infrastructure serves its customers, public utilities and industrial applications, through three closely linked applications: Transport, Treatment and Test of water and wastewater. We estimate our served market size in this sector to be approximately $20 billion.
Transport
The Transport application includes all of the equipment and services involved in the safe and efficient movement of water from sources such as oceans, lakes, rivers and ground water, to treatment facilities, and then to users. It also includes the movement of wastewater from the point of use to a treatment facility and then back into the environment. Finally, the Transport application also includes dewatering pumps, equipment and services which provide the safe removal or draining of ground water and surface water from a riverbed, construction site or mine shaft. We serve the higher-value equipment markets, such as water and wastewater submersible pumps, monitoring controls, and application solutions; we do not serve the market for lower-value equipment such as pipes and fittings. We believe our business is one of the largest players in this served market based on management estimates. With operations on six continents, we also have one of the world’s largest dewatering rental fleets, serviced with our Flygt and Godwin brands. In our Water Infrastructure Segment, Transport accounted for approximately
74%
of our segment revenue in
2013
and 73% in
2012
.
Flygt — Flygt is a world-leader in the design and manufacture of dry and submersible pumps and related intelligent controls systems. Under the Flygt banner, customers have access to a complete range of products and solutions for moving water, wastewater, and advanced monitoring and control equipment to optimize their use. Founded in Sweden in 1901, Flygt is the originator of the reliable, energy-efficient electrical submersible pump. Flygt products
7
have applications in various markets, including wastewater lift stations, water and wastewater treatment facilities, pressurized sewage systems, oil and gas, steel, mining and leisure markets. Customers include public utility and industrial water and wastewater systems operators. In 2012, Xylem successfully launched Flygt Experior which brings together advanced controls, hydraulics and energy-efficient motor technology to deliver substantial energy savings. For example, energy consumption at London’s Heathrow Airport cargo center pump station was reduced by 50% following installation of the new Flygt Experior pumps.
Godwin Pumps — With more than 35 years as a leader in pump manufacturing and applications, Godwin Pumps ("Godwin") has established itself as a well-recognized, market leading brand in the global portable pump market. Godwin manufactures, sells, rents and services its products. Its quick response and 24/7 capabilities allow it to provide customized pumping solutions to meet the specific needs of its customers. Founded in Quenington, England, Godwin is currently headquartered in Bridgeport, New Jersey. Godwin's products include fully automatic self-priming Dri-Prime® pumps, a full range of Flygt electric submersible pumps, Heidra hydraulic submersible pumps, Wet-Prime gasoline-powered contractor pumps and a broad line of generators and portable light towers, as well as a multitude of pumping accessories and pipe. Godwin products are primarily used in construction, water & wastewater transport, oil & gas markets, hydraulic fracturing, industrial, mining, and municipal, as well as government, temporary fire protection, environmental, agriculture, and marine. Godwin products are also instrumental in disaster relief efforts. After Superstorm Sandy hit the United States in October 2012, Godwin's pumps were instrumental in minimizing or eliminating flood damage in various flooded regions throughout the Northeast. Godwin's fleet of equipment is rented through 45 U.S. branches and a global network of distributors and Xylem rental and sales facilities.
Treatment
The Treatment application includes equipment and services that treat both water for consumption and wastewater to be returned responsibly to the environment. Primary served markets include public utilities and industrial operations. While there are several treatment solutions in the market today, we focus on three basic treatment types: (i) filtration, (ii) disinfection and (iii) biological treatment systems. Filtration uses gravity-based media filters and clarifiers to clean both water and wastewater. Leopold, with more than 80 years of experience, is our leading filtration brand. Disinfection systems, both ultraviolet ("UV") and ozone oxidation, treat both public utility drinking water and wastewater, as well as industrial process water, and are provided through our WEDECO brand. Biological treatment systems are key to the treatment and mixing of solids in wastewater plants, which are provided through our Sanitaire and Flygt brands. We believe our business is one of the largest players in this served market based on management estimates. In our Water Infrastructure Segment, Treatment accounted for approximately
14%
of our segment revenue in
2013
and 15% in
2012
.
Leopold — Founded in 1924 in Pittsburgh, Pennsylvania, Leopold is a leader in rapid gravity media filtration and clarification solutions for the water and wastewater industry. In potable drinking water treatment plants, the Clari-DAF system is used to clarify raw water to remove contaminants such as turbidity, algae, color, iron/manganese, organics, and taste and odor compounds. Several years ago, we augmented our filtration products with membrane technology. Our filtration products include the rapid gravity media, membranes and reverse osmosis/ultrafine filtration. Leopold gravity media filtration is used in potable water treatment plants to remove particulate in the final filtration step. In public utility wastewater treatment plants, the ClariVAC system is used in final clarifiers to remove the sludge solids. For those areas where nitrogen and phosphorus nutrient removal is required, we provide elimi-NITE systems which convert the filters to become biologically active so that the effluent meets the mandated nitrate and phosphorus levels. In desalination systems, Leopold Clari-DAF® systems and Filterworx systems are provided to remove contaminants that will harm reverse osmosis membranes, so that salt can be removed from the seawater to make it potable. Primary customers are public utility water and wastewater systems, as well as desalination plant facilities. Leopold won an order in the fourth quarter of 2013 to provide a new pre-treatment DAF system
to help ensure an uninterrupted potable water supply to Abu Dhabi Emirate and the east coast of the United Arab Emirates. The source water in the Arabian Gulf is subject to harmful algal blooms also known as "red-tides." Xylem’s Leopold Clari-DAF® system is proven to be over 95 percent
effective in removing these microorganisms prior to desalination, ensuring the production of clean, fresh, drinking water.
WEDECO — WEDECO was founded in 1975 in Herford, Germany to develop chemical-free and environmentally friendly water treatment technologies, including ultraviolet light and ozone systems. There are more than 250,000 installed WEDECO systems for UV disinfection and ozone oxidation globally in private, public utility and industrial locations. WEDECO introduced ozone technology in 1988 and has been expanding internationally ever since. UV disinfection systems have a number of applications including water treatment and aquaculture. Ozone disinfection systems have applications in drinking water, wastewater, process water, product polishing, bleaching, ozonolysis/
8
synthesis and deodorization. Customers include public utility wastewater and clean water treatment facilities, power plants, pulp and paper mills, food product manufacturers and aquaculture facilities. In the fourth quarter of 2013, a WEDECO LBX 1000 UV system was installed in a hospital in the German city of Warstein to combat an outbreak of Legionnaire's disease, a potentially fatal form of pneumonia which had contaminated a municipal wastewater treatment plant.
Sanitaire — Launched in 1967, the Sanitaire brand provides complete biological wastewater treatment solutions for public utility and industrial applications. Sanitaire’s comprehensive offering includes diffused aeration, sequencing batch reactors, drum filters and state-of-the-art controls that drive efficient operations. Sanitaire is regarded as a leading brand in diffused aeration, which is a process that introduces air into a liquid, providing an aerobic environment for degradation of organic matter. Fine-pore diffusion of air is highly competitive due to its high oxygen transfer efficiency and lower energy costs. Sanitaire wide-band aeration systems are used in applications such as grit chambers and sludge that require non-clogging, maintenance-free systems. Principal Sanitaire customers are public utility and industrial wastewater treatment facilities. In 2013, Xylem launched the Sanitaire OSCAR process performance optimization system. When combined with Sanitaire’s advanced aeration system, Xylem was able to deliver 65 percent energy savings to the operators of the Sterno, Sweden wastewater treatment plant.
Flygt — Flygt is a also a world-leader in the design and manufacturing of submersible, jet and top-entry mixers. Flygt has over 30 years of expertise in the area of wastewater treatment mixing, as well as over 100,000 applications globally. Submersible mixers are often used in sewage treatment plants to keep solids in suspension in the various process tanks and/or sludge holding tanks. During the fourth quarter of 2013, Xylem won an order to provide Flygt submersible mixers for the Panama Canal. The project includes four anti-sedimentation mixers at each lock gate of a new Panama Canal channel, as well as local electrical panels and accessories.
Test
Analytical instrumentation is used across most industries to ensure regulatory requirements are met. Growth in this market is primarily driven by increasing regulation of water and wastewater in North America, Europe and Asia. Our served market is predominately focused on water and the environment for quality levels throughout the water infrastructure loop. Analytical systems are applied in three primary ways: in the field, in a facility laboratory, or real time, online monitoring in a treatment facility process. We believe we have a leading position in this served market based on management estimates. In our Water Infrastructure Segment, Test accounted for approximately
12%
of our segment revenue in both
2013
and
2012
.
WTW — In wastewater treatment facilities, WTW-branded systems monitor parameters such as dissolved oxygen, pH, and turbidity throughout the water process to ensure regulatory standards are met before water is discharged back into the environment. Founded in 1945 as a major brand in Europe, WTW has particularly strong market penetration in the environmental, water and wastewater segments. WTW holds leading market positions in both field and on-line instrumentation and manufactures premium positioned robust and reliable analysis products for the measurement of pH, dissolved oxygen, conductivity, total dissolved solids, turbidity, specific ions and biological oxygen demand. WTW’s product offering includes meters, sensors, data-loggers, photometers and software providing customer solutions for even the most challenging applications. WTW instruments have been placed in major monitoring stations around the globe to monitor water quality. One of our largest installations is in the Yangtze river station in China.
YSI — Yellow Springs Instrument Company ("YSI"), founded in 1948, develops and manufactures sensors, instruments, software and data collection platforms for environmental and coastal water quality monitoring and testing. YSI also offers Life Sciences products including biochemical analyzers for bioprocess monitoring, food and beverage processing, and sports physiology. The main market areas are water quality, environmental monitoring, aquaculture, life sciences and ocean research. YSI sensors played a critical role in monitoring water levels and providing other real-time data that helped track Superstorm Sandy which hit the Mid-Atlantic and Northeast United States in October of 2012.
OI Analytical — Oceanography International Corporation ("OIC"), founded in 1969, provides innovative products used for chemical analysis. Data from our analytical instruments serve as the basis for informed decisions affecting human health and safety, environmental protection, industrial operations and product quality. OIC was originally focused on oceanography equipment moving to production of water-quality measurement instrumentation, as oceanography equipment sales declined. OIC developed the Company’s first total organic carbon analyzer. Since that time, the Company has become recognized worldwide as a provider of quality analytical instrumentation. OIC developed a Total Organic Carbon Analyzer in cooperation with National Aeronautics and Space Administration
9
specifically for use on the International Space Station. Without this validation that the drinking water has been purified for human consumption, the Space Station would not be suitable for astronaut habitation.
Aanderaa Data Instruments AS — ("Aandera") was founded in 1966 in Bergen, Norway, and offers sensors, instruments and systems for measuring and monitoring in the most demanding environments such as rivers, oceans and the polar regions through fully networked systems using wireless technology that monitors temperature, salinity, oxygen, turbidity, current and waves for ecosystem health. The main market areas are marine transportation, environmental and ocean research, oil and gas, aquaculture, road and traffic, and construction. Aanderaa's new technologies underlie the most advanced distributed instrumentation for underwater and atmospheric measurements. Hydro-acoustic, electro-optical, electro-chemical, pressure, temperature and meteorological data are captured by observing networks and self-contained instrumentation using real-time communication. Key customers include many oceanographic institutes, universities, geophysical surveyors, navies, offshore oil and gas companies, drilling companies, port and harbor authorities, government agencies, water authorities and international electric power utilities. Key installations include our new on-line tide and salinity station at Palmer Station in the Antarctic and coastal ocean wave and water quality monitoring station for United States Geological Survey alongside a National Oceanic and Atmospheric Administration Sentinel site in Galveston, Texas.
Applied Water
Applied Water encompasses the uses of water. Since water is used to some degree in almost every aspect of human, economic and environmental activity, this segment has a significant number of potential applications and we participate in all major areas of water demand. Irrigation applications constitute the majority of all water usage globally. Examples of what we provide include: boosting systems for farming irrigation, pumps for dairy operations, and rainwater reuse systems for small scale crop and turf irrigation. Industrial Water applications account for the next largest amount of global water consumption. Our pumps, heat exchangers, valves and controls provide cooling to power plants and manufacturing facilities, as well as circulation for food and beverage processing. The remaining portion of global water use resides in human and building consumption, where we deliver water boosting systems for drinking, heating, ventilation and air conditioning ("HVAC") and fire protection systems to Residential and Commercial Building Services. We estimate our served market size in this sector to be approximately $15 billion.
Residential & Commercial Building Services
This business is defined by four main uses of water in building services applications, such as in residential homes and commercial buildings, including offices, hotels, hospitals, schools, restaurants and malls. The first application is in HVAC, where Bell & Gossett and Lowara specialize in pumps and valves that are used in water-driven heating and cooling systems, along with heat exchangers, valves, and monitoring and control products that augment the system. The second is the supply of potable water for consumption, such as for drinking and hygiene. The Goulds Water Technology and Lowara brands provides pumps and boosting systems utilized within buildings, sourcing water from distribution networks or from wells. The third application is wastewater removal with sump and sewage pumps, provided by Bell & Gossett, Goulds Water Technology and Lowara. The fourth water-related building service area is fire protection, where our AC Fire brand supplies full pump systems for emergency fire suppression. Bell & Gossett, Goulds Water Technology and Lowara have continued to innovate, focusing on providing industry-leading energy-efficient pumps for the building services market; many of these products are more efficient than competitive devices. We believe our business is one of the largest players in this served market based on management estimates. In our Applied Water Segment, Building Services accounted for approximately
50%
of our segment revenue in
2013
and 53% in
2012
.
Industrial Water
Water is used in most industrial facilities to provide processing steps such as cooling, heating, cleaning and mixing. Our Goulds Water Technology brand supplies vertical multistage pumps to bring in source water or to boost pressure for purposes such as circulating water through a manufacturing facility to cool machine tools. Our Lowara brand focuses on industrial washing equipment and machine tool cooling. Our Standard Xchange brand delivers heat exchangers for combined heat and power applications within power generation plants. We also service niche applications such as flexible impeller pumps for wine processing facilities served by our Jabsco brand, and water-based detergent dispensing and water circulation within car washes served by Flojet and Goulds Water Technology air-operated diaphragm and end suction pumps. Our boosting pumps are also increasingly being used in hydraulic fracturing applications. Across all these various end applications, we believe our business is the second largest player in this served market based on management estimates. In our Applied Water Segment, Industrial Water accounted for approximately
43%
of our segment revenue in
2013
and 40% in
2012
.
10
Irrigation
The irrigation business consists of irrigation-related equipment and services associated with bringing water from a source to the plant or livestock need, including hoses, sprinklers, center pivot and drip irrigation. We focus on the pumps and boosting systems that supply this ancillary equipment with water. Our Goulds Water Technology brand brings mixed flow pumps, and our Flowtronex group specializes in equipment "packaged solutions" incorporating monitoring and controls to optimize energy efficiency in irrigation delivery. Our Lowara brand also produces pumps for agriculture applications and irrigation of gardens and parks. We believe we have a leading position in this served market based on management estimates. In our Applied Water Segment, Irrigation accounted for approximately
7%
of our segment revenue in
2013
and 7% in
2012
.
As described above, the following brands and products are used across the applications in our Applied Water segment:
Goulds Water Technology — With origins dating back more than 150 years, Goulds Water Technology is a leading brand of centrifugal and turbine pumps, controllers, variable frequency drives and accessories for residential and commercial water supply and wastewater applications. Goulds Water Technology is a leader in the water technologies market with its line of residential water well pumps. The Goulds Water Technology product portfolio includes submersible and line shaft turbine, 4” submersible, jet, sump, effluent, sewage and centrifugal pumps for residential, agriculture and irrigation, sewage and drainage, commercial and light industrial use. Goulds Water Technology has various vertical configuration high pressure centrifugal pumps which are utilized for water boost, filtration and boiler feed applications in industrial environments. Goulds Water Technology submersible, deepwell or other pumps can be found in more than a quarter of the existing 15 million household wells and more than 380,000 public and community wells in the United States. Products for commercial wastewater include sewage, effluent and grinder pumps and packages. Agriculture products include pump and control products for irrigation, stockwater, wash systems, cooling systems and waste management, with turf irrigation products, including submersible and surface pumps for landscape and turf irrigation systems. We serve the building trades market with filtration, chilling, pressure boost, wash system, water supply, wastewater and boiler feed applications. We also have a range of standard cast iron and bronze end-suction and multistage pumps for various commercial applications. During 2012, Goulds Water Technology products were installed to help protect the Ancient Sphinx and Pyramids in Giza, Egypt from rising ground water that was causing erosion to the soft limestone structures.
Lowara — Founded in 1968 in Vicenza, Italy, Lowara is a leader in stainless steel pump manufacturing technology for water technology applications. The Lowara range of products includes submersible, sump, effluent, sewage, centrifugal pumps and booster packages for water supply and water pumping needs in the residential, agriculture, industrial, public utility, building service and commercial markets worldwide, with particular strength in Europe. Residential applications include pumps for pressurization, conditioning, fire-fighting systems, lifting stations and dewatering. Agriculture applications include pumps for irrigation of gardens and parks. Industrial applications include drinking water, industrial washing equipment and machine tool cooling. The German water services company Erftverband implemented a comprehensive system of Lowara pumps and a Hydrovar speed control smart system to address complex water management needs in Korschenbroich and Kaarst, Germany during 2013.
Bell & Gossett — Founded in 1916 in Chicago, Illinois, Bell & Gossett ("B&G") is a leader in plumbing and water-based heating and air conditioning markets. Products are used in residential applications where single- or multi-family homes are heated with hot water or steam. Key products include circulating pumps, valves, and specialty products used in these systems. B&G also sells wastewater pumps for commercial and residential applications. In commercial applications, B&G provides a broad range of products, including a wide variety of pumps, heat exchangers, valves and controls for heating and air-conditioning systems, sump pumps for wastewater systems, condensate pumping systems for steam heating systems and a comprehensive line of energy-saving variable speed controls. Training is provided for building system design engineers at B&G’s industry renowned Little Red Schoolhouse in Morton Grove, Illinois which has educated more than 60,000 engineers. Key commercial building types include hospitals, schools, and data centers. B&G products are sold globally by independent manufacturer representatives and distributed locally by HVAC wholesalers. One of the most interesting installations of B&G products is at McMurdo Station in Antarctica. McMurdo is operated by the United States through the United States Antarctica Program, a branch of the National Science Foundation. This station includes more than 200 B&G pumps in various applications throughout the facility.
A-C Fire Pump — Allis-Chalmers Company ("A-C Fire Pump") was founded in the 1840s in Milwaukee, Wisconsin. It offers turnkey fire pump systems for commercial, residential and industrial applications. A-C Fire Pump designs and custom-builds a wide range of fire pump systems, including prefabricated packages and house units that meet
11
every fire protection need. A-C Fire Pump products include In-Line Pumps, Vertical Turbine, Package Systems, Split Case (various series) and 13D Home Defender for residential fire pump service. The 13D Home Defender is designed to boost water pressure for automatic residential sprinkler systems. In addition to residential applications, turnkey fire pumping systems from A-C Fire Pump protect an increasing number of petrochemical facilities, commercial buildings and factories around the world. During 2013, A-C Fire Pump provided fire pump packages to CNOOC (Chinese National Offshore Oil Company) as part of a large project in China.
Flowtronex — Flowtronex, founded in 1974 as Pumping Systems, Inc., began by producing some of the golf industry’s first prefabricated water pumping systems. The Silent Storm package and Pace Integrated Pump Controller are our two primary products sold into the golf market. In landscape, Flowtronex products, primarily the Floboy system, are sold to customers such as cities and nurseries. In golf, Flowtronex products are sold to golf course superintendents through our Toro Distribution partnership. Retrofit sales of golf pumping systems are sold through our FlowNet Service Network, a group of factory authorized service technicians that provide set up and start up, and service and repair of Flowtronex pump stations. Flowtronex has pumping systems operating in more than seventy countries around the world. In the United States alone, 78 of the Top 100 golf courses use Flowtronex golf irrigation pumping systems.
Standard Xchange — Since 1917, Standard Xchange has been the leader in the design and manufacture of shell and tube heat exchangers. Standard Xchange is the brand of our complete line of heat transfer products used in industrial and process applications such as heating or cooling liquids or gases, heat recovery in chemical processing, power and co-generation, paper and pulp, OEM and commercial marine markets. Products include basic shell-and-tube heat exchangers, air coolers, heat transfer coils, compact brazed, welded, gasketed plate units and packaged steam condensers. Standard Xchange heat exchangers provide cooling for many of the major turbine manufacturers in electrical power generation plants around the world.
Jabsco — The Jabsco brand is known for its marine, industrial, and hygienic/sanitary pumps and systems that are used in many industries, including marine, industrial, healthcare and food processing. It was founded in 1938 by the inventors of the flexible impeller pump. Jabsco is a leader in the leisure marine market, with a broad range of products including water system, engine cooling pumps, searchlights and marine waste systems. Jabsco also offers industrial pumps for hygienic applications, fluid transfer in chemical processing, laboratory, paint processing, plating, and construction. Jabsco rotary lobe pumps offer outstanding performance with unique capabilities. Jabsco Hy-line and Ultima rotary lobe pumps support food and dairy product production, healthcare, chemical, pharmaceutical and biotech applications, whether the product is thin, viscous or fragile. Jabsco also offers multi-purpose and specialized flexible impeller, diaphragm and sliding vane pumps for chemical and general transfer applications. Jabsco marine products can be found under the decks of millions of pleasure boats around the world.
Flojet — Established in 1975, the Flojet brand encompasses a broad range of small pumps, motors and dispensing pumps for the beverage, industrial, recreational vehicle, marine and food processing markets. Flojet is a leader in the small pump market, offering a versatile range of products serving the beverage market, including both air- and motor-operated diaphragm pumps and centrifugal chilling pumps, as well as booster systems and accumulator tanks. Flojet’s beverage pumps can be found in applications such as beer dispensing, syrup mixing for carbonated drinks, re-circulation in vending machines and refrigerators, bottled water dispensers, icemakers and coffee machines. In addition to significant beverage applications, Flojet’s electric and air-operated diaphragm pumps are utilized in street sweepers, car washes, carpet cleaners, parts washers, agricultural spraying and road rollers. Flojet’s positive displacement diaphragm pumps can be driven by air, electric motor or solenoid. The positive displacement diaphragm design of Flojet pumps makes them ideal for use in conditions that require self-priming and dry running capability for short periods of time. Additionally, the compact size of these pumps makes them very useful in tight spaces where one cannot ensure a flooded suction. Flojet pumps are designed to be more efficient and are often the choice of customers for applications where low power consumption is critical. Xylem services many of the world's leading beverage producers and during 2013 secured a large contract that will require 22 Flojet beverage pumps per store for a large national restaurant chain.
12
Geographic Profile
In addition to the traditional markets of the United States and Europe, opportunities in emerging markets within Asia Pacific, Eastern Europe, Latin America and other countries are growing.
The table below illustrates the annual revenue and percentage of revenue by geographic area for each of the three years ended
December 31, 2013
.
|
Revenue
|
||||||||||||||||||||
|
(in millions)
|
2013
|
2012
|
2011
|
|||||||||||||||||
|
$ Amount
|
% of Total
|
$ Amount
|
% of Total
|
$ Amount
|
% of Total
|
|||||||||||||||
|
United States
|
$
|
1,434
|
|
38
|
%
|
$
|
1,400
|
|
37
|
%
|
$
|
1,363
|
|
36
|
%
|
|||||
|
Europe
|
1,387
|
|
36
|
%
|
1,338
|
|
35
|
%
|
1,422
|
|
37
|
%
|
||||||||
|
Asia Pacific
|
467
|
|
12
|
%
|
469
|
|
12
|
%
|
426
|
|
11
|
%
|
||||||||
|
Other
|
549
|
|
14
|
%
|
584
|
|
16
|
%
|
592
|
|
16
|
%
|
||||||||
|
Total
|
$
|
3,837
|
|
$
|
3,791
|
|
$
|
3,803
|
|
|||||||||||
Revenue derived from emerging markets comprised
19%
,
20%
and
19%
of our revenue in
2013
,
2012
and
2011
, respectively.
The table below illustrates the property, plant & equipment and percentage of property, plant & equipment by geographic area for each of the three years ended
December 31, 2013
.
|
Property, Plant & Equipment
|
||||||||||||||||||||
|
(in millions)
|
2013
|
2012
|
2011
|
|||||||||||||||||
|
$ Amount
|
% of Total
|
$ Amount
|
% of Total
|
$ Amount
|
% of Total
|
|||||||||||||||
|
United States
|
$
|
186
|
|
38
|
%
|
$
|
183
|
|
38
|
%
|
$
|
178
|
|
38
|
%
|
|||||
|
Europe
|
225
|
|
46
|
%
|
219
|
|
45
|
%
|
209
|
|
45
|
%
|
||||||||
|
Asia Pacific
|
45
|
|
9
|
%
|
65
|
|
13
|
%
|
57
|
|
12
|
%
|
||||||||
|
Other
|
32
|
|
7
|
%
|
20
|
|
4
|
%
|
19
|
|
5
|
%
|
||||||||
|
Total
|
$
|
488
|
|
$
|
487
|
|
$
|
463
|
|
|||||||||||
Distribution, Training and End Use
Water Infrastructure provides the majority of its sales through direct channels with remaining sales through indirect channels and service capabilities. Both public utility and industrial facility customers increasingly require our teams’ global but locally proficient expertise to use our equipment in their specific applications. Several trends are increasing the need for this application expertise: (i) the increase in type and amount of contaminants in water supply, (ii) increasing environmental regulations, (iii) the need to increase system efficiencies due to rising energy costs, and (iv) the retirement of a largely aging water industry workforce not systematically replaced at utilities.
In the Applied Water segment, many end-use areas are widely different, so specialized distribution partners are often preferred. Our commercial teams have built long-standing relationships around our brands in many of these industries through which we can continue to leverage new product and service applications. Revenue opportunities are balanced between OEM and after-market customers. Our products in the Applied Water segment are sold through our global direct sales and strong indirect channels with the majority of revenue going through indirect channels. We have long-standing relationships with the leading independent distributors in the markets we serve, and we provide incentives to distributors, such as specialized training programs, to sell our products exclusively.
13
Aftermarket Parts and Service
We have many service centers around the world which employ service employees to provide aftermarket parts and services to our customers. During their lifecycle, installed products require maintenance, repair services and parts due to the harsh environments in which they operate.
In addition, depending on the type of product, median lifecycles range from 5 years to over 50 years, at which time they must be replaced. Many of our products are precisely selected and applied within a larger network of equipment driving a strong preference by customers and installers to replace them with the same exact brand and model when they reach the end of their lifecycle. This dynamic establishes a large recurring revenue stream for our business.
Supply and Seasonality
We have a global manufacturing footprint, with production facilities in Europe, North America, Latin America, and Asia. In addition, we maintain a global network of service centers providing after-market customer care. Service centers offer an array of integrated service solutions for the industry including: preventive monitoring, contract maintenance, emergency field service, engineered upgrades, inventory management, and overhauls for pumps and other rotating equipment.
We offer a wide range of highly engineered products. We primarily employ configure-to-order capabilities to maximize manufacturing and logistics efficiencies by producing high volumes of basic product configurations. When we provide a configure-to-order solution, we configure a standard product to our customers’ specifications. To a lesser extent, we provide engineer-to-order products to meet the customization requirements of our customers. This process requires that we apply our technical expertise and production capabilities to provide a non-standard solution to the customer.
Our inventory management and distribution practices seek to minimize inventory holding periods by taking delivery of the inventory and manufacturing immediately prior to the sale or distribution of products to our customers. All of our businesses require various parts and raw materials, of which the availability and prices may fluctuate. Parts and raw materials commonly used in our products include motors, fabricated parts, castings, bearings, seals, nickel, copper, aluminum, and plastics. While we may recover some cost increases through operational improvements, we are still exposed to some pricing risk. We attempt to control costs through fixed-priced contracts with suppliers and various other programs, such as our global strategic sourcing initiative.
Our business relies on third-party suppliers, contract manufacturing and commodity markets to secure raw materials, parts and components used in our products. We typically acquire materials and components through a combination of blanket and scheduled purchase orders to support our materials requirements. For most of our products, we have existing alternate sources of supply, or such sources are readily available.
We may experience price volatility or supply constraints for materials that are not available from multiple sources. From time to time, we acquire certain inventory in anticipation of supply constraints or enter into longer-term pricing commitments with vendors to improve the priority, price and availability of supply. There have been no raw material shortages that have had a significant adverse impact on our business as a whole.
Our Water Infrastructure and Applied Water segments experience some modest level of seasonality in its business. This seasonality is dependent on factors such as capital spending of customers as well as weather conditions, including heavy flooding, droughts and fluctuations in temperatures, which can positively or negatively impact portions of our business.
Customers
Our business is not dependent on any single customer or a few customers, the loss of which would have a material adverse effect on the applicable market or on the Company as a whole. No individual customer accounted for more than 10% of our consolidated
2013
,
2012
or
2011
revenue.
Backlog
Delivery schedules vary from customer to customer based upon their requirements. Typically, large projects require longer lead production cycles and delays can occur from time to time. Total backlog was
$707 million
at
14
December 31, 2013
and
$647 million
at
December 31, 2012
. We anticipate that more than 90% of the backlog at
December 31, 2013
will be recognized as revenue during
2014
.
Competition
Given the highly fragmented nature of the water industry, Water Infrastructure competes with a large number of businesses. Competition in the water transport and treatment technologies markets focuses on product performance, application expertise, design, quality, delivery, and price. In the sale of products and services, we benefit from our large installed base of pumps and complementary products, which require maintenance, repair and replacement parts due to the nature of the products and the conditions under which they operate. Timeliness of delivery, quality and the proximity of service centers are important customer considerations when selecting a provider for after-market products and services as well as equipment rentals. In geographic regions where we are locally positioned to provide a quick response, customers have historically relied on us, rather than our competitors, for after-market products relating to our highly engineered and customized solutions. Our key competitors within the Water Infrastructure segment include KSB Inc., Sulzer Ltd., Evoqua Water Technologies (formerly Siemans AG) and Danaher Corporation.
Competition in the Applied Water segment focuses on brand names, application expertise, product delivery and performance, quality, and price. We compete by offering a wide variety of innovative and high-quality products, coupled with world-class application expertise. We believe our distribution through well-established channels and our reputation for quality significantly enhance our market position. Our ability to deliver innovative product offerings has allowed us to compete effectively, to cultivate and maintain customer relationships and to serve and expand into many niche and new markets. Our key competitors within the Applied Water segment include Grundfos, Wilo SE, Pentair Ltd. and Franklin Electric Co., Inc.
Research and Development
Research and development (“R&D”) is a key element of our engineering culture and is generally focused on the design and development of products and application know-how that anticipate customer needs and emerging trends. Our engineers are involved in new product development and improvement of existing products. Our businesses invest substantial resources for R&D. We anticipate we will continue to develop and invest in our R&D capabilities to promote a steady flow of innovative, high-quality and reliable products and applications to further strengthen our position in the markets we serve. We invested
$104 million
,
$106 million
, and
$100 million
for the years ended December 31,
2013
,
2012
and
2011
, respectively, towards R&D.
We have engineering and research employees in technology centers around the world. R&D activities are initially conducted in our technology centers, located in conjunction with some of our major manufacturing facilities to ensure an efficient development process. We have a wastewater Center of Excellence in Stockholm, Sweden, with research, development and engineering employees. We have Centers of Excellence in India and China, where we are accelerating the customization of our application expertise to local needs. In the scale-up process, our R&D activities are conducted at our piloting and testing facilities or at strategic customer sites. These piloting and testing facilities enable us to serve our strategic markets in each region of the world.
We generally seek patent protection for those inventions and improvements that we believe will improve our competitive position. We believe that our patents and applications are important for maintaining the competitive differentiation of our products and improving our return on research and development investments. While we own, control or license a significant number of patents, trade secrets, proprietary information, trademarks, trade names, copyrights, and other intellectual property rights which, in the aggregate, are of material importance to our business, management believes that our business, as a whole, as well as each of our core business segments, is not materially dependent on any one intellectual property right or related group of such rights.
Patents, patent applications, and license agreements expire or terminate over time by operation of law, in accordance with their terms or otherwise. As the portfolio of our patents, patent applications, and license agreements has evolved over time, we do not expect the expiration of any specific patent to have a material adverse effect on our financial position or results of operations.
15
Environmental Matters and Regulation
Our manufacturing operations worldwide are subject to many requirements under environmental laws. In the United States, the Environmental Protection Agency and similar state agencies administer laws and regulations concerning air emissions, water discharges, waste disposal, environmental remediation, and other aspects of environmental protection. Such environmental laws and regulations in the United States include, for example, the Federal Clean Air Act, the Clean Water Act, the Resource, Conservation and Recovery Act, and the Comprehensive Environmental Response, Compensation and Liability Act. Environmental requirements significantly affect our operations. We have established an internal program to address compliance with applicable environmental requirements and, as a result, management believes that we are in substantial compliance with current environmental regulations.
While environmental laws and regulations are subject to change, such changes can be difficult to predict reliably and the timing of potential changes is uncertain. Management does not believe, based on current circumstances, that compliance costs pursuant to such regulations will have a material adverse effect on our financial position or results of operations. However, the effect of future legislative or regulatory changes could be material to our financial condition or results of operations.
Accruals for environmental matters are recorded on a site-by-site basis when it is probable that a liability has been incurred and the amount of the liability can be reasonably estimated, based on current law and existing technologies. It can be difficult to estimate reliably the final costs of investigation and remediation due to various factors. Our accrued liabilities for these environmental matters represent the best estimates related to the investigation and remediation of environmental media such as water, soil, soil vapor, air and structures, as well as related legal fees based upon the facts and circumstances as currently known to us. These estimates, and related accruals, are reviewed quarterly and updated for progress of investigation and remediation efforts and changes in facts and legal circumstances. Liabilities for these environmental expenditures are recorded on an undiscounted basis. We do not anticipate these liabilities will have a material adverse effect on our consolidated and combined financial position or results of operations. We cannot make assurances that other sites, or new details about sites known to us, that could give rise to environmental liabilities with such material adverse effects on us will not be identified in the future. At
December 31, 2013
, we had estimated and accrued
$8 million
related to environmental matters.
Employees
As of
December 31, 2013
, Xylem had more than 12,500 employees worldwide. We have over 3,700 employees in the United States, of whom approximately 17% are represented by labor unions, and in certain foreign countries some of our employees are represented by work councils. We believe that our facilities are in favorable labor markets with ready access to adequate numbers of workers and believe our relations with our employees are good.
Available Information
Xylem’s website address is
www.xyleminc.com
. We make available free of charge on or through
www.investors.xyleminc.com
our Annual Report on Form 10-K, Quarterly Reports on Form 10-Q, Current Reports on Form 8-K, and all amendments to those reports as soon as reasonably practicable after such material is electronically filed with or furnished to the SEC. Information contained on our website is not incorporated by reference unless specifically stated therein.
In addition, the public may read or copy any materials filed with the SEC at the SEC’s Public Reference Room located at 100 F Street NE, Washington, D.C. 20549. The public may also obtain information on the operation of the Public Reference Room by calling the SEC at 1-800-SEC-0330. These reports and other information are also available, free of charge, at
www.sec.gov.
16
In evaluating our business, each of the following risks should be carefully considered, along with all of the other information in this Report and in our other filings with the SEC. Should any of these risks and uncertainties develop into actual events, our business, financial condition or results of operations could be materially and adversely affected.
Risks Related to Operational and External Factors
Failure to compete successfully in our markets could adversely affect our business.
We provide products and services into competitive markets. We believe the principal points of competition in our markets are product performance, reliability and innovation, application expertise, brand reputation, energy efficiency, product life cycle cost, timeliness of delivery, proximity of service centers, effectiveness of our distribution channels and price. Maintaining and improving our competitive position will require continued investment by us in manufacturing, research and development, engineering, marketing, customer service and support, and our distribution networks. We may not be successful in maintaining our competitive position. Our competitors may develop products that are superior to our products, or may develop more efficient or effective methods of providing products and services or may adapt more quickly than we do to new technologies or evolving customer requirements. Pricing pressures also could cause us to adjust the prices of certain products to stay competitive. We may not be able to compete successfully with our existing or new competitors. Failure to continue competing successfully or to win large contracts could adversely affect our business, financial condition or results of operations.
Our results of operations and financial condition may be adversely affected by global economic and financial market conditions.
We compete around the world in various geographic and product markets. In
2013
,
38%
and
36%
of our total revenue was from customers located in the United States and Europe, respectively. We expect revenue from these markets to be significant for the foreseeable future. Important factors impacting our businesses include the overall strength of these economies and our customers’ confidence in both local and global macro-economic conditions; industrial and federal, state, local and municipal governmental spending; the strength of the residential and commercial real estate markets; interest rates; availability of commercial financing for our customers and end-users; and unemployment rates. A slowdown or downturn in these financial or macro-economic conditions could have a significant adverse effect on our business, financial condition and results of operations.
Economic and other risks associated with international sales and operations could adversely affect our business.
In
2013
,
62%
of our total revenue was from customers outside the United States. We expect our international operations and export sales to continue to be a significant portion of our revenue. Both our sales from international operations and export sales are subject in varying degrees to risks inherent to doing business outside the United States. These risks include the following:
|
•
|
possibility of unfavorable circumstances arising from host country laws or regulations;
|
|
•
|
currency exchange rate fluctuations and restrictions on currency repatriation;
|
|
•
|
potential negative consequences from changes to taxation policies;
|
|
•
|
disruption of operations from labor and political disturbances;
|
|
•
|
changes in tariff and trade barriers and import and export licensing requirements; and
|
|
•
|
insurrection or war.
|
Any payment of distributions, loans or advances to us by our foreign subsidiaries could be subject to restrictions on, or taxation of, dividends on repatriation of earnings under applicable local law, monetary transfer restrictions and foreign currency exchange regulations in the jurisdictions in which our subsidiaries operate. In addition to the general risks that we face outside the United States, we now conduct more of our operations in emerging markets than we have in the past, which could involve additional uncertainties for us, including risks that governments may impose limitations on our ability to repatriate funds; governments may impose withholding or other taxes on remittances and other payments to us, or the amount of any such taxes may increase; an outbreak or escalation of
17
any insurrection or armed conflict may occur; governments may seek to nationalize our assets; or governments may impose or increase investment barriers or other restrictions affecting our business. In addition, emerging markets pose other uncertainties, including the protection of our intellectual property and other assets, pressure on the pricing of our products, higher business conduct risks, less qualified talent and risks of political instability. We cannot predict the impact such future, largely unforeseeable events might have on our business, financial condition and results of operations.
Our business could be adversely affected by the inability of suppliers to meet delivery requirements.
Our business relies on third-party suppliers, contract manufacturing and commodity markets to secure raw materials, parts and components used in our products. Parts and raw materials commonly used in our products include motors, fabricated parts, castings, bearings, seals, nickel, copper, aluminum, and plastics. We are exposed to the availability of these materials, which may be subject to curtailment or change due to, among other things, interruptions in production by suppliers, labor disputes, the impaired financial condition of a particular supplier, suppliers’ allocations to other purchasers, changes in exchange rates and prevailing price levels, ability to meet regulatory requirements, weather emergencies or acts of war or terrorism. Any delay in our suppliers’ abilities to provide us with necessary materials could impair our ability to deliver products to our customers and, accordingly, could have a material adverse effect on our business, financial condition or results of operations.
Our business could be adversely affected by significant movements in foreign currency exchange rates.
We are exposed to fluctuations in foreign currency exchange rates, particularly with respect to the Euro, Swedish Krona, British Pound, Australian Dollar, Canadian Dollar, Polish Zloty, and Hungarian Forint. Any significant change in the value of currencies of the countries in which we do business relative to the value of the U.S. Dollar or Euro could affect our ability to sell products competitively and control our cost structure, which could have a material adverse effect on our business, financial condition and results of operations.
Weather conditions may adversely affect our financial results.
Weather conditions, including heavy flooding, droughts and fluctuations in temperatures, can positively or negatively impact portions of our business. Within the dewatering space, our pumps provided through our Godwin brand are used to remove excess or unwanted water. Heavy flooding due to weather conditions drives increased demand for these applications. On the other hand, drought conditions drive higher demand for pumps used in agricultural and turf irrigation applications, such as those provided by our Goulds Water Technology, Flowtronex and Lowara brands. Fluctuations to warmer and cooler temperatures result in varying levels of demand for products used in residential and commercial applications where homes and buildings are heated and cooled with HVAC units such as those provided by our B&G brand. Given the unpredictable nature of weather conditions, this may result in volatility for certain portions of our business, as well as the operations of certain of our customers and suppliers.
Our financial results can be difficult to predict.
Our business is impacted by an increasing amount of short cycle, and book and bill business, which we have limited insight into, particularly for the business that we transact through our distributors. We are also impacted by large projects, whose timing can change based upon customer requirements due to a number of factors affecting the project, such as funding, readiness of the project and regulatory approvals. Accordingly, our financial results for any given period can be difficult to predict.
Our strategy includes acquisitions, and we may not be able to make acquisitions of suitable candidates or integrate acquisitions successfully.
Our historical growth has included acquisitions. As part of our growth strategy, we plan to pursue the acquisition of other companies, assets and product lines that either complement or expand our existing business. We cannot make assurances, however, that we will be able to identify suitable candidates successfully, negotiate appropriate acquisition terms, obtain financing that may be needed to consummate those acquisitions, complete proposed acquisitions, successfully integrate acquired businesses into our existing operations or expand into new markets. In addition, we cannot make assurances that any acquisition, once successfully integrated, will perform as planned, be accretive to earnings, or prove to be beneficial to our operations or cash flow.
Acquisitions involve a number of risks and present financial, managerial and operational challenges, including: diversion of management attention from existing businesses and operations; integration of technology, operations personnel, and financial and other systems; potentially insufficient internal controls over financial activities or
18
financial reporting at an acquired entity that could impact us on a combined basis; the failure to realize expected synergies; the possibility that we have acquired substantial undisclosed liabilities; and the loss of key employees of the acquired businesses.
We may incur impairment charges for our goodwill and other indefinite-lived intangible assets which would negatively impact our operating results.
We have a significant amount of goodwill and purchased intangible assets on our balance sheet as a result of acquisitions we have completed. As of December 31, 2013, the net carrying value of our goodwill and other indefinite-lived intangible assets totaled approximately $2 billion. The carrying value of goodwill represents the fair value of an acquired business in excess of identifiable assets and liabilities as of the acquisition date. The carrying value of indefinite-lived intangible assets represents the fair value of trademarks and trade names as of the acquisition date. We do not amortize goodwill and indefinite-lived intangible assets that we expect to contribute indefinitely to our cash flows, but instead we evaluate these assets for impairment at least annually, or more frequently if interim indicators suggest that a potential impairment could exist. In testing for impairment, we will make a qualitative assessment, and if we believe that it is more likely than not that the fair value of a reporting unit is less than its carrying amount, the quantitative two-step goodwill impairment test is required. Significant negative industry or economic trends, disruptions to our business, inability to effectively integrate acquired businesses, unexpected significant changes or planned changes in use of the assets, divestitures and market capitalization declines may impair our goodwill and other indefinite-lived intangible assets. Any charges relating to such impairments could adversely affect our results of operations and financial condition in the periods recognized.
Our ability to successfully execute our organizational redesign as well as other restructuring and realignment actions could impact our business results.
We initiated an organizational redesign during the fourth quarter of 2013, shifting from individually managed businesses to an integrated approach within geographical regions. We expect that this will enable us to leverage the breadth of the Company’s product and services portfolio to better serve our customers and address market opportunities as well as effectively utilize internal support organizations to realize economies of scale and efficient use of resources. The successful implementation and execution of this redesign, which is still in the process of being implemented, as well as our other restructuring and realignment actions, is critical to achieving our expected cost savings as well as effectively competing in the marketplace. Other factors that may impede a successful implementation is retention of key employees, the impact of regulatory matters, and adverse economic market conditions. If the organizational redesign or restructuring and realignment actions are not executed successfully, the Company’s financial results could be adversely impacted.
Changes in our effective tax rates may adversely affect our financial results.
We sell our products in more than 150 countries and
62%
of our revenue was generated outside the United States in
2013
. Given the global nature of our business, a number of factors may increase our future effective tax rates, including:
|
•
|
our decision to repatriate non-U.S. earnings for which we have not previously provided for U.S. taxes;
|
|
•
|
the jurisdictions in which profits are determined to be earned and taxed;
|
|
•
|
sustainability of historical income tax rates in the jurisdictions in which we conduct business;
|
|
•
|
the resolution of issues arising from tax audits with various tax authorities; and
|
|
•
|
changes in the valuation of our deferred tax assets and liabilities, and changes in deferred tax valuation allowances.
|
Any significant increase in our future effective tax rates could reduce net income for future periods.
Our business could be adversely affected by inflation and other manufacturing and operating cost increases.
Our operating costs are subject to fluctuations, particularly due to changes in commodity prices, raw materials, energy and related utilities, freight, and cost of labor. In order to remain competitive, we may not be able to recuperate all or a portion of these higher costs from our customers through product price increases. Further, our
19
ability to realize financial benefits from Six Sigma and Lean projects may not be able to mitigate fully or in part these manufacturing and operating cost increases and, as a result, could negatively impact our profitability.
Product defects and unanticipated use or inadequate disclosure with respect to our products could adversely affect our business, reputation and financial statements.
Manufacturing or design defects in (including in products or components that we source from third parties), unanticipated use of, or inadequate disclosure of risks relating to the use of products that we make or sell can lead to personal injury, death or property damage. These events could lead to recalls or safety alerts relating to our products, result in the removal of a product from the market and result in product liability claims being brought against us. Although we have liability insurance, we cannot be certain that this insurance coverage will continue to be available to us at a reasonable cost or will be adequate to cover any product liability claims. Recalls, removals and product liability claims can result in significant costs, as well as negative publicity and damage to our reputation that could reduce demand for our products.
Our indebtedness may affect our business and may restrict our operational flexibility.
As of
December 31, 2013
, our total outstanding indebtedness was
$1,241 million
including our 3.55% Senior Notes of $600 million aggregate principal amount due September 2016 and 4.875% Senior Notes of $600 million aggregate principal amount due October 2021. We have an existing Four Year Competitive Advance and Revolving Credit Facility (the “Credit Facility”), which provides for an aggregate principal amount of up to $600 million. We have a Risk Sharing Finance Facility Agreement (the "R&D Facility Agreement") with The European Investment Bank ("EIB") in an aggregate principal amount of up to
€120 million
(approximately
$165 million
).
Our indebtedness could:
|
•
|
increase our vulnerability to general adverse economic and industry conditions;
|
|
•
|
limit our ability to obtain additional financing or borrow additional funds;
|
|
•
|
limit our ability to pay future dividends;
|
|
•
|
limit our flexibility in planning for, or reacting to, changes in our business and the industry in which we operate;
|
|
•
|
require that a substantial portion of our cash flow from operations be used for the payment of interest on our indebtedness instead of funding working capital, capital expenditures, acquisitions or other general corporate purposes; and
|
|
•
|
increase the amount of interest expense that we must pay because some of our borrowings are at variable interest rates, which, as interest rates increase, would result in higher interest expense.
|
In addition, there can be no assurance that future borrowings or equity financing will be available to us on favorable terms or at all for the payment or refinancing of our indebtedness. If we incur additional debt or raise equity through the issuance of preferred stock, the terms of the debt or preferred stock issued may give the holders rights, preferences and privileges senior to those of holders of our common stock, particularly in the event of liquidation. The terms of the debt may also impose additional and more stringent restrictions on our operations than we currently have. Also, regardless of the terms of our debt or equity financing, the amount of our stock that we can issue may be limited because the issuance of our stock may cause the distribution to be a taxable event for ITT under Section 355(e) of the Internal Revenue Code of 1986, as amended (the “Code”), and under the Tax Matters Agreement entered into by ITT in connection with the Spin-off (the “Tax Matters Agreement”), we could be required to indemnify ITT for that tax.
Our ability to make scheduled principal payments of, to pay interest on, or to refinance our indebtedness and to satisfy our other debt obligations will depend on our future operating performance, which may be affected by factors beyond our control. If we are unable to service our indebtedness, our business, financial condition and results of operations would be materially adversely affected.
Failure to comply with the U.S. Foreign Corrupt Practices Act or other applicable anti-corruption legislation could result in fines, criminal penalties and an adverse effect on our business.
We operate in a number of countries throughout the world, including countries considered to have a high risk of corruption. We are committed to doing business in accordance with applicable anti-corruption laws. We are subject,
20
however, to the risk that we or our affiliated entities or our representatives or their respective officers, directors, employees and agents, may take action determined to be in violation of such anti-corruption laws or regulations, including the U.S. Foreign Corrupt Practices Act of 1977, the U.K. Bribery Act of 2010 and others. Any such violation could result in substantial fines, sanctions, civil and/or criminal penalties, and curtailment of operations in certain jurisdictions, and might adversely affect our business, results of operations or financial condition. In addition, actual or alleged violations could damage our reputation and ability to do business. Furthermore, detecting, investigating, and resolving actual or alleged violations is expensive and can consume significant time and attention of our senior management.
We may be negatively impacted by litigation and regulatory proceedings.
We are subject to laws, regulations and potential liability relating to claims, complaints and proceedings, including those related to antitrust, environmental, product, and other matters.
We are subject to various laws, ordinances, regulations and other requirements of government authorities in foreign countries and in the United States, any violation of which could potentially create substantial liability for us and also damage to our reputation. Changes in laws, ordinances, regulations or other government policies, the nature, timing, and effect of which are uncertain, may significantly increase our expenses and liabilities.
From time to time, we are involved in legal proceedings that are incidental to the operation of our businesses, including acquisitions and divestitures. Some of these proceedings seek remedies relating to environmental matters, intellectual property matters, product liability and personal injury claims, employment, labor and pension matters, and government and commercial or contract issues, sometimes related to acquisitions or divestitures. We may become subject to significant claims of which we are currently unaware, or the claims of which we are aware may result in our incurring a significantly greater liability than we anticipate or can estimate. Additionally, we may receive fines or penalties or be required to change or cease operations at one or more facilities if a regulatory agency determines that we have failed to comply with laws, regulations or orders applicable to our business.
Our business could be adversely affected by interruptions in information technology, communications networks and operations.
Our business operations rely on information technology and communications networks, and operations that are vulnerable to damage or disturbance from a variety of sources. Regardless of protection measures, essentially all systems are susceptible to disruption due to failure, vandalism, computer viruses, security breaches, natural disasters, power outages and other events. In addition, cybersecurity threats are evolving and include, among others, malicious software, attempts to gain unauthorized access to data, and other electronic security breaches that could lead to disruptions in our systems, unauthorized release of confidential or otherwise protected information and corruption of data. We also have a concentration of operations on certain sites, e.g. production and shared services centers, where business interruptions could cause material damage and costs. Transport of goods from suppliers, and to customers, could also be hampered for the reasons stated above. Although we continue to assess these risks, implement controls, and perform business continuity planning, we cannot be sure that interruptions with material adverse effects will not occur.
Failure to retain our existing senior management, engineering, sales and other key personnel or the inability to attract and retain new qualified personnel could negatively impact our ability to operate or grow our business.
Our success will continue to depend to a significant extent on our ability to retain or attract a significant number of employees in senior management, engineering, sales and other key personnel. The ability to attract or retain employees will depend on our ability to offer competitive compensation, training and cultural benefits. We will need to continue to develop a roster of qualified talent to support business growth and replace departing employees. Effective succession planning is also important to our long-term success. Failure to ensure effective transfer of knowledge and smooth transitions involving key employees could hinder our strategic planning and execution. A failure to retain or attract highly skilled personnel could adversely affect our operating results or ability to operate or grow our business.
21
If we do not or cannot adequately protect our intellectual property, if third parties infringe our intellectual property rights, or if third parties claim that we are infringing or misappropriating their intellectual property rights, we may suffer competitive injury, expend significant resources enforcing our rights or defending against such claims, or be prevented from selling products or services.
We own numerous patents, trademarks, copyrights, trade secrets and other intellectual property and licenses to intellectual property owned by others, which in aggregate are important to our business. The intellectual property rights that we obtain, however, may not provide us with a significant competitive advantage because they may not be sufficiently broad or may be challenged, invalidated, circumvented, independently developed, or designed-around, particularly in countries where intellectual property rights laws are not highly developed or protected. Our failure to obtain or maintain intellectual property rights that convey competitive advantage, adequately protect our intellectual property or detect or prevent circumvention or unauthorized use of such property and the cost of enforcing our intellectual property rights could adversely impact our business, financial condition and results of operations.
From time to time, we receive notices from third parties alleging intellectual property infringement or misappropriation. Any dispute or litigation regarding intellectual property could be costly and time-consuming due to the complexity and the uncertainty of intellectual property litigation. Our intellectual property portfolio may not be useful in asserting a counterclaim, or negotiating a license, in response to a claim of infringement or misappropriation. In addition, as a result of such claims of infringement or misappropriation, we could lose our rights
to critical technology, be unable to license critical technology or sell critical products and services, be required to pay substantial damages or license fees with respect to the infringed rights or be required to redesign our products at substantial cost, any of which could adversely impact our competitive position and financial statements. Even if we successfully defend against claims of infringement or misappropriation, we may incur significant costs and diversion of management attention and resources, which could adversely affect our business, financial condition and results of operations.
We cannot make assurances that we will pay dividends on our common stock or continue to repurchase our common stock under Board approved share repurchase plans, and likewise our indebtedness could limit our ability to pay dividends or make share repurchases.
The timing, declaration, amount and payment of future dividends to our shareholders fall within the discretion of our Board of Directors and will depend on many factors, including our financial condition, results of operations and capital requirements, as well as applicable law, regulatory constraints, industry practice and other business considerations that our Board of Directors considers relevant. There can be no assurance that we will pay a dividend in the future or continue to pay dividends.
Further, the timing and amount of the repurchase of our common stock under Board approved share repurchase plans has similar dependencies as the payment of dividends and accordingly, there can be no assurances that we will continue to repurchase our common stock.
Additionally, if we cannot generate sufficient cash flow from operations to meet our debt-payment obligations, then our ability to pay dividends, if so determined by the Board of Directors, or make share repurchases will be impaired and we may be required to attempt to restructure or refinance our debt, raise additional capital or take other actions such as selling assets, reducing or delaying capital expenditures, reducing our dividend or delaying or curtailing share repurchases. There can be no assurance, however, that any such actions could be effected on satisfactory terms, if at all, or would be permitted by the terms of our debt or our other credit and contractual arrangements.
The level of returns on postretirement benefit plan assets, changes in interest rates and other factors could affect our earnings and cash flows in future periods.
Certain members of our current and retired employee population are covered by pension and other employee-related defined benefit plans (collectively, postretirement benefit plans). We may experience significant fluctuations in costs related to our postretirement benefit plans as a result of macro-economic factors, such as interest rates, that are beyond our control. The cost of our postretirement plans is incurred over long periods of time and involves factors and uncertainties during those periods which can be volatile and unpredictable, including rates of return on postretirement benefit plan assets, discount rates used to calculate liabilities and expenses and rates of future compensation increases. Management develops each assumption using relevant plan and Company experience and expectations in conjunction with market-related data. Our liquidity, financial position (including shareholders’
22
equity) and results of operations could be materially affected by significant changes in key economic indicators, actuarial experience, financial market volatility, future legislation and other governmental regulatory actions.
We make contributions to fund our postretirement benefit plans when considered necessary or advantageous to do so. The macro-economic factors discussed above, including the return on postretirement benefit plan assets and the minimum funding requirements established by local government funding or taxing authorities, or established by other agreement, may influence future funding requirements. A significant decline in the fair value of our plan assets, or other adverse changes to our overall pension and other employee-related benefit plans, could require us to make significant funding contributions and affect cash flows in future periods.
Unforeseen environmental issues could impact our financial position or results of operations.
Our operations are subject to and affected by many federal, state, local and foreign environmental laws and regulations. In addition, we could be affected by future environmental laws or regulations, including, for example, those imposed in response to climate change concerns. Compliance with current and future environmental laws and regulations currently requires and is expected to continue to require operating and capital expenditures.
Environmental laws and regulations may authorize substantial fines and criminal sanctions as well as facility shutdowns to address violations, and may require the installation of costly pollution control equipment or operational changes to limit emissions or discharges. We also incur, and expect to continue to incur, costs to comply with current environmental laws and regulations.
Developments such as the adoption of new environmental laws and regulations, stricter enforcement of existing laws and regulations, violations by us of such laws and regulations, discovery of previously unknown or more extensive contamination, litigation involving environmental impacts, our inability to recover costs associated with any such developments, or financial insolvency of other responsible parties could in the future have a material adverse effect on our financial position and results of operations.
The market price of our common stock may fluctuate significantly.
We cannot predict the prices at which our common stock may trade. The market price of our common stock may fluctuate widely, depending on many factors, some of which may be beyond our control, including:
|
•
|
actual or anticipated fluctuations in our operating results due to factors related to our business;
|
|
•
|
success or failure of our business strategy;
|
|
•
|
our quarterly or annual earnings, or those of other companies in our industry;
|
|
•
|
our ability to obtain financing as needed;
|
|
•
|
announcements by us or our competitors of significant new business awards;
|
|
•
|
announcements by us or our competitors of significant acquisitions or dispositions;
|
|
•
|
changes in accounting standards, policies, guidance, interpretations or principles;
|
|
•
|
changes in earnings estimates by securities analysts or our ability to meet those estimates;
|
|
•
|
the operating and stock price performance of other comparable companies;
|
|
•
|
natural or environmental disasters that investors believe may affect us;
|
|
•
|
overall market fluctuations;
|
|
•
|
fluctuations in the budgets of federal, state and local governmental entities around the world;
|
|
•
|
results from any material litigation or government investigation;
|
|
•
|
changes in laws and regulations affecting our business; and
|
|
•
|
general economic conditions and other external factors.
|
23
Stock markets in general have experienced volatility that has often been unrelated to the operating performance of a particular company. These broad market fluctuations could adversely affect the trading price of our common stock.
Anti-takeover provisions in our organizational documents and Indiana law could delay or prevent a change in control.
Certain provisions of our second amended and restated articles of incorporation and our amended and restated by-laws may delay or prevent a merger or acquisition part or all of our business operations. For example, the second amended and restated articles of incorporation and the amended and restated by-laws, among other things, require advance notice for shareholder proposals and nominations, do not permit shareholders to convene special meetings and do not permit action by written consent of the shareholders, unless unanimous. In addition, the amended and restated articles of incorporation authorize our Board of Directors to issue one or more series of preferred stock. These provisions may also discourage acquisition proposals of our business operations or delay or prevent a change in control, which could harm our stock price. Indiana law also imposes some restrictions on mergers and other business combinations between any holder of 10% or more of our outstanding common stock and us.
Risks Related to our 2011 Separation from ITT Corporation
If the Spin-off were to fail to qualify as a tax-free transaction under the Internal Revenue Code, then we and/or our former parent and our stockholders could be subject to significant tax liability.
In connection with the Spin-off, we and our former parent, ITT Corporation, received an IRS ruling (the “IRS Ruling”) stating that ITT and its shareholders will not recognize any taxable income, gain or loss for U.S. Federal income tax purposes as a result of the Spin-off. In addition, ITT received an opinion of tax counsel as to the satisfaction of certain requirements necessary for the Spin-off to receive tax-free treatment upon which the IRS did not rule. The IRS Ruling, while generally binding upon the IRS, was based on certain factual statements and representations. If any such factual statements or representations were incomplete or untrue in any material respect, or if the facts on which the IRS Ruling were based were materially different from the facts at the time of the Spin-off, the IRS could modify or revoke the IRS Ruling retroactively.
As discussed above, certain requirements for tax-free treatment that are not covered in the IRS Ruling were addressed in the opinion of counsel. The opinion of counsel is not binding on the IRS. Accordingly, the IRS may reach conclusions with respect to the Spin-off that are different from the conclusions reached in the opinion. Like the IRS Ruling, the opinion was based on certain factual statements and representations, which, if incomplete or untrue in any material respect, could alter counsel’s conclusions.
If all or a portion of the Spin-off does not qualify as a tax-free transaction because any of the factual statements or representations in the IRS Ruling or the legal opinion are incomplete or untrue, or because the facts upon which the IRS Ruling is based were materially different from the facts at the time of the Spin-off, ITT would recognize a substantial gain for U.S. Federal income tax purposes. In such case, under U.S. Treasury regulations each member of the ITT consolidated group at the time of the Spin-off (including us and our subsidiaries), would be jointly and severally liable for the entire amount of any resulting U.S. Federal income tax liability.
Notwithstanding the foregoing, the Spin-off will be taxable to ITT (but not to ITT shareholders) pursuant to Section 355(e) of the Internal Revenue Code if there are one or more acquisitions (including issuances) of the stock of either us or ITT, representing 50% or more, measured by vote or value, of the then-outstanding stock of either corporation and the acquisition or acquisitions are deemed to be part of a plan or series of related transactions that include the Spin-off. Any acquisition of our common stock within two years before or after the Spin-off (with exceptions, including public trading by less-than-5% shareholders and certain compensatory stock issuances) generally will be presumed to be part of such a plan unless that presumption is rebutted. The tax liability resulting from the application of Section 355(e) would be substantial. In addition, under U.S. Treasury regulations, each member of the ITT consolidated group at the time of the Spin-off (including us and our subsidiaries) would be severally liable for the resulting U.S. Federal income tax liability.
We have agreed not to enter into any transaction that could cause any portion of the Spin-off to be taxable to ITT, including under Section 355(e). Pursuant to the Tax Matters Agreement, dated as of October 25, 2011 among ITT, Exelis and Xylem, we have also agreed to indemnify ITT and Exelis for any tax liabilities resulting from such transactions, and ITT and Exelis have agreed to indemnify us for any tax liabilities resulting from such transactions
24
entered into by ITT or Exelis. These obligations may discourage, delay or prevent a change of control of our Company.
The Spin-off may expose us to potential liabilities arising out of state and federal fraudulent conveyance laws and legal distribution requirements.
The Spin-off could be challenged under various state and federal fraudulent conveyance laws. An unpaid creditor or an entity vested with the power of such creditor (such as a trustee or debtor-in-possession in a bankruptcy) could claim that the Spin-off left us, ITT and/or Exelis insolvent or with unreasonably small capital or that we, ITT and/or Exelis intended or believed it would incur debts beyond its ability to pay as they mature and that ITT did not receive fair consideration or reasonably equivalent value in the Spin-off. If a court were to agree with such a plaintiff, then such court could void the Spin-off as a fraudulent transfer and could impose a number of different remedies, which could adversely affect our financial condition and our results of operations. Among other things, the court could require the return of assets or our shares to ITT, voiding the liens of Xylem and claims against ITT, or providing ITT with a claim for money damages against us.
The measure of insolvency for purposes of the fraudulent conveyance laws will vary depending on which jurisdiction’s law is applied. Generally, however, an entity would be considered insolvent if either the fair saleable value of its assets is less than the amount of its liabilities (including the probable amount of contingent liabilities), or it is unlikely to be able to pay its liabilities as they become due. No assurance can be given as to what standard a court would apply to determine insolvency or that a court would determine that we, ITT or Exelis were solvent at the time of or after giving effect to the Spin-off.
The Spin-off could also be challenged under state corporate distribution statutes. Under the Indiana Business Corporation Law, a corporation may not make distributions to its shareholders if, after giving effect to the distribution, (i) the corporation would not be able to pay its debts as they become due in the usual course of business; or (ii) the corporation’s total assets would be less than the sum of its total liabilities. No assurance can be given that a court will not later determine that the distribution of our shares in connection with the Spin-off was unlawful.
Under the Distribution Agreement, from and after the Spin-off, we will be responsible for the debts, liabilities and other obligations related to the business or businesses which we own and operate following the consummation of the Spin-off. Although we do not expect to be liable for any of these or other obligations not expressly assumed by us pursuant to the Distribution Agreement, it is possible that we could be required to assume responsibility for certain obligations retained by ITT or Exelis should ITT or Exelis fail to pay or perform its retained obligations (for example, tax, asbestos and/or environmental liabilities).
In connection with our separation, ITT and Exelis will indemnify us for certain liabilities and we will indemnify ITT or Exelis for certain liabilities. If we are required to indemnify ITT or Exelis, we may need to divert cash to meet those obligations and our financial results could be negatively impacted. In the case of ITT’s or Exelis’s indemnity, there can be no assurance that those indemnities will be sufficient to insure us against the full amount of such liabilities, or as to ITT’s or Exelis’s ability to satisfy its indemnification obligations in the future.
Pursuant to the Distribution Agreement and certain other agreements with ITT and Exelis, ITT and Exelis agreed to indemnify us from certain liabilities, and we agreed to indemnify ITT and Exelis for certain liabilities. Indemnities that we may be required to provide ITT and Exelis may be significant and could negatively impact our business, particularly indemnities relating to our actions that could impact the tax-free nature of the Spin-off. Third parties could also seek to hold us responsible for any of the liabilities that ITT or Exelis has agreed to retain. Further, there can be no assurance that the indemnities from ITT and Exelis will be sufficient to protect us against the full amount of such liabilities, or that ITT and Exelis will be able to fully satisfy their indemnification obligations. Moreover, even if we ultimately were to succeed in recovering from ITT and Exelis any amounts for which we are held liable, we may be temporarily required to bear these losses ourselves. Each of these risks could negatively affect our business, results of operations and financial condition.
None.
25
We have more than 350 locations in more than 40 countries. These properties total approximately 10.4 million square feet, of which more than 300 locations, or approximately 6.0 million square feet, are leased. We consider the many offices, plants, warehouses, and other properties that we own or lease to be in good condition and generally suitable for the purposes for which they are used. The following table shows the significant locations by segment.
|
Location
|
State or
Country
|
Principal Business Activity
|
Approx.
Square
Feet
|
Owned or
Expiration
Date
of Lease
|
|||||
|
Water Infrastructure
|
|||||||||
|
Emmaboda
|
Sweden
|
Administration and Manufacturing
|
1,156,000
|
|
Owned
|
||||
|
Stockholm
|
Sweden
|
Administration and Research & Development
|
172,000
|
|
2019
|
||||
|
Shenyang
|
China
|
Manufacturing
|
125,000
|
|
Owned
|
||||
|
Yellow Springs
|
OH
|
Administration and Manufacturing
|
108,000
|
|
Owned
|
||||
|
Applied Water
|
|||||||||
|
Morton Grove
|
IL
|
Administration and Manufacturing
|
530,000
|
|
Owned
|
||||
|
Montecchio
|
Italy
|
Administration and Manufacturing
|
379,000
|
|
Owned
|
||||
|
Nanjing
|
China
|
Manufacturing
|
363,000
|
|
Owned
|
||||
|
Auburn
|
NY
|
Manufacturing
|
273,000
|
|
Owned
|
||||
|
Lubbock
|
TX
|
Manufacturing
|
229,000
|
|
Owned
|
||||
|
Cheektowaga
|
NY
|
Manufacturing
|
145,000
|
|
Owned
|
||||
|
Corporate Headquarters
|
|||||||||
|
Rye Brook
|
NY
|
Administration
|
67,000
|
|
2023
|
||||
In December 2013, we completed the move of our corporate headquarters to 1 International Drive, Rye Brook, NY. The new headquarters consists of approximately 67,000 square feet of office space for a lease period ending in December 2023.
From time to time, we are involved in legal proceedings that are incidental to the operation of our businesses, including acquisitions and divestitures, environmental matters, intellectual property matters, product liability and personal injury claims, employment and pension matters, government and commercial contract disputes. Although we cannot predict the outcome of these and other proceedings, including the cases below, with certainty, we believe that they will not have a material adverse effect on our consolidated financial position and results of operations.
On or about February 17, 2009, following a statement submitted to the Spanish Competition Authority (Comision Nacional de la Competencia, "CNC") by Grupo Industrial Ercole Marelli, S.A. regarding an anti-competitive agreement in which it said it had been participating, the CNC conducted an investigation at ITT Water & Wastewater España S.A. (now named Xylem Water Solutions España S.A.), at the Spanish Association of Fluid Pump Manufacturers (the "Association"), and at the offices of other members of the Association. On September 16, 2009, the Directorate of Investigation of the CNC commenced formal proceedings for alleged restrictive practices, such as several exchanges of information and a recommendation on general terms and conditions of sale, allegedly prohibited under applicable law. Following the conclusion of the formal proceedings, the CNC Council imposed fines on the Association and nineteen Spanish manufacturers and distributors of fluid pumps, including a fine of Euro 2,373,675 applied to ITT Water & Wastewater España S.A. and ITT Corporation. In March 2012, the Company appealed the CNC's decision to the Audiencia Nacional (the "High Court"), and vigorously defended the case. In March 2013, the High Court upheld the determination of the CNC and the fine previously assessed. In April 2013, the Company filed a notice of appeal before the Tribunal Supremo, the Supreme Court of Spain and in June 2013, the Company filed an appellate brief with the Supreme Court, which was admitted. These appellate proceedings are expected to last one to two years.
On October 4, 2013, the Company and Xylem Group LLC entered into a settlement agreement with respect to the proceedings in the U.S. District Court for the Northern District of Georgia originally commenced on October 26, 2011 regarding the Company's use of the "XYLEM" mark. Pursant to the settelment agreement, both parties
26
released each other from all extisting claims, and all claims have been dismissed by the U.S. District Court for the Northern District of Georgia with prejudice.
None.
27
EXECUTIVE OFFICERS OF THE REGISTRANT
The following information is provided regarding the executive officers of Xylem:
|
NAME
|
AGE
|
CURRENT TITLE
|
OTHER BUSINESS EXPERIENCE DURING PAST 5 YEARS
|
|||
|
Steven R. Loranger
|
61
|
President and Chief Executive Officer (2013)
|
• Chairman Emeritus of Xylem Inc. Board of Directors (2011)
• Chairman, President and Chief Executive Officer, ITT Corporation (2004)
|
|||
|
Michael T. Speetzen
|
44
|
Senior VP and Chief Financial Officer (2011)
|
• VP of Finance, ITT Fluid and Motion Control (2009)
|
|||
|
Christopher R. McIntire
|
50
|
Senior VP and President, Global Analytics and Treatment (2013)
|
• Senior VP and President, Analytics (2011)
• President and Chief Operating Officer, Nova Analytics (2006)
|
|||
|
Kenneth Napolitano
|
52
|
Senior VP and President, Global Applied Water Systems (2013)
|
• Senior VP and President, Applied Water Systems (2012)
• Senior VP and President, Residential and Commercial Water (2011)
• President, Residential and Commercial Water (2009)
|
|||
|
Angela A. Buonocore
|
56
|
Senior VP and Chief Communications Officer (2011)
|
• Senior VP and Chief Communications Officer, ITT Corporation (2008)
|
|||
|
Nicholas R. Colisto
|
47
|
Senior VP and Chief Information Officer (2012)
|
• VP and Chief Information Officer, Hovnanian Enterprises, Inc. (2008)
|
|||
|
Robyn T. Mingle
|
48
|
Senior VP and Chief Human Resources Officer (2011)
|
• Senior VP of Human Resources, Hovnanian Enterprises, Inc. (2003)
|
|||
|
Colin R. Sabol
|
46
|
Senior VP and President, Global Dewatering (2013)
|
• Senior VP and Chief Strategy and Growth Officer (2011)
• VP of Marketing and Business Development, ITT Fluid and Motion Control (2009)
|
|||
Note: Date in parentheses indicates the year in which the position was assumed.
28
2013
and
2012
Market Price and Dividends
Our common stock trades publicly on the New York Stock Exchange under the trading symbol “XYL”. The following table shows the high and low prices per share of our common stock as reported by the New York Stock Exchange and the dividends declared per share for the periods indicated.
|
High
|
Low
|
Dividend
|
|||||||||
|
Fiscal Year ended December 31, 2013
|
|||||||||||
|
First Quarter
|
$
|
29.49
|
|
$
|
26.39
|
|
$
|
0.1164
|
|
||
|
Second Quarter
|
29.19
|
|
25.56
|
|
0.1164
|
|
|||||
|
Third Quarter
|
29.79
|
|
23.61
|
|
0.1164
|
|
|||||
|
Fourth Quarter
|
34.93
|
|
26.99
|
|
0.1164
|
|
|||||
|
Fiscal Year ended December 31, 2012
|
|||||||||||
|
First Quarter
|
$
|
28.87
|
|
$
|
24.82
|
|
$
|
0.1012
|
|
||
|
Second Quarter
|
28.54
|
|
23.02
|
|
0.1012
|
|
|||||
|
Third Quarter
|
26.00
|
|
22.43
|
|
0.1012
|
|
|||||
|
Fourth Quarter
|
27.67
|
|
23.41
|
|
0.1012
|
|
|||||
The closing price of our common stock on the NYSE on January 31,
2014
was $33.36 per share. As of January 31,
2014
, there were 16,626 holders of record of our common stock.
Dividends are declared and paid on the common stock at the discretion of our Board of Directors and depend on our profitability, financial condition, capital needs, future prospects, and other factors deemed relevant by our Board. Therefore, there can be no assurance as to what level of dividends, if any, will be paid in the future. In the first quarter of
2014
, we declared a dividend of $0.128 per share to be paid on March 19,
2014
for shareholders of record on February 19,
2014
.
There have been no unregistered offerings of our common stock during
2013
.
Fourth Quarter
2013
Share Repurchase Activity
The following table summarizes our purchases of our common stock for the quarter ended
December 31, 2013
:
|
(in millions, except per share amounts)
|
||||||||
|
Period
|
Total Number of Shares Purchased
|
Average Price Paid per Share (a)
|
Total Number of Shares Purchased as Part of Publicly Announced Plans or Programs (b)
|
Approximate Dollar Value of Shares That May Yet Be Purchased Under the Plans or Programs (b)
|
||||
|
10/1/13 - 10/31/13
|
—
|
—
|
—
|
$259.5
|
||||
|
11/1/13 - 11/30/13
|
0.6
|
$34.03
|
0.6
|
$239.1
|
||||
|
12/1/13 - 12/31/13
|
0.1
|
$33.56
|
0.1
|
$234.6
|
||||
(a) Average price paid per share is calculated on a settlement basis.
|
(b)
|
On August 18, 2012, the Board of Directors authorized the repurchase of up to two million shares of common stock with no expiration date. The program's objective is to offset dilution associated with various Xylem employee stock plans by acquiring shares in the open market from time to time. There were no shares purchased under this program during the three months ended
December 31, 2013
and there are 1.0 million shares (approximately $35 million based on a share price of $34.60 per share) that may still be purchased under this plan.
|
On August 20, 2013, the Board of Directors authorized the repurchase of shares up to $250 million with no expiration date. The program's objective is to deploy our capital in a manner that benefits our shareholders and maintains our focus on growth. During the three months ended
December 31, 2013
, 0.7 million shares were repurchased at an
29
average price of $33.94 per share for a total cost of $25 million. There are up to $200 million in shares that may still be purchased under this plan.
PERFORMANCE GRAPH
CUMULATIVE TOTAL RETURN
The following graph compares the relative performance of our common stock, the S&P 500 Index and the S&P 500 Industrials Index. This graph covers the period from October 13, 2011 (the first day our common stock began “when-issued” trading on the NYSE) through
December 31, 2013
. Our common stock began “regular-way” trading following the Spin-off on November 1, 2011.
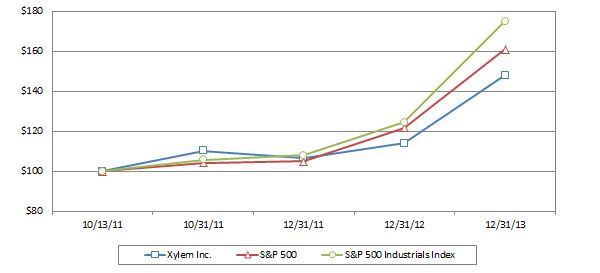
|
XYL
|
S&P 500
|
S&P 1500
Industrials
Index
|
|||||||||
|
October 13, 2011
|
$
|
100
|
|
$
|
100
|
|
$
|
100
|
|
||
|
October 31, 2011
|
110
|
|
104
|
|
106
|
|
|||||
|
December 31, 2011
|
106
|
|
105
|
|
108
|
|
|||||
|
December 31, 2012
|
114
|
|
121
|
|
124
|
|
|||||
|
December 31, 2013
|
148
|
|
161
|
|
175
|
|
|||||
The graph is not, and is not intended to be, indicative of future performance of our common stock.
This performance graph shall not be deemed “filed” with the SEC or subject to the liabilities of Section 18 of the Securities Exchange Act of 1934, and should not be deemed incorporated by reference into any of our prior or subsequent filings under the Securities Act of 1933 or the Securities Exchange Act of 1934, except as shall be expressly set forth by specific reference in such filing.
30
The following table sets forth selected consolidated and combined financial data for the five years ended
December 31, 2013
. This selected consolidated financial data should be read in conjunction with “Management’s Discussion and Analysis of Financial Condition and Results of Operations” and the consolidated and combined financial statements and the notes thereto included in this Report.
|
|
Year Ended
December 31,
|
||||||||||||||||||
|
(in millions, except per share data)
|
2013
|
2012
|
2011 (c)
|
2010 (b)
|
2009
|
||||||||||||||
|
Results of Operations Data:
|
|||||||||||||||||||
|
Revenue
|
$
|
3,837
|
|
$
|
3,791
|
|
$
|
3,803
|
|
$
|
3,202
|
|
$
|
2,849
|
|
||||
|
Gross profit
|
1,499
|
|
1,502
|
|
1,461
|
|
1,214
|
|
1,037
|
|
|||||||||
|
Gross margin
|
39.1
|
%
|
39.6
|
%
|
38.4
|
%
|
37.9
|
%
|
36.4
|
%
|
|||||||||
|
Operating income
|
363
|
|
443
|
|
395
|
|
388
|
|
276
|
|
|||||||||
|
Operating margin
|
9.5
|
%
|
11.7
|
%
|
10.4
|
%
|
12.1
|
%
|
9.7
|
%
|
|||||||||
|
Net income
|
228
|
|
297
|
|
279
|
|
329
|
|
263
|
|
|||||||||
|
Per Share Data:
|
|||||||||||||||||||
|
Earnings per share:
|
|||||||||||||||||||
|
Basic
|
$
|
1.23
|
|
$
|
1.60
|
|
$
|
1.51
|
|
$
|
1.78
|
|
$
|
1.42
|
|
||||
|
Diluted
|
1.22
|
|
1.59
|
|
1.50
|
|
1.78
|
|
1.42
|
|
|||||||||
|
Basic shares outstanding (a)
|
185.2
|
|
185.8
|
|
185.1
|
|
184.6
|
|
184.6
|
|
|||||||||
|
Diluted shares outstanding (a)
|
186.0
|
|
186.2
|
|
185.3
|
|
184.6
|
|
184.6
|
|
|||||||||
|
Cash dividends per share
|
$
|
0.4656
|
|
$
|
0.4048
|
|
$
|
0.1012
|
|
$
|
—
|
|
$
|
—
|
|
||||
|
Balance Sheet Data (at period end):
|
|||||||||||||||||||
|
Cash and cash equivalents
|
$
|
533
|
|
$
|
504
|
|
$
|
318
|
|
$
|
131
|
|
$
|
81
|
|
||||
|
Working capital*
|
930
|
|
859
|
|
834
|
|
759
|
|
636
|
|
|||||||||
|
Total assets
|
4,896
|
|
4,679
|
|
4,400
|
|
3,742
|
|
2,542
|
|
|||||||||
|
Total debt
|
1,241
|
|
1,205
|
|
1,206
|
|
4
|
|
4
|
|
|||||||||
|
*
|
The Company calculates Working Capital as follows: Net Accounts Receivable + Net Inventory - Accounts Payable - Customer Advances.
|
|
(a)
|
On October 31, 2011, the Spin-off from ITT was completed through a tax-free stock dividend to ITT’s shareholders. ITT shareholders received one share of Xylem common stock for each share of ITT common stock. As a result on October 31, 2011, we had 184.6 million shares of common stock outstanding and this share amount is being utilized to calculate earnings per share and diluted earnings per share for all prior periods presented.
|
|
(b)
|
In 2010, we acquired Godwin Pumps of America, Inc. and Nova Analytics Corporation. These businesses in the aggregate contributed revenue of $247 million in 2010 and $1,070 million of total assets on date of acquisition.
|
|
(c)
|
In 2011, we acquired YSI Incorporated, which contributed revenue of $35 million in 2011 and $371 million of total assets on date of acquisition.
|
31
The following discussion should be read in conjunction with our consolidated and combined financial statements and the notes thereto. This discussion summarizes the significant factors affecting our results of operations and the financial condition of our business during each of the fiscal years in the three-year period ended
December 31, 2013
. Except as otherwise indicated or unless the context otherwise requires, “Xylem,” “we,” “us,” “our” and “the Company” refer to Xylem Inc. and its subsidiaries. References in the consolidated and combined financial statements to “ITT” or “parent” refer to ITT Corporation (former parent of Xylem) and its consolidated subsidiaries (other than Xylem).
On and prior to October 31, 2011 (the "Distribution Date"), our financial position and results of operations consisted of the water equipment and services businesses of ITT Corporation (“WaterCo”). The Spin-off (the "Spin-off") was completed pursuant to the Distribution Agreement, dated as of October 25, 2011, among ITT, Exelis Inc. and Xylem. After the Distribution Date, ITT did not beneficially own any shares of Xylem common stock and, following such date, financial results of Xylem are not consolidated in ITT’s financial reporting. Xylem's financial position and results of operations have been derived from ITT’s historical accounting records and are presented on a carve-out basis through our Distribution Date, while our financial results for Xylem post Spin-off are prepared on a stand-alone basis. In addition, financial information for the twelve months ended December 31, 2011 consists of the consolidated results of Xylem on a stand-alone basis for the two months of November and December and the combined results of operations of WaterCo for the first ten months on a carve-out basis.
Overview
Xylem is a leading equipment and service provider for water and wastewater applications with a broad portfolio of products and services addressing the full cycle of water, from collection, distribution and use to the return of water to the environment. Our business focuses on providing technology-intensive equipment and services. Our product and service offerings are organized into two segments: Water Infrastructure and Applied Water. Our segments are aligned with each of the sectors in the cycle of water, water infrastructure and usage applications. The Water Infrastructure segment focuses on the transportation, treatment and testing of water, offering a range of products including water and wastewater pumps, treatment and testing equipment, and controls and systems. The Applied Water segment serves many of the primary uses of water and focuses on the residential, commercial, industrial and agricultural markets. The segment’s major products include pumps, valves, heat exchangers, controls and dispensing equipment.
|
•
|
Water Infrastructure
serves the water infrastructure sector with pump systems that transport water from aquifers, lakes, rivers and seas; with filtration, ultraviolet and ozone systems that provide treatment, making the water fit to use; and pumping solutions that move the wastewater to treatment facilities where our mixers, biological treatment, monitoring, and control systems provide the primary functions in the treatment process. We provide analytical instrumentation used to measure water quality, flow, and level in wastewater, surface water, and coastal environments.
|
|
•
|
Applied Water
serves the usage applications sector with water pressure boosting systems for heating, ventilation and air conditioning and for fire protection systems to the residential and commercial building services markets. In addition, our pumps, heat exchangers, valves and controls provide cooling to power plants and manufacturing facilities, as well as circulation for food and beverage processing. We also provide boosting systems for farming irrigation, pumps for dairy operations, and rainwater reuse systems for small scale crop and turf irrigation.
|
We sell our equipment and services through direct and indirect channels that serve the needs of each customer type. In the Water Infrastructure segment for the year ended
2013
, we provided the majority of our sales direct to customers with strong application expertise, while the remaining amount was through distribution partners. In the Applied Water segment, we provided the majority of our sales in
2013
through long-standing relationships with the world’s leading distributors, with the remainder going direct to customers.
Key Performance Indicators and Non-GAAP Measures
Management reviews key performance indicators including revenue, gross margin, segment operating income and margins, earnings per share, orders growth, working capital, free cash flow and backlog, among others. In addition, we consider certain measures to be useful to management and investors evaluating our operating performance for the periods presented, and provide a tool for evaluating our ongoing operations, liquidity and management of
32
assets. This information can assist investors in assessing our financial performance and measures our ability to generate capital for deployment among competing strategic alternatives and initiatives, including, but not limited to, dividends, acquisitions, share repurchases and debt repayment. These metrics, however, are not measures of financial performance under accounting principles generally accepted in the United States of America (“GAAP”) and should not be considered a substitute for revenue, operating income, net income, earnings per share (basic and diluted) or net cash from operations as determined in accordance with GAAP. We consider the following non-GAAP measures, which may not be comparable to similarly titled measures reported by other companies, to be key performance indicators:
|
•
|
"organic revenue" and "organic orders" defined as revenue and orders, respectively, excluding the impact of foreign currency fluctuations, intercompany transactions and contributions from acquisitions and divestitures. Divestitures include sales of insignificant portions of our business that did not meet the criteria for classification as a discontinued operation. The period-over-period change resulting from foreign currency fluctuations assumes no change in exchange rates from the prior period.
|
|
•
|
"constant currency" defined as financial results adjusted for currency translation impacts by translating current period and prior period activity using the same currency conversion rate. This approach is used for countries whose functional currency is not the U.S. dollar.
|
|
•
|
"adjusted net income" and "adjusted earnings per share" defined as net income and earnings per share, respectively, adjusted to exclude non-recurring separation costs from the Spin-off (not excluded in 2013), restructuring and realignment costs, special charges and tax-related special items. A reconciliation of adjusted net income is provided below.
|
|
(in millions, except per share data)
|
2013
|
2012
|
||||||
|
Net income
|
$
|
228
|
|
$
|
297
|
|
||
|
Separation costs, net of tax (a)
|
—
|
|
16
|
|
||||
|
Restructuring and realignment, net of tax
|
46
|
|
17
|
|
||||
|
Special charges, net of tax
|
23
|
|
—
|
|
||||
|
Tax-related special items
|
14
|
|
—
|
|
||||
|
Adjusted net income
|
$
|
311
|
|
$
|
330
|
|
||
|
Weighted average number of shares - Diluted
|
186.0
|
|
186.2
|
|
||||
|
Adjusted earnings per share
|
$
|
1.67
|
|
$
|
1.77
|
|
||
|
(a)
|
Costs of
$4 million
(
$2 million
, net of tax) during
2013
, associated with non-recurring separation activities are not excluded from adjusted net income.
|
|
•
|
"operating expenses excluding separation, restructuring and realignment costs and special charges" defined as operating expenses, adjusted to exclude non-recurring separation costs from the Spin-off (not excluded in
2013
), restructuring and realignment costs and special charges.
|
|
•
|
"adjusted segment operating income" defined as segment operating income, adjusted to exclude non-recurring separation costs from the Spin-off (not excluded in
2013
), restructuring and realignment costs and special charges, and "adjusted segment operating margin" defined as adjusted segment operating income divided by total segment revenue.
|
|
•
|
“realignment costs” defined as non-recurring costs not included in restructuring costs that are incurred as part of actions taken to reposition our business, including items such as professional fees, relocation, travel and other costs.
|
|
•
|
“special charges" defined as costs incurred by the Company associated with the settlement of legal proceedings with Xylem Group LLC and certain costs incurred for the change in chief executive officer made during the third quarter of 2013, as well as costs incurred in the fourth quarter of 2013 for the contractual indemnification of federal tax obligations to ITT and costs associated with a legal judgment arising from a historical acquisition matter.
|
|
•
|
"free cash flow" defined as net cash provided by operating activities less capital expenditures, as well as adjustments for other significant items that impact current results that management believes are not related to our ongoing operations and performance. Our definition of free cash flow does not consider certain non-discretionary cash payments, such as debt. The following table provides a reconciliation of free cash flow.
|
33
|
(in millions)
|
2013
|
2012
|
||||||
|
Net cash provided by operating activities
|
$
|
324
|
|
$
|
396
|
|
||
|
Capital expenditures
|
(126
|
)
|
(112
|
)
|
||||
|
Separation cash payments (a)
|
—
|
|
28
|
|
||||
|
Free cash flow
|
$
|
198
|
|
$
|
312
|
|
||
|
(a)
|
Separation cash payments associated with non-recurring separation activities are included in the 2013 free cash flow. Separation cash payments are excluded from free cash flow in 2012 and include capital expenditures associated with the Spin-off of $4 million.
|
Executive Summary
Xylem reported revenue for
2013
of
$3,837 million
, an increase of
1.2%
from
$3,791 million
reported in
2012
. The 2012 and 2013 acquisitions within our Water Infrastructure segment contributed
$82 million
of incremental revenue during 2013 or 2.2%. Continued challenging market conditions in Europe drove a decrease in revenue while the United States and emerging markets held flat. Operating income for the year ended
2013
was
$363 million
, reflecting a decrease of
$80 million
or
18.1%
compared to
$443 million
in
2012
, which was primarily due to increased restructuring costs, special charges in 2013 and geographic mix headwinds partially offset by the benefits achieved from cost reductions and higher price realization.
Additional financial highlights for
2013
include the following:
|
•
|
Net income of
$228 million
, or
$1.22
per diluted share (
$311 million
or
$1.67
on an adjusted basis)
|
|
•
|
Free cash flow generation of
$198 million
, and net cash from operating activities of $324 million
|
|
•
|
Orders of $
3,912 million
(a
3.4%
increase from
2012
on a constant currency basis)
|
|
•
|
We repurchased $67 million in shares under the $250 million share repurchase program approved by our Board of Directors in 2013 and the previous share repurchase program implemented in 2012 as part of our strategy to enhance shareholder return and offset the impact of employee stock plans
|
|
•
|
Dividends paid to shareholders increased 15% in 2013
|
2014
Business Outlook
In 2014, we are expecting some of the trends that we saw in the second half of 2013 to continue. We expect a continued slow recovery in the United States industrial markets combined with modest improved performance in our European industrial end markets. Globally, while our industrial markets are improving in production and capital outlay, continued weak performance in mining is expected. We expect public utilities to return to modest levels of growth in 2014, with growth driven by operations and maintenance spending, partially offset by continued weakness in capital expenditure spending by our customers. In general, we expect a slow recovery in most of the developed country end markets and modestly higher levels of growth in emerging markets. We are continuing to execute restructuring and realignment actions to reposition our European and North American business to optimize our cost structure and improve our operational efficiency and effectiveness. During 2013, we incurred $40 million and $24 million in restructuring and realignment costs, respectively. As a result of the restructuring actions in 2013, we realized $13 million of net savings. In 2014, we expect to incur approximately $30 to $35 million in restructuring costs, and approximately $10 to $15 million in realignment costs. We expect to realize $25 million of incremental net savings in 2014 from actions initiated in 2013, and an additional $10 million of net savings from our 2014 actions. Additional strategic actions we are taking include investing in a customer relationship management system, growth platforms and new product development, as well as executing operating efficiencies through lean six sigma and global sourcing initiatives. We also will refocus on the Xylem Management System which integrates our key business processes.
34
Results of Operations
|
(in millions)
|
2013
|
2012
|
2011
|
2013 v.
2012
|
2012 v.
2011
|
|||||||||||||
|
Revenue
|
$
|
3,837
|
|
$
|
3,791
|
|
$
|
3,803
|
|
1.2
|
%
|
(0.3
|
)%
|
|||||
|
Gross profit
|
1,499
|
|
1,502
|
|
1,461
|
|
(0.2
|
)%
|
2.8
|
%
|
||||||||
|
Gross margin
|
39.1
|
%
|
39.6
|
%
|
38.4
|
%
|
(50)bp
|
|
120bp
|
|
||||||||
|
Operating expenses excluding separation, restructuring and realignment costs and special charges (a)
|
1,048
|
|
1,013
|
|
979
|
|
3.5
|
%
|
3.5
|
%
|
||||||||
|
Expense to revenue ratio
|
27.3
|
%
|
26.7
|
%
|
25.7
|
%
|
60bp
|
|
100bp
|
|
||||||||
|
Restructuring and realignment costs
|
64
|
|
24
|
|
—
|
|
166.7
|
%
|
NM
|
|
||||||||
|
Separation costs (a)
|
—
|
|
22
|
|
87
|
|
NM
|
|
(74.7
|
)%
|
||||||||
|
Special charges
|
24
|
|
—
|
|
—
|
|
NM
|
|
NM
|
|
||||||||
|
Total operating expenses
|
1,136
|
|
1,059
|
|
1,066
|
|
7.3
|
%
|
(0.7
|
)%
|
||||||||
|
Operating income
|
363
|
|
443
|
|
395
|
|
(18.1
|
)%
|
12.2
|
%
|
||||||||
|
Operating margin
|
9.5
|
%
|
11.7
|
%
|
10.4
|
%
|
(220)bp
|
|
130bp
|
|
||||||||
|
Interest and other non-operating expense (income), net
|
65
|
|
55
|
|
12
|
|
18.2
|
%
|
358.3
|
%
|
||||||||
|
Income tax expense
|
70
|
|
91
|
|
104
|
|
(23.1
|
)%
|
(12.5
|
)%
|
||||||||
|
Tax rate
|
23.5
|
%
|
23.4
|
%
|
27.4
|
%
|
10bp
|
|
(400)bp
|
|
||||||||
|
Net income
|
$
|
228
|
|
$
|
297
|
|
$
|
279
|
|
(23.2
|
)%
|
6.5
|
%
|
|||||
|
(a)
|
Separation costs of
$4 million
(
$2 million
, net of tax) during
2013
are included within the
$1,048 million
of operating expenses.
|
NM Not Meaningful
2013
versus
2012
Revenue
Revenue generated for
2013
was
$3,837 million
, an increase of
$46 million
, or
1.2%
, compared to
$3,791 million
in
2012
. On a constant currency basis, revenue grew
1.1%
. The following table illustrates the impact from organic growth, recent acquisitions, and fluctuations in foreign currency, in relation to revenue during
2013
.
|
(in millions)
|
$ Change
|
% Change
|
||||
|
2012 Revenue
|
$
|
3,791
|
|
|||
|
Organic Growth
|
(39
|
)
|
(1.0
|
)%
|
||
|
Acquisitions
|
82
|
|
2.2
|
%
|
||
|
Constant Currency
|
43
|
|
1.1
|
%
|
||
|
Foreign currency translation (a)
|
3
|
|
0.1
|
%
|
||
|
Total change in revenue
|
46
|
|
1.2
|
%
|
||
|
2013 Revenue
|
$
|
3,837
|
|
|||
|
(a)
|
Foreign currency impact primarily due to fluctuations in the value of the Euro, Australian Dollar, South African Rand, Swedish Krona, Canadian Dollar and British Pound against the US Dollar.
|
35
The following table summarizes revenue by segment for
2013
and
2012
:
|
(in millions)
|
2013
|
2012
|
As Reported Change
|
Constant Currency Change
|
|||||||||
|
Water Infrastructure
|
$
|
2,457
|
|
$
|
2,425
|
|
1.3
|
%
|
1.5
|
%
|
|||
|
Applied Water
|
1,444
|
|
1,424
|
|
1.4
|
%
|
0.4
|
%
|
|||||
|
Eliminations
|
(64
|
)
|
(58
|
)
|
|
||||||||
|
Total
|
$
|
3,837
|
|
$
|
3,791
|
|
1.2
|
%
|
1.1
|
%
|
|||
Water Infrastructure
Water Infrastructure’s revenue increased
$32 million
, or
1.3%
in
2013
(
1.5%
on a constant currency basis). Our 2012 and 2013 acquisitions contributed
$82 million
of incremental revenue in 2013.
Organic revenue decreased
$46 million
or
1.9%
during the year which was substantially due to lower volumes across the transport, treatment and test applications. The significant declines were primarily caused by weakness in the Europe, Middle East and Africa treatment markets and declines in transport in the Asia Pacific markets from less mining activity. Organic revenue performance improved year-over-year in the third and fourth quarters of 2013 driven by increases in transport revenue which reflected modest market recovery in northern and central Europe as well as the United States. Treatment negatively impacted organic growth for the year as revenue decreased from 2012 substantially due to non-recurring large custom projects shipped in the prior year as well as project delays from government funding uncertainties. Additionally, test applications, which had flat organic revenue in 2013, experienced lower revenue for the year from delays in orders and the government sequestration in the United States during the first half of 2013 which were offset by revenue growth in the second half of the year, specifically in Europe, as well as incremental revenue from price increases, new products and cross-branding initiatives.
Foreign currency translation was unfavorable by
$4 million
for
2013
as compared to
2012
.
Applied Water
Applied Water’s revenue increased
$20 million
, or
1.4%
in
2013
(a
0.4%
increase on a constant currency basis). The growth on a constant currency basis was driven by organic revenue growth predominately due to irrigation and industrial water applications.
Organic revenue increased
$5 million
or
0.4%
for the year primarily due to irrigation application revenue caused by drought conditions in the United States. Strength in the industrial water application also bolstered revenue, particularly within China from large fire pump projects as well as in northern Europe from increased industrial multistage pump revenue. These revenue increases were partially offset by weakness in Europe, particularly within the residential and commercial building services markets of southern Europe, combined with sluggish industrial and commercial building service markets in the United States and Latin America.
Foreign currency translation was favorable by
$9 million
for
2013
as compared to
2012
.
Orders/Backlog
Orders received during
2013
increased by
$130 million
, or
3.4%
to $
3,912 million
(a
3.4%
increase on a constant currency basis). These amounts include a benefit of
$87 million
from acquisitions. Organic order growth was
$43 million
for the year.
The Water Infrastructure segment orders increased
$89 million
, or
3.7%
to
$2,510 million
(
3.8%
growth on a constant currency basis), including
$87 million
from acquisitions. Organic orders increased slightly primarily due to a strong second half of 2013 driven by higher transport volume from Europe public utilities and the dewatering business combined with healthy growth in emerging markets. Orders increased in our Applied Water segment
$45 million
, or
3.2%
to
$1,468 million
(
2.7%
growth on a constant currency basis), driven by strong performance in the commercial building services and industrial water markets in China as well as orders within the residential building services and agriculture markets in the United States during 2013, partially offset by weakness in Southern Europe across all end markets.
Delivery schedules vary from customer to customer based upon their requirements. Typically, large projects require longer lead production cycles and delays can occur from time to time. Total backlog was
$707 million
at
36
December 31, 2013
and
$647 million
at
December 31, 2012
. We anticipate that more than 90% of the backlog at
December 31, 2013
will be recognized as revenue during
2014
.
Gross Margin
Gross margins as a percentage of consolidated revenue declined to
39.1%
in
2013
from
39.6%
in
2012
. The decrease is attributable to negative price realization, geographic sales mix and additional costs associated with recent acquisitions. These negative impacts were partially mitigated by benefits from restructuring savings and cost saving initiatives such as lean six sigma and global sourcing.
Operating Expenses
|
(in millions)
|
2013
|
2012
|
Change
|
|||||||
|
Selling, General and Administrative (SG&A)
|
$
|
986
|
|
$
|
914
|
|
7.9
|
%
|
||
|
SG&A as a % of revenue
|
25.7
|
%
|
24.1
|
%
|
160bp
|
|
||||
|
Research and Development (R&D)
|
104
|
|
106
|
|
(1.9
|
)%
|
||||
|
R&D as a % of revenue
|
2.7
|
%
|
2.8
|
%
|
(10)bp
|
|
||||
|
Restructuring and asset impairment charges
|
42
|
|
17
|
|
147.1
|
%
|
||||
|
Separation Costs
|
4
|
|
22
|
|
(81.8
|
)%
|
||||
|
Operating expenses
|
$
|
1,136
|
|
$
|
1,059
|
|
7.3
|
%
|
||
|
Expense to revenue ratio
|
29.6
|
%
|
27.9
|
%
|
170bp
|
|
||||
Selling, General and Administrative Expenses
SG&A increased by
$72 million
or
7.9%
to
$986 million
or
25.7%
of revenue in
2013
, as compared to
$914 million
or
24.1%
of revenue in
2012
. The increase in SG&A expenses as a percentage of revenue is primarily due to the combined impacts from the legal settlement with Xylem Group LLC and costs incurred for the change in our chief executive officer of $20 million. The increase was also driven by realignment costs of $17 million during 2013 incurred by the Company to reposition our European business in an effort to optimize our cost structure and improve our operational efficiency and effectiveness. Acquisitions, increased pension costs and investments in growth platforms also contributed to the increase.
Research and Development Expenses
R&D spending decreased
$2 million
or
1.9%
to
$104 million
or
2.7%
of revenue for
2013
as compared to
$106 million
or
2.8%
of revenue in
2012
.
Restructuring and Asset Impairment Charges
During
2013
, we incurred restructuring costs of $31 million and $9 million in our Water Infrastructure and Applied Water segments, respectively. These charges were incurred primarily in an effort to realign our organizational structure in Europe and North America to address declines in sales volumes and optimize our cost structure. The charges relate to the reduction in structural costs, including a decrease in headcount and consolidation of facilities. During
2012
, we recognized restructuring charges of
$17 million
related to restructuring related severance payments for manufacturing reduction in force initiatives primarily within our Water Infrastructure segment.
Total expected costs associated with actions that commenced during 2013 are approximately
$33 million
for Water Infrastructure and approximately
$10 million
for Applied Water. These costs primarily comprise severance charges. These actions are expected to continue through 2014. As a result of actions initiated during 2013, we achieved net savings of approximately $13 million in 2013 and estimate annual future net savings beginning in 2014 of approximately $38 million.
Additionally, in the fourth quarter of 2013 we recorded a $2 million impairment charge related to three trade names in our Water Infrastructure segment associated with acquired businesses within our Analytics operating unit, reflecting a decline in their value since being acquired. Refer to Note 11, “Goodwill and Other Intangible Assets,” for additional information.
37
Separation Costs
We had non-recurring separation costs of
$4 million
and
$22 million
, or
$2 million
and
$16 million
after tax during
2013
and
2012
, respectively. The components of separation costs incurred during these periods are presented below.
|
(in millions)
|
2013
|
2012
|
|||||
|
Rebranding and marketing costs
|
$
|
—
|
|
$
|
8
|
|
|
|
Advisory and professional fees
|
—
|
|
7
|
|
|||
|
Information and technology costs
|
2
|
|
3
|
|
|||
|
Employee retention and hiring costs
|
—
|
|
1
|
|
|||
|
Lease termination and other real estate costs
|
2
|
|
1
|
|
|||
|
Other
|
—
|
|
2
|
|
|||
|
Total separation costs in operating income
|
4
|
|
22
|
|
|||
|
Income tax benefit
|
(2
|
)
|
(6
|
)
|
|||
|
Total separation costs, net of tax
|
$
|
2
|
|
$
|
16
|
|
|
Operating Income
We generated operating income of
$363 million
during
2013
, an $80 million or
18.1%
decrease from the prior year operating income of
$443 million
, primarily reflecting higher operating expenses as increased SG&A, and restructuring and asset impairment charges more than offset reductions from lower separation costs and savings from restructuring activities. The following table illustrates operating income results by business segments for
2013
and
2012
.
|
(in millions)
|
2013
|
2012
|
Change
|
|||||||
|
Water Infrastructure
|
$
|
271
|
|
$
|
342
|
|
(20.8
|
)%
|
||
|
Applied Water
|
167
|
|
170
|
|
(1.8
|
)%
|
||||
|
Segment operating income
|
438
|
|
512
|
|
(14.5
|
)%
|
||||
|
Corporate and other
|
(75
|
)
|
(69
|
)
|
8.7
|
%
|
||||
|
Total operating income
|
$
|
363
|
|
$
|
443
|
|
(18.1
|
)%
|
||
|
Operating margin
|
||||||||||
|
Water Infrastructure
|
11.0
|
%
|
14.1
|
%
|
(310)bp
|
|
||||
|
Applied Water
|
11.6
|
%
|
11.9
|
%
|
(30)bp
|
|
||||
|
Total Xylem
|
9.5
|
%
|
11.7
|
%
|
(220)bp
|
|
||||
38
The table included below provides a reconciliation from segment operating income to adjusted operating income, and a calculation of the corresponding adjusted operating margin.
|
(in millions)
|
2013
|
2012
|
Change
|
|||||||
|
Water Infrastructure
|
||||||||||
|
Operating income
|
$
|
271
|
|
$
|
342
|
|
(20.8
|
)%
|
||
|
Separation costs
|
—
|
|
4
|
|
NM
|
|
||||
|
Restructuring and realignment costs
|
48
|
|
19
|
|
152.6
|
%
|
||||
|
Special charges
|
4
|
|
—
|
|
NM
|
|
||||
|
Adjusted operating income
|
$
|
323
|
|
$
|
365
|
|
(11.5
|
)%
|
||
|
Adjusted operating margin
|
13.1
|
%
|
15.1
|
%
|
(200)bp
|
|
||||
|
Applied Water
|
||||||||||
|
Operating income
|
167
|
|
170
|
|
(1.8
|
)%
|
||||
|
Separation costs
|
—
|
|
2
|
|
NM
|
|
||||
|
Restructuring and realignment costs
|
16
|
|
5
|
|
220.0
|
%
|
||||
|
Adjusted operating income
|
$
|
183
|
|
$
|
177
|
|
3.4
|
%
|
||
|
Adjusted operating margin
|
12.7
|
%
|
12.4
|
%
|
30bp
|
|
||||
|
Total Xylem
|
||||||||||
|
Operating income
|
$
|
363
|
|
$
|
443
|
|
(18.1
|
)%
|
||
|
Separation costs*
|
—
|
|
22
|
|
NM
|
|
||||
|
Restructuring and realignment costs
|
64
|
|
24
|
|
166.7
|
%
|
||||
|
Special charges
|
24
|
|
—
|
|
NM
|
|
||||
|
Adjusted operating income*
|
$
|
451
|
|
$
|
489
|
|
(7.8
|
)%
|
||
|
Adjusted operating margin*
|
11.8
|
%
|
12.9
|
%
|
(110)bp
|
|
||||
NM Not meaningful percentage change
|
*
|
Costs associated with non-recurring separation activities of
$4 million
(
$2 million
, net of tax) during
2013
are not excluded from adjusted operating income.
|
Water Infrastructure
Operating income for our Water Infrastructure segment decreased
$71 million
or
20.8%
(decreased
$42 million
or
11.5%
on an adjusted basis) compared with the prior year. The
11.5%
decrease was driven by lower volume, inflation, unfavorable foreign exchange impacts, costs associated with the establishment of our European headquarters and investments in growth platforms, specifically acquisitions and new product launches. The decrease was partially offset by restructuring savings and cost reduction initiatives, such as global sourcing and lean six sigma.
Applied Water
Operating income for our Applied Water segment decreased
$3 million
or
1.8%
(increased
$6 million
or
3.4%
on an adjusted basis) compared to the prior year. The
3.4%
increase was driven by lean initiatives, global sourcing and price realization partially offset by inflation and new product development.
Interest Expense
Interest expense was
$55 million
for both
2013
and
2012
, reflecting the same full year of interest expense related to the issuance of $1.2 billion aggregate principal amount of senior notes issued in September 2011. Refer to
Note 14
, “Credit Facilities and Long-Term Debt,” for further details.
Income Tax Expense
The income tax provision for
2013
was
$70 million
at an effective tax rate of
23.5%
compared to
$91 million
at an effective tax rate of
23.4%
in
2012
. The
2013
effective tax rate is higher than
2012
due to an increase in foreign repatriations partially offset by mix of earnings.
39
Other Comprehensive Income/(Loss)
Other comprehensive income of
$74 million
in
2013
compared to a loss of
$30 million
in
2012
, an improvement of $104 million, was primarily due to a
$34 million
net gain in 2013 as compared to a net loss of
$84 million
in 2012 related to postretirement benefit plans. The net gain in 2013 was due to an increase in discount rates as well as actual gains on plan assets in excess of the assumed long-term rate of return as compared to the net loss in 2012 which was due to a reduction in discount rates, partially mitigated by actual gains on plan assets in excess of the assumed long-term rate of return. This year-over-year improvement was partially offset by a $33 million reduction in foreign currency translation benefit primarily due to the Euro strengthening against the U.S. dollar. The effective tax rate on other comprehensive income decreased as compared to 2012 due primarily to the shift in comprehensive earnings from foreign currency translation, which is not taxable, as well as from a change in the jurisdictional mix of net gains/losses from postretirement benefit plans.
2012 versus 2011
Revenue
Revenue generated for 2012 was $3,791 million, a decrease of $12 million, or 0.3%, compared to $3,803 million in 2011. On a constant currency basis, revenue grew 2.5%. The following table illustrates the impact from organic growth, recent acquisitions, and fluctuations in foreign currency, in relation to revenue during the annual 2012 period.
|
(in millions)
|
$ Change
|
% Change
|
||||
|
2011 Revenue
|
$
|
3,803
|
|
|||
|
Organic Growth
|
2
|
|
0.1
|
%
|
||
|
Acquisitions
|
94
|
|
2.4
|
%
|
||
|
Constant Currency
|
96
|
|
2.5
|
%
|
||
|
Foreign currency translation (a)
|
(108
|
)
|
(2.8
|
)%
|
||
|
Total change in revenue
|
(12
|
)
|
(0.3
|
)%
|
||
|
2012 Revenue
|
$
|
3,791
|
|
|||
|
(a)
|
Foreign currency impact primarily due to fluctuations of the Euro against the US Dollar.
|
The following table summarizes revenue by segment for 2012 and 2011:
|
(in millions)
|
2012
|
2011
|
As Reported Change
|
Constant Currency Change
|
|||||||||
|
Water Infrastructure
|
$
|
2,425
|
|
$
|
2,416
|
|
0.4
|
%
|
3.7
|
%
|
|||
|
Applied Water
|
1,424
|
|
1,444
|
|
(1.4
|
)%
|
0.8
|
%
|
|||||
|
Eliminations
|
(58
|
)
|
(57
|
)
|
|
||||||||
|
Total
|
$
|
3,791
|
|
$
|
3,803
|
|
(0.3
|
)%
|
2.5
|
%
|
|||
Water Infrastructure
Water Infrastructure’s revenue increased $9 million, or 0.4% in 2012 (3.7% on a constant currency basis), including incremental revenue of $94 million from acquisitions, consisting of YSI in 2011 and MJK and Heartland in 2012. The acquisitions of YSI and MJK contributed $90 million of the incremental revenue as we continued our expansion in the analytical instrumentation market.
Organic revenue decreased $6 million or 0.2% during the year which was primarily attributable to weakness in the transport and treatment markets, as well as sustained drought conditions within the United States. Transport and treatment decreased mostly due to a decline in the public utility sector of developed markets caused by a weak capital project environment and delays on shipments. These declines were partially offset by strength in emerging markets, specifically in the Latin America and Asia Pacific regions. The results also reflect decreases in the dewatering rental and equipment sales as a result of the unfavorable dry weather conditions within North America and lower coal and gas prices, offset slightly by a benefit from Super Storm Sandy. Overall growth was also muted by continued weakness in Europe as a result of challenging economic conditions.
40
Foreign currency translation was unfavorable by $80 million for 2012 as compared to 2011.
Applied Water
Applied Water’s revenue decreased $20 million, or 1.4% in 2012 (a 0.8% increase on a constant currency basis). The growth on a constant currency basis was driven by organic revenue growth.
Organic revenue grew $9 million or 0.6% for the year and was principally due to strength in the industrial water sector from a favorable general industrial market across most regions, especially within the United States, Russia and Asia Pacific markets. The residential and commercial pumps business increased slightly due to favorable growth in the United States but was mostly eclipsed by declines from the weak economic conditions in Europe. The warm, dry weather conditions in North America also drove an increase in the agriculture end market for the year.
Foreign currency translation was unfavorable by $32 million for 2012 as compared to 2011.
Orders/Backlog
Orders received during 2012 decreased by $65 million, or 1.7% to $3,782 million (a 1.3% increase on a constant currency basis). These amounts include a benefit of $95 million from acquisitions. Organic order decline was $46 million for the year.
The Water Infrastructure segment orders decreased $33 million, or 1.3% to $2,421 million (2.2% growth on a constant currency basis), including $95 million from acquisitions. Organic order volume decreased primarily due to the delays in public utility capital expenditure orders coupled with reduced dewatering volumes from dry weather conditions and slowdowns in the oil, gas and mining markets. Orders declined in our Applied Water segment $29 million, or 2.0% to $1,423 million (0.1% growth on a constant currency basis), driven by declining organic orders of 0.4%. The decline in organic order volume is primarily a result of the warm winter weather conditions in the United States and Asia Pacific markets impacting the building services end markets, partially offset by strength in the industrial and agriculture markets.
Delivery schedules vary from customer to customer based upon their requirements. Typically, large projects require longer lead production cycles and delays can occur from time to time. Total backlog was $647 million at December 31, 2012 and $651 million at December 31, 2011.
Gross Margin
Gross margins as a percentage of consolidated revenue increased to 39.6% in 2012 from 38.4% in 2011. The increase is attributable to benefits from price realization initiatives and cost improvements offset, in part, by an unfavorable sales mix and inflation.
Operating Expenses
|
(in millions)
|
2012
|
2011
|
Change
|
|||||||
|
Selling, General and Administrative (SG&A)
|
$
|
914
|
|
$
|
877
|
|
4.2
|
%
|
||
|
SG&A as a % of revenue
|
24.1
|
%
|
23.1
|
%
|
100bp
|
|
||||
|
Research and Development (R&D)
|
106
|
|
100
|
|
6.0
|
%
|
||||
|
R&D as a % of revenue
|
2.8
|
%
|
2.6
|
%
|
20bp
|
|
||||
|
Restructuring and asset impairment charges
|
17
|
|
2
|
|
750
|
%
|
||||
|
Separation Costs
|
22
|
|
87
|
|
(74.7
|
)%
|
||||
|
Operating expenses
|
$
|
1,059
|
|
$
|
1,066
|
|
0.7
|
%
|
||
|
Expense to revenue ratio
|
27.9
|
%
|
28.0
|
%
|
(10)bp
|
|
||||
Selling, General and Administrative Expenses
SG&A increased by $37 million or 4.2% to $914 million or 24.1% of revenue in 2012, as compared to $877 million or 23.1% of revenue in 2011. The increase in SG&A expenses is principally due to the impact of incremental costs as a standalone Company and costs related to the MJK and Heartland acquisitions.
Additionally, in 2012 we incurred $7 million of realignment costs relating to realigning our European businesses to improve our operational efficiencies.
41
Research and Development Expenses
R&D spending increased $6 million or 6.0% to $106 million or 2.8% of revenue for 2012 as compared to $100 million or 2.6% of revenue in 2011. These increases were primarily due to the impact from recent acquisitions, as well as costs associated with the launching of new products.
Restructuring and Asset Impairment Charges
During 2012, we incurred restructuring costs of $17 million primarily related to restructuring-related severance payments for reductions in force initiatives primarily within our Water Infrastructure segment. During 2011, we incurred a $2 million charge related to the impairment of a facility in our Applied Water segment. As of December 31, 2012, we consider those restructuring initiatives commenced to date to be substantially completed, with a remaining liability of $9 million related to the 2012 restructuring actions.
Separation Costs
We had non-recurring pre-tax separation costs of $22 million and $87 million, or $16 million and $72 million after tax during 2012 and 2011, respectively. The components of separation costs incurred during these periods are presented below.
|
(in millions)
|
2012
|
2011
|
|||||
|
Rebranding and marketing costs
|
$
|
8
|
|
$
|
13
|
|
|
|
Advisory and professional fees
|
7
|
|
18
|
|
|||
|
Information and technology costs
|
3
|
|
19
|
|
|||
|
Employee retention and hiring costs
|
1
|
|
14
|
|
|||
|
Lease termination and other real estate costs
|
1
|
|
10
|
|
|||
|
Non-cash asset impairments (a)
|
—
|
|
8
|
|
|||
|
Other
|
2
|
|
5
|
|
|||
|
Total separation costs in operating income
|
22
|
|
87
|
|
|||
|
Tax-related separation costs
|
—
|
|
6
|
|
|||
|
Income tax benefit
|
(6
|
)
|
(21
|
)
|
|||
|
Total separation costs, net of tax
|
$
|
16
|
|
$
|
72
|
|
|
|
(a)
|
During the third quarter of 2011, we recorded an impairment charge of $8 million on one of our facilities in China within our Applied Water segment. Prior to the separation this was a shared facility among certain Xylem and ITT businesses and in connection with the separation, the removal of certain ITT operations triggered an impairment evaluation. The fair value of the applicable assets was calculated using the cost approach.
|
Operating Income
We generated operating income of $443 million during 2012, a 12.2% increase from the prior year, primarily reflecting the benefits achieved from cost reductions and price improvements offset, in part, by an unfavorable sales mix, acquisition costs and non-recurring separation costs. The following table illustrates operating income results by business segments for 2012 and 2011.
|
(in millions)
|
2012
|
2011
|
Change
|
|||||||
|
Water Infrastructure
|
$
|
342
|
|
$
|
343
|
|
(0.3
|
)%
|
||
|
Applied Water
|
170
|
|
160
|
|
6.3
|
%
|
||||
|
Segment operating income
|
512
|
|
503
|
|
1.8
|
%
|
||||
|
Corporate and Other
|
(69
|
)
|
(108
|
)
|
|
|||||
|
Total operating income
|
$
|
443
|
|
$
|
395
|
|
12.2
|
%
|
||
|
Operating margin
|
||||||||||
|
Water Infrastructure
|
14.1
|
%
|
14.2
|
%
|
(10)bp
|
|
||||
|
Applied Water
|
11.9
|
%
|
11.1
|
%
|
80bp
|
|
||||
|
Total Xylem
|
11.7
|
%
|
10.4
|
%
|
130bp
|
|
||||
42
The table included below provides a reconciliation from segment operating income to adjusted operating income, and a calculation of the corresponding adjusted operating margin.
|
(in millions)
|
2012
|
2011
|
Change
|
|||||||
|
Water Infrastructure
|
||||||||||
|
Operating income
|
$
|
342
|
|
$
|
343
|
|
(0.3
|
)%
|
||
|
Separation costs
|
4
|
|
16
|
|
||||||
|
Restructuring and realignment costs
|
19
|
|
—
|
|
||||||
|
Adjusted operating income
|
$
|
365
|
|
$
|
359
|
|
1.7
|
%
|
||
|
Adjusted operating margin
|
15.1
|
%
|
14.9
|
%
|
20bp
|
|
||||
|
Applied Water
|
||||||||||
|
Operating income
|
$
|
170
|
|
$
|
160
|
|
6.3
|
%
|
||
|
Separation costs
|
2
|
|
13
|
|
||||||
|
Restructuring and realignment costs
|
5
|
|
—
|
|
||||||
|
Adjusted operating income
|
$
|
177
|
|
$
|
173
|
|
2.3
|
%
|
||
|
Adjusted operating margin
|
12.4
|
%
|
12.0
|
%
|
40bp
|
|
||||
|
Total Xylem
|
||||||||||
|
Operating income
|
$
|
443
|
|
$
|
395
|
|
12.2
|
%
|
||
|
Separation costs (a)
|
22
|
|
87
|
|
||||||
|
Restructuring and realignment costs
|
24
|
|
—
|
|
||||||
|
Adjusted operating income
|
$
|
489
|
|
$
|
482
|
|
1.5
|
%
|
||
|
Adjusted operating margin
|
12.9
|
%
|
12.7
|
%
|
20bp
|
|
||||
|
(a)
|
Comprising non-recurring separation costs of $6 million and $29 million in our business segments and $16 million and $58 million within Corporate for 2012 and 2011, respectively.
|
Water Infrastructure
Operating income for our Water Infrastructure segment decreased $1 million or 0.3% (increased $6 million or 1.7% excluding separation, restructuring and realignment costs) compared with the prior year. The 1.7% increase was predominately driven by incremental operating income of $20 million from the acquisitions of YSI, MJK and Heartland combined with price realization efforts and operating cost reductions. These benefits were largely offset by inflation costs on labor and material as well as unfavorable mix from lower dewatering revenue and higher revenue in emerging markets.
Applied Water
Operating income for our Applied Water segment increased $10 million or 6.3% ($4 million or 2.3% excluding separation, restructuring and realignment costs) compared to the prior year. The 2.3% increase is primarily attributable to operating cost reductions put in place by the Company and savings achieved from restructuring actions in the latter part of 2011. The increases were offset, in part, by lower sales volume, an unfavorable sales mix and inflationary pressures on labor and materials.
Interest Expense
Interest expense was $55 million and $17 million for 2012 and 2011, respectively. The increase during the current year reflected a full year of interest expense related to the issuance of $1.2 billion aggregate principal amount of senior notes issued in September 2011. Refer to
Note 14
, “Credit Facilities and Long-Term Debt,” for further details.
Income Tax Expense
The income tax provision for 2012 was $91 million at an effective tax rate of 23.4% compared to $104 million at an effective tax rate of 27.4% in 2011. The 2012 effective tax rate is lower than 2011 as a result of the decrease in non-deductible separation costs and a change in the mix of earnings.
Effective January 1, 2013, the Swedish government enacted legislation that will increase the effective tax rate of the Company. The Company has implemented strategies to address the impact of this legislation.
43
Other Comprehensive Income/(Loss)
Other comprehensive loss was
$30 million
in 2012 compared to a loss of
$132 million
in 2011, primarily due to the favorable impact of foreign currency translation adjustments in 2012 versus the unfavorable impact in 2011. In 2012, foreign currency translation adjustment was a positive impact of $48 million as compared to 2011, which was a negative impact of $61 million. The year-over-year change was primarily due to movements in the Euro against the US Dollar. Other comprehensive loss was further impacted by a loss from postretirement benefit plans of $84 million loss in 2012 compared to $74 million loss in 2011. This was primarily due to net foreign exchange losses experienced on the benefit obligations which more than offset net foreign exchange gains on plan assets. The effective tax rate on other comprehensive income increased as compared to 2011 due primarily to the shift in comprehensive earnings from foreign currency translation, which is not taxable, as well as from a change in the jurisdictional mix of net gains/losses from postretirement benefit plans.
Liquidity and Capital Resources
The following table summarizes our sources and uses of cash:
|
Year Ended December 31,
|
|||||||||||
|
(in millions)
|
2013
|
2012
|
2011
|
||||||||
|
Operating activities
|
$
|
324
|
|
$
|
396
|
|
$
|
449
|
|
||
|
Investing activities
|
(199
|
)
|
(147
|
)
|
(423
|
)
|
|||||
|
Financing activities
|
(100
|
)
|
(74
|
)
|
172
|
|
|||||
|
Foreign exchange
|
4
|
|
11
|
|
(11
|
)
|
|||||
|
Total
|
$
|
29
|
|
$
|
186
|
|
$
|
187
|
|
||
Sources and Uses of Liquidity
Operating Activities
During
2013
, net cash provided by operating activities was
$324 million
, compared to
$396 million
in
2012
. The
$72 million
year-over-year decrease was driven by an increase in the use of working capital in both segments, due to increased accounts receivable primarily from longer collection times in Europe, and increased inventories to support a higher backlog as well as to be able to support shorter lead times. Additionally, revenue volume declines during the first half of 2013 reduced cash inflow from income. Payments made for restructuring and realignment activities in 2013 also contributed to the decline, largely offset by lower tax payments.
During
2012
, net cash provided by operating activities was
$396 million
, compared to
$449 million
in
2011
. The
$53 million
year-over-year decrease is primarily the result of interest payments on debt of $53 million in 2012, higher tax payments of $40 million and additional contributions to postretirement benefit plans, partially offset by an increase in receivable collections and a decline in payments for separation costs.
Investing Activities
Cash used in investing activities was
$199 million
for
2013
, compared to
$147 million
in
2012
and
$423 million
in
2011
. The changes in investing activities are driven almost entirely by cash used for acquisitions and, to a lesser extent, from changes in spending on capital expenditures. We invested $81 million for the acquisitions during 2013 while $41 million was used in 2012 and $309 million in 2011. Capital expenditures for
2013
of $126 million were $14 million greater than in 2012 primarily due to information technology investments within both the Applied Water segment and Corporate as a result of system requirements subsequent to the Spin-off from ITT in addition to capital expenditures required for the relocation of our corporate headquarters as required by the Spin-off from ITT. In 2012 we spent
$112 million
on capital expenditures, a decrease of $14 million over 2011, primarily due to a reduction in dewatering asset purchases to align with current rental demand.
Financing Activities
Cash used by financing activities was
$100 million
and
$74 million
during
2013
and
2012
, respectively compared to cash provided by financing activities of
$172 million
during
2011
. The increase in cash used for financing activities in
2013
compared to 2012 was primarily driven by an increase in share repurchase activity of $60 million and an increase in dividend payments of $12 million. The 2013 share repurchase activity was impacted by $50 million of
44
repurchases under a new share repurchase program approved on August 20, 2013 by the Board of Directors to repurchase up to $250 million in shares.
Additionally, there was an increase in short-term debt for borrowings under the European Investment Bank facility of $38 million in 2013. The decrease in financing activities from 2011 to 2012 was primarily attributable to net proceeds from the issuance of $1.2 billion in Senior Notes which funded a net cash transfer of $1 billion to our former parent, ITT, in 2011. In general, the components of net transfers to ITT included: (i) cash transfers from the Company to parent, (ii) cash investments from our parent used to fund operations, capital expenditures and acquisitions, (iii) charges (benefits) for income taxes, and (iv) allocations of the parent company’s corporate expenses described in this Report.
Funding and Liquidity Strategy
Our ability to fund our capital needs depends on our ongoing ability to generate cash from operations, and access to the bank and capital markets.
Our global funding requirements are continually monitored with appropriate strategies executed to ensure liquidity needs are met cost effectively. Based on our current global cash positions, cash flows for operations and access to the commercial paper markets, we believe there is sufficient liquidity to meet our funding requirements. In addition, our existing committed credit facilities and access to the public debt markets would provide further liquidity if required.
Historically, we have generated operating cash flow sufficient to fund our primary cash needs centered on operating activities, working capital, capital expenditures, and strategic investments. If our cash flows from operations are less than we expect, we may need to incur debt or issue equity. From time to time, we may need to access the long-term and short-term capital markets to obtain financing. Our access to, and the availability of, financing on acceptable terms and conditions in the future will be impacted by many factors, including: (i) our credit ratings or absence of a credit rating, (ii) the liquidity of the overall capital markets, and (iii) the current state of the economy. There can be no assurance that we will continue to have access to the capital markets on terms acceptable to us. We cannot assure that such financing will be available to us on acceptable terms or that such financing will be available at all.
We anticipate that our present sources of funds, including funds from operations, will provide us with sufficient liquidity and capital resources to meet our liquidity and capital needs in both the United States and outside of the United States over the next twelve months.
Senior Notes
On September 20, 2011, we issued 3.550% Senior Notes of $600 million aggregate principal amount due September 2016 (the "Senior Notes due 2016") and 4.875% Senior Notes of $600 million aggregate principal amount due October 2021 (the "Senior Notes due 2021" and together with the Senior Notes due 2016, the "Senior Notes").
The Senior Notes include covenants which restrict our ability, subject to exceptions, to incur debt secured by liens and engage in sale and lease-back transactions, as well as provide for customary events of default (subject, in certain cases, to receipt of notice of default and/or customary grace and cure periods). We may redeem the Senior Notes, as applicable, in whole or in part, at any time at a redemption price equal to the principal amount of the Senior Notes to be redeemed, plus a make-whole premium. As of
December 31, 2013
, we were in compliance with all covenants. If a change of control triggering event (as defined in the Senior Notes indenture) occurs, we will be required to make an offer to purchase the Senior Notes at a price equal to 101% of their principal amount plus accrued and unpaid interest to the date of repurchase.
Interest on the Senior Notes due 2016 is payable on March 20 and September 20 of each year. Interest on the Senior Notes due 2021 is payable on April 1 and October 1 of each year.
Four Year Competitive Advance and Revolving Credit Facility
Effective October 31, 2011, Xylem and its subsidiaries entered into a Four Year Competitive Advance and Revolving Credit Facility (the "Credit Facility") with JPMorgan Chase Bank, N.A., as administrative agent, and a syndicate of lenders. The Credit Facility provides for an aggregate principal amount of up to $600 million of (i) a competitive advance borrowing option which will be provided on an uncommitted competitive advance basis through an auction
45
mechanism (the "competitive loans"), (ii) revolving extensions of credit (the "revolving loans") outstanding at any time and (iii) the issuance of letters of credit in a face amount not in excess of $100 million outstanding at any time.
At our election, the interest rate per annum applicable to the competitive advances will be based on either (i) a Eurodollar rate determined by reference to LIBOR, plus an applicable margin offered by the lender making such loans and accepted by us or (ii) a fixed percentage rate per annum specified by the lender making such loans. At our election, interest rate per annum applicable to the revolving loans will be based on either (i) a Eurodollar rate determined by reference to LIBOR, adjusted for statutory reserve requirements, plus an applicable margin or (ii) a fluctuating rate of interest determined by reference to the greatest of (a) the prime rate of JPMorgan Chase Bank, N.A., (b) the U.S. Federal Funds effective rate plus half of 1% or (c) the Eurodollar rate determined by reference to LIBOR, adjusted for statutory reserve requirements, in each case, plus an applicable margin.
In accordance with the terms, we may not exceed a maximum leverage ratio of 3.50 (based on a ratio of total debt to earnings before interest, taxes, depreciation and amortization) throughout the term. As of
December 31, 2013
, we were in compliance with all covenants. The Credit Facility also contains limitations on, among other things, incurring debt, granting liens, and entering sale and leaseback transactions. In addition, the Credit Facility contains other terms and conditions such as customary representations and warranties, additional covenants and customary events of default.
As of
December 31, 2013
, this credit facility remains undrawn.
Research and Development Facility Agreement
On December 4, 2013, the Company amended and restated its Risk Sharing Finance Facility Agreement (the "R&D Facility Agreement") with The European Investment Bank (the "EIB") to add an additional borrower under the facility. The facility provides an aggregate principal amount of up to
€120 million
(approximately
$165 million
)
to finance research projects and infrastructure development in the European Union. The Company's wholly-owned subsidiaries in Luxembourg, Xylem Holdings S.a.r.l. and Xylem International S.a.r.l., are the borrowers under the R&D Facility Agreement. The obligations of the borrowers under the R&D Facility Agreement are guaranteed by the Company under an Amended and Restated Deed of Guarantee, dated as of December 4, 2013, in favor of the EIB. The funds are available to finance research and development projects during the period from 2013 through 2016 at the Company's R&D facilities in Sweden, Germany, Italy, the United Kingdom, Austria, Norway and Hungary.
Under the R&D Facility Agreement, the borrower can draw loans with a maturity of no longer than 12 years. The R&D Facility Agreement provides for Fixed Rate loans and Floating Rate loans. The interest rate per annum applicable to Fixed Rate loans will be at a fixed percentage rate per annum specified by the EIB which includes the applicable margin. The interest rate per annum applicable to Floating Rate loans will be at the rate determined by reference to EURIBOR for loans drawn in Euros and LIBOR for loans drawn in Pounds Sterling or U.S. Dollars, plus an applicable spread specified by the EIB which includes the applicable margin. The applicable margin for both Fixed Rate loans and Floating Rate loans shall be determined by reference to the credit rating of the Company.
In accordance with the terms of the R&D Facility Agreement, we may not exceed a maximum leverage ratio of
3.50
(based on a ratio of total debt to earnings before interest, taxes, depreciation and amortization) throughout the term. As of
December 31, 2013
, we were in compliance with all covenants. The R&D Facility Agreement also contains limitations on, among other things, incurring debt, granting liens, and entering sale and leaseback transactions. In addition, the R&D Facility Agreement contains other terms and conditions such as customary representations and warranties, additional covenants and customary events of default.
As of
December 31, 2013
,
$38 million
was outstanding under the R&D Facility Agreement.
Although the borrowing term for this arrangement is for five years, we have classified it as short-term debt on our Consolidated Balance Sheet since we intend to repay this obligation in less than one year.
Non-U.S. Operations
For
2013
and
2012
, we generated
62%
and
63%
, respectively, of our revenue from non-U.S. operations. As we continue to grow our operations in the emerging markets and elsewhere outside of the United States, we expect to continue to generate significant revenue from non-U.S. operations and we expect our cash will be predominately held by our foreign subsidiaries. We expect to manage our worldwide cash requirements considering available funds among the many subsidiaries through which we conduct business and the cost effectiveness with which those funds can be accessed. We may transfer cash from certain international subsidiaries to the U.S. and other international subsidiaries when it is cost effective to do so. Our intent is to indefinitely reinvest all but
$84 million
of
46
these funds outside of the United States. However, we continually review our domestic and foreign cash profile, expected future cash generation and investment opportunities that support our current designation of these funds as being indefinitely reinvested and reassess whether there is a demonstrated need to repatriate funds held internationally to support our U.S. operations. If, as a result of our review, it is determined that all or a portion of the funds may be needed for our operations in the United States, we would be required to accrue U.S. taxes related to future tax payments associated with the repatriation of these funds. As of
December 31, 2013
, our foreign subsidiaries were holding
$423 million
in cash or marketable securities.
As of
December 31, 2013
, our excess of financial reporting over the tax basis of investments in certain foreign subsidiaries totaled
$1.9 billion
. We have not asserted that
$84 million
of our excess basis difference will be indefinitely reinvested and have therefore provided for United States or additional foreign withholding taxes for that portion. Generally, such amounts become subject to U.S. taxation upon the remittance of dividends and under certain other circumstances.
Contractual Obligations
The following table summarizes our contractual commitments as of
December 31, 2013
:
|
(in millions)
|
2014
|
2015 - 2016
|
2017 - 2018
|
Thereafter
|
Total
|
||||||||||||||
|
Debt and capital lease obligations (1)
|
$
|
42
|
|
$
|
600
|
|
$
|
—
|
|
$
|
600
|
|
$
|
1,242
|
|
||||
|
Interest payments (2)
|
51
|
|
94
|
|
59
|
|
78
|
|
282
|
|
|||||||||
|
Operating lease obligations
|
63
|
|
90
|
|
46
|
|
26
|
|
225
|
|
|||||||||
|
Purchase obligations (3)
|
68
|
|
4
|
|
—
|
|
—
|
|
72
|
|
|||||||||
|
Other long-term obligations reflected on the balance sheet
|
1
|
|
4
|
|
2
|
|
13
|
|
20
|
|
|||||||||
|
Total commitments
|
$
|
225
|
|
$
|
792
|
|
$
|
107
|
|
$
|
717
|
|
$
|
1,841
|
|
||||
In addition to the amounts presented in the table above, we have recorded liabilities for uncertain tax positions of
$30 million
. These amounts have been excluded from the contractual obligations table due to an inability to reasonably estimate the timing of such payments in individual years. Further, benefit payments which reflect expected future service related to the Company's pension and other postretirement employee benefit obligations are presented in
Note 15
, “Postretirement Benefit Plans” and not included in the above table. Finally, estimated environmental payments are excluded from the table above. We estimate, based on historical experience, that we will spend between $1 million and $4 million per year on environmental investigation and remediation. At
December 31, 2013
, we had estimated and accrued
$8 million
related to environmental matters.
|
(1)
|
Refer to
Note 14
, “Credit Facilities and Long-Term Debt,” in the notes to the consolidated financial statements for discussion of the use and availability of debt and revolving credit agreements. Amounts represent principal payments of long-term debt including current maturities and exclude unamortized discounts.
|
|
(2)
|
Amounts represent estimate of future interest payments on long-term debt outstanding as of
December 31, 2013
.
|
|
(3)
|
Represents unconditional purchase agreements that are enforceable and legally binding and that specify all significant terms to purchase goods or services, including fixed or minimum quantities to be purchased; fixed, minimum or variable price provisions; and the approximate timing of the transaction. Purchase agreements that are cancellable without penalty have been excluded.
|
Off-Balance Sheet Arrangements
As of
December 31, 2013
, we have issued guarantees for the debt and other obligations of consolidated subsidiaries. We do not consider the maximum exposure to be material either individually or in the aggregate.
Critical Accounting Estimates
The preparation of financial statements in conformity with GAAP requires management to make estimates and assumptions that affect the reported amounts of assets, liabilities, revenue and expenses, and the disclosure of contingent liabilities. Management bases its estimates on historical experience and on various other assumptions that it believes to be reasonable under the circumstances, the results of which form the basis for making judgments about the carrying values of assets and liabilities that are not readily apparent from other sources.
Significant accounting policies used in the preparation of the Consolidated and Combined Financial Statements are discussed in Note 1, “Summary of Significant Accounting Policies,” in the notes to the consolidated and combined financial statements. Accounting estimates and assumptions discussed in this section are those that we consider
47
most critical to an understanding of our financial statements because they are inherently uncertain, involve significant judgments, include areas where different estimates reasonably could have been used, and changes in the estimate that are reasonably possible could materially impact the financial statements. Management believes that the accounting estimates employed and the resulting balances are reasonable; however, actual results in these areas could differ from management’s estimates under different assumptions or conditions.
Revenue Recognition.
We recognize revenue when persuasive evidence of an arrangement exists, delivery has occurred, the sales price is fixed or determinable, and collectability of the sales price is reasonably assured. For product sales, delivery does not occur until the products have been shipped, risk of loss has been transferred to the customer and the contractual terms have been fulfilled. In instances where contractual terms include a provision for customer acceptance, revenue is recognized when either (i) we have previously demonstrated that the product meets the specified criteria based on either seller- or customer-specified objective criteria or (ii) upon formal acceptance received from the customer where the product has not been previously demonstrated to meet customer-specified objective criteria. Revenue on service and repair contracts is recognized after services have been agreed to by the customer and rendered.
We enter into contracts to sell our products and services, and while the majority of our sales agreements contain standard terms and conditions, certain agreements contain multiple elements or non-standard terms and conditions. Where sales agreements contain multiple elements or non-standard terms and conditions, judgment is required to determine the appropriate accounting, including whether the deliverables specified in these agreements should be treated as separate units of accounting for revenue recognition purposes, and, if so, how the transaction price should be allocated among the elements and when to recognize revenue for each element. When a sale involves multiple deliverables, the total revenue from the arrangement is allocated to each unit of accounting based on the relative selling price of the deliverable to all other deliverables in the contract. Revenue for multiple element arrangements is recognized when the appropriate revenue recognition criteria for the individual deliverable have been satisfied. The allocation of sales price between elements may impact the timing of revenue recognition, but will not change the total revenue recognized on the arrangement. For delivered elements accounted for as separate units of accounting in a multiple element arrangement, revenue is recognized only when the delivered elements have standalone value, there are no uncertainties regarding customer acceptance and there are no customer-negotiated refund or return rights affecting the sales recognized.
We record a reduction in revenue at the time of sale for estimated product returns, rebates and other allowances, based on historical experience and known trends.
Warranty Accrual.
Accruals for estimated expenses related to warranties are made at the time products are sold or services are rendered and are recorded as a component of cost of revenue. These accruals are established using historical information on the nature, frequency and average cost of warranty claims and consider any factors that may cause differences in expected future warranty costs as compared to historical claim experience. While we engage in extensive product quality programs and processes, we base our estimated warranty obligation on product warranty terms offered to customers, ongoing product failure rates, material usage and service delivery costs incurred in correcting a product failure, as well as specific product class failures outside of our baseline experience. We assess the adequacy of our recorded warranty liabilities quarterly and adjust amounts as necessary.
Income Taxes.
Deferred tax assets and liabilities are determined based on temporary differences between the financial reporting and tax bases of assets and liabilities, applying enacted tax rates in effect for the year in which we expect the differences will reverse. Based on the evaluation of available evidence, we recognize future tax benefits, such as net operating loss carryforwards, to the extent that we believe it is more likely than not we will realize these benefits. We periodically assess the likelihood that we will be able to recover our deferred tax assets and reflect any changes to our estimate of the amount we are more likely than not to realize in the valuation allowance, with a corresponding adjustment to earnings or other comprehensive income, as appropriate.
In assessing the need for a valuation allowance, we look to the future reversal of existing taxable temporary differences, taxable income in carryback years and the feasibility of tax planning strategies and estimated future taxable income. The valuation allowance can be affected by changes to tax laws, changes to statutory tax rates and changes to future taxable income estimates.
Our effective tax rate reflects the impact of certain undistributed foreign earnings for which we have not provided U.S. taxes because we plan to reinvest such earnings indefinitely outside the United States. We plan foreign earnings remittance amounts based on projected cash flow needs, as well as the working capital and long-term
48
investment requirements of our foreign subsidiaries and our domestic operations. Based on these assumptions, we estimate the amount we will distribute to the United States and provide the U.S. federal taxes due on these amounts. Material changes in our estimates of cash, working capital and long-term investment requirements in the various jurisdictions in which we do business could impact our effective tax rate.
The calculation of our tax liabilities involves dealing with uncertainties in the application of complex tax regulations in a multitude of jurisdictions across our global operations. We recognize potential liabilities and record tax liabilities for anticipated tax audit issues in the U.S. and other tax jurisdictions based on our estimate of whether, and to the extent to which, additional taxes will be due. Furthermore, we recognize the tax benefit from an uncertain tax position only if it is more likely than not that the tax position will be sustained on examination by the taxing authorities, based on the technical merits of the position. The tax benefits recognized in the financial statements from such a position are measured based on the largest benefit that has a greater than 50% likelihood of being realized upon ultimate settlement.
We adjust our liability for uncertain tax positions in light of changing facts and circumstances; however, due to the complexity of some of these uncertainties, the ultimate resolution may result in a payment that is materially different from our current estimate of the tax liabilities. If our estimate of tax liabilities proves to be less than the ultimate assessment, an additional tax expense would result. If a payment of these amounts ultimately proves to be less than the recorded amounts, the reversal of the liabilities would result in tax benefits being recognized in the period when we determine the liabilities are no longer necessary.
Goodwill and Intangible Assets.
We review goodwill and indefinite-lived intangible assets for impairment annually and whenever events or changes in circumstances indicate the carrying value of an asset may not be recoverable. We also review the carrying value of our finite-lived intangible assets for potential impairment when impairment indicators arise. We conduct our annual impairment test as of the first day of the fourth quarter. We perform a two-step impairment test for goodwill. In the first step, we compare the estimated fair value of each reporting unit to its carrying value. If the estimated fair value of the reporting unit exceeds the carrying value of the net assets assigned to that reporting unit, goodwill is not impaired and we are not required to perform further testing. If the carrying value of the net assets assigned to the reporting unit exceeds its fair value, then we must perform the second step of the impairment test in order to measure the impairment loss to be recorded, if any. If the carrying value of a reporting unit’s goodwill exceeds its implied fair value, then we record an impairment loss equal to the difference. In our annual impairment test for indefinite-lived intangible assets, we compare the fair value of those assets to their carrying value. We recognize an impairment loss when the estimated fair value of the indefinite-lived intangible asset is less than its carrying value. We estimate the fair value of our reporting units and intangible assets with indefinite lives using an income approach. Under the income approach, we calculate fair value based on the present value of estimated future cash flows.
Determining the fair value of a reporting unit or an indefinite-lived intangible asset is judgmental in nature and involves the use of significant estimates and assumptions, particularly related to future operating results and cash flows. These estimates and assumptions include, but are not limited to, revenue growth rates and operating margins used to calculate projected future cash flows, risk-adjusted discount rates, assumed royalty rates, future economic and market conditions and identification of appropriate market comparable data. In addition, the identification of reporting units and the allocation of assets and liabilities to the reporting units when determining the carrying value of each reporting unit also require judgment. Goodwill is tested for impairment at either the operating segment identified in
Note 21
, “Industry Segment and Geographic Data,” of the consolidated and combined financial statements, or one level below. The fair value of our reporting units and indefinite-lived intangible assets is based on estimates and assumptions that are believed to be reasonable. Significant changes to these estimates and assumptions could adversely impact our conclusions. Actual future results may differ from those estimates.
During the fourth quarter of 2013 we performed our annual impairment assessment and determined that that the estimated fair values of our goodwill reporting units were substantially in excess of each of their carrying values with the exception of our Analytics business within our Water Infrastructure segment. While the fair value of the Analytics business initially increased over the first couple of years after acquisition, challenging economic conditions, including reduced government spending in the U.S. and sluggish growth in European markets, have led to a reduction in fair value during the past two years. Our 2013 impairment analysis indicated that the fair value of the Analytics reporting unit exceeded its carrying value by approximately
18%
. The goodwill associated with the Analytics business was
$439 million
at December 31, 2013. However, future goodwill impairment tests could result in a charge to earnings. We will continue to evaluate goodwill on an annual basis as of the beginning of our fourth quarter and whenever events and changes in circumstances indicate there may be a potential impairment.
49
During the fourth quarter of 2013 we performed our annual impairment test of our indefinite-lived intangibles assets which resulted in an impairment charge of $2 million related to trade names within our Water Infrastructure segment. Refer to
Note 11
, “Goodwill and Other Intangible Assets,” for additional information.
Postretirement Plans.
Company employees around the world participate in numerous defined benefit pension plans. The determination of projected benefit obligations and the recognition of expenses related to these pension plans are dependent on various assumptions. These major assumptions primarily relate to discount rates, expected long-term rates of return on plan assets, rate of future compensation increases, mortality, health care inflation and termination (some of which are disclosed in
Note 15
, “Postretirement Benefit Plans,” in the notes to the consolidated and combined financial statements) and other factors. Actual results that differ from our assumptions are accumulated and are amortized generally over the estimated future working life of the plan participants, or for plans with all or substantially all inactive participants, over the average remaining life expectancy.
Significant Assumptions
Management develops each assumption using relevant Company experience, in conjunction with market-related data for each individual country in which such plans exist. All assumptions are reviewed annually with third-party consultants and adjusted as necessary. The table included below provides the weighted average assumptions used to estimate our defined benefit pension obligations and costs as of and for the years ended
2013
and
2012
.
|
|
2013
|
2012
|
|||||||||
|
|
U.S.
|
Int’l
|
U.S.
|
Int’l
|
|||||||
|
Benefit Obligation Assumptions
|
|||||||||||
|
Discount rate
|
4.79
|
%
|
4.23
|
%
|
4.13
|
%
|
4.04
|
%
|
|||
|
Rate of future compensation increase
|
NM
|
|
3.48
|
%
|
4.50
|
%
|
3.50
|
%
|
|||
|
Net Periodic Benefit Cost Assumptions
|
|||||||||||
|
Discount rate
|
4.13
|
%
|
4.04
|
%
|
4.87
|
%
|
4.76
|
%
|
|||
|
Expected long-term return on plan assets
|
8.00
|
%
|
7.33
|
%
|
8.00
|
%
|
7.35
|
%
|
|||
|
Rate of future compensation increase
|
4.50
|
%
|
3.50
|
%
|
4.50
|
%
|
3.58
|
%
|
|||
|
NM
|
Not meaningful. During 2013, an amendment to one of the Company's business unit's pension plans, the Xylem Standard Hourly Bargaining Unit Pension Plan, modified the benefit formula. Similar to all other U.S. pension plans, pension benefits for future service will be based on years of service and not impacted by future compensation increases.
|
We determine the expected long-term rate of return on plan assets by evaluating both historical returns and estimates of future returns. Specifically, the Company analyzes the estimated future returns based on independent estimates of asset class returns and evaluates historical broad market returns over long-term timeframes based on the strategic asset allocation, which is detailed in
Note 15
, “Postretirement Benefit Plans,” in the notes to the consolidated financial statements.
Based on the approach described above, the chart below shows weighted average actual returns versus the weighted average expected long-term rates of return for our pension plans that were utilized in the calculation of the net periodic pension cost for each respective year.
|
2013
|
2012
|
2011
|
||||||
|
Expected long-term rate of return on plan assets
|
7.40
|
%
|
7.42
|
%
|
7.52
|
%
|
||
|
Actual rate of return on plan assets
|
10.17
|
%
|
10.09
|
%
|
(1.40
|
)%
|
||
For the recognition of net periodic pension cost, the calculation of the expected long-term rate of return on plan assets is generally derived using a market-related value of plan assets based on average asset values at the measurement date over the last five years. The use of fair value, rather than a calculated value, could materially affect net periodic pension cost. Our weighted average expected long-term rate of return on plan assets for all pension plans, effective January 1,
2014
is
7.38%
. We estimate that every 25 basis point change in the expected return on plan assets impacts the expense by $1 million.
The discount rate reflects our expectation of the present value of expected future cash payments for benefits at the measurement date. A decrease in the discount rate increases the present value of benefit obligations and increases
50
pension expense. We base the discount rate assumption on current investment yields of high-quality fixed income investments during the retirement benefits maturity period. The pension discount rate was determined by considering an interest rate yield curve comprising AAA/AA bonds, with maturities between zero and thirty years, developed by the plan’s actuaries. Annual benefit payments are then discounted to present value using this yield curve to develop a single-point discount rate matching the plan’s characteristics. Our weighted average discount rate for all pension plans effective January 1,
2014
, is
4.29%
. We estimate that every 25 basis point change in the discount rate impacts the expense by $1 million.
The rate of future compensation increase assumption reflects our long-term actual experience and future and near-term outlook. Effective January 1,
2014
, our expected rate of future compensation is 3.48% for all pension plans. The estimated impact of a 25 basis point change in the expected rate of future compensation is less than $1 million.
The assumed rate of future increases in the per capita cost of health care (the health care trend rate) is
7.19%
for
2014
, decreasing ratably to 5.00% in 2020. An increase or decrease in the health care trend rates by one percent per year would impact the aggregate annual service and interest components by less than $1 million, and impact the benefit obligation by approximately $8 million. To the extent that actual experience differs from these assumptions, the effect will be amortized over the average future service of the covered active employees.
We currently anticipate making contributions to our pension and postretirement benefit plans in the range of
$40 million
to
$50 million
during
2014
, of which
$11 million
is expected to be made in the first quarter.
Funded Status
Funded status is derived by subtracting the respective year-end values of the projected benefit obligations from the fair value of plan assets. We estimate that every 25 basis point change in the discount rate impacts the funded status by approximately $25 million.
Fair Value of Plan Assets
The plan assets of our pension plans comprise a broad range of investments, including domestic and foreign equity securities, interests in private equity and hedge funds, fixed income investments, insurance contracts, real estate, and cash and cash equivalents.
A portion of our pension benefit plan assets portfolio comprises investments in private equity and hedge funds. The private equity and hedge fund investments are generally measured at net asset value. However, in certain instances, the values reported by the asset managers were not current at the measurement date. Accordingly, we made estimate adjustments to the last reported value where necessary to measure the assets at fair value at the measurement date. These adjustments consider information received from the asset managers, as well as general market information. The adjustment recorded at
December 31, 2013
and
2012
for these assets represented less than one half of one percent of total plan assets in each respective year. Asset values for other positions were generally measured using market observable prices. We estimate that a 5% change in asset values will impact funded status by approximately $24 million.
New Accounting Pronouncements
See
Note 2
, “Recently Issued Accounting Pronouncements,” in the notes to the consolidated and combined financial statements for a complete discussion of recent accounting pronouncements. There were no new pronouncements which we expect to have a material impact on our financial condition and results of operations in future periods.
51
We are exposed to market risk, primarily related to foreign currency exchange and interest rates. These exposures are actively monitored by management. Our exposure to foreign exchange rate risk is due to certain costs, revenue and borrowings being denominated in currencies other than one of our subsidiaries functional currency. Similarly, we are exposed to market risk as the result of changes in interest rates which may affect the cost of our financing. It is our policy and practice to use derivative financial instruments only to the extent necessary to manage exposures.
Foreign Currency Exchange Rate Risk
Our foreign currency exchange rate risk relates to receipts from customers, payments to suppliers and intercompany transactions denominated in foreign currencies. We may use derivative financial instruments to offset risk related to receipts from customers and payments to suppliers, when it is believed that the exposure will not be limited by our normal operating and financing activities. In January 2012, we began to enter into currency forward contracts periodically in order to manage the exchange rate fluctuation risk on certain intercompany transactions associated with third party sales and purchases. Our principal currency exposures relate to the Euro, Swedish Krona, British Pound, Australian Dollar, Canadian Dollar, Polish Zloty, and Hungarian Forint. We estimate that a hypothetical 10% adverse movement in foreign currency exchange rates would not be material to Xylem’s financial position and results of operations.
Interest Rate Risk
As of
December 31, 2013
, we do not have a material exposure to interest rate risk as our debt portfolio entirely comprises long-term, fixed-rate instruments. We do not account for our long-term debt using the fair value option.
Commodity Price Exposures
Portions of our business are exposed to volatility in the prices of certain commodities, such as copper, nickel and aluminum, among others. Our primary exposure to this volatility resides with the use of these materials in purchased component parts. We generally maintain long-term fixed price contracts on raw materials and component parts; however, we are prone to exposure as these contracts expire. We estimate that a hypothetical 10% adverse movement in prices for raw metal commodities would not be material to our financial position and results of operations.
52
INDEX TO CONSOLIDATED AND COMBINED FINANCIAL STATEMENTS
|
|
Page No.
|
|
Audited Consolidated and Combined Financial Statements:
|
|
|
Notes to Consolidated and Combined Financial Statements:
|
|
53
REPORT OF INDEPENDENT REGISTERED PUBLIC ACCOUNTING FIRM
To the Board of Directors and Stockholders of
Xylem Inc.
Rye Brook, New York
We have audited the accompanying consolidated balance sheets of Xylem Inc. and subsidiaries (the "Company") as of December 31, 2013 and 2012, and the related consolidated and combined statements of income, comprehensive income, stockholders' equity, and cash flows for each of the three years in the period ended December 31, 2013. These financial statements are the responsibility of the Company's management. Our responsibility is to express an opinion on the financial statements based on our audits.
We conducted our audits in accordance with the standards of the Public Company Accounting Oversight Board (United States). Those standards require that we plan and perform the audit to obtain reasonable assurance about whether the financial statements are free of material misstatement. An audit includes examining, on a test basis, evidence supporting the amounts and disclosures in the financial statements. An audit also includes assessing the accounting principles used and significant estimates made by management, as well as evaluating the overall financial statement presentation. We believe that our audits provide a reasonable basis for our opinion.
In our opinion, such consolidated financial statements present fairly, in all material respects, the financial position of Xylem Inc. and subsidiaries as of December 31, 2013 and 2012, and the results of their operations and their cash flows for each of the three years in the period ended December 31, 2013, in conformity with accounting principles generally accepted in the United States of America.
As described in Note 1 to the consolidated and combined financial statements, prior to October 31, 2011, the accompanying financial statements were derived from the accounting records of the water equipment and services businesses of ITT Corporation. For periods prior to October 31, 2011, the financial statements include expense allocations for certain corporate functions historically provided by ITT Corporation. These allocations may not be reflective of the actual expenses that would have been incurred had the Company operated as a separate entity apart from ITT Corporation. Included in
Note 20
to the consolidated and combined financial statements is a summary of transactions with related parties.
We have also audited, in accordance with the standards of the Public Company Accounting Oversight Board (United States), the Company's internal control over financial reporting as of December 31, 2013, based on the criteria established in
Internal Control - Integrated Framework (1992)
issued by the Committee of Sponsoring Organizations of the Treadway Commission and our report dated
February 27, 2014
expressed an unqualified opinion on the Company's internal control over financial reporting.
/s/ Deloitte & Touche LLP
Stamford, Connecticut
February 27, 2014
54
XYLEM INC. AND SUBSIDIARIES
CONSOLIDATED AND COMBINED INCOME STATEMENTS
(In Millions, except per share data)
|
Year Ended December 31,
|
2013
|
2012
|
2011
|
||||||||
|
Revenue
|
$
|
3,837
|
|
$
|
3,791
|
|
$
|
3,803
|
|
||
|
Cost of revenue
|
2,338
|
|
2,289
|
|
2,342
|
|
|||||
|
Gross profit
|
1,499
|
|
1,502
|
|
1,461
|
|
|||||
|
Selling, general and administrative expenses
|
986
|
|
914
|
|
877
|
|
|||||
|
Research and development expenses
|
104
|
|
106
|
|
100
|
|
|||||
|
Separation costs
|
4
|
|
22
|
|
87
|
|
|||||
|
Restructuring and asset impairment charges
|
42
|
|
17
|
|
2
|
|
|||||
|
Operating income
|
363
|
|
443
|
|
395
|
|
|||||
|
Interest expense
|
55
|
|
55
|
|
17
|
|
|||||
|
Other non-operating (expense) income, net
|
(10
|
)
|
—
|
|
5
|
|
|||||
|
Income before taxes
|
298
|
|
388
|
|
383
|
|
|||||
|
Income tax expense
|
70
|
|
91
|
|
104
|
|
|||||
|
Net income
|
$
|
228
|
|
$
|
297
|
|
$
|
279
|
|
||
|
Earnings per share:
|
|||||||||||
|
Basic
|
$
|
1.23
|
|
$
|
1.60
|
|
$
|
1.51
|
|
||
|
Diluted
|
$
|
1.22
|
|
$
|
1.59
|
|
$
|
1.50
|
|
||
|
Weighted average number of shares – Basic
|
185.2
|
|
185.8
|
|
185.1
|
|
|||||
|
Weighted average number of shares – Diluted
|
186.0
|
|
186.2
|
|
185.3
|
|
|||||
See accompanying notes to consolidated and combined financial statements.
55
XYLEM INC. AND SUBSIDIARIES
CONSOLIDATED AND COMBINED STATEMENTS OF COMPREHENSIVE INCOME
(In Millions)
|
Year Ended December 31,
|
2013
|
2012
|
2011
|
||||||||
|
Net income
|
$
|
228
|
|
$
|
297
|
|
$
|
279
|
|
||
|
Other comprehensive income, before tax:
|
|||||||||||
|
Foreign currency translation adjustment
|
15
|
|
48
|
|
(61
|
)
|
|||||
|
Net change in cash flow hedges:
|
|||||||||||
|
Unrealized gains
|
1
|
|
4
|
|
—
|
|
|||||
|
Amount of gain reclassified into net income
|
—
|
|
(3
|
)
|
—
|
|
|||||
|
Net change in postretirement benefit plans:
|
|||||||||||
|
Net gain (loss)
|
34
|
|
(84
|
)
|
(74
|
)
|
|||||
|
Prior service cost
|
4
|
|
(1
|
)
|
—
|
|
|||||
|
Amortization of prior service cost
|
1
|
|
1
|
|
1
|
|
|||||
|
Amortization of net actuarial loss
|
17
|
|
11
|
|
2
|
|
|||||
|
Settlement
|
—
|
|
2
|
|
—
|
|
|||||
|
Foreign exchange
|
2
|
|
(8
|
)
|
—
|
|
|||||
|
Other comprehensive income (loss), before tax
|
74
|
|
(30
|
)
|
(132
|
)
|
|||||
|
Income tax expense (benefits) related to other comprehensive loss
|
22
|
|
(23
|
)
|
(14
|
)
|
|||||
|
Other comprehensive income (loss), net of tax
|
52
|
|
(7
|
)
|
(118
|
)
|
|||||
|
Comprehensive income
|
$
|
280
|
|
$
|
290
|
|
$
|
161
|
|
||
See accompanying notes to consolidated and combined financial statements.
56
XYLEM INC. AND SUBSIDIARIES
CONSOLIDATED BALANCE SHEETS
(In Millions, except per share amounts)
|
December 31,
|
2013
|
2012
|
|||||
|
ASSETS
|
|||||||
|
Current assets:
|
|||||||
|
Cash and cash equivalents
|
$
|
533
|
|
$
|
504
|
|
|
|
Receivables, less allowances for discounts and doubtful accounts of $31 and $34 in 2013 and 2012, respectively
|
817
|
|
776
|
|
|||
|
Inventories, net
|
475
|
|
443
|
|
|||
|
Prepaid and other current assets
|
143
|
|
110
|
|
|||
|
Deferred income tax assets
|
41
|
|
41
|
|
|||
|
Total current assets
|
2,009
|
|
1,874
|
|
|||
|
Property, plant and equipment, net
|
488
|
|
487
|
|
|||
|
Goodwill
|
1,718
|
|
1,647
|
|
|||
|
Other intangible assets, net
|
488
|
|
484
|
|
|||
|
Other non-current assets
|
193
|
|
187
|
|
|||
|
Total assets
|
$
|
4,896
|
|
$
|
4,679
|
|
|
|
LIABILITIES AND STOCKHOLDERS’ EQUITY
|
|||||||
|
Current liabilities:
|
|||||||
|
Accounts payable
|
$
|
332
|
|
$
|
332
|
|
|
|
Accrued and other current liabilities
|
479
|
|
443
|
|
|||
|
Short-term borrowings and current maturities of long-term debt
|
42
|
|
6
|
|
|||
|
Total current liabilities
|
853
|
|
781
|
|
|||
|
Long-term debt
|
1,199
|
|
1,199
|
|
|||
|
Accrued postretirement benefits
|
348
|
|
400
|
|
|||
|
Deferred income tax liabilities
|
191
|
|
173
|
|
|||
|
Other non-current accrued liabilities
|
64
|
|
52
|
|
|||
|
Total liabilities
|
2,655
|
|
2,605
|
|
|||
|
Commitment and Contingencies (Note 19)
|
|
||||||
|
Stockholders’ equity:
|
|||||||
|
Common Stock — par value $0.01 per share:
|
|||||||
|
Authorized 750.0 shares, issued 187.6 and 186.2 shares in 2013 and 2012, respectively
|
2
|
|
2
|
|
|||
|
Capital in excess of par value
|
1,753
|
|
1,706
|
|
|||
|
Retained earnings
|
405
|
|
264
|
|
|||
|
Treasury stock – at cost 3.0 shares and 0.5 shares in 2013 and 2012, respectively
|
(86
|
)
|
(13
|
)
|
|||
|
Accumulated other comprehensive income
|
167
|
|
115
|
|
|||
|
Total stockholders’ equity
|
2,241
|
|
2,074
|
|
|||
|
Total liabilities and stockholders’ equity
|
$
|
4,896
|
|
$
|
4,679
|
|
|
See accompanying notes to consolidated and combined financial statements.
57
XYLEM INC. AND SUBSIDIARIES
CONSOLIDATED AND COMBINED STATEMENTS OF CASH FLOWS
(In Millions)
|
Year Ended December 31,
|
2013
|
2012
|
2011
|
||||||||
|
Operating Activities
|
|||||||||||
|
Net income
|
$
|
228
|
|
$
|
297
|
|
$
|
279
|
|
||
|
Adjustments to reconcile net income to net cash provided by operating activities:
|
|||||||||||
|
Depreciation
|
99
|
|
94
|
|
93
|
|
|||||
|
Amortization
|
51
|
|
48
|
|
44
|
|
|||||
|
Deferred income taxes
|
(14
|
)
|
1
|
|
8
|
|
|||||
|
Share-based compensation
|
27
|
|
22
|
|
13
|
|
|||||
|
Non-cash separation costs
|
—
|
|
—
|
|
10
|
|
|||||
|
Restructuring and asset impairment charges, net
|
42
|
|
17
|
|
2
|
|
|||||
|
Other, net
|
15
|
|
2
|
|
5
|
|
|||||
|
Payments of restructuring
|
(35
|
)
|
(9
|
)
|
(7
|
)
|
|||||
|
Contributions to postretirement benefit plans
|
(43
|
)
|
(46
|
)
|
(16
|
)
|
|||||
|
Changes in assets and liabilities (net of acquisitions):
|
|||||||||||
|
Changes in receivables
|
(47
|
)
|
2
|
|
(61
|
)
|
|||||
|
Changes in inventories
|
(39
|
)
|
5
|
|
(18
|
)
|
|||||
|
Changes in accounts payable
|
4
|
|
(4
|
)
|
(9
|
)
|
|||||
|
Changes in accrued liabilities
|
18
|
|
(28
|
)
|
53
|
|
|||||
|
Changes in accrued taxes
|
20
|
|
(17
|
)
|
56
|
|
|||||
|
Net changes in other assets and liabilities
|
(2
|
)
|
12
|
|
(3
|
)
|
|||||
|
Net Cash — Operating activities
|
324
|
|
396
|
|
449
|
|
|||||
|
Investing Activities
|
|||||||||||
|
Capital expenditures
|
(126
|
)
|
(112
|
)
|
(126
|
)
|
|||||
|
Proceeds from the sale of property, plant and equipment
|
6
|
|
5
|
|
11
|
|
|||||
|
Acquisitions of businesses and assets, net of cash acquired
|
(81
|
)
|
(41
|
)
|
(309
|
)
|
|||||
|
Other, net
|
2
|
|
1
|
|
1
|
|
|||||
|
Net Cash — Investing activities
|
(199
|
)
|
(147
|
)
|
(423
|
)
|
|||||
|
Financing Activities
|
|||||||||||
|
Net transfer to former parent
|
—
|
|
(9
|
)
|
(995
|
)
|
|||||
|
Issuance of short-term debt
|
39
|
|
13
|
|
5
|
|
|||||
|
Issuance of senior notes, net of discount
|
—
|
|
—
|
|
1,198
|
|
|||||
|
Principal payments of debt and capital lease obligations
|
(2
|
)
|
(14
|
)
|
(8
|
)
|
|||||
|
Purchase of Xylem common stock
|
(73
|
)
|
(13
|
)
|
—
|
|
|||||
|
Proceeds from exercise of employee stock options
|
22
|
|
24
|
|
1
|
|
|||||
|
Excess tax benefit from share based compensation
|
1
|
|
—
|
|
—
|
|
|||||
|
Payments of debt issuance costs
|
—
|
|
—
|
|
(10
|
)
|
|||||
|
Dividends paid
|
(87
|
)
|
(75
|
)
|
(19
|
)
|
|||||
|
Net Cash — Financing activities
|
(100
|
)
|
(74
|
)
|
172
|
|
|||||
|
Effect of exchange rate changes on cash
|
4
|
|
11
|
|
(11
|
)
|
|||||
|
Net change in cash and cash equivalents
|
29
|
|
186
|
|
187
|
|
|||||
|
Cash and cash equivalents at beginning of year
|
504
|
|
318
|
|
131
|
|
|||||
|
Cash and cash equivalents at end of year
|
$
|
533
|
|
$
|
504
|
|
$
|
318
|
|
||
|
Supplemental disclosure of cash flow information:
|
|||||||||||
|
Cash paid during the year for:
|
|||||||||||
|
Interest
|
$
|
51
|
|
$
|
53
|
|
$
|
—
|
|
||
|
Income taxes (net of refunds received)
|
$
|
65
|
|
$
|
104
|
|
$
|
64
|
|
||
See accompanying notes to consolidated and combined financial statements.
58
XYLEM INC. AND SUBSIDIARIES
CONSOLIDATED AND COMBINED STATEMENTS OF CHANGES IN STOCKHOLDERS’ EQUITY
(In Millions, except per share amounts)
|
Common
Stock |
Add'l
Paid-In Capital |
Retained
Earnings |
Accumulated Other
Comprehensive Income (Loss) |
Treasury Stock
|
Parent
Company Investment |
Total
|
|||||||||||||||||||||
|
Balance at January 1, 2011
|
—
|
|
—
|
|
4
|
|
37
|
|
—
|
|
2,682
|
|
2,723
|
|
|||||||||||||
|
Net income to October 30, 2011
|
220
|
|
220
|
|
|||||||||||||||||||||||
|
Net income from October 31, 2011
|
59
|
|
59
|
|
|||||||||||||||||||||||
|
Other comprehensive loss, net
|
(118
|
)
|
(118
|
)
|
|||||||||||||||||||||||
|
Assumption of accumulated unrealized gains (losses) on postretirement benefit plans
|
(73
|
)
|
(73
|
)
|
|||||||||||||||||||||||
|
Contributed currency translation adjustment
|
276
|
|
276
|
|
|||||||||||||||||||||||
|
Change in parent company investment
|
(1,240
|
)
|
(1,240
|
)
|
|||||||||||||||||||||||
|
Conversion of net investment
|
2
|
|
1,660
|
|
(1,662
|
)
|
—
|
|
|||||||||||||||||||
|
Dividends declared ($0.1012 per share)
|
(19
|
)
|
(19
|
)
|
|||||||||||||||||||||||
|
Stock incentive plan activity
|
3
|
|
3
|
|
|||||||||||||||||||||||
|
Balance at December 31, 2011
|
2
|
|
1,663
|
|
44
|
|
122
|
|
—
|
|
—
|
|
1,831
|
|
|||||||||||||
|
Net income
|
297
|
|
297
|
|
|||||||||||||||||||||||
|
Other comprehensive loss, net
|
(7
|
)
|
(7
|
)
|
|||||||||||||||||||||||
|
Dividends declared ($0.4048 per share)
|
(77
|
)
|
(77
|
)
|
|||||||||||||||||||||||
|
Stock incentive plan activity
|
43
|
|
43
|
|
|||||||||||||||||||||||
|
Repurchase of common stock
|
(13
|
)
|
(13
|
)
|
|||||||||||||||||||||||
|
Balance at December 31, 2012
|
$
|
2
|
|
$
|
1,706
|
|
$
|
264
|
|
$
|
115
|
|
$
|
(13
|
)
|
$
|
—
|
|
$
|
2,074
|
|
||||||
|
Net income
|
228
|
|
228
|
|
|||||||||||||||||||||||
|
Other comprehensive income, net
|
52
|
|
52
|
|
|||||||||||||||||||||||
|
Dividends declared ($0.4656 per share)
|
(87
|
)
|
(87
|
)
|
|||||||||||||||||||||||
|
Stock incentive plan activity
|
47
|
|
47
|
|
|||||||||||||||||||||||
|
Repurchase of common stock
|
(73
|
)
|
(73
|
)
|
|||||||||||||||||||||||
|
Balance at December 31, 2013
|
$
|
2
|
|
$
|
1,753
|
|
$
|
405
|
|
$
|
167
|
|
$
|
(86
|
)
|
$
|
—
|
|
$
|
2,241
|
|
||||||
See accompanying notes to consolidated and combined financial statements.
59
NOTES TO CONSOLIDATED AND COMBINED FINANCIAL STATEMENTS
Xylem Inc. (
“
Xylem
”
or the
“
Company
”
) is a leading equipment and service provider for water and wastewater applications with a broad portfolio of products and services addressing the full cycle of water, from collection, distribution and use to the return of water to the environment. Xylem operates in two segments, Water Infrastructure and Applied Water. The Water Infrastructure segment focuses on the transportation, treatment and testing of water, offering a range of products including water and wastewater pumps, treatment and testing equipment, and controls and systems. The Applied Water segment encompasses all the uses of water and focuses on the residential, commercial, industrial and agricultural markets. The Applied Water segment
’
s major products include pumps, valves, heat exchangers, controls and dispensing equipment. Xylem Inc. was incorporated in Indiana on May
4, 2011.
On October
31, 2011 (the "Distribution Date"), ITT Corporation (
“
ITT
”
) completed the Spin-off (the
“
Spin-off
”
) of Xylem, formerly ITT
’
s water equipment and services businesses. The Spin-off was completed pursuant to the Distribution Agreement, dated as of October
25, 2011 (the
“
Distribution Agreement
”
), among ITT, Exelis Inc. (
“
Exelis
”
) and Xylem.
Hereinafter, except as otherwise indicated or unless the context otherwise requires,
“
Xylem,
”
“
we,
”
“
us,
”
“
our
”
and
“
the Company
”
refer to Xylem Inc. and its subsidiaries. References in the notes to the consolidated and combined financial statements to
“
ITT
”
or
“
parent
”
refers to ITT Corporation and its consolidated subsidiaries (other than Xylem Inc.).
Basis of Presentation
The consolidated and combined financial statements reflect our financial position and results of operations in conformity with accounting principles generally accepted in the United States of America (
“
GAAP
”
). All intracompany transactions between our businesses have been eliminated. On and prior to the Distribution Date, our financial position and results of operations consisted of the water equipment and services businesses of ITT Corporation (
“
WaterCo
”
) and have been derived from ITT
’
s historical accounting records and are presented on a carve-out basis through our Distribution Date, while our financial results for Xylem post Spin-off are prepared on a stand-alone basis. As such, our Consolidated Statements of Income, Comprehensive Income and Cash Flows for the periods ended December
31, 2013 and 2012 consist of the consolidated results of Xylem on a stand-alone basis. The Consolidated and Combined Statements of Income, Comprehensive Income and Cash Flows for the twelve months ended December
31, 2011 consist of the consolidated results of Xylem on a stand-alone basis for two months of November and December and the combined results of operations of WaterCo for ten months on a carve-out basis.
For periods prior to the Spin-off, our consolidated and combined financial statements include expense allocations for (i)
certain corporate functions historically provided by ITT, including, but not limited to, finance, legal, information technology, human resources, communications, ethics and compliance, and shared services, (ii)
employee benefits and incentives, and (iii)
share-based compensation. These expenses have been allocated to us on the basis of direct usage when identifiable, with the remainder allocated on the basis of revenue, headcount or other measures.
We consider the basis on which the expenses have been allocated to be a reasonable reflection of the utilization of services provided to or the benefit received by us during the periods presented. The allocations may not, however, reflect the expense we would have incurred as an independent, publicly traded company for the periods presented prior to the Distribution Date. Actual costs that may have been incurred if we had been a stand-alone company would depend on a number of factors, including the chosen organizational structure, what functions were outsourced or performed by employees and strategic decisions made in areas such as information technology and infrastructure. Subsequent to the Spin-off, we have performed these functions using our own resources or purchased services, certain of which have been provided by ITT or Exelis under the Transition Services Agreement ("TSA"). As of December 31, 2013, we have completed substantially all services under the TSA.
Certain prior year amounts have been reclassified to conform to the current year presentation.
60
Use of Estimates
The preparation of financial statements in conformity with GAAP requires management to make estimates and assumptions that affect the reported amounts of assets and liabilities, the disclosure of contingent assets and liabilities at the date of the financial statements, and the reported amounts of revenue and expenses during the reporting period. Estimates are revised as additional information becomes available. Estimates and assumptions are used for, but not limited to, postretirement obligations and assets, revenue recognition, income tax contingency accruals and valuation allowances, goodwill and indefinite lived intangible impairment testing and contingent liabilities. Actual results could differ from these estimates.
Consolidation Principles
We consolidate companies in which we have a controlling financial interest or when Xylem is considered the primary beneficiary of a variable interest entity. We account for investments in companies over which we have the ability to exercise significant influence but do not hold a controlling financial interest under the equity method, and we record our proportionate share of income or losses in the Consolidated and Combined Income Statements. Equity method investments are reviewed for impairment when events or circumstances indicate the investment may be other than temporarily impaired. This requires significant judgment, including an assessment of the investee
’
s financial condition, the possibility of subsequent rounds of financing, and the investee
’
s historical and projected results of operations. If the actual results of operations for the investee are significantly different from projections, we may incur future charges for the impairment of these investments.
Foreign Currency Translation
The national currencies of our foreign companies are generally the functional currencies. Balance sheet accounts are translated at the exchange rate in effect at the end of each period; income statement accounts are translated at the average rates of exchange prevailing during the period. Gains and losses on foreign currency translations are reflected in the cumulative translation adjustments component of stockholders
’
equity. Net gains or losses from foreign currency transactions are reported currently in selling, general and administrative expenses.
Revenue Recognition
Revenue is recognized when persuasive evidence of an arrangement exists, the price is fixed or determinable, collectability is reasonably assured and delivery has occurred or services have been rendered. For product sales, other than long-term construction-type contracts, we recognize revenue at the time title and risks and rewards of ownership pass, which is generally when products are shipped. Certain contracts with customers require delivery, installation, testing, certification or other acceptance provisions to be satisfied before revenue is recognized. We recognize revenue on product sales to channel partners, including resellers, distributors or value-added solution providers at the time of sale when the channel partners have economic substance apart from Xylem and Xylem has completed its obligations related to the sale. Revenue from the rental of equipment is recognized over the rental period. Service revenue is recognized as services are performed.
For agreements that contain multiple deliverables, we recognize revenue based on the relative selling price if the deliverable has stand-alone value to the customer and, in arrangements that include a general right of return relative to the delivered element, performance of the undelivered element is considered probable and substantially in the Company
’
s control. The selling price for a deliverable is based on vendor-specific objective evidence of selling price (
“
VSOE
”
), if available, third-party evidence of selling price (
“
TPE
”
), if VSOE is not available, or best estimated selling price, if neither VSOE nor TPE is available.
The deliverables in our arrangements with multiple elements include various products and may include related services, such as installation and start-up services. We allocate arrangement consideration based on the relative selling prices of the separate units of accounting determined in accordance with the hierarchy described above. For deliverables that are sold separately, we establish VSOE based on the price when the deliverable is sold separately. We establish TPE, generally for services, based on prices similarly situated customers pay for similar services from third-party vendors. For those deliverables for which we are unable to establish VSOE or TPE, we estimate the selling price considering various factors including market and pricing trends, geography, product customization, and profit objectives. Revenue for multiple element arrangements is recognized when the appropriate revenue recognition criteria for the individual deliverable have been satisfied.
Certain businesses enter into long-term construction-type sales contracts for which revenue is recognized under the percentage-of-completion method based upon percentage of costs incurred to total estimated costs.
61
Shipping and Handling Costs
Shipping and handling costs are recorded as a component of cost of revenue.
Share-Based Compensation
Share-based awards issued to employees and members of the Board of Directors include non-qualified stock options, restricted stock awards and performance-based awards. Compensation costs resulting from share-based payment transactions are recognized primarily within selling, general and administrative expenses, at fair value over the requisite service period (typically three years) on a straight-line basis. The calculated compensation cost is adjusted based on an estimate of awards ultimately expected to vest. For performance-based awards, the calculated compensation cost is adjusted based on an estimate of awards ultimately expected to vest and our assessment of the probable outcome of the performance condition.The fair value of a non-qualified stock option is determined on the date of grant using a binomial lattice pricing model incorporating multiple and variable assumptions over time, including assumptions such as employee exercise patterns, stock price volatility and changes in dividends. The fair value of restricted stock awards is determined using the closing price of our common stock on date of grant. The fair value of performance-based share awards at 100% target is determined using the closing price of our common stock on date of grant.
Research and Development
We conduct research and development activities, which consist primarily of the development of new products, product applications, and manufacturing processes. These costs are charged to expense as incurred.
Exit and Disposal Costs
We periodically initiate management-approved restructuring activities to achieve cost savings through reduced operational redundancies and to position ourselves strategically in the market in response to prevailing economic conditions and associated customer demand. Costs associated with restructuring actions can include severance, infrastructure charges to vacate facilities or consolidate operations, contract termination costs and other related charges. For involuntary separation plans, a liability is recognized when it is probable and reasonably estimable. For voluntary separation plans, a liability is recognized when the employee irrevocably accepts the voluntary termination. For one-time termination benefits, such as additional severance pay or benefit payouts, and other exit costs, such as lease termination costs, the liability is measured and recognized initially at fair value in the period in which the liability is incurred, with subsequent changes to the liability recognized as adjustments in the period of change.
Deferred Financing Costs
Deferred financing costs represent costs incurred in conjunction with our debt financing activities and are capitalized in other assets and amortized over the life of the related financing arrangements. If the debt is retired early, the related unamortized deferred financing costs are written off in the period the debt is retired and are recorded in the results of operations under the caption “interest expense.”
Income Taxes
Income taxes are calculated using the asset and liability method. Deferred tax assets and liabilities are determined based on the estimated future tax effects of temporary differences between the financial statement carrying amounts and the tax bases of assets and liabilities, as measured by the current enacted tax rates.
We maintain valuation allowances when it is more likely than not that all or a portion of a deferred asset will not be realized. The valuation allowance is intended in part to provide for the uncertainty regarding the ultimate utilization of our U.S. capital loss carryforwards, U.S. foreign tax credit carryovers, and foreign net operating loss carryforwards. In determining whether a valuation allowance is warranted, we consider all positive and negative evidence and all sources of taxable income such as prior earnings history, expected future earnings, carryback and carryforward periods and tax strategies to estimate if sufficient future taxable income will be generated to realize the deferred tax asset. The assessment of the adequacy of our valuation allowance is based on our estimates of taxable income by jurisdiction in which we operate and the period over which our deferred tax assets will be recoverable. In the event that actual results differ from these estimates, or we adjust these estimates in future periods for current trends or expected changes in our estimating assumptions, we may need to modify the level of valuation allowance that could materially impact our business, financial condition and results of operations.
62
Our effective tax rate reflects the impact of certain undistributed foreign earnings for which we have not provided U.S. taxes because we plan to reinvest such earnings indefinitely outside the United States. We plan foreign earnings remittance amounts based on projected cash flow needs, as well as the working capital and long-term investment requirements of our foreign subsidiaries and our domestic operations. Based on these assumptions, we estimate the amount we will distribute to the United States and provide the U.S. federal taxes due on these amounts. Material changes in our estimates of cash, working capital and long-term investment requirements in the various jurisdictions in which we do business could impact our effective tax rate.
Tax benefits are recognized for an uncertain tax position when, in management
’
s judgment, it is more likely than not that the position will be sustained upon examination by a taxing authority. For a tax position that meets the more-likely-than-not recognition threshold, the tax benefit is measured as the largest amount that is judged to have a greater than 50% likelihood of being realized upon ultimate settlement with a taxing authority. The liability associated with unrecognized tax benefits is adjusted periodically due to changing circumstances and when new information becomes available. Such adjustments are recognized in the period in which they are identified. The effective tax rate includes the net impact of changes in the liability for unrecognized tax benefits and subsequent adjustments as considered appropriate by management. While it is often difficult to predict the final outcome or the timing of resolution of any particular tax matter, we believe our liability for unrecognized tax benefits is adequate. We classify interest relating to unrecognized tax benefits as a component of other non-operating (expense) income, net and tax penalties as a component of income tax expense in our Consolidated and Combined Income Statements.
Earnings Per Share
We present two calculations of earnings per share (
“
EPS
”
).
“
Basic
”
EPS equals net income divided by weighted average shares outstanding during the period.
“
Diluted
”
EPS equals net income divided by the sum of weighted average common shares outstanding during the period plus potentially dilutive shares. Potentially dilutive common shares that are anti-dilutive are excluded from diluted EPS.
Basic and Diluted EPS for all periods prior to the Spin-off reflect the number of distributed shares on the Distribution Date, or
184.6 million
shares. For our 2011 year to date calculations, these shares are treated as issued and outstanding from January 1, 2011 for purposes of calculating historical basic EPS. At the time of the Spin-off, ITT stock options and restricted stock awards were converted to awards of Xylem, and therefore there were no dilutive securities outstanding for historical periods. For 2011, the Company determined our weighted average dilutive shares outstanding assuming that the date of our separation from ITT was the beginning of the period.
Cash Equivalents
We consider all liquid investments purchased with an original maturity of three months or less to be cash equivalents.
Receivables and Allowance for Doubtful Accounts and Cash Discounts
Trade receivables primarily comprise uncollected amounts owed to us from transactions with customers and are presented net of allowances for doubtful accounts and cash discounts.
We determine our allowance for doubtful accounts using a combination of factors to reduce our trade receivable balances to their estimated net realizable amount. We maintain an allowance for doubtful accounts based on a variety of factors, including the length of time receivables are past due, macroeconomic trends and conditions, significant one-time events, historical experience and the financial condition of customers. We record a specific reserve for individual accounts when we become aware of specific customer circumstances, such as in the case of bankruptcy filings or deterioration in the customer
’
s operating results or financial position. The past due or delinquency status of a receivable is based on the contractual payment terms of the receivable. If circumstances related to the specific customer change, we adjust estimates of the recoverability of receivables as appropriate. We determine our allowance for cash discounts primarily based on historical experience with customers.
Credit risk with respect to accounts receivable is generally diversified due to the large number of entities comprising our customer base and their dispersion across many different geographical regions. We perform ongoing credit evaluations of the financial condition of our third-party distributors, resellers and other customers and require collateral, such as letters of credit and bank guarantees, in certain circumstances. As of
December 31, 2013
and
2012
we do not believe we have any significant concentrations of credit risk.
63
Inventories
Inventories, which include the costs of material, labor and overhead, are stated at the lower of cost or market using the first in, first out ("FIFO") method. Estimated losses from obsolete and slow-moving inventories are recorded to reduce inventory values to their estimated net realizable value. Our manufacturing operations recognize costs of sales using standard costs with full overhead absorption, which generally approximates actual cost.
Property, Plant and Equipment
These assets are recorded at historical cost and are depreciated using the straight-line method of depreciation over the estimated useful lives as follows:
|
|
Estimated Life
|
|
Buildings and improvements
|
5 to 40 years
|
|
Machinery and equipment
|
2 to 10 years
|
|
Furniture and fixtures
|
3 to 7 years
|
|
Equipment held for lease or rental
|
2 to 10 years
|
Leasehold improvements are depreciated over the shorter of their estimated useful life or the term of the lease. Costs related to maintenance and repairs that do not prolong the assets' useful lives are expensed as incurred.
Goodwill and Intangible Assets
Goodwill represents purchase consideration paid in a business combination that exceeds the values assigned to the net assets of acquired businesses. Intangible assets include customer relationships, proprietary technology, brands and trademarks, patents and other intangible assets. Intangible assets with a finite life are amortized on a straight-line basis over an estimated economic useful life which ranges from
5
to
40
years and is included in selling, general and administrative expense. Certain of our intangible assets, namely certain brands and trademarks, have an indefinite life and are not amortized.
Long-Lived Asset Impairment
Long-lived assets, including intangible assets with finite lives, are amortized and tested for impairment whenever events or changes in circumstances indicate their carrying value may not be recoverable. We assess the recoverability of long-lived assets based on the undiscounted future cash flow the assets are expected to generate and recognize an impairment loss when estimated undiscounted future cash flows expected to result from the use of the asset plus net proceeds expected from disposition of the asset, if any, are less than the carrying value of the asset. When an impairment is identified, we reduce the carrying amount of the asset to its estimated fair value based on a discounted cash flow approach or, when available and appropriate, to comparable market values.
Goodwill and indefinite-lived intangible assets are not amortized, but rather are tested for impairment annually (or more frequently if impairment indicators arise, such as changes to the reporting unit structure, significant adverse changes in the business climate or an adverse action or assessment by a regulator). We conduct our annual impairment testing on the first day of our fourth quarter. For goodwill, the impairment test is a two-step test. In the first step, the estimated fair value of each reporting unit is compared to the carrying value of the net assets assigned to that reporting unit. If the estimated fair value of the reporting unit exceeds its carrying value, goodwill is not impaired and the second step of the impairment test is not performed. If the carrying value of the reporting unit exceeds its estimated fair value, then the second step of the impairment test is performed in order to measure the impairment loss to be recorded, if any. If the carrying value of a reporting unit
’
s goodwill exceeds its implied fair value, then we record an impairment loss equal to the difference. We estimate the fair value of our reporting units and indefinite-lived intangible assets using an income approach. Under the income approach, we estimate fair value based on the present value of estimated future cash flows.
Product Warranties
We accrue for the estimated cost of product warranties at the time revenue is recognized and record it as a component of cost of revenue. Our product warranty liability reflects our best estimate of probable liability under the terms and conditions of our product warranties offered to customers. We estimate the liability based on our standard warranty terms, the historical frequency of claims and the cost to replace or repair our products under
64
warranty. Factors that impact our warranty liability include the number of units sold, the length of warranty term, historical and anticipated rates of warranty claims and cost per claim. We assess the adequacy of our recorded warranty liabilities quarterly and adjust amounts as necessary.
Postretirement Benefit Plans
The determination of defined benefit pension and postretirement plan obligations and their associated costs requires the use of actuarial computations to estimate participant plan benefits to which the employees will be entitled. The significant assumptions primarily relate to discount rates, expected long-term rates of return on plan assets, rate of future compensation increases, mortality, termination, and other factors. We develop each assumption using relevant company experience in conjunction with market-related data for each individual country in which such plans exist. All actuarial assumptions are reviewed annually with third-party consultants and adjusted as necessary. For the recognition of net periodic postretirement cost, the calculation of the expected long-term rate of return on plan assets is generally derived using a market-related value of plan assets based on average asset values at the measurement date over the last five years. Actual results that differ from our assumptions are accumulated and amortized on a straight line basis only to the extent they exceed 10% of the higher of the market-related value or the projected benefit obligation, over the estimated remaining service period of active participants, or for plans with all or substantially all inactive participants, over the average remaining life expectancy. The fair value of plan assets is determined based on market prices or estimated fair value at the measurement date.
We consider changes to a plan’s benefit formula that eliminate the accrual for future service but continue to allow for future salary increases (i.e. “soft freeze”) a curtailment.
Business Combinations
We allocate the purchase price of acquisitions to the tangible and intangible assets acquired, liabilities assumed, and non-controlling interests in the acquiree based on their estimated fair value at the acquisition date. Changes to the acquisition date provisional fair values prior to the expiration of the measurement period, a period not to exceed 12 months from date of acquisition, are recorded as an adjustment to the associated goodwill. Changes to the acquisition date fair values after expiration of the measurement period are recorded in earnings. The excess of the acquisition price over those estimated fair values is recorded as goodwill. Acquisition-related expenses and restructuring costs, if any, are recognized separately from the business combination and are expensed as incurred.
Derivative Financial Instruments
We record all derivatives on the balance sheet at fair value. The accounting for changes in the fair value of derivatives depends on whether we have elected to designate a derivative in a hedging relationship and apply hedge accounting and whether the hedging relationship has satisfied the criteria necessary to apply hedge accounting. Derivatives designated and qualifying as a hedge of the exposure to changes in the fair value of an asset, liability, or firm commitment attributable to a particular risk are considered fair value hedges. Derivatives designated and qualifying as a hedge of the exposure to variability in expected future cash flows, including forecasted transactions, are considered cash flow hedges. Derivatives may also be designated as hedges of the foreign currency exposure of a net investment in a foreign operation. Hedge accounting generally provides for the matching of the timing of gain or loss recognition on the hedging instrument with the recognition of the changes in the fair value of the hedged asset or liability that are attributable to the hedged risk in a fair value hedge or the earnings effect of the hedged forecasted transactions in a cash flow hedge. We may enter into derivative contracts that are intended to hedge certain risks economically, even though hedge accounting does not apply or we elect not to apply hedge accounting.
The effective portion of changes in the fair value of derivatives designated and that qualify as cash flow hedges of foreign exchange risk is recorded in other comprehensive income ("OCI") and is subsequently reclassified into either revenue or cost of revenue (hedge of sales classified into revenue and hedge of purchases classified into cost of revenue) in the period that the hedged forecasted transaction affects earnings. Any ineffective portion of the change in fair value of the derivative is recognized directly in selling, general and administrative expenses. Our policy is to de
-
designate cash flow hedges at the time forecasted transactions are recognized as assets or liabilities on a business unit
’
s balance sheet and report subsequent changes in fair value through selling, general and administrative expenses where the gain or loss due to movements in currency rates on the underlying asset or liability is revalued. If it becomes probable that the originally forecasted transaction will not occur, the gain or loss related to the hedge recorded within accumulated other comprehensive income is immediately recognized into net income.
65
Commitments and Contingencies
We record accruals for commitments and loss contingencies for those which are both probable and for which the amount can be reasonably estimated. In addition, legal fees are accrued for cases where a loss is probable and the related fees can be reasonably estimated. Significant judgment is required to determine both probability and the estimated amount of loss. We review these accruals quarterly and adjust the accruals to reflect the impact of negotiations, settlements, rulings, advice of legal counsel, and other current information.
Accruals for environmental matters are recorded on a site-by-site basis when it is probable that a liability has been incurred and the amount of the liability can be reasonably estimated, based on current law and existing technologies. Our estimated liability is reduced to reflect the anticipated participation of other potentially responsible parties in those instances where it is probable that such parties are legally responsible and financially capable of paying their respective shares of the relevant costs. These accruals are reviewed quarterly and are adjusted as assessment and remediation efforts progress or as additional technical or legal information becomes available. Actual costs to be incurred at identified sites in future periods may vary from the estimates, given inherent uncertainties in evaluating environmental exposures. Accruals for environmental liabilities are primarily included in other non-current liabilities at undiscounted amounts and exclude claims for recoveries from insurance companies or other third parties.
Concentrations of Credit Risk
Financial instruments that potentially subject us to significant concentrations of credit risk consist principally of cash and cash equivalents, and accounts receivable from trade customers. We maintain cash and cash equivalents and derivative contracts with various financial institutions. These financial institutions are located in many different geographical regions, and our policy is designed to limit exposure with any one institution. As part of our cash and risk management processes, we perform periodic evaluations of the relative credit standing of the financial institutions. We have not sustained any material credit losses during the previous three years from instruments held at financial institutions. We may utilize forward contracts to protect against the effects of foreign currency fluctuations. Such contracts involve the risk of non-performance by the counterparty. Credit risk with respect to accounts receivable is generally diversified due to the large number of entities comprising our customer base and their dispersion across many different industries and geographic regions. We perform ongoing credit evaluations of the financial condition of our third-party distributors, resellers and other customers and require collateral, such as letters of credit and bank guarantees, in certain circumstances.
Substantially all of the cash and cash equivalents, including foreign cash balances, at
December 31, 2013
and
2012
were uninsured. Foreign cash balances at
December 31, 2013
and
2012
were
$423 million
and
$401 million
, respectively.
Fair Value Measurements
We determine fair value as the price that would be received to sell an asset or paid to transfer a liability in an orderly transaction between market participants at the measurement date. We use a hierarchical structure to prioritize the inputs to valuation techniques used to measure fair value into three broad levels. The fair value hierarchy gives the highest priority to quoted prices in active markets for identical assets or liabilities (Level 1), then to quoted market prices for similar assets or liabilities in active markets (Level 2) and gives the lowest priority to unobservable inputs (Level 3).
Note 2
. Recently Issued Accounting Pronouncements
Pronouncements Not Yet Adopted
In January 2014, the Financial Accounting Standards Board (
“
FASB
”
) issued guidance related to service concession arrangements. A service concession arrangement is an arrangement between a public-sector entity grantor and an operating entity under which the operating entity operates the grantor's infrastructure (for example, airports, roads and bridges). The guidance states that service concession arrangements should not be accounted for under the guidance of Topic 840, Leases, but rather other guidance as deemed appropriate. This guidance is effective for fiscal years beginning December 15, 2014. We are currently evaluating the impact of the guidance on our financial condition and results of operations.
66
In July 2013, the FASB issued guidance on the financial statement presentation of an unrecognized tax benefit. The guidance requires that an unrecognized tax benefit or a portion of an unrecognized tax benefit, be presented as a reduction to a deferred tax asset for a net operating loss carryforward, a similar tax loss, or a tax credit carryforward. If an applicable deferred tax asset is not available or a company does not expect to use the applicable deferred tax asset, the unrecognized tax benefit should be presented in an entity's financial statements as a liability and should not be combined with a deferred tax asset. This guidance is effective for fiscal years beginning after December 15, 2013. The adoption of this guidance is not expected to have a material impact on our financial condition or results of operations.
In March 2013, the FASB issued guidance on the release of a cumulative translation adjustment ("CTA") related to an entity's investment in a foreign entity into income. The guidance requires such CTA to be released when there has been a: (1) sale of a subsidiary or group of net assets within a foreign entity and the sale represents the substantially complete liquidation of the investment in the foreign entity, (2) loss of a controlling financial interest in an investment in a foreign entity or (3) step acquisition for a foreign entity. This guidance is effective for fiscal years beginning after December 15, 2013. The impact of the guidance on our financial condition and results of operations will depend on the occurrence and the significance of transactions that meet the criteria described above.
In February 2013, the FASB issued guidance related to the measurement and disclosure of obligations resulting from joint and several liability arrangements. The new guidance requires companies to measure obligations resulting from joint and several liability arrangements as the sum of (1) the amount the company agreed to pay on the basis of its arrangement among co-obligors and (2) any additional amount the company expects to pay on behalf of its co-obligors. Additionally, the new guidance requires the disclosure of a description of the joint and several arrangement and the total outstanding amount of the obligation for all joint parties. This guidance is effective for fiscal years beginning after December 15, 2013. The adoption of this guidance is not expected to have a material impact on our financial condition or results of operations.
Recently Adopted Pronouncements
In February 2013, the FASB issued guidance regarding new disclosures for items reclassified out of accumulated other comprehensive income ("AOCI"). The guidance requires entities to present information about items reclassified out of AOCI by component. Additionally, entities are required to present either on the face of the statement where net income is presented or as a separate disclosure in the notes to the financial statements, significant amounts reclassified out of AOCI by the respective line items of net income. This guidance is effective for fiscal years beginning after December 15, 2012. The adoption of this guidance did not have a material impact on our financial statement presentation and disclosures.
In July 2012, the FASB provided companies with the option to make an initial qualitative evaluation, based on events and circumstances, to determine the likelihood of an impairment of an indefinite-lived intangible asset. The results of this qualitative assessment determine whether it is necessary to perform the currently required quantitative comparison of the indefinite-lived intangible asset
'
s fair value to its carrying amount. If it is more likely than not that the fair value of the intangible asset is less than its carrying amount, a company would be required to perform the quantitative assessment. This guidance is effective for annual and interim impairment tests performed for fiscal years beginning after September 15, 2012 with early adoption permitted. The adoption of the guidance did not have a material impact on our financial condition and results of operations.
In September 2011, in conjunction with the assessment of the impairment of goodwill, the FASB provided companies with the option to make an initial qualitative evaluation, based on the entity
’
s events and circumstances, to determine the likelihood of goodwill impairment. The results of this qualitative assessment determine whether it is necessary to perform the currently required two-step impairment test. If it is more likely than not that the fair value of a reporting unit is less than its carrying amount, a company would be required to perform the two-step impairment test. We adopted this new guidance effective January 1, 2012. The adoption of this guidance did not have a material impact on our financial condition and results of operations.
In June 2011, the FASB issued authoritative guidance surrounding the presentation of comprehensive income, with an objective of increasing the prominence of items reported in other comprehensive income (
“
OCI
”
). The guidance requires most entities to present items of net income and other comprehensive income either in one continuous statement, referred to as the statement of comprehensive income, or in two separate, but consecutive, statements of net income and other comprehensive income. We have adopted this guidance with retrospective application and have presented total comprehensive income in our Consolidated and Combined Statements of Comprehensive Income for all reported periods.
67
In May 2011, the FASB issued guidance intended to achieve common fair value measurements and related disclosures between U.S. GAAP and international accounting standards. The amendments primarily clarify existing fair value guidance and are not intended to change the application of existing fair value measurement guidance. However, the amendments include certain instances where a particular principle or requirement for measuring fair value or disclosing information about fair value measurements has changed. On January
1, 2012, we adopted this guidance. The adoption of the guidance did not have a material impact on our financial condition and results of operations.
2013 Acquisitions
During 2013, we spent
$84 million
(
$81 million
, net of cash acquired) on acquisitions. As the acquisitions were not material, individually or in the aggregate, to results of operations, pro forma results of operations reflecting results prior to the acquisitions and certain other disclosure items have not been presented.
MultiTrode
On March 1, 2013 we acquired MultiTrode Pty Ltd ("MultiTrode"), a water and wastewater technology and services company based in Australia, for approximately
$26 million
. MultiTrode offers advanced monitoring and control technologies to municipal and private water and waste water authorities as well as industrial clients. The company had approximately
60
employees and generated revenue of approximately
$13 million
in its fiscal year ended June 30, 2012.
Our consolidated financial statements include MultiTrode's results of operations prospectively from March 1, 2013 within the Water Infrastructure segment.
PIMS
On February 5, 2013 we acquired PIMS Group ("PIMS"), a wastewater services company based in the United Kingdom, for approximately
$57 million
, including a cash payment of
$55 million
and the assumption of certain liabilities. PIMS is a supplier of wastewater installation and maintenance services for the private sector, municipal and industrial markets. The company had approximately
220
employees and generated revenue of approximately
$38 million
for its fiscal year ended April 30, 2012.
Our consolidated financial statements include PIMS' results of operations prospectively from February 5, 2013 within the Water Infrastructure segment.
2012 Acquisitions
Heartland and MJK
During 2012, we spent
$41 million
, net of cash acquired, on
two
acquisitions that were not material individually or in the aggregate to our results of operations or financial position. On October 26, 2012, we acquired Heartland Pump Rental & Sales, Inc. ("Heartland"), a dewatering pump sale and rental company, for approximately
$29 million
. Heartland generated revenue of approximately
$33 million
for the fiscal year ended December 31, 2011. On July 13, 2012, we acquired MJK Automation (“MJK”) for a purchase price of approximately
$12 million
. MJK, which reported 2011 revenue of
$11 million
for the fiscal year ended June 30, 2012, is a leading manufacturer of flow and level sensors, and measurement and control technology for water and wastewater applications. Our financial statements include Heartland and MJK results of operations prospectively from October 26, 2012 and July 13, 2012, respectively, within the Water Infrastructure segment. As the acquisitions were not material to results of operations, pro forma results of operations reflecting results prior to the acquisitions and certain other disclosure items have not been presented.
68
2011 Acquisitions
YSI
On September 1, 2011, we acquired 100% of the outstanding shares of YSI Incorporated (“YSI”) for a purchase price of
$309 million
, net of cash acquired. YSI, which reported 2010 revenue of
$101 million
, is a leading developer and manufacturer of sensors, instruments, software, and data collection platforms for environmental water monitoring. YSI employs
390
people at facilities in the United States, Europe and Asia. Our financial statements include YSI’s results of operations prospectively from September 1, 2011 within the Water Infrastructure segment; however, the acquisition was not material to results of operations and accordingly, pro forma results of operations reflecting YSI’s results prior to acquisition have not been presented.
The purchase price for YSI was allocated to the net tangible and intangible assets acquired and liabilities assumed based on their fair values as of September 1, 2011. The excess of the purchase price over the assets acquired and liabilities assumed was recorded as goodwill. A charge in the amount of
$3 million
is included in selling, general and administrative expense related to acquisition-related costs.
The following table presents the allocation of the purchase price to the assets acquired and liabilities assumed, based on their fair values (in millions):
|
Purchase Price
|
|
$
|
309
|
|
||
|
Assets acquired and liabilities assumed:
|
||||||
|
Accounts receivable
|
15
|
|
||||
|
Inventory
|
15
|
|
||||
|
Property, plant and equipment
|
9
|
|
||||
|
Goodwill
|
190
|
|
||||
|
Intangible assets
|
125
|
|
||||
|
Other current and non-current assets
|
17
|
|
||||
|
Other current and non-current liabilities
|
(62
|
)
|
|
|||
|
Net assets acquired
|
|
$
|
309
|
|
||
Goodwill of
$190 million
arising from the acquisition consists largely of the planned expansion of YSI to new geographic markets, synergies and economies of scale. The goodwill related to this acquisition has been assigned to our Water Infrastructure segment and is not expected to be deductible for income tax purposes. In addition, of the
$125 million
that was allocated to intangible assets,
$41 million
was assigned to customer relationships and will be amortized on a straight line basis over the estimated useful life of
16
years;
$35 million
was assigned to proprietary technology and will be amortized on a straight line basis over the weighted average useful life of
16
years; and the remaining
$49 million
of acquired intangible assets was assigned to trademarks, which is not subject to amortization as they were determined to have indefinite useful lives.
69
From time to time, the Company will incur costs related to restructuring actions in order to optimize our cost base and more strategically position ourselves based on the economic environment and customer demand. During
2013
, the costs incurred primarily relate to the reduction in structural costs, including the elimination of headcount and consolidation of facilities within both our Water Infrastructure and Applied Water segments. The components of restructuring and asset impairment charges incurred during each of the previous three years ended are presented below.
|
Year Ended December 31,
|
||||||||||||
|
(in millions)
|
2013
|
2012
|
2011
|
|||||||||
|
By component:
|
||||||||||||
|
Severance and other charges
|
$
|
38
|
|
$
|
17
|
|
$
|
—
|
|
|||
|
Lease related charges
|
2
|
|
—
|
|
—
|
|
||||||
|
Total restructuring charges
|
40
|
|
17
|
|
—
|
|
||||||
|
Asset impairment
|
2
|
|
—
|
|
2
|
|
||||||
|
Total restructuring and asset impairment charges
|
$
|
42
|
|
$
|
17
|
|
$
|
2
|
|
|||
|
By segment:
|
||||||||||||
|
Water Infrastructure
|
$
|
33
|
|
$
|
14
|
|
$
|
—
|
|
|||
|
Applied Water
|
9
|
|
3
|
|
2
|
|
||||||
Restructuring
The following table displays a rollforward of the restructuring accruals, presented on our Consolidated Balance Sheet within accrued liabilities, for the years ended
December 31, 2013
and
2012
.
|
(in millions)
|
2013
|
2012
|
||||||
|
Restructuring accruals - January 1
|
$
|
9
|
|
$
|
1
|
|
||
|
Restructuring charges
|
40
|
|
17
|
|
||||
|
Cash payments
|
(35
|
)
|
(9
|
)
|
||||
|
Other
|
(1
|
)
|
—
|
|
||||
|
Restructuring accruals - December 31
|
$
|
13
|
|
$
|
9
|
|
||
|
By segment:
|
||||||||
|
Water Infrastructure
|
$
|
10
|
|
$
|
6
|
|
||
|
Applied Water
|
3
|
|
3
|
|
||||
The following is a rollforward of employee position eliminations associated with restructuring activities for the years ended
December 31, 2013
and
2012
.
|
2013
|
2012
|
|||||
|
Planned reductions - January 1
|
54
|
|
—
|
|
||
|
Additional planned reductions
|
513
|
|
189
|
|
||
|
Actual reductions
|
(516
|
)
|
(135
|
)
|
||
|
Planned reductions - December 31
|
51
|
|
54
|
|
||
Total expected costs of approximately
$33 million
for Water Infrastructure associated with actions that commenced during 2013 include
$31 million
incurred in 2013 and
$2 million
remaining to be incurred during 2014. Total
70
expected costs of approximately
$10 million
for Applied Water include
$8 million
incurred in 2013 and
$2 million
remaining to be incurred during 2014. These costs primarily comprise severance charges. We currently expect these actions to continue through the end of 2014.
Asset Impairment Charges
During the fourth quarter of 2013 we performed our annual impairment test of our indefinite-lived intangibles assets which resulted in an impairment charge of
$2 million
related to trade names within our Water Infrastructure segment. Refer to
Note 11
, “Goodwill and Other Intangible Assets,” for additional information.
We had non-recurring separation costs of
$4 million
and
$22 million
, or
$2 million
and
$16 million
after tax during
2013
and
2012
, respectively. The components of separation costs incurred during these periods are presented below.
|
Year Ended December 31,
|
|||||||
|
(in millions)
|
2013
|
2012
|
|||||
|
Rebranding and marketing costs
|
$
|
—
|
|
$
|
8
|
|
|
|
Advisory and professional fees
|
—
|
|
7
|
|
|||
|
Information and technology costs
|
2
|
|
3
|
|
|||
|
Employee retention and hiring costs
|
—
|
|
1
|
|
|||
|
Lease termination and other real estate costs
|
2
|
|
1
|
|
|||
|
Other
|
—
|
|
2
|
|
|||
|
Total separation costs in operating income
|
4
|
|
22
|
|
|||
|
Income tax benefit
|
(2
|
)
|
(6
|
)
|
|||
|
Total separation costs, net of tax
|
$
|
2
|
|
$
|
16
|
|
|
The components of other non-operating (expense) income, net are as follows:
|
Year Ended December 31,
|
|||||||||||
|
(in millions)
|
2013
|
2012
|
2011
|
||||||||
|
Interest income
|
$
|
3
|
|
$
|
4
|
|
$
|
3
|
|
||
|
Income from joint ventures
|
2
|
|
4
|
|
4
|
|
|||||
|
Other expense – net (a)
|
(15
|
)
|
(8
|
)
|
(2
|
)
|
|||||
|
Total other non-operating (expense) income, net
|
$
|
(10
|
)
|
$
|
—
|
|
$
|
5
|
|
||
|
(a)
|
2013 includes
$10 million
of expense incurred under the tax matters agreement with ITT. Refer to Note 7 "Income Taxes" for additional information regarding the tax matters agreement.
|
Prior to the Spin-off, Xylem was a member of ITT’s consolidated federal and state tax returns, and therefore current and deferred tax expense has been computed for the Company on a separate return basis. Subsequent to the Spin-off, the Company files its own consolidated federal and state tax returns.
71
The source of pre-tax income and the components of income tax expense are as follows:
|
Year Ended December 31,
|
|||||||||||
|
(in millions)
|
2013
|
2012
|
2011
|
||||||||
|
Income components:
|
|||||||||||
|
Domestic
|
$
|
49
|
|
$
|
106
|
|
$
|
46
|
|
||
|
Foreign
|
249
|
|
282
|
|
337
|
|
|||||
|
Total pre-tax income
|
$
|
298
|
|
$
|
388
|
|
$
|
383
|
|
||
|
Income tax expense components:
|
|||||||||||
|
Current:
|
|||||||||||
|
Domestic – federal
|
$
|
37
|
|
$
|
27
|
|
$
|
20
|
|
||
|
Domestic – state and local
|
1
|
|
7
|
|
5
|
|
|||||
|
Foreign
|
46
|
|
56
|
|
71
|
|
|||||
|
Total Current
|
84
|
|
90
|
|
96
|
|
|||||
|
Deferred:
|
|||||||||||
|
Domestic – federal
|
$
|
(6
|
)
|
$
|
10
|
|
$
|
21
|
|
||
|
Domestic – state and local
|
—
|
|
(2
|
)
|
3
|
|
|||||
|
Foreign
|
(8
|
)
|
(7
|
)
|
(16
|
)
|
|||||
|
Total Deferred
|
(14
|
)
|
1
|
|
8
|
|
|||||
|
Total income tax provision
|
$
|
70
|
|
$
|
91
|
|
$
|
104
|
|
||
|
Effective income tax rate
|
23.5
|
%
|
23.4
|
%
|
27.4
|
%
|
|||||
Reconciliations between taxes at the U.S. federal income tax rate and taxes at our effective income tax rate on earnings before income taxes are as follows:
|
Year Ended December 31,
|
||||||||
|
2013
|
2012
|
2011
|
||||||
|
Tax provision at U.S. statutory rate
|
35.0
|
%
|
35.0
|
%
|
35.0
|
%
|
||
|
Increase (decrease) in tax rate resulting from:
|
||||||||
|
Foreign restructurings
|
—
|
|
—
|
|
1.5
|
|
||
|
State income taxes
|
0.7
|
|
1.2
|
|
1.3
|
|
||
|
Settlements of tax examinations
|
—
|
|
0.2
|
|
(4.7
|
)
|
||
|
Valuation allowance
|
39.4
|
|
8.9
|
|
4.7
|
|
||
|
Tax exempt interest
|
(43.0
|
)
|
(18.2
|
)
|
(14.6
|
)
|
||
|
Foreign tax rate differential
|
(4.1
|
)
|
(3.4
|
)
|
(4.6
|
)
|
||
|
Repatriation of foreign earnings, net of foreign tax credits
|
5.1
|
|
0.4
|
|
3.7
|
|
||
|
Non-deductible separation costs
|
—
|
|
—
|
|
2.6
|
|
||
|
Tax incentives
|
(8.1
|
)
|
—
|
|
—
|
|
||
|
Other – net
|
(1.5
|
)
|
(0.7
|
)
|
2.5
|
|
||
|
Effective income tax rate
|
23.5
|
%
|
23.4
|
%
|
27.4
|
%
|
||
We operate under tax incentives, which are effective January 2013 through December 2023 and may be extended if certain additional requirements are satisfied. The tax incentives are conditional upon our meeting certain employment thresholds. The impact of these tax incentives decreased our tax provision by
8.1%
in 2013.
Deferred tax assets and liabilities are determined based on temporary differences between the financial reporting and tax bases of assets and liabilities, applying enacted tax rates in effect for the year in which we expect the differences will reverse.
72
The following is a summary of the components of the net deferred tax assets and liabilities recognized in the Consolidated Balance Sheets:
|
December 31,
|
|||||||
|
(in millions)
|
2013
|
2012
|
|||||
|
Deferred tax assets:
|
|||||||
|
Employee benefits
|
$
|
114
|
|
$
|
130
|
|
|
|
Accrued expenses
|
20
|
|
17
|
|
|||
|
Loss carryforward
|
357
|
|
237
|
|
|||
|
Inventory
|
6
|
|
7
|
|
|||
|
Foreign tax credit carryforwards
|
17
|
|
18
|
|
|||
|
Other
|
1
|
|
3
|
|
|||
|
$
|
515
|
|
$
|
412
|
|
||
|
Valuation allowance
|
(349
|
)
|
(229
|
)
|
|||
|
Net deferred tax asset
|
$
|
166
|
|
$
|
183
|
|
|
|
Deferred tax liabilities:
|
|||||||
|
Intangibles
|
$
|
180
|
|
$
|
174
|
|
|
|
Investment in foreign subsidiaries
|
15
|
|
15
|
|
|||
|
Property, plant, and equipment
|
19
|
|
15
|
|
|||
|
Other
|
42
|
|
34
|
|
|||
|
Total deferred tax liabilities
|
$
|
256
|
|
$
|
238
|
|
|
Management assesses the available positive and negative evidence to estimate if sufficient future taxable income will be generated to realize existing deferred tax assets. On the basis of this evaluation, as of
December 31, 2013
, a valuation allowance of
$349 million
has been established to reduce the deferred income tax asset related to certain U.S. and foreign net operating losses and U.S. and foreign capital loss carryforwards. During
2013
, the valuation allowance increased by
$120 million
primarily driven by losses from certain foreign operations.
Deferred taxes are classified in the Consolidated Balance Sheets as follows:
|
December 31,
|
|||||||
|
(in millions)
|
2013
|
2012
|
|||||
|
Current assets
|
$
|
41
|
|
$
|
41
|
|
|
|
Non-current assets
|
64
|
|
77
|
|
|||
|
Current liabilities
|
(4
|
)
|
—
|
|
|||
|
Non-current liabilities
|
(191
|
)
|
(173
|
)
|
|||
|
Total net deferred tax liabilities
|
$
|
(90
|
)
|
$
|
(55
|
)
|
|
Tax attributes available to reduce future taxable income begin to expire as follows:
|
(in millions)
|
December 31, 2013
|
First Year of Expiration
|
|||
|
U.S. net operating loss
|
$
|
10
|
|
December 31, 2023
|
|
|
State net operating loss
|
48
|
|
December 31, 2014
|
||
|
U.S. tax credits
|
31
|
|
December 31, 2020
|
||
|
Foreign net operating loss
|
1,214
|
|
December 31, 2014
|
||
The foreign tax credit for financial statement purposes differs from the amount for tax return purposes due to unrecognized tax benefits.
As of
December 31, 2013
, we have provided a deferred tax liability of
$16 million
on the excess of
$84 million
of financial reporting over the tax basis of investments in certain foreign subsidiaries that has not been indefinitely reinvested. However, we have not provided for deferred taxes on the excess of financial reporting over the tax basis of investments in certain foreign subsidiaries in the amount of
$1.9 billion
because we plan to reinvest such
73
amounts indefinitely outside the U.S. The determination of the amount of federal and state income taxes is not practicable because of complexities of the hypothetical calculation.
Unrecognized Tax Benefits
We recognize tax benefits from uncertain tax positions only if it is more likely than not that the tax position will be sustained on examination by the taxing authorities, based on the technical merits of the position. The tax benefits recognized in the consolidated financial statements from such positions are measured based on the largest benefit that has a greater than
50%
likelihood of being realized upon ultimate settlement. A reconciliation of the beginning and ending amount of unrecognized tax benefits is as follows:
|
(in millions)
|
2013
|
2012
|
2011
|
||||||||
|
Unrecognized tax benefits — January 1
|
$
|
8
|
|
$
|
5
|
|
$
|
43
|
|
||
|
Additions for:
|
|||||||||||
|
Current year tax positions
|
23
|
|
1
|
|
—
|
|
|||||
|
Prior year tax positions
|
—
|
|
2
|
|
—
|
|
|||||
|
Reductions for:
|
|||||||||||
|
Assumption by ITT
|
—
|
|
—
|
|
(24
|
)
|
|||||
|
Settlements
|
(1
|
)
|
—
|
|
(14
|
)
|
|||||
|
Unrecognized tax benefits — December 31
|
$
|
30
|
|
$
|
8
|
|
$
|
5
|
|
||
The amount of unrecognized tax benefits at
December 31, 2013
, was
$30 million
which, if ultimately recognized, will reduce our annual effective tax rate. We do not believe that the unrecognized tax benefits will significantly change within the next twelve months.
In many cases, unrecognized tax benefits are related to tax years that remain subject to examination by the relevant taxing authorities. By virtue of previously filed separate company and consolidated tax returns with ITT, we are routinely under audit by federal, state, local and foreign taxing authorities. These audits include questioning the timing and the amount of deductions and the allocation of income among various tax jurisdictions. Income taxes payable include amounts considered sufficient to pay assessments that may result from examination of prior year returns; however, the amount paid upon resolution of issues raised may differ from the amount provided. Differences between the reserves for tax contingencies and the amounts owed by the company are recorded in the period they become known. Under the Tax Matters Agreement, as discussed below, ITT assumes all consolidated tax liabilities and related interest and penalties for the pre-spin period. The following table summarizes the earliest open tax years by major jurisdiction:
|
Jurisdiction
|
Earliest
Open Year
|
|
|
Canada
|
2008
|
|
|
Germany
|
2005
|
|
|
Italy
|
2008
|
|
|
Luxembourg
|
2010
|
|
|
Poland
|
2006
|
|
|
Sweden
|
2008
|
|
|
Switzerland
|
2013
|
|
|
United Kingdom
|
2006
|
|
|
United States
|
2009
|
|
We classify interest relating to unrecognized tax benefits as a component of other non-operating (expense) income, net and tax penalties as a component of income tax expense in our Consolidated and Combined Income Statements. The amount of interest relating to unrecognized tax benefits as of December 31,
2013
was
$1 million
.
Tax Matters Agreement
In connection with the Spin-off, Xylem, ITT and Exelis entered into a Tax Matters Agreement. Under the agreement, we may be obligated to make payments to ITT and Exelis under certain conditions. These conditions include a
74
payment to ITT in the event audit settlement payments exceed amounts specified in the agreement. We also may be obligated to make payments in the event the Spin-off is determined to be taxable.
The Tax Matters Agreement governs the respective rights, responsibilities and obligations of ITT, Xylem and the other Spincos (members of the ITT group that were spun-off, including Xylem are collectively referred to as “Spincos”) with respect to taxes for periods ending on or before the Spin-off. In general, pursuant to the Tax Matters Agreement, ITT will prepare and file the tax returns that include ITT (or any of its subsidiaries) and Xylem (or any of its subsidiaries) for all taxable periods ending on or prior to, and including, October 31, 2011, with the appropriate tax authorities, and, except as otherwise set forth below, ITT will pay any taxes relating thereto to the relevant tax authority. In connection with any audit adjustments with respect to such returns, we have agreed to indemnify ITT for a portion of such tax liability to the extent it exceeds an agreed-upon threshold.
We will file all tax returns that include solely Xylem and/or its subsidiaries and any separate company tax returns for Xylem and/or its subsidiaries for all taxable periods ending on or prior to, and including, October 31, 2011, and will pay all taxes due with respect to such tax returns (including any taxes attributable to an audit adjustment with respect to such returns). In general, ITT controls all audits and administrative matters and other tax proceedings relating to the consolidated U.S. federal income tax return of the ITT group and any other tax returns for which the ITT group is responsible.
Under the Tax Matters Agreement, we have agreed not to enter into any transaction involving an acquisition (including issuance) of Xylem common stock or any other transaction (or, to the extent we have the right to prohibit it, to permit any such transaction) that could cause the Spin-off to be taxable to ITT. We have also agreed to indemnify ITT for any tax resulting from any such transactions. Generally, ITT will recognize taxable gain on the Spin-off if there are one or more acquisitions (including issuances) of our capital stock, directly or indirectly, representing 50% or more, measured by vote or value, of our then-outstanding capital stock, and the acquisitions or issuances are deemed to be part of a plan or series of related transactions that include the Spin-off. Any such shares of our common stock acquired, directly or indirectly, within two years before or after the Spin-off (with exceptions, including public trading by less-than-5% shareholders and certain compensatory stock issuances) will generally be presumed to be part of such a plan unless that presumption is rebutted. As a result, our obligations may discourage, delay or prevent a change of control of our company.
Notwithstanding the receipt of any such IRS ruling, tax opinion or officer’s certificate, generally Xylem and each other Spinco must indemnify ITT and each other Spinco for any taxes and related losses resulting from (i) any act or failure to act by such Spinco described in the covenants above, (ii) any acquisition of equity securities or assets of such Spinco or any member of its group, and (iii) any breach by such Spinco or any member of its group of any representation or covenant contained in the separation documents or the documents relating to the IRS private letter ruling or tax opinion concerning the Spin-off of such Spinco.
Under U.S. federal income tax law, ITT and the Spincos are severally liable for all of ITT’s federal income taxes attributable to periods prior to and including the year of the spin, which ended on December 31, 2011.
Thus, if ITT failed to pay the U.S. federal income taxes attributable to it under the Tax Matters Agreement for periods prior to and including the current taxable year of ITT, the Spincos would be severally liable for such taxes. In the event a Spinco is required to make a payment in respect of a Spin-off related tax liability of the ITT consolidated U.S. federal income tax return group under these rules for which such Spinco is not responsible under the Tax Matters Agreement and full indemnification cannot be obtained from the Spinco responsible for such payment under the Tax Matters Agreement, ITT will indemnify the Spinco that was required to make the payment from and against the portion of such liability for which full indemnification cannot be obtained from the Spinco responsible for such payment under the Tax Matters Agreement.
The Tax Matters Agreement also contains provisions regarding the apportionment of tax attributes of the ITT consolidated U.S. federal income tax return group, authority to make tax elections, cooperation, and other customary matters.
As of December 31,
2013
, the net amount Xylem owed ITT pursuant to the Tax Matters Agreement is
$4 million
.
75
The following is a reconciliation of the shares used in calculating basic and diluted net earnings per share.
|
Year Ended December 31,
|
|||||||||||
|
2013
|
2012
|
2011
|
|||||||||
|
Net Income (in millions)
|
$
|
228
|
|
$
|
297
|
|
$
|
279
|
|
||
|
Shares (in thousands):
|
|||||||||||
|
Weighted average common shares outstanding
|
185,082
|
|
185,459
|
|
184,574
|
|
|||||
|
Add: Participating securities (a)
|
134
|
|
325
|
|
485
|
|
|||||
|
Weighted average common shares outstanding — Basic
|
185,216
|
|
185,784
|
|
185,059
|
|
|||||
|
Plus incremental shares from assumed conversions: (b)
|
|||||||||||
|
Dilutive effect of stock options
|
264
|
|
213
|
|
202
|
|
|||||
|
Dilutive effect of restricted stock
|
558
|
|
233
|
|
63
|
|
|||||
|
Weighted average common shares outstanding — Diluted
|
186,038
|
|
186,230
|
|
185,324
|
|
|||||
|
Basic earnings per share
|
$
|
1.23
|
|
$
|
1.60
|
|
$
|
1.51
|
|
||
|
Diluted earnings per share
|
$
|
1.22
|
|
$
|
1.59
|
|
$
|
1.50
|
|
||
|
(a)
|
Restricted stock awards containing rights to non-forfeitable dividends which participate in undistributed earnings with common shareholders are considered participating securities for purposes of computing earnings per share.
|
|
(b)
|
Incremental shares from stock options, restricted stock and performance share units are computed by the treasury stock method. The weighted average shares listed below were not included in the computation of diluted earnings per share because to do so would have been anti-dilutive for the periods presented or were otherwise excluded under the treasury stock method. The treasury stock method calculates dilution assuming the exercise of all in-the-money options and vesting of restricted stock and performance share awards, reduced by the repurchase of shares with the proceeds from the assumed exercises, unrecognized compensation expense for outstanding awards and the estimated tax benefit of the assumed exercises. Performance share units will be included in the treasury stock calculation of diluted earnings per share upon achievement of underlying performance conditions. See
Note 16
, "Stock-Based Compensation Plans" for further detail on the performance share units.
|
|
Year Ended December 31,
|
||||||||
|
(in thousands)
|
2013
|
2012
|
2011
|
|||||
|
Stock options
|
4,126
|
|
4,285
|
|
4,445
|
|
||
|
Restricted shares
|
703
|
|
870
|
|
788
|
|
||
|
Performance shares
|
80
|
|
—
|
|
—
|
|
||
|
December 31,
|
|||||||
|
(in millions)
|
2013
|
2012
|
|||||
|
Finished goods
|
$
|
189
|
|
$
|
182
|
|
|
|
Work in process
|
31
|
|
30
|
|
|||
|
Raw materials
|
255
|
|
231
|
|
|||
|
Total inventories, net
|
$
|
475
|
|
$
|
443
|
|
|
76
|
December 31,
|
|||||||
|
(in millions)
|
2013
|
2012
|
|||||
|
Land, buildings and improvements
|
$
|
263
|
|
$
|
255
|
|
|
|
Machinery and equipment
|
685
|
|
653
|
|
|||
|
Equipment held for lease or rental
|
192
|
|
183
|
|
|||
|
Furniture and fixtures
|
93
|
|
90
|
|
|||
|
Construction work in progress
|
49
|
|
40
|
|
|||
|
Other
|
22
|
|
19
|
|
|||
|
Total property, plant and equipment, gross
|
1,304
|
|
1,240
|
|
|||
|
Less accumulated depreciation
|
816
|
|
753
|
|
|||
|
Total property, plant and equipment, net
|
$
|
488
|
|
$
|
487
|
|
|
Depreciation expense was
$99 million
,
$94 million
, and
$93 million
for
2013
,
2012
, and
2011
, respectively.
Note 11
. Goodwill and Other Intangible Assets
Changes in the carrying value of goodwill by operating segment during the years ended
December 31, 2013
and
2012
are as follows:
|
(in millions)
|
Water
Infrastructure |
Applied Water
|
Total
|
||||||||
|
Balance as of December 31, 2011
|
$
|
1,054
|
|
$
|
556
|
|
$
|
1,610
|
|
||
|
Activity in 2012
|
|||||||||||
|
Acquisitions
|
19
|
|
—
|
|
19
|
|
|||||
|
Foreign currency and other
|
12
|
|
6
|
|
18
|
|
|||||
|
Balance as of December 31, 2012
|
$
|
1,085
|
|
$
|
562
|
|
$
|
1,647
|
|
||
|
Activity in 2013
|
|||||||||||
|
Acquisitions
|
48
|
|
—
|
|
48
|
|
|||||
|
Foreign currency and other
|
16
|
|
7
|
|
23
|
|
|||||
|
Balance as of December 31, 2013
|
$
|
1,149
|
|
$
|
569
|
|
$
|
1,718
|
|
||
During the fourth quarter of 2013 we performed our annual impairment assessment and determined that that the estimated fair values of our goodwill reporting units were substantially in excess of each of their carrying values with the exception of our Analytics business within our Water Infrastructure segment. While the fair value of the Analytics business initially increased over the first couple of years after acquisition, challenging economic conditions, including reduced government spending in the U.S. and sluggish growth in European markets, have led to a reduction in fair value during the past two years. Our 2013 impairment analysis indicated that the fair value of the Analytics reporting unit exceeded its carrying value by approximately
18%
. The goodwill associated with the Analytics business was
$439 million
at December 31, 2013. However, future goodwill impairment tests could result in a charge to earnings. We will continue to evaluate goodwill on an annual basis as of the beginning of our fourth quarter and whenever events and changes in circumstances indicate there may be a potential impairment.
77
Other Intangible Assets
Information regarding our other intangible assets is as follows:
|
(in millions)
|
December 31, 2013
|
December 31, 2012
|
|||||||||||||||||||||
|
|
Carrying
Amount
|
Accumulated
Amortization
|
Net
Intangibles
|
Carrying
Amount
|
Accumulated
Amortization
|
Net
Intangibles
|
|||||||||||||||||
|
Customer and distributor relationships
|
$
|
352
|
|
$
|
(104
|
)
|
$
|
248
|
|
$
|
317
|
|
$
|
(75
|
)
|
$
|
242
|
|
|||||
|
Proprietary technology
|
109
|
|
(36
|
)
|
73
|
|
105
|
|
(29
|
)
|
76
|
|
|||||||||||
|
Trademarks
|
35
|
|
(16
|
)
|
19
|
|
33
|
|
(14
|
)
|
19
|
|
|||||||||||
|
Patents and other
|
20
|
|
(17
|
)
|
3
|
|
21
|
|
(17
|
)
|
4
|
|
|||||||||||
|
Indefinite-lived intangibles
|
145
|
|
—
|
|
145
|
|
143
|
|
—
|
|
143
|
|
|||||||||||
|
Other intangibles
|
$
|
661
|
|
$
|
(173
|
)
|
$
|
488
|
|
$
|
619
|
|
$
|
(135
|
)
|
$
|
484
|
|
|||||
Based on the results of our annual impairment tests, we recorded a
$2 million
impairment charge related to three trade names within our Water Infrastructure segment in the fourth quarter of 2013. The charge was calculated using an income approach, which is considered a Level 3 input for fair value measurement, and is reflected in “Restructuring and asset impairment charges” in our Consolidated and Combined Income Statements. The trade names, related to acquired businesses within our Analytics operating unit, were classified as indefinite-lived assets at time of acquisition as there was not a plan at that time to phase out the trade names. As a result of the decline in value, we have decided to phase out two of the trade names over a period of time and thus they are no longer classified as indefinite-lived assets. We determined that
no
impairment of the indefinite-lived intangibles existed as of the measurement date in
2012
. Future impairment tests could result in a charge to earnings. We will continue to evaluate the indefinite-lived intangible assets on an annual basis as of the beginning of our fourth quarter and whenever events and changes in circumstances indicate there may be a potential impairment.
Customer and distributor relationships, proprietary technology, trademarks, patents and other are amortized over weighted average lives of approximately
14
years,
18
years,
16
years and
10
years, respectively.
Total amortization expense for intangible assets was
$38 million
,
$34 million
, and
$31 million
for
2013
,
2012
and
2011
, respectively.
Estimated amortization expense for each of the five succeeding years is as follows:
|
(in millions)
|
|||
|
2014
|
$
|
36
|
|
|
2015
|
35
|
|
|
|
2016
|
35
|
|
|
|
2017
|
34
|
|
|
|
2018
|
34
|
|
|
Risk Management Objective of Using Derivatives
We are exposed to certain risks arising from both our business operations and economic conditions and principally manage our exposures to these risks through management of our core business activities. Certain of our foreign operations expose us to fluctuations of foreign interest rates and exchange rates that may impact revenue, expenses, cash receipts and payments. We enter into derivative financial instruments to protect the value or fix the amount of certain cash flows in terms of the functional currency of the business unit with that exposure.
78
Cash Flow Hedges of Foreign Exchange Risk
We are exposed to fluctuations in various foreign currencies against our functional currencies. We use foreign currency derivatives, including currency forward agreements, to manage our exposure to fluctuations in the various exchange rates. Currency forward agreements involve fixing the foreign currency exchange rate for delivery of a specified amount of foreign currency on a specified date.
Beginning in 2012, certain business units within our segments with exposure to foreign currency exchange risks have designated certain currency forward agreements as cash flow hedges of forecasted intercompany inventory purchases and sales. Listed in the table below are the outstanding foreign currency derivatives that were used to hedge foreign exchange risks as of
December 31, 2013
.
|
(in millions; except number of instruments)
|
|
|
|||||||||||
|
Foreign Currency Derivative
|
Number of
Instruments
|
Notional
Sold
|
Sell Notional Currency
|
Notional
Purchased
|
Buy Notional
Currency
|
||||||||
|
Buy PLN/ Sell EUR forward
|
22
|
|
24
|
|
Euro (EUR)
|
103
|
|
Polish Zloty
(PLN) |
|||||
|
Buy HUF/ Sell EUR forward
|
11
|
|
11
|
|
Euro (EUR)
|
3,186
|
|
Hungarian
Forint (HUF) |
|||||
|
Buy SEK/ Sell EUR forward
|
11
|
|
137
|
|
Euro (EUR)
|
1,233
|
|
Swedish Krona (SEK)
|
|||||
|
Sell GBP/ Buy EUR forward
|
11
|
|
22
|
|
British Pound Sterling (GBP)
|
27
|
|
Euro (EUR)
|
|||||
The table below presents the effect of our derivative financial instruments on the Consolidated and Combined Income Statements and Statements of Comprehensive Income.
|
|
Year Ended December 31,
|
|||||||||||
|
(in millions)
|
2013
|
2012
|
2011
|
|||||||||
|
Derivatives in Cash Flow Hedges
|
||||||||||||
|
Foreign Exchange Contracts
|
||||||||||||
|
Amount of gain recognized in OCI (a)
|
$
|
1
|
|
$
|
4
|
|
$
|
—
|
|
|||
|
Amount of (gain) reclassified from OCI into revenue (a)
|
(2
|
)
|
(2
|
)
|
—
|
|
||||||
|
Amount of loss (gain) reclassified from OCI into cost of revenue (a)
|
2
|
|
(1
|
)
|
—
|
|
||||||
|
(a)
|
Effective portion
|
As of
December 31, 2013
,
$2 million
of the net unrealized gains on cash flow hedges is expected to be reclassified into earnings in the next 12 months. Any ineffective portion of the change in fair value of a cash flow hedge is recognized immediately in selling, general and administrative expenses in the Consolidated and Combined Income Statements and, for the
twelve months ended December 31, 2013
and
2012
was not material.
The fair values of our foreign exchange contracts currently included in our hedging program were as follows:
|
December 31,
|
|||||||
|
(in millions)
|
2013
|
2012
|
|||||
|
Derivatives designated as hedging instruments
|
|||||||
|
Assets
|
|||||||
|
Other current assets
|
$
|
1
|
|
$
|
—
|
|
|
79
|
December 31,
|
|||||||
|
(in millions)
|
2013
|
2012
|
|||||
|
Compensation and other employee-benefits
|
$
|
215
|
|
$
|
201
|
|
|
|
Customer-related liabilities
|
63
|
|
60
|
|
|||
|
Accrued warranty costs
|
36
|
|
40
|
|
|||
|
Accrued income taxes
|
45
|
|
50
|
|
|||
|
Other accrued liabilities
|
120
|
|
92
|
|
|||
|
Total accrued and other current liabilities
|
$
|
479
|
|
$
|
443
|
|
|
Note 14
. Credit Facilities and Long-Term Debt
Total debt outstanding is summarized as follows:
|
December 31,
|
|||||||
|
(in millions)
|
2013
|
2012
|
|||||
|
Short-term borrowings and current maturities of long-term debt
|
$
|
42
|
|
$
|
6
|
|
|
|
Long-term debt:
|
|||||||
|
3.550% Senior Notes due 2016 (a)
|
600
|
|
600
|
|
|||
|
4.875% Senior Notes due 2021 (a)
|
600
|
|
600
|
|
|||
|
Unamortized discount (b)
|
(1
|
)
|
(1
|
)
|
|||
|
Long-term debt
|
1,199
|
|
1,199
|
|
|||
|
Total debt (c)
|
$
|
1,241
|
|
$
|
1,205
|
|
|
|
(a)
|
The fair value of our Senior Notes (as defined below) was determined using quoted prices in active markets for identical securities, which are considered Level 1 inputs. The fair value of our Senior Notes due 2016 (as defined below) was
$635 million
and
$639 million
as of
December 31, 2013
and
2012
, respectively. The fair value of our Senior Notes due 2021 (as defined below) was
$629 million
and
$680 million
as of
December 31, 2013
and
2012
, respectively.
|
|
(b)
|
The unamortized discount is recognized as a reduction in the carrying value of the Senior Notes in the Consolidated Balance Sheets and is being amortized to interest expense in our Consolidated and Combined Income Statements over the expected remaining terms of the Senior Notes.
|
Deferred Financing Costs
We had deferred financing costs of
$7 million
and
$9 million
as of
December 31, 2013
and
December 31, 2012
, respectively, related to our revolving credit facility and Senior Notes. Scheduled amortization for future years, assuming no further prepayments of principal, is
$2 million
in
2014
,
$2 million
in
2015
,
$1 million
in
2016
, less than
$1 million
in
2017
, less than
$1 million
in
2018
and
$1 million
thereafter.
Senior Notes
On September 20, 2011, we issued
3.550%
Senior Notes of
$600 million
aggregate principal amount due September 2016 (the "Senior Notes due 2016") and
4.875%
Senior Notes of
$600 million
aggregate principal amount due October 2021 (the "Senior Notes due 2021" and together with the Senior Notes due 2016, the “Senior Notes”).
The Senior Notes include covenants which restrict our ability, subject to exceptions, to incur debt secured by liens and engage in sale and lease-back transactions, as well as provide for customary events of default (subject, in certain cases, to receipt of notice of default and/or customary grace and cure periods). We may redeem the Senior Notes, as applicable, in whole or in part, at any time at a redemption price equal to the principal amount of the Senior Notes to be redeemed, plus a make-whole premium. As of
December 31, 2013
, we were in compliance with all covenants. If a change of control triggering event (as defined in the Senior Notes indenture) occurs, we will be
80
required to make an offer to purchase the Senior Notes at a price equal to
101%
of their principal amount plus accrued and unpaid interest to the date of repurchase.
Interest on the Senior Notes due 2016 is payable on March 20 and September 20 of each year. Interest on the Senior Notes due 2021 is payable on April 1 and October 1 of each year.
Four Year Competitive Advance and Revolving Credit Facility
Effective October 31, 2011, Xylem and its subsidiaries entered into a Four Year Competitive Advance and Revolving Credit Facility (the "Credit Facility") with JPMorgan Chase Bank, N.A., as administrative agent, and a syndicate of lenders. The Credit Facility provides for an aggregate principal amount of up to
$600 million
of (i) a competitive advance borrowing option which will be provided on an uncommitted competitive advance basis through an auction mechanism (the "competitive loans"), (ii) revolving extensions of credit (the "revolving loans") outstanding at any time and (iii) the issuance of letters of credit in a face amount not in excess of
$100 million
outstanding at any time.
At our election, the interest rate per annum applicable to the competitive advances will be based on either (i) a Eurodollar rate determined by reference to LIBOR, plus an applicable margin offered by the lender making such loans and accepted by us or (ii) a fixed percentage rate per annum specified by the lender making such loans. At our election, the interest rate per annum applicable to the revolving loans will be based on either (i) a Eurodollar rate determined by reference to LIBOR, adjusted for statutory reserve requirements, plus an applicable margin or (ii) a fluctuating rate of interest determined by reference to the greatest of (a) the prime rate of JPMorgan Chase Bank, N.A., (b) the U.S. Federal Funds effective rate plus half of
1%
or (c) the Eurodollar rate determined by reference to LIBOR, adjusted for statutory reserve requirements, in each case, plus an applicable margin.
In accordance with the terms, we may not exceed a maximum leverage ratio of
3.50
(based on a ratio of total debt to earnings before interest, taxes, depreciation and amortization) throughout the term. As of
December 31, 2013
, we were in compliance with all covenants. The Credit Facility also contains limitations on, among other things, incurring debt, granting liens, and entering sale and leaseback transactions. In addition, the Credit Facility contains other terms and conditions such as customary representations and warranties, additional covenants and customary events of default.
As of
December 31, 2013
, the Credit Facility remains undrawn.
Research and Development Facility Agreement
On December 4, 2013, the Company amended and restated its Risk Sharing Finance Facility Agreement (the "R&D Facility Agreement") with The European Investment Bank (the "EIB") to add an additional borrower under the facility. The facility provides an aggregate principal amount of up to
€120 million
(approximately
$165 million
)
to finance research projects and infrastructure development in the European Union. The Company's wholly-owned subsidiaries in Luxembourg, Xylem Holdings S.a.r.l. and Xylem International S.a.r.l., are the borrowers under the R&D Facility Agreement. The obligations of the borrowers under the R&D Facility Agreement are guaranteed by the Company under an Amended and Restated Deed of Guarantee, dated as of December 4, 2013, in favor of the EIB. The funds are available to finance research and development projects during the period from 2013 through 2016 at the Company's R&D facilities in Sweden, Germany, Italy, the United Kingdom, Austria, Norway and Hungary.
Under the R&D Facility Agreement, the borrower can draw loans with a maturity of no longer than 12 years. The R&D Facility Agreement provides for Fixed Rate loans and Floating Rate loans. The interest rate per annum applicable to Fixed Rate loans will be at a fixed percentage rate per annum specified by the EIB which includes the applicable margin. The interest rate per annum applicable to Floating Rate loans will be at the rate determined by reference to EURIBOR for loans drawn in Euros and LIBOR for loans drawn in Pounds Sterling or U.S. Dollars, plus an applicable spread specified by the EIB which includes the applicable margin. The applicable margin for both Fixed Rate loans and Floating Rate loans shall be determined by reference to the credit rating of the Company.
In accordance with the terms of the R&D Facility Agreement, we may not exceed a maximum leverage ratio of
3.50
(based on a ratio of total debt to earnings before interest, taxes, depreciation and amortization) throughout the term. As of
December 31, 2013
, we were in compliance with all covenants. The R&D Facility Agreement also contains limitations on, among other things, incurring debt, granting liens, and entering sale and leaseback transactions. In addition, the R&D Facility Agreement contains other terms and conditions such as customary representations and warranties, additional covenants and customary events of default.
81
As of
December 31, 2013
,
$38 million
was outstanding under the R&D Facility Agreement.
Although the borrowing term for this arrangement is for five years, we have classified it as short-term debt on our Consolidated Balance Sheet since we intend to repay this obligation in less than one year.
Note 15
. Postretirement Benefit Plans
Defined contribution plans
– Prior to the Spin-off, employees who met certain eligibility requirements participated in various defined contribution plans administered by ITT. In connection with the Spin-off, we entered into a Benefit and Compensation Matters Agreement with ITT whereby Xylem agreed to replicate certain ITT defined contribution plans to allow for continuation of those benefits. Under this agreement, assets attributable to Xylem specific employees were transferred from ITT to our domestic and international qualified defined contribution plans. The assets transferred into Xylem were
$144 million
in
29
different investment options, including the Xylem Stock Fund. Xylem’s U.S. plan also provides for transition credits for eligible U.S. employees for the first
five
years of the plan to supplement retirement benefits in the absence of a defined benefit plan. Age plus years of eligible service greater than or equal to
60
, entitles an employee to transition credits. The liability for transition credits was approximately
$3 million
at December 31,
2013
and
2012
.
Xylem and certain of our subsidiaries maintain various defined contribution savings plans, which allow employees to contribute a portion of their pre-tax and/or after-tax income in accordance with specified guidelines. Several of the plans require us to match a percentage of the employee contributions up to certain limits, generally between
3.0%
–
7.0%
of employee base pay. Matching obligations, the majority of which were funded in cash in connection with the plans, along with transition credits and other company contributions are as follows:
|
(in millions)
|
Defined Contribution
|
||
|
2013
|
$
|
35
|
|
|
2012
|
30
|
|
|
|
2011
|
28
|
|
|
The Xylem Stock Fund, an investment option under the defined contribution plan in which Company employees participate is considered an Employee Stock Ownership Plan. As a result, participants in the Xylem Stock Fund may receive dividends in cash or may reinvest such dividends into the Xylem Stock Fund. Company employees held approximately
453
thousand and
528
thousand shares of Xylem Inc. common stock in the Xylem Stock Fund at December 31,
2013
and
2012
, respectively.
Defined benefit pension plans and other postretirement plans
– We historically have maintained qualified and nonqualified defined benefit retirement plans covering certain current and former employees, including hourly and union plans as well as salaried plans, which generally require up to 5 years of service to be vested and for which the benefits are determined based on years of credited service and either specified rates, final pay, or final average pay. The other postretirement benefit plans are all unfunded plans in the U.S. and Canada.
Prior to the Spin-off, employees who met certain eligibility requirements participated in various defined benefit pension plans and other postretirement benefit plans administered and sponsored by ITT. These plans were accounted for under a multi-employer plan and as such, we recorded expense of
$49 million
in 2011 to reflect our allocation of pension and other postretirement benefit costs related to shared plans.
Pursuant to the Benefit and Compensation Matters Agreement, the assets and liabilities of certain defined benefit plans and other post retirement benefit plans, allocable to Xylem employees, were transferred to Xylem. Assets of
$337 million
, projected obligation of
$400 million
and
$105 million
of other comprehensive income (
$73 million
net of tax) were recorded for the plans transferred by ITT. In the U.S., the new Xylem Investment Master Trust (U.S. Master Trust) was created at the time of the Spin-off and
$45 million
of assets were transferred from the ITT Master Trust related to the Xylem U.S. defined benefit pension plans for hourly employees.
Benefits accrued for Xylem specific participants under the ITT Salaried Retirement Plan ceased on October 31, 2011. As a result, a curtailment was recorded by ITT during the third quarter of 2011, of which we were allocated a charge of
$1 million
. As of December 31, 2011, there were no required contributions outstanding. The Company does not offer a defined benefit plan for salaried employees in the United States.
The ITT Industries General Pension Plan in the UK ("the UK Plan") for salaried employees was amended, effective December 31, 2011, to eliminate the crediting of future benefits relating to service. A curtailment was recorded
82
during the quarter ended September 30, 2011. As a result the applicable plan assets and obligations were re-measured. The re-measurement included a
$9 million
(
$6 million
net of tax) increase in deferred losses within accumulated other comprehensive income and a corresponding decrease to the funded status of the plan, as well as updated asset values, and a change in the discount rate from
6.00%
to
5.75%
. In addition, all participants were reclassified as inactive for benefit plan purposes and actuarial gains and losses will be amortized over
27
years which represents the expected weighted-average remaining lives of plan participants.
During the first quarter of 2012, an annuity was purchased to wind up
five
pension plans in Canada. This resulted in a settlement change of
$2 million
. The Company has no further obligation for these plans.
Effective October 1, 2013, the Xylem Canada Company Pension Plan for Salaried Employees was amended to close the plan to new entrants and a soft freeze, where benefits earned to date are based on frozen service but the future average earnings will continue to be recognized. The impact of the curtailment on the Company’s financial statements was immaterial. However, the participants are now considered inactive and actuarial gains and losses will be amortized over
25
years which represents the expected weighted-average remaining lives of the plan participants.
Effective October 14, 2013, an amendment to one of the Company's business unit's pension plans for its hourly workers, the Xylem Standard Hourly Bargaining Unit Pension Plan, modified the benefit formula. Pension benefits for future service will be based only on years of service. The remeasurement at year end resulted in a
$4 million
prior service credit, which will be amortized into net periodic pension cost over approximately
11 years
.
Amounts recognized in the Consolidated Balance Sheets for pension and other employee-related benefit plans (collectively, postretirement plans) reflect the funded status of the postretirement benefit plans. The following table provides a summary of the funded status of our postretirement plans, the presentation of such balances and a summary of amounts recorded within accumulated other comprehensive income.
|
(in millions)
|
December 31, 2013
|
December 31, 2012
|
|||||||||||||||||||||
|
|
Pension
|
Other
|
Total
|
Pension
|
Other
|
Total
|
|||||||||||||||||
|
Fair value of plan assets
|
$
|
524
|
|
$
|
—
|
|
$
|
524
|
|
$
|
477
|
|
$
|
—
|
|
$
|
477
|
|
|||||
|
Projected benefit obligation
|
(777
|
)
|
(63
|
)
|
(840
|
)
|
(790
|
)
|
(65
|
)
|
(855
|
)
|
|||||||||||
|
Funded status
|
$
|
(253
|
)
|
$
|
(63
|
)
|
$
|
(316
|
)
|
$
|
(313
|
)
|
$
|
(65
|
)
|
$
|
(378
|
)
|
|||||
|
|
|||||||||||||||||||||||
|
Other non-current assets
|
$
|
46
|
|
$
|
—
|
|
$
|
46
|
|
$
|
36
|
|
$
|
—
|
|
$
|
36
|
|
|||||
|
Accrued and other current liabilities
|
(11
|
)
|
(3
|
)
|
(14
|
)
|
(11
|
)
|
(3
|
)
|
(14
|
)
|
|||||||||||
|
Accrued postretirement benefits
|
(288
|
)
|
(60
|
)
|
(348
|
)
|
(338
|
)
|
(62
|
)
|
(400
|
)
|
|||||||||||
|
Net amount recognized
|
$
|
(253
|
)
|
$
|
(63
|
)
|
$
|
(316
|
)
|
$
|
(313
|
)
|
$
|
(65
|
)
|
$
|
(378
|
)
|
|||||
|
Accumulated other comprehensive income (loss):
|
|||||||||||||||||||||||
|
Net actuarial losses
|
$
|
(228
|
)
|
$
|
(20
|
)
|
$
|
(248
|
)
|
$
|
(277
|
)
|
$
|
(24
|
)
|
$
|
(301
|
)
|
|||||
|
Prior service cost
|
—
|
|
—
|
|
—
|
|
(5
|
)
|
—
|
|
(5
|
)
|
|||||||||||
|
Total
|
$
|
(228
|
)
|
$
|
(20
|
)
|
$
|
(248
|
)
|
$
|
(282
|
)
|
$
|
(24
|
)
|
$
|
(306
|
)
|
|||||
The unrecognized amounts recorded in accumulated other comprehensive income will be subsequently recognized as expense on a straight line basis over the average remaining service period of active participants, or for plans with all or substantially all inactive participants, over the average remaining life expectancy. Actuarial gains and losses incurred in future periods and not recognized as expense in those periods will be recognized as increases or decreases in other comprehensive income, net of tax.
83
The net actuarial loss included in accumulated other comprehensive income at the end of
2013
and expected to be recognized in net periodic benefit cost during
2014
is
$11 million
(
$8 million
, net of tax). The prior service cost included in accumulated other comprehensive income to be recognized in 2014 is less than
$1 million
.
The benefit obligation, fair value of plan assets, funded status, and amounts recognized in the consolidated and combined financial statements for our defined benefit domestic and international pension plans were:
|
Domestic Plans
|
International Plans
|
||||||||||||||
|
December 31,
|
December 31,
|
||||||||||||||
|
(in millions)
|
2013
|
2012
|
2013
|
2012
|
|||||||||||
|
Change in benefit obligation:
|
|||||||||||||||
|
Benefit obligation at beginning of year
|
$
|
83
|
|
$
|
71
|
|
$
|
707
|
|
$
|
599
|
|
|||
|
Service cost
|
3
|
|
3
|
|
14
|
|
11
|
|
|||||||
|
Interest cost
|
3
|
|
3
|
|
28
|
|
29
|
|
|||||||
|
Benefits paid
|
(3
|
)
|
(3
|
)
|
(32
|
)
|
(33
|
)
|
|||||||
|
Actuarial (gain) loss
|
(8
|
)
|
9
|
|
(9
|
)
|
69
|
|
|||||||
|
Plan amendments, settlements and curtailments
|
(4
|
)
|
—
|
|
(2
|
)
|
—
|
|
|||||||
|
Foreign currency translation/other
|
—
|
|
—
|
|
(3
|
)
|
32
|
|
|||||||
|
Benefit obligation at end of year
|
$
|
74
|
|
$
|
83
|
|
$
|
703
|
|
$
|
707
|
|
|||
|
Change in plan assets:
|
|||||||||||||||
|
Fair value of plan assets at beginning of year
|
$
|
51
|
|
44
|
|
$
|
426
|
|
$
|
373
|
|
||||
|
Employer contributions
|
4
|
|
5
|
|
36
|
|
38
|
|
|||||||
|
Actual return on plan assets
|
6
|
|
5
|
|
42
|
|
37
|
|
|||||||
|
Benefits paid
|
(3
|
)
|
(3
|
)
|
(32
|
)
|
(33
|
)
|
|||||||
|
Plan amendments, settlements and curtailments
|
—
|
|
—
|
|
(1
|
)
|
(1
|
)
|
|||||||
|
Foreign currency translation/other
|
—
|
|
—
|
|
(5
|
)
|
12
|
|
|||||||
|
Fair value of plan assets at end of year
|
$
|
58
|
|
$
|
51
|
|
$
|
466
|
|
$
|
426
|
|
|||
|
Funded (unfunded) status of the plans
|
$
|
(16
|
)
|
$
|
(32
|
)
|
$
|
(237
|
)
|
$
|
(281
|
)
|
|||
The following table provides a rollforward of the projected benefit obligation for the other postretirement employee benefit plans:
|
(in millions)
|
2013
|
2012
|
|||||
|
Change in benefit obligation:
|
|||||||
|
Benefit obligation at beginning of year
|
$
|
65
|
|
$
|
46
|
|
|
|
Service cost
|
1
|
|
1
|
|
|||
|
Interest cost
|
3
|
|
3
|
|
|||
|
Benefits paid
|
(3
|
)
|
(3
|
)
|
|||
|
Actuarial (gain) loss
|
(2
|
)
|
15
|
|
|||
|
Other
|
(1
|
)
|
3
|
|
|||
|
Benefit Obligation at the end of year
|
$
|
63
|
|
$
|
65
|
|
|
84
The accumulated benefit obligation (“ABO”) for all the defined benefit pension plans was
$741 million
and
$740 million
at
December 31, 2013
and
2012
, respectively. For defined benefit pension plans in which the accumulated benefit obligation was in excess of the fair value of the plans’ assets, the projected benefit obligation (“PBO”), ABO and fair value of the plans’ assets were as follows:
|
December 31,
|
|||||||
|
(in millions)
|
2013
|
2012
|
|||||
|
Projected benefit obligation
|
$
|
404
|
|
$
|
516
|
|
|
|
Accumulated benefit obligation
|
375
|
|
469
|
|
|||
|
Fair value of plan assets
|
106
|
|
171
|
|
|||
The components of net periodic benefit cost for our defined benefit pension plans are as follows:
|
Year Ended December 31,
|
|||||||||||
|
(in millions)
|
2013
|
2012
|
2011
|
||||||||
|
Domestic defined benefit pension plans:
|
|||||||||||
|
Service cost
|
$
|
3
|
|
$
|
3
|
|
$
|
2
|
|
||
|
Interest cost
|
3
|
|
3
|
|
3
|
|
|||||
|
Expected return on plan assets
|
(4
|
)
|
(4
|
)
|
(4
|
)
|
|||||
|
Amortization of prior service cost
|
1
|
|
1
|
|
1
|
|
|||||
|
Amortization of net actuarial loss
|
2
|
|
2
|
|
—
|
|
|||||
|
Net periodic benefit cost
|
$
|
5
|
|
$
|
5
|
|
$
|
2
|
|
||
|
International defined benefit pension plans:
|
|||||||||||
|
Service cost
|
$
|
14
|
|
$
|
11
|
|
$
|
6
|
|
||
|
Interest cost
|
28
|
|
29
|
|
12
|
|
|||||
|
Expected return on plan assets
|
(31
|
)
|
(30
|
)
|
(6
|
)
|
|||||
|
Amortization of net actuarial loss
|
13
|
|
8
|
|
2
|
|
|||||
|
Settlement and special termination benefits
|
—
|
|
2
|
|
1
|
|
|||||
|
Net periodic benefit cost
|
$
|
24
|
|
$
|
20
|
|
$
|
15
|
|
||
|
Total net periodic benefit cost
|
$
|
29
|
|
$
|
25
|
|
$
|
17
|
|
||
85
Other changes in plan assets and benefit obligations recognized in other comprehensive income, as they pertain to our defined benefit pension plans are as follows:
|
Year Ended December 31,
|
|||||||||||
|
(in millions)
|
2013
|
2012
|
2011
|
||||||||
|
Domestic defined benefit pension plans:
|
|||||||||||
|
Net (gain) loss
|
$
|
(11
|
)
|
$
|
8
|
|
$
|
14
|
|
||
|
Prior service (credit) cost
|
(4
|
)
|
1
|
|
—
|
|
|||||
|
Amortization of prior service cost
|
(1
|
)
|
(1
|
)
|
(1
|
)
|
|||||
|
Amortization of net actuarial loss
|
(2
|
)
|
(2
|
)
|
—
|
|
|||||
|
Change recognized in other comprehensive income
|
$
|
(18
|
)
|
$
|
6
|
|
$
|
13
|
|
||
|
International defined benefit pension plans:
|
|||||||||||
|
Net (gain) loss
|
$
|
(21
|
)
|
$
|
62
|
|
$
|
57
|
|
||
|
Amortization of net actuarial loss
|
(13
|
)
|
(8
|
)
|
(2
|
)
|
|||||
|
Settlement
|
—
|
|
(2
|
)
|
—
|
|
|||||
|
Foreign exchange
|
(2
|
)
|
8
|
|
—
|
|
|||||
|
Change recognized in other comprehensive (income) loss (a)
|
$
|
(36
|
)
|
$
|
60
|
|
$
|
55
|
|
||
|
Total recognized in other comprehensive (income) loss
|
$
|
(54
|
)
|
$
|
66
|
|
$
|
68
|
|
||
|
Total recognized in comprehensive (income) loss
|
$
|
(25
|
)
|
$
|
91
|
|
$
|
85
|
|
||
|
(a)
|
The 2011 amount excludes
$97 million
(
$68 million
net of tax) of deferred losses assumed upon Spin-off.
|
The components of net periodic benefit cost for other postretirement employee benefit plans are as follows:
|
Year Ended December 31,
|
|||||||||||
|
(in millions)
|
2013
|
2012
|
2011
|
||||||||
|
Service cost
|
$
|
1
|
|
$
|
1
|
|
$
|
1
|
|
||
|
Interest cost
|
3
|
|
3
|
|
1
|
|
|||||
|
Amortization of net actuarial loss
|
2
|
|
1
|
|
—
|
|
|||||
|
Net periodic benefit cost
|
$
|
6
|
|
$
|
5
|
|
$
|
2
|
|
||
Other changes in plan assets and benefit obligations recognized in other comprehensive income, as they pertain to other postretirement employee benefit plans are as follows:
|
Year Ended December 31,
|
|||||||||||
|
(in millions)
|
2013
|
2012
|
2011
|
||||||||
|
Net (gain) loss
|
$
|
(2
|
)
|
$
|
14
|
|
$
|
3
|
|
||
|
Amortization of net actuarial loss
|
(2
|
)
|
(1
|
)
|
—
|
|
|||||
|
Change recognized in other comprehensive (income) loss (a)
|
$
|
(4
|
)
|
$
|
13
|
|
$
|
3
|
|
||
|
Total recognized in comprehensive loss
|
$
|
2
|
|
$
|
18
|
|
$
|
5
|
|
||
|
(a)
|
The 2011 amount excludes
$8 million
(
$5 million
net of tax) of deferred losses assumed upon Spin-off.
|
86
Assumptions
The following table provides the weighted-average assumptions used to determine projected benefit obligations and net periodic benefit cost, as they pertain to our pension plans.
|
|
2013
|
2012
|
2011
|
||||||||||||||
|
|
U.S.
|
Int’l
|
U.S.
|
Int’l
|
U.S.
|
Int’l
|
|||||||||||
|
Benefit Obligation Assumptions
|
|||||||||||||||||
|
Discount rate
|
4.79
|
%
|
4.23
|
%
|
4.13
|
%
|
4.04
|
%
|
4.87
|
%
|
4.76
|
%
|
|||||
|
Rate of future compensation increase
|
NM
|
|
3.48
|
%
|
4.50
|
%
|
3.50
|
%
|
4.50
|
%
|
3.58
|
%
|
|||||
|
Net Periodic Benefit Cost Assumptions
|
|||||||||||||||||
|
Discount rate
|
4.13
|
%
|
4.04
|
%
|
4.87
|
%
|
4.76
|
%
|
5.83
|
%
|
5.53
|
%
|
|||||
|
Expected long-term return on plan assets
|
8.00
|
%
|
7.33
|
%
|
8.00
|
%
|
7.35
|
%
|
9.00
|
%
|
7.34
|
%
|
|||||
|
Rate of future compensation increase
|
4.50
|
%
|
3.50
|
%
|
4.50
|
%
|
3.58
|
%
|
4.50
|
%
|
3.37
|
%
|
|||||
|
NM
|
Not meaningful. During 2013, an amendment to one of the Company's business unit's pension plans, the Xylem Standard Hourly Bargaining Unit Pension Plan, modified the benefit formula. Similar to all other U.S. pension plans, pension benefits for future service will be based on years of service and not impacted by future compensation increases.
|
Management develops each assumption using relevant company experience in conjunction with market-related data for each individual country in which plans exist. Assumptions are reviewed annually and adjusted as necessary.
The expected long-term rate of return on assets reflects the expected returns for each major asset class in which the plans hold investments, the weight of each asset class in the target mix, the correlations among asset classes and their expected volatilities. The assets of the pension plans are held by a number of independent trustees, managed by several investment institutions and are accounted for separately in the Company’s pension funds.
Our expected return on plan assets is estimated by evaluating both historical returns and estimates of future returns. Specifically, we analyze the plans’ actual historical annual return on assets, net of fees, over the past 15, 20 and 25 years; estimate future returns based on independent estimates of asset class returns; and evaluate historical broad market returns over long-term timeframes based on our asset allocation range. For the new U.S. Master Trust, historical returns were estimated using a constructed portfolio that reflects the Company’s strategic asset allocation and the historical compound geometric returns of each asset class for the longest time period available. Based on this approach, the weighted average expected long-term rate of return on assets for all plan assets effective January 1,
2014
is estimated at
7.38%
.
The table below provides the weighted average actual rate of return generated on plan assets during each of the years presented as compared to the weighted average expected long-term rates of return utilized in calculating the net periodic benefit costs.
|
2013
|
2012
|
2011
|
||||||
|
Expected long-term rate of return on plan assets
|
7.40
|
%
|
7.42
|
%
|
7.52
|
%
|
||
|
Actual rate of return on plan assets
|
10.17
|
%
|
10.09
|
%
|
(1.40
|
)%
|
||
The assumed rate of future increases in the per capita cost of health care (the health care trend rate) is
7.19%
for
2014
, decreasing ratably to
5.00%
in
2020
. An increase or decrease in the health care trend rates by one percent per year would impact the aggregate annual service and interest components by less than
$1 million
, and impact the benefit obligation by approximately
$8 million
. To the extent that actual experience differs from these assumptions, the effect will be amortized over the average future service of the covered active employees.
87
The determination of the assumptions related to postretirement benefit plans are based on the provisions of the applicable accounting pronouncements, the review of various market data and discussion with our actuaries.
Investment Policy
The investment strategy for managing worldwide postretirement benefit plan assets is to seek an optimal rate of return relative to an appropriate level of risk for each plan. Investment strategies vary by plan, depending on the specific characteristics of the plan, such as plan size and design, funded status, liability profile and legal requirements. In general, the plans are managed closely to their strategic allocations.
The following table provides the actual asset allocations of plan assets as of December 31,
2013
and
2012
, and the related asset target allocation ranges by asset category.
|
2013
|
2012
|
Target
Allocation
Ranges
|
|||||
|
Equity securities
|
31.7
|
%
|
29.2
|
%
|
20-40%
|
||
|
Fixed income
|
24.7
|
%
|
26.4
|
%
|
20-50%
|
||
|
Hedge funds
|
23.5
|
%
|
29.4
|
%
|
20-60%
|
||
|
Private equity
|
4.2
|
%
|
5.1
|
%
|
0-15%
|
||
|
Insurance contracts and other
|
15.9
|
%
|
9.9
|
%
|
0-30%
|
||
During the fourth quarter of 2012, the investment strategy for the plan assets within our UK Plan was adjusted with the objective of reducing risk to market and economic volatility as well as helping to maintain the fully funded status and enhance portfolio liquidity. Since at the time the UK Plan held
58%
of the Company's postretirement plan assets, this change reduced the overall Company target allocations in equity securities, fixed income and private equity, while increasing the allocation to hedge funds.
Fair Value of Plan Assets
In measuring plan assets at fair value, a fair value hierarchy is applied which categorizes and prioritizes the inputs used to estimate fair value into three levels. The fair value hierarchy is based on maximizing the use of observable inputs and minimizing the use of unobservable inputs when measuring fair value. Classification within the fair value hierarchy is based on the lowest level input that is significant to the fair value measurement. The three levels of the fair value hierarchy are defined as follows:
|
•
|
Level 1 inputs are quoted prices (unadjusted) in active markets for identical assets or liabilities.
|
|
•
|
Level 2 inputs are other than quoted prices included within level 1 that are observable for the asset or liability, either directly or indirectly. Level 2 inputs include quoted prices (in non-active markets or in active markets for similar assets or liabilities), inputs other than quoted prices that are observable, and inputs that are derived principally from or corroborated by observable market data by correlation or other means.
|
|
•
|
Level 3 inputs are unobservable inputs for the assets or liabilities.
|
In certain instances, fair value is estimated using quoted market prices obtained from external pricing services. In obtaining such data from the pricing service, we have evaluated the methodologies used to develop the estimate of fair value in order to assess whether such valuations are representative of fair value, including net asset value (NAV). Additionally, in certain circumstances, the NAV reported by an asset manager may be adjusted when sufficient evidence indicates NAV is not representative of fair value.
The following is a description of the valuation methodologies and inputs used to measure fair value for major categories of investments.
|
•
|
Equity securities — Equities (including common and preferred shares, domestic listed and foreign listed, closed end mutual funds and exchange traded funds) are generally valued at the closing price reported on the major market on which the individual securities are traded at the measurement date. Equity securities held by the Company that are publicly traded in active markets are classified within Level 1 of the fair value hierarchy.
|
88
Those equities that are held in proprietary funds pooled with other investor accounts are generally classified within Level 2 of the hierarchy.
|
•
|
Fixed income — United States government securities are generally valued using quoted prices of securities with similar characteristics. Corporate bonds and notes are generally valued by using pricing models (e.g. discounted cash flows), quoted prices of securities with similar characteristics or broker quotes. Fixed income securities are generally classified in Level 2 of the fair value hierarchy, however, bond funds listed on active markets are classified in Level 1.
|
|
•
|
Hedge funds — Hedge funds are pooled funds that employ a range of investment strategies including equity and fixed income, credit driven, macro and multi oriented strategies. The valuation of limited partnership interests in hedge funds may require significant management judgment. The NAV reported by the asset manager is adjusted when it is determined that NAV is not representative of fair value. In making such an assessment, a variety of factors is reviewed, including, but not limited to, the timeliness of NAV as reported by the asset manager and changes in general economic and market conditions subsequent to the last NAV reported by the asset manager. Depending on how these investments can be redeemed and the extent of any adjustments to NAV, hedge funds are classified within either Level 2 (redeemable within 90 days) or Level 3 (redeemable beyond 90 days) of the fair value hierarchy.
|
|
•
|
Private equity — Private equity includes a diversified range of strategies, including buyout funds, distressed funds, venture and growth equity funds and mezzanine funds. The valuation of limited partnership interests in private equity funds may require significant management judgment. The NAV reported by the asset manager is adjusted when it is determined that NAV is not representative of fair value. In making such an assessment, a variety of factors is reviewed, including, but not limited to, the timeliness of NAV as reported by the asset manager and changes in general economic and market conditions subsequent to the last NAV reported by the asset manager. These funds are generally classified within Level 3 of the fair value hierarchy.
|
|
•
|
Insurance contracts and other — Primarily comprised of insurance contracts and cash. Insurance contracts are valued at book value, which approximates fair value, and is calculated using the prior year balance adjusted for investment returns and cash flows. Cash and cash equivalents are held in accounts with brokers or custodians for liquidity and investment collateral.
|
89
The following table provides the fair value of plan assets held by our pension benefit plans by asset class.
|
December 31,
|
|||||||||||||||||||||||||||||||
|
2013
|
2012
|
||||||||||||||||||||||||||||||
|
(in millions)
|
Total
|
Level 1
|
Level 2
|
Level 3
|
Total
|
Level 1
|
Level 2
|
Level 3
|
|||||||||||||||||||||||
|
Asset Category
|
|||||||||||||||||||||||||||||||
|
Equity securities
|
|||||||||||||||||||||||||||||||
|
Global stock funds/securities
|
$
|
123
|
|
$
|
108
|
|
$
|
11
|
|
$
|
4
|
|
$
|
93
|
|
$
|
79
|
|
$
|
11
|
|
$
|
3
|
|
|||||||
|
Index funds
|
40
|
|
3
|
|
37
|
|
—
|
|
46
|
|
3
|
|
43
|
|
—
|
|
|||||||||||||||
|
Emerging markets funds
|
3
|
|
3
|
|
—
|
|
—
|
|
—
|
|
—
|
|
—
|
|
—
|
|
|||||||||||||||
|
Fixed income
|
|||||||||||||||||||||||||||||||
|
Corporate bonds
|
95
|
|
40
|
|
48
|
|
7
|
|
100
|
|
32
|
|
59
|
|
9
|
|
|||||||||||||||
|
Government bonds
|
35
|
|
35
|
|
—
|
|
—
|
|
26
|
|
23
|
|
3
|
|
—
|
|
|||||||||||||||
|
Hedge funds
|
123
|
|
9
|
|
95
|
|
19
|
|
140
|
|
44
|
|
76
|
|
20
|
|
|||||||||||||||
|
Private equity
|
22
|
|
—
|
|
—
|
|
22
|
|
24
|
|
—
|
|
—
|
|
24
|
|
|||||||||||||||
|
Insurance contracts and other
|
83
|
|
62
|
|
4
|
|
17
|
|
48
|
|
44
|
|
—
|
|
4
|
|
|||||||||||||||
|
Total
|
$
|
524
|
|
$
|
260
|
|
$
|
195
|
|
$
|
69
|
|
$
|
477
|
|
$
|
225
|
|
$
|
192
|
|
$
|
60
|
|
|||||||
The following table presents a reconciliation of the beginning and ending balances of fair value measurement within our pension plans using significant unobservable inputs (Level 3).
|
(in millions)
|
Equity
Securities
|
Fixed Income
|
Hedge funds
|
Private Equity
|
Other
|
Total
|
|||||||||||||||||
|
Balance, December 31, 2011
|
$
|
2
|
|
$
|
—
|
|
$
|
37
|
|
$
|
24
|
|
$
|
4
|
|
$
|
67
|
|
|||||
|
Purchases, sales, settlements
|
—
|
|
8
|
|
8
|
|
(1
|
)
|
—
|
|
15
|
|
|||||||||||
|
Unrealized loss
|
—
|
|
1
|
|
1
|
|
1
|
|
—
|
|
3
|
|
|||||||||||
|
Realized gains
|
1
|
|
—
|
|
1
|
|
—
|
|
—
|
|
2
|
|
|||||||||||
|
Net transfers
|
—
|
|
—
|
|
(25
|
)
|
—
|
|
—
|
|
(25
|
)
|
|||||||||||
|
Currency impact
|
—
|
|
—
|
|
(2
|
)
|
—
|
|
—
|
|
(2
|
)
|
|||||||||||
|
Balance, December 31, 2012
|
3
|
|
9
|
|
20
|
|
24
|
|
4
|
|
60
|
|
|||||||||||
|
Purchases, sales, settlements
|
—
|
|
(3
|
)
|
10
|
|
(4
|
)
|
12
|
|
15
|
|
|||||||||||
|
Unrealized gains
|
—
|
|
1
|
|
1
|
|
1
|
|
1
|
|
4
|
|
|||||||||||
|
Realized gains
|
1
|
|
—
|
|
—
|
|
—
|
|
—
|
|
1
|
|
|||||||||||
|
Net transfers
|
—
|
|
—
|
|
(12
|
)
|
—
|
|
—
|
|
(12
|
)
|
|||||||||||
|
Currency impact
|
—
|
|
—
|
|
—
|
|
1
|
|
—
|
|
1
|
|
|||||||||||
|
Balance, December 31, 2013
|
$
|
4
|
|
$
|
7
|
|
$
|
19
|
|
$
|
22
|
|
$
|
17
|
|
$
|
69
|
|
|||||
Contributions and Estimated Future Benefit Payments
Funding requirements under governmental regulations are a major consideration in making contributions to our postretirement plans. We made contributions of
$43 million
and
$46 million
to our pension and postretirement benefit plans during
2013
and
2012
, respectively. We currently anticipate making contributions to our pension and postretirement benefit plans in the range of
$40 million
to
$50 million
during
2014
, of which
$11 million
is expected to be made in the first quarter.
90
The following benefit payments, which reflect expected future service, as appropriate, are expected to be paid as follows:
|
(in millions)
|
Pension
|
Other Benefits
|
|||||
|
2014
|
$
|
35
|
|
$
|
3
|
|
|
|
2015
|
36
|
|
3
|
|
|||
|
2016
|
37
|
|
3
|
|
|||
|
2017
|
38
|
|
3
|
|
|||
|
2018
|
39
|
|
3
|
|
|||
|
Years 2019 – 2023
|
222
|
|
20
|
|
|||
Note 16
. Stock-Based Compensation Plans
Our stock-based compensation program is a broad-based program designed to attract and retain employees while also aligning employees’ interests with the interests of our shareholders. In addition, members of our Board of Directors participate in our stock-based compensation program in connection with their service on our board. Share-based awards issued to employees include non-qualified stock options, restricted stock awards and performance-based awards. Compensation costs resulting from share-based payment transactions are recognized primarily within selling, general and administrative expenses, at fair value over the requisite service period (typically
three
years) on a straight-line basis. Under the 2011 Omnibus Incentive Plan, the number of shares initially available for awards was
18 million
. As of
December 31, 2013
, there were approximately
10 million
shares of common stock available for future grants.
We measure the cost of employee services received in exchange for an award of equity instruments based on the grant-date fair value of the award. The calculated compensation cost is adjusted based on an estimate of awards ultimately expected to vest. The fair value of a non-qualified stock option is determined on the date of grant using a binomial lattice pricing model incorporating multiple and variable assumptions over time, including assumptions such as employee exercise patterns, stock price volatility and changes in dividends. The fair value of restricted stock and performance-based share awards are determined using the closing price on date of grant.
Total share-based compensation costs recognized for
2013
,
2012
and
2011
were
$27 million
,
$22 million
, and
$13 million
, respectively. We recognized less than
$1 million
of share-based compensation costs within Restructuring and asset impairment charges during 2013, which relates to the acceleration of certain unamortized compensation expense for share-based compensation of restructured employees. A significant component of the charges in 2011 related to costs allocated to Xylem for ITT Corporate employees as well as other ITT employees not solely dedicated to Xylem. These awards and related amounts are not necessarily indicative of awards and amounts that would have been granted if we were an independent, publicly traded company for that period.
The unamortized compensation expense related to our stock options, restricted shares and performance-based shares was
$6 million
,
$17 million
and
$1 million
, respectively, at
December 31, 2013
and is expected to be recognized over a weighted average period of
1.5
,
1.7
and
2.2
years, respectively.
The amount of cash received from the exercise of stock options was
$22 million
for
2013
with a tax benefit of
$8 million
realized associated with stock option exercises and vesting of restricted stock. We classify as a financing activity the cash flows attributable to excess tax benefits arising from stock option exercises and restricted stock vestings.
91
Stock Option Grants
Options are awarded with a contractual term of ten years and generally vest over or at the conclusion of a three-year period and are exercisable in seven to ten-year periods, except in certain instances of death, retirement or disability. The exercise price per share is the fair market value of the underlying common stock on the date each option is granted. At
December 31, 2013
, there were options to purchase an aggregate of
3.5 million
shares of common stock. The following is a summary of the changes in outstanding stock options for
2013
:
|
(shares in thousands)
|
Shares
|
Weighted
Average
Exercise
Price / Share
|
Weighted Average
Remaining
Contractual
Term (Years)
|
|||||
|
Outstanding at January 1, 2013
|
4,083
|
|
$
|
26.46
|
|
6.4
|
||
|
Granted
|
817
|
|
$
|
27.43
|
|
10.0
|
||
|
Exercised
|
(850
|
)
|
$
|
25.01
|
|
3.4
|
||
|
Forfeited
|
(546
|
)
|
$
|
27.86
|
|
6.1
|
||
|
Outstanding at December 31, 2013
|
3,504
|
|
$
|
26.80
|
|
6.4
|
||
|
Options exercisable at December 31, 2013
|
1,994
|
|
$
|
26.71
|
|
4.9
|
||
|
Vested and non-vested expected to vest at December 31. 2013
|
3,438
|
|
$
|
26.79
|
|
6.4
|
||
The amount of non-vested options outstanding was
1.5 million
and
2.2 million
at a weighted average grant date fair value of
$26.90
and
$27.14
as of December 31, 2013 and January 1, 2013, respectively. The aggregate intrinsic value of the outstanding, exercisable and vested and non-vested stock options expected to vest at
December 31, 2013
was
$28 million
,
$16 million
and
$27 million
respectively. The total intrinsic value of options exercised (which is the amount by which the stock price exceeded the exercise price of the options on the date of exercise) during
2013
was
$7 million
.
Stock Option Fair Value
The fair value of each option grant was estimated on the date of grant using the binomial lattice pricing model which incorporates multiple and variable assumptions over time, including assumptions such as employee exercise patterns, stock price volatility and changes in dividends. The following are weighted-average assumptions for
2013
.
|
|
2013
|
2012
|
2011
|
||||||||
|
Dividend yield
|
1.69
|
%
|
1.52
|
%
|
1.51
|
%
|
|||||
|
Volatility
|
31.10
|
%
|
33.40
|
%
|
36.30
|
%
|
|||||
|
Risk-free interest rate
|
1.28
|
%
|
1.42
|
%
|
1.50
|
%
|
|||||
|
Expected term (in years)
|
6.62
|
|
7.00
|
|
6.40
|
|
|||||
|
Weighted-average fair value per share
|
$
|
7.58
|
|
$
|
8.10
|
|
$
|
7.88
|
|
||
Expected volatility is calculated based on an analysis of historic and implied volatility measures for a set of peer companies. We use historical data to estimate option exercise and employee termination behavior within the valuation model. Employee groups and option characteristics are considered separately for valuation purposes. The expected term represents an estimate of the period of time options are expected to remain outstanding. The expected term provided above represents the weighted average of expected behavior for certain groups of employees who have historically exhibited different behavior. The risk-free rate is based on the U.S. Treasury yield curve in effect at the time of option grant.
Restricted Stock Grants
As part of the 2011 Omnibus Incentive Plan, we are authorized to issue shares of restricted stock to eligible employees and directors. Restricted shares granted to employees become fully vested upon the third anniversary of the date of grant, and certain liability-based restricted shares to international employees settle in cash. Prior to the time a restricted share becomes fully vested, the awardees cannot transfer, pledge, hypothecate or encumber such shares. Prior to the time a restricted share is fully vested, the awardees have certain rights of a stockholder and may include the right to vote and receive dividends. If an employee leaves prior to vesting, whether through resignation or termination for cause, the restricted stock and related accrued dividends are forfeited. If an employee retires or is terminated other than for cause, a pro rata portion of the restricted stock may vest in accordance with
92
the terms of the grant agreements. Restricted shares granted to Board members become fully vested upon the date of the next annual meeting.
Our restricted stock activity was as follows for
2013
:
|
(shares in thousands)
|
Shares
|
Weighted Average
Grant Date Fair
Value Per Share
|
||||
|
Outstanding at January 1, 2013
|
1,588
|
|
$
|
26.92
|
|
|
|
Granted
|
568
|
|
$
|
28.18
|
|
|
|
Vested
|
(691
|
)
|
$
|
26.44
|
|
|
|
Forfeited
|
(190
|
)
|
$
|
28.84
|
|
|
|
Outstanding at December 31, 2013
|
1,275
|
|
$
|
27.67
|
|
|
Performance-Based Share Grants
As part of the annual March 2013 grant under the long-term incentive plan, performance-based shares were granted to all executive officers of the Company. The performance-based shares vest based upon performance by the Company over a
three
-year period against targets approved by the compensation committee of the Company's Board of Directors prior to the grant date. For the 2013-2015 performance period, the performance-based shares were granted at a target of
100%
with actual payout contingent upon the achievement of a pre-set, three-year adjusted Return on Invested Capital and cumulative adjusted net income performance target. Compensation costs resulting from share-based payment transactions are recognized primarily within selling, general and administrative expenses, at fair value over the requisite service period (typically three years) on a straight-line basis. The calculated compensation cost is adjusted based on an estimate of awards ultimately expected to vest and our assessment of the probable outcome of the performance condition. The fair value of performance-based share awards at
100%
target is determined using the closing price of our common stock on date of grant.
Our performance-based share activity was as follows for
2013
:
|
(shares in thousands)
|
Shares
|
Weighted Average
Grant Date Fair
Value Per Share
|
||||
|
Outstanding at January 1, 2013
|
—
|
|
$
|
—
|
|
|
|
Granted
|
119
|
|
$
|
27.49
|
|
|
|
Vested
|
—
|
|
$
|
—
|
|
|
|
Forfeited
|
(67
|
)
|
$
|
27.49
|
|
|
|
Outstanding at December 31, 2013
|
52
|
|
$
|
27.49
|
|
|
93
The Company has the authority to issue an aggregate of
750 million
shares of Common Stock having a par value of
$0.01
per share. The stockholders of Xylem common stock are entitled to receive dividends as declared by the Xylem Board of Directors. Dividends declared were
$0.4656
,
$0.4048
and
$0.1012
during
2013
,
2012
and
2011
, respectively.
The changes in common stock outstanding for the three years ended December 31 are as follows:
|
(in thousands of shares)
|
2013
|
2012
|
2011
|
|||||
|
Beginning Balance, January 1
|
185,658
|
|
184,641
|
|
—
|
|
||
|
Conversion of net investment
|
—
|
|
—
|
|
184,578
|
|
||
|
Stock incentive plan activity
|
1,203
|
|
1,367
|
|
63
|
|
||
|
Repurchase of common stock
|
(2,304
|
)
|
(350
|
)
|
—
|
|
||
|
Ending Balance, December 31
|
184,557
|
|
185,658
|
|
184,641
|
|
||
On August 20, 2013, the Board of Directors authorized the repurchase up to
$250 million
in shares with no expiration date. The program's objective is to deploy our capital in a manner that benefits our shareholders and maintains our focus on growth. During
2013
, we repurchased
1.7 million
shares for
$50 million
under this program. There are up to
$200 million
in shares that may still be purchased under this plan.
On August 18, 2012, the Board of Directors authorized the repurchase of up to
2.0 million
shares of common stock with no expiration date. The program's objective is to offset dilution associated with various Xylem employee stock plans by acquiring shares in the open market from time to time. We repurchased
0.6 million
and
0.4 million
shares for
$17 million
and
$9 million
under this program during
2013
and
2012
, respectively. There are up to
1.0 million
shares that may still be purchased under this plan.
Aside from the aforementioned repurchase programs, we repurchased
0.2 million
and
0.1 million
shares for
$6 million
and
$4 million
during
2013
and
2012
, respectively in relation to settlement of employee tax withholding obligations due as a result of the vesting of restricted stock.
94
The following table provides the components of accumulated other comprehensive income for
2013
,
2012
and
2011
:
|
(in millions)
|
Foreign Currency Translation
|
Postretirement Benefit Plans
|
Derivative Instruments
|
Total
|
|||||||||||
|
Balance at January 1, 2011
|
$
|
73
|
|
$
|
(36
|
)
|
$
|
—
|
|
$
|
37
|
|
|||
|
Foreign currency translation adjustment
|
(61
|
)
|
(61
|
)
|
|||||||||||
|
Contributed currency translation adjustment
|
276
|
|
276
|
|
|||||||||||
|
Change in postretirement benefit plans
|
(74
|
)
|
(74
|
)
|
|||||||||||
|
Change in tax on postretirement benefit plans
|
15
|
|
15
|
|
|||||||||||
|
Amortization of prior service cost and net actuarial loss on postretirement benefit plans into:
|
|||||||||||||||
|
Cost of revenue
|
2
|
|
2
|
|
|||||||||||
|
Selling, general and administrative expenses
|
1
|
|
1
|
|
|||||||||||
|
Tax on amortization of postretirement benefit plan items
|
(1
|
)
|
(1
|
)
|
|||||||||||
|
Assumption of accumulated unrealized gains
|
(105
|
)
|
(105
|
)
|
|||||||||||
|
Assumption of tax on accumulated unrealized gains
|
32
|
|
32
|
|
|||||||||||
|
Balance at December 31, 2011
|
$
|
288
|
|
$
|
(166
|
)
|
$
|
—
|
|
$
|
122
|
|
|||
|
Foreign currency translation adjustment
|
48
|
|
48
|
|
|||||||||||
|
Change in postretirement benefit plans
|
(93
|
)
|
(93
|
)
|
|||||||||||
|
Change in tax on postretirement benefit plans
|
27
|
|
27
|
|
|||||||||||
|
Amortization of prior service cost and net actuarial loss on postretirement benefit plans into:
|
|||||||||||||||
|
Cost of revenue
|
5
|
|
5
|
|
|||||||||||
|
Selling, general and administrative expenses
|
5
|
|
5
|
|
|||||||||||
|
Other non-operating (expense) income, net
|
4
|
|
4
|
|
|||||||||||
|
Tax on amortization of postretirement benefit plan items
|
(4
|
)
|
(4
|
)
|
|||||||||||
|
Unrealized gain on foreign exchange agreements
|
4
|
|
4
|
|
|||||||||||
|
Tax on unrealized gain on foreign exchange agreements
|
(1
|
)
|
(1
|
)
|
|||||||||||
|
Reclassification of unrealized gain on foreign exchange agreements
|
(3
|
)
|
(3
|
)
|
|||||||||||
|
Tax on reclassification of unrealized gain on foreign exchange agreements
|
1
|
|
1
|
|
|||||||||||
|
Balance at December 31, 2012
|
$
|
336
|
|
$
|
(222
|
)
|
$
|
1
|
|
$
|
115
|
|
|||
95
|
(in millions)
|
Foreign Currency Translation
|
Postretirement Benefit Plans
|
Derivative Instruments
|
Total
|
|||||||||||
|
Balance at January 1, 2013
|
$
|
336
|
|
$
|
(222
|
)
|
$
|
1
|
|
|
$
|
115
|
|
||
|
Foreign currency translation adjustment
|
15
|
|
15
|
|
|||||||||||
|
Change in postretirement benefit plans
|
40
|
|
40
|
|
|||||||||||
|
Change in tax on postretirement benefit plans
|
(17
|
)
|
(17
|
)
|
|||||||||||
|
Amortization of prior service cost and net actuarial loss on postretirement benefit plans into:
|
|||||||||||||||
|
Cost of revenue
|
7
|
|
7
|
|
|||||||||||
|
Selling, general and administrative expenses
|
7
|
|
7
|
|
|||||||||||
|
Research and development expenses
|
1
|
|
1
|
|
|||||||||||
|
Other non-operating (expense) income, net
|
3
|
|
3
|
|
|||||||||||
|
Tax on amortization of postretirement benefit plan items
|
(5
|
)
|
(5
|
)
|
|||||||||||
|
Unrealized gains on foreign exchange agreements
|
1
|
|
1
|
|
|||||||||||
|
Reclassification of unrealized gain on foreign exchange agreements into revenue
|
(2
|
)
|
(2
|
)
|
|||||||||||
|
Reclassification of unrealized loss on foreign exchange agreements into cost of revenue
|
2
|
|
2
|
|
|||||||||||
|
Balance at December 31, 2013
|
$
|
351
|
|
$
|
(186
|
)
|
$
|
2
|
|
$
|
167
|
|
|||
General
From time to time, we are involved in legal proceedings that are incidental to the operation of our businesses, including acquisitions and divestitures, intellectual property matters, product liability and personal injury claims, employment and pension matters, government and commercial contract disputes.
We are currently involved in litigation relating to a purchase price dispute with the minority shareholders arising from one of our historical acquisitions. The court recently announced its decision to increase the purchase price to be paid to such minority shareholders, and both sides are appealing that decision.
From time to time claims may be asserted against Xylem alleging injury caused by any our products resulting from asbestos exposure. We believe there are numerous legal defenses available for such claims and would defend ourselves vigorously. Pursuant to the Distribution Agreement ("Distribution Agreement") dated October 25, 2011 among ITT, Exelis and Xylem, ITT has an obligation to indemnify, defend and hold Xylem harmless for asbestos product liability matters, including settlements, judgments, and legal defense costs associated with all pending and future claims that may arise from past sales of ITT’s legacy products. We believe ITT remains a substantial entity with sufficient financial resources to honor its obligations to us.
Although the ultimate outcome of any legal matter cannot be predicted with certainty, based on present information, including our assessment of the merits of the particular claims, we do not expect that any asserted or unasserted legal claims or proceedings, individually or in aggregate, will have a material adverse effect on our results of operations, or financial condition. We have estimated and accrued
$17 million
and
$8 million
as of
December 31, 2013
and
2012
, respectively for these general legal matters.
Indemnifications
As part of the Spin-off, ITT, Exelis and Xylem agreed to indemnify, defend and hold harmless each of the other parties with respect to such parties’ assumed or retained liabilities under the Distribution Agreement and breaches of the Distribution Agreement or related spin agreements. ITT’s indemnification obligations include asserted and unasserted asbestos and silica liability claims that relate to the presence or alleged presence of asbestos or silica in products manufactured, repaired or sold prior to October 21, 2011, the Distribution Date, subject to limited exceptions with respect to certain employee claims, or in the structure or material of any building or facility, subject
96
to exceptions with respect to employee claims relating to Xylem buildings or facilities. The indemnification associated with pending and future asbestos claims does not expire. Xylem has not recorded a liability for material matters for which we expect to be indemnified by ITT or Exelis through the Distribution Agreement and we are not aware of any claims or other circumstances that would give rise to material payments from us under such indemnifications.
Environmental
In the ordinary course of business, we are subject to federal, state, local, and foreign environmental laws and regulations. We are responsible, or are alleged to be responsible, for ongoing environmental investigation and remediation of sites in various countries. These sites are in various stages of investigation and/or remediation and in many of these proceedings our liability is considered de minimis. We have received notification from the U.S. Environmental Protection Agency, and from similar state and foreign environmental agencies, that a number of sites formerly or currently owned and/or operated by Xylem, and other properties or water supplies that may be or have been impacted from those operations, contain disposed or recycled materials or wastes and require environmental investigation and/or remediation. These sites include instances where we have been identified as a potentially responsible party under federal and state environmental laws and regulations.
Accruals for environmental matters are recorded on a site-by-site basis when it is probable that a liability has been incurred and the amount of the liability can be reasonably estimated, based on current law and existing technologies. Our accrued liabilities for these environmental matters represent the best estimates related to the investigation and remediation of environmental media such as water, soil, soil vapor, air and structures, as well as related legal fees. These estimates, and related accruals, are reviewed quarterly and updated for progress of investigation and remediation efforts and changes in facts and legal circumstances. Liabilities for these environmental expenditures are recorded on an undiscounted basis. We have estimated and accrued
$8 million
and
$11 million
as of
December 31, 2013
and
2012
, respectively, for environmental matters.
It is difficult to estimate the final costs of investigation and remediation due to various factors, including incomplete information regarding particular sites and other potentially responsible parties, uncertainty regarding the extent of investigation or remediation and our share, if any, of liability for such conditions, the selection of alternative remedial approaches, and changes in environmental standards and regulatory requirements. In our opinion, the total amount accrued is reasonable based on existing facts and circumstances.
As of
December 31, 2013
, our estimate of reasonably possible losses in excess of amounts accrued for environmental and legal matters was approximately
$26 million
.
Operating Leases
We lease certain offices, manufacturing buildings, machinery, computers and other equipment. Such leases expire at various dates through 2047 and may include renewal and payment escalation clauses. We often pay maintenance, insurance and tax expense related to leased assets. Total rent expense for the three years ended
December 31, 2013
was as follows:
|
(in millions)
|
Total
|
||
|
2013
|
$
|
77
|
|
|
2012
|
73
|
|
|
|
2011
|
64
|
|
|
At
December 31, 2013
, we are obligated to make minimum rental payments under operating leases which are as follows:
|
(in millions)
|
2014
|
2015
|
2016
|
2017
|
2018
|
Thereafter
|
|||||||||||||||||
|
Minimum rental payments
|
$
|
63
|
|
$
|
51
|
|
$
|
39
|
|
$
|
24
|
|
$
|
22
|
|
$
|
26
|
|
|||||
97
Warranties
We warrant numerous products, the terms of which vary widely. In general, we warrant products against defect and specific non-performance. Warranty expense was
$34 million
,
$32 million
, and
$35 million
for
2013
,
2012
and
2011
, respectively. The table below provides changes in the product warranty accrual over each period.
|
(in millions)
|
2013
|
2012
|
|||||
|
Warranty accrual – January 1
|
$
|
40
|
|
$
|
42
|
|
|
|
Net changes for product warranties in the period
|
34
|
|
32
|
|
|||
|
Settlement of warranty claims
|
(37
|
)
|
(33
|
)
|
|||
|
Other
|
—
|
|
(1
|
)
|
|||
|
Warranty accrual – December 31
|
$
|
37
|
|
$
|
40
|
|
|
Note 20
. Related Party Transactions and Parent Company Investment
Transactions with Unconsolidated Affiliates
We recorded sales to unconsolidated affiliates during
2013
,
2012
and
2011
totaling
$15 million
,
$12 million
and
$14 million
, respectively. Additionally, we purchased
$20 million
,
$20 million
and
$21 million
of products from unconsolidated affiliates during
2013
,
2012
and
2011
, respectively.
Transactions with Former Parent
Net transfers from/(to) parent are included within parent company investment on the Consolidated and Combined Statements of Changes in Stockholders’ Equity representing activity with ITT, Xylem's former parent company, prior to the Spin-off. The components of the net transfers from/(to) parent for 2011 are as follows:
|
Year Ended December 31,
|
|||
|
(in millions)
|
2011
|
||
|
Intercompany dividends
|
$
|
(87
|
)
|
|
Cash pooling and general financing activities
|
(1,355
|
)
|
|
|
Corporate allocations including income taxes
|
182
|
|
|
|
Contribution of assets and liabilities upon Spin-off
|
20
|
|
|
|
Total net transfers from/(to) parent
|
$
|
(1,240
|
)
|
All significant intercompany transactions between us and ITT have been included in these consolidated and combined financial statements and are considered to be effectively settled for cash at the time the transaction is recorded, when the underlying transaction is to be settled in cash by ITT. The total net effect of the settlement of these intercompany transactions is reflected in the Consolidated and Combined Statements of Cash Flow as a financing activity.
During 2011, we sold inventory to other ITT business in the aggregate amount of
$10 million
, which is included in revenue in our consolidated and combined financial statements. In addition, we recognized cost of revenue from the inventory purchased from other ITT businesses of
$10 million
for 2011.
The consolidated and combined financial statements include expense allocations for certain functions provided by ITT as well as other ITT employees not solely dedicated to Xylem, including, but not limited to, general corporate expenses related to finance, legal, information technology, human resources, communications, ethics and compliance, shared services, employee benefits and incentives, and share-based compensation. These expenses have been allocated to us on the basis of direct usage when identifiable, with the remainder allocated on the basis of revenue, headcount or other measure. We were allocated
$129 million
, which includes
$44 million
of separation costs, of general corporate expenses incurred by ITT which is included within selling, general and administrative expenses in the Consolidated and Combined Income Statements for 2011.
98
The expense allocations have been determined on a basis that we consider to be a reasonable reflection of the utilization of services provided or the benefit received by us during the periods presented. The allocations may not, however, reflect the expense we would have incurred as an independent, publicly traded company for the periods presented. Actual costs that may have been incurred if we had been a standalone company would depend on a number of factors, including the chosen organizational structure, what functions were outsourced or performed by employees and strategic decisions made in areas such as information technology and infrastructure.
99
Note 21
. Industry Segment and Geographic Data
Our business is organized into
two
segments: Water Infrastructure and Applied Water. The Water Infrastructure segment, comprising our Water Solutions and Analytics operating units, focuses on the transportation, treatment and testing of water, offering a range of products including water and wastewater pumps, treatment and testing equipment, and controls and systems. The Applied Water segment, comprising our Residential & Commercial Water and Flow Control operating units, encompasses the uses of water and focuses on the residential, commercial, industrial and agricultural markets offering a wide range of products, including pumps, valves and heat exchangers. Corporate and other consists of corporate office expenses including compensation, benefits, occupancy, depreciation, and other administrative costs, as well as charges related to certain matters, such as the Spin-off transaction and environmental matters that are managed at a corporate level and are not included in the business segments in evaluating performance or allocating resources.
The accounting policies of each segment are the same as those described in the summary of significant accounting policies (see Note 1). The following tables contain financial information for each reportable segment:
|
Year Ended December 31,
|
|||||||||||
|
(in millions)
|
2013
|
2012
|
2011
|
||||||||
|
Revenue:
|
|||||||||||
|
Water Infrastructure
|
$
|
2,457
|
|
$
|
2,425
|
|
$
|
2,416
|
|
||
|
Applied Water
|
1,444
|
|
1,424
|
|
1,444
|
|
|||||
|
Eliminations
|
(64
|
)
|
(58
|
)
|
(57
|
)
|
|||||
|
Total
|
$
|
3,837
|
|
$
|
3,791
|
|
$
|
3,803
|
|
||
|
Operating income:
|
|||||||||||
|
Water Infrastructure
|
$
|
271
|
|
$
|
342
|
|
$
|
343
|
|
||
|
Applied Water
|
167
|
|
170
|
|
160
|
|
|||||
|
Corporate and other
|
(75
|
)
|
(69
|
)
|
(108
|
)
|
|||||
|
Total operating income
|
363
|
|
443
|
|
395
|
|
|||||
|
Other non-operating income
|
(10
|
)
|
—
|
|
5
|
|
|||||
|
Interest expense
|
55
|
|
55
|
|
17
|
|
|||||
|
Income before taxes
|
$
|
298
|
|
$
|
388
|
|
$
|
383
|
|
||
|
Depreciation and amortization:
|
|||||||||||
|
Water Infrastructure
|
$
|
115
|
|
$
|
106
|
|
$
|
104
|
|
||
|
Applied Water
|
28
|
|
29
|
|
31
|
|
|||||
|
Corporate and other
|
7
|
|
7
|
|
2
|
|
|||||
|
Total
|
$
|
150
|
|
$
|
142
|
|
$
|
137
|
|
||
|
Capital expenditures:
|
|||||||||||
|
Water Infrastructure
|
$
|
76
|
|
$
|
79
|
|
$
|
91
|
|
||
|
Applied Water
|
34
|
|
27
|
|
31
|
|
|||||
|
Corporate and other
|
16
|
|
6
|
|
4
|
|
|||||
|
Total
|
$
|
126
|
|
$
|
112
|
|
$
|
126
|
|
||
100
The following table illustrates revenue by product category, net of intercompany revenue.
|
Year Ended December 31,
|
|||||||||||
|
(in millions)
|
2013
|
2012
|
2011
|
||||||||
|
Pumps, accessories, parts and service
|
$
|
3,076
|
|
$
|
3,054
|
|
$
|
3,093
|
|
||
|
Other (a)
|
761
|
|
737
|
|
710
|
|
|||||
|
Total
|
$
|
3,837
|
|
$
|
3,791
|
|
|
$
|
3,803
|
|
|
|
(a)
|
Other includes treatment equipment, analytical instrumentation, heat exchangers, valves and controls.
|
The following table contains the total assets for each reportable segment as of December 31,
2013
and
2012
.
|
|
Total Assets
|
||||||||||
|
(in millions)
|
2013
|
2012
|
2011
|
||||||||
|
Water Infrastructure
|
$
|
2,989
|
|
$
|
2,844
|
|
$
|
2,745
|
|
||
|
Applied Water
|
1,340
|
|
1,253
|
|
1,241
|
|
|||||
|
Corporate and other (a)
|
567
|
|
582
|
|
414
|
|
|||||
|
Total
|
$
|
4,896
|
|
$
|
4,679
|
|
$
|
4,400
|
|
||
|
(a)
|
Corporate and other consists of items pertaining to our corporate headquarters function, which principally consist of deferred tax assets and certain property, plant and equipment.
|
Geographical Information
Revenue is attributed to countries based upon the location of the customer. Property, Plant & Equipment is attributed to countries based upon the location of the assets.
|
|
Revenue
|
||||||||||
|
Year Ended December 31,
|
|||||||||||
|
(in millions)
|
2013
|
2012
|
2011
|
||||||||
|
United States
|
$
|
1,434
|
|
$
|
1,400
|
|
$
|
1,363
|
|
||
|
Europe
|
1,387
|
|
1,338
|
|
1,422
|
|
|||||
|
Asia Pacific
|
467
|
|
469
|
|
426
|
|
|||||
|
Other
|
549
|
|
584
|
|
592
|
|
|||||
|
Total
|
$
|
3,837
|
|
$
|
3,791
|
|
$
|
3,803
|
|
||
|
|
Property, Plant & Equipment
|
||||||||||
|
December 31,
|
|||||||||||
|
(in millions)
|
2013
|
2012
|
2011
|
||||||||
|
United States
|
$
|
186
|
|
$
|
183
|
|
$
|
178
|
|
||
|
Europe
|
225
|
|
219
|
|
209
|
|
|||||
|
Asia Pacific
|
45
|
|
65
|
|
57
|
|
|||||
|
Other
|
32
|
|
20
|
|
19
|
|
|||||
|
Total
|
$
|
488
|
|
$
|
487
|
|
$
|
463
|
|
||
101
The table below provides changes in the allowance for doubtful accounts over each period.
|
(in millions)
|
2013
|
2012
|
2011
|
||||||||
|
Balance at beginning of year
|
$
|
25
|
|
$
|
29
|
|
$
|
25
|
|
||
|
Additions charged to expense
|
8
|
|
4
|
|
11
|
|
|||||
|
Deductions/other
|
(11
|
)
|
(8
|
)
|
(7
|
)
|
|||||
|
Balance at end of year
|
$
|
22
|
|
$
|
25
|
|
$
|
29
|
|
||
The table below provides changes in the inventory valuation over each period.
|
(in millions)
|
2013
|
2012
|
2011
|
||||||||
|
Balance at beginning of year
|
$
|
38
|
|
$
|
39
|
|
$
|
33
|
|
||
|
Additions charged to cost of revenue
|
14
|
|
9
|
|
17
|
|
|||||
|
Deductions/other
|
(11
|
)
|
(10
|
)
|
(11
|
)
|
|||||
|
Balance at end of year
|
$
|
41
|
|
$
|
38
|
|
$
|
39
|
|
||
|
|
2013 Quarter Ended
|
|||||||||||||||
|
(In millions, except per share amounts)
|
Dec. 31
|
Sept. 30
|
June 30
|
Mar. 31
|
||||||||||||
|
Revenue
|
$
|
1,033
|
|
$
|
965
|
|
$
|
960
|
|
$
|
879
|
|
||||
|
Gross profit
|
410
|
|
384
|
|
371
|
|
334
|
|
||||||||
|
Operating income
|
129
|
|
98
|
|
70
|
|
66
|
|
||||||||
|
Net income
|
$
|
68
|
|
$
|
73
|
|
$
|
46
|
|
$
|
41
|
|
||||
|
Earnings per share:
|
||||||||||||||||
|
Basic
|
$
|
0.37
|
|
$
|
0.39
|
|
$
|
0.25
|
|
$
|
0.22
|
|
||||
|
Diluted
|
$
|
0.37
|
|
$
|
0.39
|
|
$
|
0.25
|
|
$
|
0.22
|
|
||||
|
2012 Quarter Ended
|
||||||||||||||||
|
(In millions, except per share amounts)
|
Dec. 31
|
Sept. 30
|
June 30
|
Mar. 31
|
||||||||||||
|
Revenue
|
$
|
969
|
|
$
|
931
|
|
$
|
966
|
|
$
|
925
|
|
||||
|
Gross profit
|
382
|
|
374
|
|
383
|
|
363
|
|
||||||||
|
Operating income
|
104
|
|
111
|
|
129
|
|
99
|
|
||||||||
|
Net income
|
$
|
73
|
|
$
|
72
|
|
$
|
89
|
|
$
|
63
|
|
||||
|
Earnings per share:
|
||||||||||||||||
|
Basic
|
$
|
0.39
|
|
$
|
0.39
|
|
$
|
0.48
|
|
$
|
0.34
|
|
||||
|
Diluted
|
$
|
0.39
|
|
$
|
0.38
|
|
$
|
0.48
|
|
$
|
0.34
|
|
||||
102
None.
Evaluation of Disclosure Controls and Procedures
Our management, with the participation of our Chief Executive Officer ("CEO") and our Chief Financial Officer ("CFO"), evaluated the effectiveness of the design and operation of our disclosure controls and procedures as of the end of the year ended
December 31, 2013
pursuant to Rule 13a-15(b) of the Securities Exchange Act of 1934 (“the Exchange Act”). Based upon that evaluation, our CEO and our CFO concluded that our disclosure controls and procedures were effective as of the year ended
December 31, 2013
to ensure that information required to be disclosed by us in the reports we file or submit under the Exchange Act is (1) recorded, processed, summarized and reported, within the time periods specified in the SEC's rules and forms and (2) accumulated and communicated to our management, including our CEO and CFO, as appropriate to allow timely decisions regarding required disclosures.
Management's Annual Report on Internal Control Over Financial Reporting
As required by the SEC's rules and regulations for the implementation of Section 404 of the Sarbanes-Oxley Act, the Company's management is responsible for establishing and maintaining adequate internal control over financial reporting as defined in Rules 13a-15(f) and 15d-15(f) under the Exchange Act. The Company's internal control over financial reporting is a process designed to provide reasonable assurance regarding the reliability of financial reporting and the preparation of financial statements for external purposes in accordance with GAAP.
The Company's management, including the CEO and CFO, conducted an assessment of the effectiveness of our internal control over financial reporting as of
December 31, 2013
based on the framework established in Internal Control - Integrated Framework issued by the Committee of Sponsoring Organization of the Treadway Commission in 1992. This assessment included an evaluation of the design of our internal control over financial reporting and testing of the operational effectiveness of those controls. Based on our assessment, the Company's management has concluded that our internal control over financial reporting was effective as of
December 31, 2013
.
The effectiveness of the Company's internal control over financial reporting as of
December 31, 2013
has been audited by Deloitte & Touche LLP, an independent registered public accounting firm, as stated in their report which appears following Item 9B of this Annual Report on Form 10-K.
Changes in Internal Control Over Financial Reporting
There were no changes in the Company's internal control over financial reporting that occurred during the quarter ended
December 31, 2013
that have materially affected, or are reasonably likely to materially affect, our internal control over financial reporting.
None
103
REPORT OF INDEPENDENT REGISTERED PUBLIC ACCOUNTING FIRM
To the Board of Directors and Stockholders of
Xylem Inc.
Rye Brook, New York
We have audited the internal control over financial reporting of Xylem Inc. and subsidiaries (the "Company") as of
December 31, 2013
, based on criteria established in
Internal Control - Integrated Framework (1992)
issued by the Committee of Sponsoring Organizations of the Treadway Commission. The Company's management is responsible for maintaining effective internal control over financial reporting and for its assessment of the effectiveness of internal control over financial reporting, included in the accompanying
Management's Annual Report on Internal Controls Over Financial Reporting
. Our responsibility is to express an opinion on the Company's internal control over financial reporting based on our audit.
We conducted our audit in accordance with the standards of the Public Company Accounting Oversight Board (United States). Those standards require that we plan and perform the audit to obtain reasonable assurance about whether effective internal control over financial reporting was maintained in all material respects. Our audit included obtaining an understanding of internal control over financial reporting, assessing the risk that a material weakness exists, testing and evaluating the design and operating effectiveness of internal control based on the assessed risk, and performing such other procedures as we considered necessary in the circumstances. We believe that our audit provides a reasonable basis for our opinion.
A company's internal control over financial reporting is a process designed by, or under the supervision of, the company's principal executive and principal financial officers, or persons performing similar functions, and effected by the company's board of directors, management, and other personnel to provide reasonable assurance regarding the reliability of financial reporting and the preparation of financial statements for external purposes in accordance with generally accepted accounting principles. A company's internal control over financial reporting includes those policies and procedures that (1) pertain to the maintenance of records that, in reasonable detail, accurately and fairly reflect the transactions and dispositions of the assets of the company; (2) provide reasonable assurance that transactions are recorded as necessary to permit preparation of financial statements in accordance with generally accepted accounting principles, and that receipts and expenditures of the company are being made only in accordance with authorizations of management and directors of the company; and (3) provide reasonable assurance regarding prevention or timely detection of unauthorized acquisition, use, or disposition of the company's assets that could have a material effect on the financial statements.
Because of the inherent limitations of internal control over financial reporting, including the possibility of collusion or improper management override of controls, material misstatements due to error or fraud may not be prevented or detected on a timely basis. Also, projections of any evaluation of the effectiveness of the internal control over financial reporting to future periods are subject to the risk that the controls may become inadequate because of changes in conditions, or that the degree of compliance with the policies or procedures may deteriorate.
In our opinion, the Company maintained, in all material respects, effective internal control over financial reporting as of
December 31, 2013
, based on the criteria established in
Internal Control - Integrated Framework (1992)
issued by the Committee of Sponsoring Organizations of the Treadway Commission.
We have also audited, in accordance with the standards of the Public Company Accounting Oversight Board (United States), the consolidated financial statements as of and for the year ended
December 31, 2013
of the Company and our report dated
February 27, 2014
expressed an unqualified opinion on those financial statements.
/s/ Deloitte & Touche LLP
Stamford, Connecticut
February 27, 2014
104
The information required by this Item is incorporated herein by reference to the information in our Definitive Proxy Statement to be filed with the SEC in connection with our
2014
Annual Meeting of Shareholders (the “
2014
Proxy Statement”) set forth under the captions “Proposal 1 - Election of Directors,” "Director Selection and Composition," "Committees of the Board of Directors -- Audit Committee" and “Section 16(a) Beneficial Ownership Reporting Compliance.”
The information called for by Item 10 with respect to executive officers is set forth in Part I of this Report under the caption “Executive Officers of the Registrant” and is incorporated by reference in this section.
We have adopted corporate governance principles and charters for each of our standing committees. The principles address director qualification standards, responsibilities, access to management and independent advisors, compensation, orientation and continuing education, management succession principles and board and committee self-evaluation. The corporate governance principles and standing committee charters are available on the Company’s website at
www.investors.xyleminc.com
. A copy of the corporate governance principles and standing committee charters is also available to any shareholder who requests a copy from the Company’s Corporate Secretary.
We have also adopted a written code of conduct which is applicable to all our directors, officers and employees, including the Company’s Chief Executive Officer and Chief Financial Officer and other executive officers identified pursuant to this Item 10. In accordance with the SEC’s rules and regulations, a copy of the code has been posted to our website and a copy of the code of conduct is also available to any shareholder who requests it. We intend to disclose any changes in our code of conduct by posting a revised version on our website at
www.xyleminc.com
.
The information required by this Item is incorporated herein by reference to the information in our
2014
Proxy Statement set forth under captions “Executive Compensation," "
2013
Non-Management Director Compensation" and “Report of the Leadership Development & Compensation Committee.”
The information required by this Item is incorporated herein by reference to the information in our
2014
Proxy Statement set forth under the captions “Stock Ownership of Directors, Executive Officers and Certain Beneficial Owners” and "Equity Compensation Plan Information."
The information required by this Item is incorporated herein by reference to the information in our
2014
Proxy Statement set forth under the caption “Information About our Board of Directors.”
The information required by this Item is incorporated herein by reference to the information in our
2014
Proxy Statement set forth under the caption “Independent Registered Public Accounting Firm Fees.”
105
|
(a)
|
(1)
|
The Index to Consolidated and Combined Financial Statements of the Registrant under Item 8 of this Report is incorporated herein by reference as the list of Financial Statements required as part of this Report.
|
|
(2)
|
Financial Statement Schedules — All financial statement schedules have been omitted because they are not applicable or the required information is shown in the financial statements or notes thereto.
|
|
|
(3)
|
Exhibits — The exhibit list in the Exhibit Index is incorporated by reference as the list of exhibits required as part of this Report.
|
|
106
SIGNATURES
Pursuant to the requirements of Section 13 or 15(d) of the Securities Exchange Act of 1934, the Registrant has duly caused this Report to be signed on its behalf by the undersigned, thereunto duly authorized.
|
XYLEM INC.
|
|
|
(Registrant)
|
|
|
/s/ John P. Connolly
|
|
|
John P. Connolly
|
|
|
Vice President, Controller and Chief Accounting Officer
|
|
|
(Principal Accounting Officer)
|
|
February 27, 2014
Pursuant to the requirements of the Securities Exchange Act of 1934, this Report has been signed below by the following persons on behalf of the Registrant and in the capacities and on the dates indicated:
|
February 27, 2014
|
|
/s/ Steven R. Loranger
|
|
|
Steven R. Loranger
|
|
|
|
President and Chief Executive Officer
|
|
|
|
(Principal Executive Officer)
|
|
|
February 27, 2014
|
|
/s/ Michael T. Speetzen
|
|
|
Michael T. Speetzen
|
|
|
|
Senior Vice President and Chief Financial Officer
|
|
|
|
(Principal Financial Officer)
|
|
|
February 27, 2014
|
|
/s/ Markos I. Tambakeras
|
|
|
Markos I. Tambakeras, Chairman
|
|
|
February 27, 2014
|
|
/s/ Curtis J. Crawford
|
|
|
Curtis J. Crawford, Director
|
|
|
February 27, 2014
|
/s/ Robert F. Friel
|
|
|
Robert F. Friel, Director
|
||
|
February 27, 2014
|
|
/s/ Victoria D. Harker
|
|
|
Victoria D. Harker, Director
|
|
|
February 27, 2014
|
|
/s/ Sten E. Jakobsson
|
|
|
Sten E. Jakobsson, Director
|
|
|
February 27, 2014
|
|
/s/ Edward J. Ludwig
|
|
|
Edward J. Ludwig, Director
|
|
|
February 27, 2014
|
|
/s/ Surya N. Mohapatra
|
|
|
Surya N. Mohapatra, Director
|
|
|
February 27, 2014
|
/s/ Jerome A. Peribere
|
|
|
Jerome A. Peribere, Director
|
||
|
February 27, 2014
|
/s/ James P. Rogers
|
|
|
James P. Rogers, Director
|
||
107
EXHIBIT INDEX
|
Exhibit
Number
|
Description
|
Location
|
|
|
(3.1
|
)
|
Second Amended and Restated Articles of Incorporation of Xylem Inc.
|
Incorporated by reference to Exhibit 3.1 of Xylem Inc.’s Form 10-Q filed on October 29, 2013 (CIK No. 131190969, File No. 1-35229).
|
|
(3.2
|
)
|
Amended and Restated By-laws of Xylem Inc.
|
Incorporated by reference to Exhibit 3.1 of Xylem Inc.’s Form 10-Q filed on October 29, 2013 (CIK No. 131190969, File No. 1-35229).
|
|
(4.1
|
)
|
Indenture, dated as of September 20, 2011, between Xylem Inc., ITT Corporation, as initial guarantor, and Union Bank, N.A., as trustee
|
Incorporated by reference to Exhibit 4.2 of ITT Corporation’s Form 8-K Current Report filed on September 21, 2011 (CIK No. 216228, File No. 1-5672).
|
|
(4.2
|
)
|
Form of Xylem Inc. 3.550% Senior Notes due 2016
|
Incorporated by reference to Exhibit 4.5 of Xylem Inc.'s Form S-4 Registration Statement filed on May 24, 2012 (CIK No. 1524472, File No. 333-181643).
|
|
(4.3
|
)
|
Form of Xylem Inc. 4.875% Senior Notes due 2021
|
Incorporated by reference to Exhibit 4.6 of Xylem Inc.'s Form S-4 Registration Statement filed on May 24, 2012 (CIK No. 1524472, File No. 333-181643).
|
|
(10.1
|
)
|
Distribution Agreement, dated as of October 25, 2011, among ITT Corporation, Exelis Inc. and Xylem Inc.
|
Incorporated by reference to Exhibit 10.1 of ITT Corporation’s Form 10-Q Quarterly Report filed on October 28, 2011 (CIK No. 216228, File No. 1-5672).
|
|
(10.2
|
)
|
Benefits and Compensation Matters Agreement, dated as of October 25, 2011, among ITT Corporation, Exelis Inc. and Xylem Inc.
|
Incorporated by reference to Exhibit 10.2 of ITT Corporation’s Form 10-Q Quarterly Report filed on October 28, 2011 (CIK No. 216228, File No. 1-5672).
|
|
(10.3
|
)
|
Tax Matters Agreement, dated as of October 25, 2011, among ITT Corporation, Exelis Inc. and Xylem Inc.
|
Incorporated by reference to Exhibit 10.3 of ITT Corporation’s Form 10-Q Quarterly Report filed on October 28, 2011 (CIK No. 216228, File No. 1-5672).
|
|
(10.4
|
)
|
Master Transition Services Agreement, dated as of October 25, 2011, among ITT Corporation, Exelis Inc. and Xylem Inc.
|
Incorporated by reference to Exhibit 10.4 of ITT Corporation’s Form 10-Q Quarterly Report filed on October 28, 2011 (CIK No. 216228, File No. 1-5672).
|
|
(10.5
|
)
|
Four-Year Competitive Advance and Revolving Credit Facility Agreement, dated as of October 25, 2011, among Xylem Inc., the Lenders Named Therein, J.P. Morgan Chase Bank, N.A., as Administrative Agent and Citibank, N.A., as Syndication Agent.
|
Incorporated by reference to Exhibit 10.5 of Xylem Inc.’s Form 10-Q Quarterly Report filed on November 11, 2011 (CIK No. 1524472, File No. 1-35229).
|
|
(10.6
|
)
|
Xylem 2011 Omnibus Incentive Plan
|
Incorporated by reference to Exhibit 4.3 of Xylem Inc.’s Registration Statement on Form S-8 filed on October 28, 2011 (CIK
No. 1524472, File No. 333-177607).
|
|
(10.7
|
)
|
Xylem 1997 Long-Term Incentive Plan
|
Incorporated by reference to Exhibit 10.7 of Xylem Inc.’s Form 10-Q Quarterly Report filed on November 11, 2011 (CIK No. 1524472, File No. 1-35229).
|
108
|
Exhibit
Number
|
Description
|
Location
|
|
|
(10.8
|
)
|
Xylem 1997 Annual Incentive Plan
|
Incorporated by reference to Exhibit 10.8 of Xylem Inc.’s Form 10-Q Quarterly Report filed on November 11, 2011 (CIK No. 1524472, File No. 1-35229).
|
|
(10.9
|
)
|
Xylem Annual Incentive Plan for Executive Officers
|
Incorporated by reference to Exhibit 10.9 of Xylem Inc.’s Form 10-Q Quarterly Report filed on November 11, 2011 (CIK No. 1524472, File No. 1-35229).
|
|
(10.10
|
)
|
Xylem Retirement Savings Plan
|
Incorporated by reference to Exhibit 10.1 of Xylem Inc.’s Form 10-Q filed on July 30, 2013 (CIK No. 1524472, File No. 1-35229).
|
|
(10.11
|
)
|
Xylem Supplemental Retirement Savings Plan
|
Incorporated by reference to Exhibit 10.11 of Xylem Inc.’s Form 10-Q Quarterly Report filed on November 11, 2011 (CIK No. 1524472, File No. 1-35229).
|
|
(10.12
|
)
|
Xylem Deferred Compensation Plan
|
Incorporated by reference to Exhibit 4.5 of Xylem Inc.’s Registration Statement on
Form S-8 filed on October 28, 2011 (CIK
No. 1524472, File No. 333-177607).
|
|
(10.13
|
)
|
Xylem Deferred Compensation Plan for
Non-Employee Directors
|
Incorporated by reference to Exhibit 10.13 of Xylem Inc.’s Form 10-Q Quarterly Report filed on November 11, 2011 (CIK No. 1524472, File No. 1-35229).
|
|
(10.14
|
)
|
Xylem Enhanced Severance Pay Plan
|
Incorporated by reference to Exhibit 10.14 of Xylem Inc.’s Form 10-Q Quarterly Report filed on November 11, 2011 (CIK No. 1524472, File No. 1-35229).
|
|
(10.15
|
)
|
Xylem Special Senior Executive Severance Pay Plan
|
Incorporated by reference to Exhibit 10.15 of Xylem Inc.’s Form 10-Q Quarterly Report filed on November 11, 2011 (CIK No. 1524472, File No. 1-35229).
|
|
(10.16
|
)
|
Xylem Senior Executive Severance Pay Plan
|
Incorporated by reference to Exhibit 10.16 of Xylem Inc.’s Form 10-Q Quarterly Report filed on November 11, 2011 (CIK No. 1524472, File No. 1-35229).
|
|
(10.17
|
)
|
Form of Xylem 2011 Omnibus Incentive Plan 2011 Non-Qualified Stock Option Award Agreement — Founders Grant
|
Incorporated by reference to Exhibit 10.17 of Xylem Inc.’s Form 10-Q Quarterly Report filed on November 11, 2011 (CIK No. 1524472, File No. 1-35229).
|
|
(10.18
|
)
|
Form of Xylem 2011 Omnibus Incentive Plan Non-Qualified Stock Option Award Agreement — General Grant
|
Incorporated by reference to Exhibit 10.18 of Xylem Inc.’s Form 10-Q Quarterly Report filed on November 11, 2011 (CIK No. 1524472, File No. 1-35229).
|
|
(10.19
|
)
|
Letter agreement dated September 8, 2013 between Steven R. Loranger and Xylem Inc.
|
Incorporated by reference to Exhibit 10.1 of Xylem Inc.'s Form 10-Q Quarterly Report filed on October 29, 2013 (CIK No. 1524472, File No. 1-35229).
|
|
(10.20
|
)
|
Form of Xylem 2011 Omnibus Incentive Plan-Performance Share Unit Agreement
|
Incorporated by reference to Exhibit 10.3 of Xylem Inc.'s Form 10-Q Quarterly Report filed on April 30, 2013 (CIK No. 1524472, File No. 1-35229).
|
109
|
Exhibit
Number
|
Description
|
Location
|
|
|
(10.21
|
)
|
Form of Xylem 2011 Omnibus Incentive Plan Restricted Stock Unit Agreement — Founders Grant
|
Incorporated by reference to Exhibit 10.21 of Xylem Inc.’s Form 10-Q Quarterly Report filed on November 11, 2011 (CIK No. 1524472, File No. 1-35229).
|
|
(10.22
|
)
|
Form of Xylem 2011 Omnibus Incentive Plan Restricted Stock Unit Agreement — General Grant
|
Incorporated by reference to Exhibit 10.22 of Xylem Inc.’s Form 10-Q Quarterly Report filed on November 11, 2011 (CIK No. 1524472, File No. 1-35229).
|
|
(10.24
|
)
|
Form of Director’s Indemnification Agreement
|
Incorporated by reference to Exhibit 10.24 of Xylem Inc.’s Form 10-Q Quarterly Report filed on November 11, 2011 (CIK No. 1524472, File No. 1-35229).
|
|
(10.25
|
)
|
Form of Xylem 2011 Omnibus Incentive Plan 2012 Restricted Stock Unit Agreement
|
Incorporated by reference to Exhibit 10.2 of Xylem Inc.'s Form 10-Q Quarterly Report filed on April 30, 2013 (CIK No. 1524472, File No. 1-35229).
|
|
(10.27
|
)
|
Form of Xylem 2011 Omnibus Incentive Plan 2012 Non-Qualified Stock Option Award Agreement
|
Incorporated by reference to Exhibit 10.1 of Xylem Inc.'s Form 10-Q Quarterly Report filed on April 30, 2013 (CIK No. 1524472, File No. 1-35229).
|
|
(10.28
|
)
|
Form of Xylem Special Senior Executive Severance Pay Plan
|
Incorporated by reference to Exhibit 10.28 of Xylem Inc.'s Form 10-Q Quarterly Report filed on May 3, 2012 (CIK No. 1524472, File No. 1-35229).
|
|
(10.29
|
)
|
Form of Xylem Enhanced Severance Pay Plan
|
Incorporated by reference to Exhibit 10.29 of Xylem Inc.'s Form 10-Q Quarterly Report filed on May 3, 2012 (CIK No. 1524472, File No. 1-35229).
|
|
(10.30
|
)
|
Research and Development Facility Agreement - Xylem Water Technologies Risk-Sharing Financing Facility First Amended and Restated Finance Contract, dated December 4, 2013, among the European Investment Bank, Xylem Holdings S.a.r.l. and Xylem International S.a.r.l., as borrowers, and Xylem Inc., as guarantor.
|
Filed herewith.
|
|
(11.0
|
)
|
Statement re computation of per share earnings
|
Information required to be presented in Exhibit 11 is provided under "Earnings Per Share" in Note 8 to the consolidated financial statements in Part II, Item 8. “Financial Statements and Supplementary Data” of this Annual Report on Form 10-K in accordance with the provisions of Financial Accounting Standards Board Accounting Standards Codification 260,
Earnings Per Share
.
|
|
(12.0
|
)
|
Statements re computation of ratios
|
Filed herewith.
|
|
(21.0
|
)
|
Subsidiaries of the Registrant
|
Filed herewith.
|
|
(23.1
|
)
|
Consent of Independent Registered Public Accounting Firm
|
Filed herewith.
|
|
(31.1
|
)
|
Certification pursuant to Rule 13a-14(a)/15d-14(a) of the Securities Exchange Act of 1934, as adopted pursuant to Section 302 of the Sarbanes-Oxley Act of 2002
|
Filed herewith.
|
|
(31.2
|
)
|
Certification pursuant to Rule 13a-14(a)/15d-14(a) of the Securities Exchange Act of 1934, as adopted pursuant to Section 302 of the Sarbanes-Oxley Act of 2002
|
Filed herewith.
|
110
|
Exhibit
Number
|
Description
|
Location
|
|
|
(32.1
|
)
|
Certification Pursuant to 18 U.S.C. Section 1350, as adopted pursuant to Section 906 of the Sarbanes-Oxley Act of 2002
|
This Exhibit is intended to be furnished in accordance with Regulation S-K Item 601(b) (32) (ii) and shall not be deemed to be filed for purposes of Section 18 of the Securities Exchange Act of 1934 or incorporated by reference into any filing under the Securities Act of 1933 or the Securities Exchange Act of 1934, except as shall be expressly set forth by specific reference.
|
|
(32.2
|
)
|
Certification Pursuant to 18 U.S.C. Section 1350, as adopted pursuant to Section 906 of the Sarbanes-Oxley Act of 2002
|
This Exhibit is intended to be furnished in accordance with Regulation S-K Item 601(b) (32) (ii) and shall not be deemed to be filed for purposes of Section 18 of the Securities Exchange Act of 1934 or incorporated by reference into any filing under the Securities Act of 1933 or the Securities Exchange Act of 1934, except as shall be expressly set forth by specific reference.
|
|
(101
|
)
|
The following materials from Xylem Inc.’s Annual Report on Form 10-K for the year ended December 31, 2013, formatted in XBRL (Extensible Business Reporting Language): (i) Combined Condensed Income Statements, (ii) Combined Condensed Statements of Comprehensive Income, (iii) Combined Condensed Balance Sheets, (iv) Combined Condensed Statements of Cash Flows and (v) Notes to Combined Condensed Financial Statements
|
Submitted electronically with this report.
|
111
TABLE OF CONTENTS
Part IItem 1A. Risk FactorsItem 1. BusinessItem 1B. Unresolved Staff CommentsItem 2. PropertiesItem 3. Legal ProceedingsItem 4. Mine Safety DisclosuresPart IIItem 5. Market For The Registrant S Common Equity, Related Stockholder Matters and Issuer Purchases Of Equity SecuritiesItem 6. Selected Financial DataItem 7. Management S Discussion and Analysis Of Financial Condition and Results Of OperationsItem 7A. Quantitative and Qualitative Disclosures About Market RiskItem 8. Financial Statements and Supplementary DataNote 1. Summary Of Significant Accounting PoliciesNote 2 . Recently Issued Accounting PronouncementsNote 3. AcquisitionsNote 4. Restructuring and Asset Impairment ChargesNote 5. Separation CostsNote 6. Other Non-operating (expense) Income, NetNote 7. Income TaxesNote 8. Earnings Per ShareNote 9. InventoriesNote 10. Property, Plant and EquipmentNote 11 . Goodwill and Other Intangible AssetsNote 12. Derivative Financial InstrumentsNote 13. Accrued and Other Current LiabilitiesNote 14 . Credit Facilities and Long-term DebtNote 15 . Postretirement Benefit PlansNote 16 . Stock-based Compensation PlansNote 17. Capital StockNote 18. Accumulated Other Comprehensive Income (loss)Note 19. Commitments and ContingenciesNote 20 . Related Party Transactions and Parent Company InvestmentNote 21 . Industry Segment and Geographic DataNote 22. Supplemental InformationNote 23. Quarterly Financial Data (unaudited)Item 9. Changes in and Disagreements with Accountants on Accounting and Financial DisclosureItem 9A. Controls and ProceduresItem 9B. Other InformationPart IIIItem 10. Directors, Executive Officers and Corporate GovernanceItem 11. Executive CompensationItem 12. Security Ownership Of Certain Beneficial Owners and Management and Related Stockholder MattersItem 13. Certain Relationships and Related Transactions, and Director IndependenceItem 14. Principal Accounting Fees and ServicesPart IVItem 15. Exhibits, Financial Statement Schedules