|
|
|
|
|
|
|
|
|
|
|
|
|
|
|
|
|
|
|
|
|
|
|
|
|
|
|
|
|
|
|
|
|
|
|
Table of Contents
Washington, D.C. 20549
|
þ
|
ANNUAL REPORT PURSUANT TO SECTION 13 OR 15(d) OF THE SECURITIES EXCHANGE ACT OF 1934 | |
| For the fiscal year ended December 31, 2009 | ||
|
or
|
||
|
o
|
TRANSITION REPORT PURSUANT TO SECTION 13 OR 15(d) OF THE SECURITIES EXCHANGE ACT OF 1934 | |
| For the transition period from to | ||
|
Delaware
|
51-0283071 | |
|
(State or other jurisdiction of
incorporation or organization) |
(I.R.S. Employer
Identification Number) |
|
|
7 Times Square Tower,
New York, New York |
10036
(Zip Code) |
|
|
(Address of principal executive
offices)
|
|
Name of Each Exchange
|
||
|
Title of Each Class
|
on Which Registered
|
|
|
Common Stock, $1.00 par value
|
New York Stock Exchange |
| Large accelerated filer þ | Accelerated filer o | Non-accelerated filer o | Smaller reporting company o |
13
Table of Contents
| • | “AIHL” are to our insurance holding company subsidiary Alleghany Insurance Holdings LLC, | |
| • | “RSUI” are to our subsidiary RSUI Group, Inc. and its subsidiaries, | |
| • | “CATA” are to our subsidiary Capitol Transamerica Corporation and its subsidiaries, and also includes the operations and results of Platte River Insurance Company, or “Platte River,” unless the context otherwise requires, | |
| • | “EDC” are to our subsidiary Employers Direct Corporation and its subsidiaries, | |
| • | “AIHL Re” are to our subsidiary AIHL Re LLC, and | |
| • | “Alleghany Properties” are to our subsidiary Alleghany Properties Holdings LLC and its subsidiaries. |
14
Table of Contents
15
Table of Contents
16
Table of Contents
17
Table of Contents
| Years Ended December 31 | ||||||||||||||||||||||||||||||||
| 2002 | 2003 | 2004 | 2005 | 2006 | 2007 | 2008 | 2009 | |||||||||||||||||||||||||
| (in millions) | ||||||||||||||||||||||||||||||||
|
Net liability as of the end of year
|
$ | 113.3 | $ | 276.0 | $ | 639.0 | $ | 952.9 | $ | 1,127.5 | $ | 1,412.9 | $ | 1,570.3 | $ | 1,573.3 | ||||||||||||||||
|
Cumulative amount of net liability paid as of:
|
||||||||||||||||||||||||||||||||
|
One year later
|
47.4 | 72.6 | 239.4 | 172.7 | 243.3 | 296.1 | 355.6 | |||||||||||||||||||||||||
|
Two years later
|
80.6 | 116.8 | 310.8 | 356.1 | 421.7 | 515.0 | ||||||||||||||||||||||||||
|
Three years later
|
100.1 | 149.6 | 365.2 | 493.2 | 529.6 | |||||||||||||||||||||||||||
|
Four years later
|
110.1 | 173.7 | 413.6 | 572.2 | ||||||||||||||||||||||||||||
|
Five years later
|
115.8 | 191.7 | 446.9 | |||||||||||||||||||||||||||||
|
Six years later
|
121.7 | 208.0 | ||||||||||||||||||||||||||||||
|
Seven years later
|
124.0 | |||||||||||||||||||||||||||||||
|
Net liability re-estimated as of:
|
||||||||||||||||||||||||||||||||
|
One year later
|
134.0 | 268.7 | 631.8 | 943.2 | 1,115.4 | 1,370.0 | 1,552.4 | |||||||||||||||||||||||||
|
Two years later
|
147.7 | 264.6 | 620.1 | 941.2 | 1,047.9 | 1,341.9 | ||||||||||||||||||||||||||
|
Three years later
|
149.0 | 268.1 | 593.3 | 899.7 | 1,012.5 | |||||||||||||||||||||||||||
|
Four years later
|
150.7 | 263.8 | 584.1 | 873.0 | ||||||||||||||||||||||||||||
|
Five years later
|
153.5 | 262.0 | 566.7 | |||||||||||||||||||||||||||||
|
Six years later
|
151.7 | 256.1 | ||||||||||||||||||||||||||||||
|
Seven years later
|
148.4 | |||||||||||||||||||||||||||||||
|
Cumulative (Deficiency) Redundancy
|
$ | (35.1 | ) | $ | 19.9 | $ | 72.3 | $ | 79.9 | $ | 115.0 | $ | 71.0 | $ | 17.9 | |||||||||||||||||
|
Gross Liability-End of Year
|
$ | 258.1 | $ | 438.0 | $ | 1,246.4 | $ | 2,571.9 | $ | 2,228.9 | $ | 2,379.7 | $ | 2,578.6 | $ | 2,521.0 | ||||||||||||||||
|
Less: Reinsurance Recoverable
|
144.8 | 162.0 | 607.4 | 1,619.0 | 1,101.4 | 966.8 | 1,008.3 | 947.7 | ||||||||||||||||||||||||
|
Net Liability-End of Year
|
$ | 113.3 | $ | 276.0 | $ | 639.0 | $ | 952.9 | $ | 1,127.5 | $ | 1,412.9 | $ | 1,570.3 | $ | 1,573.3 | ||||||||||||||||
|
Gross Re-estimated Liability-Latest
|
$ | 285.6 | $ | 430.2 | $ | 1,156.8 | $ | 2,372.8 | $ | 1,979.5 | $ | 2,223.2 | $ | 2,500.0 | $ | 2,521.0 | ||||||||||||||||
|
Re-estimated Recoverable-Latest
|
137.2 | 174.1 | 590.1 | 1,499.8 | 966.9 | 881.3 | 947.6 | 947.7 | ||||||||||||||||||||||||
|
Net Re-estimated Liability-Latest
|
$ | 148.4 | $ | 256.1 | $ | 566.7 | $ | 873.0 | $ | 1,012.6 | $ | 1,341.9 | $ | 1,552.4 | $ | 1,573.3 | ||||||||||||||||
|
Gross Cumulative (Deficiency) Redundancy
|
$ | (27.5 | ) | $ | 7.8 | $ | 89.6 | $ | 199.1 | $ | 249.5 | $ | 156.5 | $ | 78.6 | $ | – | |||||||||||||||
18
Table of Contents
| 2009 | 2008 | 2007 | ||||||||||
|
Statutory reserves
|
$ | 1,574.9 | $ | 1,573.1 | $ | 1,417.4 | ||||||
|
Reinsurance recoverables*
|
947.7 | 1,008.3 | 966.8 | |||||||||
|
Purchase accounting adjustment
|
(1.6 | ) | (2.8 | ) | (4.5 | ) | ||||||
|
GAAP reserves
|
$ | 2,521.0 | $ | 2,578.6 | $ | 2,379.7 | ||||||
| * | Reinsurance recoverables in this table include only ceded loss reserves. Amounts reflected under the caption “Reinsurance recoverables” on our consolidated balance sheets set forth in Item 8 of this Form 10-K Report also include paid loss recoverables. |
| 2009 | 2008 | 2007 | ||||||||||
|
Reserves as of January 1
|
$ | 2,578.6 | $ | 2,379.7 | $ | 2,228.9 | ||||||
|
Reserves acquired
|
— | — | 165.0 | |||||||||
|
Less: reinsurance recoverables
|
1,008.3 | 966.8 | 1,101.4 | |||||||||
|
Net reserves
|
1,570.3 | 1,412.9 | 1,292.5 | |||||||||
|
Incurred loss, net of reinsurance, related to:
|
||||||||||||
|
Current year
|
460.0 | 612.8 | 480.1 | |||||||||
|
Prior years
|
(17.9 | ) | (42.8 | ) | (31.1 | ) | ||||||
|
Total incurred loss, net of reinsurance
|
442.1 | 570.0 | 449.0 | |||||||||
|
Paid loss, net of reinsurance, related to:
|
||||||||||||
|
Current year
|
83.5 | 116.4 | 71.7 | |||||||||
|
Prior years
|
355.6 | 296.2 | 256.9 | |||||||||
|
Total paid loss, net of reinsurance
|
439.1 | 412.6 | 328.6 | |||||||||
|
Reserves, net of reinsurance recoverables, as of December 31
|
1,573.3 | 1,570.3 | 1,412.9 | |||||||||
|
Reinsurance recoverables as of December 31*
|
947.7 | 1,008.3 | 966.8 | |||||||||
|
Reserves, gross of reinsurance recoverables, as of December 31
|
$ | 2,521.0 | $ | 2,578.6 | $ | 2,379.7 | ||||||
| * | Reinsurance recoverables in this table include only ceded loss reserves. Amounts reflected under the caption “Reinsurance recoverables” on our consolidated balance sheets set forth in Item 8 of this Form 10-K Report also include paid loss recoverables. |
19
Table of Contents
| 2009 | 2008 | 2007 | ||||||||||
|
Reserves as of January 1
|
$ | 14.9 | $ | 16.7 | $ | 17.4 | ||||||
|
Losses and LAE incurred
|
0.5 | (0.3 | ) | 0.1 | ||||||||
|
Paid losses*
|
(0.3 | ) | (1.5 | ) | (0.8 | ) | ||||||
|
Reserves as of December 31
|
$ | 15.1 | $ | 14.9 | $ | 16.7 | ||||||
|
Type of reserves
|
||||||||||||
|
Case
|
$ | 1.9 | $ | 2.5 | $ | 3.7 | ||||||
|
IBNR
|
13.2 | 12.4 | 13.0 | |||||||||
|
Total
|
$ | 15.1 | $ | 14.9 | $ | 16.7 | ||||||
| * | Paid losses include commutations and legal settlements as well as regular paid losses. |
| 2009 | 2008 | 2007 | ||||||||||
|
Reserves as of January 1
|
$ | 5.5 | $ | 6.2 | $ | 6.4 | ||||||
|
Losses and LAE incurred
|
(0.4 | ) | 0.3 | (0.1 | ) | |||||||
|
Paid losses*
|
(1.3 | ) | (1.0 | ) | (0.1 | ) | ||||||
|
Reserves as of December 31
|
$ | 3.8 | $ | 5.5 | $ | 6.2 | ||||||
|
Type of reserves
|
||||||||||||
|
Case
|
$ | 0.5 | $ | 0.9 | $ | 1.4 | ||||||
|
IBNR
|
3.3 | 4.6 | 4.8 | |||||||||
|
Total
|
$ | 3.8 | $ | 5.5 | $ | 6.2 | ||||||
| * | Paid losses include commutations and legal settlements as well as regular paid losses. |
20
Table of Contents
21
Table of Contents
22
Table of Contents
23
Table of Contents
24
Table of Contents
25
Table of Contents
26
Table of Contents
27
Table of Contents
28
Table of Contents
29
Table of Contents
30
Table of Contents
31
Table of Contents
| Item 5. | Market for Registrant’s Common Equity, Related Stockholder Matters and Issuer Purchases of Equity Securities. |
| 2009 | 2008 | |||||||||||||||
|
Quarter Ended
|
High | Low | High | Low | ||||||||||||
|
March 31
|
$ | 301.47 | $ | 234.83 | $ | 396.00 | $ | 317.23 | ||||||||
|
June 30
|
277.50 | 221.74 | 372.39 | 324.32 | ||||||||||||
|
September 30
|
288.73 | 250.58 | 411.76 | 279.41 | ||||||||||||
|
December 31
|
276.52 | 247.01 | 362.75 | 177.74 | ||||||||||||
|
Approximate Dollar
|
||||||||||||||||
|
Total Number of
|
Value of Shares
|
|||||||||||||||
|
Shares Purchased as
|
that May Yet Be
|
|||||||||||||||
|
Part of Publicly
|
Purchased Under the
|
|||||||||||||||
|
Total Number of
|
Average Price
|
Announced Plans
|
Plans
|
|||||||||||||
|
Period
|
Shares Purchased | Paid per Share | or Programs(1) | or Programs | ||||||||||||
|
October 1 to October 31
|
55,774 | $ | 259.11 | 55,774 | ||||||||||||
|
November 1 to November 30
|
749 | $ | 264.90 | 749 | ||||||||||||
|
December 1 to December 31
|
29,629 | $ | 269.66 | 29,269 | ||||||||||||
|
Total
|
86,152 | $ | 262.76 | 85,792 | $ | 81,718,365 | ||||||||||
| (1) | All shares represent shares repurchased pursuant to an authorization of the Board of Directors, announced in February 2008, to repurchase shares of our common stock, at such times and at prices as management may determine advisable, up to an aggregate of $300.0 million. |
32
Table of Contents
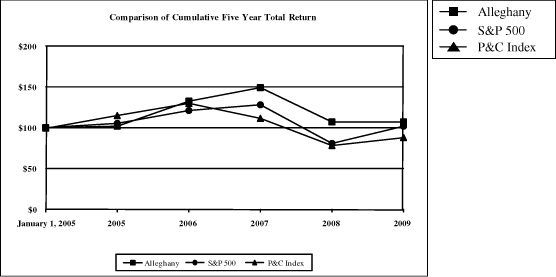
| Company/Index | 2005 | 2006 | 2007 | 2008 | 2009 | ||||||||||||||||||||
|
n
Alleghany
|
101.55 | 132.62 | 149.55 | 107.01 | 106.83 | ||||||||||||||||||||
|
=
S&P 500
|
104.91 | 121.48 | 128.16 | 80.74 | 102.11 | ||||||||||||||||||||
|
5
P&C Index
|
115.11 | 129.93 | 111.79 | 78.91 | 88.65 | ||||||||||||||||||||
33
Table of Contents
| Item 6. | Selected Financial Data. |
| Years Ended December 31, | ||||||||||||||||||||
| 2009 | 2008 | 2007 | 2006 | 2005 | ||||||||||||||||
| (in millions, except for per share and share amounts) | ||||||||||||||||||||
|
Operating Data
|
||||||||||||||||||||
|
Revenues from continuing operations
|
$ | 1,184.4 | $ | 989.1 | $ | 1,228.6 | $ | 1,060.3 | $ | 1,062.7 | ||||||||||
|
Earnings from continuing operations
|
$ | 271.0 | $ | 40.6 | $ | 287.6 | $ | 240.9 | $ | 43.9 | ||||||||||
|
Earnings from discontinued operations
|
— | 107.4 | 11.5 | 7.0 | 8.4 | |||||||||||||||
|
Net earnings
|
$ | 271.0 | $ | 148.0 | $ | 299.1 | $ | 247.9 | $ | 52.3 | ||||||||||
|
Basic earnings per share of common stock**
|
||||||||||||||||||||
|
Continuing operations
|
$ | 30.43 | $ | 2.75 | $ | 31.89 | $ | 27.40 | $ | 5.15 | ||||||||||
|
Discontinued operations
|
— | 12.67 | 1.36 | 0.83 | 0.98 | |||||||||||||||
|
Net earnings
|
$ | 30.43 | $ | 15.42 | $ | 33.25 | $ | 28.23 | $ | 6.13 | ||||||||||
|
Average number of shares of common stock**
|
8,704,268 | 8,479,863 | 8,476,152 | 8,465,844 | 8,536,073 | |||||||||||||||
| Years Ended December 31, | ||||||||||||||||||||
| 2009 | 2008 | 2007 | 2006 | 2005 | ||||||||||||||||
|
|
||||||||||||||||||||
|
Total assets
|
$ | 6,192.8 | $ | 6,181.8 | $ | 6,942.1 | $ | 6,178.7 | $ | 5,822.3 | ||||||||||
|
Debt
|
$ | – | $ | – | $ | – | $ | 80.0 | $ | 80.0 | ||||||||||
|
Common stockholders’ equity
|
$ | 2,717.5 | $ | 2,347.3 | $ | 2,484.8 | $ | 2,146.4 | $ | 1,894.4 | ||||||||||
|
Common stockholders’ equity per share of common stock**
|
$ | 306.71 | $ | 278.17 | $ | 292.73 | $ | 254.12 | $ | 221.40 | ||||||||||
| * | We sold World Minerals on July 14, 2005. World Minerals has been classified as discontinued operations for the year ended 2005. On July 18, 2007, AIHL acquired EDC. We sold Darwin on October 20, 2008. Darwin has been classified as discontinued operations for the four years ended 2008 and discontinued operations, net of minority interest expense, includes the gain on disposition in 2008. | |
| ** | Amounts have been adjusted for subsequent common stock dividends. |
34
Table of Contents
| Item 7. | Management’s Discussion and Analysis of Financial Condition and Results of Operations. |
| • | significant weather-related or other natural or human-made catastrophes and disasters; | |
| • | the cyclical nature of the property and casualty insurance industry; | |
| • | changes in market prices of our equity investments and changes in value of our debt portfolio; | |
| • | adverse loss development for events insured by our insurance operating units in either the current year or prior year; | |
| • | the long-tail and potentially volatile nature of certain casualty lines of business written by our insurance operating units; | |
| • | the cost and availability of reinsurance; | |
| • | exposure to terrorist acts; | |
| • | the willingness and ability of our insurance operating units’ reinsurers to pay reinsurance recoverables owed to our insurance operating units; | |
| • | changes in the ratings assigned to our insurance operating units; | |
| • | claims development and the process of estimating reserves; | |
| • | legal and regulatory changes; | |
| • | the uncertain nature of damage theories and loss amounts; and | |
| • | increases in the levels of risk retention by our insurance operating units. |
35
Table of Contents
| • | Reported Loss Development Method: a reported loss development pattern is calculated based on historical data, and this pattern is then used to project the latest evaluation of cumulative reported losses for each accident year to ultimate levels; |
36
Table of Contents
| • | Paid Development Method: a paid loss development pattern is calculated based on historical development data, and this pattern is then used to project the latest evaluation of cumulative paid losses for each accident year to ultimate levels; | |
| • | Expected Loss Ratio Method: expected loss ratios are applied to premiums earned, based on historical company experience, or historical insurance industry results when company experience is deemed not to be sufficient; and | |
| • | Bornhuetter-Ferguson Method: the results from the Expected Loss Ratio Method are essentially blended with either the Reported Loss Development Method or the Paid Development Method. |
| • | Expected loss ratios represent management’s expectation of losses, in relation to earned premium, at the time business is written, before any actual claims experience has emerged. This expectation is a significant determinant of the estimate of loss reserves for recently written business where there is little paid or incurred loss data to consider. Expected loss ratios are generally derived from historical loss ratios adjusted for the impact of rate changes, loss cost trends, and known changes in the type of risks underwritten. | |
| • | Rate of loss cost inflation (or deflation) represents management’s expectation of the inflation associated with the costs we may incur in the future to settle claims. Expected loss cost inflation is particularly important for claims with a substantial medical component, such as workers’ compensation. | |
| • | Reported and paid loss emergence patterns represent management’s expectation of how losses will be reported and ultimately paid in the future based on the historical emergence patterns of reported and paid losses and are derived from past experience of our insurance operating units, modified for current trends. These emergence patterns are used to project current reported or paid loss amounts to their ultimate settlement value. |
| Frequency | ||||||||||||
|
Severity
|
1.0% | 5.0% | 10.0% | |||||||||
|
1.0%
|
$ | 8.7 | $ | 26.3 | $ | 48.3 | ||||||
|
5.0%
|
$ | 26.3 | $ | 44.6 | $ | 67.4 | ||||||
|
10.0%
|
$ | 48.3 | $ | 67.4 | $ | 91.3 | ||||||
37
Table of Contents
| 2009 | 2008 | |||||||
|
RSUI:
|
||||||||
|
Net casualty reserve releases
|
$ | (38.4 | ) | $ | (43.7 | ) | ||
|
Reserve release for third quarter 2008 hurricanes
|
(9.9 | ) | — | |||||
|
Non-catastrophe property case reserve re-estimation
|
11.5 | (6.2 | ) | |||||
|
All other, net
|
1.6 | (4.8 | ) | |||||
| $ | (35.2 | ) | $ | (54.7 | ) | |||
|
CATA:
|
||||||||
|
Net insurance reserve releases
|
$ | (10.7 | ) | $ | (11.8 | ) | ||
|
EDC:
|
||||||||
|
Net workers’ compensation increase
|
$ | 26.5 | $ | 25.4 | ||||
|
All other, net
|
1.5 | (1.7 | ) | |||||
| $ | 28.0 | $ | 23.7 | |||||
|
Total incurred related to prior years
|
$ | (17.9 | ) | $ | (42.8 | ) | ||
| • | For RSUI, loss and LAE for 2009 reflect a net $38.4 million release of prior accident year casualty loss reserves, compared with a net $43.7 million release of prior accident year casualty loss reserves during 2008. Both amounts relate primarily to D&O liability, professional liability, and general liability lines of business for the 2003 through 2007 accident years and reflect favorable loss emergence, compared with loss emergence patterns assumed in earlier periods for such lines of business. Specifically, cumulative losses for such lines of business, which include both loss payments and case reserves, in respect of prior accident years were expected to be higher through December 31, 2009 than the actual cumulative losses through that date. This amount of lower cumulative losses, expressed as a percentage of carried loss and LAE reserves at the beginning of the year, was 2.9 percent. Such reduction did not impact the assumptions used in estimating RSUI’s loss and LAE liabilities for business earned in 2009. For RSUI, loss and LAE for 2009 also reflect a net $9.9 million release of prior accident year loss reserves related to 2008 third quarter Hurricanes Ike, Gustav, and Dolly. | |
| • | For CATA, loss and LAE for 2009 reflect a net $10.7 million release of prior accident year loss reserves, compared with a net $11.8 million release of prior accident year loss reserves during 2008. Both amounts relate primarily to favorable loss emergence in the casualty and surety lines of business, compared with loss emergence patterns assumed in earlier periods for such lines of business. Specifically, cumulative losses for such lines of business, which include both loss payments and case reserves, in respect of prior accident years |
38
Table of Contents
| were expected to be higher through December 31, 2009 than the actual cumulative losses through that date. This amount of lower cumulative losses, expressed as a percentage of carried loss and LAE reserves at the beginning of the year, was 2.6 percent. Such reduction did not impact the assumptions used in estimating CATA’s loss and LAE liabilities for business earned in 2009. |
| • | For EDC, workers’ compensation loss and LAE for 2009 reflect a $26.5 million increase of prior accident year workers’ compensation loss reserves, compared with a $25.4 million increase of prior accident year workers’ compensation loss reserves during 2008. Both such reserve increases primarily reflect a significant acceleration in claims emergence and higher than anticipated increases in industry-wide severity. In addition, the $26.5 million increase in 2009 also reflects the estimated impact of judicial decisions by the Workers’ Compensation Appeals Board, or “WCAB.” Such WCAB decisions related to permanent disability determinations that have materially weakened prior workers’ compensation reforms instrumental in reducing medical and disability costs in earlier years. These decisions are in the process of being appealed to the California appellate courts but will continue in effect during the appeals process. With respect to the $26.5 million increase for prior accident years, $17.7 million primarily reflected higher than expected paid losses and $8.8 million reflected the estimated impact of the WCAB decisions. Cumulative paid losses in respect of prior accident years were expected to be lower through June 30, 2009 (the date of the reserve increase) than the actual cumulative paid losses through that date. This amount of higher cumulative paid losses, expressed as a percentage of carried loss and LAE reserves at the beginning of the year, was 1.5 percent. Such increases impacted the assumptions used in estimating EDC’s loss and LAE liabilities for business earned in 2009 and 2008, causing an increase of current accident year reserves of $8.0 million and $10.5 million, respectively. Of the $8.0 million, $6.2 million primarily reflected higher than expected paid losses and the remainder reflected the estimated impact of the WCAB decisions. Although EDC believes its reserves, including the provision for the WCAB decisions, were adequate as of December 31, 2009, the WCAB decisions could materially adversely affect the number and amount of EDC’s permanent disability payments, including those on its open claims, and the related loss and LAE reserves. |
39
Table of Contents
| • | the duration of time and the relative magnitude to which fair value of the investment has been below cost; | |
| • | the financial condition and near-term prospects of the issuer of the investment; | |
| • | extraordinary events, including negative news releases and rating agency downgrades, with respect to the issuer of the investment; and | |
| • | our ability and intent to hold the investment for a period of time sufficient to allow for any anticipated recovery. |
40
Table of Contents
41
Table of Contents
42
Table of Contents
| 2009 | 2008 | 2007 | ||||||||||
| (in millions) | ||||||||||||
|
Revenues
|
||||||||||||
|
Net premiums earned
|
$ | 845.0 | $ | 948.7 | $ | 974.3 | ||||||
|
Net investment income
|
101.9 | 130.2 | 146.1 | |||||||||
|
Net realized capital gains
|
320.4 | 151.8 | 100.5 | |||||||||
|
Other than temporary impairment losses
|
(85.9 | ) | (244.0 | ) | (7.7 | ) | ||||||
|
Other income
|
3.0 | 2.4 | 15.4 | |||||||||
|
Total revenues
|
$ | 1,184.4 | $ | 989.1 | $ | 1,228.6 | ||||||
|
Costs and expenses
|
||||||||||||
|
Loss and loss adjustment expenses
|
$ | 442.1 | $ | 570.0 | $ | 449.0 | ||||||
|
Commissions, brokerage and other underwriting expenses
|
273.7 | 286.6 | 257.2 | |||||||||
|
Other operating expenses
|
45.6 | 34.9 | 55.6 | |||||||||
|
Corporate administration
|
26.9 | 35.9 | 33.0 | |||||||||
|
Interest expense
|
0.7 | 0.7 | 1.5 | |||||||||
|
Total costs and expenses
|
$ | 789.0 | $ | 928.1 | $ | 796.3 | ||||||
|
Earnings from continuing operations, before income taxes
|
$ | 395.4 | $ | 61.0 | $ | 432.3 | ||||||
|
Income taxes
|
124.4 | 20.4 | 144.7 | |||||||||
|
Earnings from continuing operations
|
$ | 271.0 | $ | 40.6 | $ | 287.6 | ||||||
|
Earnings from discontinued operations, net of tax*
|
— | 107.4 | 11.5 | |||||||||
|
Net earnings
|
$ | 271.0 | $ | 148.0 | $ | 299.1 | ||||||
|
Revenues:
|
||||||||||||
|
AIHL
|
$ | 996.9 | $ | 813.6 | $ | 1,137.8 | ||||||
|
Corporate activities**
|
187.5 | 175.5 | 90.8 | |||||||||
|
Earnings (loss) from continuing operations, before income taxes:
|
||||||||||||
|
AIHL
|
$ | 237.6 | $ | (75.1 | ) | $ | 378.8 | |||||
|
Corporate activities**
|
157.8 | 136.1 | 53.5 | |||||||||
| * | Discontinued operations consist of the operations of Darwin, net of minority interest expense and the gain on disposition in 2008. Additional information regarding the results of discontinued operations can be found in Note 2 to the Notes to the Consolidated Financial Statements set forth in Item 8 of this 10-K Report. | |
| ** | Corporate activities consist of Alleghany Properties, our investments in Homesite and ORX and corporate activities at the parent level. |
43
Table of Contents
44
Table of Contents
| RSUI | AIHL Re | CATA | EDC(1) | AIHL | ||||||||||||||||
| (in millions, except ratios) | ||||||||||||||||||||
|
2009
|
||||||||||||||||||||
|
Gross premiums written
|
$ | 1,033.4 | $ | – | $ | 174.6 | $ | 51.1 | $ | 1,259.1 | ||||||||||
|
Net premiums written
|
621.1 | – | 165.3 | 44.4 | 830.8 | |||||||||||||||
|
Net premiums earned (2)
|
$ | 633.4 | $ | – | $ | 166.7 | $ | 44.9 | $ | 845.0 | ||||||||||
|
Loss and loss adjustment expenses
|
274.3 | – | 81.6 | 86.2 | 442.1 | |||||||||||||||
|
Commission, brokerage and other underwriting expenses (3)
|
169.3 | – | 75.0 | 29.4 | 273.7 | |||||||||||||||
|
Underwriting profit (loss) (4)
|
$ | 189.8 | $ | – | $ | 10.1 | $ | (70.7 | ) | $ | 129.2 | |||||||||
|
Net investment income (2)
|
116.7 | |||||||||||||||||||
|
Net realized capital gains (2)
|
119.8 | |||||||||||||||||||
|
Other than temporary impairment losses (2)
|
(85.9 | ) | ||||||||||||||||||
|
Other income (2)
|
1.3 | |||||||||||||||||||
|
Other expenses (3)
|
43.5 | |||||||||||||||||||
|
Earnings from continuing operations, before income taxes
|
$ | 237.6 | ||||||||||||||||||
|
Loss ratio (5)
|
43.3 | % | – | 48.9 | % | 192.2 | % | 52.3 | % | |||||||||||
|
Expense ratio (6)
|
26.7 | % | – | 45.0 | % | 65.4 | % | 32.4 | % | |||||||||||
|
Combined ratio (7)
|
70.0 | % | – | 93.9 | % | 257.6 | % | 84.7 | % | |||||||||||
|
2008
|
||||||||||||||||||||
|
Gross premiums written
|
$ | 1,055.4 | $ | 0.4 | $ | 207.9 | $ | 77.0 | $ | 1,340.7 | ||||||||||
|
Net premiums written
|
650.9 | 0.1 | 177.4 | 69.8 | 898.2 | |||||||||||||||
|
Net premiums earned (2)
|
$ | 689.6 | $ | 0.2 | $ | 186.9 | $ | 72.0 | $ | 948.7 | ||||||||||
|
Loss and loss adjustment expenses
|
376.3 | – | 90.9 | 102.8 | 570.0 | |||||||||||||||
|
Commission, brokerage and other underwriting expenses (3)
|
175.7 | – | 80.8 | 30.1 | 286.6 | |||||||||||||||
|
Underwriting profit (loss) (4)
|
$ | 137.6 | $ | 0.2 | $ | 15.2 | $ | (60.9 | ) | $ | 92.1 | |||||||||
|
Net investment income (2)
|
112.6 | |||||||||||||||||||
|
Net realized capital losses (2)
|
(4.4 | ) | ||||||||||||||||||
|
Other than temporary impairment losses (2)
|
(244.0 | ) | ||||||||||||||||||
|
Other income (2)
|
0.7 | |||||||||||||||||||
|
Other expenses (3)
|
32.1 | |||||||||||||||||||
|
Losses from continuing operations, before income taxes
|
$ | (75.1 | ) | |||||||||||||||||
|
Loss ratio (5)
|
54.6 | % | – | 48.6 | % | 142.8 | % | 60.1 | % | |||||||||||
|
Expense ratio (6)
|
25.5 | % | 22.8 | % | 43.2 | % | 41.8 | % | 30.2 | % | ||||||||||
|
Combined ratio (7)
|
80.1 | % | 22.8 | % | 91.8 | % | 184.6 | % | 90.3 | % | ||||||||||
|
2007
|
||||||||||||||||||||
|
Gross premiums written
|
$ | 1,206.6 | $ | 1.1 | $ | 250.1 | $ | 49.0 | $ | 1,506.8 | ||||||||||
|
Net premiums written
|
716.1 | 2.2 | 199.1 | 45.1 | 962.5 | |||||||||||||||
|
Net premiums earned (2)
|
$ | 707.5 | $ | 24.5 | $ | 198.0 | $ | 44.3 | $ | 974.3 | ||||||||||
|
Loss and loss adjustment expenses
|
324.3 | – | 95.8 | 28.9 | 449.0 | |||||||||||||||
|
Commission, brokerage and other underwriting expenses (3)
|
163.3 | 0.1 | 82.8 | 11.0 | 257.2 | |||||||||||||||
|
Underwriting profit (4)
|
$ | 219.9 | $ | 24.4 | $ | 19.4 | $ | 4.4 | $ | 268.1 | ||||||||||
|
Net investment income (2)
|
126.5 | |||||||||||||||||||
|
Net realized capital gains (2)
|
44.2 | |||||||||||||||||||
|
Other than temporary impairment losses (2)
|
(7.7 | ) | ||||||||||||||||||
|
Other income (2)
|
0.5 | |||||||||||||||||||
|
Other expenses (3)
|
52.8 | |||||||||||||||||||
|
Earnings from continuing operations, before income taxes
|
$ | 378.8 | ||||||||||||||||||
|
Loss ratio (5)
|
45.8 | % | – | 48.4 | % | 65.1 | % | 46.1 | % | |||||||||||
|
Expense ratio (6)
|
23.1 | % | 0.7 | % | 41.8 | % | 24.8 | % | 26.4 | % | ||||||||||
|
Combined ratio (7)
|
68.9 | % | 0.7 | % | 90.2 | % | 89.9 | % | 72.5 | % | ||||||||||
| (1) | Includes the results of EDC, net of purchase accounting adjustments, commencing July 18, 2007. (See Note 4(a) to the Consolidated Financial Statements set forth in Item 8 of this Form 10-K Report). | |
| (2) | Represent components of total revenues. |
45
Table of Contents
| (3) | Commission, brokerage and other underwriting expenses represent commission and brokerage expenses and that portion of salaries, administration and other operating expenses attributable primarily to underwriting activities, whereas the remainder constitutes other expenses. | |
| (4) | Represents net premiums earned less loss and LAE and commission, brokerage and other underwriting expenses, all as determined in accordance with GAAP, and does not include net investment income and other income or net realized capital gains and other-than-temporary impairment losses. Underwriting profit does not replace net earnings determined in accordance with GAAP as a measure of profitability; rather, we believe that underwriting profit, which does not include net investment income and other income or net realized capital gains and other-than-temporary impairment losses, enhances the understanding of AIHL’s insurance operating units’ operating results by highlighting net earnings attributable to their underwriting performance. With the addition of net investment income, net realized capital gains, other-than-temporary impairment losses, other income and other expenses, reported pre-tax net earnings (a GAAP measure) may show a profit despite an underlying underwriting loss. Where underwriting losses persist over extended periods, an insurance company’s ability to continue as an ongoing concern may be at risk. Therefore, we view underwriting profit as an important measure in the overall evaluation of performance. | |
| (5) | Loss and LAE divided by net premiums earned, all as determined in accordance with GAAP. | |
| (6) | Commission, brokerage and other underwriting expenses divided by net premiums earned, all as determined in accordance with GAAP. | |
| (7) | The sum of the loss ratio and expense ratio, all as determined in accordance with GAAP, representing the percentage of each premium dollar an insurance company has to spend on losses (including LAE) and commission, brokerage and other underwriting expenses. |
46
Table of Contents
47
Table of Contents
| Years Ended December 31, | ||||||||||||
| 2009 | 2008 | 2007 | ||||||||||
| (in millions) | ||||||||||||
|
Net investment income
|
$ | 116.7 | $ | 112.6 | $ | 126.5 | ||||||
|
Net realized capital gains
|
$ | 132.1 | * | $ | 44.3 | * | $ | 44.2 | ||||
|
Other than temporary impairment losses
|
$ | (85.9 | ) | $ | (244.0 | ) | $ | (7.7 | ) | |||
| * | Excludes non-cash impairment charges in 2009 and 2008 related to the intangible assets associated with our acquisition of EDC which were classified as a net realized capital loss in our consolidated statements of earnings (see Note 4(a) to the Notes to the Consolidated Financial Statements set forth in Item 8 of this Form 10-K Report). |
48
Table of Contents
|
Pre-Tax
|
After-Tax
|
|||||||||||||||||||
|
Net
|
Net
|
After-
|
||||||||||||||||||
|
Average
|
Investment
|
Investment
|
Effective
|
Tax
|
||||||||||||||||
|
Year
|
Investments (1) | Income (2) | Income (3) | Yield(4) | Yield(5) | |||||||||||||||
|
2009
|
$ | 2,858.4 | $ | 104.7 | $ | 83.9 | 3.7 | % | 2.9 | % | ||||||||||
|
2008
|
$ | 2,564.5 | $ | 112.0 | $ | 86.3 | 4.4 | % | 3.4 | % | ||||||||||
|
2007
|
$ | 2,293.0 | $ | 119.1 | $ | 90.8 | 5.2 | % | 4.0 | % | ||||||||||
| (1) | Average of amortized cost of debt securities portfolio at beginning and end of period. | |
| (2) | After investment expenses, excluding net realized gains and other-than-temporary impairment losses. | |
| (3) | Pre-tax net investment income less income taxes. | |
| (4) | Pre-tax net investment income for the period divided by average investments for the same period. | |
| (5) | After-tax net investment income for the period divided by average investments for the same period. |
| Years Ended December 31, | ||||||||||||
| 2009 | 2008 | 2007 | ||||||||||
|
Net investment income
|
$ | (14.8 | ) | $ | 17.6 | $ | 19.6 | |||||
|
Net realized capital gains
|
200.6 | 156.2 | 56.2 | |||||||||
|
Other than temporary impairment losses
|
– | – | – | |||||||||
|
Other income
|
1.7 | 1.7 | 15.0 | |||||||||
|
Total revenues
|
$ | 187.5 | $ | 175.5 | $ | 90.8 | ||||||
|
Corporate administration and other expenses
|
29.1 | 38.7 | 35.9 | |||||||||
|
Interest expense
|
0.6 | 0.7 | 1.4 | |||||||||
|
Earnings from continuing operations, before income taxes
|
$ | 157.8 | $ | 136.1 | $ | 53.5 | ||||||
49
Table of Contents
|
Workers’
|
||||||||||||||||||||||||||||
| Property | Casualty(1) | CMP(2) | Surety | Comp(3) | All Other(4) | Total | ||||||||||||||||||||||
| (dollars in millions) | ||||||||||||||||||||||||||||
|
2009
|
||||||||||||||||||||||||||||
|
Gross loss and LAE reserves
|
$ | 249.1 | $ | 1,902.4 | $ | 63.6 | $ | 18.0 | $ | 245.9 | $ | 42.0 | $ | 2,521.0 | ||||||||||||||
|
Reinsurance recoverables on unpaid losses
|
(104.5 | ) | (799.5 | ) | (0.2 | ) | (0.1 | ) | (20.2 | ) | (23.2 | ) | (947.7 | ) | ||||||||||||||
|
Net loss and LAE reserves
|
$ | 144.6 | $ | 1,102.9 | $ | 63.4 | $ | 17.9 | $ | 225.7 | $ | 18.8 | $ | 1,573.3 | ||||||||||||||
|
2008
|
||||||||||||||||||||||||||||
|
Gross loss and LAE reserves
|
$ | 365.9 | $ | 1,836.6 | $ | 75.8 | $ | 21.5 | $ | 227.4 | $ | 51.4 | $ | 2,578.6 | ||||||||||||||
|
Reinsurance recoverables on unpaid losses
|
(153.5 | ) | (811.6 | ) | (0.3 | ) | (0.2 | ) | (12.2 | ) | (30.5 | ) | (1,008.3 | ) | ||||||||||||||
|
Net loss and LAE reserves
|
$ | 212.4 | $ | 1,025.0 | $ | 75.5 | $ | 21.3 | $ | 215.2 | $ | 20.9 | $ | 1,570.3 | ||||||||||||||
|
2007
|
||||||||||||||||||||||||||||
|
Gross loss and LAE reserves
|
$ | 332.1 | $ | 1,683.2 | $ | 85.0 | $ | 20.6 | $ | 187.4 | $ | 71.4 | $ | 2,379.7 | ||||||||||||||
|
Reinsurance recoverables on unpaid losses
|
(126.4 | ) | (783.8 | ) | (1.1 | ) | (0.3 | ) | (8.8 | ) | (46.4 | ) | (966.8 | ) | ||||||||||||||
|
Net loss and LAE reserves
|
$ | 205.7 | $ | 899.4 | $ | 83.9 | $ | 20.3 | $ | 178.6 | $ | 25.0 | $ | 1,412.9 | ||||||||||||||
| (1) | Primarily consists of umbrella/excess, D&O liability, professional liability, and general liability. | |
| (2) | Commercial multiple peril. | |
| (3) | Workers’ compensation amounts include EDC, net of purchase accounting adjustments (see Note 4(a) to the Notes to the Consolidated Financial Statements set forth in Item 8 of this Form 10-K Report). Such adjustments |
50
Table of Contents
| include a minor reduction of gross and net loss and LAE for acquisition date discounting, as required under purchase accounting. Workers’ compensation amounts also include minor balances from CATA. | ||
| (4) | Primarily consists of loss and LAE reserves for terminated lines of business and loss reserves acquired in connection with prior acquisitions for which the sellers provided loss reserve guarantees. The loss and LAE reserves are ceded 100 percent to the sellers. Additional information regarding the loss reserve guarantees can be found in Note 5(b) to the Notes to the Consolidated Financial Statements set forth in Item 8 of this 10-K Report. |
51
Table of Contents
|
Reinsurer(1)
|
Rating(2) | Dollar Amount | Percentage | |||||||||
|
Swiss Re
|
A (Excellent | ) | $ | 174.3 | 17.9 | % | ||||||
|
The Chubb Corporation
|
A++ (Superior | ) | 105.8 | 10.8 | % | |||||||
|
Platinum Underwriters Holdings, Ltd.
|
A (Excellent | ) | 97.1 | 9.9 | % | |||||||
|
All other reinsurers
|
599.0 | 61.4 | % | |||||||||
|
Total
|
$ | 976.2 | 100.0 | % | ||||||||
| (1) | Reinsurance recoverables reflect amounts due from one or more reinsurance subsidiaries of the listed reinsurer. | |
| (2) | Represents the A.M. Best rating for the applicable reinsurance subsidiary or subsidiaries from which the reinsurance recoverable is due. |
52
Table of Contents
53
Table of Contents
|
More than
|
More than
|
|||||||||||||||||||
|
1 Year
|
3 Years
|
|||||||||||||||||||
|
Within
|
but Within
|
but Within
|
More than
|
|||||||||||||||||
|
Contractual Obligations
|
Total | 1 Year | 3 Years | 5 Years | 5 Years | |||||||||||||||
|
Operating lease obligations
|
$ | 88.5 | $ | 9.4 | $ | 19.0 | $ | 19.5 | $ | 40.6 | ||||||||||
|
Investments
|
2.6 | 2.6 | – | – | – | |||||||||||||||
|
Other long-term liabilities reflected on our consolidated
balance sheet under GAAP*
|
116.1 | 20.3 | 25.7 | 50.1 | 20.0 | |||||||||||||||
|
Losses and LAE
|
2,521.0 | 634.1 | 876.9 | 480.3 | 529.7 | |||||||||||||||
|
Total
|
$ | 2,728.2 | $ | 666.4 | $ | 921.6 | $ | 549.9 | $ | 590.3 | ||||||||||
| * | Other long-term liabilities primarily reflect employee pension obligations, certain retired executive pension obligations, and obligations under certain incentive compensation plans. |
54
Table of Contents
| • | the occurrence of several significant catastrophic events in a relatively short period of time; | |
| • | the sale of investments into a depressed marketplace to fund these paid losses; |
55
Table of Contents
| • | the uncollectibility of reinsurance recoverables on these paid losses; | |
| • | the significant decrease in the value of collateral supporting reinsurance recoverables; or | |
| • | a significant reduction in our net premium collections. |
| December 31, 2009 | December 31, 2008 | |||||||||||||||
|
Carrying
|
Fair
|
Carrying
|
Fair
|
|||||||||||||
| Value | Value | Value | Value | |||||||||||||
|
Assets
|
||||||||||||||||
|
Investments (excluding equity method investments)*
|
$ | 4,211.6 | $ | 4,211.6 | $ | 4,057.7 | $ | 4,057.7 | ||||||||
| * | For purposes of this table, investments include available-for-sale securities as well as investments in partnerships carried at fair value that are included in other invested assets. Investments exclude our investments in Homesite, ORX and partnerships that are accounted for under the equity method which are included in other invested assets. The fair value of short-term investments approximates amortized cost. The fair value of all other categories of investments is discussed below. |
| • | “Level 1” — Valuations are based on unadjusted quoted prices in active markets for identical, unrestricted assets. Since valuations are based on quoted prices that are readily and regularly available in an active market, valuation of these assets does not involve any meaningful degree of judgment. An active market is defined as a market where transactions for the financial instrument occur with sufficient frequency and volume to provide pricing information on an ongoing basis. Our Level 1 assets generally include publicly traded common stocks and debt securities issued directly by the U.S. Government, where our valuations are based on quoted market prices. | |
| • | “Level 2” — Valuations are based on quoted market prices where such markets are not deemed to be sufficiently “active.” In such circumstances, additional valuation metrics will be used which involve direct or indirect observable market inputs. Our Level 2 assets generally include preferred stocks and debt securities other than debt issued directly by the U.S. Government. Substantially all of the determinations of value in this category are based on a single quote from third-party dealers and pricing services. As we generally do not make any adjustments thereto, such quote typically constitutes the sole input in our determination of the fair value of these types of securities. In developing a quote, such third parties will use the terms of the |
56
Table of Contents
| security and market-based inputs. Terms of the security include coupon, maturity date, and any special provisions that may, for example, enable the investor, at its election, to redeem the security prior to its scheduled maturity date. Market-based inputs include the level of interest rates applicable to comparable securities in the market place and current credit rating(s) of the security. Such quotes are generally non-binding. |
| • | “Level 3” — Valuations are based on inputs that are unobservable and significant to the overall fair value measurement. Valuation under Level 3 generally involves a significant degree of judgment on our part. Our Level 3 assets are primarily limited to partnership investments. Net asset value quotes from the third-party general partner of the entity in which such investment is held, which will often be based on unobservable market inputs, constitute the primary input in our determination of the fair value of such assets. |
| Level 1 | Level 2 | Level 3 | Total | |||||||||||||
|
As of December 31, 2009
|
||||||||||||||||
|
Equity securities:
|
||||||||||||||||
|
Common stock
|
$ | 624.5 | $ | — | $ | — | $ | 624.5 | ||||||||
|
Preferred stock
|
— | — | — | — | ||||||||||||
|
Debt securities:
|
||||||||||||||||
|
U.S. Government obligations
|
638.4 | — | — | 638.4 | ||||||||||||
|
Mortgage and asset-backed securities*
|
— | 958.8 | — | 958.8 | ||||||||||||
|
States, municipalities, political subdivisions bonds
|
— | 1,234.0 | — | 1,234.0 | ||||||||||||
|
Foreign bonds
|
— | 144.3 | — | 144.3 | ||||||||||||
|
Corporate bonds and other
|
— | 313.5 | — | 313.5 | ||||||||||||
| 638.4 | 2,650.6 | — | 3,289.0 | |||||||||||||
|
Short-term investments
|
75.2 | 187.7 | — | 262.9 | ||||||||||||
|
Other invested assets**
|
— | — | 35.2 | 35.2 | ||||||||||||
|
Investments (excluding equity method investments)
|
$ | 1,338.1 | $ | 2,838.3 | $ | 35.2 | $ | 4,211.6 | ||||||||
57
Table of Contents
| Level 1 | Level 2 | Level 3 | Total | |||||||||||||
|
As of December 31, 2008
|
||||||||||||||||
|
Equity securities:
|
||||||||||||||||
|
Common stock
|
$ | 619.8 | $ | — | $ | — | $ | 619.8 | ||||||||
|
Preferred stock
|
— | 9.7 | — | 9.7 | ||||||||||||
|
Debt securities:
|
||||||||||||||||
|
U.S. Government obligations
|
266.3 | 20.3 | — | 286.6 | ||||||||||||
|
Mortgage and asset-backed securities*
|
— | 653.8 | 0.7 | 654.5 | ||||||||||||
|
States, municipalities, political subdivisions bonds
|
— | 1,434.1 | — | 1,434.1 | ||||||||||||
|
Foreign bonds
|
— | 177.3 | — | 177.3 | ||||||||||||
|
Corporate bonds and other
|
— | 207.5 | — | 207.5 | ||||||||||||
| 266.3 | 2,493.0 | 0.7 | 2,760.0 | |||||||||||||
|
Short-term investments
|
175.9 | 460.3 | — | 636.2 | ||||||||||||
|
Other invested assets**
|
— | — | 32.0 | 32.0 | ||||||||||||
|
Investments (excluding equity method investments)
|
$ | 1,062.0 | $ | 2,963.0 | $ | 32.7 | $ | 4,057.7 | ||||||||
| * | Consists primarily of residential mortgage-backed securities. | |
| ** | The carrying value of partnership investments of $35.2 million increased by $3.2 million from the December 31, 2008 carrying value of $32.0 million, due primarily to an increase in estimated fair value during the period. |
|
Type of Underlying Collateral
|
Fair Value | Average Rating | ||||
|
RMBS: guaranteed by FNMA or FHLMC (1)
|
$ | 89.2 | Aaa / AAA | |||
|
RMBS: guaranteed by GNMA (2)
|
520.3 | Aaa / AAA | ||||
|
RMBS: Alt A (3)
|
20.5 | A1 / A+ | ||||
|
RMBS:
Sub-prime
(3)
|
2.9 | Aaa/AAA | ||||
|
RMBS: Prime (3) and other non-RMBS (4)
|
325.9 | Aaa/AAA | ||||
|
Total
|
$ | 958.8 | Aaa / AAA | |||
| (1) | “FNMA” refers to the Federal National Mortgage Association, and “FHLMC” refers to the Federal Home Loan Mortgage Corporation. | |
| (2) | “GNMA” refers to the Government National Mortgage Association. | |
| (3) | As defined by Standard & Poor’s. | |
| (4) | In addition to RMBS Prime, includes commercial mortgage-backed securities and other asset-backed securities. |
|
Gross
|
Gross
|
Weighted
|
||||||||||
|
Type of Underlying
|
Unrealized
|
Unrealized
|
Average
|
|||||||||
|
Collateral
|
Gains | Losses | Life | |||||||||
|
Alt-A
|
$ | 0.1 | $ | 1.3 | 4.5 years | |||||||
|
Sub-prime
|
$ | – | $ | 0.5 | 4.2 years | |||||||
58
Table of Contents
|
% of Debt Securities
|
||||||||
| Portfolio | ||||||||
| As rated | As rated if uninsured | |||||||
|
Aaa /AAA
|
63.2 | % | 63.4 | % | ||||
|
Aa / AA
|
23.0 | % | 20.7 | % | ||||
|
A / A
|
10.3 | % | 12.4 | % | ||||
|
Baa / BBB
|
2.5 | % | 2.4 | % | ||||
|
Below Baa / BBB
|
1.0 | % | 1.0 | % | ||||
|
Not rated
|
– | % | 0.1 | % | ||||
| 100.0 | % | 100.0 | % | |||||
|
General
|
Special
|
Total
|
||||||||||
| Obligation | Revenue | Fair Value | ||||||||||
|
Texas
|
$ | 72.8 | $ | 16.1 | $ | 88.9 | ||||||
|
Massachusetts
|
8.8 | 58.4 | 67.2 | |||||||||
|
Illinois
|
43.5 | 17.1 | 60.6 | |||||||||
|
New York
|
4.3 | 51.6 | 55.9 | |||||||||
|
Washington
|
44.2 | 11.0 | 55.2 | |||||||||
|
All other
|
353.1 | 317.3 | 670.4 | |||||||||
| $ | 526.7 | $ | 471.5 | $ | 998.2 | |||||||
|
Advance refunded / escrowed to maturity bonds
|
235.8 | |||||||||||
|
Total municipal bond portfolio
|
$ | 1,234.0 | ||||||||||
59
Table of Contents
60
Table of Contents
61
Table of Contents
| Item 7A. | Quantitative and Qualitative Disclosures about Market Risk. |
|
Estimated Fair Value
|
Hypothetical Percentage
|
|||||||||||||
|
Estimated
|
Hypothetical
|
after Hypothetical
|
Increase (Decrease) in
|
|||||||||||
|
As of December 31,
|
Fair Value | Price Change | Change in Prices | Stockholders’ Equity | ||||||||||
|
2009
|
$ | 624.5 | 20% Increase | $ | 749.4 | 2.9 | % | |||||||
| 20% decrease | $ | 499.6 | (2.9 | )% | ||||||||||
|
2008
|
$ | 629.5 | 20% Increase | $ | 755.4 | 2.9 | % | |||||||
| 20% decrease | $ | 503.6 | (2.9 | )% | ||||||||||
| Interest rate shifts | -300 | -200 | -100 | 0 | 100 | 200 | 300 | ||||||||||||||||||||||||||||
|
Debt securities, fair value
|
$3,605.7 | $3,499.8 | $3,398.2 | $3,289.0 | $3,172.3 | $3,057.1 | $2,947.6 | ||||||||||||||||||||||||||||
|
Estimated change in fair value
|
$316.7 | $210.8 | $109.2 | – | $(116.7 | ) | $(231.9 | ) | $(341.4 | ) | |||||||||||||||||||||||||
| Interest rate shifts | -300 | -200 | -100 | 0 | 100 | 200 | 300 | ||||||||||||||||||||||||||||
|
Debt securities, fair value
|
$3,036.6 | $2,954.3 | $2,861.0 | $2,760.0 | $2,659.6 | $2,561.8 | $2,466.9 | ||||||||||||||||||||||||||||
|
Estimated change in fair value
|
$276.6 | $194.3 | $101.0 | – | $(100.4 | ) | $(198.2 | ) | $(293.1 | ) | |||||||||||||||||||||||||
62
Table of Contents
63
Table of Contents
|
Description
|
Page | |||
| 65 | ||||
| 66 | ||||
| 67 | ||||
| 68 | ||||
| 69 | ||||
| 109 | ||||
64
Table of Contents
Consolidated Balance Sheets
| December 31, | ||||||||
| 2009 | 2008 | |||||||
|
(in thousands, except
|
||||||||
| share amounts) | ||||||||
|
Assets
|
||||||||
|
Investments
|
||||||||
|
Available-for-sale
securities at fair value:
|
||||||||
|
Equity securities (cost: 2009 – $530,945;
2008 – $463,207)
|
$ | 624,546 | $ | 629,518 | ||||
|
Debt securities (amortized cost: 2009 – $3,235,595;
2008 – $2,781,829)
|
3,289,013 | 2,760,019 | ||||||
|
Short-term investments
|
262,903 | 636,197 | ||||||
| 4,176,462 | 4,025,734 | |||||||
|
Other invested assets
|
238,227 | 250,407 | ||||||
|
Total investments
|
4,414,689 | 4,276,141 | ||||||
|
Cash
|
32,526 | 18,125 | ||||||
|
Premium balances receivable
|
145,992 | 154,022 | ||||||
|
Reinsurance recoverables
|
976,172 | 1,056,438 | ||||||
|
Ceded unearned premium reserves
|
160,713 | 185,402 | ||||||
|
Deferred acquisition costs
|
71,098 | 71,753 | ||||||
|
Property and equipment at cost, net of accumulated depreciation
and amortization
|
20,097 | 23,310 | ||||||
|
Goodwill and other intangibles, net of amortization
|
145,667 | 151,223 | ||||||
|
Current taxes receivable
|
— | 14,338 | ||||||
|
Net deferred tax assets
|
124,266 | 130,293 | ||||||
|
Other assets
|
101,550 | 100,783 | ||||||
| $ | 6,192,770 | $ | 6,181,828 | |||||
|
Liabilities and Stockholders’ Equity
|
||||||||
|
Losses and loss adjustment expenses
|
$ | 2,520,979 | $ | 2,578,590 | ||||
|
Unearned premiums
|
573,906 | 614,067 | ||||||
|
Reinsurance payable
|
51,795 | 53,541 | ||||||
|
Current taxes payable
|
3,827 | — | ||||||
|
Other liabilities
|
324,742 | 288,941 | ||||||
|
Total liabilities
|
3,475,249 | 3,535,139 | ||||||
|
Preferred stock
|
||||||||
|
(shares authorized: 2009 – none; 2008 –
1,132,000; shares issued and outstanding: 2009 – none;
2008 – 1,131,619)
|
— | 299,429 | ||||||
|
Common stock
|
||||||||
|
(shares authorized: 2009 and 2008 – 22,000,000; issued
and outstanding 2009 – 9,118,367; 2008 –
8,516,270)
|
9,118 | 8,349 | ||||||
|
Contributed capital
|
921,225 | 742,863 | ||||||
|
Accumulated other comprehensive income
|
94,045 | 87,249 | ||||||
|
Treasury stock, at cost (2009 – 258,013 shares;
2008 – 76,513 shares)
|
(66,325 | ) | (24,290 | ) | ||||
|
Retained earnings
|
1,759,458 | 1,533,089 | ||||||
|
Total stockholders’ equity
|
2,717,521 | 2,646,689 | ||||||
| $ | 6,192,770 | $ | 6,181,828 | |||||
65
Table of Contents
| Years Ended December 31, | ||||||||||||
| 2009 | 2008 | 2007 | ||||||||||
| (in thousands, except per share amounts) | ||||||||||||
|
Revenues
|
||||||||||||
|
Net premiums earned
|
$ | 845,015 | $ | 948,652 | $ | 974,321 | ||||||
|
Net investment income
|
101,949 | 130,184 | 146,082 | |||||||||
|
Net realized capital gains
|
320,389 | 151,713 | 100,425 | |||||||||
|
Other than temporary impairment losses
|
(85,916 | ) | (243,881 | ) | (7,659 | ) | ||||||
|
Other income
|
2,955 | 2,432 | 15,427 | |||||||||
|
Total revenues
|
1,184,392 | 989,100 | 1,228,596 | |||||||||
|
Costs and expenses
|
||||||||||||
|
Loss and loss adjustment expenses
|
442,104 | 570,019 | 449,052 | |||||||||
|
Commissions, brokerage and other underwriting expenses
|
273,722 | 286,573 | 257,198 | |||||||||
|
Other operating expenses
|
45,615 | 34,861 | 55,604 | |||||||||
|
Corporate administration
|
26,938 | 35,895 | 32,987 | |||||||||
|
Interest expense
|
633 | 700 | 1,476 | |||||||||
|
Total costs and expenses
|
789,012 | 928,048 | 796,317 | |||||||||
|
Earnings from continuing operations, before income taxes
|
395,380 | 61,052 | 432,279 | |||||||||
|
Income taxes
|
124,381 | 20,485 | 144,737 | |||||||||
|
Earnings from continuing operations
|
270,999 | 40,567 | 287,542 | |||||||||
|
Discontinued operations
|
||||||||||||
|
Operations (including a gain on disposal of $141,688 in 2008)
|
— | 164,193 | 24,976 | |||||||||
|
Income taxes (including tax on the gain on disposal of $49,591
in 2008)
|
— | 56,789 | 13,448 | |||||||||
|
Earnings from discontinued operations, net of tax
|
— | 107,404 | 11,528 | |||||||||
|
Net earnings
|
$ | 270,999 | $ | 147,971 | $ | 299,070 | ||||||
|
Changes in other comprehensive income
|
||||||||||||
|
Change in unrealized (losses) gains, net of deferred taxes of
$90,590, $(145,368), and $60,778 for 2009, 2008 and 2007,
respectively
|
$ | 168,239 | $ | (269,969 | ) | $ | 112,874 | |||||
|
Less: reclassification for net realized capital gains and other
than temporary impairment losses, net of taxes of $86,386,
$(15,198) and $32,458 for 2009, 2008 and 2007, respectively
|
(160,432 | ) | 28,225 | (60,280 | ) | |||||||
|
Other
|
(1,011 | ) | 361 | 167 | ||||||||
|
Comprehensive income
|
$ | 277,795 | $ | (93,412 | ) | $ | 351,831 | |||||
|
Net earnings
|
$ | 270,999 | $ | 147,971 | $ | 299,070 | ||||||
|
Preferred dividends
|
6,158 | 17,218 | 17,223 | |||||||||
|
Net earnings available to common stockholders
|
$ | 264,841 | $ | 130,753 | $ | 281,847 | ||||||
|
Basic earnings per share of common stock: *
|
||||||||||||
|
Continuing operations
|
$ | 30.43 | $ | 2.75 | $ | 31.89 | ||||||
|
Discontinued operations
|
— | 12.67 | 1.36 | |||||||||
|
Basic earning per share
|
$ | 30.43 | $ | 15.42 | $ | 33.25 | ||||||
|
Diluted earnings per share of common stock: *
|
||||||||||||
|
Continuing operations
|
$ | 29.66 | $ | 2.75 | $ | 30.25 | ||||||
|
Discontinued operations
|
— | 12.67 | 1.20 | |||||||||
|
Diluted earnings per share
|
$ | 29.66 | $ | 15.42 | $ | 31.45 | ||||||
| * | Amounts reflect subsequent common stock dividends. |
66
Table of Contents
Consolidated Statements of Changes in Stockholders’ Equity
| Three Years Ended December 31, 2009 | ||||||||||||||||||||||||||||
|
Accumulated
|
||||||||||||||||||||||||||||
|
Other
|
Total
|
|||||||||||||||||||||||||||
|
Preferred
|
Common
|
Contributed
|
Comprehensive
|
Treasury
|
Retained
|
Stockholders’
|
||||||||||||||||||||||
| Stock | Stock | Capital | Income | Stock | Earnings | Equity | ||||||||||||||||||||||
| (in thousands, except share amounts) | ||||||||||||||||||||||||||||
|
Balance at December 31, 2006
|
||||||||||||||||||||||||||||
|
(8,446,465* shares of common stock issued; none in treasury)
|
$ | 299,527 | $ | 7,959 | $ | 627,215 | $ | 275,871 | $ | — | $ | 1,235,392 | $ | 2,445,964 | ||||||||||||||
|
Add (deduct):
|
||||||||||||||||||||||||||||
|
Net earnings
|
— | — | — | — | — | 299,070 | 299,070 | |||||||||||||||||||||
|
Other comprehensive loss, net of tax:
|
||||||||||||||||||||||||||||
|
Retirement plans
|
— | — | — | 167 | — | — | 167 | |||||||||||||||||||||
|
Change in unrealized appreciation of investments, net
|
— | — | — | 52,594 | — | — | 52,594 | |||||||||||||||||||||
|
Comprehensive income
|
— | — | — | 52,761 | — | 299,070 | 351,831 | |||||||||||||||||||||
|
Dividends paid
|
— | 159 | 58,315 | — | — | (75,840 | ) | (17,366 | ) | |||||||||||||||||||
|
Stock based compensation
|
— | — | 1,144 | — | — | — | 1,144 | |||||||||||||||||||||
|
Other, net
|
(47 | ) | 41 | 2,761 | — | — | (1 | ) | 2,754 | |||||||||||||||||||
|
Balance at December 31, 2007
|
||||||||||||||||||||||||||||
|
(8,488,795* shares of common stock issued; none in treasury)
|
299,480 | 8,159 | 689,435 | 328,632 | — | 1,458,621 | 2,784,327 | |||||||||||||||||||||
|
Add (deduct):
|
||||||||||||||||||||||||||||
|
Net earnings
|
— | — | — | — | — | 147,971 | 147,971 | |||||||||||||||||||||
|
Other comprehensive loss, net of tax:
|
||||||||||||||||||||||||||||
|
Retirement plans
|
— | — | — | 361 | — | — | 361 | |||||||||||||||||||||
|
Change in unrealized appreciation of investments, net
|
— | — | — | (241,744 | ) | — | — | (241,744 | ) | |||||||||||||||||||
|
Comprehensive income
|
— | — | — | (241,383 | ) | — | 147,971 | (93,412 | ) | |||||||||||||||||||
|
Dividends paid
|
— | 163 | 55,988 | — | — | (73,501 | ) | (17,350 | ) | |||||||||||||||||||
|
Stock based compensation
|
— | — | 2,941 | — | — | — | 2,941 | |||||||||||||||||||||
|
Treasury stock purchase
|
— | — | — | — | (24,290 | ) | — | (24,290 | ) | |||||||||||||||||||
|
Adjust gain on sale of subsidiary stock
|
— | — | (9,473 | ) | — | — | — | (9,473 | ) | |||||||||||||||||||
|
Other, net
|
(51 | ) | 27 | 3,972 | — | — | (2 | ) | 3,946 | |||||||||||||||||||
|
Balance at December 31, 2008
|
||||||||||||||||||||||||||||
|
(8,516,270* shares of common stock issued; 76,513 in treasury)
|
299,429 | 8,349 | 742,863 | 87,249 | (24,290 | ) | 1,533,089 | 2,646,689 | ||||||||||||||||||||
|
Add (deduct):
|
||||||||||||||||||||||||||||
|
Net earnings
|
— | — | — | — | — | 270,999 | 270,999 | |||||||||||||||||||||
|
Other comprehensive loss, net of tax:
|
||||||||||||||||||||||||||||
|
Retirement plans
|
— | — | — | (1,011 | ) | — | — | (1,011 | ) | |||||||||||||||||||
|
Change in unrealized appreciation of investments, net
|
— | — | — | 7,807 | — | — | 7,807 | |||||||||||||||||||||
|
Comprehensive income
|
— | — | — | 6,796 | — | 270,999 | 277,795 | |||||||||||||||||||||
|
Dividends paid
|
— | 72 | 11,246 | — | 26,629 | (44,630 | ) | (6,683 | ) | |||||||||||||||||||
|
Stock based compensation
|
— | — | 1,186 | — | — | — | 1,186 | |||||||||||||||||||||
|
Treasury stock purchase
|
— | — | — | — | (75,856 | ) | — | (75,856 | ) | |||||||||||||||||||
|
Preferred stock repurchase
|
(117,218 | ) | — | — | — | — | — | (117,218 | ) | |||||||||||||||||||
|
Conversion of preferred stock
|
(182,211 | ) | 698 | 181,513 | — | — | — | — | ||||||||||||||||||||
|
Other, net
|
— | (1 | ) | (15,583 | ) | — | 7,192 | — | (8,392 | ) | ||||||||||||||||||
|
Balance at December 31, 2009
(9,118,367 shares
of common stock issued; 258,013 in treasury)
|
$ | — | $ | 9,118 | $ | 921,225 | $ | 94,045 | $ | (66,325 | ) | $ | 1,759,458 | $ | 2,717,521 | |||||||||||||
| * | Amounts reflect subsequent common stock dividends. |
67
Table of Contents
| Years Ended December 31, | ||||||||||||
| 2009 | 2008 | 2007 | ||||||||||
| (in thousands) | ||||||||||||
|
Cash flows from operating activities
|
||||||||||||
|
Net earnings
|
$ | 270,999 | $ | 147,971 | $ | 299,070 | ||||||
|
Earnings from discontinued operations, net
|
— | 107,404 | 11,528 | |||||||||
|
Earnings from continuing operations
|
270,999 | 40,567 | 287,542 | |||||||||
|
Adjustments to reconcile earnings from continuing operations to
net cash provided by operating activities:
|
||||||||||||
|
Depreciation and amortization
|
32,358 | 25,674 | 16,275 | |||||||||
|
Net realized capital (gains) losses
|
(320,389 | ) | (151,713 | ) | (100,425 | ) | ||||||
|
Other than temporary impairment losses
|
85,916 | 243,881 | 7,659 | |||||||||
|
(Increase) decrease in other assets
|
1,255 | (37,117 | ) | (2,515 | ) | |||||||
|
(Increase) decrease in reinsurance receivable, net of
reinsurance payable
|
78,520 | (41,604 | ) | 116,257 | ||||||||
|
(Increase) decrease in premium balances receivable
|
8,030 | 17,671 | 27,318 | |||||||||
|
(Increase) decrease in ceded unearned premium reserves
|
24,689 | 35,801 | 90,098 | |||||||||
|
(Increase) decrease in deferred acquisition costs
|
655 | 3,870 | (8,286 | ) | ||||||||
|
Increase (decrease) in other liabilities and current taxes
|
59,164 | (24,928 | ) | 46,224 | ||||||||
|
Increase (decrease) in unearned premiums
|
(40,161 | ) | (86,955 | ) | (102,873 | ) | ||||||
|
Increase (decrease) in losses and loss adjustment expenses
|
(57,611 | ) | 198,889 | (25,469 | ) | |||||||
|
Net adjustments
|
(127,574 | ) | 183,469 | 64,263 | ||||||||
|
Net cash provided by operating activities from continuing
operations
|
143,425 | 224,036 | 351,805 | |||||||||
|
Net cash provided by operating activities from discontinued
operations
|
— | 106,510 | 127,355 | |||||||||
|
Net cash provided by operating activities
|
143,425 | 330,546 | 479,160 | |||||||||
|
Cash flows from investing activities
|
||||||||||||
|
Purchase of investments
|
(2,332,932 | ) | (1,564,024 | ) | (1,336,433 | ) | ||||||
|
Sales of investments
|
1,725,742 | 1,149,434 | 824,305 | |||||||||
|
Maturities of investments
|
311,868 | 325,970 | 284,666 | |||||||||
|
Purchases of property and equipment
|
(5,539 | ) | (9,760 | ) | (4,884 | ) | ||||||
|
Net change in short-term investments
|
373,442 | (320,111 | ) | 79,974 | ||||||||
|
Other, net
|
(913 | ) | 3,700 | 4,640 | ||||||||
|
Acquisition of majority- and minority-owned companies, net of
cash acquired
|
— | (50,816 | ) | (186,743 | ) | |||||||
|
Net cash provided by investing activities from continuing
operations
|
71,668 | (465,607 | ) | (334,475 | ) | |||||||
|
Net cash provided by investing activities from discontinued
operations
|
— | 151,607 | (152,076 | ) | ||||||||
|
Net cash (used in) provided by investing activities
|
71,668 | (314,000 | ) | (486,551 | ) | |||||||
|
Cash flows from financing activities
|
||||||||||||
|
Treasury stock acquisitions
|
(75,856 | ) | (25,068 | ) | — | |||||||
|
Convertible preferred stock acquisition
|
(117,358 | ) | — | — | ||||||||
|
Principal payments on long-term debt
|
— | — | (80,000 | ) | ||||||||
|
Proceeds from repayment of note receivable
|
— | — | 91,536 | |||||||||
|
Convertible preferred stock dividends paid
|
(7,456 | ) | (17,350 | ) | (17,367 | ) | ||||||
|
Tax benefit on stock based compensation
|
312 | 2,330 | 1,063 | |||||||||
|
Other, net
|
(334 | ) | 2,133 | 3,626 | ||||||||
|
Net cash provided by (used in) financing activities from
continuing operations
|
(200,692 | ) | (37,955 | ) | (1,142 | ) | ||||||
|
Net cash provided by (used in) financing activities from
discontinued operations
|
— | (5,000 | ) | 5,316 | ||||||||
|
Net cash provided by (used in) financing activities
|
(200,692 | ) | (42,955 | ) | 4,174 | |||||||
|
Cash flows of discontinued operations
|
||||||||||||
|
Operating activities
|
— | (106,510 | ) | (127,355 | ) | |||||||
|
Investing activities
|
— | 88,398 | 152,076 | |||||||||
|
Financing activities
|
— | 5,000 | (5,316 | ) | ||||||||
|
Net cash provided by (used in) discontinued operations
|
— | (13,112 | ) | 19,405 | ||||||||
|
Net cash provided by (used in) continuing operations
|
14,401 | (39,521 | ) | 16,188 | ||||||||
|
Cash at beginning of period
|
18,125 | 57,646 | 41,458 | |||||||||
|
Cash at end of period
|
$ | 32,526 | $ | 18,125 | $ | 57,646 | ||||||
|
Supplemental disclosures of cash flow information
|
||||||||||||
|
Cash paid during the period for:
|
||||||||||||
|
Interest
|
$ | — | $ | 200 | $ | 505 | ||||||
|
Income taxes paid (refunds received)
|
$ | 105,478 | $ | 179,984 | $ | 191,680 | ||||||
68
Table of Contents
Notes to Consolidated Financial Statements
| 1. | Summary of Significant Accounting Principles |
| (a) | Principles of Financial Statement Presentation |
| (b) | Investments |
69
Table of Contents
| 1. | Summary of Significant Accounting Principles, continued |
| (c) | Derivative Financial Instruments |
| (d) | Cash |
| (e) | Premiums and Unearned Premiums |
| (f) | Reinsurance Recoverables |
70
Table of Contents
| 1. | Summary of Significant Accounting Principles, continued |
| (g) | Deferred Acquisition Costs |
| (h) | Property and Equipment |
| (i) | Goodwill and Other Intangible Assets |
71
Table of Contents
| 1. | Summary of Significant Accounting Principles, continued |
| (j) | Income Taxes |
| (k) | Loss Reserves |
| (l) | Revenue Recognition for Land Sales |
| (m) | Earnings Per Share of Common Stock |
| (n) | Stock-Based Compensation Plans |
72
Table of Contents
| 1. | Summary of Significant Accounting Principles, continued |
| 2009 | 2008 | 2007 | ||||||||||
|
Expected volatility
|
23 | % | 19 | % | 18 | % | ||||||
|
Expected dividends
|
— | — | — | |||||||||
|
Expected term (in years)
|
9 | 10 | 8-10 | |||||||||
|
Risk-free rate
|
3.2 | % | 3.8 | % | 5.2 | % | ||||||
| (o) | Reclassification |
| (p) | Recent Accounting Standards |
73
Table of Contents
| 1. | Summary of Significant Accounting Principles, continued |
74
Table of Contents
| 1. | Summary of Significant Accounting Principles, continued |
| (q) | Statutory Accounting Practices |
| 2. | Discontinued Operations |
75
Table of Contents
| 2. | Discontinued Operations, continued |
|
January 1, 2008
|
||||||||
|
Through
|
||||||||
|
October 19,
|
Year Ended
|
|||||||
| 2008 | December 31, 2007 | |||||||
|
Revenues
|
||||||||
|
Net premiums earned
|
$ | 170.9 | $ | 180.9 | ||||
|
Investment and all other income
|
20.7 | 22.6 | ||||||
| 191.6 | 203.5 | |||||||
|
Costs and expenses
|
||||||||
|
Loss and loss adjustment expenses
|
67.6 | 101.3 | ||||||
|
Commissions, brokerage and other underwriting expenses
|
65.2 | 50.9 | ||||||
|
All other operating expenses
|
17.9 | 5.9 | ||||||
| 150.7 | 158.1 | |||||||
|
Earnings before income taxes and minority interest
|
40.9 | 45.4 | ||||||
|
Income taxes
|
11.0 | 13.2 | ||||||
|
Earnings before minority interest
|
29.9 | 32.2 | ||||||
|
Minority interest*
|
14.6 | 20.7 | ||||||
|
Net earnings
|
$ | 15.3 | $ | 11.5 | ||||
| * | Represents the portion of Darwin’s earnings that is attributable to common stockholders other than Alleghany, as well as parent capital gains taxes incurred. These expense accruals were made at the AIHL level. |
76
Table of Contents
| 3. | Investments |
|
Amortized
|
Gross
|
Gross
|
||||||||||||||
|
Cost
|
Unrealized
|
Unrealized
|
Fair
|
|||||||||||||
| or Cost | Gains | Losses | Value | |||||||||||||
|
2009
|
||||||||||||||||
|
Consolidated
|
||||||||||||||||
|
Equity securities:
|
||||||||||||||||
|
Common stock
|
$ | 530.9 | $ | 99.4 | $ | (5.8 | ) | $ | 624.5 | |||||||
|
Preferred stock
|
— | — | — | — | ||||||||||||
|
Debt securities:
|
||||||||||||||||
|
U.S. Government obligations
|
634.8 | 5.1 | (1.5 | ) | 638.4 | |||||||||||
|
Mortgage and asset-backed securities*
|
955.8 | 16.5 | (13.5 | ) | 958.8 | |||||||||||
|
States, municipalities, political subdivisions
|
1,202.2 | 35.0 | (3.2 | ) | 1,234.0 | |||||||||||
|
Foreign bonds
|
137.8 | 6.5 | — | 144.3 | ||||||||||||
|
Corporate bonds and other
|
305.0 | 8.9 | (0.4 | ) | 313.5 | |||||||||||
| 3,235.6 | 72.0 | (18.6 | ) | 3,289.0 | ||||||||||||
|
Short-term investments
|
262.9 | — | — | 262.9 | ||||||||||||
| $ | 4,029.4 | $ | 171.4 | $ | (24.4 | ) | $ | 4,176.4 | ||||||||
|
Industry Segment
|
||||||||||||||||
|
AIHL insurance group
|
$ | 3,744.7 | $ | 167.0 | $ | (23.3 | ) | $ | 3,888.4 | |||||||
|
Corporate activities
|
284.7 | 4.4 | (1.1 | ) | 288.0 | |||||||||||
| $ | 4,029.4 | $ | 171.4 | $ | (24.4 | ) | $ | 4,176.4 | ||||||||
77
Table of Contents
| 3. | Investments, continued |
|
Amortized
|
Gross
|
Gross
|
||||||||||||||
|
Cost
|
Unrealized
|
Unrealized
|
Fair
|
|||||||||||||
| or Cost | Gains | Losses | Value | |||||||||||||
|
2008
|
||||||||||||||||
|
Consolidated
|
||||||||||||||||
|
Equity securities:
|
||||||||||||||||
|
Common stock
|
$ | 453.5 | $ | 215.0 | $ | (48.7 | ) | $ | 619.8 | |||||||
|
Preferred stock
|
9.7 | — | — | 9.7 | ||||||||||||
|
Debt securities:
|
||||||||||||||||
|
U.S. Government obligations
|
274.7 | 11.9 | — | 286.6 | ||||||||||||
|
Mortgage and asset-backed securities*
|
707.7 | 10.1 | (63.3 | ) | 654.5 | |||||||||||
|
States, municipalities, political subdivisions
|
1,421.8 | 23.4 | (11.1 | ) | 1,434.1 | |||||||||||
|
Foreign bonds
|
172.5 | 6.6 | (1.8 | ) | 177.3 | |||||||||||
|
Corporate bonds and other
|
205.1 | 4.1 | (1.7 | ) | 207.5 | |||||||||||
| 2,781.8 | 56.1 | (77.9 | ) | 2,760.0 | ||||||||||||
|
Short-term investments
|
636.2 | — | — | 636.2 | ||||||||||||
| $ | 3,881.2 | $ | 271.1 | $ | (126.6 | ) | $ | 4,025.7 | ||||||||
|
Industry Segment
|
||||||||||||||||
|
AIHL insurance group
|
$ | 3,624.0 | $ | 79.2 | $ | (125.9 | ) | $ | 3,577.3 | |||||||
|
Corporate activities
|
257.2 | 191.9 | (0.7 | ) | 448.4 | |||||||||||
| 3,881.2 | $ | 271.1 | $ | (126.6 | ) | $ | 4,025.7 | |||||||||
| * | Consists primarily of residential mortgage-backed securities. |
|
Amortized
|
Fair
|
|||||||
| Cost | Value | |||||||
|
Short-term investments due in one year or less
|
$ | 262.9 | $ | 262.9 | ||||
|
Mortgage and asset-backed securities
|
955.8 | 958.8 | ||||||
|
Debt securities
|
||||||||
|
One year or less
|
285.7 | 288.8 | ||||||
|
Over one through five years
|
1,039.7 | 1,062.6 | ||||||
|
Over five through ten years
|
448.8 | 464.1 | ||||||
|
Over ten years
|
505.6 | 514.7 | ||||||
|
Equity securities
|
530.9 | 624.5 | ||||||
| $ | 4,029.4 | $ | 4,176.4 | |||||
78
Table of Contents
| 3. | Investments, continued |
79
Table of Contents
| 3. | Investments, continued |
|
Gross
|
||||||||
|
Fair
|
Unrealized
|
|||||||
| Value | Losses | |||||||
|
2009
|
||||||||
|
Debt securities
|
||||||||
|
U.S. Government obligations
|
||||||||
|
Less than 12 months
|
$ | 225.5 | $ | 1.5 | ||||
|
More than 12 months
|
— | — | ||||||
|
Mortgage & asset-backed securities
|
||||||||
|
Less than 12 months
|
18.6 | 0.7 | ||||||
|
More than 12 months
|
149.2 | 12.8 | ||||||
|
States, municipalities & political subdivisions
bonds
|
||||||||
|
Less than 12 months
|
98.1 | 2.5 | ||||||
|
More than 12 months
|
16.1 | 0.7 | ||||||
|
Foreign bonds
|
||||||||
|
Less than 12 months
|
1.0 | — | ||||||
|
More than 12 months
|
— | — | ||||||
|
Corporate bonds and other
|
||||||||
|
Less than 12 months
|
50.7 | 0.4 | ||||||
|
More than 12 months
|
1.8 | — | ||||||
|
Total debt securities
|
||||||||
|
Less than 12 months
|
393.9 | 5.1 | ||||||
|
More than 12 months
|
167.1 | 13.5 | ||||||
|
Equity securities — Common Stock
|
||||||||
|
Less than 12 months
|
105.0 | 5.8 | ||||||
|
More than 12 months
|
— | — | ||||||
|
Equity securities — Preferred Stock
|
||||||||
|
Less than 12 months
|
— | — | ||||||
|
More than 12 months
|
— | — | ||||||
|
Total temporarily impaired securities
|
||||||||
|
Less than 12 months
|
498.9 | 10.9 | ||||||
|
More than 12 months
|
167.1 | 13.5 | ||||||
|
Total
|
$ | 666.0 | $ | 24.4 | ||||
80
Table of Contents
| 3. | Investments, continued |
|
Gross
|
||||||||
|
Fair
|
Unrealized
|
|||||||
| Value | Losses | |||||||
|
2008
|
||||||||
|
Debt securities
|
||||||||
|
U.S. Government obligations
|
||||||||
|
Less than 12 months
|
$ | — | $ | — | ||||
|
More than 12 months
|
— | — | ||||||
|
Mortgage & asset-backed securities
|
||||||||
|
Less than 12 months
|
311.9 | 46.1 | ||||||
|
More than 12 months
|
57.0 | 17.2 | ||||||
|
States, municipalities & political subdivisions
bonds
|
||||||||
|
Less than 12 months
|
380.1 | 8.6 | ||||||
|
More than 12 months
|
20.9 | 2.5 | ||||||
|
Foreign bonds
|
||||||||
|
Less than 12 months
|
54.9 | 1.8 | ||||||
|
More than 12 months
|
— | — | ||||||
|
Corporate bonds and other
|
||||||||
|
Less than 12 months
|
39.8 | 1.1 | ||||||
|
More than 12 months
|
11.4 | 0.6 | ||||||
|
Total debt securities
|
||||||||
|
Less than 12 months
|
786.7 | 57.6 | ||||||
|
More than 12 months
|
89.3 | 20.3 | ||||||
|
Equity securities — Common Stock
|
||||||||
|
Less than 12 months
|
151.5 | 48.7 | ||||||
|
More than 12 months
|
— | — | ||||||
|
Equity securities — Preferred Stock
|
||||||||
|
Less than 12 months
|
— | — | ||||||
|
More than 12 months
|
— | — | ||||||
|
Total temporarily impaired securities
|
||||||||
|
Less than 12 months
|
938.2 | 106.3 | ||||||
|
More than 12 months
|
89.3 | 20.3 | ||||||
|
Total
|
$ | 1,027.5 | $ | 126.6 | ||||
81
Table of Contents
| 3. | Investments, continued |
| 2009 | 2008 | 2007 | ||||||||||
|
Interest income
|
$ | 113.7 | $ | 122.2 | $ | 135.1 | ||||||
|
Dividend income
|
15.2 | 20.1 | 17.5 | |||||||||
|
Investment expenses
|
(7.2 | ) | (4.7 | ) | (6.3 | ) | ||||||
|
Equity in (losses) earnings of Homesite, net of purchase
accounting adjustments
|
(1.1 | ) | 0.3 | 4.0 | ||||||||
|
Other investment (loss) income
|
(18.7 | )* | (7.7 | ) | (4.2 | ) | ||||||
| $ | 101.9 | $ | 130.2 | $ | 146.1 | |||||||
| * | Reflects $21.9 million of losses related to Alleghany’s investment in ORX, net of purchase accounting adjustments, due primarily to the asset impairment charges incurred as of December 31, 2008, but finalized and recorded in 2009, arising from relatively low energy prices as of December 31, 2008. |
| 4. | Acquisitions |
| (a) | EDC |
|
Available-for-sale
securities
|
$ | 257.5 | ||
|
Goodwill
|
48.7 | * | ||
|
Other intangible assets
|
13.9 | ** | ||
|
All other assets
|
81.1 | |||
|
Total assets assumed
|
$ | 401.2 | ||
|
Liabilities assumed (primarily losses and loss adjustment
expenses)
|
203.1 | |||
|
Net assets acquired
|
$ | 198.1 | ||
| * | In connection with impairment testing of goodwill and other intangible assets as of December 31, 2008, Alleghany determined that the $48.7 million of goodwill associated with Alleghany’s acquisition of EDC was impaired. As a result, as of December 31, 2008, Alleghany recorded a non-cash charge of $48.7 million, which is classified as a net realized capital loss in the consolidated statement of earnings and represents the entire EDC goodwill balance at such date. The estimation of EDC’s fair value was based primarily on observing the stock |
82
Table of Contents
| 4. | Acquisitions, continued |
| market-based valuations of other publicly-traded insurance carriers. The factors that contributed to Alleghany’s determination that the EDC goodwill was impaired include the recent unfavorable conditions in the U.S. economy and California workers’ compensation insurance market, combined with EDC’s poor results during 2008. There was no resulting impact to Alleghany’s tax balances as a result of this charge. | ||
| ** | In June 2009, EDC determined that it was unable to write business at rates it deemed adequate due to the current state of the California workers’ compensation market. As a result, EDC ceased soliciting new or renewal business on a direct basis commencing August 1, 2009 and took corresponding expense reduction steps, including staff reductions, in light of such determination. As a result of EDC’s determination to cease writing business on a direct basis and certain other factors, on June 30, 2009, EDC recorded a pre-tax, non-cash impairment charge of $11.2 million in the 2009 second quarter, which is classified as a net realized capital loss in Alleghany’s consolidated statement of earnings. The $11.2 million charge represents the entire carrying value of EDC’s trade names (originally determined to have indefinite useful lives), renewal rights, distribution rights, and database development, net of accumulated amortization. In addition, immaterial accruals were established related to terminated employee severance payments and other charges. During the 2009 third quarter, EDC sold the renewal rights of its directly placed workers’ compensation insurance policies and certain other assets and rights to an independent insurance brokerage. |
| (b) | Homesite |
| (c) | ORX |
83
Table of Contents
| 4. | Acquisitions, continued |
| (d) | Goodwill and Intangible Assets |
| 2009 | 2008 | |||||||
|
AIHL insurance group — Goodwill
|
$ | 48.1 | $ | 45.1 | ||||
|
AIHL insurance group — Intangible assets
|
||||||||
|
Agency relationships
|
$ | 16.8 | $ | 11.5 | ||||
|
State insurance licenses
|
25.8 | 26.1 | ||||||
|
Trade name
|
35.5 | 39.2 | ||||||
|
Brokerage and reinsurance relationships
|
19.2 | 21.4 | ||||||
|
Renewal and distribution rights
|
0.3 | 3.3 | ||||||
|
Other
|
— | 4.6 | ||||||
| $ | 97.6 | $ | 106.1 | |||||
| 5. | Reinsurance |
| (a) | AIHL Reinsurance Recoverable |
| 2009 | 2008 | |||||||
|
Reinsurance recoverables on paid losses
|
$ | 28.5 | $ | 48.1 | ||||
|
Ceded outstanding losses and loss adjustment expenses
|
947.7 | 1,008.3 | ||||||
|
Reinsurance recoverables
|
$ | 976.2 | $ | 1,056.4 | ||||
|
Reinsurer(1)
|
Rating(2) | Dollar Amount | Percentage | |||||||||
|
Swiss Reinsurance Company
|
A (Excellent | ) | $ | 174.3 | 17.9 | % | ||||||
|
The Chubb Corporation
|
A++ (Superior | ) | 105.8 | 10.8 | % | |||||||
|
Platinum Underwriters Holdings, Ltd.
|
A (Excellent | ) | 97.1 | 9.9 | % | |||||||
|
All other reinsurers
|
599.0 | 61.4 | % | |||||||||
|
Total
|
$ | 976.2 | 100.0 | % | ||||||||
84
Table of Contents
| 5. | Reinsurance, continued |
| (1) | Reinsurance recoverables reflect amounts due from one or more reinsurance subsidiaries of the listed reinsurer. | |
| (2) | Represents the A.M. Best rating for the applicable reinsurance subsidiary or subsidiaries from which the reinsurance recoverable is due. |
| (b) | Prior Year Acquisitions |
85
Table of Contents
| 5. | Reinsurance, continued |
| (c) | AIHL Premium Activity |
| Written | Earned | |||||||
|
2009
|
||||||||
|
Premiums direct
|
$ | 1,238.8 | $ | 1,278.9 | ||||
|
Premiums assumed
|
$ | 20.3 | $ | 19.1 | ||||
|
Premiums ceded
|
$ | 428.3 | $ | 453.0 | ||||
|
2008
|
||||||||
|
Premiums direct
|
$ | 1,324.2 | $ | 1,409.7 | ||||
|
Premiums assumed
|
$ | 16.5 | $ | 17.2 | ||||
|
Premiums ceded
|
$ | 442.5 | $ | 478.2 | ||||
|
2007
|
||||||||
|
Premiums direct
|
$ | 1,488.9 | $ | 1,580.1 | ||||
|
Premiums assumed
|
$ | 17.9 | $ | 19.3 | ||||
|
Premiums ceded
|
$ | 544.3 | $ | 625.1 | ||||
| (d) | RSUI |
86
Table of Contents
| 5. | Reinsurance, continued |
| (e) | CATA |
| (f) | EDC |
| 6. | Liability for Losses and Loss Adjustment Expenses |
| 2009 | 2008 | 2007 | ||||||||||
|
Reserves as of January 1
|
$ | 2,578.6 | $ | 2,379.7 | $ | 2,228.9 | ||||||
|
Reserves acquired
|
— | — | 165.0 | |||||||||
|
Less: reinsurance recoverables
|
1,008.3 | 966.8 | 1,101.4 | |||||||||
|
Net reserves
|
1,570.3 | 1,412.9 | 1,292.5 | |||||||||
|
Incurred loss, net of reinsurance, related to:
|
||||||||||||
|
Current year
|
460.0 | 612.8 | 480.1 | |||||||||
|
Prior years
|
(17.9 | ) | (42.8 | ) | (31.1 | ) | ||||||
|
Total incurred loss, net of reinsurance
|
442.1 | 570.0 | 449.0 | |||||||||
|
Paid loss, net of reinsurance, related to:
|
||||||||||||
|
Current year
|
83.5 | 116.4 | 71.7 | |||||||||
|
Prior years
|
355.6 | 296.2 | 256.9 | |||||||||
|
Total paid loss, net of reinsurance
|
439.1 | 412.6 | 328.6 | |||||||||
|
Reserves, net of reinsurance recoverables, as of December 31
|
1,573.3 | 1,570.3 | 1,412.9 | |||||||||
|
Reinsurance recoverables, as of December 31*
|
947.7 | 1,008.3 | 966.8 | |||||||||
|
Reserves, gross of reinsurance recoverables, as of December 31
|
$ | 2,521.0 | $ | 2,578.6 | $ | 2,379.7 | ||||||
| * | Reinsurance recoverables in this table include only ceded loss reserves. Amounts reflected under the caption “Reinsurance recoverables” on Alleghany’s consolidated balance sheets also include paid loss recoverables. |
87
Table of Contents
| 6. | Liability for Losses and Loss Adjustment Expenses, continued |
| 2009 | 2008 | |||||||
|
RSUI:
|
||||||||
|
Net casualty reserve releases
|
$ | (38.4 | ) | $ | (43.7 | ) | ||
|
Reserve release for third quarter 2008 hurricanes
|
(9.9 | ) | — | |||||
|
Non-catastrophe property case reserve re-estimation
|
11.5 | (6.2 | ) | |||||
|
All other, net
|
1.6 | (4.8 | ) | |||||
| $ | (35.2 | ) | $ | (54.7 | ) | |||
|
CATA:
|
||||||||
|
Net insurance reserve releases
|
$ | (10.7 | ) | $ | (11.8 | ) | ||
|
EDC:
|
||||||||
|
Net workers’ compensation increase
|
$ | 26.5 | $ | 25.4 | ||||
|
All other, net
|
1.5 | (1.7 | ) | |||||
| $ | 28.0 | $ | 23.7 | |||||
|
Total incurred related to prior years
|
$ | (17.9 | ) | $ | (42.8 | ) | ||
| • | For RSUI, loss and loss adjustment expenses for 2009 reflect a net $38.4 million release of prior accident year casualty loss reserves, compared with a net $43.7 million release of prior accident year casualty loss reserves during 2008. Both amounts relate primarily to D&O liability, professional liability, and general |
88
Table of Contents
| 6. | Liability for Losses and Loss Adjustment Expenses, continued |
| liability lines of business for the 2003 through 2007 accident years and reflects favorable loss emergence, compared with loss emergence patterns assumed in earlier periods for such lines of business. Specifically, cumulative losses for such lines of business, which include both loss payments and case reserves, in respect of prior accident years were expected to be higher through December 31, 2009 than the actual cumulative losses through that date. This amount of lower cumulative losses, expressed as a percentage of carried loss and loss adjustment expense reserves at the beginning of the year, was 2.9 percent. Such reduction did not impact the assumptions used in estimating RSUI’s loss and loss adjustment expense liabilities for business earned in 2009. For RSUI, loss and loss adjustment expenses for 2009 also reflect a net $9.9 million release of prior accident year loss reserves related to 2008 third quarter Hurricanes Ike, Gustav and Dolly. |
| • | For CATA, loss and loss adjustment expenses for 2009 reflect a net $10.7 million release of prior accident year loss reserves, compared with a net $11.8 million release of prior accident year loss reserves during 2008. Both amounts relate primarily to favorable loss emergence in the casualty and surety lines of business, compared with loss emergence patterns assumed in earlier periods for such lines of business. Specifically, cumulative losses for such lines of business, which include both loss payments and case reserves, in respect of prior accident years were expected to be higher through December 31, 2009 than the actual cumulative losses through that date. This amount of lower cumulative losses, expressed as a percentage of carried loss and loss adjustment expense reserves at the beginning of the year, was 2.6 percent. Such reduction did not impact the assumptions used in estimating CATA’s loss and loss adjustment expense liabilities for business earned in 2009. | |
| • | For EDC, workers’ compensation loss and loss adjustment expenses for 2009 reflect a $26.5 million increase of prior accident year workers’ compensation loss reserves, compared with a $25.4 million increase of prior accident year workers’ compensation loss reserves during 2008. Both such reserve increases primarily reflect a significant acceleration in claims emergence and higher than anticipated increases in industry-wide severity. In addition, the $26.5 million increase in 2009 also reflects the estimated impact of the judicial decisions by the Workers’ Compensation Appeals Board, or “WCAB.” Such WCAB decisions related to permanent disability determinations that have materially weakened prior workers’ compensation reforms instrumental in reducing medical and disability costs in earlier years. These decisions are in the process of being appealed to the California appellate courts but will continue in effect during the appeals process. With respect to the $26.5 million increase for prior accident years, $17.7 million primarily reflected higher than expected paid losses and $8.8 million reflected the estimated impact of the WCAB decisions. Cumulative paid losses in respect of prior accident years were expected to be lower through June 30, 2009 (the date of the reserve increase) than the actual cumulative paid losses through that date. This amount of higher cumulative paid losses, expressed as a percentage of carried loss and loss adjustment expense reserves at the beginning of the year, was 1.5 percent. Such increases impacted the assumptions used in estimating EDC’s loss and loss adjustment expense liabilities for business earned in 2009 and 2008, causing an increase of current accident year reserves of $8.0 million and $10.5 million, respectively. Of the $8.0 million, $6.2 million primarily reflected higher than expected paid losses and the remainder reflected the estimated impact of the WCAB decisions |
| 7. | Credit Agreement |
89
Table of Contents
| 8. | Income Taxes |
|
State and
|
||||||||||||
| Federal | Foreign | Total | ||||||||||
|
2009
|
||||||||||||
|
Current
|
$ | 123.3 | $ | 2.4 | $ | 125.7 | ||||||
|
Deferred
|
(1.1 | ) | (0.2 | ) | (1.3 | ) | ||||||
| $ | 122.2 | $ | 2.2 | $ | 124.4 | |||||||
|
2008
|
||||||||||||
|
Current
|
$ | 84.3 | $ | 1.7 | $ | 86.0 | ||||||
|
Deferred
|
(63.5 | ) | (2.0 | ) | (65.5 | ) | ||||||
| $ | 20.8 | $ | (0.3 | ) | $ | 20.5 | ||||||
|
2007
|
||||||||||||
|
Current
|
$ | 166.9 | $ | 3.6 | $ | 170.5 | ||||||
|
Deferred
|
(24.5 | ) | (1.2 | ) | (25.7 | ) | ||||||
| $ | 142.4 | $ | 2.4 | $ | 144.8 | |||||||
| 2009 | 2008 | 2007 | ||||||||||
|
Federal income tax rate
|
35.0 | % | 35.0 | % | 35.0 | % | ||||||
|
Change in estimates and other
true-ups
|
— | (0.7 | ) | 1.2 | ||||||||
|
Income subject to dividends-received deduction
|
(0.8 | ) | (6.8 | ) | (0.8 | ) | ||||||
|
Tax-exempt interest
|
(3.5 | ) | (22.2 | ) | (2.5 | ) | ||||||
|
State taxes, net of federal tax benefit
|
0.4 | — | 0.4 | |||||||||
|
Goodwill impairment
|
— | 27.9 | — | |||||||||
|
Other, net
|
0.4 | 0.4 | 0.2 | |||||||||
| 31.5 | % | 33.6 | % | 33.5 | % | |||||||
90
Table of Contents
| 8. | Income Taxes, continued |
| 2009 | 2008 | |||||||
|
Deferred tax assets
|
||||||||
|
Foreign tax credit carry forward
|
$ | — | $ | 1.1 | ||||
|
State net operating loss carry forward
|
15.3 | 15.0 | ||||||
|
Reserves for impaired assets
|
3.1 | 2.3 | ||||||
|
Expenses deducted for tax purposes when paid
|
1.4 | 1.8 | ||||||
|
Other than temporary impairment
|
48.4 | 69.5 | ||||||
|
Property and casualty loss reserves
|
67.6 | 66.5 | ||||||
|
Unearned premium reserves
|
29.3 | 31.5 | ||||||
|
Performance shares
|
1.7 | 1.9 | ||||||
|
Unrealized loss on investments
|
— | 20.6 | ||||||
|
Compensation accruals
|
48.9 | 43.7 | ||||||
|
Other
|
16.6 | 4.5 | ||||||
|
Deferred tax assets
|
$ | 232.3 | $ | 258.4 | ||||
|
Valuation allowance
|
$ | (14.6 | ) | $ | (14.5 | ) | ||
|
Total net deferred tax assets
|
$ | 217.7 | $ | 243.9 | ||||
|
Deferred tax liabilities
|
||||||||
|
Unrealized gain on investments
|
$ | 54.1 | $ | 68.7 | ||||
|
Tax over book depreciation
|
1.4 | 1.4 | ||||||
|
Deferred gains
|
3.8 | 2.1 | ||||||
|
Burlington Northern redemption
|
— | 4.2 | ||||||
|
Deferred acquisition costs
|
25.7 | 25.9 | ||||||
|
Purchase accounting adjustments
|
5.5 | 10.8 | ||||||
|
Other
|
2.9 | 0.5 | ||||||
|
Total deferred tax liabilities
|
$ | 93.4 | $ | 113.6 | ||||
|
Net deferred tax assets
|
$ | 124.3 | $ | 130.3 | ||||
91
Table of Contents
| 9. | Stockholders’ Equity |
| (a) | Mandatory Convertible Preferred Stock |
| (b) | Treasury Stock |
| (c) | Regulatory Matters |
| 10. | Stock-Based Compensation Plans |
| (a) | General |
92
Table of Contents
| 10. | Stock-Based Compensation Plans, continued |
| (b) | Director Stock Option and Restricted Stock Plans |
|
Weighted-
|
||||||||||||||||
|
Weighted-
|
Average
|
Aggregate
|
||||||||||||||
|
Average
|
Remaining
|
Intrinsic
|
||||||||||||||
|
Shares
|
Exercise
|
Contractual
|
Value
|
|||||||||||||
|
Options
|
(000) | Price | Term (years) | ($ millions) | ||||||||||||
|
Outstanding at January 1, 2009
|
64 | $ | 204 | |||||||||||||
|
Granted
|
4 | 225 | ||||||||||||||
|
Exercised
|
(11 | ) | 152 | |||||||||||||
|
Forfeited or expired
|
— | — | ||||||||||||||
|
Outstanding at December 31, 2009
|
57 | $ | 216 | 4.2 | $ | 3.9 | ||||||||||
|
Exercisable at December 31, 2009
|
48 | $ | 203 | 3.3 | $ | 3.7 | ||||||||||
93
Table of Contents
| 10. | Stock-Based Compensation Plans, continued |
|
Weighted-Average
|
||||||||
|
Shares
|
Grant-Date
|
|||||||
|
Non-vested Shares
|
(000) | Fair Value | ||||||
|
Non-vested at January 1, 2009
|
9 | $ | 129 | |||||
|
Granted
|
4 | 102 | ||||||
|
Vested
|
(4 | ) | 105 | |||||
|
Forfeited
|
— | — | ||||||
|
Non-vested at December 31, 2009
|
9 | $ | 118 | |||||
| (c) | Alleghany 2002 and 2007 Long-Term Incentive Plans |
94
Table of Contents
| 10. | Stock-Based Compensation Plans, continued |
| (d) | RSUI Restricted Share Plan |
| 11. | Employee Benefit Plans |
| (a) | Alleghany Employee Defined Benefit Pension Plans |
95
Table of Contents
| 11. | Employee Benefit Plans, continued |
| 2009 | 2008 | |||||||
|
OBLIGATIONS AND FUNDING STATUS:
|
||||||||
|
Change in benefit obligation
|
||||||||
|
Benefit obligation at beginning of year
|
$ | 20.3 | $ | 17.3 | ||||
|
Service cost
|
2.9 | 2.9 | ||||||
|
Interest cost
|
1.1 | 0.9 | ||||||
|
Amendments
|
— | — | ||||||
|
Curtailment loss
|
— | — | ||||||
|
Actuarial loss
|
1.3 | 0.5 | ||||||
|
Benefits paid
|
(2.3 | ) | (1.3 | ) | ||||
|
Projected benefit obligation at end of year
|
$ | 23.3 | $ | 20.3 | ||||
|
Change in plan assets
|
||||||||
|
Fair value of plan assets at beginning of year
|
$ | 2.6 | $ | 2.3 | ||||
|
Actual return on plan assets, net of expenses
|
(0.2 | ) | 0.4 | |||||
|
Company contributions
|
2.2 | 1.2 | ||||||
|
Benefits paid
|
(2.3 | ) | (1.3 | ) | ||||
|
Fair value of plan assets at end of year
|
$ | 2.3 | $ | 2.6 | ||||
|
Funded status
|
$ | (21.0 | ) | $ | (17.7 | ) | ||
|
Amounts recognized in statement of financial position
consist of:
|
||||||||
|
Prepaid benefit cost
|
0.7 | 0.8 | ||||||
|
Accrued benefit liability
|
(16.2 | ) | (14.4 | ) | ||||
|
Accumulated other comprehensive income
|
(5.5 | ) | (4.1 | ) | ||||
|
Net amount recognized
|
$ | (21.0 | ) | $ | (17.7 | ) | ||
|
Weighted average asset allocations
|
||||||||
|
Debt securities
|
100 | % | 100 | % | ||||
| 2009 | 2008 | 2007 | ||||||||||
|
COST AND OTHER COMPREHENSIVE INCOME:
|
||||||||||||
|
Net pension cost included the following expense (income)
components:
|
||||||||||||
|
Service cost — benefits earned during the year
|
$ | 2.9 | $ | 2.9 | $ | 2.3 | ||||||
|
Interest cost on benefit obligation
|
1.1 | 0.9 | 0.8 | |||||||||
|
Expected return on plan assets
|
(0.1 | ) | (0.1 | ) | (0.1 | ) | ||||||
|
Net amortization and deferral
|
0.2 | 0.2 | 0.2 | |||||||||
|
Net periodic pension cost
|
4.1 | 3.9 | 3.2 | |||||||||
|
Curtailment loss
|
— | — | — | |||||||||
|
Settlement charge
|
— | 0.2 | — | |||||||||
|
Total cost
|
$ | 4.1 | $ | 4.1 | $ | 3.2 | ||||||
|
Change in other comprehensive income (pension-related)
|
1.4 | (0.1 | ) | — | ||||||||
|
Net periodic pension cost and other comprehensive income
|
$ | 5.5 | $ | 4.0 | $ | 3.2 | ||||||
96
Table of Contents
| 11. | Employee Benefit Plans, continued |
| 2009 | 2008 | 2007 | ||||||||||
|
ASSUMPTIONS:
|
||||||||||||
|
Assumptions used in computing the net periodic pension
cost of the plans is as follows
|
||||||||||||
|
Rates for increases in compensation levels
|
4.00 | % | 4.00 | % | 4.00 | % | ||||||
|
Weighted average discount rates
|
6.00 | % | 6.00 | % | 5.75 | % | ||||||
|
Expected long-term rates of return
|
5.00 | % | 5.00 | % | 4.00 | % | ||||||
|
Assumptions used in computing the funded status of the
plans is as follows
|
||||||||||||
|
Rates for increases in compensation levels
|
4.00 | % | 4.00 | % | 4.00 | % | ||||||
|
Weighted average discount rates
|
6.00 | % | 6.00 | % | 6.00 | % | ||||||
|
2010
|
$ | 0.1 | ||
|
2011
|
0.3 | |||
|
2012
|
0.3 | |||
|
2013
|
0.3 | |||
|
2014
|
0.3 | |||
|
2015-2019
|
1.9 |
| (b) | Other Employee Retirement Plans |
97
Table of Contents
| 11. | Employee Benefit Plans, continued |
| 12. | Earnings Per Share of Common Stock |
| 2009 | 2008 | 2007 | ||||||||||
|
Net earnings
|
$ | 271.0 | $ | 148.0 | $ | 299.1 | ||||||
|
Preferred dividends
|
6.2 | 17.2 | 17.2 | |||||||||
|
Income available to common stockholders for basic earnings per
share
|
264.8 | 130.8 | 281.9 | |||||||||
|
Preferred dividends
|
6.2 | — | 17.2 | |||||||||
|
Effect of other dilutive securities
|
0.4 | — | 0.3 | |||||||||
|
Income available to common stockholders for diluted earnings per
share
|
$ | 271.4 | $ | 130.8 | $ | 299.4 | ||||||
|
Weighted average shares outstanding applicable to basic earnings
per share
|
8,704,268 | 8,479,863 | 8,476,152 | |||||||||
|
Preferred stock
|
430,121 | — | 1,017,929 | |||||||||
|
Effect of other dilutive securities
|
14,476 | — | 23,819 | |||||||||
|
Adjusted weighted average shares outstanding applicable to
diluted earnings per share
|
9,148,865 | 8,479,863 | 9,517,900 | |||||||||
| 13. | Commitments and Contingencies |
| (a) | Leases |
|
Aggregate
|
||||
|
Minimum
|
||||
|
Lease
|
||||
|
Year
|
Payments | |||
|
2010
|
$ | 9.4 | ||
|
2011
|
9.4 | |||
|
2012
|
9.6 | |||
|
2013
|
9.7 | |||
|
2014
|
9.7 | |||
|
2015 and thereafter
|
40.6 | |||
98
Table of Contents
| 13. | Commitments and Contingencies, continued |
| (b) | Litigation |
| (c) | Asbestos and Environmental Impairment Exposure |
| (d) | Indemnification Obligations |
99
Table of Contents
| 13. | Commitments and Contingencies, continued |
| (e) | Equity Holdings Concentration |
100
Table of Contents
| 14. | Fair Value of Financial Instruments |
| December 31, 2009 | December 31, 2008 | |||||||||||||||
|
Carrying
|
Fair
|
Carrying
|
Fair
|
|||||||||||||
| Amount | Value | Amount | Value | |||||||||||||
|
Assets
|
||||||||||||||||
|
Investments (excluding equity method investments)*
|
$ | 4,211.6 | $ | 4,211.6 | $ | 4,057.7 | $ | 4,057.7 | ||||||||
| * | For purposes of this table, investments include available-for-sale securities as well as investments in partnerships carried at fair value that are included in other invested assets. Investments exclude Alleghany’s investments in Homesite, ORX and partnerships that are accounted for under the equity method, which are included in other invested assets. The fair value of short-term investments approximates amortized cost. The fair value of all other categories of investments is discussed below. |
| • | “Level 1” — Valuations are based on unadjusted quoted prices in active markets for identical, unrestricted assets. Since valuations are based on quoted prices that are readily and regularly available in an active market, valuation of these assets does not involve any meaningful degree of judgment. An active market is defined as a market where transactions for the financial instrument occur with sufficient frequency and volume to provide pricing information on an ongoing basis. Alleghany’s Level 1 assets generally include publicly traded common stocks and debt securities issued directly by the U.S. Government, where Alleghany’s valuations are based on quoted market prices. | |
| • | “Level 2” — Valuations are based on quoted market prices where such markets are not deemed to be sufficiently “active.” In such circumstances, additional valuation metrics will be used which involve direct or indirect observable market inputs. Alleghany’s Level 2 assets generally include preferred stocks and debt securities other than debt issued directly by the U.S. Government. Substantially all of the determinations of value in this category are based on a single quote from third-party dealers and pricing services. As Alleghany generally does not make any adjustments thereto, such quote typically constitutes the sole input in Alleghany’s determination of the fair value of these types of securities. In developing a quote, such third parties will use the terms of the security and market-based inputs. Terms of the security include coupon, maturity date, and any special provisions that may, for example, enable the investor, at its election, to redeem the security prior to its scheduled maturity date. Market-based inputs include the level of interest rates applicable to comparable securities in the market place and current credit rating(s) of the security. Such quotes are generally non-binding. |
101
Table of Contents
| 14. | Fair Value of Financial Instruments, continued |
| • | “Level 3” — Valuations are based on inputs that are unobservable and significant to the overall fair value measurement. Valuation under Level 3 generally involves a significant degree of judgment on the part of Alleghany. Alleghany’s Level 3 assets are primarily limited to partnership investments. Net asset value quotes from the third-party general partner of the entity in which such investment is held, which will often be based on unobservable market inputs, constitute the primary input in Alleghany’s determination of the fair value of such assets. |
102
Table of Contents
| 14. | Fair Value of Financial Instruments, continued |
| Level 1 | Level 2 | Level 3 | Total | |||||||||||||
|
As of December 31, 2009
|
||||||||||||||||
|
Equity securities:
|
||||||||||||||||
|
Common stock
|
$ | 624.5 | $ | — | $ | — | $ | 624.5 | ||||||||
|
Preferred stock
|
— | — | — | — | ||||||||||||
|
Debt securities:
|
||||||||||||||||
|
U.S. Government obligations
|
638.4 | — | — | 638.4 | ||||||||||||
|
Mortgage and asset-backed securities*
|
— | 958.8 | — | 958.8 | ||||||||||||
|
States, municipalities, political subdivisions bonds
|
— | 1,234.0 | — | 1,234.0 | ||||||||||||
|
Foreign bonds
|
— | 144.3 | — | 144.3 | ||||||||||||
|
Corporate bonds and other
|
— | 313.5 | — | 313.5 | ||||||||||||
| 638.4 | 2,650.6 | — | 3,289.0 | |||||||||||||
|
Short-term investments
|
75.2 | 187.7 | — | 262.9 | ||||||||||||
|
Other invested assets**
|
— | — | 35.2 | 35.2 | ||||||||||||
|
Investments (excluding equity method investments)
|
$ | 1,338.1 | $ | 2,838.3 | $ | 35.2 | $ | 4,211.6 | ||||||||
|
As of December 31, 2008
|
||||||||||||||||
|
Equity securities:
|
||||||||||||||||
|
Common stock
|
$ | 619.8 | $ | — | $ | — | $ | 619.8 | ||||||||
|
Preferred stock
|
— | 9.7 | — | 9.7 | ||||||||||||
|
Debt securities:
|
||||||||||||||||
|
U.S. Government obligations
|
266.3 | 20.3 | — | 286.6 | ||||||||||||
|
Mortgage and asset-backed securities*
|
— | 653.8 | 0.7 | 654.5 | ||||||||||||
|
States, municipalities, political subdivisions bonds
|
— | 1,434.1 | — | 1,434.1 | ||||||||||||
|
Foreign bonds
|
— | 177.3 | — | 177.3 | ||||||||||||
|
Corporate bonds and other
|
— | 207.5 | — | 207.5 | ||||||||||||
| 266.3 | 2,493.0 | 0.7 | 2,760.0 | |||||||||||||
|
Short-term investments
|
175.9 | 460.3 | — | 636.2 | ||||||||||||
|
Other invested assets**
|
— | — | 32.0 | 32.0 | ||||||||||||
|
Investments (excluding equity method investments)
|
$ | 1,062.0 | $ | 2,963.0 | $ | 32.7 | $ | 4,057.7 | ||||||||
| * | Consists primarily of residential mortgage-backed securities. | |
| ** | The carrying value of partnership investments of $35.2 million increased by $3.2 million from the December 31, 2008 carrying value of $32.0 million, due primarily to an increase in estimated fair value during the period. |
| 15. | Segments of Business |
103
Table of Contents
| 15. | Segments of Business, continued |
| 2009 | 2008 | 2007(1) | ||||||||||
| (in millions) | ||||||||||||
|
Revenues:
|
||||||||||||
|
AIHL insurance group:
|
||||||||||||
|
Net premiums earned
|
||||||||||||
|
RSUI
|
$ | 633.4 | $ | 689.6 | $ | 707.5 | ||||||
|
CATA
|
166.7 | 186.9 | 198.0 | |||||||||
|
EDC
|
44.9 | 72.0 | 44.3 | |||||||||
|
AIHL Re
|
— | 0.2 | 24.5 | |||||||||
| 845.0 | 948.7 | 974.3 | ||||||||||
|
Net investment income
|
116.7 | 112.6 | 126.5 | |||||||||
|
Net realized capital gains (losses)
|
119.8 | (4.4 | ) | 44.2 | ||||||||
|
Other than temporary impairment losses (2)
|
(85.9 | ) | (244.0 | ) | (7.7 | ) | ||||||
|
Other income
|
1.3 | 0.7 | 0.5 | |||||||||
|
Total insurance group
|
996.9 | 813.6 | 1,137.8 | |||||||||
|
Corporate activities:
|
||||||||||||
|
Net investment income (3)
|
(14.8 | ) | 17.6 | 19.6 | ||||||||
|
Net realized capital gains (4)
|
200.6 | 156.2 | 56.2 | |||||||||
|
Other than temporary impairment losses
|
— | — | — | |||||||||
|
Other income (5)
|
1.7 | 1.7 | 15.0 | |||||||||
|
Total
|
$ | 1,184.4 | $ | 989.1 | $ | 1,228.6 | ||||||
104
Table of Contents
| 15. | Segments of Business, continued |
| 2009 | 2008 | 2007(1) | ||||||||||
| (in millions) | ||||||||||||
|
Earnings from continuing operations before income
taxes:
|
||||||||||||
|
AIHL insurance group:
|
||||||||||||
|
Underwriting profit (loss) (6)
|
||||||||||||
|
RSUI
|
$ | 189.8 | $ | 137.6 | $ | 219.9 | ||||||
|
CATA
|
10.1 | 15.2 | 19.4 | |||||||||
|
EDC
|
(70.7 | ) | (60.9 | ) | 4.4 | |||||||
|
AIHL Re
|
— | 0.2 | 24.4 | |||||||||
| 129.2 | 92.1 | 268.1 | ||||||||||
|
Net investment income
|
116.7 | 112.6 | 126.5 | |||||||||
|
Net realized capital gains
|
119.8 | (4.4 | ) | 44.2 | ||||||||
|
Other than temporary impairment losses (2)
|
(85.9 | ) | (244.0 | ) | (7.7 | ) | ||||||
|
Other income, less other expenses
|
(42.2 | ) | (31.4 | ) | (52.3 | ) | ||||||
|
Total insurance group
|
237.6 | (75.1 | ) | 378.8 | ||||||||
|
Corporate activities:
|
||||||||||||
|
Net investment income (3)
|
(14.8 | ) | 17.6 | 19.6 | ||||||||
|
Net realized capital gains (4)
|
200.6 | 156.2 | 56.2 | |||||||||
|
Other than temporary impairment losses
|
— | — | — | |||||||||
|
Other income (5)
|
1.7 | 1.7 | 15.0 | |||||||||
|
Corporate administration and other expenses
|
29.1 | 38.7 | 35.9 | |||||||||
|
Interest expense
|
0.6 | 0.7 | 1.4 | |||||||||
|
Total
|
$ | 395.4 | $ | 61.0 | $ | 432.3 | ||||||
| (1) | Includes the results of EDC, net of purchase accounting adjustments, commencing July 18, 2007. See Note 4(a). | |
| (2) | Reflects impairment charges for unrealized losses related to AIHL’s investment portfolio that were deemed to be other than temporary. See Note 3. | |
| (3) | Includes $(1.1) million, $0.3 million and $4.0 million of Alleghany’s equity in (losses) earnings of Homesite, net of purchase accounting adjustments, for 2009, 2008 and 2007, respectively. Also includes $(21.9) million and $1.5 million of Alleghany’s equity in (losses) earnings of ORX, net of purchase accounting adjustments, for 2009 and 2008, respectively. See Note 4(b) and 4(c). | |
| (4) | Primarily reflects net realized capital gains from the sale of shares of Burlington Northern common stock. | |
| (5) | Primarily reflects sales activity of Alleghany Properties. | |
| (6) | Represents net premiums earned less loss and loss adjustment expenses and commission, brokerage and other underwriting expenses, all as determined in accordance with GAAP, and does not include net investment income, other income, net realized capital gains or other-than-temporary impairment losses. Commission, brokerage and other underwriting expenses represent commission and brokerage expenses and that portion of salaries, administration and other operating expenses attributable primarily to underwriting activities, whereas the remainder constitutes other expenses. |
105
Table of Contents
| 15. | Segments of Business, continued |
| 2009 | 2008 | 2007 | ||||||||||
| (in millions) | ||||||||||||
|
Identifiable assets at December 31
|
||||||||||||
|
AIHL insurance group
|
$ | 5,659.2 | $ | 5,554.2 | $ | 6,166.7 | ||||||
|
Corporate activities
|
533.6 | 627.6 | 775.4 | |||||||||
|
Total
|
$ | 6,192.8 | $ | 6,181.8 | $ | 6,942.1 | ||||||
|
Capital expenditures
|
||||||||||||
|
AIHL insurance group
|
$ | 5.5 | $ | 9.8 | $ | 4.7 | ||||||
|
Corporate activities
|
— | — | 0.2 | |||||||||
|
Total
|
$ | 5.5 | $ | 9.8 | $ | 4.9 | ||||||
|
Depreciation and amortization
|
||||||||||||
|
AIHL insurance group
|
$ | 30.5 | $ | 25.0 | $ | 15.3 | ||||||
|
Corporate activities
|
1.9 | 0.7 | 1.0 | |||||||||
|
Total
|
$ | 32.4 | $ | 25.7 | $ | 16.3 | ||||||
| 16. | Other Information |
| (a) | Other Assets |
| 2009 | 2008 | |||||||
|
Real estate properties
|
$ | 19.8 | $ | 19.5 | ||||
|
Interest and dividends receivable
|
38.1 | 41.1 | ||||||
|
Other
|
43.7 | 40.2 | ||||||
| $ | 101.6 | $ | 100.8 | |||||
| (b) | Other Invested Assets |
| 2009 | 2008 | |||||||
|
Investment in Homesite (see Note 4(b))
|
$ | 125.7 | $ | 121.6 | ||||
|
Investment in ORX (see Note 4(c))
|
29.6 | 51.5 | ||||||
|
Partnerships accounted for on an available for sale basis
|
35.2 | 32.0 | ||||||
|
Partnerships accounted for as an equity method investment
|
47.7 | 45.3 | ||||||
| $ | 238.2 | $ | 250.4 | |||||
106
Table of Contents
| 16. | Other Information, continued |
| (c) | Property and equipment |
| 2009 | 2008 | |||||||
|
Furniture and equipment
|
$ | 46.4 | $ | 41.2 | ||||
|
Leasehold improvements
|
5.9 | 5.7 | ||||||
|
Other
|
0.3 | 0.3 | ||||||
| 52.6 | 47.2 | |||||||
|
Less: accumulated depreciation and amortization
|
(32.5 | ) | (23.9 | ) | ||||
| $ | 20.1 | $ | 23.3 | |||||
| (d) | Deferred Acquisition Costs |
| 2009 | 2008 | |||||||
|
Balance at January 1
|
$ | 71.8 | $ | 75.6 | ||||
|
Current year’s costs deferred
|
146.9 | 153.5 | ||||||
|
Less: amortization to expense for the year
|
(147.6 | ) | (155.2 | ) | ||||
|
Less: asset impairment (related to EDC)
|
— | (2.1 | ) | |||||
|
Balance at December 31
|
$ | 71.1 | $ | 71.8 | ||||
| (e) | Other Liabilities |
| 2009 | 2008 | |||||||
|
Accounts payable
|
$ | 4.3 | $ | 7.3 | ||||
|
Incentive plans
|
143.6 | 129.2 | ||||||
|
Accrued salaries and wages
|
10.0 | 8.2 | ||||||
|
Deferred compensation
|
8.1 | 7.2 | ||||||
|
Accrued expenses
|
7.7 | 11.2 | ||||||
|
Taxes other than income
|
2.5 | 3.5 | ||||||
|
Deferred revenue
|
11.8 | 11.8 | ||||||
|
Payable to brokers
|
3.0 | 4.8 | ||||||
|
Pension and postretirement benefits
|
32.5 | 23.1 | ||||||
|
Funds held for surety bonds
|
76.6 | 65.3 | ||||||
|
Other
|
24.6 | 17.3 | ||||||
| $ | 324.7 | $ | 288.9 | |||||
107
Table of Contents
| 17. | Quarterly Results of Operations (unaudited) |
| Quarters Ended | ||||||||||||||||
| March 31 | June 30 | September 30 | December 31 | |||||||||||||
|
2009
|
||||||||||||||||
|
Revenues
|
$ | 239.9 | $ | 299.4 | $ | 288.3 | $ | 356.7 | ||||||||
|
Earnings from:
|
||||||||||||||||
|
Continuing operations
|
$ | 44.6 | $ | 46.0 | $ | 49.5 | $ | 130.9 | ||||||||
|
Discontinued operations
|
— | — | — | — | ||||||||||||
|
Net earnings
|
$ | 44.6 | $ | 46.0 | $ | 49.5 | $ | 130.9 | ||||||||
|
Basic earnings per share of common stock: *
|
||||||||||||||||
|
Continuing operations
|
$ | 4.82 | $ | 5.11 | $ | 5.50 | $ | 14.72 | ||||||||
|
Discontinued operations
|
— | — | — | — | ||||||||||||
|
Total
|
$ | 4.82 | $ | 5.11 | $ | 5.50 | $ | 14.72 | ||||||||
|
2008
|
||||||||||||||||
|
Revenues
|
$ | 355.5 | $ | 253.4 | $ | 263.3 | $ | 116.9 | ||||||||
|
Earnings from:
|
||||||||||||||||
|
Continuing operations
|
$ | 90.6 | $ | 13.0 | $ | (8.8 | ) | $ | (54.1 | ) | ||||||
|
Discontinued operations
|
5.3 | 4.8 | 4.6 | 92.6 | ||||||||||||
|
Net earnings
|
$ | 95.9 | $ | 17.8 | $ | (4.2 | ) | $ | 38.5 | |||||||
|
Basic earnings per share of common stock: *
|
||||||||||||||||
|
Continuing operations
|
$ | 10.15 | $ | 1.02 | $ | (1.55 | ) | $ | (6.86 | ) | ||||||
|
Discontinued operations
|
0.63 | 0.57 | 0.55 | 10.92 | ||||||||||||
|
Total
|
$ | 10.78 | $ | 1.59 | $ | (1.00 | ) | $ | 4.06 | |||||||
| * | Adjusted to reflect subsequent stock dividends. |
108
Table of Contents
109
Table of Contents
110
Table of Contents
| Item 9. | Changes in and Disagreements With Accountants on Accounting and Financial Disclosure. |
| Item 9A. | Controls and Procedures. |
| Item 9B. | Other Information. |
111
Table of Contents
| Item 10. | Directors, Executive Officers and Corporate Governance. |
| Item 11. | Executive Compensation. |
| Item 12. | Security Ownership of Certain Beneficial Owners and Management and Related Stockholder Matters. |
| Item 13. | Certain Relationships and Related Transactions, and Director Independence. |
| Item 14. | Principal Accountant Fees and Services. |
112
Table of Contents
| Item 15. | Exhibits and Financial Statement Schedules. |
113
Table of Contents
(Registrant)
|
Date: February 25, 2010
|
By
/s/
Weston
M. Hicks
Weston
M. Hicks
President |
|
Date: February 25, 2010
|
By
/s/
Rex
D. Adams
Rex
D. Adams
Director |
|
|
Date: February 25, 2010
|
By
/s/
Jerry
G. Borrelli
Jerry
G. Borrelli
Vice President (principal accounting officer) |
|
|
Date: February 25, 2010
|
By
/s/
Karen
Brenner
Karen
Brenner
Director |
|
|
Date: February 25, 2010
|
By
/s/
John
J. Burns, Jr.
John
J. Burns, Jr.
Chairman of the Board and Director |
|
|
Date: February 25, 2010
|
By
/s/
Dan
R. Carmichael
Dan
R. Carmichael
Director |
|
|
Date: February 25, 2010
|
By
/s/
Roger
B. Gorham
Roger
B. Gorham
Senior Vice President (principal financial officer) |
114
Table of Contents
|
Date: February 25, 2010
|
By
/s/
Weston
M. Hicks
Weston
M. Hicks
President and Director (principal executive officer) |
|
|
Date: February 25, 2010
|
By
/s/
Thomas
S. Johnson
Thomas
S. Johnson
Director |
|
|
Date: February 25, 2010
|
By
/s/
Allan
P. Kirby, Jr.
Allan
P. Kirby, Jr.
Director |
|
|
Date: February 25, 2010
|
By
/s/
Jefferson
W. Kirby
Jefferson
W. Kirby
Director |
|
|
Date: February 25, 2010
|
By
/s/
William
K. Lavin
William
K. Lavin
Director |
|
|
Date: February 25, 2010
|
By
/s/
Phillip
M. Martineau
Phillip
M. Martineau
Director |
|
|
Date: February 25, 2010
|
By
/s/
James
F. Will
James
F. Will
Director |
|
|
Date: February 25, 2010
|
By
/s/
Raymond
L.M. Wong
Raymond
L.M. Wong
Director |
115
Table of Contents
|
Description
|
Page | |||
| 117 | ||||
| 118 | ||||
| 119 | ||||
| 123 | ||||
| 124 | ||||
| 125 | ||||
| 126 | ||||
116
Table of Contents
117
Table of Contents
ALLEGHANY CORPORATION AND SUBSIDIARIES
December 31, 2009
|
Amount at
|
||||||||||||
|
which shown
|
||||||||||||
|
in the
|
||||||||||||
|
Fair
|
Balance
|
|||||||||||
|
Type of Investment
|
Cost | Value | Sheet | |||||||||
| (in thousands) | ||||||||||||
|
Fixed maturities:
|
||||||||||||
|
Bonds:
|
||||||||||||
|
United States Government and government agencies and authorities
|
$ | 634,822 | $ | 638,448 | $ | 638,448 | ||||||
|
States, municipalities & political subdivisions
|
1,202,200 | 1,233,939 | 1,233,939 | |||||||||
|
Foreign governments
|
— | — | — | |||||||||
|
Mortgage and asset-backed securities
|
955,757 | 958,781 | 958,781 | |||||||||
|
All other bonds
|
442,816 | 457,845 | 457,845 | |||||||||
|
Fixed maturities
|
3,235,595 | 3,289,013 | 3,289,013 | |||||||||
|
Equity securities:
|
||||||||||||
|
Common stocks:
|
||||||||||||
|
Public utilities
|
— | — | — | |||||||||
|
Banks, trust, and insurance companies
|
55,102 | 60,780 | 60,780 | |||||||||
|
Industrial, miscellaneous, and all other
|
475,806 | 563,652 | 563,652 | |||||||||
|
Nonredeemable preferred stocks
|
37 | 114 | 114 | |||||||||
|
Equity securities
|
530,945 | 624,546 | 624,546 | |||||||||
|
Other invested assets
|
238,227 | 238,227 | 238,227 | |||||||||
|
Short-term investments
|
262,903 | 262,903 | 262,903 | |||||||||
|
Total investments
|
$ | 4,267,670 | $ | 4,414,689 | $ | 4,414,689 | ||||||
118
Table of Contents
ALLEGHANY CORPORATION
December 31, 2009 and 2008
| 2009 | 2008 | |||||||
| (in thousands) | ||||||||
|
Assets
|
||||||||
|
Equity securities (cost: 2009 $14,995; 2008 $38,062)
|
$ | 18,368 | $ | 227,130 | ||||
|
Debt securities (amortized cost: 2009 $221,213; 2008 $79,232)
|
221,438 | 81,364 | ||||||
|
Short-term investments
|
45,744 | 136,740 | ||||||
|
Cash
|
1,831 | 77 | ||||||
|
Property and equipment — at cost, net of accumulated
depreciation
|
1,095 | 1,312 | ||||||
|
Other assets
|
17,759 | 18,982 | ||||||
|
Current taxes receivable
|
2,469 | — | ||||||
|
Net deferred tax receivable
|
26,055 | — | ||||||
|
Investment in subsidiaries
|
2,441,924 | 2,274,417 | ||||||
| $ | 2,776,683 | $ | 2,740,022 | |||||
|
Liabilities and stockholders’ equity
|
||||||||
|
Other liabilities
|
59,162 | 43,863 | ||||||
|
Current taxes payable
|
— | 4,889 | ||||||
|
Net deferred tax liabilities
|
— | 44,581 | ||||||
|
Total liabilities
|
59,162 | 93,333 | ||||||
|
Stockholders’ equity
|
2,717,521 | 2,646,689 | ||||||
| $ | 2,776,683 | $ | 2,740,022 | |||||
119
Table of Contents
ALLEGHANY CORPORATION
Years ended December 31,
| 2009 | 2008 | 2007 | ||||||||||
| (in thousands) | ||||||||||||
|
Revenues:
|
||||||||||||
|
Net investment income
|
$ | 8,341 | $ | 15,806 | $ | 14,545 | ||||||
|
Net realized capital gains
|
200,626 | 156,191 | 56,207 | |||||||||
|
Other than temporary impairment losses
|
— | — | — | |||||||||
|
Other income
|
— | 318 | 203 | |||||||||
|
Total revenues
|
208,967 | 172,315 | 70,955 | |||||||||
|
Costs and Expenses:
|
||||||||||||
|
Interest expense
|
633 | 700 | 1,006 | |||||||||
|
Corporate administration
|
27,022 | 37,216 | 35,534 | |||||||||
|
Total costs and expenses
|
27,655 | 37,916 | 36,540 | |||||||||
|
Operating profit (losses)
|
181,312 | 134,399 | 34,415 | |||||||||
|
Equity in earnings of consolidated subsidiaries
|
214,068 | (73,347 | ) | 397,864 | ||||||||
|
Earnings from continuing operations, before income taxes
|
395,380 | 61,052 | 432,279 | |||||||||
|
Income taxes
|
124,381 | 20,485 | 144,737 | |||||||||
|
Earnings from continuing operations
|
270,999 | 40,567 | 287,542 | |||||||||
|
Earnings from discontinued operations (including gain on
disposal of $141,688 in 2008)
|
— | 164,193 | 24,976 | |||||||||
|
Income taxes (including tax on gain on disposal of $49,591 in
2008)
|
— | 56,789 | 13,448 | |||||||||
|
Earnings from discontinued operations, net of tax
|
— | 107,404 | 11,528 | |||||||||
|
Net earnings
|
$ | 270,999 | $ | 147,971 | $ | 299,070 | ||||||
120
Table of Contents
ALLEGHANY CORPORATION
Years ended December 31,
| 2009 | 2008 | 2007 | ||||||||||
| (in thousands) | ||||||||||||
|
CASH FLOWS FROM OPERATING ACTIVITIES
|
||||||||||||
|
Net earnings
|
$ | 270,999 | $ | 147,971 | $ | 299,070 | ||||||
|
Adjustments to reconcile earnings to cash provided by (used in)
operations:
|
||||||||||||
|
Equity in undistributed net (earnings) losses of consolidated
subsidiaries
|
(158,401 | ) | 47,890 | (269,549 | ) | |||||||
|
Depreciation and amortization
|
1,873 | 716 | 980 | |||||||||
|
Net (gain) loss on investment transactions
|
(200,626 | ) | (156,191 | ) | (56,207 | ) | ||||||
|
Decrease (increase) in other assets
|
8,135 | 1,614 | (1,074 | ) | ||||||||
|
Increase (decrease) in other liabilities and taxes payable
|
(7,334 | ) | 50,470 | (20,712 | ) | |||||||
|
Earnings of discontinued operations and sale of subsidiary
|
— | (107,404 | ) | (11,528 | ) | |||||||
|
Net adjustments
|
(356,353 | ) | (162,905 | ) | (358,090 | ) | ||||||
|
Net cash provided by (used) in operations
|
(85,354 | ) | (14,934 | ) | (59,020 | ) | ||||||
|
CASH FLOWS FROM INVESTING ACTIVITIES
|
||||||||||||
|
Purchase of investments
|
(286,330 | ) | (75,357 | ) | (69,080 | ) | ||||||
|
Sales of investments
|
364,967 | 259,745 | 159,555 | |||||||||
|
Maturities of investments
|
1,623 | 31,707 | 1,354 | |||||||||
|
Purchases of property and equipment
|
(34 | ) | 940 | (148 | ) | |||||||
|
Net change in short-term investments
|
90,996 | (118,408 | ) | 45,065 | ||||||||
|
Other, net
|
— | — | 504 | |||||||||
|
Net cash provided by (used in) investing activities
|
171,222 | 98,627 | 137,250 | |||||||||
|
CASH FLOWS FROM FINANCING ACTIVITIES
|
||||||||||||
|
Principal payments on long-term debt
|
— | — | (19,123 | ) | ||||||||
|
Treasury stock acquisitions
|
(75,856 | ) | (25,068 | ) | — | |||||||
|
Convertible preferred stock acquisitions
|
(117,358 | ) | — | — | ||||||||
|
Convertible preferred stock dividends paid
|
(7,456 | ) | (17,350 | ) | (17,367 | ) | ||||||
|
Tax benefit on stock based compensation
|
312 | 2,330 | 1,063 | |||||||||
|
Capital contributions to consolidated subsidiaries
|
(36,200 | ) | (50,005 | ) | (90,179 | ) | ||||||
|
Distributions from consolidated subsidiaries
|
151,040 | 3,050 | 43,635 | |||||||||
|
Other, net
|
1,404 | 2,133 | 3,627 | |||||||||
|
Net cash provided by (used in) financing activities
|
(84,114 | ) | (84,910 | ) | (78,344 | ) | ||||||
|
Net decrease in cash
|
1,754 | (1,217 | ) | (114 | ) | |||||||
|
Cash at beginning of year
|
77 | 1,294 | 1,408 | |||||||||
|
Cash at end of year
|
$ | 1,831 | $ | 77 | $ | 1,294 | ||||||
|
SUPPLEMENTAL DISCLOSURES OF CASH FLOW INFORMATION
|
||||||||||||
|
Cash paid during the year for:
|
||||||||||||
|
Interest
|
— | — | — | |||||||||
|
Income taxes
|
$ | 105,161 | $ | 154,911 | $ | 170,359 | ||||||
121
Table of Contents
ALLEGHANY CORPORATION
(in thousands)
122
Table of Contents
ALLEGHANY CORPORATION AND SUBSIDIARIES
| At December 31, | For the Years Ended December 31, | |||||||||||||||||||||||||||||||||||||||||
|
Future
|
||||||||||||||||||||||||||||||||||||||||||
|
Policy
|
Other
|
Benefits,
|
||||||||||||||||||||||||||||||||||||||||
|
Benefits,
|
Policy
|
Claims,
|
Amortization
|
|||||||||||||||||||||||||||||||||||||||
|
Deferred
|
Losses,
|
Claims
|
Losses
|
of Deferred
|
||||||||||||||||||||||||||||||||||||||
|
Policy
|
Claims
|
and
|
Net
|
and
|
Policy
|
Other
|
||||||||||||||||||||||||||||||||||||
|
Acquisition
|
and Loss
|
Unearned
|
Benefits
|
Premium
|
Investment
|
Settlement
|
Acquisition
|
Operating
|
Premiums
|
|||||||||||||||||||||||||||||||||
|
Year
|
Line of Business | Costs | Expenses | Premiums | Payable | Revenue | Income | Expenses | Costs | Expenses | Written | |||||||||||||||||||||||||||||||
| (in thousands) | ||||||||||||||||||||||||||||||||||||||||||
|
2009
|
Property
and Casualty Insurance |
$ | 71,098 | $ | 2,520,979 | $ | 573,906 | $ | — | $ | 845,015 | $ | 116,719 | $ | 442,104 | $ | 147,635 | $ | 126,087 | $ | 830,829 | |||||||||||||||||||||
|
2008
|
Property
and Casualty Insurance |
$ | 71,753 | $ | 2,578,590 | $ | 614,067 | $ | — | $ | 948,652 | $ | 112,596 | $ | 570,019 | $ | 155,151 | $ | 131,422 | $ | 898,221 | |||||||||||||||||||||
|
2007
|
Property
and Casualty Insurance |
$ | 75,623 | $ | 2,379,701 | $ | 699,409 | $ | — | $ | 974,321 | $ | 126,470 | $ | 449,052 | $ | 146,058 | $ | 111,140 | $ | 962,451 | |||||||||||||||||||||
123
Table of Contents
ALLEGHANY CORPORATION AND SUBSIDIARIES
Three years ended December 31, 2009
|
Percentage
|
||||||||||||||||||||||||
|
Ceded to
|
Assumed
|
of Amount
|
||||||||||||||||||||||
|
Gross
|
Other
|
From Other
|
Net
|
Assumed
|
||||||||||||||||||||
|
Year
|
Line of Business | Amount | Companies | Companies | Amount | to Net | ||||||||||||||||||
| (in thousands) | ||||||||||||||||||||||||
|
2009
|
Property and casualty | $ | 1,278,910 | $ | 452,999 | $ | 19,104 | $ | 845,015 | 2.3 | % | |||||||||||||
|
2008
|
Property and casualty | $ | 1,409,736 | $ | 478,268 | $ | 17,184 | $ | 948,652 | 1.8 | % | |||||||||||||
|
2007
|
Property and casualty | $ | 1,580,071 | $ | 625,099 | $ | 19,349 | $ | 974,321 | 2.0 | % | |||||||||||||
124
Table of Contents
ALLEGHANY CORPORATION AND SUBSIDIARIES
|
Charged to
|
Charged to
|
|||||||||||||||||||||
|
Balance at
|
Costs and
|
Other
|
Deductions-
|
Balance at
|
||||||||||||||||||
|
Year
|
Description | January 1, | Expenses | Accounts-Describe | Describe | December 31, | ||||||||||||||||
| (in thousands) | ||||||||||||||||||||||
|
2009
|
Allowance for uncollectible
reinsurance recoverables |
$ | — | $ | — | $ | — | $ | — | $ | — | |||||||||||
|
Allowance for uncollectible
premiums receivable |
$ | 3,412 | $ | 918 | $ | — | $ | 3,356 | $ | 974 | ||||||||||||
|
2008
|
Allowance for uncollectible
reinsurance recoverables |
$ | — | $ | — | $ | — | $ | — | $ | — | |||||||||||
|
Allowance for uncollectible
premiums receivable |
$ | 1,232 | $ | 3,486 | $ | — | $ | 1,306 | $ | 3,412 | ||||||||||||
|
2007
|
Allowance for uncollectible
reinsurance recoverables |
$ | — | $ | — | $ | — | $ | — | $ | — | |||||||||||
|
Allowance for uncollectible
premiums receivable |
$ | 986 | $ | 517 | $ | — | $ | 271 | $ | 1,232 | ||||||||||||
125
Table of Contents
ALLEGHANY CORPORATION AND SUBSIDIARIES
| At December 31, | For the Years Ended December 31, | |||||||||||||||||||||||||||||||||||||||||||||||
|
Discount,
|
Claims
|
|||||||||||||||||||||||||||||||||||||||||||||||
|
if Any,
|
and Claim
|
|||||||||||||||||||||||||||||||||||||||||||||||
|
Reserves
|
Deducted
|
Adjustment
|
||||||||||||||||||||||||||||||||||||||||||||||
|
for
|
in Reserves
|
Expenses
|
||||||||||||||||||||||||||||||||||||||||||||||
|
Unpaid
|
for Unpaid
|
Incurred
|
Amortization
|
|||||||||||||||||||||||||||||||||||||||||||||
|
Deferred
|
Claims
|
Claims
|
Related to |
of Deferred
|
Paid Claims
|
|||||||||||||||||||||||||||||||||||||||||||
|
Policy
|
and Claim
|
and Claim
|
Net
|
(1)
|
(2)
|
Policy
|
and Claim
|
|||||||||||||||||||||||||||||||||||||||||
|
Acquisition
|
Adjustment
|
Adjustment
|
Unearned
|
Earned
|
Investment
|
Current
|
Prior
|
Acquisition
|
Adjustment
|
Premiums
|
||||||||||||||||||||||||||||||||||||||
|
Year
|
Line of Business | Costs | Expenses | Expenses | Premiums | Premiums | Income | Year | Year | Costs | Expenses | Written | ||||||||||||||||||||||||||||||||||||
| (in thousands) | ||||||||||||||||||||||||||||||||||||||||||||||||
|
2009
|
Property and Casualty | $ | 71,098 | $ | 2,520,979 | $ | — | $ | 573,906 | $ | 845,015 | $ | 116,719 | $ | 459,943 | $ | (17,839 | ) | $ | 147,635 | $ | 439,086 | $ | 830,829 | ||||||||||||||||||||||||
|
2008
|
Property and Casualty | $ | 71,753 | $ | 2,578,590 | $ | — | $ | 614,067 | $ | 948,652 | $ | 112,596 | $ | 612,836 | $ | (42,817 | ) | $ | 155,151 | $ | 412,651 | $ | 898,221 | ||||||||||||||||||||||||
|
2007
|
Property and Casualty | $ | 75,623 | $ | 2,379,701 | $ | — | $ | 699,409 | $ | 974,321 | $ | 126,470 | $ | 480,137 | $ | (31,085 | ) | $ | 146,058 | $ | 328,759 | $ | 962,451 | ||||||||||||||||||||||||
126
Table of Contents
|
Exhibit
|
||||
|
Number
|
Description
|
|||
| 3 | .01 | Restated Certificate of Incorporation of Alleghany, as amended by Amendment accepted and received for filing by the Secretary of State of the State of Delaware on June 23, 1988, filed as Exhibit 3.1 to Alleghany’s Registration Statement on Form S-3 (No. 333-134996) filed on June 14, 2006, is incorporated herein by reference. | ||
| 3 | .02 | By-laws of Alleghany, as amended December 19, 2006, filed as Exhibit 3.2 to Alleghany’s Current Report on Form 8-K filed on December 22, 2006, is incorporated herein by reference. | ||
| 3 | .03 | Certificate of Elimination of 5.75% Mandatory Convertible Preferred Stock of Alleghany, filed as Exhibit 3.1 to Alleghany’s Current Report on Form 8-K filed on July 21, 2009, is incorporated herein by reference. | ||
| 4 | .01 | Specimen certificates representing shares of common stock, par value $1.00 per share, of Alleghany, filed as Exhibit 4.1 to Alleghany’s Quarterly Report on Form 10-Q for the quarter ended June 30, 2006, is incorporated herein by reference. | ||
| * 10 | .01 | Alleghany 2005 Management Incentive Plan, filed as Exhibit 10.4 to Alleghany’s Current Report on Form 8-K filed on October 22, 2007, is incorporated herein by reference. | ||
| * 10 | .02 | Alleghany Officers and Highly Compensated Employees Deferred Compensation Plan, as amended and restated as of January 1, 2008, filed as Exhibit 10.1 to Alleghany’s Current Report on Form 8-K filed on December 18, 2008, is incorporated herein by reference. | ||
| *10 | .03 | Alleghany 2002 Long-Term Incentive Plan, adopted and effective April 26, 2002, as amended, filed as Exhibit 10.2 to Alleghany’s Current Report on Form 8-K filed on December 18, 2008, is incorporated herein by reference. | ||
| *10 | .04 | Alleghany 2007 Long-Term Incentive Plan, adopted and effective April 27, 2007, as amended, filed as Exhibit 10.3 to Alleghany’s Current Report on Form 8-K filed on December 18, 2008, is incorporated herein by reference. | ||
| *10 | .05 | Alleghany Retirement Plan, amended and restated effective December 31, 2007, filed as Exhibit 10.05 to Alleghany’s Annual Report on Form 10-K for the year ended December 31, 2008, is incorporated herein by reference. | ||
| *10 | .06 | Alleghany Retirement COLA Plan dated and effective as of January 1, 1992, as adopted on March 17, 1992, filed as Exhibit 10.1 to Alleghany’s Registration Statement on Form S-3 (No. 333-134996) filed on June 14, 2006, is incorporated herein by reference. | ||
| *10 | .07 | Description of Alleghany Group Long Term Disability Plan effective as of July 1, 1995, filed as Exhibit 10.10 to Alleghany’s Annual Report on Form 10-K for the year ended December 31, 1995, is incorporated herein by reference. | ||
| *10 | .08 | Alleghany 2000 Directors’ Stock Option Plan effective April 28, 2000, filed as Exhibit A to Alleghany’s Proxy Statement, filed in connection with its Annual Meeting of Stockholders held on April 28, 2000, is incorporated herein by reference. | ||
| * 10 | .09 | Alleghany Non-Employee Directors’ Retirement Plan, as amended, effective December 19, 2006, filed as Exhibit 10.1 to Alleghany’s Current Report on Form 8-K filed on December 22, 2006, is incorporated herein by reference. | ||
| *10 | .10(a) | Alleghany 2005 Directors’ Stock Plan, as amended as of December 31, 2008, filed as Exhibit 10.12(a) to Alleghany’s Annual Report on Form 10-K for the year ended December 31, 2008, is incorporated herein by reference. | ||
| *10 | .10(b) | Form of Option Agreement under the Alleghany 2005 Directors’ Stock Plan, as amended as of December 16, 2008, filed as Exhibit 10.12(a) to Alleghany’s Annual Report on Form 10-K for the year ended December 31, 2008, is incorporated herein by reference. | ||
| * | Compensatory plan or arrangement. |
127
Table of Contents
|
Exhibit
|
||||
|
Number
|
Description
|
|||
| *10 | .10(c) | Amended and Restated Stock Unit Supplement to the Alleghany 2005 Directors’ Stock Plan, as amended as of December 16, 2008, filed as Exhibit 10.12(c) to Alleghany’s Annual Report on Form 10-K for the year ended December 31, 2008, is incorporated herein by reference. | ||
| *10 | .11(a) | Employment Agreement, dated October 7, 2002, between Alleghany and Weston M. Hicks, filed as Exhibit 10.1 to Alleghany’s Quarterly Report on Form 10-Q for the quarter ended September 30, 2002, is incorporated herein by reference. | ||
| * 10 | .11(b) | Restricted Stock Unit Matching Grant Agreement, dated October 7, 2002, between Alleghany and Weston M. Hicks, filed as Exhibit 10.3 to Alleghany’s Quarterly Report on Form 10-Q for the quarter ended September 30, 2002, is incorporated herein by reference. | ||
| *10 | .11(c) | Restricted Stock Award Agreement, dated December 31, 2004, between Alleghany and Weston M. Hicks, filed as Exhibit 10.11(d) to Alleghany’s Annual Report on Form 10-K for the year ended December 31, 2004, is incorporated herein by reference. | ||
| *10 | .11(d) | Letter Agreement, dated April 15, 2008, between Alleghany and Weston M. Hicks, filed as Exhibit 10.1 to Alleghany’s Current Report on Form 8-K filed on April 21, 2008, is incorporated herein by reference. | ||
| *10 | .12 | Restricted Stock Award Agreement, dated as of December 21, 2004 between Alleghany and Roger B. Gorham, filed as Exhibit 10.1 to Alleghany’s Current Report on Form 8-K filed on April 21, 2005, is incorporated herein by reference. | ||
| 10 | .13(a) | Asset Purchase Agreement dated as of July 1, 1991 among Celite Holdings Corporation, Celite Corporation and Manville Sales Corporation (the “Celite Asset Purchase Agreement”), filed as Exhibit 10.1 to Alleghany’s Current Report on Form 8-K filed on June 20, 2006, is incorporated herein by reference. | ||
| 10 | .13(b) | List of Contents of Exhibits and Schedules to the Celite Asset Purchase Agreement, filed as Exhibit 10.2 to Alleghany’s Current Report on Form 8-K filed on June 20, 2006, is incorporated herein by reference. Alleghany agrees to furnish supplementally a copy of any omitted exhibit or schedule to the Securities and Exchange Commission upon request. | ||
| 10 | .13(c) | Amendment No. 1 dated as of July 31, 1991 to the Celite Asset Purchase Agreement, filed as Exhibit 10.3 to Alleghany’s Current Report on Form 8-K filed on June 20, 2006, is incorporated herein by reference. | ||
| 10 | .13(d) | Amendment No. 2 dated as of May 11, 2006 to the Celite Asset Purchase Agreement, filed as Exhibit 10.4 to Alleghany’s Current Report on Form 8-K filed on June 20, 2006, is incorporated herein by reference. | ||
| 10 | .14(a) | Acquisition Agreement, dated as of June 6, 2003, by and between Royal Group, Inc. and AIHL (the “Resurgens Specialty Acquisition Agreement”), filed as Exhibit 10.1 to Alleghany’s Quarterly Report on Form 10-Q for the quarter ended June 30, 2003, is incorporated herein by reference. | ||
| 10 | .14(b) | List of Contents of Exhibits and Schedules to the Resurgens Specialty Acquisition Agreement, filed as Exhibit 10.2 to Alleghany’s Quarterly Report on Form 10-Q for the quarter ended June 30, 2003, is incorporated herein by reference. Alleghany agrees to furnish supplementally a copy of any omitted exhibit or schedule to the Securities and Exchange Commission upon request. | ||
| 10 | .15(a) | Quota Share Reinsurance Agreement, dated as of July 1, 2003, by and between Royal Indemnity Company and RIC (the “Royal Indemnity Company Quota Share Reinsurance Agreement”), filed as Exhibit 10.4 to Alleghany’s Quarterly Report on Form 10-Q for the quarter ended June 30, 2003, is incorporated herein by reference. | ||
| * | Compensatory plan or arrangement. |
128
Table of Contents
|
Exhibit
|
||||
|
Number
|
Description
|
|||
| 10 | .15(b) | List of Contents of Exhibits and Schedules to the Royal Indemnity Company Quota Share Reinsurance Agreement, filed as Exhibit 10.5 to Alleghany’s Quarterly Report on Form 10-Q for the quarter ended June 30, 2003, is incorporated herein by reference. Alleghany agrees to furnish supplementally a copy of any omitted exhibit or schedule to the Securities and Exchange Commission upon request. | ||
| 10 | .16(a) | Quota Share Reinsurance Agreement, dated as of July 1, 2003, by and between Royal Surplus Lines Insurance Company and RIC (the “Royal Surplus Lines Insurance Company Quota Share Reinsurance Agreement”), filed as Exhibit 10.6 to Alleghany’s Quarterly Report on Form 10-Q for the quarter ended June 30, 2003, is incorporated herein by reference. | ||
| 10 | .16(b) | List of Contents of Exhibits and Schedules to the Royal Surplus Lines Insurance Company Quota Share Reinsurance Agreement, filed as Exhibit 10.7 to Alleghany’s Quarterly Report on Form 10-Q for the quarter ended June 30, 2003, is incorporated herein by reference. Alleghany agrees to furnish supplementally a copy of any omitted exhibit or schedule to the Securities and Exchange Commission upon request. | ||
| 10 | .17(a) | Quota Share Reinsurance Agreement, dated as of July 1, 2003, by and between Landmark and RIC (the “Landmark Quota Share Reinsurance Agreement”), filed as Exhibit 10.8 to Alleghany’s Quarterly Report on Form 10-Q for the quarter ended June 30, 2003, is incorporated herein by reference. | ||
| 10 | .17(b) | List of Contents of Exhibits and Schedules to the Landmark Quota Share Reinsurance Agreement, filed as Exhibit 10.9 to Alleghany’s Quarterly Report on Form 10-Q for the quarter ended June 30, 2003, is incorporated herein by reference. Alleghany agrees to furnish supplementally a copy of any omitted exhibit or schedule to the Securities and Exchange Commission upon request. | ||
| 10 | .18(a) | Administrative Services Agreement, dated as of July 1, 2003, by and among Royal Indemnity Company, Resurgens Specialty and RIC (the “Royal Indemnity Company Administrative Services Agreement”), filed as Exhibit 10.10 to Alleghany’s Quarterly Report on Form 10-Q for the quarter ended June 30, 2003, is incorporated herein by reference. | ||
| 10 | .18(b) | List of Contents of Exhibits and Schedules to the Royal Indemnity Company Administrative Services Agreement, filed as Exhibit 10.11 to Alleghany’s Quarterly Report on Form 10-Q for the quarter ended June 30, 2003, is incorporated herein by reference. Alleghany agrees to furnish supplementally a copy of any omitted exhibit or schedule to the Securities and Exchange Commission upon request. | ||
| 10 | .19(a) | Administrative Services Agreement, dated as of July 1, 2003, by and among Royal Surplus Lines Insurance Company, Resurgens Specialty and RIC (the “Royal Surplus Lines Insurance Company Administrative Services Agreement”), filed as Exhibit 10.12 to Alleghany’s Quarterly Report on Form 10-Q for the quarter ended June 30, 2003, is incorporated herein by reference. | ||
| 10 | .19(b) | List of Contents of Exhibits and Schedules to the Royal Surplus Lines Insurance Company Administrative Services Agreement, filed as Exhibit 10.13 to Alleghany’s Quarterly Report on Form 10-Q for the quarter ended June 30, 2003, is incorporated herein by reference. Alleghany agrees to furnish supplementally a copy of any omitted exhibit or schedule to the Securities and Exchange Commission upon request. | ||
| 10 | .20(a) | Administrative Services Agreement, dated as of July 1, 2003, by and among Royal Insurance Company of America, Resurgens Specialty and RIC (the “Royal Insurance Company of America Administrative Services Agreement”), filed as Exhibit 10.14 to Alleghany’s Quarterly Report on Form 10-Q for the quarter ended June 30, 2003, is incorporated herein by reference. | ||
| 10 | .20(b) | List of Contents of Exhibits and Schedules to the Royal Insurance Company of America Administrative Services Agreement, filed as Exhibit 10.15 to Alleghany’s Quarterly Report on Form 10-Q for the quarter ended June 30, 2003, is incorporated herein by reference. Alleghany agrees to furnish supplementally a copy of any omitted exhibit or schedule to the Securities and Exchange Commission upon request. | ||
129
Table of Contents
|
Exhibit
|
||||
|
Number
|
Description
|
|||
| 10 | .21(a) | Administrative Services Agreement, dated as of July 1, 2003, by and among Landmark, Resurgens Specialty and RIC (the “Landmark Administrative Services Agreement”), filed as Exhibit 10.16 to Alleghany’s Quarterly Report on Form 10-Q for the quarter ended June 30, 2003, is incorporated herein by reference. | ||
| 10 | .21(b) | List of Contents of Exhibits and Schedules to the Landmark Administrative Services Agreement, filed as Exhibit 10.17 to Alleghany’s Quarterly Report on Form 10-Q for the quarter ended June 30, 2003, is incorporated herein by reference. Alleghany agrees to furnish supplementally a copy of any omitted exhibit or schedule to the Securities and Exchange Commission upon request. | ||
| 10 | .22 | Administrative Services Intellectual Property License Agreement, dated as of July 1, 2003, by and between Royal Indemnity Company and Resurgens Specialty (entered into pursuant to the Royal Indemnity Company Administrative Services Agreement), filed as Exhibit 10.21 to Alleghany’s Quarterly Report on Form 10-Q for the quarter ended June 30, 2003, is incorporated herein by reference. | ||
| 10 | .23 | Administrative Services Intellectual Property License Agreement, dated as of July 1, 2003, by and between Royal Indemnity Company and Resurgens Specialty (entered into pursuant to the Royal Surplus Lines Insurance Company Administrative Services Agreement), filed as Exhibit 10.22 to Alleghany’s Quarterly Report on Form 10-Q for the quarter ended June 30, 2003, is incorporated herein by reference. | ||
| 10 | .24 | Administrative Services Intellectual Property License Agreement, dated as of July 1, 2003, by and between Royal Indemnity Company and Resurgens Specialty (entered into pursuant to the Royal Insurance Company of America Administrative Services Agreement), filed as Exhibit 10.23 to Alleghany’s Quarterly Report on Form 10-Q for the quarter ended June 30, 2003, is incorporated herein by reference. | ||
| 10 | .25 | Administrative Services Intellectual Property License Agreement, dated as of July 1, 2003, by and between Royal Indemnity Company and Resurgens Specialty (entered into pursuant to the Landmark Administrative Services Agreement), filed as Exhibit 10.24 to Alleghany’s Quarterly Report on Form 10-Q for the quarter ended June 30, 2003, is incorporated herein by reference. | ||
| 10 | .26(a) | Stock Purchase Agreement, dated as of June 6, 2003, by and between AIHL and Guaranty National Insurance Company (the “Landmark Stock Purchase Agreement”), filed as Exhibit 10.42 to Alleghany’s Quarterly Report on Form 10-Q for the quarter ended June 30, 2003, is incorporated herein by reference. | ||
| 10 | .26(b) | List of Contents of Exhibits and Schedules to the Landmark Stock Purchase Agreement, filed as Exhibit 10.43 to Alleghany’s Quarterly Report on Form 10-Q for the quarter ended June 30, 2003, is incorporated herein by reference. Alleghany agrees to furnish supplementally a copy of any omitted exhibit or schedule to the Securities and Exchange Commission upon request. | ||
| 10 | .27(a) | Stock Purchase Agreement, dated as of June 12, 2003, by and between Swiss Re America Holding Corporation and RSUI (the “RIC Stock Purchase Agreement”), filed as Exhibit 10.44 to Alleghany’s Quarterly Report on Form 10-Q for the quarter ended June 30, 2003, is incorporated herein by reference. | ||
| 10 | .27(b) | List of Contents of Exhibits and Schedules to the RIC Stock Purchase Agreement, filed as Exhibit 10.45 to Alleghany’s Quarterly Report on Form 10-Q for the quarter ended June 30, 2003, is incorporated herein by reference. Alleghany agrees to furnish supplementally a copy of any omitted exhibit or schedule to the Securities and Exchange Commission upon request. | ||
| 10 | .28(a) | RIC (Landmark) Quota Share Reinsurance Agreement, dated as of September 2, 2003, by and between Landmark and Royal Indemnity Company (the “Royal Indemnity Company (Landmark) Quota Share Reinsurance Agreement”), filed as Exhibit 10.2 to Alleghany’s Quarterly Report on Form 10-Q for the quarter ended September 30, 2003, is incorporated herein by reference. | ||
130
Table of Contents
|
Exhibit
|
||||
|
Number
|
Description
|
|||
| 10 | .28(b) | List of Contents of Exhibits and Schedules to the Royal Indemnity Company (Landmark) Quota Share Reinsurance Agreement, filed as Exhibit 10.3 to Alleghany’s Quarterly Report on Form 10-Q for the quarter ended September 30, 2003, is incorporated herein by reference. Alleghany agrees to furnish supplementally a copy of any omitted exhibit or schedule to the Securities and Exchange Commission upon request. | ||
| 10 | .29(a) | RIC (Landmark) Administrative Services Agreement, dated as of September 2, 2003, by and between Royal Indemnity Company and Landmark (the “Royal Indemnity Company (Landmark) Administrative Services Agreement”), filed as Exhibit 10.4 to Alleghany’s Quarterly Report on Form 10-Q for the quarter ended September 30, 2003, is incorporated herein by reference. | ||
| 10 | .29(b) | List of Contents of Exhibits and Schedules to the Royal Indemnity Company (Landmark) Administrative Services Agreement, filed as Exhibit 10.5 to Alleghany’s Quarterly Report on Form 10-Q for the quarter ended September 30, 2003, is incorporated herein by reference. Alleghany agrees to furnish supplementally a copy of any omitted exhibit or schedule to the Securities and Exchange Commission upon request. | ||
| 10 | .30(a) | Stock Purchase Agreement, dated as of May 19, 2005, by and among Imerys USA, Inc., Imerys, S.A. and Alleghany (the “Imerys Stock Purchase Agreement”), filed as Exhibit 10.1(a) to Alleghany’s Current Report on Form 8-K filed on May 23, 2005, is incorporated herein by reference. | ||
| 10 | .30(b) | List of Contents of Exhibits and Schedules to the Imerys Stock Purchase Agreement, filed as Exhibit 10.1(b) to Alleghany’s Current Report on Form 8-K filed on May 23, 2005, is incorporated herein by reference. Alleghany agrees to furnish supplementally a copy of any omitted exhibit or schedule to the Securities and Exchange Commission upon request. | ||
| 10 | .31 | Agreement and Plan of Merger, dated as of June 27, 2008, by and among Darwin, AWAC and Allied World Merger Company, filed as Exhibit 2.1 to Alleghany’s Current Report on Form 8-K filed on June 30, 2008, is incorporated herein by reference. | ||
| 10 | .32 | Voting Agreement, dated as of June 27, 2008, by and between AIHL and AWAC, filed as Exhibit 10.1 to Alleghany’s Current Report on Form 8-K filed on June 30, 2008, is incorporated herein by reference. | ||
| 21 | List of subsidiaries of Alleghany. | |||
| 23 | Consent of KPMG LLP, independent registered public accounting firm, to the incorporation by reference of its reports relating to the financial statements, the related schedules of Alleghany and subsidiaries and its attestation report. | |||
| 31 | .1 | Certification of the Chief Executive Officer of Alleghany pursuant to Section 302 of the Sarbanes-Oxley Act of 2002. | ||
| 31 | .2 | Certification of the Chief Financial Officer of Alleghany pursuant to Section 302 of the Sarbanes-Oxley Act of 2002. | ||
| 32 | .1 | Certification of the Chief Executive Officer of Alleghany pursuant to 18 U.S.C. Section 1350, as adopted pursuant to Section 906 of the Sarbanes-Oxley Act of 2002. This exhibit shall not be deemed “filed” as a part of this Annual Report on Form 10-K. | ||
| 32 | .2 | Certification of the Chief Financial Officer of Alleghany pursuant to 18 U.S.C. Section 1350, as adopted pursuant to Section 906 of the Sarbanes-Oxley Act of 2002. This exhibit shall not be deemed “filed” as a part of this Annual Report on Form 10-K. | ||
131