YRC WORLDWIDE INC.
10-Ks and 10-Qs
|
|
|
|
|
|
|
|
|
|
|
|
|
|
|
|
|
|
|
|
|
|
|
|
|
|
|
|
|
|
|
|
|
|
|
|
|
|
|
|
|
|
|
|
|
|
|
|
|
|
UNITED STATES
SECURITIES AND EXCHANGE COMMISSION
WASHINGTON, D.C. 20549
FORM 10-K
|
ý
|
ANNUAL REPORT PURSUANT TO SECTION 13 OR 15(d) OF THE SECURITIES EXCHANGE ACT OF 1934
|
For the fiscal year ended
December 31, 2014
OR
|
o
|
TRANSITION REPORT PURSUANT TO SECTION 13 OR 15(d) OF THE SECURITIES EXCHANGE ACT OF 1934
|
For the transition period from
to
Commission file number: 0-12255
YRC Worldwide Inc.
(Exact name of registrant as specified in its charter)
|
Delaware
|
48-0948788
|
|
|
(State or other jurisdiction of
|
(I.R.S. Employer
|
|
|
incorporation or organization)
|
Identification No.)
|
|
|
10990 Roe Avenue, Overland Park, Kansas
|
66211
|
|
|
(Address of principal executive offices)
|
(Zip Code)
|
|
(913) 696-6100
(Registrant’s telephone number, including area code)
Securities registered pursuant to Section 12(b) of the Act:
|
Title of each class
|
|
Name of each exchange on which registered
|
|
Common Stock, $0.01 par value per share
|
|
The NASDAQ Stock Market LLC
|
Securities registered pursuant to Section 12(g) of the Act: NONE
Indicate by check mark if the registrant is a well-known seasoned issuer as defined in Rule 405 of the Securities Act.
Yes
o
No
ý
Indicate by check mark if the registrant is not required to file reports pursuant to Section 13 or 15(d) of the Exchange Act. Yes
o
No
ý
Indicate by check mark whether the registrant (1) has filed all reports required to be filed by Section 13 or 15(d) of the Securities Exchange Act of 1934 during the preceding 12 months (or for such shorter period that the registrant was required to file such reports), and (2) has been subject to such filing requirements for the past 90 days.
Yes
ý
No
o
Indicate by check mark whether the registrant has submitted electronically and posted on its corporate Web site, if any, every Interactive Data File required to be submitted and posted pursuant to Rule 405 of Regulation S-T during the preceding 12 months (or for such shorter period that the registrant was required to submit and post such files).
Yes
ý
No
o
Indicate by check mark if disclosure of delinquent filers pursuant to Item 405 of Regulation S-K is not contained herein, and will not be contained, to the best of registrant’s knowledge, in definitive proxy or information statements incorporated by referenced in Part III of this Form 10-K or any amendment to this Form 10-K.
o
Indicate by check mark whether the registrant is a large accelerated filer, an accelerated filer, a non-accelerated filer or a smaller reporting company. See the definitions of “large accelerated filer,” “accelerated filer” and “smaller reporting company” in Rule 12b-2 of the Exchange Act.
|
Large accelerated filer
|
ý
|
Accelerated filer
|
o
|
|||
|
Non-accelerated filer
|
o
(Do not check if a smaller reporting company)
|
Smaller reporting company
|
o
|
|||
Indicate by check mark whether the registrant is a shell company (as defined in Rule 12b-2 of the Exchange Act).
Yes
o
No
ý
As of
June 30, 2014
, the aggregate market value of the registrant’s common stock held by non-affiliates of the registrant was
$860.8 million
based on the closing price as reported on the NASDAQ Global Select Market.
Indicate the number of shares outstanding of each of the issuer’s classes of common stock, as of the latest practicable date.
|
Class
|
Outstanding at February 13, 2015
|
|
|
Common Stock, $0.01 par value per share
|
31,673,173 shares
|
|
DOCUMENTS INCORPORATED BY REFERENCE
Pursuant to General Instruction G to Form 10-K, information required by Part III of this Form 10-K, either is incorporated herein by reference to a definitive proxy statement filed with the SEC no later than 120 days after the end of the fiscal year covered by this Form 10-K or will be included in an amendment to this Form 10-K filed with the SEC no later than 120 days after the end of the fiscal year covered by this Form 10-K.
INDEX
|
Item
|
Page
|
|
|
PART I
|
||
|
1
|
||
|
1A
|
||
|
1B
|
||
|
2
|
||
|
3
|
||
|
4
|
||
|
PART II
|
||
|
5
|
||
|
6
|
||
|
7
|
||
|
7A
|
||
|
8
|
||
|
9
|
||
|
9A
|
||
|
9B
|
||
|
PART III
|
||
|
10
|
||
|
11
|
||
|
12
|
||
|
13
|
||
|
14
|
||
|
PART IV
|
||
|
15
|
||
3
Note on Forward-Looking Statements
This entire report, including (among other items) Item 7, “Management’s Discussion and Analysis of Financial Condition and Results of Operations” includes forward-looking statements (each a “forward-looking statement”) within the meaning of Section 27A of the Securities Act of 1933, as amended (the “Securities Act”), and Section 21E of the Securities Exchange Act of 1934, as amended (“Exchange Act”). Forward-looking statements include those preceded by, followed by or including the words “will,” “expect,” “intend,” “anticipate,” “believe,” “project,” “forecast,” “propose,” “plan,” “designed,” “estimate,” “enable” and similar expressions. Those forward-looking statements speak only as of the date of this report. We disclaim any obligation to update those statements, except as applicable law may require us to do so, and we caution you not to rely unduly on them. We have based those forward-looking statements on our current expectations and assumptions about future events, which may prove to be inaccurate. While our management considers those expectations and assumptions to be reasonable, they are inherently subject to significant business, economic, competitive, regulatory and other risks, contingencies and uncertainties, most of which are difficult to predict and many of which are beyond our control. Therefore, actual results may differ materially and adversely from those expressed in any forward-looking statements. Factors that might cause or contribute to such differences include, but are not limited to, those we discuss in this report under the section entitled “Risk Factors” in Item 1A and the section entitled “Financial Condition/Liquidity and Capital Resources” in Item 7, “Management’s Discussion and Analysis of Financial Condition and Results of Operations,” and in other reports we file with the Securities and Exchange Commission (the “SEC”). The factors we discuss in this report are not necessarily all the important factors that could affect us. Unpredictable or unknown factors we have not discussed in this report also could have material adverse effects on actual results of matters that are the subject of our forward-looking statements. We do not intend to update our description of important factors each time a potential important factor arises. We advise our existing and potential security holders that they should (1) be aware that important factors to which we do not refer in this report could affect the accuracy of our forward-looking statements and (2) use caution and common sense when considering our forward-looking statements.
General Description of the Business
YRC Worldwide Inc. (also referred to as “YRC Worldwide,” the “Company,” “we,” “us” or “our”) is a holding company that, through wholly owned operating subsidiaries and its interest in a Chinese joint venture, offers its customers a wide range of transportation services. We have one of the largest, most comprehensive less-than-truckload (“LTL”) networks in North America with local, regional, national and international capabilities. Through our team of experienced service professionals, we offer flexible supply chain solutions, ensuring customers can ship industrial, commercial and retail goods with confidence. Our reporting segments include the following:
|
•
|
YRC Freight is the reporting segment focused on business opportunities in national, regional and international markets. YRC Freight provides for the movement of industrial, commercial and retail goods, primarily through our subsidiary YRC Inc. (“YRC Freight”) and Reimer Express (“YRC Reimer”), a subsidiary located in Canada that specializes in shipments into, across and out of Canada. In addition to the United States and Canada, YRC Freight also serves parts of Mexico, Puerto Rico and Guam.
|
|
•
|
Regional Transportation is the reporting segment for our transportation service providers focused on business opportunities in the regional and next-day delivery markets. Regional Transportation is comprised of USF Holland Inc. (“Holland”), New Penn Motor Express, Inc. (“New Penn”) and USF Reddaway Inc. (“Reddaway”). These companies each provide regional, next-day ground services in their respective regions through a network of facilities located across the United States, Canada, Mexico and Puerto Rico.
|
For revenue and other information regarding our reporting segments, see the “Business Segments” footnote of our consolidated financial statements.
Incorporated in Delaware in 1983 and headquartered in Overland Park, Kansas, we employed approximately
33,000
people as of
December 31, 2014
. The mailing address of our headquarters is 10990 Roe Avenue, Overland Park, Kansas 66211, and our telephone number is (913) 696-6100. Our website is www.yrcw.com. Through the “SEC Filings” link on our website, we make available the following filings as soon as reasonably practicable after they are electronically filed with or furnished to the SEC: our Annual Report on Form 10-K, Quarterly Reports on Form 10-Q, Current Reports on Form 8-K, and any amendments to those reports filed
4
or furnished pursuant to Section 13(a) or 15(d) of the Exchange Act. All of these filings may be viewed or printed from our website free of charge.
Narrative Description of the Business
YRC Freight
YRC Freight offers a full range of services for the transportation of industrial, commercial and retail goods in national, regional and international markets, primarily through the operation of owned or leased equipment in its respective North American ground distribution networks. Transportation services are provided for various categories of goods, which may include (among others) apparel, appliances, automotive parts, chemicals, food, furniture, glass, machinery, metal, metal products, non-bulk petroleum products, rubber, textiles, wood and other manufactured products or components. YRC Freight provides both LTL services, which combine shipments from multiple customers on a single trailer, and truckload services. Deliveries are predominately LTL shipments with truckload services offered to maximize equipment utilization and reduce empty miles (the distance empty or partially full trailers travel to balance the network). YRC Freight also provides higher-margin specialized services, including guaranteed expedited services, time-specific deliveries, cross-border services, coast-to-coast air delivery, product returns, temperature-sensitive shipment protection and government material shipments.
YRC Freight serves manufacturing, wholesale, retail and government customers throughout North America. YRC Freight’s
20,000
employees are dedicated to operating its extensive network which supports approximately
11.5 million
shipments annually. YRC Freight shipments have an average shipment size of approximately
1,200 pounds
and travel an average distance of roughly
1,300 miles
. Operations research and engineering teams centrally coordinate the equipment, routing, sequencing and timing necessary to efficiently transport shipments through its network. On
December 31, 2014
, YRC Freight’s revenue fleet was comprised of approximately
8,300
tractors, including approximately
7,200
owned tractors and
1,100
leased tractors, and approximately
32,800
trailers, including approximately
29,100
owned trailers and
3,700
leased trailers. The YRC Freight network includes
259
strategically located service facilities including
125
owned facilities with
8,211
doors and
134
leased facilities with
5,979
doors.
YRC Freight provides services throughout North America, has one of the largest networks of LTL service centers, equipment and transportation professionals and provides flexible and efficient supply chain solutions including:
|
•
|
Standard LTL:
one-stop shopping for all big-shipment national LTL freight needs with centralized customer service for LTL shipping among the countries of North America. YRC Freight offers flexibility, convenience and reliability that comes with one national freight shipping provider.
|
|
•
|
Guaranteed Standard:
a guaranteed on-time service with more direct points than any other guaranteed standard delivery service in North America. Our guaranteed multiple-day window service is designed to meet retail industry needs to reduce chargeback fees.
|
|
•
|
Time-Critical:
for expedited and specialized shipments including
emergency and window deliveries via ground or air anywhere in North America with shipment arrival timed to the hour or day, proactive notification and a 100% on-time guarantee.
|
|
•
|
Specialized Solutions:
includes a variety of services to meet industry and customer-specific needs with offerings such as Custom Projects, Consolidation and Distribution, Reverse Logistics, Residential White Glove, and Exhibit Services.
|
|
•
|
my.yrcfreight.com:
a secure e-commerce website offering online resources for supply chain visibility and shipment management in real time.
|
YRC Freight includes the operations of its wholly owned Canadian subsidiary, YRC Reimer. Founded in 1952, YRC Reimer offers Canadian shippers a selection of direct connections within Canada, throughout North America and around the world. YRC Reimer is also a part of YRC Freight and its operating network and information systems are completely integrated with those of YRC Freight, enabling YRC Reimer to provide seamless cross-border services between Canada, Mexico and the United States and markets overseas.
YRC Freight represented
64%
,
64%
and
66%
of our consolidated revenue in
2014
,
2013
and
2012
, respectively.
5
Regional Transportation
Regional Transportation is comprised of Holland, New Penn and Reddaway:
|
•
|
Holland:
headquartered in Holland, Michigan, provides local next-day, regional and expedited services through a network located in 21 states in the Midwestern and Southeastern portions of the United States. Holland also provides service to the provinces of Ontario and Quebec, Canada.
|
|
•
|
New Penn:
headquartered in Lebanon, Pennsylvania, provides local next-day, day-definite, and time-definite services through a network located in the Northeastern United States; Quebec, Canada; and Puerto Rico.
|
|
•
|
Reddaway:
headquartered in Tualatin, Oregon, provides local next-day, regional and expedited services through a network located in California, the Pacific Northwest, the Rocky Mountain States and the Southwest. Additionally, Reddaway provides services to Alaska, Hawaii and to the provinces of Alberta and British Columbia, Canada.
|
Together, the Regional Transportation companies deliver services in the next-day, second-day and time-sensitive markets, which are among the fastest-growing transportation segments. The Regional Transportation service portfolio includes:
|
•
|
Regional delivery:
including next-day local area delivery and second-day services; consolidation/distribution services; protect-from-freezing and hazardous materials handling; and a variety of other specialized offerings.
|
|
•
|
Expedited delivery:
including day-definite, hour-definite and time-definite capabilities.
|
|
•
|
Interregional delivery:
combining our best-in-class regional networks with reliable sleeper teams, Regional Transportation provides reliable, high-value services between our regional operations.
|
|
•
|
Cross-border delivery:
through strategic partnerships, the Regional Transportation companies provide full-service capabilities between the United States and Canada, Mexico and Puerto Rico.
|
|
•
|
my.yrcregional.com and NewPenn.com:
are e-commerce websites offering secure and customized online resources to manage transportation activity.
|
The Regional Transportation companies’ approximately
12,000
employees serve manufacturing, wholesale, retail and government customers throughout North America which supports approximately
11 million
shipments annually. Regional Transportation shipments have an average shipment size of approximately
1,300
pounds and travel an average distance of roughly
400
miles. At
December 31, 2014
, the Regional Transportation network includes
125
service facilities including
62
owned facilities with
3,903
doors and
63
leased facilities with
2,825
doors. The Regional Transportation revenue fleet includes approximately
6,400
tractors including approximately
5,500
owned and
900
leased and approximately
13,000
trailers including approximately
11,600
owned and
1,400
leased.
The Regional Transportation companies accounted for
36%
,
36%
and
34%
of our consolidated operating revenue
in 2014, 2013 and 2012
, respectively.
Parent Company
YRC Worldwide, headquartered in Overland Park, Kansas, has approximately
300
employees. The parent company provides centrally managed support to our operating companies that spans a variety of functions, including components of finance, legal, risk management and security.
Each of our shared services organizations charges the operating companies for their services, either based upon usage or on an overhead allocation basis.
Competition
Our companies operate in a highly competitive environment. Given the growth of U.S. import/export trade, our competitors include global, integrated freight transportation services providers; global freight forwarders; national freight services providers including intermodal providers; regional or interregional carriers; third party logistics providers; and small, intraregional transportation companies. Our companies also have competitors within several different modes of transportation including: LTL,
6
truckload, air and ocean cargo, intermodal rail, parcel and package companies, transportation consolidators, reverse logistics firms, and and privately owned fleets.
Ground-based transportation includes private fleets and “for-hire” provider groups. The private provider segment consists of fleets owned by companies that move their own goods and materials. The “for-hire” groups are classified based on the typical shipment sizes that they handle. Truckload refers to providers transporting shipments that generally fill an entire 48-foot or 53-foot trailer, and LTL refers to providers transporting goods from multiple shippers in a single trailer.
LTL transportation providers consolidate numerous shipments generally ranging from 100 to 10,000 pounds from varying businesses at individual service centers in close proximity to where those shipments originated. Utilizing expansive networks of pickup and delivery operations around local service centers, shipments are moved between origin and destination using distribution centers when necessary, where consolidation and deconsolidation of shipments occur. Depending on the distance shipped, shared load providers are often classified into one of four sub-groups:
|
•
|
Regional - Average distance is typically less than 500 miles with a focus on one- and two-day delivery times. Regional transportation companies can move shipments directly to their respective destination centers, which increases service reliability and avoids costs associated with intermediate handling.
|
|
•
|
Interregional - Average distance is usually between 500 and 1,000 miles with a focus on two- and three-day delivery times. There is a competitive overlap between regional and national providers in this category, as each group sees the interregional segment as a growth opportunity, and few providers focus exclusively on this sector.
|
|
•
|
National - Average distance is typically in excess of 1,000 miles with focus on two- to five-day delivery times. National providers rely on intermediate shipment handling through a network of facilities, which require numerous satellite service centers, multiple distribution centers and a relay network. To gain service and cost advantages, they often ship directly between service centers, minimizing intermediate handling.
|
|
•
|
Global - Providing freight forwarding and final-mile delivery services to companies shipping to and from multiple regions around the world. This service can be offered through a combination of owned assets or through a purchased transportation model.
|
YRC Freight provides services in all four sub-groups in North America. Holland, New Penn and Reddaway compete in the regional, interregional and national transportation marketplace. Each brand competes against a number of providers in these markets from small firms with one or two vehicles to global competitors with thousands of physical assets. While we have competitors with a similar multi-dimensional approach, there are few in the traditional LTL segment with as comprehensive an offering in those categories as our family of companies provide.
Competitive cost of entry into the asset-based LTL sector on a small scale, within a limited service area, is relatively small (although more than in other sectors of the transportation industry). The larger the service area, the greater the barriers to entry, due primarily to the need for additional equipment and facilities associated with broader geographic service coverage. Broader market coverage in the competitive transportation landscape also requires increased technology investment and the ability to capture cost efficiencies from shipment density (scale), making entry on a national basis more difficult. Further development of density-based pricing strategies will require carriers to make investments in scanning and measuring technologies, something that we have already taken significant steps toward. Other competitors in our categories are also making investments in this technology at varying speeds.
Regulation
Our operating companies and other interstate carriers were substantially deregulated following the enactment of the Motor Carrier Act of 1980, the Trucking Industry Regulatory Reform Act of 1994, the Federal Aviation Administration Authorization of 1994 and the ICC Termination Act of 1995. Prices and services are now largely free of regulatory controls, although the states retained the right to require compliance with safety and insurance requirements, and interstate motor carriers remain subject to regulatory controls that agencies within the U.S. Department of Transportation impose.
Our companies are subject to regulatory and legislative changes, which can affect our economics and those of our competitors. Among potential regulatory changes are potential revisions to rules governing hours of service for commercial truck drivers and safety programs that could impact the pool of available drivers. Various federal and state agencies regulate us, and our operations are also subject to various federal, foreign, state, provincial and local environmental laws and regulations dealing with transportation, storage, presence, use, disposal and handling of hazardous materials, emissions related to the use of petroleum based fuels, discharge of storm-water and underground fuel storage tanks. Our drivers and facility employees are protected by occupational safety and health regulations and our drivers by hours of service regulations. We are also subject to regulations to
7
combat terrorism that the U.S. Department of Homeland Security and other agencies impose. See the Risk Factors section related to our compliance with laws and regulations in Item 1A of this report.
Environmental Matters
Our operations are subject to U.S. federal, foreign, state, provincial and local regulations with regard to air and water quality and other environmental matters. We believe that we are in substantial compliance with these regulations. Regulations in this area continue to evolve and changes in standards of enforcement of existing regulations, as well as the enactment and enforcement of new legislation or regulation, may require us and our customers to modify, supplement or replace equipment or facilities or to change or discontinue present methods of operation.
Our companies store fuel for use in our revenue equipment in approximately 264 underground storage tanks (“USTs”) located throughout the United States. Maintenance of such USTs is regulated at the federal and, in some cases, state level. The USTs are required to have leak detection systems and are required to be extracted upon our exiting the property. Traditionally upon sale of properties containing USTs, the UST is considered an asset in the transaction and, as such, we contractually transfer this removal obligation to the buyer, or remove the UST at closing at the buyer’s expense.
During 2014, we spent approximately $8.0 million to comply with U.S. federal, state and local provisions regulating the discharge of materials into the environment or otherwise relating to the protection of the environment (collectively, “Environmental Regulations”). In 2015, we expect to spend approximately $8.2 million to comply with the Environmental Regulations. Based upon current information, we believe that our compliance with Environmental Regulations will not have a material adverse effect upon our capital expenditures, results of operations or competitive position because we have either made adequate reserves for such compliance expenditures or the cost for such compliance is expected to be small in comparison with our overall expenses.
The Comprehensive Environmental Response, Compensation and Liability Act (known as the “Superfund Act”) imposes liability for the release of a “hazardous substance” into the environment. Superfund liability is imposed without regard to fault and even if the waste disposal was in compliance with then current laws and regulations. With the joint and several liabilities imposed under the Superfund Act, a potentially responsible party (“PRP”) may be required to pay more than its proportional share of such environmental remediation. Several of our subsidiaries have been identified as PRPs at various sites discussed below. The U.S. Environmental Protection Agency (the “EPA”) and appropriate state agencies are supervising investigative and cleanup activities at these sites.
|
•
|
The EPA has identified the former Yellow Transportation (now a part of YRC Freight) as a PRP for two
locations: Angeles Chemical Co., Santa Fe Springs, CA and Alburn Incinerator, Inc., Chicago, IL. We estimate that the combined potential costs at these two sites to be $0.1 million. With respect to these sites, it appears that YRC Freight delivered minimal amounts of waste to these sites, as compared to other respondents.
|
|
•
|
The EPA has identified the former Roadway Express (now a part of YRC Freight) as a PRP for two locations: Ward Transformer, Raleigh, NC and Berry’s Creek, Carlstadt, NJ. We estimate that the potential cost for the Ward Transformer site to be $0.5 million. The EPA has notified YRC Inc. and 140 other potential parties of their potential responsibility status at the Berry’s Creek site where YRC Freight owns and operates a service center in the watershed area that discharges into Berry’s Creek. We estimate the Berry’s Creek potential cost to be $1.2 million.
|
|
•
|
The EPA has issued YRC Worldwide a Request for Information regarding current and former Yellow Transportation and Roadway Express (now YRC Freight) facilities adjacent to or in close proximity of Newtown Creek, NY and its tributaries. YRC Worldwide and its operating companies have not been named as a PRP in this matter, but YRC Freight has entered into a tolling agreement with the Newtown Creek Group (NCG). The NCG is comprised of five companies who have agreed to perform a Remedial Investigation and Feasibility Study under the supervision of the EPA.
|
|
•
|
The EPA has identified USF Red Star, a non-operating subsidiary, as a PRP at three locations: Booth Oil, N. Tonawanda, NY and two separate landfills in Byron, NY, and Moira, NY. We believe the potential combined costs at these sites to be $0.3 million.
|
|
•
|
The EPA has identified Holland as a PRP for one location, Horton Sales Piedmont Site, Greenville County, SC. We believe the potential cost at this site will be insignificant.
|
While PRPs in Superfund actions have joint and several liabilities for all costs of remediation, it is not possible at this time to quantify our ultimate exposure because the projects are either in the investigative or early remediation stage. Based upon current information, we do not believe that probable or reasonably possible expenditures in connection with the sites described above are likely to have a material adverse effect on our financial condition or results of operations because:
8
|
•
|
To the extent necessary, we have established adequate reserves to cover the estimate we presently believe will be our liability with respect to the matter;
|
|
•
|
We and our subsidiaries have only limited or de minimis involvement in the sites based upon volumetric calculations; and
|
|
•
|
Other PRPs involved in the sites have substantial assets and may reasonably be expected to pay a larger share of the cost of remediation.
|
We are subject to various other governmental proceedings and regulations, including foreign regulations, relating to environmental matters and are investigating potential violations of Environmental Regulations with respect to certain sites, but we do not believe that any of these matters or investigations are likely to have a material adverse effect on our business, financial condition, liquidity or results of operations.
This section, “Environmental Matters,” contains forward-looking statements within the meaning of Section 27A of the Securities Act, as amended (the “Securities Act”), and Section 21E of the Exchange Act. The words “will,” “expect,” “intend,” “anticipate,” “believe,” “project,” “forecast,” “propose,” “plan,” “designed,” “estimate,” “enable” and similar expressions are intended to identify forward-looking statements. Our expectations regarding our compliance with Environmental Regulations and our expenditures to comply with Environmental Regulations, including (without limitation) our capital expenditures on environmental control equipment, and the effect that liability from Environmental Regulation or Superfund sites may have on our competitive position, financial condition or results of operations, are only our expectations regarding these matters. These expectations may be substantially different from actual results, which may be affected by the following factors: changes in Environmental Regulations; unexpected, adverse outcomes with respect to sites where we have been named as a PRP, including (without limitation) the sites described above, and to sites in which we are investigating potential violations of Environmental Regulations; the discovery of new sites of which we are not aware and where additional expenditures may be required to comply with Environmental Regulations; an unexpected discharge of hazardous materials in the course of our business or operations; an acquisition of one or more new businesses; a catastrophic event causing discharges into the environment of hydrocarbons; the inability of other PRPs to pay their share of liability for a Superfund site; and a material change in the allocation to us of the volume of discharge and a resulting change in our liability as a PRP with respect to a site.
Economic Factors and Seasonality
Our business is subject to a number of general economic factors that may have a material adverse effect on the results of our operations, many of which are largely out of our control. These include the impact of recessionary economic cycles and downturns in individual customer’s business cycles, particularly in market segments and industries, such as retail and manufacturing, where we have a significant concentration of customers. Economic conditions may adversely affect our customers’ business levels, the amount of transportation services they need and their ability to pay for our services. We operate in a highly price-sensitive and competitive industry, making industry pricing actions, quality of customer service, effective asset utilization and cost control major competitive factors. All of our revenues are subject to seasonal variations. Customers tend to reduce shipments just prior to and after the winter holiday season, and operating expenses as a percent of revenue tend to be higher, and operating cash flows as a percent of revenue tend to be lower, in the winter months primarily due to colder weather and seasonally lower levels of shipments and the seasonal timing of expenditures. Generally, most of the first quarter and the latter part of the fourth quarter are the seasonally weakest while the second and third quarters are the seasonally strongest. The availability and cost of labor and other operating cost inputs, such as fuel and equipment maintenance and equipment replacements, can significantly impact our overall cost, competitive position within our industry and our resulting earnings and cash flows.
Financial Information About Geographic Areas
Our revenue from foreign sources is mainly derived from Canada and, to a lesser extent, Mexico. We have certain long-lived assets located in these areas as well. We discuss this information in the “Business Segments” footnote to our consolidated financial statements.
9
In addition to the risks and uncertainties described elsewhere in this report or in our other SEC filings, the following risk factors should be considered carefully in evaluating us. These risks could have a material adverse effect on our business, financial condition and results of operations.
Liquidity Risks
Our substantial indebtedness and cash interest payment obligations, lease obligations and pension funding obligations could adversely affect our financial flexibility and our competitive position.
As of
December 31, 2014
, we were substantially leveraged with
$1,116.2 million
in aggregate par value of outstanding indebtedness. We also have, and will continue to have, significant lease obligations. As of
December 31, 2014
, our expected minimum cash payments under our operating leases for
2015
are
$63.6 million
and our operating lease obligations totaled
$194.5 million
, which are primarily payable through 2019. We currently plan to procure a portion of our new revenue equipment using operating leases in 2015 and beyond. We expect our funding obligations in 2015 under our single-employer pension plans and the multi-employer pension funds will be approximately
$151.9 million
. Our substantial indebtedness, lease obligations and pension funding obligations could continue to have a significant impact on our business.
For example, it could:
|
•
|
increase our vulnerability to adverse changes or sustained slow growth in general economic, industry and competitive conditions;
|
|
•
|
require us to dedicate a substantial portion of our cash flow from operations to make payments on our indebtedness, leases and pension funding obligations, thereby reducing the availability of our cash flow to fund working capital, capital expenditures and other general corporate purposes;
|
|
•
|
limit our flexibility in planning for, or reacting to, changes in our business and the industry in which we operate;
|
|
•
|
restrict us from taking advantage of business opportunities;
|
|
•
|
make it more difficult to satisfy our financial obligations and covenants in our credit facilities;
|
|
•
|
place us at a competitive disadvantage compared to our competitors that have less debt, lease obligations, and pension funding obligations; and
|
|
•
|
limit our ability to borrow additional funds for working capital, capital expenditures, acquisitions, debt service requirements, execution of our business strategy or other general corporate purposes on satisfactory terms or at all.
|
In addition, the failure to comply with our financial covenants could result in an event of default which, if not cured or waived, could result in the acceleration of all of our indebtedness.
Our ability to fund working capital and capital expenditures will depend on our ability to generate cash in the future.
Our ability to generate cash in the future, to a certain extent, is subject to general economic, financial, competitive, business, legislative, regulatory and other factors that are beyond our control. We believe that our results of operations will provide sufficient liquidity to fund our operations and meet our covenants for at least the next twelve months.
Our ability to satisfy our liquidity needs and meet future stepped-up covenants beyond
2015
is primarily dependent on improving our profitability. Improvements to our profitability primarily include continued successful implementation and realization of productivity and efficiency initiatives including those identified in the modified labor agreement as well as pricing improvements. Some of these are outside of our control.
A failure to meet our liquidity needs could materially and adversely affect our business, financial condition and results of operations.
We incurred net losses in each of fiscal 2014, 2013 and 2012. We may not obtain the projected benefits and cost savings from productivity and efficiency initiatives. If we incur future net losses we may need additional capital to meet our future cash requirements and execute our business strategy.
Our business experienced net losses in each of fiscal 2014, 2013 and 2012. Contributing factors to our net losses in these years include the challenges facing transportation services generally as a result of the prolonged slow economic recovery, competitive pressures in the LTL industry stemming from excess capacity that resulted in lower profit margins, interest expense and financing costs, and our operating cost structure. In each of 2009, 2011 and 2014, we implemented financial restructurings to improve our
10
balance sheet and to provide additional operating liquidity. Since our restructuring in 2011, our senior management team and board of directors have put strategies in place that are focused on increasing profitability at YRC Freight. These efforts have been concentrated on improving pricing and shipping volumes as well as customer mix, redeploying shared services and, in turn, driving more autonomy, responsibility and accountability to our operating companies, streamlining operations and our transportation network, and divesting non-core assets. There is no assurance that these changes and improvements will be successful, that their implementation will have a positive impact on our operating results or that we will not have to initiate additional changes and improvements in order to achieve the projected benefits and cost savings. If we incur future net losses, we may experience liquidity challenges and we may need to raise additional capital to meet our future cash requirements and to execute our business strategy.
Restrictive covenants in the documents governing our existing and future indebtedness may limit our current and future operations, particularly our ability to respond to changes in our business or to pursue our business strategies.
The documents governing our existing indebtedness contain, and the documents governing any future indebtedness will likely contain, a number of restrictive covenants that impose significant operating and financial restrictions, including restrictions on our ability to take actions that we believe may be in our interest. The documents governing our existing indebtedness, among other things, limit our ability to:
|
•
|
incur additional indebtedness and guarantee indebtedness;
|
|
•
|
make certain restricted payments or investments;
|
|
•
|
enter into agreements that restrict distributions from restricted subsidiaries;
|
|
•
|
sell or otherwise dispose of assets, including capital stock of restricted subsidiaries;
|
|
•
|
enter into transactions with affiliates;
|
|
•
|
create or incur liens;
|
|
•
|
enter into sale/leaseback transactions;
|
|
•
|
merge, consolidate or sell substantially all of our assets; and
|
|
•
|
make certain investments and acquire certain assets.
|
The restrictions could adversely affect our ability to:
|
•
|
finance our operations;
|
|
•
|
make strategic acquisitions or investments or enter into alliances;
|
|
•
|
withstand a future downturn in our business or the economy in general;
|
|
•
|
engage in business activities, including future opportunities, that may be in our interest; and
|
|
•
|
plan for or react to market conditions or otherwise execute our business strategies.
|
Our ability to obtain future financing or to sell assets could be adversely affected because substantially all of our assets have been secured as collateral for the benefit of the holders of our indebtedness.
Our failure to comply with the covenants in the documents governing our existing and future indebtedness could materially adversely affect our financial condition and liquidity.
The documents governing our indebtedness contain financial covenants, affirmative covenants requiring us to take certain actions and negative covenants restricting our ability to take certain actions. If we are unsuccessful in meeting our financial covenants, we will need to seek an amendment or waiver from our lenders or otherwise we will be in default under our credit facilities, which would enable lenders thereunder to accelerate the repayment of amounts outstanding and exercise remedies with respect to collateral. If our lenders under our credit facilities demand payment, we will not have sufficient cash to repay such indebtedness. In addition, a default under our credit facilities or the lenders exercising their remedies thereunder could trigger cross-default provisions in our other indebtedness and certain other operating agreements. Our ability to amend our credit facilities or otherwise obtain waivers from our lenders depends on matters that are outside of our control and there can be no assurance that we will be successful in that regard. In addition, any covenant breach or event of default could harm our credit rating and our ability to obtain additional financing on acceptable terms. The occurrence of any of these events could have a material adverse effect on our financial condition and liquidity. During the next twelve months, the thresholds required under the financial covenants in our credit facilities are subject to significant step-ups, specifically our maximum total leverage ratio. In the event our operating results indicate we will not meet our maximum total leverage ratio, we will take action to improve our maximum total leverage ratio which will include paying down our outstanding indebtedness with either cash on hand or from cash proceeds from equity issuances. The issuance of equity is outside of our control and there can be no assurance that management will be able to issue additional equity at terms that are agreeable to us or that we would have sufficient cash on hand to meet the maximum total leverage ratio.
Risks Related to Our Common Stock
11
The price of our Common Stock may fluctuate significantly, and this may make it difficult to resell our Common Stock when holders want or at prices they find attractive.
The market price for our Common Stock has been highly volatile and subject to wide fluctuations. We expect the market price of our Common Stock to continue to be volatile and subject to wide fluctuations in response to a wide variety of factors, including the following:
|
•
|
fluctuations in stock market prices and trading volumes of securities of similar companies;
|
|
•
|
general market conditions and overall fluctuations in U.S. equity markets;
|
|
•
|
variations in our operating results, or the operating results of our competitors;
|
|
•
|
changes in our financial guidance, if any, or securities analysts’ estimates of our financial performance;
|
|
•
|
sales of large blocks of our Common Stock, including sales by our executive officers, directors and significant stockholders;
|
|
•
|
additions or departures of any of our key personnel;
|
|
•
|
announcements related to litigation;
|
|
•
|
changing legal or regulatory developments in the United States and other countries; and
|
|
•
|
discussion of us or our stock price by the financial press and in online investor communities.
|
In addition, the stock markets from time to time experience price and volume fluctuations that may be unrelated or disproportionate to the operating performance of companies and that may be extreme. These fluctuations may adversely affect the trading price of our Common Stock, regardless of our actual operating performance.
We issued a substantial number of shares of Common Stock in connection with our financing transactions that occurred in early 2014 (“2014 Financing Transactions”) and have registered such shares of Common Stock under the Securities Act, which could lead to significant sales of our Common Stock and may adversely affect the market price of our Common Stock.
Pursuant to the 2014 Financing Transactions (defined in the “2014 Financing Transactions” footnote to our consolidated financial statements included herein), we issued 14,333,334 shares of our Common Stock and 583,334 shares of our Convertible Preferred Stock. We are unable to predict the potential effects of such issuance of Common Stock on the trading activity and market price of our Common Stock. The registration of these shares facilitates the resale of such shares of Common Stock into the public market, and would increase the number of shares of our Common Stock available for public trading. Sales of a substantial number of shares of our Common Stock in the public market, or the perception that such sales may occur, could have a material adverse effect on the market price of our Common Stock.
Future issuances of our Common Stock or equity-related securities in the public market could adversely affect the trading price of our Common Stock and our ability to raise funds in new stock offerings.
In the future, we may issue significant numbers of additional shares of our Common Stock to raise capital or in connection with a restructuring or refinancing of our maturing indebtedness. Shares of our Common Stock are reserved for issuance, exercise of outstanding stock options and vesting of outstanding share units. As of December 31, 2014, we had outstanding options to purchase an aggregate of approximately
33,000
shares of Common Stock, outstanding nonvested restricted stock and share units representing the right to receive a total of approximately
1,043,000
shares of Common Stock upon vesting and an aggregate of approximately
3.1 million
shares of our Common Stock was reserved for future issuance under our Amended and Restated 2011 Incentive and Equity Award Plan (the “Amended 2011 Plan”). We have registered under the Securities Act all of the shares of Common Stock that we may issue upon the exercise of our outstanding options and the vesting of outstanding share units and on account of future awards made under the Amended 2011 Plan. All of these registered shares can be freely sold in the public market upon issuance, except for shares issued to our directors and executive officers, which sales are subject to certain volume restrictions. If a large number of these shares are sold in the public market, the sales could reduce the trading price of our Common Stock.
We cannot predict the size of future issuances or the effect, if any, that such issuances may have on the market price for our Common Stock. Sales of significant amounts of our Common Stock or equity-related securities in the public market, or the perception that such sales may occur, could adversely affect prevailing trading prices of our Common Stock and the value of our remaining convertible notes and could impair our ability to raise capital through future offerings of equity or equity-related securities. Further sales of shares of our Common Stock or the availability of shares of our Common Stock for future sale or in connection with hedging and arbitrage activity that may develop with respect to our Common Stock, could adversely affect the trading price of our Common Stock.
12
We do not intend to pay dividends on our Common Stock in the foreseeable future.
We do not anticipate that we will be able to pay any dividends on shares of our Common Stock in the foreseeable future. We intend to retain any future earnings to fund operations, to service debt and to use for other corporate needs.
We can issue shares of preferred stock that may adversely affect the rights of holders of our Common Stock.
Our certificate of incorporation currently authorizes the issuance of five million shares of preferred stock. Our board of directors is authorized to approve the issuance of one or more series of preferred stock without further authorization of our shareholders and to fix the number of shares, the designations, the relative rights and the limitations of any series of preferred stock. As a result, our board, without shareholder approval, could authorize the issuance of preferred stock with voting, conversion and other rights that could proportionately reduce, minimize or otherwise adversely affect the voting power and other rights of holders of our Common Stock or other series of preferred stock or that could have the effect of delaying, deferring or preventing a change in our control.
Business Risks
We are a holding company and we are dependent on the ability of our subsidiaries to distribute funds to us.
We are a holding company and our subsidiaries conduct substantially all of our consolidated operations and own substantially all of our consolidated assets. Consequently, our cash flow and our ability to make payments on our indebtedness substantially depends upon our subsidiaries’ cash flow and payments of funds to us by our subsidiaries. Our subsidiaries’ ability to make any advances, distributions or other payments to us may be restricted by, among other things, debt instruments, tax considerations and legal restrictions. If we are unable to obtain funds from our subsidiaries as a result of these restrictions, we may not be able to pay principal of, or cash interest on, our indebtedness when due, and we cannot assure you that we will be able to obtain the necessary funds from other sources.
We are subject to general economic factors that are largely out of our control, any of which could have a material adverse effect on our business, financial condition and results of operations.
Our business is subject to a number of general economic factors that may adversely affect our business, financial condition and results of operations, many of which are largely out of our control. These factors include recessionary economic cycles and downturns in customers’ business cycles and changes in their business practices, particularly in market segments and industries, such as retail and manufacturing, where we have a significant concentration of customers. Economic conditions may adversely affect our customers’ business levels, the amount of transportation services they need and their ability to pay for our services. Because a portion of our costs are fixed, it may be difficult for us to quickly adjust our cost structure proportionally with fluctuations in volume levels. Customers encountering adverse economic conditions represent a greater potential for loss, and we may be required to increase our reserve for bad-debt losses. Further, we depend on our suppliers for equipment, parts and services that are critical to our business. A disruption in the availability of these supplies or a material increase in their cost due to adverse economic conditions or financial constraints of our suppliers could adversely impact our business, results of operations and liquidity.
We are subject to business risks and increasing costs associated with the transportation industry that are largely out of our control, any of which could have a material adverse effect on our business, financial condition and results of operations.
We are subject to business risks and increasing costs associated with the transportation industry that are largely out of our control, any of which could adversely affect our business, financial condition and results of operations. The factors contributing to these risks and costs include weather, excess capacity in the transportation industry, interest rates, fuel prices and taxes, fuel surcharge collection, terrorist attacks, license and registration fees, insurance premiums, self-insurance levels, and letters of credit required to support outstanding claims, difficulty in recruiting and retaining qualified drivers, the risk of widespread disruption of our technology systems, and increasing equipment and operational costs. Our results of operations may also be adversely affected by seasonal factors. Further, the future availability and support available for our current technology may make it necessary for us to upgrade or change these systems, which may be costly and could disrupt or reduce the efficiency of our operations.
We operate in a highly competitive industry, and our business will suffer if we are unable to adequately address potential downward pricing pressures and other factors that could have a material adverse effect on our business, financial condition and results of operations.
Numerous competitive factors could adversely affect our business, financial condition and results of operations. These factors include the following:
13
|
•
|
We compete with many other transportation service providers of varying sizes and types, some of which have a lower cost structure, more equipment and greater capital resources than we do or have other competitive advantages.
|
|
•
|
Some of our competitors periodically reduce their prices to gain business, especially during times of reduced growth rates in the economy, which limits our ability to maintain or increase prices or maintain or grow our business.
|
|
•
|
Our customers may negotiate rates or contracts that minimize or eliminate our ability to offset fuel prices through fuel surcharges.
|
|
•
|
Many customers reduce the number of carriers they use by selecting so-called “core carriers” as approved transportation service providers, and in some instances, we may not be selected.
|
|
•
|
Many customers periodically accept bids from multiple carriers for their shipping needs, which may depress prices or result in the loss of some business to competitors.
|
|
•
|
The trend towards consolidation in the ground transportation industry may create other large carriers with greater financial resources and other competitive advantages relating to their size.
|
|
•
|
Advances in technology require increased investments to remain competitive, and our customers may not be willing to accept higher prices to cover the cost of these investments.
|
|
•
|
Competition from non-asset-based logistics and freight brokerage companies may adversely affect our customer relationships and prices.
|
|
•
|
As a union carrier, we may have a competitive disadvantage against non-union carriers with lower cost structures and greater operating flexibility.
|
If our relationship with our employees and unions were to deteriorate, we may be faced with labor disruptions or stoppages, which could have a material adverse effect on our business, financial condition and results of operations and place us at a disadvantage relative to non-union competitors.
Virtually all of our operating subsidiaries have employees who are represented by the International Brotherhood of Teamsters (“IBT”). These employees represent the majority of our workforce at December 31, 2014. Salaries, wages and employee benefits compose over half of our operating costs.
Each of our YRC Freight, New Penn, and Holland subsidiaries employ most of their unionized employees under the terms of a common national master freight agreement with the IBT, as supplemented by additional regional supplements and local agreements, a significant majority of which will expire on March 31, 2019. The IBT also represents a number of employees at Reddaway, and Reimer under more localized agreements, which have wages, benefit contributions and other terms and conditions that better fit the cost structure and operating models of these business units. Our subsidiaries are regularly subject to grievances, arbitration proceedings and other claims concerning alleged past and current non-compliance with applicable labor law and collective bargaining agreements.
Neither we nor any of our subsidiaries can predict the outcome of any of these matters. These matters, if resolved in a manner unfavorable to us, could have a material adverse effect on our business, financial condition, liquidity and results of operations.
Our pension expense and funding obligations could increase significantly and have a material adverse effect on our business, financial condition and results of operations.
Our future funding obligations for our U.S. single-employer defined benefit pension plans qualified with the Internal Revenue Service depend upon their funded status, the future performance of assets set aside in trusts for these plans, the level of interest rates used to determine funding levels and actuarial experience and any changes in government laws and regulations.
Our subsidiaries began making contributions to most of the multi-employer pension funds (the “funds”) beginning June 1, 2011 at the rate of 25% of the contribution rate in effect on July 1, 2009. A fund that did not allow our subsidiaries to begin making contributions at a reduced rate to the fund elected to either (i) apply the amount of the contributions toward paying down previously deferred contributions under our Contribution Deferral Agreement, or (ii) have the amount of the contributions placed in escrow until such time when the fund is able to accept re-entry at the reduced rate.
If the funding of the funds does not reach certain goals (including those required not to enter endangered or critical status or those required by a fund’s funding improvement or rehabilitation plan), our pension expenses and required cash contributions could further increase upon the expiration of our collective bargaining agreements and, as a result, could materially adversely affect our business, financial condition and results of operations. Decreases in investment returns that are not offset by contributions could also increase our obligations under such plans.
We believe that based on information obtained from public filings and from plan administrators and trustees, our portion of the contingent liability in the case of a full withdrawal from or termination of all of the multi-employer pension plans would be an
14
estimated $10 billion on a pre-tax basis. If we were subject to withdrawal liability with respect to a plan, ERISA provides that a withdrawing employer can pay the obligation in a lump sum or over time based upon an annual payment that is the product of the highest contribution rate to the relevant plan multiplied by the average of the three highest consecutive years measured in contribution base units, which, in some cases, could be up to 20 years. Even so, our applicable subsidiaries have no current intention of taking any action that would subject us to payment of material withdrawal obligations; however we cannot provide any assurance that such obligations will not arise in the future which would have a material adverse effect on our business, financial condition, liquidity and results of operations.
Ongoing self-insurance and claims expenses could have a material adverse effect on our business, financial condition and results of operations.
Our future insurance and claims expenses might exceed historical levels. We currently self-insure for a majority of our claims exposure resulting from cargo loss, personal injury, property damage and workers’ compensation. If the number or severity of claims for which we are self-insured increases, our business, financial condition and results of operations could be adversely affected, and we may have to post additional letters of credit or cash collateral to state workers’ compensation authorities or insurers to support our insurance policies, which may adversely affect our liquidity. Although we have significantly reduced our letter of credit expense in recent periods, there is no assurance this trend will continue. If we lose our ability to self-insure, our insurance costs could materially increase, and we may find it difficult to obtain adequate levels of insurance coverage.
We have significant ongoing capital expenditure requirements that could have a material adverse effect on our business, financial condition and results of operations if we are unable to generate sufficient cash from operations.
Our business is capital intensive. Our capital expenditures focus primarily on revenue equipment replacement, land and structures and investments in information technology. In light of our operating results over the past few years and our liquidity needs, we have deferred certain capital expenditures in recent years and may need to continue to do so in the future, including the next twelve months. As a result, the average age of our fleet has increased and we will need to update our fleet periodically. If we are unable to generate sufficient cash from operations to fund our capital requirements, we may have to limit our growth, utilize our existing liquidity, or enter into additional financing arrangements, including leasing arrangements, or operate our revenue equipment (including tractors and trailers) for longer periods resulting in increased maintenance costs, any of which could reduce our operating income. If our cash from operations and existing financing arrangements are not sufficient to fund our capital expenditure requirements, we may not be able to obtain additional financing at all or on terms acceptable to us. In addition, our credit facilities contain provisions that limit our level of annual capital expenditures.
We operate in an industry subject to extensive government regulations, and costs of compliance with, or liability for violation of, existing or future regulations could significantly increase our costs of doing business.
The U.S. Departments of Transportation and Homeland Security and various federal, state, local and foreign agencies exercise broad powers over our business, generally governing such activities as authorization to engage in motor carrier operations, safety and permits to conduct transportation business. Our drivers are also subject to hours-of-service rules from the Federal Motor Carrier Safety Administration (“FMCSA”). In the future, we may become subject to new or more restrictive regulations that the FMCSA, Departments of Transportation and Homeland Security, the Occupational Safety and Health Administration, the Environmental Protection Agency or other authorities impose, including regulations relating to engine exhaust emissions, the hours of service that our drivers may provide in any one time period, security and other matters. Compliance with these regulations could substantially impair equipment productivity and increase our costs.
In December 2010, the FMSCA established the Compliance Safety Accountability (“CSA”) motor carrier oversight program under which drivers and fleets are evaluated based on certain safety-related standards. Carriers’ safety and fitness ratings under CSA include the on-road safety performance of the carrier’s drivers. The FMSCA has also implemented changes to the hours of service regulations which govern the work hours of commercial drivers and has a number of other proposals that it has announced are in process, including a rule which may mandate the use of electronic logging devices in over-the-road commercial motor vehicles.
As a result of these increased standards, drivers who do not meet such standards are not eligible to drive for us. If we experience safety and fitness violations, our fleet could be ranked poorly as compared to our peers, and our safety and fitness scores could be adversely impacted. A reduction in our safety and fitness scores or those of our drivers could also reduce our competitiveness in relation to other companies who retain higher scores. Additionally, competition for drivers with favorable safety ratings may increase and thus provide for increases in driver related compensation costs.
15
We are subject to various Environmental Regulations, and costs of compliance with, or liabilities for violations of, existing or future laws and regulations could significantly increase our costs of doing business.
Our operations are subject to Environmental Regulations dealing with, among other things, the handling of hazardous materials, underground fuel storage tanks and discharge and retention of storm water. We operate in industrial areas, where truck terminals and other industrial activities are located, and where groundwater or other forms of environmental contamination may have occurred. Our operations involve the risks of fuel spillage or seepage, environmental damage and hazardous waste disposal, among others. If we are involved in a spill or other accident involving hazardous substances, or if we are found to be in violation of applicable environmental laws or regulations, it could significantly increase our cost of doing business. Under specific environmental laws and regulations, we could be held responsible for all of the costs relating to any contamination at our past or present terminals and at third-party waste disposal sites. If we fail to comply with applicable environmental laws and regulations, we could be subject to substantial fines or penalties and to civil and criminal liability.
In addition, as climate change initiatives become more prevalent, federal, state and local governments and our customers are beginning to promulgate solutions for these issues. This increased focus on greenhouse gas emission reductions and corporate environmental sustainability may result in new regulations and customer requirements that could negatively affect us. This could cause us to incur additional direct costs or to make changes to our operations in order to comply with any new regulations and customer requirements, as well as increased indirect costs or loss of revenue resulting from, among other things, our customers incurring additional compliance costs that affect our costs and revenues. We could also lose revenue if our customers divert business from us because we have not complied with their sustainability requirements. These costs, changes and loss of revenue could have a material adverse effect on our business, financial condition, liquidity and results of operations.
Our business may be harmed by anti-terrorism measures.
In the aftermath of the terrorist attacks on the United States, federal, state and municipal authorities have implemented and are implementing various security measures, including checkpoints and travel restrictions on large trucks. Although many companies would be adversely affected by any slowdown in the availability of freight transportation, the negative impact could affect our business disproportionately. For example, we offer specialized services that guarantee on-time delivery. If the security measures disrupt or impede the timing of our deliveries, we may fail to meet the needs of our customers, or may incur increased expenses to do so. We cannot assure you that these measures will not significantly increase our costs and reduce our operating margins and income.
The outcome of IRS audits to which we and our subsidiaries are a party could have a material adverse effect on our businesses, financial condition and results of operations.
The IRS may issue adverse tax determinations in connection with its audit of our prior year tax returns. See the “Income Taxes” footnote to our consolidated financial statements. We may incur significant expenses defending ourselves in these audits. We may be required to pay significant taxes and/or interest to resolve these audits. These costs could have a material adverse effect on our businesses, financial condition, liquidity and results of operations.
Current or future litigation may adversely affect our business, financial condition, liquidity or results of operations.
We have been and continue to be involved in legal proceedings, claims and other litigation that arise in the ordinary course of business. Litigation may be related to labor and employment, competitive matters, personal injury, property damage, safety and contract compliance, environmental liability, our past financial restructurings and other matters. We are currently subject to putative class action litigation in connection with public statements made by prior management regarding our financial restructuring in 2009. We discuss legal proceedings in the “Commitments, Contingencies and Uncertainties” footnote to our consolidated financial statements included elsewhere in this Annual Report on Form 10-K. Some or all of our expenditures to defend, settle or litigate these matters may not be covered by insurance or could impact our cost and ability to obtain insurance in the future. Litigation can be expensive, lengthy and disruptive to normal business operations, including to our management due to the increased time and resources required to respond to and address the litigation. The results of complex legal proceedings are often uncertain and difficult to predict. An unfavorable outcome of any particular matter or any future legal proceedings could have a material adverse effect on our business, financial condition, liquidity or results of operations. In the future, we could incur judgments or enter into settlements of claims that could harm our financial position, liquidity and results of operations.
We may not obtain further benefits and cost savings from operational changes and performance improvement initiatives.
In response to our business environment, we initiated operational changes and process improvements to reduce costs and improve financial performance. These changes and initiatives include evaluating management talent, reducing overhead costs, closing
16
redundant facilities, making upgrades to our technology, eliminating non-core assets and unnecessary activities and implementing changes of operations under our labor agreements. There is no assurance that these changes and improvements will be successful, that their implementation may not have an adverse impact on our operating results or that we will not have to initiate additional changes and improvements in order to achieve the projected benefits and cost savings.
Our actual operating results may differ significantly from our projections.
From time to time, we use projections regarding our future performance. These projections, which are forward-looking statements, are prepared by our management and are qualified by, and subject to, the assumptions and the other information contained or referred to in the introductory section immediately prior to “Part I” of this Report. Our projections are not prepared with a view toward compliance with published guidelines of the American Institute of Certified Public Accountants, and neither our registered public accountants nor any other independent expert or outside party compiles or examines the projections and, accordingly, no such person expresses any opinion or any other form of assurance with respect thereto.
Projections are based upon a number of assumptions and estimates that, while presented with numerical specificity, are inherently subject to significant business, economic and competitive uncertainties and contingencies, many of which are beyond our control and are based upon specific assumptions with respect to future business decisions, some of which will change.
Projections are necessarily speculative in nature, and it can be expected that some or all of the assumptions and estimates relating to the projections furnished by us will not materialize or will vary significantly from actual results. Accordingly, our projections are only an estimate of what management believes is realizable as of the date of release. Actual results will vary from the projections and the variations may be material. Investors should also recognize that the reliability of any forecasted financial data diminishes the farther in the future that the data is projected. In light of the foregoing, investors are urged not to rely upon, or otherwise consider, our projections in making investment decisions in respect of our securities.
Any failure to successfully implement our operating strategy, the failure of some or all of the assumptions and estimates relating to the projections used by us or the occurrence of any of the adverse events or circumstances described in this Annual Report on Form 10-K and in our other filings with the SEC could result in the actual operating results being different from the projections, and such differences may be adverse and material.
Difficulties attracting and retaining qualified drivers could result in increases in driver compensation and purchased transportation costs and could adversely affect our profitability and our ability to maintain or grow our fleet.
Like many in the trucking industry, we are experiencing difficulty in attracting and retaining sufficient numbers of qualified drivers. Due in part to the time commitment, the physical strains of the work and the current industry conditions, the available pool of employee drivers and independent contractors has been declining. Regulatory requirements, including the CSA program of the FMCSA, have also reduced the number of eligible employee drivers and independent contractors and may continue to do so in the future. Because of the shortage of qualified drivers and intense competition for drivers from other trucking companies, we expect to continue to face difficulty increasing our number of drivers. Driver shortages may result in less than optimal use of purchased transportation, which may result in higher costs to the Company. The compensation we offer our drivers is subject to market conditions, and we may find it necessary to continue to increase driver compensation in future periods. In addition, we and our industry suffer from a high driver turnover rate. Driver turnover requires us to continually recruit a substantial number of drivers in order to operate existing revenue equipment. If we are unable to continue to attract and retain drivers, we could be required to adjust our compensation packages, increase our use of purchased transportation, let tractors sit idle, or operate with fewer tractors and face difficulty meeting customer demands, any of which would adversely affect our growth and profitability.
17
Not applicable.
At
December 31, 2014
, we operated a total of
384
transportation service facilities located in 50 states, Puerto Rico, Canada and Mexico for our YRC Freight and Regional Transportation segments. Of this total,
187
are owned and
197
are leased, generally with lease terms ranging from one month to ten years with right of renewal options. The number of customer freight servicing doors totaled
20,918
, of which
12,114
are at owned facilities and
8,804
are at leased facilities. The transportation service centers vary in size ranging from one to three doors at small local facilities, to 426 doors at the largest consolidation and distribution facility. In addition, we and our subsidiaries own and occupy a general office building in Lebanon, Pennsylvania. We also lease and occupy general office buildings in Holland, Michigan, Overland Park, Kansas, Tualatin, Oregon and Winnipeg, Manitoba. Our owned transportation service facilities and office buildings serve as collateral under our credit agreements.
Our facilities and equipment are adequate to meet current business requirements in
2015
. Refer to “Item 7. Management’s Discussion and Analysis of Financial Condition and Results of Operations” for a more detailed discussion of expectations regarding capital spending in
2015
.
We discuss legal proceedings in the “Commitments, Contingencies and Uncertainties” footnote to our consolidated financial statements included with this annual report on Form 10-K.
Not applicable.
18
Executive Officers of the Registrant
The following are our executive officers, each of whom serves until his or her successor has been elected and qualified or until his or her earlier resignation or removal:
|
Name
|
Age
|
Position(s) Held
|
|
James L. Welch
|
60
|
YRC Worldwide Inc.: Chief Executive Officer (since 2011); Dynamex Inc. (transportation and logistics services): President and Chief Executive Officer (2008 - 2011); JHT Holdings (truck transportation): Interim Chief Executive Officer (2007 - 2008); Yellow Transportation (subsidiary of our Company): President and Chief Executive Officer (2000 - 2007), and various other positions (1978 - 2000); Current Director: SkyWest Inc. (regional airline), and Erickson Air Crane, Inc. (manufacturing and operating); Former Director: Dynamex Inc., Spirit AeroSystems Holdings Inc. (commercial airplane assemblies and components), and Roadrunner Transportation (transportation and logistics services).
|
|
Jamie G. Pierson
|
45
|
Executive Vice President and Chief Financial Officer of YRC Worldwide Inc. (since November 2011); Interim Chief Financial Officer of YRC Worldwide Inc. (August 2011-November 2011); Managing Director, Alvarez & Marsal North America, LLC (professional services) (2008-November 2011); Vice President - Corporate Development and Integration, Greatwide Logistics Services, Inc. (transportation and logistics) (2007-2008); Director, FTI Capital Advisors, LLC (investment bank) (2002-2007); Vice President, FTI Consulting, Inc. (2001-2002); Vice President, Stonegate Securities, Inc. (investment bank) (2000-2001); Associate, Houlihan Lokey Howard & Zukin (investment bank) (1997-2000).
|
|
Mark D. Boehmer
|
54
|
Vice President and Treasurer of YRC Worldwide (since July 2013); Vice President and Treasurer of Sealy Corporation (bedding manufacturer) (2003-2013).
|
|
Stephanie D. Fisher
|
38
|
Vice President and Controller of YRC Worldwide (since May 2012); Director - Financial Reporting and various positions in the Company’s Corporate Accounting department (2004-2012); Member of the Supervisory Committee of CommunityAmerica Credit Union (since December 2010, Chairman of the Committee since May 2012).
|
|
Darren D. Hawkins
|
45
|
President (since February 2014), Senior Vice President - Sales and Marketing (January 2013-February 2014) of YRC Freight; Director of Operations (December 2011-January 2013) and Director of Sales (January 2009-December 2011) for Con- Way Freight, a subsidiary of Con-Way, Inc.; various positions of increasing responsibility with Yellow Transportation (1991-2009).
|
|
Scott D. Ware
|
54
|
President (since May 2012), Vice President Operations & Linehaul (2009-2012) and Vice President Linehaul (2007-2009) of Holland (subsidiary of the Company); Director of Linehaul of SAIA Inc. (2002-2007); Director of Linehaul of JEVIC (2000-2002); various industry management roles with Preston, Overnite, Con-Way and Spartan Express (1985-2000).
|
|
Thomas J. O’Connor
|
54
|
President of Reddaway (subsidiary of the Company) (since January 2007); President of USF Bestway (subsidiary of the Company) (2005-2007); Vice President - Western Division and officer of the Company (1999-2005), District Manager (1995-1999) and various management positions of increasing responsibility (1982-1995) of Roadway Express, Inc. (subsidiary of the Company).
|
|
Donald R. Foust
|
57
|
President of New Penn (subsidiary of the Company) (since August 2014); Regional Vice President, Eastern Sales and Operations (2013-July 2014), Vice President, Sales and Marketing (2012-2013), Director of Corporate Sales (2011-2012), Regional Sales Manager (2009-2011) of Roadrunner Transportation Services (transportation and logistics); various management roles at Yellow Transportation (subsidiary of the Company) (1999-2009).
|
19
As of
February 13, 2015
,
204
stockholders of record held YRC Worldwide common stock. Trading activity averaged
777,130
shares per day during
2014
, up from
621,240
per day in
2013
. The NASDAQ Stock Market quotes prices for our common stock under the symbol “YRCW.” As part of our 2014 Financing Transactions, on January 31, 2014, we issued 583,334 shares of YRC Worldwide Class A Convertible preferred stock (“Class A Preferred”) that converted into 2,333,336 shares of Common Stock in 2014. No shares of Class A preferred stock remain outstanding as of December 31, 2014.
Quarterly Financial Information (unaudited)
|
2014
|
||||||||||||
|
(in millions, except per share and share data)
|
First
Quarter
|
Second Quarter
|
Third
Quarter
|
Fourth
Quarter
|
||||||||
|
Operating revenue
|
$
|
1,210.9
|
|
$
|
1,317.6
|
|
$
|
1,322.6
|
|
$
|
1,217.7
|
|
|
(Gains) losses on property disposals, net
|
0.2
|
|
(6.5
|
)
|
0.2
|
|
(5.8
|
)
|
||||
|
Operating income (loss)
|
(32.4
|
)
|
20.0
|
|
26.7
|
|
31.2
|
|
||||
|
Net income (loss)
|
(70.2
|
)
|
(4.9
|
)
|
1.2
|
|
6.2
|
|
||||
|
Diluted income (loss) per share
(a)
|
(3.95
|
)
|
(0.16
|
)
|
(0.03
|
)
|
0.16
|
|
||||
|
Market price of common stock per share:
|
||||||||||||
|
High
|
27.00
|
|
28.73
|
|
29.21
|
|
25.40
|
|
||||
|
Low
|
11.81
|
|
18.40
|
|
19.47
|
|
14.03
|
|
||||
|
2013
|
||||||||||||
|
(in millions, except per share and share data)
|
First
Quarter
|
Second Quarter
|
Third
Quarter
|
Fourth
Quarter
(b)
|
||||||||
|
Operating revenue
|
$
|
1,162.5
|
|
$
|
1,242.5
|
|
$
|
1,252.7
|
|
$
|
1,207.7
|
|
|
(Gains) losses on property disposals, net
|
(4.5
|
)
|
1.3
|
|
1.3
|
|
(0.3
|
)
|
||||
|
Operating (loss) income
|
9.9
|
|
14.3
|
|
5.8
|
|
(1.6
|
)
|
||||
|
Net income (loss)
|
(24.5
|
)
|
(15.1
|
)
|
(44.4
|
)
|
0.4
|
|
||||
|
Diluted loss per share
(a)
|
(2.93
|
)
|
(1.72
|
)
|
(4.45
|
)
|
(1.71
|
)
|
||||
|
Market price of common stock per share:
|
||||||||||||
|
High
|
9.60
|
|
30.49
|
|
36.99
|
|
20.58
|
|
||||
|
Low
|
5.75
|
|
6.69
|
|
14.39
|
|
7.06
|
|
||||
|
(a)
|
Diluted income (loss) per share amounts were computed independently for each of the quarters presented. The sum of the quarters may differ from the total annual amount primarily due to change in the number of outstanding shares in the year and the impact of the if-converted method used to calculate earnings per share.
|
|
(b)
|
The fourth quarter 2013 results were impacted by the 2013 tax rate, which included a benefit recognized due to application of ASC 740 rules regarding intra-period tax allocation.
|
Purchases of Equity Securities by the Issuer
We did not repurchase any shares of our Common Stock
in 2014, 2013 and 2012
. Our credit agreement as of December 31, 2014 did not permit us to purchase shares of our Common Stock.
Dividends
We did not declare any cash dividends on our Common Stock
in 2014, 2013 and 2012
. Our credit agreement as of December 31, 2014 did not permit us to declare dividends on any of our outstanding capital stock.
20
Common Stock Performance
Set forth below is a line graph comparing the quarterly percentage change in the cumulative total stockholder return of the Company’s common stock against the cumulative total return of the S&P Composite-500 Stock Index and the Dow Jones Transportation Average Stock Index for the period of five years commencing December 31, 2009 and ending December 31, 2014.
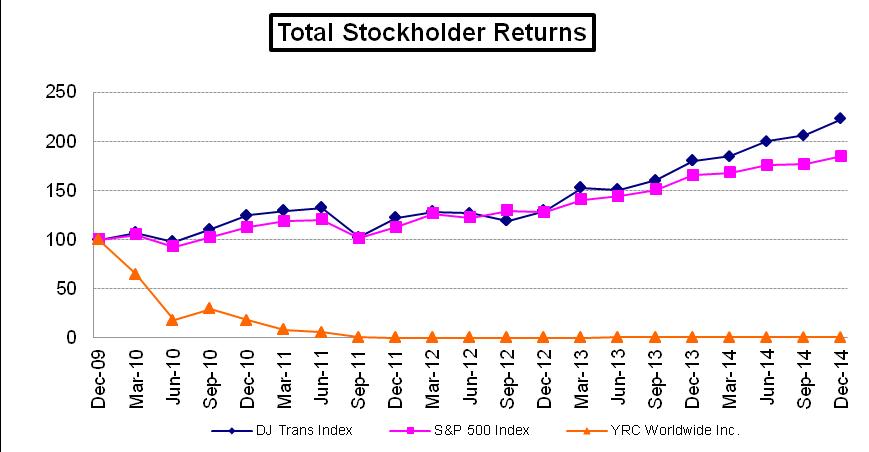
21
Our selected financial data below should be read in conjunction with “
Management’s Discussion and Analysis of Financial Condition and Results of Operations” and “Financial Statements and Supplementary Data” included in this Form 10-K.
|
(dollars in millions, except per share data. shares in thousands)
|
2014
|
2013
|
2012
|
2011
|
2010
|
|||||||||||||||
|
For the Year
|
||||||||||||||||||||
|
Operating revenue
|
$
|
5,068.8
|
|
$
|
4,865.4
|
|
$
|
4,850.5
|
|
$
|
4,868.8
|
|
$
|
4,334.6
|
|
|||||
|
Operating income (loss)
|
45.5
|
|
28.4
|
|
24.1
|
|
(138.2
|
)
|
(227.9
|
)
|
||||||||||
|
Net loss from continuing operations
|
(67.7
|
)
|
(83.6
|
)
|
(136.5
|
)
|
(354.4
|
)
|
(304.7
|
)
|
||||||||||
|
Net loss from discontinued operations, net of tax
|
—
|
|
—
|
|
—
|
|
—
|
|
(23.1
|
)
|
||||||||||
|
Net loss
|
(67.7
|
)
|
(83.6
|
)
|
(136.5
|
)
|
(354.4
|
)
|
(327.8
|
)
|
||||||||||
|
Less: Net income (loss) attributable to non-controlling interest
|
—
|
|
—
|
|
3.9
|
|
(3.1
|
)
|
(2.0
|
)
|
||||||||||
|
Net loss attributable to YRC Worldwide Inc.
|
(67.7
|
)
|
(83.6
|
)
|
(140.4
|
)
|
(351.3
|
)
|
(325.8
|
)
|
||||||||||
|
Amortization of beneficial conversion feature on preferred stock
|
(18.1
|
)
|
—
|
|
—
|
|
(58.0
|
)
|
—
|
|
||||||||||
|
Net loss attributable to common shareholders
|
(85.8
|
)
|
(83.6
|
)
|
(140.4
|
)
|
(409.3
|
)
|
(325.8
|
)
|
||||||||||
|
Acquisition of property and equipment
|
(69.2
|
)
|
(66.9
|
)
|
(66.4
|
)
|
(71.6
|
)
|
(19.2
|
)
|
||||||||||
|
Proceeds from disposal of property and equipment
|
20.8
|
|
9.8
|
|
50.4
|
|
67.5
|
|
85.7
|
|
||||||||||
|
Disposition of affiliates, net of cash sold
|
—
|
|
—
|
|
—
|
|
—
|
|
34.3
|
|
||||||||||
|
Net cash provided by (used in) operating activities
|
28.5
|
|
12.1
|
|
(25.9
|
)
|
(26.0
|
)
|
0.7
|
|
||||||||||
|
Net cash provided by (used in) investing activities
|
(41.6
|
)
|
(23.5
|
)
|
19.8
|
|
(156.6
|
)
|
106.0
|
|
||||||||||
|
Net cash provided by (used in) financing activities
|
7.9
|
|
(21.0
|
)
|
14.3
|
|
240.1
|
|
(61.5
|
)
|
||||||||||
|
At Year-End
|
||||||||||||||||||||
|
Total assets
|
$
|
1,985.0
|
|
$
|
2,064.9
|
|
$
|
2,225.5
|
|
$
|
2,485.8
|
|
$
|
2,571.6
|
|
|||||
|
Total debt
|
1,109.9
|
|
1,363.4
|
|
1,375.4
|
|
1,354.7
|
|
1,060.1
|
|
||||||||||
|
Total YRC Worldwide Inc. shareholders’ deficit
|
(474.3
|
)
|
(597.4
|
)
|
(629.1
|
)
|
(353.9
|
)
|
(209.5
|
)
|
||||||||||
|
Non-controlling interest
|
—
|
|
—
|
|
—
|
|
(4.6
|
)
|
(1.9
|
)
|
||||||||||
|
Total shareholders’ deficit
|
(474.3
|
)
|
(597.4
|
)
|
(629.1
|
)
|
(358.5
|
)
|
(211.4
|
)
|
||||||||||
|
Measurements
|
||||||||||||||||||||
|
Basic & Diluted per share data:
|
||||||||||||||||||||
|
Net loss from continuing operations attributable to YRC Worldwide Inc.
|
$
|
(3.00
|
)
|
$
|
(8.96
|
)
|
$
|
(19.20
|
)
|
$
|
(196.12
|
)
|
$
|
(2,293.30
|
)
|
|||||
|
Net loss from discontinued operations
|
—
|
|
—
|
|
—
|
|
—
|
|
(174.87
|
)
|
||||||||||
|
Net loss
|
(3.00
|
)
|
(8.96
|
)
|
(19.20
|
)
|
(196.12
|
)
|
(2,468.17
|
)
|
||||||||||
|
Average common shares outstanding
|
28,592
|
|
9,332
|
|
7,311
|
|
2,087
|
|
132
|
|
||||||||||
|
Other Data
|
||||||||||||||||||||
|
Number of employees
|
33,000
|
|
32,000
|
|
32,000
|
|
32,000
|
|
32,000
|
|
||||||||||
|
Operating ratio:
(a)
|
||||||||||||||||||||
|
YRC Freight
|
100.0
|
%
|
101.0
|
%
|
101.2
|
%
|
102.8
|
%
|
105.9
|
%
|
||||||||||
|
Regional Transportation
|
96.4
|
%
|
95.4
|
%
|
95.7
|
%
|
97.9
|
%
|
99.8
|
%
|
||||||||||
|
Truckload
|
N/A
|
|
N/A
|
|
N/A
|
|
119.1
|
%
|
109.3
|
%
|
||||||||||
|
Consolidated
|
99.1
|
%
|
99.4
|
%
|
99.5
|
%
|
102.8
|
%
|
105.3
|
%
|
||||||||||
|
(a)
|
Operating ratio is calculated as (i) 100 percent (ii) minus the result of dividing operating income by operating revenue or (iii) plus the result of dividing operating loss by operating revenue and expressed as a percentage.
|
22
“Management’s Discussion and Analysis of Financial Condition and Results of Operations” contains forward-looking statements within the meaning of Section 27A of the Securities Act and Section 21E of the Exchange Act. See the introductory section immediately prior to “Part I” and Risk Factors in “Item 1A” of this report regarding these statements.
Overview
MD&A includes the following sections:
Our Business:
a brief description of our business and a discussion of how we assess our operating results
Consolidated Results of Operations:
an analysis of our consolidated results of operations for the years ended
December 31, 2014
,
2013
and
2012
Reporting Segment Results of Operations:
an analysis of our results of operations for the years ended
December 31, 2014
,
2013
and
2012
for our two reporting segments: YRC Freight and Regional Transportation
Certain Non-GAAP Financial Measures:
an analysis of our results using certain non-GAAP financial measures, for the years ended
December 31, 2014
,
2013
and
2012
Financial Condition/Liquidity and Capital Resources:
a discussion of our major sources and uses of cash as well as an analysis of our cash flows and aggregate contractual obligations and commercial commitments
Our Business
YRC Worldwide is a holding company that, through wholly owned operating subsidiaries and its interest in a Chinese joint venture, offers its customers a wide range of transportation services. YRC Worldwide has one of the largest, most comprehensive less-than-truckload (“LTL”) networks in North America with local, regional, national and international capabilities. Through its team of experienced service professionals, YRC Worldwide offers industry-leading expertise in heavyweight shipments and flexible supply chain solutions, ensuring customers can ship industrial, commercial and retail goods with confidence.
We measure the performance of our business both on a consolidated and reporting segment basis and using several metrics, but rely primarily upon (without limitation) operating revenue, operating income (loss), and operating ratio. We also use certain non-GAAP financial measures as secondary measures to assess our operating performance.
|
•
|
Operating Revenue:
Operating revenue has two primary components: volume (commonly evaluated using tonnage, tonnage per day, number of shipments, shipments per day or weight per shipment) and yield or price (commonly evaluated using picked up revenue, revenue per hundredweight or revenue per shipment). Yield includes fuel surcharge revenue which is common in the trucking industry and represents an amount charged to customers that adjusts with changing fuel prices. We base our fuel surcharges on a published national index and adjust them weekly. Rapid material changes in the index or our cost of fuel can positively or negatively impact our revenue and operating income as a result of changes in our fuel surcharge. We believe that fuel surcharge is an accepted and important component of the overall pricing of our services to our customers. Without an industry accepted fuel surcharge program, our base pricing for our transportation services would require changes. We believe the distinction between base rates and fuel surcharge has blurred over time, and it is impractical to clearly separate all the different factors that influence the price that our customers are willing to pay. In general, under our present fuel surcharge program, we believe rising fuel costs are beneficial to us and falling fuel costs are detrimental to us in the short term, the effects of which are mitigated over time.
|
|
•
|
Operating Income (Loss)
: Operating income (loss) is operating revenue less any operating expenses. Consolidated operating income (loss) includes certain corporate charges that are not allocated to our reporting segments.
|
|
•
|
Operating Ratio:
Operating ratio is a common operating performance measure used in the trucking industry. It is calculated as (i) 100 percent (ii) minus the result of dividing operating income by operating revenue or (iii) plus the result of dividing operating loss by operating revenue, and is expressed as a percentage.
|
|
•
|
Certain Non-GAAP Financial Measures:
We use adjusted EBITDA and adjusted free cash flow (deficit), which are non-GAAP financial measures, to assess our performance. Adjusted EBITDA reflects earnings before interest, taxes, depreciation, and amortization expense, and further adjusts for letter of credit fees, equity-based compensation expense, net gains or losses on property disposals and certain other items, including restructuring professional fees, expenses
|
23
associated with certain lump sum payments to our IBT employees and the impact of permitted dispositions and discontinued operations as defined in our credit facilities. Adjusted EBITDA is used for internal management purposes as a financial measure that reflects core operating performance and to measure compliance with certain financial covenants in our credit facilities. Adjusted free cash flow (deficit) is a non-GAAP measure that reflects our operating cash flow minus gross capital expenditures and excludes restructuring costs included in operating cash flow. Our non-GAAP financial measures have the following limitations:
|
◦
|
Adjusted EBITDA does not reflect the interest expense or the cash requirements necessary to fund restructuring professional fees, letter of credit fees, service interest or principal payments on our outstanding debt;
|
|
◦
|
Although depreciation and amortization are non-cash charges, the assets being depreciated and amortized will often have to be replaced in the future and adjusted EBITDA does not reflect any cash requirements for such replacements;
|
|
◦
|
Equity based compensation is an element of our long-term incentive compensation package, although adjusted EBITDA excludes employee equity-based compensation expense when presenting our ongoing operating performance for a particular period;
|
|
◦
|
Adjusted free cash flow (deficit) excludes the cash usage by our restructuring activities, debt issuance costs,
|
equity issuance costs and principal payments on our outstanding debt and the resulting reduction in our liquidity position from those cash outflows; and
|
◦
|
Other companies in our industry may calculate adjusted EBITDA and adjusted free cash flow (deficit) differently than we do, limiting its usefulness as a comparative measure.
|
Because of these limitations, our non-GAAP measures should not be considered a substitute for performance measures calculated in accordance with GAAP. We compensate for these limitations by relying primarily on our GAAP results and use our non-GAAP measures as secondary measures.
Consolidated Results of Operations
Our consolidated results for
2014
,
2013
and
2012
include the consolidated results of our reporting segments and unallocated corporate charges. A more detailed discussion of the operating results of our reporting segments is presented in the “Reporting Segment Results of Operations” section below.
The table below provides summary consolidated financial information for the three years ended
December 31
:
|
Percent Change
|
||||||||||||||||||
|
(in millions)
|
2014
|
2013
|
2012
|
2014 vs. 2013
|
2013 vs. 2012
|
|||||||||||||
|
Operating revenue
|
$
|
5,068.8
|
|
$
|
4,865.4
|
|
$
|
4,850.5
|
|
4.2
|
%
|
0.3
|
%
|
|||||
|
Operating income
|
45.5
|
|
28.4
|
|
24.1
|
|
60.2
|
%
|
17.8
|
%
|
||||||||
|
Nonoperating expenses, net
|
129.3
|
|
157.9
|
|
175.6
|
|
(18.1
|
)%
|
(10.1
|
)%
|
||||||||
|
Net loss
|
(67.7
|
)
|
(83.6
|
)
|
(136.5
|
)
|
19.0
|
%
|
38.8
|
%
|
||||||||
2014
Compared to
2013
Our consolidated operating revenue
increased
$203.4 million
in
2014
compared to
2013
. The increase in revenue was largely driven by increases in yield and shipping volumes. The increases in yield were driven by a stronger overall pricing environment and successful contract negotiations with our customers. We believe the increase in shipping volumes was driven, in large part, by the improvement in the overall economic environment as well as increased shipper confidence due to the finalization of the 2014 Financing Transactions and our modified labor agreement entered into in early 2014.
Operating expenses in
2014
increased
$186.3 million
, or
3.9%
, compared to
2013
. The increase in operating expenses was primarily driven by a
$98.1 million
, or
3.5%
,
increase
in salaries, wages and benefits, a
$78.4 million
, or
15.3%
,
increase
in purchased transportation and a a
$34.4 million
, or
14.7%
,
increase
in other operating expense. These increases were partially offset by a
$6.2 million
, or
0.6%
,
decrease
in operating expenses and supplies.
|
•
|
The
$98.1 million
, or
3.5%
,
increase
in salaries, wages and employees’ benefits was driven by a $85.9 million increase in employment costs primarily driven by an increase in shipping volumes and a decrease in our operational productivities. The increase in salaries, wages and employees’ benefits is also driven by a $29.9 million, or 31.9%, increase in workers’ compensation related expenses primarily due to an increase in new claims despite the safety initiatives implemented in
|
24
2013, partially offset by a reduction in letter of credit fees used to support our workers’ compensation claims of $17.7 million, or 63.9%, driven by more favorable terms under our new $450 million asset-based loan facility (“ABL Facility”).
|
•
|
The
$78.4 million
, or
15.3%
,
increase
in purchased transportation was largely driven by an increase in expense related to YRC Freight’s new over-the-road purchased transportation option as permitted by our modified labor agreement that went into effect in February 2014. Additionally, we incurred an increase in local purchased transportation to keep our network in cycle in response to higher volumes and workforce shortages experienced earlier in the year. Finally, we experienced an additional $25.0 million, or 56.9%, increase in vehicle rent expense as our percentage of leased units increased due to our current strategy of using operating leases for our new revenue equipment.
|
|
•
|
The
$34.4 million
, or
14.7%
,
increase
in other operating expense was driven by a $23.0 million, or 74.3%, increase in our bodily injury and property damage expense due to unfavorable development on our outstanding claims, partially offset by a reduction in letter of credit fees used to support our bodily injury and property damage claims of $4.2 million, 67.2%, driven by more favorable terms under our ABL Facility. We also experienced an additional $16.8 million, or 35.3%, increase in cargo claims expense due to an increase in the frequency and severity of our outstanding claims.
|
|
•
|
The
$6.2 million
, or
0.6%
,
decrease
in operating expenses and supplies was driven by a $22.6 million, or 4.1%, decrease in fuel expenses driven by a lower cost per gallon of fuel, partially offset by more miles driven at our Regional Transportation segment. This decrease was partially offset by a $10.6 million, or 5.4%, increase in vehicle maintenance expenses to support our aging fleet.
|
Also offsetting the increase in operating expenses were gains on disposals of property, which were
$11.9 million
in 2014 compared to
$2.2 million
in
2013
.
Nonoperating expenses
decreased
$28.6 million
, or
18.1%
, in
2014
compared to
2013
. The decrease was primarily driven by the $11.2 million gain we recorded on our extinguishment of debt in the first quarter of 2014, $16.3 million of which related to the acceleration of net premiums on our old debt, partially offset by $5.1 million of additional expense related to the fair value of the incremental shares provided to those holders of our 10% Series B Convertible Senior Secured Notes (“Series B Notes”) who exchanged their outstanding balances at a conversion price of $15.00 per share. We also experienced a decrease in interest expense as a result of the 2014 Financing Transactions which reduced our outstanding debt and lowered the weighted average interest rate on our debt.
Our effective tax rate for the years ended December 31, 2014 and 2013 was 19.2% and 35.4%, respectively. Significant items impacting the 2014 rate include a state tax provision, a foreign tax provision, certain permanent items, a decrease in the reserve for uncertain tax positions and an increase in the valuation allowance established for the net deferred tax asset balance at December 31, 2014. We recognize valuation allowances on deferred tax assets if, based on the weight of the evidence, we believe that some or all of our deferred tax assets will not be realized. Changes in valuation allowances are included in our tax provision or in equity if directly related to other comprehensive income (loss), unless affected by a specific intra-period allocation as happened in 2013 and explained in the “Income Taxes” footnote to our consolidated financial statements, in the period of change. In determining whether a valuation allowance is warranted, we evaluate factors such as prior years’ earnings history, expected future earnings, loss carry-back and carry-forward periods, reversals of existing deferred tax liabilities and tax planning strategies that potentially enhance the likelihood of the realization of a deferred tax asset. Accordingly, as of December 31, 2014 and 2013, we have a full valuation allowance against our net deferred tax assets, exclusive of a deferred tax liability related to a foreign jurisdiction.
Since our debt recapitalization in July 2011, we have experienced significant changes in the ownership of our stock, as measured for Federal income tax purposes. On July 25, 2013, we reached the threshold that would trigger a change defined by IRC Code Section 382. Another such ownership change occurred in January 2014. These changes will likely substantially limit the use of tax Net Operating Loss carryovers (NOLs) generated through January 31, 2014 and prior to offset future taxable income. While Section 382 changes may adversely affect future cash flow, they have no impact on our current financial statements. The deferred tax assets resulting from the existing NOLs for which a Section 382 change would limit financial statement recognition are already fully offset by a valuation allowance.
On September 13, 2013, the U.S. Department of the Treasury and the IRS released final regulations providing guidance on the application of IRC Section 263(a) to amounts paid to acquire, produce, or improve tangible property, as well as rules for materials and supplies (“Tangible Property Regulations”). While the final regulations are generally effective for taxable years beginning on or after January 1, 2014, taxpayers were permitted to early adopt provisions for years beginning on or after January 1, 2012. The implementation of these regulations had no material impact on the Company’s financial statements.
2013
Compared to
2012
Our consolidated operating revenue increased
$14.9 million
in
2013
compared to
2012
. The increase in revenue was largely attributable to the increase in volumes at our Regional Transportation reporting segment.
25
Operating expenses in
2013
increased
$10.6 million
or
0.2%
compared to
2012
. The increase in operating expenses was primarily driven by a $23.7 million or 4.8% increase in purchased transportation and a $14.6 million or 0.5% increase in salaries, wages and benefits. These increases were partially offset by a $13.7 million or 5.6% decrease in other operating expense and a $12.0 million or 1.1% decrease in operating expenses and supplies.
|
•
|
The $23.7 million or 4.8% increase in purchased transportation was primarily driven by increased purchased rail transportation costs.
|
|
•
|
The $14.6 million or 0.5% increase in salaries, wages and benefits was primarily driven by a $28.1 million increase in wages to support higher shipping volumes primarily at our Regional Transportation reporting segment. This was partially offset by a $10.0 million decrease in Workers’ Compensation expense from our safety and settlement initiatives.
|
|
•
|
The $13.7 million or 5.6% decrease in other operating expense was driven by a $9.2 million decrease in bodily injury and property damage expense due to our settlement initiatives and a $3.5 million decrease in cargo claims driven by favorable claim development compared to 2012.
|
|
•
|
The $12.0 million or 1.1% decrease in operating expenses and supplies was primarily driven by a $16.5 million decrease in fuel expenses, partially offset by a $6.8 million increase in vehicle maintenance expenses to support our aging fleet.
|
Our consolidated operating income during 2013 included a $2.2 million net gain from the sale of property and equipment compared to a $9.7 million net gain in 2012.
Nonoperating expenses decreased
$17.7 million
or
10.1%
in
2013
compared to
2012
. Nonoperating costs in 2012 include a $30.8 million impairment charge for our equity investment in JHJ. The adjustment was required as the estimated fair value, using a discounted cash flow model, was less than our investment. The impairment charge is reflective of market information obtained in the fourth quarter of 2012. This decrease was partially offset by a $13.1 million increase in interest expense driven by additional make whole interest on our Series B Notes that converted to equity during 2013.
Our effective tax rate for the years ended
December 31, 2013
and
2012
was 35.4% and 9.9%, respectively. Significant items impacting the 2013 rate include a benefit recognized due to application of ASC 740 rules regarding intra-period tax allocation, a state tax provision, a foreign tax provision, certain permanent items, a decrease in the reserve for uncertain tax positions and an increase in the valuation allowance established for the net deferred tax asset balance at December 31, 2013. We recognize valuation allowances on deferred tax assets if, based on the weight of the evidence, we believe that some or all of our deferred tax assets will not be realized. Changes in valuation allowances are included in our tax provision or in equity if directly related to other comprehensive income (loss), unless affected by a specific intra-period allocation as happened in 2013 and explained in the “Income Taxes” footnote to our consolidated financial statements, in the period of change. In determining whether a valuation allowance is warranted, we evaluate factors such as prior years’ earnings history, expected future earnings, loss carry-back and carry-forward periods, reversals of existing deferred liabilities and tax planning strategies that potentially enhance the likelihood of the realization of a deferred tax asset. Accordingly, as of December 31, 2013 and 2012, we have a full valuation allowance against of net deferred tax assets, exclusive of a deferred tax liability related to a foreign jurisdiction.
Since our debt recapitalization in July 2011, we have experienced significant changes in the ownership of our stock, as measured for Federal income tax purposes. On July 25, 2013, we reached the threshold that would trigger a change defined by IRC Code Sec. 382. Subsequent to the balance sheet date, another such ownership change occurred in January 2014. These changes will likely limit substantially the use of tax Net Operating Loss carryovers (NOLs) generated in 2013 and prior to offset future taxable income. While Sec. 382 changes may adversely affect future cash flow, they have no impact on our current financial statements. The deferred tax assets resulting from the existing NOLs for which a Sec. 382 changes would limit financial statement recognition are already fully offset by a valuation allowance.
Reporting Segment Results of Operations
We evaluate our business using our two reporting segments:
|
•
|
YRC Freight
is the reporting segment for our transportation service providers focused on business opportunities in national, regional and international markets. YRC Freight provides for the movement of industrial, commercial and retail goods, primarily through centralized management and customer facing organizations. This unit includes our subsidiary YRC Inc. and Reimer Express, a subsidiary located in Canada that specializes in shipments into, across and out of Canada. In addition to the United States and Canada, YRC Freight also serves parts of Mexico, Puerto Rico and Guam.
|
|
•
|
Regional Transportation
is the reporting segment for our transportation service providers focused on business opportunities in the regional and next-day delivery markets. The Regional Transportation companies each provide
|
26
regional, next-day ground services in their respective regions through a network of facilities located across the United States, Canada, Mexico and Puerto Rico.
YRC Freight Results
YRC Freight represented
64%
,
64%
and
66%
of our consolidated revenue in
2014
,
2013
and
2012
, respectively. The table below provides summary financial information for YRC Freight for the years ended
December 31
:
|
Percent Change
|
|||||||||||||||||
|
(in millions)
|
2014
|
2013
|
2012
|
2014 vs. 2013
|
2013 vs. 2012
|
||||||||||||
|
Operating revenue
|
$
|
3,237.4
|
|
$
|
3,136.8
|
|
$
|
3,206.9
|
|
3.2
|
%
|
(2.2
|
)%
|
||||
|
Operating income (loss)
|
0.5
|
|
(31.2
|
)
|
(37.3
|
)
|
101.6
|
%
|
16.4
|
%
|
|||||||
|
Operating ratio
(a)
|
100.0
|
%
|
101.0
|
%
|
101.2
|
%
|
1.0pp
|
0.2pp
|
|||||||||
|
(a)
|
pp represents the change in percentage points
|
2014
Compared to
2013
YRC Freight reported operating revenue of
$3,237.4 million
in
2014
, an
increase
of
$100.6 million
or
3.2%
compared to
2013
. The table below summarizes the key revenue metrics for the YRC Freight reporting segment for the years ended
December 31
:
|
2014
|
2013
|
Percent Change
(b)
|
||||||||
|
Workdays
|
252.0
|
|
252.5
|
|
|
|||||
|
Total picked up revenue (in millions)
(a)
|
$
|
3,219.6
|
|
$
|
3,126.5
|
|
3.0
|
%
|
||
|
Total tonnage (in thousands)
|
6,807
|
|
6,717
|
|
1.3
|
%
|
||||
|
Total tonnage per workday (in thousands)
|
27.01
|
|
26.60
|
|
1.5
|
%
|
||||
|
Total shipments (in thousands)
|
11,502
|
|
11,444
|
|
0.5
|
%
|
||||
|
Total shipments per workday (in thousands)
|
45.64
|
|
45.32
|
|
0.7
|
%
|
||||
|
Total revenue per hundred weight
|
$
|
23.65
|
|
$
|
23.27
|
|
1.6
|
%
|
||
|
Total revenue per hundred weight (excluding fuel surcharge)
|
$
|
19.80
|
|
$
|
19.35
|
|
2.3
|
%
|
||
|
Total revenue per shipment
|
$
|
280
|
|
$
|
273
|
|
2.5
|
%
|
||
|
Total picked up revenue per shipment (excluding fuel surcharge)
|
$
|
234
|
|
$
|
227
|
|
3.2
|
%
|
||
|
Total weight per shipment (in pounds)
|
1,184
|
|
1,174
|
|
0.8
|
%
|
||||
|
(in millions)
|
2014
|
2013
|
|||||
|
(a)
Reconciliation of operating revenue to total picked up revenue:
|
|||||||
|
Operating revenue
|
$
|
3,237.4
|
|
$
|
3,136.8
|
|
|
|
Change in revenue deferral and other
|
(17.8
|
)
|
(10.3
|
)
|
|||
|
Total picked up revenue
|
$
|
3,219.6
|
|
$
|
3,126.5
|
|
|
(a)
Does not equal financial statement revenue due to revenue recognition adjustments between accounting periods.
(b)
Percent change based on unrounded figures and not rounded figures presented.
Operating income for YRC Freight was
$0.5 million
in
2014
compared to operating loss of
$31.2 million
in
2013
. The operating loss improvement was driven by a
$100.6 million
increase in operating revenue, which was partially offset by a
$68.9 million
increase in operating costs.
The increase in revenue was largely driven by increases in yield and shipping volumes as noted in the table above. The increases in yield were driven by a stronger overall pricing environment and successful contract negotiations with our customers. We believe the increase in volumes was driven, in large part, by the improvement in the overall economic environment as well as increased shipper confidence due to the finalization of the 2014 Financing Transactions and our modified labor agreement in early 2014.
27
The operating cost increase was driven by a $47.1 million, or 2.6%, increase in salaries, wages and employees’ benefits, a $47.7 million, or 11.1%, increase in purchased transportation, and a $14.5 million, or 10.0%, increase in other operating expenses. These increases were partially offset by $16.4 million, or 2.3%, decrease in operating expenses and supplies.
|
•
|
The $47.1 million, or 2.6%, increase in salaries, wages and employees’ benefits was driven by a $37.0 million increase in employment costs primarily driven by an increase in shipping volumes and a decrease in our operational productivities. The increase in salaries, wages and employees’ benefits is also driven by a $24.1 million, or 46.9%, increase in workers’ compensation related expenses primarily due to an increase in the number of new claims, partially offset by a reduction in letter of credit fees used to support our workers’ compensation claims of $14.1 million driven by more favorable terms under our ABL Agreement.
|
|
•
|
The $47.7 million, or 11.1%, increase in purchased transportation was largely driven by an increase in expense related to YRC Freight’s new over-the-road purchased transportation option as permitted by our modified labor agreement that went into effect in February 2014.
|
|
•
|
The $14.5 million, or 10.0%, increase in other operating expense was driven by a $12.4 million increase in cargo claims expense due to an increase in the frequency and severity of our claims. We also experienced a $7.4 million, or 43.4%, increase in our bodily injury and property damage expense due to unfavorable development on our outstanding claims, partially offset by a reduction in letter of credit fees used to support our bodily injury and property damage claims of $3.4 million, or 70.3%, driven by more favorable terms under our ABL Agreement.
|
|
•
|
The $16.4 million, or 2.3%, decrease in operating expenses and supplies was driven by a $21.9 million decrease in fuel expenses driven by a slightly lower cost per gallon of fuel as well as a higher percentage of our linehaul miles being provided by purchased transportation, thus lowering our fuel usage. This decrease was partially offset by a $5.7 million increase in vehicle maintenance expenses to support our aging fleet.
|
Also offsetting the increase in operating expenses were gains on disposals of property, which were $15.9 million in
2014
compared to $3.0 million in
2013
.
2013
Compared to
2012
YRC Freight reported operating revenue of
$3,136.8 million
in
2013
, an
decrease
of
$70.1 million
or 2.2% compared to
2012
. The table below summarizes the key revenue metrics for the YRC Freight reporting segment for the years ended December 31:
|
2013
|
2012
|
Percent Change
(b)
|
||||||||
|
Workdays
|
252.5
|
|
252.0
|
|
||||||
|
Total picked up revenue (in millions)
(a)
|
$
|
3,126.5
|
|
$
|
3,186.5
|
|
(1.9
|
)%
|
||
|
Total tonnage (in thousands)
|
6,717
|
|
6,815
|
|
(1.4
|
)%
|
||||
|
Total tonnage per workday (in thousands)
|
26.60
|
|
27.04
|
|
(1.6
|
)%
|
||||
|
Total shipments (in thousands)
|
11,444
|
|
11,791
|
|
(2.9
|
)%
|
||||
|
Total shipments per workday (in thousands)
|
45.32
|
|
46.79
|
|
(3.1
|
)%
|
||||
|
Total revenue per hundred weight
|
$
|
23.27
|
|
$
|
23.38
|
|
(0.4
|
)%
|
||
|
Total revenue per hundred weight (excluding fuel surcharge)
|
$
|
19.35
|
|
$
|
19.13
|
|
1.1
|
%
|
||
|
Total revenue per shipment
|
$
|
273
|
|
$
|
270
|
|
1.1
|
%
|
||
|
Total picked up revenue per shipment (excluding fuel surcharge)
|
$
|
227
|
|
$
|
221
|
|
2.7
|
%
|
||
|
Total weight per shipment (in pounds)
|
1,174
|
|
1,156
|
|
1.6
|
%
|
||||
|
(in millions)
|
2013
|
2012
|
|||||
|
(a)
Reconciliation of operating revenue to total picked up revenue:
|
|||||||
|
Operating revenue
|
$
|
3,136.8
|
|
$
|
3,206.9
|
|
|
|
Change in revenue deferral and other
|
(10.3
|
)
|
(20.4
|
)
|
|||
|
Total picked up revenue
|
$
|
3,126.5
|
|
$
|
3,186.5
|
|
|
(a)
Does not equal financial statement revenue due to revenue recognition adjustments between accounting periods.
28
(b)
Percent change based on unrounded figures and not rounded figures presented.
Operating loss for YRC Freight was $31.2 million in 2013 compared to $37.3 million in 2012. The operating loss improvement was driven by a $76.2 million decrease in operating costs, which was partially offset by a $70.1 million decrease in revenue.
The decrease in revenue was largely driven by decreases in shipping volumes as noted in the table above. We believe these decreases were a result of driver shortages in the summer months and service declines due to challenges implementing our network optimization plan.
The operating cost decreases were driven by a $41.2 million or 5.5% decrease in operating expenses and supplies, a $33.3 million, or 1.8%, decrease in salaries, wages and benefits, and a $16.6 million, or 10.3%, decrease in other operating expenses. These decreases were partially offset by higher purchased transportation costs of $18.4 million, or 4.5%.
|
•
|
The $41.2 or 5.5% million decrease in operating expenses and supplies was driven by a $18.9 million decrease in fuel driven by a decrease in shipping volumes and slightly lower fuel prices and a $17.5 million decrease in professional services.
|
|
•
|
The $33.3 million or 1.8% decrease in salaries, wages and employees’ benefits during 2013 is driven by a $14.1 million decrease in workers’ compensation expense primarily driven by safety initiatives and favorable development of prior year claims and $10.6 million in lower salaries and wages due to lower shipping volumes partially offset by annual wage increases.
|
|
•
|
The $16.6 million or 10.3% reduction in other operating expense was driven by a $10.7 million decrease in our bodily injury and property damage expense due to our system-wide employee safety initiatives and favorable development of prior year claims and a $3.9 million decrease in cargo claims compared to 2012 due to improved claims frequency.
|
|
•
|
The $18.4 million increase in purchased transportation costs was driven by increased purchased rail transportation costs due to a higher percentage of loaded rail miles in 2013.
|
Gains on disposals of property were $3.0 million in 2013 compared to $10.0 million in 2012.
Regional Transportation Results
Regional Transportation represented
36%
,
36%
and
34%
of consolidated revenue in
2014
,
2013
and
2012
, respectively. The table below provides summary financial information for Regional Transportation for the years ended
December 31
:
|
Percent Change
|
|||||||||||||||||
|
(in millions)
|
2014
|
2013
|
2012
|
2014 vs. 2013
|
2013 vs. 2012
|
||||||||||||
|
Operating revenue
|
$
|
1,831.4
|
|
$
|
1,728.6
|
|
$
|
1,640.6
|
|
5.9
|
%
|
5.4
|
%
|
||||
|
Operating income
|
66.1
|
|
79.9
|
|
70.0
|
|
(17.3
|
)%
|
14.1
|
%
|
|||||||
|
Operating ratio
(a)
|
96.4
|
%
|
95.4
|
%
|
95.7
|
%
|
-1.0pp
|
0.3pp
|
|||||||||
|
(a)
|
pp represents the change in percentage points
|
2014
Compared to
2013
Regional Transportation reported operating revenue of
$1,831.4 million
for
2014
, representing an
increase
of
$102.8 million
, or
5.9%
, from
2013
. The table below summarizes the key revenue metrics for the Regional Transportation reporting segment for the years ended
December 31
:
29
|
2014
|
2013
|
Percent Change
(b)
|
||||||||
|
Workdays
|
252.0
|
|
251.5
|
|
||||||
|
Total picked up revenue (in millions)
(a)
|
$
|
1,832.3
|
|
$
|
1,729.6
|
|
5.9
|
%
|
||
|
Total tonnage (in thousands)
|
7,906
|
|
7,628
|
|
3.6
|
%
|
||||
|
Total tonnage per workday (in thousands)
|
31.37
|
|
30.33
|
|
3.4
|
%
|
||||
|
Total shipments (in thousands)
|
10,745
|
|
10,452
|
|
2.8
|
%
|
||||
|
Total shipments per workday (in thousands)
|
42.64
|
|
41.56
|
|
2.6
|
%
|
||||
|
Total revenue per hundred weight
|
$
|
11.59
|
|
$
|
11.34
|
|
2.2
|
%
|
||
|
Total revenue per hundred weight (excluding fuel surcharge)
|
$
|
9.80
|
|
$
|
9.55
|
|
2.6
|
%
|
||
|
Total revenue per shipment
|
$
|
171
|
|
$
|
165
|
|
3.0
|
%
|
||
|
Total picked up revenue per shipment (excluding fuel surcharge)
|
$
|
144
|
|
$
|
139
|
|
3.4
|
%
|
||
|
Total weight per shipment (in pounds)
|
1,472
|
|
1,460
|
|
0.8
|
%
|
||||
|
(in millions)
|
2014
|
2013
|
|||||
|
(a)
Reconciliation of operating revenue to total picked up revenue:
|
|||||||
|
Operating revenue
|
$
|
1,831.4
|
|
$
|
1,728.6
|
|
|
|
Change in revenue deferral and other
|
0.9
|
|
1.0
|
|
|||
|
Total picked up revenue
|
$
|
1,832.3
|
|
$
|
1,729.6
|
|
|
(a)
Does not equal financial statement revenue due to revenue recognition adjustments between accounting periods.
(b)
Percent change based on unrounded figures and not rounded figures presented.
Operating income for Regional Transportation was
$66.1 million
for
2014
, an
decrease
of
$13.8 million
from the same period in
2013
, consisting of a
$116.6 million
increase in operating expenses, partially offset by a
$102.8 million
increase
in revenue.
The increase in operating revenue was largely driven by increases in shipping volumes and yield as noted in the table above. We believe the increase in shipping volumes was driven, in large part, by the improvement in the overall economic environment as well as increased shipper confidence due to the finalization of the 2014 Financing Transactions and our modified labor agreement in early 2014. The increases in yield were driven by a stronger overall pricing environment and successful contract negotiations with our customers.
The operating cost increase was driven by a $49.6 million, or 5.1%, increase in salaries, wages and employees’ benefits, a $30.6 million, or 37.0%, increase in purchased transportation, a $19.4 million, or 22.0%, increase in other operating expenses and a $10.7 million, or 2.5%, increase in operating expenses and supplies.
|
•
|
The $49.6 million, or 5.1%, increase in salaries, wages and employees’ benefits was driven by a $44.0 million increase in employment costs primarily driven by an increase in shipping volumes and a decrease in our operational productivities. The increase in salaries, wages and employees’ benefits is also driven by a $8.8 million, or 22.5%, increase in workers’ compensation related expenses primarily due to an increase in new claims, partially offset by a reduction in letter of credit fees used to support our workers’ compensation claims of $3.2 million, or 57.5%, driven by more favorable terms under our ABL Agreement.
|
|
•
|
The $30.6 million, or 37.0%, increase in purchased transportation was driven by a $21.5 million, or 350.2%, increase in vehicle rent expense as our percentage of leased units increased due to our current strategy of using operating leases for our new revenue equipment. We also experienced a $9.4 million, or 12.8%, increase in local purchased transportation to keep our network in cycle in response to higher volumes and workforce shortages.
|
|
•
|
The $19.4 million, or 22.0%, increase in other operating expense was driven by a $15.1 million, or 117.3%, increase in our bodily injury and property damage expense due to unfavorable development on our outstanding claims, partially offset by a reduction in letter of credit fees used to support our bodily injury and property damage claims of $0.8 million driven by more favorable terms under our ABL Agreement. We also experienced a $4.4 million increase in cargo claims expense due to an increase in the frequency and severity of our outstanding claims.
|
30
|
•
|
The $10.7 million, or 2.5%, increase in operating expenses and supplies was driven by a $4.9 million, or 6.2%, increase vehicle maintenance expense to support our aging fleet. Regional Transportation only experienced a small decrease in fuel expense as the reduction in the cost per gallon of fuel was almost entirely offset by an increase in miles driven.
|
Also contributing to the increase in operating expenses were losses on disposals of property, which were $4.1 million in
2014
compared to $0.6 million in
2013
.
2013
Compared to
2012
Regional Transportation reported operating revenue of $1,728.6 million for
2013
, representing an increase of $88.0 million, or 5.4%, from the same period in
2012
. The table below summarizes the key revenue metrics for the Regional Transportation reporting segment for the years ended December 31:
|
2013
|
2012
|
Percent Change
(b)
|
||||||||
|
Workdays
|
251.5
|
|
252.0
|
|
||||||
|
Total picked up revenue (in millions)
(a)
|
$
|
1,729.6
|
|
$
|
1,641.1
|
|
5.4
|
%
|
||
|
Total tonnage (in thousands)
|
7,628
|
|
7,321
|
|
4.2
|
%
|
||||
|
Total tonnage per workday (in thousands)
|
30.33
|
|
29.05
|
|
4.4
|
%
|
||||
|
Total shipments (in thousands)
|
10,452
|
|
10,002
|
|
4.5
|
%
|
||||
|
Total shipments per workday (in thousands)
|
41.56
|
|
39.69
|
|
4.7
|
%
|
||||
|
Total revenue per hundred weight
|
$
|
11.34
|
|
$
|
11.21
|
|
1.2
|
%
|
||
|
Total revenue per hundred weight (excluding fuel surcharge)
|
$
|
9.55
|
|
$
|
9.39
|
|
1.7
|
%
|
||
|
Total revenue per shipment
|
$
|
165
|
|
$
|
164
|
|
0.9
|
%
|
||
|
Total picked up revenue per shipment (excluding fuel surcharge)
|
$
|
139
|
|
$
|
137
|
|
1.5
|
%
|
||
|
Total weight per shipment (in pounds)
|
1,460
|
|
1,464
|
|
(0.3
|
)%
|
||||
|
(in millions)
|
2013
|
2012
|
|||||
|
(a)
Reconciliation of operating revenue to total picked up revenue:
|
|||||||
|
Operating revenue
|
$
|
1,728.6
|
|
$
|
1,640.6
|
|
|
|
Change in revenue deferral and other
|
1.0
|
|
0.5
|
|
|||
|
Total picked up revenue
|
$
|
1,729.6
|
|
$
|
1,641.1
|
|
|
(a)
Does not equal financial statement revenue due to revenue recognition adjustments between accounting periods.
(b)
Percent change based on unrounded figures and not rounded figures presented.
Operating income for Regional Transportation was $79.9 million for 2013, an increase of $9.9 million from the same period in
2012, consisting of an $88.0 million increase in revenue, partially offset by a $78.1 million increase in operating expenses. The increase in revenue was driven by increases in shipping volumes and yield as indicated in the table above. We believe these increases were driven by a moderate improvement in the economic conditions in the areas where our regional carriers operate.
The increase in operating expenses was driven by a $47.7 million, or 5.1%, increase in salaries, wages and benefits and a $18.2 million, or 4.4%, increase in operating expense and supplies.
|
•
|
Salaries, wages and employees’ benefits expense increased by $47.7 million, or 5.1%, primarily as a result of an increase in wages and associated benefits compared to the prior year driven by an increase shipping volumes.
|
|
•
|
Operating expenses and supplies increased by $18.2 million, or 4.4%, due to a $6.7 million increase in vehicle maintenance driven by our aging fleet and a $2.7 million increase in fuel expenses as a result of higher shipping volumes.
|
Net losses on property disposals were $0.6 million in 2013 compared to $0.7 million in 2012.
Certain Non-GAAP Financial Measures
31
As discussed in the “Our Business” section, we use certain non-GAAP financial measures to assess performance. These measures should be considered in addition to the results prepared in accordance with GAAP, but should not be considered a substitute for, or superior to, our GAAP financial measures.
Consolidated Adjusted EBITDA
The reconciliation of operating income to Adjusted EBITDA (as defined in the credit agreement for our $700 million term loan facility (“Term Loan”) as “Consolidated EBITDA”) for the
years ended December 31, 2014, 2013 and 2012
is as follows:
|
(in millions)
|
2014
|
2013
|
2012
|
||||||||
|
Reconciliation of operating income to adjusted EBITDA:
|
|||||||||||
|
Operating income
|
$
|
45.5
|
|
$
|
28.4
|
|
$
|
24.1
|
|
||
|
Depreciation and amortization
|
163.6
|
|
172.3
|
|
183.8
|
|
|||||
|
Gains on property disposals, net
|
(11.9
|
)
|
(2.2
|
)
|
(9.7
|
)
|
|||||
|
Letter of credit expense
|
12.1
|
|
33.9
|
|
36.3
|
|
|||||
|
Restructuring professional fees
|
4.2
|
|
12.0
|
|
3.0
|
|
|||||
|
(Gains) losses on permitted dispositions and other
|
1.8
|
|
1.7
|
|
(4.0
|
)
|
|||||
|
Equity based compensation expense
|
14.3
|
|
5.8
|
|
3.8
|
|
|||||
|
Amortization of ratification bonus
|
15.6
|
|
—
|
|
—
|
|
|||||
|
Other nonoperating, net
(a)
|
(0.7
|
)
|
3.0
|
|
2.2
|
|
|||||
|
Adjusted EBITDA
|
$
|
244.5
|
|
$
|
254.9
|
|
$
|
239.5
|
|
||
|
(a)
|
As required under our Term Loan, other nonoperating, net shown above does not include the impact of earnings (loss) of our equity method investment as well as all non-cash foreign currency gains or losses.
|
Consolidated Adjusted Free Cash Flow (Deficit)
The reconciliation of adjusted EBITDA to adjusted free cash flow (deficit) for the
years ended December 31, 2014, 2013 and 2012
is as follows:
|
(in millions)
|
2014
|
2013
|
2012
|
||||||||
|
Adjusted EBITDA
|
$
|
244.5
|
|
$
|
254.9
|
|
$
|
239.5
|
|
||
|
Total restructuring professional fees
|
(4.2
|
)
|
(12.0
|
)
|
(3.0
|
)
|
|||||
|
Cash paid for interest
|
(129.1
|
)
|
(120.5
|
)
|
(120.5
|
)
|
|||||
|
Cash paid for letter of credit fees
|
(8.7
|
)
|
(34.1
|
)
|
(38.0
|
)
|
|||||
|
Working Capital cash flows excluding income tax, net
|
(90.1
|
)
|
(85.0
|
)
|
(109.8
|
)
|
|||||
|
Net cash provided by (used in) operating activities before income taxes
|
12.4
|
|
3.3
|
|
(31.8
|
)
|
|||||
|
Cash received for income taxes, net
|
16.1
|
|
8.8
|
|
5.9
|
|
|||||
|
Net cash provided by (used in) operating activities
|
28.5
|
|
12.1
|
|
(25.9
|
)
|
|||||
|
Acquisition of property and equipment
|
(69.2
|
)
|
(66.9
|
)
|
(66.4
|
)
|
|||||
|
Total restructuring professional fees
|
4.2
|
|
12.0
|
|
3.0
|
|
|||||
|
Adjusted Free Cash Flow (Deficit)
|
$
|
(36.5
|
)
|
$
|
(42.8
|
)
|
$
|
(89.3
|
)
|
||
Segment Adjusted EBITDA
The following represents adjusted EBITDA by segment for the
years ended December 31, 2014, 2013 and 2012
is as follows:
32
|
(in millions)
|
2014
|
2013
|
2012
|
||||||||
|
Adjusted EBITDA by segment:
|
|||||||||||
|
YRC Freight
|
$
|
99.8
|
|
$
|
105.2
|
|
$
|
104.9
|
|
||
|
Regional Transportation
|
144.4
|
|
150.5
|
|
140.2
|
|
|||||
|
Corporate and other
|
0.3
|
|
(0.8
|
)
|
(5.6
|
)
|
|||||
|
Adjusted EBITDA
|
$
|
244.5
|
|
$
|
254.9
|
|
$
|
239.5
|
|
||
The reconciliation of operating income (loss), by segment, to adjusted EBITDA for the
years ended December 31, 2014, 2013 and 2012
is as follows:
|
YRC Freight segment (in millions)
|
2014
|
2013
|
2012
|
||||||||
|
Reconciliation of operating loss to adjusted EBITDA:
|
|||||||||||
|
Operating income (loss)
|
$
|
0.5
|
|
$
|
(31.2
|
)
|
$
|
(37.3
|
)
|
||
|
Depreciation and amortization
|
98.0
|
|
109.1
|
|
119.8
|
|
|||||
|
Gains on property disposals, net
|
(15.9
|
)
|
(3.0
|
)
|
(9.9
|
)
|
|||||
|
Letter of credit expense
|
8.3
|
|
25.8
|
|
29.6
|
|
|||||
|
Amortization of ratification bonus
|
10.0
|
|
—
|
|
—
|
|
|||||
|
Other nonoperating expenses, net
(a)
|
(1.1
|
)
|
4.5
|
|
2.7
|
|
|||||
|
Adjusted EBITDA
|
$
|
99.8
|
|
$
|
105.2
|
|
$
|
104.9
|
|
||
|
(a)
|
As required under our Term Loan, other nonoperating, net shown above removes the impact of non-cash foreign currency gains or losses.
|
|
Regional Transportation segment (in millions)
|
2014
|
2013
|
2012
|
||||||||
|
Reconciliation of operating income to adjusted EBITDA:
|
|||||||||||
|
Operating income
|
$
|
66.1
|
|
$
|
79.9
|
|
$
|
70.0
|
|
||
|
Depreciation and amortization
|
65.8
|
|
63.1
|
|
63.3
|
|
|||||
|
Losses on property disposals, net
|
4.0
|
|
0.6
|
|
0.7
|
|
|||||
|
Letter of credit expense
|
2.9
|
|
6.8
|
|
6.2
|
|
|||||
|
Amortization of ratification bonus
|
5.6
|
|
—
|
|
—
|
|
|||||
|
Other nonoperating expenses, net
|
—
|
|
0.1
|
|
—
|
|
|||||
|
Adjusted EBITDA
|
$
|
144.4
|
|
$
|
150.5
|
|
$
|
140.2
|
|
||
|
Corporate and other segment (in millions)
|
2014
|
2013
|
2012
|
||||||||
|
Reconciliation of operating loss to adjusted EBITDA:
|
|||||||||||
|
Operating loss
|
$
|
(21.1
|
)
|
$
|
(20.3
|
)
|
$
|
(8.6
|
)
|
||
|
Depreciation and amortization
|
(0.2
|
)
|
0.1
|
|
0.7
|
|
|||||
|
(Gains) losses on property disposals, net
|
—
|
|
0.2
|
|
(0.5
|
)
|
|||||
|
Letter of credit expense
|
0.9
|
|
1.3
|
|
0.5
|
|
|||||
|
Restructuring professional fees
|
4.2
|
|
12.0
|
|
3.0
|
|
|||||
|
(Gains) losses on permitted dispositions and other
|
1.8
|
|
1.7
|
|
(4.0
|
)
|
|||||
|
Equity based compensation expense
|
14.3
|
|
5.8
|
|
3.8
|
|
|||||
|
Other nonoperating expenses, net
(a)
|
0.4
|
|
(1.6
|
)
|
(0.5
|
)
|
|||||
|
Adjusted EBITDA
|
$
|
0.3
|
|
$
|
(0.8
|
)
|
$
|
(5.6
|
)
|
||
|
(a)
|
As required under our Term Loan, other nonoperating, net shown above removes the impact of earnings (loss) of our equity method investment as well as non-cash foreign currency gains or losses.
|
33
Financial Condition/Liquidity and Capital Resources
Our principal sources of liquidity are cash and cash equivalents, available borrowings under our ABL Facility and any prospective net cash flow from operations. As of
December 31, 2014
, we had cash and cash equivalents and amounts able to be drawn on our ABL Facility totaling
$198.2 million
. The amount which we are actually able to draw on our ABL Facility is limited by certain financial covenants in the ABL Facility.
Our principal uses of cash are to fund our operations, including making contributions to our single-employer pension plans and the multi-employer pension funds, and to meet our other cash obligations, including but not limited to paying cash interest and principal on our funded debt, letter of credit fees under our credit facilities and funding capital expenditures. For the
year ended December 31, 2014
, our cash flow from operating activities
provided
net cash of
$28.5 million
.
Our ABL Facility credit agreement, among other things, restricts certain capital expenditures and requires that the Company, in effect, maintain availability of at least 10% of the lesser of the aggregate amount of commitments from all lenders or the borrowing base.
We have a considerable amount of indebtedness. As of
December 31, 2014
, we had
$1,116.2 million
in aggregate par value of outstanding indebtedness, the majority of which matures in 2019. We also have considerable future funding obligations for our single-employer pension plans and various multi-employer pension funds. We expect our funding obligations for
2015
for our single-employer pension plans and multi-employer pension funds will be
$60.3 million
and
$91.6 million
, respectively. In addition, we have, and will continue to have, substantial operating lease obligations. As of
December 31, 2014
, our operating lease obligations for 2015 are
$63.6 million
. As of
December 31, 2014
, our operating lease obligations through 2025 totaled
$194.5 million
and is expected to increase as we lease additional revenue equipment. As of
December 31, 2014
, our Standard & Poor’s Corporate Family Rating was “CCC+” and Moody’s Investor Service Corporate Family Rating was “B3”.
Our capital expenditures for the years ended
December 31, 2014
and
2013
were
$69.2 million
and
$66.9 million
, respectively. These amounts were principally used to fund replacement engines and trailer refurbishments for our revenue fleet, capitalized costs for our network facilities and technology infrastructure. Additionally, for the
years ended December 31, 2014 and 2013
, we entered into new operating lease commitments for revenue equipment totaling
$65.0 million
and
67.1 million
, respectively, with such payments to be made over the average lease term of
5 years
. Additionally, for the
years ended December 31, 2014 and 2013
the capital value of these equipment totals were
$72.4 million
and
70.2 million
, respectively. In light of our operating results over the past few years and our liquidity needs, we have deferred certain capital expenditures and may continue to do so in the future. As a result, the average age of our fleet is increasing, which may affect our maintenance costs and operational efficiency unless we are able to obtain suitable lease financing to meet our replacement equipment needs.
34
Credit Facility Covenants
On February 13, 2014, we completed our 2014 Financing Transactions and refinanced the debt associated with our prior credit facilities. We entered into a Term Loan credit agreement with new financial covenants that, among other things, restricts certain capital expenditures and requires us to maintain a maximum total leverage ratio (defined as Consolidated Total Debt divided by Consolidated Adjusted EBITDA as defined below).
On September 25, 2014, the Company entered into an amendment to the Term Loan credit agreement (the “Credit Agreement Amendment”) which, among other things, adjusted the maximum permitted total leverage ratio through December 31, 2016 and increased the applicable interest rate over the same period.
The Credit Agreement Amendment reset the total maximum leverage ratio covenants as follows:
|
Four Consecutive Fiscal Quarters Ending
|
Maximum Total
Leverage Ratio
|
Four Consecutive Fiscal Quarters Ending
|
Maximum Total
Leverage Ratio
|
|
|
September 30, 2014
|
5.25 to 1.00
|
September 30, 2016
|
3.75 to 1.00
|
|
|
December 31, 2014
|
5.25 to 1.00
|
December 31, 2016
|
3.50 to 1.00
|
|
|
March 31, 2015
|
5.00 to 1.00
|
March 31, 2017
|
3.25 to 1.00
|
|
|
June 30, 2015
|
4.75 to 1.00
|
June 30, 2017
|
3.25 to 1.00
|
|
|
September 30, 2015
|
4.50 to 1.00
|
September 30, 2017
|
3.25 to 1.00
|
|
|
December 31, 2015
|
4.25 to 1.00
|
December 31, 2017 and thereafter
|
3.00 to 1.00
|
|
|
March 31, 2016
|
4.00 to 1.00
|
|
|
|
|
June 30, 2016
|
3.75 to 1.00
|
|||
Upon effectiveness of the Credit Agreement Amendment, each consenting lender received a fee equal to
0.25%
of their outstanding exposure, resulting in
$1.7 million
of fees paid in 2014. These fees have been included in ‘Other Assets’ on the consolidated balance sheet and will be amortized over the remaining life of the Term Loan.
Consolidated Adjusted EBITDA, defined in our Credit Agreement Amendment as “Consolidated EBITDA,” is a measure that reflects our earnings before interest, taxes, depreciation, and amortization expense, and is further adjusted for, among other things, letter of credit fees, equity-based compensation expense, net gains or losses on property disposals and certain other items, including restructuring professional fees, expenses associated with certain lump sum payments to our IBT employees and the results of permitted dispositions and discontinued operations. Consolidated Total Debt, as defined in our Credit Agreement Amendment, is the principal amount of indebtedness outstanding. Our total leverage ratio for the year ended
December 31, 2014
was
4.57
to 1.00.
We believe that our results of operations will provide sufficient liquidity to fund our operations and meet the covenants under our Term Loan for at least the next twelve months.
Our ability to satisfy our liquidity needs and meet future stepped-up covenants beyond the next twelve months is primarily dependent on improving our profitability. Improvements to our profitability primarily include continued successful implementation and realization of productivity and efficiency initiatives including those identified in the modified labor agreement as well as pricing and safety improvements. Some of these are outside of our control.
In the event our operating results indicate we will not meet our maximum total leverage ratio, we will take action to improve our maximum total leverage ratio which will include paying down our outstanding indebtedness with either cash on hand or with cash proceeds from equity issuances. The issuance of equity is outside of our control and there can be no assurance that we will be able to issue additional equity at terms that are agreeable to us or that we would have sufficient cash on hand to meet the maximum total leverage ratio.
In the event that we fail to comply with any Term Loan covenant or any ABL Facility covenant, we would be considered in default, which would enable applicable lenders to accelerate the repayment of amounts outstanding, require the cash collateralization of letters of credit (in the case of the ABL Facility) and exercise remedies with respect to collateral and we would need to seek an amendment or waiver from the applicable lender groups. In the event that our lenders under our Term Loan or ABL Facility demand payment or cash collateralization (in the case of the ABL Facility), we will not have sufficient cash to repay such indebtedness. In addition, a default under our Term Loan or ABL Facility or the applicable lenders exercising their remedies
35
thereunder could trigger cross-default provisions in our other indebtedness and certain other operating agreements. Our ability to amend our Term Loan or our ABL Facility or otherwise obtain waivers from the applicable lenders depends on matters that are outside of our control and there can be no assurance that we will be successful in that regard.
Cash Flow
Operating Cash Flow
Operating cash flow was a source of cash of
$28.5 million
for the year ended
December 31, 2014
compared to a source of cash of
$12.1 million
during the year ended
December 31, 2013
. The favorable cash flow impact is largely related to a
$15.9 million
year-over-year decrease in net loss.
Operating cash flow was a source of cash of
$12.1 million
for the year ended
December 31, 2013
compared to a use of cash of
$25.9 million
during the year ended
December 31, 2012
. The favorable cash flow impact is largely related to a decrease in our workers’ compensation and bodily injury and property damage liabilities.
Investing Cash Flow
Investing cash flows used
$41.6 million
of cash in
2014
compared to
$23.5 million
used in
2013
. In
2014
, we received a net $1.6 million in restricted escrow refunds, compared to
$31.8 million
in
2013
. Also, proceeds from the disposal of property and equipment increased in
2014
compared to
2013
due to additional property sales in 2014. See a detailed discussion of
2014
and
2013
capital expenditures below in “Capital Expenditures” for further information.
Investing cash flows used
$23.5 million
of cash in
2013
compared to a source of cash of
$19.8 million
in
2012
. In
2013
, we received
$31.8 million
in restricted escrow refunds, compared to
$33.4 million
in
2012
. Also, proceeds from the disposal of property and equipment declined in
2013
compared to
2012
. See a detailed discussion of
2013
and
2012
capital expenditures below in “Capital Expenditures” for further information.
Financing Cash Flow
Net cash provided by financing activities for
2014
was
$7.9 million
. The cash provided during
2014
was driven by the issuance of $693.0 million in long-term debt for the Term Loan and
$250.0 million
in equity issuance proceeds, offset by
$892.7 million
of repayments of our long-term debt. The repayments primarily consisted of $298.1 million for our previous term loan (the “Prior Term Loan”), $324.9 million for our prior asset-based loan that was replaced by our ABL Facility (“Prior ABL Facility”), $69.4 million for our 6% Convertible Senior Notes (“6% Notes”) and $183.5 million for our Series A Convertible Senior Secured Notes (“Series A Notes”). We also had
$29.1 million
in debt issuance costs and
$17.1 million
in equity issuance costs related to our new debt and equity issued in
2014
.
Net cash used in financing activities for
2013
was
$21.0 million
. During
2013
, we increased our net borrowings under our Prior ABL Facility by $0.3 million, which was offset by a $9.2 million repayment of other long-term debt from asset sale proceeds and $12.1 million in debt issuance costs related to the November 12, 2013 credit agreement amendments.
Net cash provided by financing activities for
2012
was
$14.3 million
. During
2012
, we increased our net borrowings under our Prior ABL Facility by $45.0 million, which was offset by a $25.6 repayment of other long-term debt from asset sale proceeds and $5.1 million in debt issuance costs.
Capital Expenditures
Our capital expenditures focus primarily on the replacement of revenue equipment, land and structures purchases and investments in information technology. Our business is capital intensive with significant investments in service center facilities and a fleet of tractors and trailers. We determine the amount and timing of capital expenditures based on numerous factors, including fleet age, service center condition, viability of IT systems, anticipated liquidity levels, economic conditions, new or expanded services, regulatory actions and availability of financing.
36
The table below summarizes our actual net capital expenditures (proceeds) by type of investment for the years ended December 31:
|
(in millions)
|
2014
|
2013
|
2012
|
||||||||
|
Acquisition of property and equipment
|
|||||||||||
|
Revenue equipment
|
$
|
27.4
|
|
$
|
48.0
|
|
$
|
48.4
|
|
||
|
Land and structures
|
6.0
|
|
5.1
|
|
3.9
|
|
|||||
|
Technology
|
18.3
|
|
10.3
|
|
12.2
|
|
|||||
|
Other
|
17.5
|
|
3.5
|
|
1.9
|
|
|||||
|
Total capital expenditures
|
69.2
|
|
66.9
|
|
66.4
|
|
|||||
|
Proceeds from disposal of property and equipment
|
|||||||||||
|
Revenue equipment
|
(2.0
|
)
|
(4.1
|
)
|
(2.6
|
)
|
|||||
|
Land and structures
|
(18.0
|
)
|
(5.7
|
)
|
(47.8
|
)
|
|||||
|
Other
|
(0.8
|
)
|
—
|
|
—
|
|
|||||
|
Total proceeds
|
(20.8
|
)
|
(9.8
|
)
|
(50.4
|
)
|
|||||
|
Total net capital expenditures
|
$
|
48.4
|
|
$
|
57.1
|
|
$
|
16.0
|
|
||
Our capital expenditures for revenue equipment were primarily for replacement engines and trailer refurbishments for our revenue fleet. We procured substantially all of our new revenue equipment using operating leases in 2014 and plan to continue this practice in 2015. Additionally, the increase in other capital expenditures in 2014 consists primarily of new dimensioners, which are used to measure shipment size at our distribution centers.
Our expectation regarding our ability to fund capital expenditures using operating leases is only our forecast regarding this matter. This forecast may be substantially different from actual results. In addition to the factors previously described in “
Financial Condition/Liquidity and Capital Resources
”, the introduction to “Part I” and the risk factors listed in “Item 1A” of this report, the following factors could affect levels of capital expenditures: the accuracy of our estimates regarding our spending requirements, changes in our strategic direction, the need to spend additional capital on cost reduction opportunities, the need to replace any unanticipated losses in capital assets and our ability to dispose of excess real estate at our anticipated sales price. In addition, our credit facilities contain provisions that restrict our level of capital expenditures.
Contractual Obligations and Other Commercial Commitments
The following sections provide aggregated information regarding our contractual obligations and commercial commitments as of
December 31, 2014
.
Non-Union Pension Obligations
We provide defined benefit pension plans for certain employees not covered by collective bargaining agreements. The Yellow Transportation and Roadway qualified plans cover approximately
12,000
employees including those currently receiving benefits and those who have left the company with deferred benefits. On January 1, 2004, the existing qualified benefit plans were closed to new participants. On July 1, 2008, the benefit accrual for participants was frozen.
We have also adopted the required legislative updates provided by the Highway and Transportation Funding Act (“HATFA”) which was signed into law on August 8, 2014. This legislation extends the use of longer-term, stabilized interest rate assumptions for measuring pension obligations and minimum funding requirements. We expect to make the plan contributions as required by HATFA and other regulations.
During
2014
, our pension expense was
$24.1 million
and our cash contributions were
$62.3 million
. Using our current plan assumptions, which include an assumed
7.0%
return on assets and a discount rate of
4.33%
, we expect to record expense of
$16.4 million
for the year ended December 31, 2015. We expect our cash contributions for our non-union sponsored pension plans for the next five years to be as follows:
37
|
(in millions)
|
Expected Cash Contributions
|
||
|
2015
|
$
|
60.3
|
|
|
2016
|
55.9
|
|
|
|
2017
|
71.6
|
|
|
|
2018
|
52.3
|
|
|
|
2019
|
41.8
|
|
|
Our investment strategy for our pension assets and our related pension contribution funding obligation includes an active interest rate hedging program designed to mitigate the impact of changes in interest rates on each plan’s funded position. If the pension discount rate falls, our investment strategy is designed to significantly mitigate such interest rate risk to each pension plan’s funded status and our contribution funding obligation. Conversely, if the pension discount rate rises, some portion of the beneficial impact of a rising discount rate on the pension liability will be forgone. The investment program is dynamic and the hedging program is designed to adapt to market conditions.
If future actual asset returns fall short of the 7.0% assumption by 1.0% per year, total cash contributions would be $13.1 million higher over the next five years. If future actual asset returns exceed the 7.0% assumption by 1.0% per year, total cash contributions would be $13.3 million lower over the next five years.
If future interest rates decrease 100 basis points from January 1, 2015 levels, total cash contributions would be $44.0 million lower over the next five years. This reflects our liability hedging strategy and the impact of HAFTA legislation. The liability hedging strategy results in additional asset returns from decreases in interest rates. However, HATFA limits the increase in liabilities from lower interest rates such that the net effect is lower contributions. If interest rates increase 100 basis points from January 1, 2015 levels, total cash contributions would be $39.2 million higher over the next five years.
Contractual Cash Obligations
The following table reflects our cash outflows that we are contractually obligated to make as of
December 31, 2014
:
|
|
Payments Due by Period
|
|
||||||||||||||||||
|
(in millions)
|
Less than 1 year
|
1-3 years
|
3-5 years
|
After 5 years
|
Total
|
|||||||||||||||
|
Balance sheet obligations:
(a)
|
||||||||||||||||||||
|
ABL borrowings, including interest
|
$
|
0.3
|
|
$
|
0.6
|
|
$
|
0.3
|
|
$
|
—
|
|
$
|
1.2
|
|
|||||
|
Long-term debt including interest
|
83.1
|
|
128.5
|
|
734.7
|
|
—
|
|
946.3
|
|
||||||||||
|
Lease financing obligations
|
41.0
|
|
81.9
|
|
61.3
|
|
35.3
|
|
219.5
|
|
(b)
|
|||||||||
|
Pension deferral obligations including interest
|
8.8
|
|
17.6
|
|
137.8
|
|
—
|
|
164.2
|
|
||||||||||
|
Workers’ compensation, property damage and liability claims obligations
(c)
|
115.0
|
|
129.6
|
|
60.4
|
|
109.1
|
|
414.1
|
|
||||||||||
|
Off balance sheet obligations:
|
||||||||||||||||||||
|
Operating leases
|
63.6
|
|
78.9
|
|
34.3
|
|
17.7
|
|
194.5
|
|
||||||||||
|
Letter of credit fees
|
9.0
|
|
18.0
|
|
10.1
|
|
—
|
|
37.1
|
|
||||||||||
|
Capital expenditures
|
8.3
|
|
—
|
|
—
|
|
—
|
|
8.3
|
|
||||||||||
|
Total contractual obligations
|
$
|
329.1
|
|
$
|
455.1
|
|
$
|
1,038.9
|
|
$
|
162.1
|
|
$
|
1,985.2
|
|
|||||
|
(a)
|
Total liabilities for uncertain tax positions as of
December 31, 2014
were
$11.6 million
and are classified on the Company’s consolidated balance sheet within “Claims and Other Liabilities” and are excluded from the table above.
|
|
(b)
|
The lease financing obligation payments represent interest payments of
$158.8 million
and principal payments of
$60.7 million
. The remaining principle obligation is offset by the estimated book value of leased property at the expiration date of each lease agreement.
|
|
(c)
|
The workers’ compensation, property damage and liability claims obligations represent our estimate of future payments for these obligations, not all of which are contractually required.
|
During
2014
, we entered into new operating lease commitments for revenue equipment of
$65.0 million
, with such lease payments to be made over the average lease term of
5 years
. The capital value of this equipment totals
$72.4 million
.
38
Other Commercial Commitments
The following table reflects other commercial commitments or potential cash outflows that may result from a contingent event, such as a need to borrow short-term funds due to insufficient cash flow.
|
|
Amount of Commitment Expiration Per Period
|
|
|||||||||||||||||
|
(in millions)
|
Less than 1 year
|
1-3 years
|
3-5 years
|
After 5 years
|
Total
|
||||||||||||||
|
Unused line of credit
|
|||||||||||||||||||
|
ABL Facility
(a)
|
$
|
—
|
|
$
|
—
|
|
$
|
71.2
|
|
(b)
|
$
|
—
|
|
$
|
71.2
|
|
|||
|
Letters of credit
|
—
|
|
—
|
|
374.3
|
|
—
|
|
374.3
|
|
|||||||||
|
Surety bonds
|
117.2
|
|
—
|
|
0.1
|
|
—
|
|
117.3
|
|
|||||||||
|
Total commercial commitments
|
$
|
117.2
|
|
$
|
—
|
|
$
|
445.6
|
|
$
|
—
|
|
|
$
|
562.8
|
|
|||
|
(a)
|
At December 31, 2014, we held
$89.1 million
in restricted escrow, which represents cash collateral for our outstanding letters of credit on our ABL Facility.
|
|
(b)
|
The unused line of credit that may actually be drawn is limited by certain financial covenants in the ABL Facility. As of December 31, 2014, the amount that actually may be drawn on the ABL Facility is
$27.1 million
.
|
39
Critical Accounting Policies
Preparation of our financial statements requires accounting policies that involve significant estimates and judgments regarding the amounts included in the financial statements and disclosed in the accompanying notes to the financial statements. We continually review the appropriateness of our accounting policies and the accuracy of our estimates including discussion with the Audit/Ethics Committee of our Board of Directors who make recommendations to management regarding these policies. Even with a thorough process, estimates must be adjusted based on changing circumstances and new information. Management has identified the policies described below as requiring significant judgment and having a potential material impact to our financial statements.
Revenue Reserves
We consider our policies regarding revenue-related reserves as critical based on their significance in evaluating our financial performance by management and investors. We have an extensive system that allows us to accurately capture, record and control all relevant information necessary to effectively manage our revenue reserves.
In addition, YRC Freight and Regional Transportation recognize revenue on a gross basis because they are the primary obligors even when other transportation service providers are used who act on their behalf. YRC Freight and Regional Transportation remain responsible to their customers for complete and proper shipment, including the risk of physical loss or damage of the goods and cargo claims issues. Management believes these policies most accurately reflect revenue as earned. Our revenue-related reserves involve three primary estimates: shipments in transit, rerate reserves and uncollectible accounts.
Shipments in Transit
We assign pricing to bills of lading at the time of shipment based primarily on the weight, general classification of the product, the shipping destination and individual customer discounts. This process is referred to as rating. For shipments in transit, YRC Freight and Regional Transportation record revenue based on the percentage of service completed as of the period end and accrue delivery costs as incurred. The percentage of service completed for each shipment is based on how far along in the shipment cycle each shipment is in relation to standard transit days. Standard transit days are defined as our published service days between origin zip code and destination zip code. Based on historical cost and engineering studies, certain percentages of revenue are determined to be earned during each stage of the shipment cycle, such as initial pick up, long distance transportation, intermediate transfer and customer delivery. Using standard transit times, we analyze each shipment in transit at a particular period end to determine what stage the shipment is in. We apply that stage’s percentage of revenue earned factor to the rated revenue for that shipment to determine the revenue dollars earned by that shipment in the current period. The total revenue earned is accumulated for all shipments in transit at a particular period end and recorded as operating revenue. Management believes this provides a reasonable estimation of the portion of in transit revenue actually earned. At
December 31, 2014
and
2013
, our financial statements included deferred revenue as a reduction to “Accounts Receivable” of $27.1 million and $26.6 million, respectively.
Rerate Reserves
At various points throughout our customer invoicing process, incorrect ratings (
i.e.
prices) could be identified based on many factors, including weight verifications or updated customer discounts. Although the majority of rerating occurs in the same month as the original rating, a portion occurs during the following periods. We accrue a reserve for rerating primarily based on historical trends. At
December 31, 2014
and
2013
, our financial statements included a rerate reserve as a reduction to “Accounts Receivable” of
$12.2 million
and
$9.6 million
, respectively.
Uncollectible Accounts
We record an allowance for doubtful accounts primarily based on historical uncollectible amounts. We also take into account known factors surrounding specific customers and overall collection trends. Our process involves performing ongoing credit evaluations of customers, including the market in which they operate and the overall economic conditions. We continually review historical trends and make adjustments to the allowance for doubtful accounts as appropriate. Our allowance for doubtful accounts totaled
$10.0 million
and
$9.3 million
as of
December 31, 2014
and
2013
, respectively.
Claims and Self-Insurance
We are self-insured up to certain limits for workers’ compensation, cargo loss and damage, property damage and liability claims. We measure the liabilities associated with workers’ compensation and property damage and liability claims primarily through actuarial methods performed by an independent third party. Actuarial methods include estimates for the undiscounted liability for
40
claims reported, for claims incurred but not reported and for certain future administrative costs. These estimates are based on historical loss experience and judgments about the present and expected levels of costs per claim and the time required to settle claims. The effect of future inflation for costs is considered in the actuarial analysis. Actual claims may vary from these estimates due to a number of factors, including but not limited to, accident frequency and severity, claims management, changes in healthcare costs and overall economic conditions. We discount the actuarial calculations of claims liabilities for each calendar year to present value based on the average U.S. Treasury rate, during the calendar year of occurrence, for maturities that match the initial expected payout of the liabilities. As of
December 31, 2014
and
2013
, we had
$406.6 million
and
$400.4 million
accrued for claims and insurance, respectively.
Pension
Effective July 1, 2008, we froze our qualified and nonqualified defined benefit pension plans for all participating employees not covered by collective bargaining agreements. Given the frozen status of the plans, the key estimates in determining pension cost are return on plan assets and discount rate, each of which are discussed below.
Return on Plan Assets
The assumption for expected return on plan assets represents a long-term assumption of our portfolio performance that can impact our pension expense. With
$899.3 million
of plan assets for the YRC Worldwide funded pension plans, a 100-basis-point decrease in the assumption for expected rate of return on assets would increase annual pension expense by approximately $8.5 million and would have no effect on the underfunded pension liability reflected on the balance sheet at
December 31, 2014
.
We believe our 2015 expected rate of return of 7.00% is appropriate based on our investment portfolio as well as a review of other objective indices. Although plan investments are subject to short-term market volatility, we believe they are well diversified and closely managed. Our asset allocation as of December 31, 2014 consisted of
37.0%
equities,
35.0%
in debt securities, and
28.0%
in absolute return investments and as of December 31, 2013 consisted of
35.0%
equities,
34.0%
in debt securities,
31.0%
in absolute return investments. The 2014 allocation is consistent with the current long-term target asset allocation for the plans which is
37.0%
for equities,
33.0%
for debt securities and
30.0%
for absolute return investments. We will continue to review our expected long-term rate of return on an annual basis and revise appropriately.
Discount Rate
The discount rate refers to the interest rate used to discount the estimated future benefit payments to their present value, also referred to as the benefit obligation. The discount rate allows us to estimate what it would cost to settle the pension obligations as of the measurement date, December 31, and impacts the following year’s pension cost. We determine the discount rate by selecting a portfolio of high quality non-callable bonds with interest payments and maturities generally consistent with our expected benefit payments.
Changes in the discount rate can significantly impact our net pension liability. However, the liability hedging strategy mitigates this impact with additional asset returns. A 100-basis-point decrease in our discount rate would increase our underfunded pension liability by approximately $132.0 million. That same change would decrease our annual pension expense by approximately $6.0 million, driven by the return on assets. The discount rate can fluctuate considerably over periods depending on overall economic conditions that impact long-term corporate bond yields. At December 31, 2014 and 2013, we used a discount rate to determine benefit obligations of 4.33% and 5.23%, respectively.
Gains and Losses
Gains and losses occur due to changes in the amount of either the projected benefit obligation or plan assets from experience different than assumed and from changes in assumptions. We recognize an amortization of the net gain or loss as a component of net pension cost for a year if, as of the beginning of the year, that net gain or loss exceeds ten percent of the greater of the benefit obligation or the market-related value of plan assets. If an amortization is required, it equals the amount of net gain or loss that exceeds the ten percent corridor, amortized over the average remaining life expectancy of plan participants.
As of
December 31, 2014
, the pension plans have net losses of
$502.7 million
and a projected benefit obligation of
$1,353.6 million
. The average remaining life expectancy of plan participants is approximately 25 years. For 2015, we expect to amortize approximately
$16.4 million
of the net loss. The comparable amortization amounts for 2014 and 2013 were
$12.8 million
and
$14.8 million
, respectively.
41
Multi-Employer Pension Plans
YRC Freight, New Penn, Holland and Reddaway contribute to
32
separate multi-employer pension plans for employees that our collective bargaining agreements cover (approximately
78%
of total YRC Worldwide employees). The pension plans provide defined benefits to retired participants.
We do not directly manage multi-employer plans. Trustees, half of whom the respective union appoints and half of whom various contributing employers appoint, manage the trusts covering these plans.
Our collective bargaining agreements with the unions determine the amount of our contributions to these plans. We recognize as net pension expense the contractually required contribution for the respective period and recognize as a liability any contributions due and unpaid.
In 2006, the Pension Protection Act became law and modified both the Internal Revenue Code (as amended, the “Code”) as it applies to multi-employer pension plans and the Employment Retirement Income Security Act of 1974 (as amended, “ERISA”). The Code and ERISA (in each case, as so modified) and related regulations establish minimum funding requirements for multi-employer pension plans. The funding status of these plans is determined by many factors, including the following factors:
|
•
|
the number of participating active and retired employees
|
|
•
|
the number of contributing employers
|
|
•
|
the amount of each employer’s contractual contribution requirements
|
|
•
|
the investment returns of the plans
|
|
•
|
plan administrative costs
|
|
•
|
the number of employees and retirees participating in the plan who no longer have a contributing employer
|
|
•
|
the discount rate used to determine the funding status
|
|
•
|
the actuarial attributes of plan participants (such as age, estimated life and number of years until retirement)
|
|
•
|
the benefits defined by the plan
|
If any of our multi-employer pension plans fail to:
|
•
|
meet minimum funding requirements
|
|
•
|
meet a required funding improvement or rehabilitation plan that the Pension Protection Act may require for certain of our underfunded plans
|
|
•
|
obtain from the IRS certain changes to or a waiver of the requirements in how the applicable plan calculates its funding levels or
|
|
•
|
reduce pension benefits to a level where the requirements are met,
|
we could be required to make additional contributions to our multi-employer pension plans.
If any of our multi-employer pension plans enters critical status and our contributions are not sufficient to satisfy any rehabilitation plan schedule, the Pension Protection Act could require us to make additional contributions to the multi-employer pension plan from five to ten percent of the contributions that our collective bargaining agreements requires until the agreement expires.
If we fail to make our required contributions to a multi-employer plan under a funding improvement or rehabilitation plan, it would expose us to penalties including potential withdrawal liability. If the benchmarks that an applicable funding improvement or rehabilitation plan provides are not met by the end of a prescribed period, the IRS could impose an excise tax on us and the plan’s other contributing employers. These excise taxes are not contributed to the deficient funds, but rather are deposited in the United States general treasury funds. The Company does not believe that the temporary cessation of certain of its contributions to applicable multi-employer pension funds from the third quarter of 2009 through May 2011 will give rise to these excise taxes as we believe these contributions were not required for that period.
Depending on the amount involved, a requirement to increase contributions beyond our contractually agreed rate or the imposition of an excise tax on us could have a material adverse impact on our business, financial condition, liquidity, and results of operations.
Funded Status of the Multi-Employer Pension Plans and Contingent Withdrawal Liabilities
The plan administrators and trustees of multi-employer pension plans do not routinely provide us with current information regarding the funded status of the plans. Much of our information regarding the funded status has been (i) obtained from public filings using
42
publicly available plan asset values, which are often dated, and (ii) based on the limited information available from plan administrators or trustees, which has not been independently validated.
The Pension Protection Act provides that certain plans with a funded percentage of less than 65%, or that fail other tests, will be deemed to be in critical status. Plans in critical status must create a rehabilitation plan to exit critical status within periods that the Pension Protection Act prescribes. We believe that based on information obtained from public filings and from plan administrators and trustees, many of the multi-employer pension plans in which we participate, including The Central States Southeast and Southwest Areas Pension Plan, Road Carriers Local 707 Pension Fund and Teamsters Local 641 Pension Fund, are in critical status. If the funding of the multi-employer pension plans does not reach certain goals (including those required not to enter endangered or critical status or those required by a plan’s funding improvement or rehabilitation plan), our pension expenses could further increase.
We believe that based on information obtained from public filings and from plan administrators and trustees, our portion of the contingent liability in the case of a full withdrawal or termination from all of the multi-employer pension plans would be an estimated $10 billion on a pre-tax basis. Our applicable subsidiaries have no current intention of taking any action that would subject us to payment of material withdrawal obligations.
Property and Equipment and Definite Life Intangibles
Impairment Testing
We review property and equipment and definite life intangibles for impairment whenever events or changes in circumstances indicate that the carrying amount of an asset may not be recoverable. We evaluate recoverability of assets to be held and used by comparing the carrying amount of an asset to future undiscounted net cash flows expected to be generated by the asset. If such assets are considered to be impaired, the impairment to be recognized is measured by the amount by which the carrying amount of the assets exceeds the fair value of the assets. Assets to be disposed of are reported at the lower of the carrying amount or fair value less costs to sell.
We believe that the accounting estimate related to asset impairment is a critical accounting estimate because: (1) it requires management to make assumptions about future revenues and expenses over the life of the asset, and (2) the impact that recognizing an impairment would have on our financial position, as well as our results of operations, could be material. Management’s assumptions about future revenues and expenses require significant judgment because actual revenues and expenses have fluctuated in the past and may continue to do so. In estimating future revenues and expenses, we use our internal business forecasts and recent performance. We develop our forecasts based on recent revenue and expense data for existing services and other industry and economic factors. To the extent that the Company is unable to achieve its forecast, it may incur significant impairment losses on property and equipment or intangible assets.
Depreciable Lives of Assets
We review the appropriateness of depreciable lives for each category of property and equipment. These studies utilize models, which take into account actual usage, physical wear and tear, and replacement history to calculate remaining life of our asset base. For revenue equipment, we consider the optimal life cycle usage of each type of equipment, including the ability to utilize the equipment in different parts of the fleet or at different operating units in the organization. Capital, engine replacement, refurbishment and maintenance costs are considered in determining total cost of ownership and related useful lives for purposes of depreciation recognition.
We also make assumptions regarding future conditions in determining potential salvage values. These assumptions impact the amount of depreciation expense recognized in the period and any gain or loss once the asset is disposed.
Tires
The cost of replacement tires are expensed at the time those tires are placed into service, as is the case with other repairs and maintenance costs. The cost of tires on newly-acquired revenue equipment is capitalized and depreciated over the estimated useful life of the related equipment.
43
Indefinite Life Intangibles
Intangible assets with indefinite lives, which consist of certain acquired tradenames, are not subject to amortization, but are subjected to an impairment test at least annually and as triggering events may occur. The impairment test for tradenames consists of a comparison of the fair value of the tradename with its carrying amount. An impairment loss is recognized for the amount by which the carrying amount exceeds the fair value of the asset. In making this assessment, we utilized the relief from royalty method, an income approach (a level 3 fair value measurement), which includes assumptions as to future revenue, applicable royalty rate and cost of capital, among others.
We believe that the accounting estimate related to indefinite life intangibles is a critical accounting estimate because (1) it requires our management to make assumptions about fair values, and (2) the impact of recognizing an impairment could be material to our financial position, as well as our results of operations. Management’s assumptions about fair values require considerable judgment because changes in broad economic factors and industry factors can result in variable and volatile fair values. Assumptions with respect to rates used to discount cash flows, a key input, are dependent upon interest rates and the cost of capital at a point in time.
Accounting for Income Taxes
We use the asset and liability method to reflect income taxes on our financial statements. We recognize deferred tax assets and liabilities by applying enacted tax rates to the differences between the carrying value of existing assets and liabilities and their respective tax basis and to loss carryforwards. Tax credit carryforwards are recorded as deferred tax assets. The effect on deferred tax assets and liabilities of a change in tax rates is recognized in income in the period that the change occurs. We assess the validity of deferred tax assets and loss and tax credit carryforwards and provide valuation allowances when we determine, based on the weight of evidence, it is more likely than not that such assets, losses, or credits will not be realized. Changes in valuation allowances are included in our tax provision or in equity if directly related to other comprehensive income (loss), unless affected by a specific intra-period allocation as happened in 2013 and described below. In determining whether a valuation allowance is warranted, we evaluate factors such as prior years’ earnings, loss carry-back and carry-forward periods, reversals of existing deferred tax liabilities and tax planning strategies that potentially enhance the likelihood of the realization of a deferred tax asset. We have not recognized deferred taxes relative to foreign subsidiaries’ earnings that are deemed to be permanently reinvested. Any related taxes associated with such earnings are not material.
YRC Worldwide Inc. applies the intraperiod tax allocation rules of ASC 740 to allocate income taxes among continuing operations, discontinued operations, extraordinary items, other comprehensive income (loss), and additional paid-in capital when it meets the criteria as prescribed in the rule.
While the tax effect of net income (loss) before income taxes generally should be computed without regard to the tax effects of net income (loss) before income taxes from the other categories referenced in the preceding paragraph, an exception applies when there is a loss before income taxes and income from those other categories. In that situation, the appropriate tax provision is allocated to the other categories of earnings and a related tax benefit is recorded in net income (loss). This exception to the general rule applies even when a valuation allowance is in place at the beginning and end of the year. While intraperiod tax allocation does not change the overall tax provision, it may result in a gross-up of the individual components, thereby changing the amount of tax provision included in each category. In 2013, the Company met the criteria necessary to apply the exception within the intraperiod tax allocation rules, since it incurred a net loss before income taxes and income was recognized in other comprehensive income (loss). As a result, the Company recorded a tax benefit of $41.7 million in income tax benefit (as reported on the Consolidated Statement of Operations) and an offsetting tax expense of $41.7 million in total other comprehensive income (loss) for the year ended December 31, 2013. The total income tax benefit did not change, and continues to be impacted by the full valuation allowance on our U.S. deferred tax assets.
44
We have exposure to a variety of market risks, including the effects of interest rates, foreign exchange rates and fuel prices.
Interest Rates
To provide adequate funding through seasonal business cycles and minimize overall borrowing costs, we utilize both fixed rate and variable rate financial instruments with varying maturities. At
December 31, 2014
, we had approximately 38% of our outstanding debt at fixed rates. A significant portion of the remaining variable rate debt operates at a 3-month LIBOR floor of 1.0% plus a fixed margin of 7.25%. If interest rates for our variable rate long-term debt had increased 100 basis points during the year, our interest expense would have increased, and income before taxes would have decreased by $1.8 million and $1.5 million for the years ended
December 31, 2014
and
2013
, respectively.
The table below provides information regarding the interest rates on our fixed-rate debt as of
December 31, 2014
.
|
(in millions)
|
2015
|
|
2016
|
|
2017
|
|
2018
|
|
2019
|
|
Thereafter
|
|
Total
|
|
|||||||
|
Fixed-rate debt
|
$
|
23.9
|
|
$
|
8.1
|
|
$
|
9.6
|
|
$
|
11.3
|
|
$
|
126.6
|
|
$
|
243.1
|
|
$
|
422.6
|
|
|
Interest rate
|
10.0 - 18.2%
|
|
10.0 - 18.2%
|
|
10.0 - 18.2%
|
|
5.0 - 18.2%
|
|
3.3 - 18.3%
|
|
10.0 - 16.8%
|
|
|||||||||
Foreign Exchange Rates
Revenue, operating expenses, assets and liabilities of our Canadian and Mexican subsidiaries and our Chinese joint venture are denominated in local currencies, thereby creating exposure to fluctuations in exchange rates. The risks related to foreign currency exchange rates are not significant to our consolidated financial position or results of operations.
Fuel Prices
YRC Freight and Regional Transportation currently have effective fuel surcharge programs in place. These programs are well established within the industry and customer acceptance of fuel surcharges remains high. Since the amount of fuel surcharge is based on average, national diesel fuel prices and is reset weekly, our exposure to fuel price volatility is significantly reduced. In general, under our present fuel surcharge program, we believe rising fuel prices are beneficial to us, and falling fuel prices are detrimental to us, in the short term, the effects of which are mitigated over time.
45
CONSOLIDATED BALANCE SHEETS
YRC Worldwide Inc. and Subsidiaries
|
(Dollars in millions except share and per share data)
|
December 31,
2014 |
December 31,
2013 |
|||||
|
Assets
|
|||||||
|
Current Assets:
|
|||||||
|
Cash and cash equivalents
|
$
|
171.1
|
|
$
|
176.3
|
|
|
|
Restricted amounts held in escrow
|
28.9
|
|
90.1
|
|
|||
|
Accounts receivable, less allowances of $10.0 and $9.3
|
470.5
|
|
460.9
|
|
|||
|
Fuel and operating supplies
|
14.2
|
|
17.0
|
|
|||
|
Prepaid expenses and other
|
67.0
|
|
53.6
|
|
|||
|
Total current assets
|
751.7
|
|
797.9
|
|
|||
|
Property and Equipment:
|
|||||||
|
Cost
|
2,819.6
|
|
2,844.2
|
|
|||
|
Less – accumulated depreciation
|
(1,825.4
|
)
|
(1,754.4
|
)
|
|||
|
Net property and equipment
|
994.2
|
|
1,089.8
|
|
|||
|
Intangibles, net
|
60.3
|
|
79.8
|
|
|||
|
Restricted amounts held in escrow
|
60.2
|
|
0.6
|
|
|||
|
Deferred income taxes, net
|
21.4
|
|
18.3
|
|
|||
|
Other assets
|
97.2
|
|
78.5
|
|
|||
|
Total Assets
|
$
|
1,985.0
|
|
$
|
2,064.9
|
|
|
|
Liabilities and Shareholders’ Deficit
|
|||||||
|
Current Liabilities:
|
|||||||
|
Accounts payable
|
$
|
172.2
|
|
$
|
176.7
|
|
|
|
Wages, vacations and employees’ benefits
|
176.6
|
|
191.2
|
|
|||
|
Deferred income taxes, net
|
21.4
|
|
18.6
|
|
|||
|
Claims and insurance accruals
|
129.3
|
|
121.0
|
|
|||
|
Other current and accrued liabilities
|
72.9
|
|
68.5
|
|
|||
|
Current maturities of long-term debt
|
31.1
|
|
8.6
|
|
|||
|
Total current liabilities
|
603.5
|
|
584.6
|
|
|||
|
Other Liabilities:
|
|||||||
|
Long-term debt, less current portion
|
1,078.8
|
|
1,354.8
|
|
|||
|
Deferred income taxes, net
|
1.5
|
|
1.8
|
|
|||
|
Pension and postretirement
|
460.3
|
|
384.8
|
|
|||
|
Claims and other liabilities
|
315.2
|
|
336.3
|
|
|||
|
Shareholders’ Deficit:
|
|||||||
|
Cumulative preferred stock, $1 par value per share - authorized 5,000,000 shares:
|
|||||||
|
Series A Preferred stock, shares issued 1, liquidation preference $1
|
—
|
|
—
|
|
|||
|
Common stock, $0.01 par value per share - authorized 95,000,000 and 33,333,333 shares, issued 30,667,000 and 10,173,000 shares
|
0.3
|
|
0.1
|
|
|||
|
Capital surplus
|
2,290.9
|
|
1,964.4
|
|
|||
|
Accumulated deficit
|
(2,240.0
|
)
|
(2,154.2
|
)
|
|||
|
Accumulated other comprehensive loss
|
(432.8
|
)
|
(315.0
|
)
|
|||
|
Treasury stock, at cost (410 shares)
|
(92.7
|
)
|
(92.7
|
)
|
|||
|
Total shareholders’ deficit
|
(474.3
|
)
|
(597.4
|
)
|
|||
|
Total Liabilities and Shareholders’ Deficit
|
$
|
1,985.0
|
|
$
|
2,064.9
|
|
|
The accompanying notes are an integral part of these statements.
46
STATEMENTS OF CONSOLIDATED OPERATIONS
YRC Worldwide Inc. and Subsidiaries
For the Years Ended December 31
|
(Dollars in millions except per share data, shares in thousands)
|
2014
|
2013
|
2012
|
||||||||
|
Operating Revenue
|
$
|
5,068.8
|
|
$
|
4,865.4
|
|
$
|
4,850.5
|
|
||
|
Operating Expenses:
|
|||||||||||
|
Salaries, wages and employees’ benefits
|
2,901.2
|
|
2,803.1
|
|
2,786.5
|
|
|||||
|
Operating expenses and supplies
|
1,110.7
|
|
1,116.9
|
|
1,128.9
|
|
|||||
|
Purchased transportation
|
590.9
|
|
512.5
|
|
488.8
|
|
|||||
|
Depreciation and amortization
|
163.6
|
|
172.3
|
|
183.8
|
|
|||||
|
Other operating expenses
|
268.8
|
|
234.4
|
|
248.1
|
|
|||||
|
Gains on property disposals, net
|
(11.9
|
)
|
(2.2
|
)
|
(9.7
|
)
|
|||||
|
Total operating expenses
|
5,023.3
|
|
4,837.0
|
|
4,826.4
|
|
|||||
|
Operating Income
|
45.5
|
|
28.4
|
|
24.1
|
|
|||||
|
Nonoperating Expenses:
|
|||||||||||
|
Interest expense
|
150.0
|
|
163.9
|
|
150.8
|
|
|||||
|
Equity investment impairment
|
—
|
|
—
|
|
30.8
|
|
|||||
|
Gain on extinguishment of debt
|
(11.2
|
)
|
—
|
|
—
|
|
|||||
|
Other, net
|
(9.5
|
)
|
(6.0
|
)
|
(6.0
|
)
|
|||||
|
Nonoperating expenses, net
|
129.3
|
|
157.9
|
|
175.6
|
|
|||||
|
Net Loss Before Income Taxes
|
(83.8
|
)
|
(129.5
|
)
|
(151.5
|
)
|
|||||
|
Income tax benefit
|
(16.1
|
)
|
(45.9
|
)
|
(15.0
|
)
|
|||||
|
Net Loss
|
(67.7
|
)
|
(83.6
|
)
|
(136.5
|
)
|
|||||
|
Less: Net Income Attributable to Noncontrolling Interest
|
—
|
|
—
|
|
3.9
|
|
|||||
|
Net Loss Attributable to YRC Worldwide Inc.
|
(67.7
|
)
|
(83.6
|
)
|
(140.4
|
)
|
|||||
|
Amortization of beneficial conversion feature on preferred stock
|
(18.1
|
)
|
—
|
|
—
|
|
|||||
|
Net Loss Attributable to Common Shareholders
|
$
|
(85.8
|
)
|
$
|
(83.6
|
)
|
$
|
(140.4
|
)
|
||
|
Average Common Shares Outstanding – Basic and Diluted
|
28,592
|
|
9,332
|
|
7,311
|
|
|||||
|
Basic and Diluted Loss Per Common Share:
|
$
|
(3.00
|
)
|
$
|
(8.96
|
)
|
$
|
(19.20
|
)
|
||
The accompanying notes are an integral part of these statements.
47
STATEMENTS OF CONSOLIDATED COMPREHENSIVE LOSS
YRC Worldwide Inc. and Subsidiaries
For the Years Ended December 31
|
(in millions)
|
2014
|
2013
|
2012
|
||||||||
|
Net loss
|
$
|
(67.7
|
)
|
$
|
(83.6
|
)
|
$
|
(136.5
|
)
|
||
|
Other comprehensive income (loss), net of tax:
|
|||||||||||
|
Pension:
|
|||||||||||
|
Net actuarial gains (losses) and other adjustments
|
(126.4
|
)
|
70.2
|
|
(169.1
|
)
|
|||||
|
Less amortization of prior losses
|
12.7
|
|
9.6
|
|
9.0
|
|
|||||
|
Changes in foreign currency translation adjustments
|
(4.1
|
)
|
(2.4
|
)
|
1.8
|
|
|||||
|
Other comprehensive income (loss)
|
(117.8
|
)
|
77.4
|
|
(158.3
|
)
|
|||||
|
Less comprehensive income attributable to non-controlling interest
|
—
|
|
—
|
|
3.9
|
|
|||||
|
Comprehensive loss attributable to YRC Worldwide Inc.
|
$
|
(185.5
|
)
|
$
|
(6.2
|
)
|
$
|
(298.7
|
)
|
||
The accompanying notes are an integral part of these statements.
48
STATEMENTS OF CONSOLIDATED CASH FLOWS
YRC Worldwide Inc. and Subsidiaries
For the Years Ended December 31
|
(in millions)
|
2014
|
2013
|
2012
|
||||||||
|
Operating Activities:
|
|||||||||||
|
Net loss
|
$
|
(67.7
|
)
|
$
|
(83.6
|
)
|
$
|
(136.5
|
)
|
||
|
Noncash items included in net loss:
|
|||||||||||
|
Depreciation and amortization
|
163.6
|
|
172.3
|
|
183.8
|
|
|||||
|
Paid-in-kind interest on Series A Notes and Series B Notes
|
14.3
|
|
29.9
|
|
29.2
|
|
|||||
|
Amortization of deferred debt costs
|
8.5
|
|
7.9
|
|
5.6
|
|
|||||
|
Amortizations of premiums and discounts on debt
|
27.5
|
|
7.7
|
|
(1.6
|
)
|
|||||
|
Equity based compensation expense
|
14.0
|
|
5.8
|
|
3.8
|
|
|||||
|
Deferred income tax expense (benefit)
|
(0.2
|
)
|
(42.4
|
)
|
3.8
|
|
|||||
|
Equity investment impairment
|
—
|
|
—
|
|
30.8
|
|
|||||
|
Gains on property disposals, net
|
(11.9
|
)
|
(2.2
|
)
|
(9.7
|
)
|
|||||
|
Gain on extinguishment of debt
|
(11.2
|
)
|
—
|
|
—
|
|
|||||
|
Other noncash items
|
(5.9
|
)
|
(3.6
|
)
|
(1.7
|
)
|
|||||
|
Changes in assets and liabilities, net:
|
|||||||||||
|
Accounts receivable
|
(11.1
|
)
|
(4.6
|
)
|
13.5
|
|
|||||
|
Accounts payable
|
(5.7
|
)
|
13.3
|
|
13.5
|
|
|||||
|
Other operating assets
|
0.3
|
|
3.9
|
|
3.6
|
|
|||||
|
Other operating liabilities
|
(86.0
|
)
|
(92.3
|
)
|
(164.0
|
)
|
|||||
|
Net cash provided by (used in) operating activities
|
28.5
|
|
12.1
|
|
(25.9
|
)
|
|||||
|
Investing Activities:
|
|||||||||||
|
Acquisition of property and equipment
|
(69.2
|
)
|
(66.9
|
)
|
(66.4
|
)
|
|||||
|
Proceeds from disposal of property and equipment
|
20.8
|
|
9.8
|
|
50.4
|
|
|||||
|
Restricted escrow receipts
|
90.7
|
|
31.8
|
|
33.4
|
|
|||||
|
Restricted escrow deposits
|
(89.1
|
)
|
—
|
|
—
|
|
|||||
|
Other, net
|
5.2
|
|
1.8
|
|
2.4
|
|
|||||
|
Net cash provided by (used in) investing activities
|
(41.6
|
)
|
(23.5
|
)
|
19.8
|
|
|||||
|
Financing Activities:
|
|||||||||||
|
Issuance of long-term debt
|
696.8
|
|
0.3
|
|
45.0
|
|
|||||
|
Repayment of long-term debt
|
(892.7
|
)
|
(9.2
|
)
|
(25.6
|
)
|
|||||
|
Debt issuance costs
|
(29.1
|
)
|
(12.1
|
)
|
(5.1
|
)
|
|||||
|
Equity issuance costs
|
(17.1
|
)
|
—
|
|
—
|
|
|||||
|
Equity issuance proceeds
|
250.0
|
|
—
|
|
—
|
|
|||||
|
Net cash provided by (used in) financing activities
|
7.9
|
|
(21.0
|
)
|
14.3
|
|
|||||
|
Net (Decrease) Increase In Cash and Cash Equivalents
|
(5.2
|
)
|
(32.4
|
)
|
8.2
|
|
|||||
|
Cash and Cash Equivalents, Beginning of Year
|
176.3
|
|
208.7
|
|
200.5
|
|
|||||
|
Cash and Cash Equivalents, End of Year
|
$
|
171.1
|
|
$
|
176.3
|
|
$
|
208.7
|
|
||
The accompanying notes are an integral part of these statements.
49
STATEMENTS OF CONSOLIDATED CASH FLOWS (CONTINUED)
YRC Worldwide Inc. and Subsidiaries
For the Years Ended December 31
|
(in millions)
|
2014
|
|
2013
|
|
2012
|
||||||
|
Supplemental Cash Flow Information
:
|
|||||||||||
|
Interest paid
|
$
|
(129.1
|
)
|
$
|
(120.5
|
)
|
$
|
(120.5
|
)
|
||
|
Letter of credit fees paid
|
(8.7
|
)
|
(34.1
|
)
|
(38.0
|
)
|
|||||
|
Income tax refund, net
|
16.1
|
|
8.8
|
|
5.9
|
|
|||||
|
Capital lease financing transactions
|
3.8
|
|
1.2
|
|
1.8
|
|
|||||
|
Debt redeemed for equity consideration
|
51.8
|
|
35.3
|
|
20.3
|
|
|||||
The accompanying notes are an integral part of these statements.
50
STATEMENTS OF CONSOLIDATED SHAREHOLDERS’ DEFICIT
YRC Worldwide Inc. and Subsidiaries
For the Years Ended December 31
|
(in millions)
|
2014
|
2013
|
2012
|
||||||||
|
Preferred Stock:
|
|||||||||||
|
Beginning balance
|
$
|
—
|
|
$
|
—
|
|
$
|
—
|
|
||
|
Issuance of equity in exchange for debt
|
0.6
|
|
—
|
|
—
|
|
|||||
|
Conversion of preferred shares to common shares
|
(0.6
|
)
|
—
|
|
—
|
|
|||||
|
Ending balance
|
$
|
—
|
|
$
|
—
|
|
$
|
—
|
|
||
|
Common Stock:
|
|||||||||||
|
Beginning balance
|
$
|
0.1
|
|
$
|
0.1
|
|
$
|
0.1
|
|
||
|
Issuance of common stock
|
0.1
|
|
—
|
|
—
|
|
|||||
|
Issuance of common stock upon conversion of Series B Notes
|
0.1
|
|
—
|
|
—
|
|
|||||
|
Ending balance
|
$
|
0.3
|
|
$
|
0.1
|
|
$
|
0.1
|
|
||
|
Capital Surplus:
|
|||||||||||
|
Beginning balance
|
$
|
1,964.4
|
|
$
|
1,926.5
|
|
$
|
1,903.0
|
|
||
|
Issuance of equity, net
|
249.3
|
|
—
|
|
—
|
|
|||||
|
Conversion of preferred stock to common stock
|
0.6
|
|
—
|
|
—
|
|
|||||
|
Beneficial conversion feature on preferred stock
|
18.1
|
|
—
|
|
—
|
|
|||||
|
Issuance of equity upon conversion of Series B Notes
|
64.7
|
|
35.3
|
|
20.3
|
|
|||||
|
Equity issuance costs
|
(17.1
|
)
|
—
|
|
—
|
|
|||||
|
Share-based compensation
|
10.9
|
|
2.6
|
|
3.2
|
|
|||||
|
Ending balance
|
$
|
2,290.9
|
|
$
|
1,964.4
|
|
$
|
1,926.5
|
|
||
|
Accumulated Deficit:
|
|||||||||||
|
Beginning balance
|
$
|
(2,154.2
|
)
|
$
|
(2,070.6
|
)
|
$
|
(1,930.2
|
)
|
||
|
Amortization of conversion feature on preferred stock
|
(18.1
|
)
|
—
|
|
—
|
|
|||||
|
Net loss attributable to YRC Worldwide Inc.
|
(67.7
|
)
|
(83.6
|
)
|
(140.4
|
)
|
|||||
|
Ending balance
|
$
|
(2,240.0
|
)
|
$
|
(2,154.2
|
)
|
$
|
(2,070.6
|
)
|
||
|
Accumulated Other Comprehensive Loss:
|
|||||||||||
|
Beginning balance
|
$
|
(315.0
|
)
|
$
|
(392.4
|
)
|
$
|
(234.1
|
)
|
||
|
Pension, net of tax:
|
|||||||||||
|
Net actuarial gains (losses) and other adjustments
|
(126.4
|
)
|
70.2
|
|
(169.1
|
)
|
|||||
|
Amortization of prior net losses
|
12.7
|
|
9.6
|
|
9.0
|
|
|||||
|
Foreign currency translation adjustments
|
(4.1
|
)
|
(2.4
|
)
|
1.8
|
|
|||||
|
Ending balance
|
$
|
(432.8
|
)
|
$
|
(315.0
|
)
|
$
|
(392.4
|
)
|
||
|
Treasury Stock, At Cost:
|
|||||||||||
|
Beginning and ending balance
|
$
|
(92.7
|
)
|
$
|
(92.7
|
)
|
$
|
(92.7
|
)
|
||
|
Noncontrolling Interest:
|
|||||||||||
|
Beginning balance
|
$
|
—
|
|
$
|
—
|
|
$
|
(4.6
|
)
|
||
|
Net income attributable to the noncontrolling interest
|
—
|
|
—
|
|
3.9
|
|
|||||
|
Other
|
—
|
|
—
|
|
0.7
|
|
|||||
|
Ending Balance
|
$
|
—
|
|
$
|
—
|
|
$
|
—
|
|
||
|
Total Shareholders’ Deficit
|
$
|
(474.3
|
)
|
$
|
(597.4
|
)
|
$
|
(629.1
|
)
|
||
The accompanying notes are an integral part of these statements.
51
NOTES TO CONSOLIDATED FINANCIAL STATEMENTS
YRC Worldwide Inc. and Subsidiaries
1. Description of Business
YRC Worldwide Inc. (also referred to as “YRC Worldwide,” the “Company,” “we,” “us” or “our”), one of the largest transportation service providers in the world, is a holding company that through wholly owned operating subsidiaries and its interest in a Chinese joint venture offers its customers a wide range of transportation services. YRC Worldwide has one of the largest, most comprehensive less-than-truckload (“LTL”) networks in North America with local, regional, national and international capabilities. Through its team of experienced service professionals, YRC Worldwide offers flexible supply chain solutions, ensuring customers can ship industrial, commercial and retail goods with confidence. Our reporting segments include the following:
|
•
|
YRC Freight is the reporting segment for our transportation service providers focused on business opportunities in national, regional and international markets. YRC Freight provides for the movement of industrial, commercial and retail goods, primarily through centralized management and customer facing organizations. This unit includes our subsidiary YRC Inc. (“YRC Freight”) and Reimer Express (“YRC Reimer”), a subsidiary located in Canada that specializes in shipments into, across and out of Canada. In addition to the United States and Canada, YRC Freight also serves parts of Mexico, Puerto Rico and Guam.
|
|
•
|
Regional Transportation is the reporting segment for our transportation service providers focused on business opportunities in the regional and next-day delivery markets. Regional Transportation is comprised of USF Holland Inc. (“Holland”), New Penn Motor Express, Inc. (“New Penn”) and USF Reddaway Inc. (“Reddaway”). These companies each provide regional, next-day ground services in their respective regions through a network of facilities located across the United States, Canada, Mexico and Puerto Rico.
|
2. Principles of Consolidation
The accompanying consolidated financial statements include the accounts of YRC Worldwide and its majority owned subsidiaries. All significant intercompany accounts and transactions have been eliminated in consolidation. We report on a calendar year basis. The quarters of the Regional Transportation companies (with the exception of New Penn) consist of thirteen weeks that end on a Saturday either before or after the end of March, June and September, whereas all other operating segment quarters end on the natural calendar quarter end. Our investment in the non-majority owned affiliate in which we do not have control where the entity is either not a variable interest entity or YRC Worldwide is not the primary beneficiary is accounted for on the equity method. Management makes estimates and assumptions that affect the amounts reported in the consolidated financial statements and notes. Actual results could differ from those estimates.
Accounting policies refer to specific accounting principles and the methods of applying those principles to fairly present our financial position and results of operations in accordance with generally accepted accounting principles. The policies discussed below include those that management has determined to be the most appropriate in preparing our financial statements.
Cash and Cash Equivalents
Cash and cash equivalents include demand deposits and highly liquid investments purchased with maturities of three months or less. Under the Company’s cash management system, checks issued but not presented to banks frequently result in book overdraft balances for accounting purposes which are classified within accounts payable in the accompanying consolidated balance sheets. The change in book overdrafts are reported as a component of operating cash flows for accounts payable as they do not represent bank overdrafts.
Concentration of Credit Risks and Other
We sell services and extend credit based on an evaluation of the customer’s financial condition, without requiring collateral. Exposure to losses on receivables is principally dependent on each customer’s financial condition. We monitor our exposure for credit losses and maintain allowances for anticipated losses.
At
December 31, 2014
, approximately
78%
of our labor force is subject to collective bargaining agreements. As part of the 2014 Financing Transactions (which is described more fully in the “2014 Financing Transaction” footnote to our consolidated financial statements), the primary labor agreement was modified to, among other things, extend the expiration date of our previous agreement from March 31, 2015 to March 31, 2019. This extension also extended the contribution rates under our multi-employer pension
52
plan. The modification provided for lump sum payments in lieu of wage increases in 2014 and 2015, but provided for wage increases in 2016 through 2019. We started amortizing these lump sum payments over the period in which the wages will not be increased beginning on April 1, 2014. Finally, the modification provided for certain changes to work rules and our use of purchased transportation in certain situations.
Revenue Recognition
For shipments in transit, we record revenue based on the percentage of service completed as of the period end and accrue delivery costs as incurred. The percentage of service completed for each shipment is based on how far along in the shipment cycle each shipment is in relation to standard transit days. Standard transit days are defined as our published service days between origin zip code and destination zip code. Based on historical cost and engineering studies, certain percentages of revenue are determined to be earned during each stage of the shipment cycle, such as initial pick up, long distance transportation, intermediate transfer and customer delivery. Using standard transit times, we analyze each shipment in transit at a particular period end to determine what stage the shipment is in. We apply that stage’s percentage of revenue earned factor to the rated revenue for that shipment to determine the revenue dollars earned by that shipment in the current period. The total revenue earned is accumulated for all shipments in transit at a particular period end and recorded as operating revenue.
In addition, we recognize revenue on a gross basis because we are the primary obligors even when we use other transportation service providers who act on our behalf. We remain responsible to our customers for complete and proper shipment, including the risk of physical loss or damage of the goods and cargo claims issues. We assign pricing to bills of lading at the time of shipment based primarily on the weight, general classification of the product, the shipping destination and individual customer discounts. This process is referred to as rating. At various points throughout our process, incorrect ratings could be identified based on many factors, including weight verifications or updated customer discounts. Although the majority of rerating occurs in the same month as the original rating, a portion occurs during the following periods. We accrue a reserve for rerating based primarily on historical trends.
At December 31, 2014 and 2013
, our financial statements included a rerate reserve as a reduction to “Accounts Receivable” of
$12.2
million and
$9.6
million, respectively.
Uncollectible Accounts
We record an allowance for doubtful accounts primarily based on historical uncollectible amounts. We also take into account known factors surrounding specific customers and overall collection trends. Our process involves performing ongoing credit evaluations of customers, including the market in which they operate and the overall economic conditions. We continually review historical trends and customer specific factors and make adjustments to the allowance for doubtful accounts as appropriate. Our allowance for doubtful accounts totaled
$10.0 million
and
$9.3 million
as of
December 31, 2014
and
2013
, respectively.
Foreign Currency
Our functional currency is the U.S. dollar, whereas, our foreign operations utilize the local currency as their functional currency. Accordingly, for purposes of translating foreign subsidiary financial statements to the U.S. dollar reporting currency, assets and liabilities of our foreign operations are translated at the fiscal year end exchange rates and income and expenses are translated monthly, at the average exchange rates for each respective month, with changes recognized in other comprehensive loss. Foreign currency gains and losses resulting from foreign currency transactions resulted in net gains of
$5.7
million,
$3.7
million and
$2.0
million during
2014
,
2013
and
2012
, respectively, and are included in “Other nonoperating (income) expense” in the accompanying statements of consolidated operations.
Claims and Insurance Accruals
Claims and insurance accruals, both current and long-term, reflect the estimated settlement cost of claims for workers’ compensation, cargo loss and damage, and property damage and liability that insurance does not cover. We establish and modify reserve estimates for workers’ compensation and property damage and liability claims primarily upon actuarial analyses prepared by independent actuaries. These reserves are discounted to present value using a risk-free rate based on the year of occurrence. The risk-free rate is the U.S. Treasury rate for maturities that match the expected payout of such claims and was
0.9%
,
0.5%
and
0.4%
for workers’ compensation claims incurred as of
December 31, 2014
,
2013
and
2012
, respectively. The rate was
0.4%
,
0.3%
and
0.3%
for property damage and liability claims incurred as of
December 31, 2014
,
2013
and
2012
, respectively. The process of determining reserve requirements utilizes historical trends and involves an evaluation of accident frequency and severity, claims management, changes in health care costs and certain future administrative costs. The effect of future inflation for costs is considered in the actuarial analysis. Adjustments to previously established reserves are included in operating results in the year of adjustment.
As of December 31, 2014 and 2013
, we had
$406.6
million and
$400.4
million, respectively, accrued for claims and insurance.
53
Expected aggregate undiscounted amounts and material changes to these amounts as of
December 31
are presented below:
|
(in millions)
|
Workers’
Compensation
|
Property Damage and Liability Claims
|
Total
|
||||||
|
Undiscounted amount at December 31, 2012
|
$
|
390.1
|
|
$
|
65.1
|
|
$
|
455.2
|
|
|
Estimated settlement cost for 2013 claims
|
89.2
|
|
36.7
|
|
125.9
|
|
|||
|
Claim payments, net of recoveries
|
(115.6
|
)
|
(24.3
|
)
|
(139.9
|
)
|
|||
|
Change in estimated settlement cost for older claim years
|
(16.7
|
)
|
(8.7
|
)
|
(25.4
|
)
|
|||
|
Undiscounted amount at December 31, 2013
|
$
|
347.0
|
|
$
|
68.8
|
|
$
|
415.8
|
|
|
Estimated settlement cost for 2014 claims
|
94.3
|
|
39.0
|
|
133.3
|
|
|||
|
Claim payments, net of recoveries
|
(114.5
|
)
|
(40.8
|
)
|
(155.3
|
)
|
|||
|
Change in estimated settlement cost for older claim years
|
12.3
|
|
8.0
|
|
20.3
|
|
|||
|
Undiscounted settlement cost estimate at December 31, 2014
|
$
|
339.1
|
|
$
|
75.0
|
|
$
|
414.1
|
|
|
Discounted settlement cost estimate at December 31, 2014
|
$
|
311.3
|
|
$
|
74.5
|
|
$
|
385.8
|
|
In addition to the amounts above, settlement cost amounts for cargo claims and other insurance related amounts, none of which are discounted, totaled
$20.8
million and
$15.6
million
at December 31, 2014 and 2013
, respectively.
Estimated cash payments to settle claims which were incurred on or before
December 31, 2014
, for the next five years and thereafter are as follows:
|
(in millions)
|
Workers’
Compensation
|
Property Damage and Liability Claims
|
Total
|
||||||
|
2015
|
$
|
84.7
|
|
$
|
30.2
|
|
$
|
114.9
|
|
|
2016
|
57.7
|
|
18.7
|
|
76.4
|
|
|||
|
2017
|
40.0
|
|
13.2
|
|
53.2
|
|
|||
|
2018
|
28.6
|
|
6.5
|
|
35.1
|
|
|||
|
2019
|
21.8
|
|
3.5
|
|
25.3
|
|
|||
|
Thereafter
|
106.3
|
|
2.9
|
|
109.2
|
|
|||
|
Total
|
$
|
339.1
|
|
$
|
75.0
|
|
$
|
414.1
|
|
Stock Compensation Plans
We have various stock-based employee compensation plans, which are described more fully in the “Stock Compensation Plans” footnote to our consolidated financial statements. We recognize compensation costs for non-vested shares and compensation cost for all share-based payments (
i.e.,
options) based on the grant date fair value. Additionally, we recognize compensation cost for all share-based payments granted on a straight-line basis over the requisite service period (generally three to four years) based on the grant-date fair value.
Property and Equipment
The following is a summary of the components of our property and equipment at cost as of
December 31
:
|
(in millions)
|
2014
|
2013
|
|||||
|
Land
|
$
|
257.5
|
|
$
|
267.8
|
|
|
|
Structures
|
784.3
|
|
810.4
|
|
|||
|
Revenue equipment
|
1,431.9
|
|
1,438.3
|
|
|||
|
Technology equipment and software
|
148.2
|
|
133.9
|
|
|||
|
Other
|
197.7
|
|
193.8
|
|
|||
|
Total cost
|
$
|
2,819.6
|
|
$
|
2,844.2
|
|
|
54
We carry property and equipment at cost less accumulated depreciation. We compute depreciation using the straight-line method based on the following service lives:
|
Years
|
|
|
Structures
|
10 - 30
|
|
Revenue equipment
|
10 - 20
|
|
Technology equipment and software
|
3 - 7
|
|
Other
|
3 - 10
|
We charge maintenance and repairs to expense as incurred and betterments are capitalized. Leasehold improvements are capitalized and amortized over the shorter of their useful lives or the remaining lease term.
Our investment in technology equipment and software consists primarily of customer service and freight management equipment and related software.
For the
years ended December 31, 2014, 2013 and 2012
, depreciation expense was
$145.1
million,
$153.8
million and
$165.2
million, respectively.
The cost of replacement tires are expensed at the time those tires are placed into service, as is the case with other repair and maintenance costs. The cost of tires on newly acquired revenue equipment is capitalized and depreciated over the estimated useful life of the related equipment.
Impairment of Long-Lived Assets
If facts and circumstances indicate that the carrying amount of held-and-used identifiable amortizable intangibles and property, plant and equipment may be impaired, we perform an evaluation of recoverability in accordance with FASB ASC Topic 360. Our evaluation compares the estimated future undiscounted cash flows associated with the asset or asset group to its carrying amount to determine if a reduction to the carrying amount is required. The carrying amount of an impaired asset would be reduced to fair value if the estimated undiscounted cash flows are insufficient to recover the carrying value of the asset group. We performed impairment reviews for held-and-used long-lived assets during the
years ended December 31, 2014, 2013 and 2012
in connection with an update of our internal business forecasts that considered current economic conditions and results of operations.
Impairment of Equity Method Investments
During the year ended December 31, 2012, we determined that the estimated fair value of JHJ International Transportation Company, Ltd (“JHJ”), a
50%
owned equity investment, did not exceed its carrying amount and resulted in an impairment charge of
$30.8 million
. This determination was based upon market information we obtained in the fourth quarter of 2012 (a Level 3 fair value measurement). This impairment charge was recorded in equity investment impairment in the accompanying statements of consolidated operations and in the “Corporate and Other” segment.
Assets Held for Sale
When we plan to dispose of property or equipment by sale, the asset is carried in the financial statements at the lower of the carrying amount or estimated fair value, less cost to sell, and is reclassified to assets held for sale. Additionally, after such reclassification, there is no further depreciation taken on the asset. For an asset to be classified as held for sale, management must approve and commit to a formal plan, the sale should be anticipated during the ensuing year and the asset must be actively marketed, be available for immediate sale, and meet certain other specified criteria. We use level 3 inputs to determine the fair value of each property that is considered as held for sale.
At
December 31, 2014
and
December 31, 2013
, the net book value of assets held for sale was approximately
$15.3 million
and
$17.2 million
, respectively. This amount is included in “Property and Equipment” in the accompanying consolidated balance sheets. We recorded charges of
$6.2 million
,
$3.9 million
and
$13.2 million
for the
years ended December 31, 2014, 2013 and 2012
, respectively, to reduce properties held for sale to estimated fair value, less cost to sell. These charges are included in “Gains on property disposals, net” in the accompanying statements of consolidated operations.
Earnings from Equity Method Investments
55
We account for the ownership of our joint venture under the equity method and accordingly, recognize our share of the respective joint ventures earnings in “Other nonoperating (income) expense” in the accompanying statements of operations.
The following reflects the components of these results for the years ended
December 31
:
|
(in millions)
|
2014
|
2013
|
2012
|
||||||
|
Our share of joint venture earnings
|
$
|
(2.1
|
)
|
$
|
(2.1
|
)
|
$
|
(1.9
|
)
|
|
Impairment charge
|
—
|
|
—
|
|
30.8
|
|
|||
|
Net equity method (earnings) losses
|
$
|
(2.1
|
)
|
$
|
(2.1
|
)
|
$
|
28.9
|
|
Fair Value of Financial Instruments
We determined fair value measurements used in our consolidated financial statements based upon the price that would be received to sell an asset or paid to transfer a liability in an orderly transaction between market participants at the measurement date. The fair value hierarchy distinguishes between (1) market participant assumptions developed based on market data obtained from independent sources (observable inputs) and (2) an entity’s own assumptions about market participant assumptions developed based on the best information available in circumstances (unobservable inputs). The fair value hierarchy consists of three broad levels, which gives the highest priority to unadjusted quoted prices in active markets for identical assets or liabilities (Level 1) and the lowest priority to unobservable inputs (Level 3). The three levels of the fair value hierarchy are described below:
|
•
|
Level 1:
Valuations based on quoted prices in active markets for identical assets or liabilities that the entity has the ability to access.
|
|
•
|
Level 2:
Valuations based on quoted prices for similar assets or liabilities, quoted prices in markets that are not active, or other inputs that are observable or can be corroborated by observable data for substantially the full term of the assets or liabilities.
|
|
•
|
Level 3:
Valuations based on inputs that are supported by little or no market activity and that are significant to the fair value of the assets or liabilities.
|
The asset’s or liability’s fair value measurement level with the fair value hierarchy is based on the lowest level of any input that is significant to the fair value measurement. Valuation techniques used maximize the use of observable inputs and minimize the use of unobservable inputs.
The valuation methodologies described above may produce a fair value calculation that may not be indicative of net realizable value or reflective of future fair values. We believe that our valuation methods are appropriate and consistent with other market participants. The use of different methodologies or assumptions to determine the fair value of certain financial assets could result in a different fair value measurement at the reporting date. There have been no changes in the methodologies used
at December 31, 2014 and 2013
.
The following tables summarize the fair value hierarchy of our financial assets held at fair value on a recurring basis, which consists of our restricted cash held in escrow:
|
|
|
Fair Value Measurement at December 31, 2014
|
|||||||||||||
|
(in millions)
|
Total Carrying
Value
|
Quoted prices
in active market
(Level 1)
|
Significant
other
observable
inputs (Level 2)
|
Significant
unobservable
inputs
(Level 3)
|
|||||||||||
|
Restricted amounts held in escrow-current
|
$
|
28.9
|
|
$
|
28.9
|
|
$
|
—
|
|
$
|
—
|
|
|||
|
Restricted amounts held in escrow-long term
|
60.2
|
|
60.2
|
|
—
|
|
—
|
|
|||||||
|
Total assets at fair value
|
$
|
89.1
|
|
$
|
89.1
|
|
$
|
—
|
|
$
|
—
|
|
|||
56
|
|
|
Fair Value Measurement at December 31, 2013
|
|||||||||||||
|
(in millions)
|
Total Carrying
Value
|
Quoted prices
in active market
(Level 1)
|
Significant
other
observable
inputs (Level 2)
|
Significant
unobservable
inputs
(Level 3)
|
|||||||||||
|
Restricted amounts held in escrow-current
|
$
|
90.1
|
|
$
|
90.1
|
|
$
|
—
|
|
$
|
—
|
|
|||
|
Restricted amounts held in escrow-long term
|
0.6
|
|
0.6
|
|
—
|
|
—
|
|
|||||||
|
Total assets at fair value
|
$
|
90.7
|
|
$
|
90.7
|
|
$
|
—
|
|
$
|
—
|
|
|||
Restricted amounts held in escrow are invested in money market accounts and are recorded at fair value on quoted market prices. The carrying value of cash and cash equivalents, accounts receivable and accounts payable approximates their fair value due to the short-term nature of these instruments.
Reclassifications Out of Accumulated Other Comprehensive Loss
For the
years ended December 31, 2014 and 2013
, we reclassified the amortization of our net pension gain (loss) totaling
$12.7 million
and
$9.6 million
, respectively, from accumulated other comprehensive loss to net loss. This reclassification is a component of net periodic pension cost and is discussed in the “Employee Benefits” footnote.
Impact of Recently Issued Accounting Standards
In May 2014, the Financial Accounting Standards Board (“FASB”) issued new authoritative literature,
Revenue from Contracts with Customers
. The issuance is part of a joint effort by the FASB and the International Accounting Standards Board (“IASB”) to enhance financial reporting by creating common revenue recognition guidance for U.S. GAAP and, thereby, improving the consistency of requirements, comparability of practices and usefulness of disclosures. The new standard will supersede much of the existing authoritative literature for revenue recognition. The standard and related amendments will be effective for the Company for its annual reporting period ending December 31, 2017, including interim periods within that reporting period. Early application is not permitted. Entities are allowed to transition to the new standard by either recasting prior periods or recognizing the cumulative effect. While we do not believe the newly-issued guidance will have a significant impact on our Consolidated Financial Statements, the Company is currently evaluating the newly-issued guidance, including which transition approach will be applied.
In August 2014, the FASB issued new authoritative literature,
Presentation of Financial Statements - Going Concern (Subtopic 205-40): Disclosure of Uncertainties about an Entity’s Ability to Continue as a Going Concern
. The new standard provides guidance around management’s responsibility to evaluate whether there is substantial doubt about an entity’s ability to continue as a going concern and to provide related footnote disclosures. The new standard is effective for our fiscal year December 31, 2016 and interim periods thereafter. Early adoption is permitted. The Company is currently evaluating the newly-issued guidance, but does not believe it will have a material impact on its financial statements.
3. Investment
Shanghai Jiayu Logistics Co., Ltd.
On August 19, 2008, we completed the purchase of a
65%
equity interest in Shanghai Jiayu Logistics Co., Ltd. (“Jiayu”), a Shanghai, China ground transportation company with a purchase price of
$59.4 million
. Through March 31, 2010, we accounted for our
65%
ownership interest in Jiayu as an equity method investment as the rights of the minority shareholder were considered extensive and allowed for his ability to veto many business decisions. These rights were primarily provided as a part of the General Manager role held by the minority shareholder. Effective April, 1, 2010, the minority shareholder no longer had a role in managing the operations of the business which changed the conclusions from an accounting perspective regarding the relationship of this joint venture and required that we consolidate Jiayu in our financial statements effective April 1, 2010. The results of operations for Jiayu were included in our ‘Corporate and other’ reporting segment from April 1, 2010 to February 29, 2012. In an effort to focus on our core operations, we entered into an agreement in March 2012 to sell our
65%
equity interest in Jiayu to the minority shareholder. The transaction closed during the fourth quarter of 2012. At the time the agreement was entered into, management control was passed to the minority shareholder and, as a result, we deconsolidated our interest in Jiayu during March 2012 and returned to accounting for our ownership interest as an equity method investment. Based on the March 2012 agreement, we recorded our equity method investment at its estimated fair value of
$0
and wrote off a
$12.0 million
note receivable from Jiayu. After consideration of the non-controlling interest and other factors, we recognized a loss of
$4.2 million
upon the deconsolidation of our investment during 2012. Additionally, the noncontrolling interest was allocated a
$4.2 million
gain on this transaction.
57
4. Intangibles
Definite Life Intangibles
The components of amortizable intangible assets are as follows at
December 31
:
|
2014
|
2013
|
|||||||||||||
|
Weighted
|
Gross
|
Gross
|
||||||||||||
|
Average
|
Carrying
|
Accumulated
|
Carrying
|
Accumulated
|
||||||||||
|
(in millions)
|
Life (years)
|
Amount
|
Amortization
|
Amount
|
Amortization
|
|||||||||
|
Customer related
|
12
|
$
|
197.6
|
|
$
|
(165.7
|
)
|
$
|
197.9
|
|
$
|
(147.4
|
)
|
|
Amortization expense for intangible assets recognized on a straight line basis was
$18.3 million
,
$18.5 million
and
$18.6 million
for the
years ended December 31, 2014, 2013 and 2012
, respectively. Estimated amortization expense for the next five years is as follows:
|
(in millions)
|
2015
|
2016
|
2017
|
2018
|
2019
|
||||||||||
|
Estimated amortization expense
|
$
|
18.3
|
|
$
|
13.6
|
|
$
|
—
|
|
$
|
—
|
|
$
|
—
|
|
Indefinite Life Intangibles
The following table shows the changes in the carrying amount of our indefinite lived tradenames attributable to each applicable segment:
|
(in millions)
|
YRC Freight
|
Regional Transportation
|
Total
|
||||||
|
Balances at December 31, 2011
|
$
|
11.2
|
|
$
|
18.7
|
|
$
|
29.9
|
|
|
Change in foreign currency exchange rates
|
0.2
|
|
—
|
|
0.2
|
|
|||
|
Balances at December 31, 2012
|
11.4
|
|
18.7
|
|
30.1
|
|
|||
|
Change in foreign currency exchange rates
|
(0.8
|
)
|
—
|
|
(0.8
|
)
|
|||
|
Balances at December 31, 2013
|
10.6
|
|
18.7
|
|
29.3
|
|
|||
|
Change in foreign currency exchange rates
|
(0.8
|
)
|
—
|
|
(0.8
|
)
|
|||
|
Balances at December 31, 2014
|
$
|
9.8
|
|
$
|
18.7
|
|
$
|
28.5
|
|
Intangible assets with indefinite lives, which consist of our tradenames, are not subject to amortization, but are subjected to an impairment test at least annually and as triggering events may occur. The impairment test for tradenames consists of a comparison of the fair value of the tradename with its carrying amount. An impairment loss is recognized for the amount by which the carrying amount exceeds the fair value of the asset. In making this assessment, we utilized the relief from royalty method, an income approach (a level 3 fair value measurement), which includes assumptions as to future revenue, applicable royalty rate and cost of capital, among others.
5. Other Assets
The primary components of other assets at
December 31
are as follows:
|
(in millions)
|
2014
|
2013
|
||||||
|
Equity method investment for JHJ International Transportation Co., Ltd.
|
$
|
23.2
|
|
$
|
23.4
|
|
||
|
Deferred debt costs
|
26.5
|
|
18.5
|
|
||||
|
Other
|
47.5
|
|
36.6
|
|
||||
|
Total
|
$
|
97.2
|
|
$
|
78.5
|
|
||
58
During the
years ended December 31, 2014 and 2013
, we received dividends in the amount of
$1.9 million
and
$1.8 million
, respectively, from JHJ. As of each of
December 31, 2014 and 2013
, the excess of our investment over our interest in JHJ’s equity is
$4.8 million
.
6. Employee Benefits
Qualified and Nonqualified Defined Benefit Pension Plans
With the exception of Regional Transportation, YRC Reimer and certain of our other foreign subsidiaries, YRC Worldwide and its operating subsidiaries sponsor qualified and nonqualified defined benefit pension plans for certain employees not covered by collective bargaining agreements (approximately
12,000
current, former and retired employees). Qualified and nonqualified pension benefits are based on years of service and the employees’ covered earnings. Employees covered by collective bargaining agreements participate in various multi-employer pension plans to which YRC Worldwide contributes, as discussed below. Regional Transportation does not offer a defined benefit pension plan and instead offers retirement benefits through either contributory 401(k) savings plans or profit sharing plans, as discussed below. The existing YRC Worldwide defined benefit pension plans closed to new participants effective January 1, 2004 and the benefit accrual for active employees was frozen effective July 1, 2008. Our actuarial valuation measurement date for our pension plans is December 31.
Funded Status
The reconciliation of the beginning and ending balances of the projected benefit obligation and the fair value of plan assets for the
years ended December 31, 2014 and 2013
, and the funded status
at December 31, 2014 and 2013
, is as follows:
|
(in millions)
|
2014
|
2013
|
||||
|
Change in benefit obligation:
|
||||||
|
Benefit obligation at beginning of year
|
$
|
1,188.8
|
|
$
|
1,345.7
|
|
|
Service cost
|
4.3
|
|
4.3
|
|
||
|
Interest cost
|
60.7
|
|
56.2
|
|
||
|
Benefits paid
|
(101.1
|
)
|
(76.5
|
)
|
||
|
Actuarial (gain) loss
|
214.1
|
|
(131.6
|
)
|
||
|
Expenses paid from assets
|
(11.3
|
)
|
(9.6
|
)
|
||
|
Other
|
(0.3
|
)
|
0.3
|
|
||
|
Benefit obligation at year end
|
$
|
1,355.2
|
|
$
|
1,188.8
|
|
|
Change in plan assets:
|
|
|
||||
|
Fair value of plan assets at prior year end
|
$
|
808.4
|
|
$
|
799.4
|
|
|
Actual return on plan assets
|
141.6
|
|
31.9
|
|
||
|
Employer contributions
|
62.3
|
|
62.9
|
|
||
|
Benefits paid
|
(101.1
|
)
|
(76.5
|
)
|
||
|
Expenses paid from assets
|
(11.3
|
)
|
(9.6
|
)
|
||
|
Other
|
(0.6
|
)
|
0.3
|
|
||
|
Fair value of plan assets at year end
|
$
|
899.3
|
|
$
|
808.4
|
|
|
Funded status at year end
|
$
|
(455.9
|
)
|
$
|
(380.4
|
)
|
The underfunded status of the plans of
$455.9 million
and
$380.4 million
at December 31, 2014 and 2013
, respectively, is recognized in the accompanying consolidated balance sheets as shown in the table below. No plan assets are expected to be returned to the Company during the year ending December 31,
2015
.
Benefit Plan Obligations
Amounts recognized in the consolidated balance sheets for pension benefits at
December 31
are as follows:
59
|
(in millions)
|
2014
|
2013
|
||||
|
Noncurrent assets
|
$
|
1.9
|
|
$
|
1.7
|
|
|
Current liabilities
|
0.4
|
|
0.6
|
|
||
|
Noncurrent liabilities
|
457.4
|
|
381.5
|
|
||
Amounts recognized in accumulated other comprehensive loss at December 31 consist of:
|
(in millions)
|
2014
|
2013
|
||||
|
Net actuarial loss
|
$
|
502.7
|
|
$
|
389.2
|
|
As shown above, included in accumulated other comprehensive loss at
December 31, 2014
, are unrecognized actuarial losses of
$502.7 million
(
$448.6 million
, net of tax). The actuarial loss included in accumulated other comprehensive income and expected to be recognized in net periodic cost during the year ending December 31,
2015
, is
$16.4 million
.
The total accumulated benefit obligation for all plans was
$1,353.6 million
and
$1,188.8 million
at December 31, 2014 and 2013
, respectively.
Information for pension plans with an ABO in excess of plan assets
at December 31, 2014 and 2013
is as follows:
|
At December 31, 2014
|
||||||||||
|
(in millions)
|
ABO Exceeds Assets
|
Assets Exceed ABO
|
Total
|
|||||||
|
Projected benefit obligation
|
$
|
1,349.0
|
|
$
|
6.2
|
|
$
|
1,355.2
|
|
|
|
Accumulated benefit obligation
|
1,349.0
|
|
4.6
|
|
1,353.6
|
|
||||
|
Fair value of plan assets
|
891.2
|
|
8.1
|
|
899.3
|
|
||||
|
At December 31, 2013
|
||||||||||
|
(in millions)
|
ABO Exceeds Assets
|
Assets Exceed ABO
|
Total
|
|||||||
|
Projected benefit obligation
|
$
|
1,182.1
|
|
$
|
5.3
|
|
$
|
1,187.4
|
|
|
|
Accumulated benefit obligation
|
1,182.1
|
|
6.7
|
|
1,188.8
|
|
||||
|
Fair value of plan assets
|
799.9
|
|
8.5
|
|
808.4
|
|
||||
Assumptions
Weighted average actuarial assumptions used to determine benefit obligations at December 31:
|
2014
|
2013
|
|||
|
Discount rate
|
4.33
|
%
|
5.23
|
%
|
Weighted average assumptions used to determine net periodic benefit cost for the years ended December 31:
|
2014
|
2013
|
2012
|
||||
|
Discount rate
|
5.23
|
%
|
4.28
|
%
|
5.23
|
%
|
|
Expected rate of return on assets
|
7.0
|
%
|
7.0
|
%
|
7.0
|
%
|
|
Mortality table
|
RP-2000
Projected to 2014 |
|
RP-2000
Projected to 2013 |
|
RP-2000
Projected to 2012 |
|
The discount rate refers to the interest rate used to discount the estimated future benefit payments to their present value, also referred to as the benefit obligation. The discount rate allows us to estimate what it would cost to settle the pension obligations as
60
of the measurement date,
December 31
, and is used as the interest rate factor in the following year’s pension cost. We determine the discount rate by selecting a portfolio of high quality noncallable bonds such that the coupons and maturities exceed our expected benefit payments.
In determining the expected rate of return on assets, we consider our historical experience in the plans’ investment portfolio, historical market data and long-term historical relationships as well as a review of other objective indices including current market factors such as inflation and interest rates. Although plan investments are subject to short-term market volatility, we believe they are well diversified and closely managed. Our asset allocation as of
December 31, 2014
, consisted of
37%
equities,
35%
in debt securities and
28%
in absolute return investments and as of
December 31, 2013
consisted of
35%
equities,
34%
in debt securities and
31%
in absolute return investments. The
2014
allocations are consistent with the targeted long-term asset allocation for the plans which is
37%
equities,
33%
debt securities and
30%
absolute return investments. Based on various market factors, we selected an expected rate of return on assets of
7.0%
effective for the
2014
and
2013
valuations. We will continue to review our expected long-term rate of return on an annual basis and revise appropriately. The pension trust holds no YRC Worldwide securities.
Future Contributions and Benefit Payments
We expect to contribute approximately
$60.3 million
to our single employer pension plans in 2015.
Expected benefit payments from our qualified and non-qualified defined benefit pension plans for each of the next five years and the total payments for the following five years ended December 31 are as follows:
|
(in millions)
|
2015
|
|
2016
|
|
2017
|
|
2018
|
|
2019
|
|
2020-2024
|
|
||||||
|
Expected benefit payments
|
$
|
76.3
|
|
$
|
76.4
|
|
$
|
76.7
|
|
$
|
78.1
|
|
$
|
79.9
|
|
$
|
406.7
|
|
Pension and Other Post-retirement Costs
The components of our net periodic pension cost, other post-retirement costs and other amounts recognized in other comprehensive loss for the years ended December 31,
2014
,
2013
and
2012
were as follows:
|
(in millions)
|
2014
|
2013
|
2012
|
||||||
|
Net periodic benefit cost:
|
|
|
|
||||||
|
Service cost
|
$
|
4.3
|
|
$
|
4.3
|
|
$
|
3.9
|
|
|
Interest cost
|
60.7
|
|
56.2
|
|
59.3
|
|
|||
|
Expected return on plan assets
|
(53.7
|
)
|
(55.6
|
)
|
(51.1
|
)
|
|||
|
Amortization of prior net loss
|
12.8
|
|
14.8
|
|
9.0
|
|
|||
|
Net periodic pension cost
|
$
|
24.1
|
|
$
|
19.7
|
|
$
|
21.1
|
|
|
Other changes in plan assets and benefit obligations recognized in other comprehensive loss (income):
|
|
|
|
||||||
|
Net actuarial loss (gain) and other adjustments
|
$
|
126.3
|
|
$
|
(107.7
|
)
|
$
|
170.4
|
|
|
Less amortization of prior losses
|
(12.8
|
)
|
(14.8
|
)
|
(9.0
|
)
|
|||
|
Total recognized in other comprehensive loss (income)
|
113.5
|
|
(122.5
|
)
|
161.4
|
|
|||
|
Total recognized in net periodic benefit cost and other comprehensive (income) loss
|
$
|
137.6
|
|
$
|
(102.8
|
)
|
$
|
182.5
|
|
During the years ended
December 31, 2014
,
2013
and
2012
, the income tax provision (benefit) related to amounts in other comprehensive income was
$(3.2) million
,
$42.7 million
and
$(1.3) million
, respectively.
Fair Value Measurement
Our pension assets are stated at fair value. Fair value is the price that would be received to sell an asset or paid to transfer a liability in an orderly transaction between market participants at the measurement date. The majority of our assets are invested in Level 2 assets of fixed income funds and absolute return investments. These funds are valued at quoted redemption values that represent the net asset values of units held at year-end which we have determined approximates fair value.
61
Investments in private equities and absolute return funds do not have readily available market values. These estimated fair values may differ significantly from the values that would have been used had a ready market for these investments existed, and such differences could be material. Investments in hedge funds that do not have an established market are valued at net asset values as determined by the investment managers, which we have determined approximates fair value. The level of certain investments have been adjusted in the prior years to conform with current year presentation.
The table below details by level, within the fair value hierarchy, the pension assets at fair value as of
December 31, 2014
:
|
Pension Assets at Fair Value as of December 31, 2014
|
||||||||||||
|
(in millions)
|
Level 1
|
Level 2
|
Level 3
|
Total
|
||||||||
|
Equities
|
$
|
112.2
|
|
$
|
111.9
|
|
$
|
—
|
|
$
|
224.1
|
|
|
Private equities
|
—
|
|
—
|
|
104.7
|
|
104.7
|
|
||||
|
Fixed income:
|
||||||||||||
|
Corporate
|
7.9
|
|
33.0
|
|
130.1
|
|
171.0
|
|
||||
|
Government
|
106.9
|
|
157.4
|
|
—
|
|
264.3
|
|
||||
|
Other
|
—
|
|
—
|
|
—
|
|
—
|
|
||||
|
Absolute return
|
—
|
|
120.6
|
|
—
|
|
120.6
|
|
||||
|
Interest bearing
|
14.6
|
|
—
|
|
—
|
|
14.6
|
|
||||
|
Total plan assets
|
$
|
241.6
|
|
$
|
422.9
|
|
$
|
234.8
|
|
$
|
899.3
|
|
The table below details by level, within the fair value hierarchy, the pension assets at fair value as of
December 31, 2013
:
|
Pension Assets at Fair Value as of December 31, 2013
|
||||||||||||
|
(in millions)
|
Level 1
|
Level 2
|
Level 3
|
Total
|
||||||||
|
Equities
|
$
|
113.3
|
|
$
|
106.4
|
|
—
|
|
$
|
219.7
|
|
|
|
Private equities
|
—
|
|
—
|
|
60.3
|
|
60.3
|
|
||||
|
Fixed income:
|
|
|
|
|
||||||||
|
Corporate
|
4.3
|
|
33.7
|
|
111.4
|
|
149.4
|
|
||||
|
Government
|
98.0
|
|
102.8
|
|
—
|
|
200.8
|
|
||||
|
Other
|
10.1
|
|
—
|
|
—
|
|
10.1
|
|
||||
|
Absolute return
|
6.2
|
|
138.6
|
|
—
|
|
144.8
|
|
||||
|
Interest bearing
|
23.3
|
|
—
|
|
—
|
|
23.3
|
|
||||
|
Total plan assets
|
$
|
255.2
|
|
$
|
381.5
|
|
$
|
171.7
|
|
$
|
808.4
|
|
The table below presents the activity of our assets measured at fair value on a recurring basis using significant unobservable inputs (Level 3):
|
(in millions)
|
Private
Equities
|
Fixed income
|
Total Level 3
|
||||||
|
Balance at December 31, 2012
|
$
|
38.8
|
|
$
|
96.1
|
|
$
|
134.9
|
|
|
Purchases
|
6.4
|
|
9.6
|
|
16.0
|
|
|||
|
Sales
|
(6.4
|
)
|
(5.3
|
)
|
(11.7
|
)
|
|||
|
Unrealized gain (loss)
|
21.5
|
|
11.0
|
|
32.5
|
|
|||
|
Balance at December 31, 2013
|
$
|
60.3
|
|
$
|
111.4
|
|
$
|
171.7
|
|
|
Purchases
|
32.8
|
|
5.0
|
|
37.8
|
|
|||
|
Sales
|
(1.0
|
)
|
(4.3
|
)
|
(5.3
|
)
|
|||
|
Unrealized gain (loss)
|
12.6
|
|
18.0
|
|
30.6
|
|
|||
|
Balance at December 31, 2014
|
$
|
104.7
|
|
$
|
130.1
|
|
$
|
234.8
|
|
62
The following table sets forth a summary of the Level 3 assets for which the fair value is not readily determinable but a reported NAV is used to estimate the fair value as of
December 31, 2014
:
|
Fair value estimated using Net Asset Value per Share
|
||||||||
|
(in millions)
|
Fair Value
|
Unfunded Commitments
|
Redemption Frequency
|
Redemption Notice Period
|
||||
|
Private equities
(a)
|
$
|
67.7
|
|
$
|
18.2
|
|
Redemptions not permitted
|
|
|
Fixed income
(b)
|
130.1
|
|
12.6
|
|
Redemptions not permitted
|
|||
|
Total
|
$
|
197.8
|
|
|||||
|
(a)
|
Consists of private equity investments in renewable energy, healthcare and Chinese technology.
|
|
(b)
|
Primarily consists of investments in and debt securities secured by royalty payments from marketers of pharmaceuticals.
|
The following table sets forth a summary of the Level 3 assets for which the fair value is not readily determinable but a reported NAV is used to estimate the fair value as of
December 31, 2013
:
|
Fair value estimated using Net Asset Value per Share
|
||||||||
|
(in millions)
|
Fair Value
|
Unfunded Commitments
|
Redemption Frequency
|
Redemption Notice Period
|
||||
|
Private equities
(a)
|
$
|
60.3
|
|
$
|
18.0
|
|
Redemptions not permitted
|
|
|
Fixed income
(b)
|
111.4
|
|
16.0
|
|
Redemptions not permitted
|
|||
|
Total
|
$
|
171.7
|
|
|||||
|
(a)
|
Consists of
five
private equity funds investing in renewable solar energy, acquisition of pharmaceutical company interests, Chinese technology and healthcare companies.
|
|
(b)
|
Consists of
three
fixed income funds which invest in debt securities secured by royalty payments from marketers of pharmaceutical products.
|
The assets presented in the
December 31, 2014
and
2013
fair value hierarchy tables classified as Level 1 and Level 2, which fair value is estimated using NAV per share, have redemption frequencies ranging from daily to annually, have redemption notice periods from approximately
1
day to
90
days and have no unfunded commitments. These assets consist of equity, fixed income, and absolute return funds. Generally, the investment strategies of the fixed income and equity funds is based on fundamental and quantitative analysis and consists of long and hedged strategies. The general strategy of the absolute return funds consists of alternative investment techniques, including derivative instruments and other unconventional assets, to achieve a stated return rate.
Multi-Employer Pension Plans
YRC Freight, New Penn, Holland and Reddaway contribute to various separate multi-employer health, welfare and pension plans for employees that are covered by our collective bargaining agreements (approximately
78%
of total Company employees). The collective bargaining agreements determine the amounts of these contributions. The health and welfare plans provide medical related benefits to active employees and retirees. The pension plans provide defined benefits to retired participants. We recognize as net pension cost within ‘salaries, wages and employee benefits’ the contractually required contributions for the period and recognize as a liability any contributions due and unpaid at period end. We do not directly manage multi-employer plans. The trusts covering these plans are generally managed by trustees, half of whom the unions appoint and half of whom various contributing employers appoint.
We expensed the following amounts related to these plans for the years ended December 31:
|
(in millions)
|
2014
|
2013
|
2012
|
||||||
|
Health and welfare
|
$
|
416.2
|
|
$
|
399.5
|
|
$
|
387.5
|
|
|
Pension
|
93.6
|
|
89.1
|
|
85.6
|
|
|||
|
Total
|
$
|
509.8
|
|
$
|
488.6
|
|
$
|
473.1
|
|
63
Pension
Through the third quarter of 2009, we deferred payment of certain of our contributions to multi-employer pension funds. These deferred payments have been recognized as an operating expense and the liability was recorded as deferred contribution obligations. Beginning in the third quarter of 2009 through May 2011, most of our collective bargaining agreements provided for a temporary cessation of pension contributions so no expense or liability was required to be recognized for that period. In accordance with modifications to our collective bargaining agreements, we agreed to resume making pension contributions effective June 1, 2011 at
25.0%
of the contribution rate in effect as of July 1, 2009.
The following table provides additional information related to our participation in individually significant multi-employer pension plans for the year ended
December 31, 2014
:
|
|
Pension Protection Zone Status
(b)
|
Funding Improvement or
Rehabilitation Plan
|
Employer Surcharge Imposed
|
Expiration Date of Collective-Bargaining Agreement
|
||
|
Pension Fund
(a)
|
EIN Number
|
2014
|
2013
|
|||
|
Central States, Southwest and Southwest Areas Pension Fund
|
36-6044243
|
Red
|
Red
|
Yes
|
No
|
3/31/2019
|
|
Teamsters National 401K Savings Plan
(c)
|
52-1967784
|
N/A
|
N/A
|
N/A
|
No
|
3/31/2019
|
|
I.B. of T. Union Local No 710 Pension Fund
|
36-2377656
|
Green
|
Green
|
No
|
No
|
3/31/2019
|
|
Central Pennsylvania Teamsters Defined Benefit Plan
|
23-6262789
|
Green
|
Yellow
|
Yes
|
No
|
3/31/2019
|
|
Road Carriers Local 707 Pension Fund
|
51-6106510
|
Not Available
|
Red
|
Yes
|
No
|
3/31/2019
|
|
Teamsters Local 641 Pension Fund
|
22-6220288
|
Red
|
Red
|
Yes
|
No
|
3/31/2019
|
(a)
The determination of individually significant multi-employer plans is based on the relative contributions to the plans over the periods presented as well as other factors.
(b)
The Pension Protection Zone Status is based on information that the Company obtained from the plans’ Forms 5500. Unless otherwise noted, the most recent Pension Protection Act (PPA) zone status available for 2014 and 2013 is for the plan’s year-end during calendar years 2013 and 2012, respectively. Among other factors, plans in the red zone are generally less than 65 percent funded, plans in the yellow zone are less than 80 percent funded, and plans in the green zone are at least 80 percent funded.
(c)
The policies of the Western Conference of Teamsters Pension Trust precluded the Company from reentering the plan on June 1, 2011. The plan did not assess a withdrawal liability and has not done so since June 1, 2011. Contributions related to the employees previously covered by this plan are now being made to the Teamsters National 401(k) Plan.
YRC Worldwide was listed in the Central States, Southwest and Southwest Areas Pension Plan, Road Carriers Local 707 Pension Fund and Teamsters Local 641 Pension Fund’s Forms 5500 as providing more than 5 percent of the total contributions for 2013 and 2012.
We contributed a total of
$91.6 million
,
$88.7 million
and
$84.9 million
to the multi-employer pension funds for the
years ended December 31, 2014, 2013 and 2012
. The following table provides the pension amounts contributed by fund for those funds that are considered to be individually significant:
|
(in millions)
|
2014
|
2013
|
2012
|
||||||
|
Central States, Southeast and Southwest Areas Pension Plan
|
$
|
52.2
|
|
$
|
52.1
|
|
$
|
51.9
|
|
|
Teamsters National 401K Savings Plan
|
13.1
|
|
11.2
|
|
11.0
|
|
|||
|
I.B. of T. Union Local No 710 Pension Fund
|
4.9
|
|
4.4
|
|
4.1
|
|
|||
|
Central Pennsylvania Teamsters Defined Benefit Plan
|
4.3
|
|
4.5
|
|
4.5
|
|
|||
|
Road Carriers Local 707 Pension Fund
|
2.3
|
|
2.3
|
|
2.5
|
|
|||
|
Teamsters Local 641 Pension Fund
|
1.5
|
|
1.6
|
|
1.6
|
|
|||
64
In 2006, the Pension Protection Act became law and modified both the IRC as it applies to multi-employer pension plans and the Employment Retirement Income Security Act of 1974 (as amended, “ERISA”). The IRC and ERISA (in each case, as so modified) and related regulations establish minimum funding requirements for multi-employer pension plans.
If any of our multi-employer pension plans fails to meet minimum funding requirements, meet a required funding improvement or rehabilitation plan that the Pension Protection Act may require for certain of our underfunded plans, obtain from the Internal Revenue Service (“IRS”) certain changes to or a waiver of the requirements in how the applicable plan calculates its funding levels, or reduce pension benefits to a level where the requirements are met then we could be required to make additional contributions to the pension plan. If any of our multi-employer pension plans enters critical status and our contributions are not sufficient to satisfy any rehabilitation plan schedule, the Pension Protection Act could require us to make additional surcharge contributions to the multi-employer pension plan in the amount of five to ten percent of the existing contributions required by our labor agreement for the remaining term of the labor agreement.
If we fail to make our required contributions to a multi-employer plan under a funding improvement or rehabilitation plan, it would expose us to penalties including potential withdrawal liability. If the benchmarks that an applicable funding improvement or rehabilitation plan provides are not met by the end of a prescribed period, the IRS could impose an excise tax on us and the plan’s other contributing employers. These excise taxes are not contributed to the deficient funds, but rather are deposited in the United States general treasury funds. The Company does not believe that the temporary cessation of certain of its contributions to applicable multi-employer pension funds beginning in the third quarter of 2009 and continuing through May 2011 will give rise to these excise taxes as the underlying employer contributions were not required for that period.
A requirement to materially increase contributions beyond our contractually agreed rate or the imposition of an excise tax on us could have a material adverse impact on the financial results and liquidity of YRC Worldwide.
401(k) Savings Plans
We sponsor the YRC Worldwide Inc. 401(k) Plan, which is a defined contribution plan primarily for employees that our collective bargaining agreements do not cover. The plan permits participants to make contributions to the plan and permits the employer of participants to make contributions on behalf of the participants. There were no employer contributions in
2014
,
2013
or
2012
. Our employees covered under collective bargaining agreements may also participate in union-sponsored 401(k) plans.
Performance Incentive Awards
YRC Worldwide and its operating subsidiaries each provide annual performance incentive awards and more frequent sales incentive awards to certain non-union employees, which are based primarily on actual operating results achieved compared to targeted operating results or sales targets and are paid in cash. Operating income in
2014
,
2013
and
2012
included performance and sales incentive expense for non-union employees of
$16.7 million
,
$14.5 million
and
$12.3 million
, respectively. We generally pay annual performance incentive awards in the first quarter of the following year and sales performance incentive awards on a monthly basis.
We also provide long-term performance based incentive plan to key management personnel that provides the opportunity annually to earn cash and equity awards to further compensate certain levels of management. During the years ended
December 31, 2014
,
2013
and
2012
, compensation expense related to these awards was
$14.5 million
,
$5.8 million
and
$3.8 million
, respectively.
7. 2014 Financing Transactions
On January 31, 2014, we issued
14,333,334
shares of our Common Stock and
583,334
shares of our Class A Convertible Preferred Stock, par value
$1.00
per share (the “Convertible Preferred Stock”), pursuant to certain stock purchase agreements, dated as of December 22, 2013 (the “Stock Purchase Agreements”), for an aggregate
$250.0 million
in cash. We used the proceeds from these transactions to, among other things, (i) deposit with the trustee funds sufficient to repay our
6%
Notes at their maturity on February 15, 2014 and (ii) repurchase approximately
$90.9 million
of our Series A Notes. In February 2014, the Company deposited approximately
$89.6 million
with the trustee to fund the redemption (including accrued interest), and thereby discharged the indenture governing the Series A Notes. The Company used the cash deposited with the trustee to redeem its Series A Notes on August 5, 2014.
Also on January 31, 2014, certain holders of our Series B Notes exchanged their outstanding balances (including the make-whole premium and additional accrued interest through January 15, 2014) at a conversion price of
$15.00
per share, while certain other holders converted their Series B Notes in accordance with their terms. We also amended the indenture governing our Series B
65
Notes to eliminate substantially all of the restrictive covenants, certain events of default and other related provisions contained in the indenture and to release and discharge the liens on the collateral securing the Series B Notes.
Effective January 31, 2014, certain of our subsidiaries, various pension funds party thereto, and Wilmington Trust Company, as agent for such pension funds, entered into the Second Amended and Restated Contribution Deferral Agreement (“Second A&R CDA”), which, among other things (i) amended and restated the Amended and Restated Contribution Deferral Agreement (“A&R CDA”) (which agreement is discussed in our “Debt and Financing footnote”), (ii) released the agent’s security interest in third priority collateral on the Collateral Release Date (as defined therein), (iii) limited the value of obligations secured by the collateral to the Secured Obligations (as defined therein) and (iv) extended the maturity of deferred pension payments and deferred interest from March 31, 2015 to December 31, 2019.
On February 13, 2014, we replaced our existing credit facilities (as discussed in our “Debt and Financing” footnote) with a new
$450 million
ABL Facility (the “ABL Facility”) and a new
$700 million
term loan facility (“Term Loan”). The ABL Facility will be used to support our outstanding letters of credit commitments.
We refer to transactions described above collectively as the “2014 Financing Transactions.” The table below summarizes the cash flow activity for the 2014 Financing Transactions:
|
Cash Sources (in millions)
|
Cash Uses (in millions)
|
|||||||
|
Term Loan
|
$
|
700.0
|
|
Extinguish Prior ABL Facility (includes accrued interest)
|
$
|
326.0
|
|
|
|
Proceeds from sale of common stock
|
215.0
|
|
Extinguish Prior Term Loan (includes accrued interest)
|
299.7
|
|
|||
|
Proceeds from sale of preferred stock
|
35.0
|
|
Retire 6% Notes
|
71.5
|
|
|||
|
Cash proceeds from restricted amounts held in escrow - existing ABL facility
|
90.0
|
|
Repurchase Series A Notes (upon transaction closing and includes accrued interest)
|
93.9
|
|
|||
|
ABL Facility
|
—
|
|
Redeem Series A Notes (on August 5, 2014 and includes accrued interest)
|
89.6
|
|
|||
|
Fees, Expenses and Original Issuance Discount
|
50.8
|
|
||||||
|
Restricted Cash to Balance Sheet
(a)
|
92.0
|
|
||||||
|
Cash to Balance Sheet
|
16.5
|
|
||||||
|
Total sources
|
$
|
1,040.0
|
|
Total uses
|
$
|
1,040.0
|
|
|
|
(a)
|
Under the terms of the ABL facility, this amount was classified as “restricted cash” in the consolidated balance sheet at the closing date of the ABL Facility.
|
The table below summarizes the non-cash activity for the 2014 Financing Transactions:
|
Non-Cash Sources (in millions)
|
Non-Cash Uses (in millions)
|
|||||||
|
Secured Second A&R CDA
|
$
|
51.0
|
|
A&R CDA
|
$
|
124.2
|
|
|
|
Unsecured Second A&R CDA
|
73.2
|
|
Exchange/conversion of Series B Notes to common stock
|
50.6
|
|
|||
|
Exchange/conversion of Series B Notes to common stock
|
50.6
|
|
||||||
|
Total sources
|
$
|
174.8
|
|
Total uses
|
$
|
174.8
|
|
|
66
We accounted for the A&R CDA maturity extension as a debt modification and the remaining transactions as extinguishment of debt and issuance of new debt. We recorded a gain on extinguishment of debt of
$11.2 million
associated with this transaction during the year ended
December 31, 2014
,
$16.3 million
of which related to the acceleration of net premiums on our old debt, partially offset by
$5.1 million
of additional expense related to the fair value of the incremental shares provided to those Series B Note holders who exchanged their outstanding balances at a conversion price of
$15.00
per share. We recorded, in “interest expense” on the statements of consolidated comprehensive income (loss),
$8.0 million
of make-whole interest related to the Series B Notes exchanged during the
year ended December 31, 2014
. We paid
$43.8 million
of fees associated with these transactions of which
$26.7 million
was recorded as unamortized deferred debt costs in “other assets” in the consolidated balance sheet and will be recognized as interest expense over the term of the Term Loan and ABL Facility and
$17.1 million
offset the equity proceeds of our stock purchase agreements.
On March 14, 2014, the Company held a special meeting of stockholders at which our stockholders approved amending our Certificate of Incorporation to increase the number of authorized shares of Common Stock to
95.0 million
shares and to allow an investor involved in the 2014 Financing Transactions to own more than
19.99%
of outstanding Common Stock. Upon approval of these amendments, each outstanding share of Convertible Preferred Stock automatically converted into four shares of Common Stock and the Company recorded
$18.1 million
related to the amortization of the beneficial conversion feature on preferred stock on the statements of consolidated operations.
On February 13, 2014, we completed our 2014 Financing Transactions which substantially changed the makeup of our outstanding debt. Refer to the “2014 Financing Transactions” footnote for further details. As of
December 31, 2014
we had two primary credit facilities that we utilized to support our liquidity needs: a
$700 million
term loan facility and a
$450 million
ABL Facility. The ABL Facility is used to support our outstanding letters of credit commitments. We have set forth a brief description of our two primary credit facilities and our other financing arrangements in place at
December 31, 2014
as well as those credit facilities in place at December 31, 2013 below.
$700 Million First Lien Term Loan
On February 13, 2014, we borrowed in full
$700 million
, less a
1%
discount, from a syndicate of banks and other financial institutions arranged by Credit Suisse Securities (USA) and RBS Citizens, N.A. No amounts under this Term Loan, once repaid, may be reborrowed. On September 25, 2014, the Company entered into Amendment No. 1 to its Credit Agreement , which amended the Term Loan to, among other things, adjust the maximum permitted total leverage ratio through December 31, 2016 and increase the applicable interest rate (subject to the exceptions discussed below) over the same period. Certain material provisions of the Term Loan are summarized below:
-
Maturity and Amortization
: The Term Loan matures on February 13, 2019. The Term Loan will amortize in equal quarterly installments in an aggregate annual amount equal to
1%
of the original principal amount of the Term Loan.
-
Incremental
: Subject to finding current or new lenders willing to provide such commitments, the Company has the right to incur one or more increases to the Term Loan and/or one or more new tranches of term loans (which may be unsecured or secured on a junior basis) to be made available under the Term Loan credit agreement which shall not exceed (i)
$250 million
so long as the senior secured leverage ratio on a pro forma basis (defined as consolidated total debt that is secured by a lien as of such date over Consolidated EBITDA as of the twelve months ended the most recent fiscal quarter end for which financial statements are available) does not exceed
3.25
to
1.0
, plus (ii) all voluntary prepayments of the Term Loan.
-
Interest and Fees
: The Term Loan bears interest, at the election of the borrower, at either the applicable London interbank offer rate (“LIBOR”) (subject to a floor of
1.00%
) plus a margin of
7.25%
per annum, or a rate determined by reference to the alternate base rate (the greater of the prime rate established by the administrative agent, the federal fund rate plus
0.50%
and one month, LIBOR plus
1.00%
) plus a margin of
6.25%
; provided that such margins will step down by
0.25%
when the Company meets a total leverage ratio of equal or less than
3.25
to
1.00
.
-
Guarantors
: The obligations of the borrower under the Term Loan are unconditionally guaranteed by certain wholly owned domestic restricted subsidiaries of the Company (the “Term Guarantors”).
-
Collateral
: The Term Loan is secured by a perfected first priority security interest in (subject to permitted liens) substantially all assets of the Company and the guarantors under the Term Loan (the “Term Guarantors”), except that accounts receivable, cash, deposit accounts and other assets related to accounts receivable are subject to a second priority interest (subject to permitted liens)
67
and certain owned real property securing the obligations under the Second A&R CDA filed January 31, 2014, do not secure the obligations under the Term Loan credit agreement (the “CDA Collateral”).
-
Mandatory Prepayments
: The Term Loan includes the following mandatory prepayments:
|
•
|
75%
of excess cash flow (as defined in the Term Loan and paid if permitted under the ABL Facility), subject to step downs to (w)
50%
if the total leverage ratio is less than or equal to
4.00
to
1.00
but greater than
3.50
to
1.00
, to (x)
25%
if the total leverage ratio is less than or equal to
3.50
to
1.00
but greater than
3.00
to
1.00
and (y)
0%
if the total leverage ratio is less than or equal to
3.00
to
1.00
.
|
|
•
|
100%
of the net cash proceeds of all asset sales or similar dispositions outside of the ordinary course of business, casualty events and other limited exceptions under the Term Loan (subject to materiality thresholds and customary reinvestment rights); and
|
|
•
|
100%
of cash proceeds from debt issuances that are not permitted by the Term Loan.
|
-
Events of Default
: The Term Loan documentation contains certain customary events of default, including but not limited to the failure to make payments due under the Term Loan, breach of and failure to cure the breach of certain covenants, the entry of a final unpaid judgment against any of the Term Guarantors in excess of
$30 million
, the commencement of certain insolvency proceedings, liquidations or dissolutions, a cross-default to certain other indebtedness with an outstanding aggregate principal balance of at least
$30 million
(other than the ABL Facility), and cross-acceleration to the ABL Facility.
-
Covenants
: The Term Loan contains certain customary affirmative and negative covenants, including, among others, covenants restricting the incurrences of debt, liens, the making of investments and repurchases, transactions with affiliates, fundamental changes and asset sales, and prepayments of junior debt. In addition, refer to the “Liquidity” footnote for financial covenants for each of the remaining test periods.
$450 Million ABL Facility
On February 13, 2014, we entered into the ABL Facility which is an asset-based
$450 million
loan facility from a syndicate of banks arranged by RBS Citizens, N.A., Merrill Lynch, Pierce, Fenner & Smith and CIT Finance LLC. The ABL Facility terminates on February 13, 2019. YRC Worldwide, YRC Inc., Reddaway, Holland and New Penn are borrowers under the ABL Facility, and certain of the Company’s domestic subsidiaries are guarantors thereunder. Certain material provisions of the ABL Facility are summarized below and are qualified in their entirety by reference to the definitive documentation:
-
Availability
: The aggregate amount available under the ABL Facility cannot be more than (a) the collateral line cap minus (b) the facility exposure. The facility exposure refers to the aggregate amount of loans and letter of credit outstanding (with an exclusion for certain fees and other amounts owing for letters of credit). The collateral line cap refers to a limit equal to the greater of (a) the commitments by lenders under the facility and (b) the borrowing base. The borrowing base equals the sum of (a)
85%
of the sum of (i) Eligible Accounts (as defined in the ABL Facility) minus without duplication (ii) the Dilution Reserve (as defined in the ABL Facility relating to reserves for eligible accounts experiencing bad debt write-downs, discounts, allowances and similar dilutive items), plus (b)
100%
of Eligible Borrowing Base Cash (as defined in the ABL Facility which constitutes
85%
of the “deferred revenue liability” as reflected on the balance sheet of the Company and its restricted subsidiaries as of the last day of the most recently completed fiscal month), minus (d) the Availability Reserve (as defined in the ABL Facility) imposed by the agent in its permitted discretion (made in good-faith and using reasonable business judgment) to reduce the amount of the borrowing base in light of predetermined criteria set forth in the ABL Facility.
-
Eligible Borrowing Base Cash
: The eligible borrowing base cash is cash that is deposited from time to time into a segregated restricted account maintained at the agent over which the agent has dominion. Such cash can only be withdrawn by us from the account if (i) no event of default exists or would arise as a result of the borrowing base cash release and (ii) availability as of the proposed date of such borrowing base cash release is not less than
15%
of the collateral line cap. Eligible borrowing base cash is included in “Restricted amounts held in escrow” in the accompanying consolidated balance sheet.
-
Interest
: Revolving loans made under the ABL Facility bear interest, at the Company’s election, of either the applicable LIBOR rate plus
2.5%
or the base rate (the greater of the prime rate established by the agent, the federal funds effective rate plus
0.50%
and one month LIBOR plus
1.00%
). Thereafter, the interest rates will be subject to the following price grid based on the average quarterly excess availability under the revolver:
68
|
Average Quarterly
|
Base Rate
|
LIBOR
|
|
|
Level
|
Excess Capacity
|
Plus
|
Plus
|
|
I
|
>
$140,000,000
|
1.00%
|
2.00%
|
|
II
|
>
$70,000,000
|
1.25%
|
2.25%
|
|
< $140,000,000
|
|||
|
III
|
< $70,000,000
|
1.50%
|
2.50%
|
The rates set forth above are subject to a
0.25%
reduction during any fiscal quarter for which the Company has a total leverage ratio of less than
2.50
to
1.00
. We have not drawn on the facility at any time during the
year ended December 31, 2014
.
-
Letter of Credit Fees
: The ABL Facility has certain specific fees relating to letters of credit which include: (i) fees payable quarterly in arrears equal to the applicable margin in effect for revolving loans (which is listed in the “Interest” description immediately above) multiplied by the average daily stated amount of letters of credit (
2.5%
for the
year ended December 31, 2014
), (ii) fronting fees for letters of credit payable quarterly in arrears equal to
0.125%
of the stated amount of the letters of credit and (iii) fees to issuing banks to compensate for customary charges related to the issuance and administration of letters of credit.
-
Other Fees
: Other fees in respect of the ABL Facility include an unused line fee payable quarterly in arrears calculated by multiplying the amount by which the commitments exceed the loans and letters of credit for any calendar quarter by the unused line fee percentage (such unused line fee percentage initially to
0.25%
per annum through March 31, 2014, and thereafter
0.375%
per annum if the average revolver usage is less than
50%
or
0.25%
per annum if the average revolver usage is greater than
50%
).
-
Collateral
: The obligations under the ABL Facility are secured by a perfected first priority security interest in (subject to permitted liens) all accounts receivable, cash, deposit accounts and other assets related to accounts receivable of the Company and the other loan parties and an additional second priority security interest in (subject to permitted liens) substantially all remaining assets of the borrowers and the guarantors other than CDA Collateral.
-
Incremental
: The Facility provides for a
$100 million
uncommitted accordion to increase the revolving commitment in the future to support borrowing base growth.
-
Events of Default
: The ABL Facility contains certain customary events of default, including but not limited to the failure to make payments due under the ABL Facility, breach of and failure to cure the breach of certain covenants, the entry of a final unpaid judgment against any of the ABL Facility loan parties in excess of
$30 million
, the commencement of any insolvency proceeding, liquidation or dissolution, and a cross-default to certain other indebtedness with an outstanding aggregate principal balance of at least
$30 million
(including the Term Loan).
-
Covenants
: The ABL Facility contains certain customary affirmative and negative covenants (including certain customary provisions regarding borrowing base reporting, and including, among others, covenants restricting the incurrences of debt, liens, the making of investments and repurchases, transactions with affiliates, fundamental changes and asset sales, and prepayments of junior debt). Certain of the covenants relating to investments, restricted payments and capital expenditures are relaxed upon meeting specified payment conditions or debt repayment conditions, as applicable. Payment conditions include (i) the absence of an event of default arising from such transaction, (ii) liquidity of at least
$100 million
or availability of at least
$67.5 million
and (iii) the Consolidated Fixed Charge Coverage Ratio for the most recent term period on a pro forma basis is equal to or greater than
1.10
to
1.00
). Debt repayment conditions include (i) the absence of an event of default from repaying such debt and (ii) availability on the date of repayment is not less than
$67.5 million
. During any period commencing when the ABL Facility borrowers fail to maintain availability in an amount at least equal to
10%
of the collateral line cap and until the borrowers have maintained availability of at least
10%
of the collateral line cap for
30
consecutive calendar days, the ABL Facility loan parties are required to maintain a Consolidated Fixed Charge Coverage Ratio of at least
1.10
to
1.00
. The “Consolidated Fixed Charge Coverage Ratio” is defined as (a) (i) consolidated adjusted EBITDA for such period, minus (ii) capital expenditures made during such period, minus (iii) the aggregate amount of net cash taxes paid in cash during such period, minus (iv) the amount, if any, by which the cash pension contribution for such period exceeds the pension expense for such period, and plus (v) the amount, if any, by which the pension expense for such period exceeds the cash pension contribution for such period, divided by (b) the consolidated fixed charges for such period. In addition, refer to the “Liquidity” footnote for covenants for each of the remaining test periods.
On February 4, 2015, the Company, the Company’s subsidiaries that are borrower’s under the ABL facility, more than a majority of the lenders under the ABL Facility (the “Consenting Lenders”) and Citizens Business Capital, in its capacity as administrative agent under the ABL Facility (the “ABL Agent”), entered into a Limited Waiver and Consent. Pursuant to the Limited Waiver and Consent, the Company and the other borrowers obtained waivers and consents to eliminate any consequences from a technical,
69
administrative error resulting from the Company depositing the requisite amount of eligible borrowing base cash in a restricted account with the ABL Agent prior to delivery of the January 15, 2015 borrowing base certificate but after the month ended December 31, 2014. Throughout the intervening period of time, the ABL Agent had a perfected security in all such cash.
Second Amended and Restated Contribution Deferral Agreement
-
Overview
: Certain of our subsidiaries are parties to the A&R CDA with certain multiemployer pension funds named therein (collectively, the “Funds”) pursuant to which we are permitted to continue to defer pension payments and deferred interest owed to such Funds as of July 22, 2011 (each, “Deferred Pension Payments” and “Deferred Interest”). The A&R CDA was scheduled to mature on March 31, 2015
t
hough the Company entered into the Second A&R CDA on January 31, 2014 which extended the maturity to December 31, 2019. There is no mandatory amortization prior to that time. The Deferred Pension Payments and Deferred Interest (each as defined in the A&R CDA) bears interest at a fixed rate, with respect to each Fund, per annum as set forth in its trust documentation as of February 28, 2011.
-
Application of Certain Payments
: Pursuant to the terms of the collective bargaining agreement with the IBT, the Company’s subsidiaries began making contributions to the Funds for the month beginning June 1, 2011 at the rate of
25%
of the contribution rate in effect on July 1, 2009. However, legislative changes to current law or other satisfactory action or arrangements are required to enable certain of the Funds (based on their funded status) to accept contributions at a reduced rate.
In accordance with the re-entry arrangements between each Fund and the primary obligors, a Fund may require the primary obligors to make payments of obligations owed to such Fund under the A&R CDA in lieu of payments required pursuant to the collective bargaining agreement with the IBT or make payments into an escrow arrangement, in each case in an amount equal to such Fund’s current monthly contribution amount.
-
Collateral
: Under the A&R CDA, the Funds maintain their first lien on existing first priority collateral. The Funds allowed the secured parties under the Series A Notes and Series B Notes (as each are defined and described above) a second lien behind the secured parties to the credit agreement on certain properties and the Funds had a third lien on such collateral. However, under the Second A&R CDA, such third lien on certain properties was released on the collateral release date upon the occurrence of events specified therein.
Series B Convertible Senior Secured Notes
On July 22, 2011, we issued
$100.0 million
of our Series B Notes that bear interest at a stated rate of
10.0%
per year and mature on March 31, 2015. Interest is payable on a semiannual basis in arrears only in-kind through the issuance of additional Series B Notes. As of
December 31, 2014
and
2013
, respectively, there was
$17.7 million
and
$69.2 million
in aggregate principal amount of Series B Notes outstanding, after giving effect to the payment in-kind of interest on the Series B Notes.
The Series B Notes are convertible into our common stock, at any time at the conversion price per share of approximately
$18.5334
and a conversion rate of
53.9567
common shares per
$1,000
of the Series B Notes (such conversion price and conversion rate applying also to the Series B Notes make whole premium). Upon conversion, holders of Series B Notes will not receive any cash payment representing accrued and unpaid interest; however, such holders will receive a make whole premium, equal to the total amount of interest received if the notes were held to their maturity, paid in shares of our common stock for the Series B Notes that were converted. See “Conversions” section below for additional details regarding conversions on our Series B Notes.
As of
December 31, 2014
, the effective conversion price and conversion rate for Series B Notes (after taking into account the make whole premium) was
$17.6462
and
56.6695
common shares per
$1,000
of Series B Notes, respectively.
The holders of the Series B Notes are entitled to vote with our common stock on an as-converted-to-common-stock-basis, provided that, such number of votes shall be limited to
0.0594
votes for each such share of common stock on an as-converted-to-common-stock-basis.
70
As discussed in the “2014 Financing Transactions” note, we amended the indenture governing our Series B Notes to eliminate substantially all of the restrictive covenants, certain events of default and other related provisions contained in the indenture and to release and discharge the liens on the collateral securing the Series B Notes. As of December 31, 2014, the Series B Notes indenture contained customary covenants limiting, among other things, our and our restricted subsidiaries’ ability to:
|
•
|
pay dividends or make certain other restricted payments or investments;
|
|
•
|
incur additional indebtedness and issue disqualified stock or subsidiary preferred stock;
|
|
•
|
create liens on assets;
|
|
•
|
sell assets;
|
|
•
|
merge, consolidate, or sell all or substantially all of our or the guarantors’ assets;
|
|
•
|
enter into certain transactions with affiliates; and
|
|
•
|
create restrictions on dividends or other payments by our restricted subsidiaries.
|
Amended and Restated Credit Agreement
-
Overview
: Our prior amended and restated credit agreement provided for a term loan in an aggregate principal amount of
$307.4 million
and a letter of credit facility of up to
$437.0 million
. As discussed in the “2014 Financing Transactions” footnote, we extinguished the Prior Term Loan on February 13, 2014. Certain material provisions of the amended and restated credit agreement are summarized below:
-
Interest and Fees
: After giving effect to the November 2013 amendment, the Prior Term Loan, at our option, bore interest at either (x)
6.00%
in excess of the
alternate base rate
(
i.e.
, the greater of the prime rate and the federal funds effective rate in effect on such day plus 1/2 of
1%
) in effect from time to time, or (y)
7.00%
in excess of the London interbank offer rate (adjusted for maximum reserves). The London interbank offer rate was subject to a floor of
3.50%
and the alternate base rate was subject to a floor of the then-applicable London interbank offer rate plus
1.0%
. The stated interest rate floor of
10.0%
was in effect since issuance.
Issued but undrawn letters of credit were subject to a participation fee equal to
8.00%
of the average daily amount of letter of credit exposure. Any commitment available to be used to issue letters of credit was subject to a commitment fee of
8.00%
of the average daily unused commitment. Letters of credit were subject to a
1%
fronting fee or as mutually agreed between the Company and the applicable issuing bank.
Prior ABL Facility
-
Overview
: Our Prior ABL Facility provided for a
$175.0 million
ABL first-out delayed draw term loan facility (the “Term A Facility”) and a
$225.0 million
ABL last-out term loan facility (the “Term B Facility”). As discussed in the “2014 Financing Transactions” footnote, we extinguished the Prior ABL Facility on February 13, 2014. Certain material provisions of the amended and restated credit agreement are summarized below:
-
Availability
: The aggregate amount available under the Prior ABL Facility was subject to a borrowing base equal to
85%
of Net Eligible Receivables, plus
100%
of the portion of the Prior ABL Facility that was cash collateralized, minus reserves established by the Agent in its permitted discretion.
-
Interest and Fees
: After giving effect to the amendment to the prior ABL Facility on November 12, 2013 (described below), interest on outstanding borrowings was payable at a rate per annum equal to the reserve adjusted LIBOR rate (which is the greater of the adjusted
LIBOR
rate and
1.50%
) or the “
ABR Rate
” (which was the greatest of the applicable
prime rate
, the
federal funds rate
plus
0.5%
, and the LIBOR rate plus
1.0%
) plus an applicable margin, which, for loans under the Term A Facility were equal to
7.50%
for LIBOR rate advances and
6.50%
for ABR Rate advances, and for loans under the Term B Facility were equal to
10.25%
for LIBOR rate advances and
9.25%
for ABR Rate advances. We were required to pay a commitment fee equal to
7.50%
per annum on the average daily unused portion of the commitment in respect of the Term A Facility.
Pursuant to the terms of the Prior ABL Facility, we were required to deposit an aggregate amount equal to
$90.0 million
into escrow accounts to secure our obligations under the Prior ABL Facility, which amounts we expected to remain in escrow for the term of the Prior ABL Facility; this amount is included in “Restricted amounts held in escrow,” a current asset on the Consolidated Balance Sheet, which includes accrued interest.
71
Series A Convertible Senior Secured Notes
On July 22, 2011, we issued
$140.0 million
in aggregate principal of our Series A Notes that bore interest at a stated rate of
10%
per year and was set to mature on March 31, 2015. Interest was payable on a semiannual basis in arrears only in-kind through the issuance of additional Series A Notes. As discussed in the “2014 Financing Transactions” footnote, on February 13, 2014, the Company deposited approximately
$89.6 million
(including accrued interest) with the trustee in order to fund the redemption of the remaining Series A Notes, thereby discharging the indenture governing the Series A Notes. The Company used the cash deposited with the trustee to redeem its Series A Notes on August 5, 2014. There were no conversions at any time of our Series A Notes.
6% Convertible Senior Notes
On February 11, 2010, we entered into a note purchase agreement with certain investors pursuant to which such investors agreed, subject to the terms and conditions set forth therein, to purchase up to
$70 million
of our 6% Notes. The outstanding 6% Notes were paid at maturity on February 15, 2014. These
6%
Notes bore interest at
6%
which was payable on February 15 and August 15 of each year. There were no conversions of our 6% Notes.
Total Debt Outstanding
|
As of December 31, 2014 (in millions)
|
Par Value
|
Discount
|
Book
Value
|
Stated
Interest Rate
|
Effective
Interest Rate
|
||||||||||||
|
Term Loan
|
$
|
693.0
|
|
$
|
(5.7
|
)
|
$
|
687.3
|
|
8.25
|
%
|
8.45
|
%
|
||||
|
ABL Facility
(a)
|
—
|
|
—
|
|
—
|
|
N/A
|
|
N/A
|
|
|||||||
|
Series B Notes
|
17.7
|
|
(0.6
|
)
|
17.1
|
|
10.0
|
%
|
25.6
|
%
|
|||||||
|
Secured Second A&R CDA
|
47.0
|
|
—
|
|
47.0
|
|
3.3-18.3%
|
|
7.3
|
%
|
|||||||
|
Unsecured Second A&R CDA
|
73.2
|
|
—
|
|
73.2
|
|
3.3-18.3%
|
|
7.3
|
%
|
|||||||
|
Lease financing obligations
|
285.1
|
|
—
|
|
285.1
|
|
10.0-18.2%
|
|
12.0
|
%
|
|||||||
|
Other
|
0.2
|
|
—
|
|
0.2
|
|
|||||||||||
|
Total debt
|
$
|
1,116.2
|
|
$
|
(6.3
|
)
|
$
|
1,109.9
|
|
||||||||
|
Current maturities of Term Loan
|
$
|
(7.0
|
)
|
$
|
—
|
|
$
|
(7.0
|
)
|
||||||||
|
Current maturities of Series B Notes
|
(17.7
|
)
|
0.6
|
|
(17.1
|
)
|
|||||||||||
|
Current maturities of lease financing obligations
|
(6.8
|
)
|
—
|
|
(6.8
|
)
|
|||||||||||
|
Current maturities of other
|
(0.2
|
)
|
—
|
|
(0.2
|
)
|
|||||||||||
|
Long-term debt
|
$
|
1,084.5
|
|
$
|
(5.7
|
)
|
$
|
1,078.8
|
|
||||||||
|
(a)
|
As of
December 31, 2014
, the borrowing base and availability on our ABL Facility were
$445.5 million
and
$71.2 million
, respectively. The availability is calculated in accordance with the terms of the ABL Facility and is derived by reducing the borrowing base by our
$374.3 million
of outstanding letters of credit as of
December 31, 2014
. The amount which is actually able to be drawn is limited by certain financial covenants in the ABL Facility to
$27.1 million
.
|
72
|
As of December 31, 2013 (in millions)
|
Par Value
|
Premium/
(Discount)
|
Book
Value
|
Stated
Interest Rate
|
Effective
Interest Rate
|
||||||||||||
|
Prior Term Loan
|
$
|
298.1
|
|
$
|
37.7
|
|
$
|
335.8
|
|
10.00
|
%
|
—
|
%
|
||||
|
Term A Facility (capacity $175.0, borrowing base $156.5, availability $51.5)*
|
105.0
|
|
(2.1
|
)
|
102.9
|
|
8.50
|
%
|
15.8
|
%
|
|||||||
|
Term B Facility (capacity $219.9, borrowing base $219.9, availability $0.0)
|
219.9
|
|
(3.9
|
)
|
216.0
|
|
11.25
|
%
|
15.0
|
%
|
|||||||
|
Series A Notes
|
177.8
|
|
(17.8
|
)
|
160.0
|
|
10.00
|
%
|
18.3
|
%
|
|||||||
|
Series B Notes
|
69.2
|
|
(10.5
|
)
|
58.7
|
|
10.00
|
%
|
25.6
|
%
|
|||||||
|
6% Notes
|
69.4
|
|
(1.1
|
)
|
68.3
|
|
6.00
|
%
|
15.5
|
%
|
|||||||
|
A&R CDA
|
124.2
|
|
(0.2
|
)
|
124.0
|
|
3.25-18.25%
|
|
7.3
|
%
|
|||||||
|
Lease financing obligations
|
297.5
|
|
—
|
|
297.5
|
|
10.0-18.2%
|
|
11.9
|
%
|
|||||||
|
Other
|
0.2
|
|
—
|
|
0.2
|
|
|||||||||||
|
Total debt
|
$
|
1,361.3
|
|
$
|
2.1
|
|
$
|
1,363.4
|
|
||||||||
|
Current maturities of lease financing obligations
|
(8.4
|
)
|
—
|
|
(8.4
|
)
|
|||||||||||
|
Current maturities of other
|
(0.2
|
)
|
—
|
|
(0.2
|
)
|
|||||||||||
|
Long-term debt
|
$
|
1,352.7
|
|
$
|
2.1
|
|
$
|
1,354.8
|
|
||||||||
*The effective interest rate on the Term A Facility is calculated based upon the capacity of the facility and not the par value.
Conversions
As of
December 31, 2014
, there was
$17.7 million
in aggregate principal amount of Series B Notes outstanding that was convertible into approximately
982,000
shares of our common stock (after taking into account the make whole premium). As of
December 31, 2014
, the effective conversion price and conversion rate for Series B Notes (after taking into account the make whole premium) was
$17.6462
and
56.6695
common shares per
$1,000
of Series B Notes, respectively.
As discussed in the “2014 Financing Transactions” footnote, on January 31, 2014, certain holders of our Series B Notes exchanged their outstanding balances as part of an exchange agreement. Not including the exchanges made as part of our 2014 Financing Transactions, during the year ended
December 31, 2014
,
$1.2 million
of aggregate principal amount of Series B Notes converted into
75,900
shares of our common stock. Upon conversion, we recorded
$0.4 million
of additional interest expense representing the
$0.2 million
make whole premium and
$0.2 million
of accelerated amortization of the discount on Series B Notes converted. There were no conversions of our Series B Notes from
December 31, 2014
through
February 13, 2015
.
Maturities
The principal maturities over the next five years and thereafter of total debt as of December 31, 2014 was as follows:
|
(in millions) |
Term Loan
|
ABL Facility
|
Second A&R CDA
|
Series B
Notes
(a)
|
Lease Financing Obligations
(b)
|
Other
|
Total
|
||||||||||||||
|
2015
|
$
|
7.0
|
|
$
|
—
|
|
$
|
—
|
|
$
|
17.7
|
|
$
|
6.8
|
|
$
|
—
|
|
$
|
31.5
|
|
|
2016
|
7.0
|
|
—
|
|
—
|
|
—
|
|
8.1
|
|
—
|
|
15.1
|
|
|||||||
|
2017
|
7.0
|
|
—
|
|
—
|
|
—
|
|
9.6
|
|
—
|
|
16.6
|
|
|||||||
|
2018
|
7.0
|
|
—
|
|
—
|
|
—
|
|
11.1
|
|
0.2
|
|
18.3
|
|
|||||||
|
2019
|
665.0
|
|
—
|
|
120.2
|
|
—
|
|
6.4
|
|
—
|
|
791.6
|
|
|||||||
|
Thereafter
|
—
|
|
—
|
|
—
|
|
—
|
|
243.1
|
|
—
|
|
243.1
|
|
|||||||
|
Total
|
$
|
693.0
|
|
$
|
—
|
|
$
|
120.2
|
|
$
|
17.7
|
|
$
|
285.1
|
|
$
|
0.2
|
|
$
|
1,116.2
|
|
|
(a)
|
The Series B Notes exclude
$0.4 million
of in-kind interest payments that will be payable when the notes are redeemed.
|
|
(b)
|
Lease financing obligations subsequent to 2018 of
$243.1 million
represent principal cash obligations of
$15.3 million
and the estimated net book value of the underlying assets at the expiration of their associated lease agreements of
$227.8 million
.
|
73
Fair Value Measurement
The book value and estimated fair values of our long-term debt, including current maturities and other financial instruments, are summarized as follows:
|
|
December 31, 2014
|
December 31, 2013
|
|||||||||||||
|
(in millions)
|
Book Value
|
Fair Value
|
Book Value
|
Fair Value
|
|||||||||||
|
Term Loan
|
$
|
687.3
|
|
$
|
685.4
|
|
$
|
—
|
|
$
|
—
|
|
|||
|
Prior Term Loan
|
—
|
|
—
|
|
335.8
|
|
289.2
|
|
|||||||
|
Prior ABL Facility
|
—
|
|
—
|
|
318.9
|
|
326.1
|
|
|||||||
|
Series A Notes and Series B Notes
|
17.1
|
|
17.7
|
|
218.7
|
|
225.8
|
|
|||||||
|
Lease financing obligations
|
285.1
|
|
282.2
|
|
297.5
|
|
297.5
|
|
|||||||
|
Other
|
120.4
|
|
119.1
|
|
192.5
|
|
179.8
|
|
|||||||
|
Total debt
|
$
|
1,109.9
|
|
$
|
1,104.4
|
|
$
|
1,363.4
|
|
$
|
1,318.4
|
|
|||
The fair values of the Term Loan, ABL Facility, Prior Term Loan, the Prior ABL Facility, Series A Notes, Series B Notes,
6%
Notes (included in “Other” above), Secured and Unsecured A&R CDA (included in “Other” above), and A&R CDA (included in “Other “ above) were estimated based on observable prices (level two inputs for fair value measurements). The fair value of the lease financing obligations is estimated using a publicly traded secured loan with similar characteristics (level three input for fair value measurement).
9. Liquidity
For a description of our outstanding debt as of
December 31, 2014
, please refer to the “Debt and Financing” footnote to our consolidated financial statements.
Credit Facility Covenants
On February 13, 2014, we completed our 2014 Financing Transactions and refinanced the debt associated with our prior credit facilities. We entered into a Term Loan credit agreement with new financial covenants that, among other things, restricts certain capital expenditures and requires us to maintain a maximum total leverage ratio (defined as Consolidated Total Debt divided by Consolidated Adjusted EBITDA as defined below).
On September 25, 2014, the Company entered into the Credit Agreement Amendment which, among other things, adjusted the maximum permitted total leverage ratio through December 31, 2016 and increased the applicable interest rate over the same period.
The Credit Agreement Amendment resets the total maximum leverage ratio covenants as follows:
|
Four Consecutive Fiscal Quarters Ending
|
Maximum Total
Leverage Ratio
|
Four Consecutive Fiscal Quarters Ending
|
Maximum Total
Leverage Ratio
|
|
|
December 31, 2014
|
5.25 to 1.00
|
September 30, 2016
|
3.75 to 1.00
|
|
|
March 31, 2015
|
5.00 to 1.00
|
December 31, 2016
|
3.50 to 1.00
|
|
|
June 30, 2015
|
4.75 to 1.00
|
March 31, 2017
|
3.25 to 1.00
|
|
|
September 30, 2015
|
4.50 to 1.00
|
June 30, 2017
|
3.25 to 1.00
|
|
|
December 31, 2015
|
4.25 to 1.00
|
September 30, 2017
|
3.25 to 1.00
|
|
|
March 31, 2016
|
4.00 to 1.00
|
December 31, 2017 and thereafter
|
3.00 to 1.00
|
|
|
June 30, 2016
|
3.75 to 1.00
|
|||
Upon effectiveness of the Credit Agreement Amendment, each consenting lender received a fee equal to
0.25%
of their outstanding exposure, resulting in
$1.7 million
of fees paid in 2014. These fees have been included in ‘Other Assets’ on the consolidated balance sheet and will be amortized over the remaining life of the Term Loan.
74
Consolidated Adjusted EBITDA, defined in our Credit Agreement Amendment as “Consolidated EBITDA,” is a measure that reflects our earnings before interest, taxes, depreciation, and amortization expense, and is further adjusted for, among other things, letter of credit fees, equity-based compensation expense, net gains or losses on property disposals and certain other items, including restructuring professional fees, expenses associated with certain lump sum payments to our IBT employees and the results of permitted dispositions and discontinued operations. Consolidated Total Debt, as defined in our Credit Agreement Amendment, is the aggregate principal amount of indebtedness outstanding. Our total leverage ratio for the year ending
December 31, 2014
was
4.57
to 1.00.
In the event that we fail to comply with any Term Loan covenant or any ABL Facility covenant, we would be considered in default, which would enable applicable lenders to accelerate the repayment of amounts outstanding, require the cash collateralization of letters of credit (in the case of the ABL Facility) and exercise remedies with respect to collateral and we would need to seek an amendment or waiver from the applicable lender groups. In the event that our lenders under our Term Loan or ABL Facility demand payment or cash collateralization (in the case of the ABL Facility), we will not have sufficient cash to repay such indebtedness. In addition, a default under our Term Loan or ABL Facility or the applicable lenders exercising their remedies thereunder could trigger cross-default provisions in our other indebtedness and certain other operating agreements. Our ability to amend our Term Loan or our ABL Facility or otherwise obtain waivers from the applicable lenders depends on matters that are outside of our control and there can be no assurance that we will be successful in that regard.
Risk and Uncertainties Regarding Future Liquidity
Our principal sources of liquidity are cash and cash equivalents, available borrowings under our ABL Facility and any prospective net operating cash flows from operations. As of
December 31, 2014
, we had cash and cash equivalents and amounts able to be drawn on our ABL Facility totaling
$198.2 million
. The amount which is actually able to be drawn on our ABL Facility is limited by certain financial covenants in the ABL Facility.
Our principal uses of cash are to fund our operations, including making contributions to our single-employer pension plans and our multi-employer pension funds, and to meet our other cash obligations including, but not limited to, paying cash interest and principal on our funded debt, payments on our equipment leases, letter of credit fees under our credit facilities and funding capital expenditures.
Our ABL Facility credit agreement, among other things, restricts certain capital expenditures and requires that the Company, in effect, maintain availability of at least
10%
of the lesser of the aggregate amount of commitments from all lenders or the borrowing base.
We have a considerable amount of indebtedness. As of
December 31, 2014
, we had
$1,116.2 million
in aggregate par value of outstanding indebtedness, the majority of which matures in 2019. We also have a considerable amount of future funding obligations for our single-employer pension plans and the multi-employer pension funds. We expect our funding obligations for
2015
for our single-employer pension plans and multi-employer pension funds will be
$60.3 million
and
$91.6 million
, respectively. In addition, we also have, and will continue to have, substantial operating lease obligations. As of
December 31, 2014
, our operating lease obligations for
2015
are
$63.6 million
. As of
December 31, 2014
, our operating lease obligations through 2025 totaled
$194.5 million
and is expected to increase as we lease additional revenue equipment.
Our capital expenditures for the years ended
December 31, 2014
and
2013
were
$69.2 million
and
$66.9 million
, respectively. These amounts were principally used to fund replacement engines and trailer refurbishments for our revenue fleet, capitalized costs for our network facilities and technology infrastructure. Additionally, for the
year ended December 31, 2014
, we entered into new operating lease commitments for revenue equipment totaling
$65.0 million
, with such payments to be made over the average lease term of
5 years
. In light of our operating results over the past few years and our liquidity needs, we have deferred certain capital expenditures and expect to continue to do so in the future. As a result, the average age of our fleet is increasing, which may affect our maintenance costs and operational efficiency unless we are able to obtain suitable lease financing to meet our replacement equipment needs.
We believe that our results of operations will provide sufficient liquidity to fund our operations and meet the covenants under our Term Loan for at least the next twelve months.
75
Our ability to satisfy our liquidity needs and meet future stepped-up covenants beyond the next twelve months is primarily dependent on improving our profitability. Improvements to our profitability primarily include continued successful implementation and realization of productivity and efficiency initiatives including those identified in the modified labor agreement as well as pricing and safety improvements. Some of these are outside of our control.
In the event our operating results indicate we will not meet our maximum total leverage ratio, we will take action to improve our maximum total leverage ratio which will include paying down our outstanding indebtedness with either cash on hand or with cash proceeds from equity issuances. The issuance of equity is outside of our control and there can be no assurance that we will be able to issue additional equity at terms that are agreeable to us or that we would have sufficient cash on hand to meet the maximum total leverage ratio.
10. Stock Compensation Plans
We reserved
5.0 million
shares for issuance to key management personnel and directors under the 2011 amended and restated long-term incentive and equity award plan. As of
December 31, 2014
,
3.1 million
shares remain available for issuance under this plan. The plan permits the issuance of restricted stock and share units, as well as options, stock appreciation rights, and performance stock and performance stock unit awards. Awards under the plan can be satisfied in cash or shares at the discretion of the Board of Directors. According to the plan provisions, the share units provide the holders the right to receive one share of our Common Stock upon vesting of one share unit. The plan requires the exercise price of any option granted to equal the closing market price of our Common Stock on the date of grant.
Stock Options
On March 1, 2010, we formalized the Second Union Employee Option Plan that provided for a grant of up to
31,000
options, including the effect of the reverse stock split, to purchase our Common Stock at an exercise price equal to
$3,600.00
per share, of which all have been granted. As a part of the union wage reduction, we agreed to award a certain equity interest to all effected union employees. These options vested immediately, will expire
10
years from the grant date, and were exercisable upon shareholder approval, which was received on June 29, 2010, at our annual shareholder meeting. There has been no activity in these stock options for the
years ended December 31, 2014, 2013 and 2012
.
The following table summarizes information about stock options outstanding as of
December 31, 2014
:
|
Options Outstanding
|
Options Exercisable
|
|||||||||||||||
|
Shares
|
Weighted Average Remaining Contractual
|
Weighted Average
|
Aggregate
|
Shares
|
Weighted Average
|
Aggregate
|
||||||||||
|
Range of exercise prices
|
(in thousands)
|
Term (in years)
|
Exercise price
|
Intrinsic Value
|
(in thousands)
|
Exercise price
|
Intrinsic Value
|
|||||||||
|
$3,600 - $325,950
|
33
|
5.17
|
$
|
3,661.03
|
|
$
|
—
|
|
33
|
|
$
|
3,661.03
|
|
$
|
—
|
|
Restricted Stock
A summary of the activity of our nonvested restricted stock and share unit awards is presented in the following table:
76
|
Shares
(in thousands)
|
Weighted Average
Grant-Date Fair Value
|
||||
|
Unvested at December 31, 2011
|
270
|
|
11.60
|
|
|
|
Granted
|
586
|
|
$
|
11.34
|
|
|
Vested
|
(21
|
)
|
8.85
|
|
|
|
Forfeited
|
(83
|
)
|
11.63
|
|
|
|
Unvested at December 31, 2012
|
752
|
|
$
|
11.47
|
|
|
Granted
|
429
|
|
6.24
|
|
|
|
Vested
|
(405
|
)
|
10.27
|
|
|
|
Forfeited
|
(118
|
)
|
10.54
|
|
|
|
Unvested at December 31, 2013
|
658
|
|
$
|
8.96
|
|
|
Granted
|
975
|
|
15.83
|
|
|
|
Vested
|
(564
|
)
|
13.33
|
|
|
|
Forfeited
|
(26
|
)
|
15.38
|
|
|
|
Unvested at December 31, 2014
|
1,043
|
|
$
|
12.86
|
|
The intrinsic value of unvested shares as of December 31, 2014 was
$23.5 million
. We recognize expense on a straight-line basis over the vesting term. The vesting provisions for the restricted stock and share unit awards and the related number of shares granted during the year ended December 31 are as follows:
|
Shares (in thousands)
|
||||||
|
Vesting Terms
|
2014
|
2013
|
2012
|
|||
|
50% immediately and 50% on the 1 year anniversary of the grant date
|
456
|
|
187
|
|
—
|
|
|
50% on the 1 year anniversary of the grant date and 50% on the 2 year anniversary of the grant date
|
—
|
|
150
|
|
—
|
|
|
25% per year for four years
|
39
|
|
56
|
|
501
|
|
|
25% immediately and 25% on each employment anniversary thereafter
|
—
|
|
18
|
|
—
|
|
|
100% immediately
|
21
|
|
5
|
|
—
|
|
|
100% on February 20, 2013
|
—
|
|
—
|
|
72
|
|
|
33.3% immediately and 33.3% per year thereafter on the
anniversary of the grant date |
—
|
|
13
|
|
13
|
|
|
20% on February 28, 2015, 60% on July 31, 2015 and 20% on February 28, 2016
|
459
|
|
—
|
|
—
|
|
|
Total restricted stock and share units granted
|
975
|
|
429
|
|
586
|
|
As of December 31, 2014 and 2013
, there was
$5.1 million
and
$4.8 million
, respectively, of unrecognized compensation expense related to nonvested share-based compensation arrangements. That expense is expected to be recognized over a weighted-average period of
1.1
years. The fair value of nonvested shares is determined based on the closing trading price of our shares on the grant date. The fair value of shares vested during the year ended December 31, 2014 was
$12.2 million
. The fair value of shares vested during the years ended December 31, 2013 and 2012 was not significant.
The outstanding awards under our stock compensation plans provide dividend participation features and are considered participating securities in our earnings per share calculation.
11. Income Taxes
We use the asset and liability method to reflect income taxes on our financial statements, pursuant to ASC 740, “Income Taxes
”
(“ASC 740”). We recognize deferred tax assets and liabilities by applying enacted tax rates to the differences between the carrying value of existing assets and liabilities and their respective tax basis and to loss carryforwards. Tax credit carryforwards are recorded as deferred tax assets. The effect on deferred tax assets and liabilities of a change in tax rates is recognized in income in the period that the change occurs. We assess the validity of deferred tax assets and loss and tax credit carryforwards and provide
77
valuation allowances when we determine it is more likely than not that such assets, losses, or credits will not be realized. We have not recognized deferred taxes relative to foreign subsidiaries’ earnings that are deemed to be permanently reinvested. Any related taxes associated with such earnings are not material.
Deferred tax liabilities (assets) were comprised of the following at
December 31
:
|
(in millions)
|
2014
|
2013
|
||||
|
Depreciation
|
$
|
259.6
|
|
$
|
295.2
|
|
|
Deferred revenue
|
14.7
|
|
17.2
|
|
||
|
Intangibles
|
22.3
|
|
29.5
|
|
||
|
Gain on debt redemption
|
51.3
|
|
64.3
|
|
||
|
Other
|
87.0
|
|
54.7
|
|
||
|
Deferred tax liabilities
|
434.9
|
|
460.9
|
|
||
|
Claims and insurance
|
(168.8
|
)
|
(169.2
|
)
|
||
|
Net operating loss carryforwards
|
(316.4
|
)
|
(329.1
|
)
|
||
|
Employee benefit accruals
|
(273.8
|
)
|
(237.9
|
)
|
||
|
Other
|
(169.0
|
)
|
(176.7
|
)
|
||
|
Deferred tax assets
|
(928.0
|
)
|
(912.9
|
)
|
||
|
Valuation allowance
|
494.5
|
|
454.1
|
|
||
|
Net deferred tax assets
|
(433.5
|
)
|
(458.8
|
)
|
||
|
Net deferred tax liability
|
$
|
1.4
|
|
$
|
2.1
|
|
The net deferred tax liability of
$1.4 million
and
$2.1 million
as of
December 31, 2014
and
2013
, respectively, is included as separate line items in the accompanying balance sheets. Current income tax receivable was
$4.5 million
and
$20.1 million
as of December 31, 2014 and 2013
, respectively, and is included in “Prepaid expenses and other” in the accompanying balance sheets.
The Company has carried back the 2014 federal taxable loss to the extent allowed and expects refunds of
$7.6 million
. As of
December 31, 2014
, the Company has remaining federal Net Operating Loss carryforwards of approximately
$697.5 million
, of which, an estimated
$234.7 million
will not be utilized due to limitations imposed by the Internal Revenue Code regarding the use of tax attributes following deemed ownership changes that occurred in July, 2011, in July, 2013 and in January, 2014. These carryforwards expire between 2028 and 2034 if not used. As of
December 31, 2014
, the Company has foreign tax credit and other credit carryforwards of approximately
$13.5 million
, none of which will likely be utilized due to the Internal Revenue Code limitations described above, and which will expire between 2015 and 2018 if not used.
As of December 31, 2014 and 2013
, a valuation allowance of
$494.5 million
and
$454.1 million
has been established for deferred tax assets because, based on available sources of future taxable income, it is more likely than not that those assets will not be realized.
A reconciliation between income taxes at the federal statutory rate and the consolidated effective tax rate follows:
|
|
2014
|
2013
|
2012
|
|||
|
Federal statutory rate
|
35.0
|
%
|
35.0
|
%
|
35.0
|
%
|
|
State income taxes, net
|
(4.9
|
)%
|
(2.4
|
)%
|
(1.8
|
)%
|
|
Foreign tax rate differential
|
1.4
|
%
|
(0.1
|
)%
|
2.6
|
%
|
|
Permanent differences
|
(6.4
|
)%
|
2.0
|
%
|
8.6
|
%
|
|
Valuation allowance
|
(31.9
|
)%
|
(30.9
|
)%
|
(39.8
|
)%
|
|
Benefit from intraperiod tax allocation under ASC 740
|
—
|
%
|
32.2
|
%
|
—
|
%
|
|
Net (increase) decrease in unrecognized tax benefits
|
17.8
|
%
|
0.6
|
%
|
(1.7
|
)%
|
|
Benefit from settlement of Tax Court litigation
|
1.6
|
%
|
—
|
%
|
6.4
|
%
|
|
Other, net (including prior year return to provision)
|
6.6
|
%
|
(1.0
|
)%
|
0.6
|
%
|
|
Effective tax rate
|
19.2
|
%
|
35.4
|
%
|
9.9
|
%
|
78
The income tax provision (benefit) consisted of the following:
|
(in millions)
|
2014
|
2013
|
2012
|
||||||
|
Current:
|
|||||||||
|
Federal
|
$
|
(23.6
|
)
|
$
|
(14.5
|
)
|
$
|
(24.0
|
)
|
|
State
|
3.7
|
|
1.4
|
|
2.5
|
|
|||
|
Foreign
|
4.0
|
|
9.6
|
|
2.7
|
|
|||
|
Current income tax benefit
|
$
|
(15.9
|
)
|
$
|
(3.5
|
)
|
$
|
(18.8
|
)
|
|
Deferred:
|
|||||||||
|
Federal
|
$
|
—
|
|
$
|
(41.7
|
)
|
$
|
5.5
|
|
|
State
|
—
|
|
—
|
|
0.5
|
|
|||
|
Foreign
|
(0.2
|
)
|
(0.7
|
)
|
(2.2
|
)
|
|||
|
Deferred income tax provision (benefit)
|
$
|
(0.2
|
)
|
$
|
(42.4
|
)
|
$
|
3.8
|
|
|
Income tax benefit
|
$
|
(16.1
|
)
|
$
|
(45.9
|
)
|
$
|
(15.0
|
)
|
|
|
|||||||||
|
Based on the income (loss) before income taxes:
|
|||||||||
|
Domestic
|
$
|
(106.2
|
)
|
$
|
(152.8
|
)
|
$
|
(173.8
|
)
|
|
Foreign
|
22.4
|
|
23.3
|
|
22.3
|
|
|||
|
Loss before income taxes
|
$
|
(83.8
|
)
|
$
|
(129.5
|
)
|
$
|
(151.5
|
)
|
During 2013, the Company recognized
$41.7 million
of deferred benefit in the Statement of Consolidated Operations and an equal and offsetting deferred tax expense in other comprehensive income included in the Statement of Consolidated Comprehensive Loss due to the application of intraperiod tax allocation rules under ASC 740. This allocation has no effect on total tax provision or total valuation allowance.
YRC Worldwide Inc. applies the intraperiod tax allocation rules of ASC 740 to allocate income taxes among continuing operations, discontinued operations, extraordinary items, other comprehensive income (loss), and additional paid-in capital when it meets the criteria as prescribed in the rule.
Uncertain Tax Positions
A rollforward of the total amount of unrecognized tax benefits for the years ended December 31 is as follows:
|
(in millions)
|
2014
|
2013
|
|||||
|
Unrecognized tax benefits at January 1
|
$
|
27.6
|
|
$
|
29.7
|
|
|
|
Increases related to:
|
|||||||
|
Tax positions taken during a prior period
|
11.6
|
|
1.3
|
|
|||
|
Tax positions taken during the current period
|
0.5
|
|
0.9
|
|
|||
|
Decreases related to:
|
|||||||
|
Tax positions taken during a prior period
|
(5.6
|
)
|
—
|
|
|||
|
Lapse of applicable statute of limitations
|
(9.9
|
)
|
(1.2
|
)
|
|||
|
Settlements with taxing authorities
|
(1.1
|
)
|
(3.1
|
)
|
|||
|
Unrecognized tax benefits at December 31
|
$
|
23.1
|
|
$
|
27.6
|
|
|
At December 31, 2014 and 2013
, there are
$11.6 million
and
$27.6 million
of benefits that, if recognized, would affect the effective tax rate. We accrued interest of
$1.1 million
and
$1.4 million
for the
years ended December 31, 2014 and 2013
and reversed
$11.2
79
million
and
$2.6 million
of previously accrued interest on uncertain tax positions during the
years ended December 31, 2014 and 2013
for a net reduction of
$10.1 million
and
$1.2 million
for 2014 and 2013. The reversal related primarily to settlements and other favorable resolution of prior uncertain positions. The total amount of interest accrued for uncertain tax positions is
$4.4 million
and
$14.5 million
as of
as of December 31, 2014 and 2013
. During the year ended
December 31, 2014
, we paid tax of
$1.6 million
and interest of
$7.8 million
to settle certain state and foreign audits of tax years 2001-08 for certain of our subsidiaries and we reduced our previously recorded liability for unrecognized tax benefits accordingly. We have not accrued any penalties relative to uncertain tax positions. We have elected to treat interest and penalties on uncertain tax positions as interest expense and other operating expenses, respectively.
It is reasonably possible that the existing unrecognized tax benefits may decrease over the next twelve months by as much as
$5.9 million
as a result of developments in examinations and/or litigation, or from the expiration of statutes of limitation.
Tax years that remain subject to examination for our major tax jurisdictions as of
December 31, 2014
:
|
Statute remains open
|
2005-2012
|
|
|
Tax years currently under examination/exam completed
|
2005-2012
|
|
|
Tax years not examined
|
2013-2014
|
|
12. Business Segments
We report financial and descriptive information about our reportable operating segments on a basis consistent with that used internally for evaluating segment performance and allocating resources to segments. We evaluate performance primarily on operating income and return on invested capital.
Effective April 1, 2010 until its deconsolidation in the first quarter of 2012, the results of Jiayu are reflected in our consolidated results as part of the Corporate Segment.
We charge management fees and other corporate services to our segments based upon usage or on an overhead allocation basis. Corporate and other operating losses represent operating expenses of the holding company, including compensation and benefits and professional services for all periods presented. Corporate identifiable assets primarily refer to cash, cash equivalents, restricted cash and deferred debt issuance costs as well as our investment in JHJ. Intersegment revenue relates to transportation services between our segments.
Revenue from foreign sources totaled
$137.5 million
,
$139.5 million
, and
$158.3 million
in 2014, 2013 and 2012
, respectively, and is mainly derived from Canada and, to a lesser extent, Mexico. Long-lived assets located in foreign countries totaled
$8.7 million
,
$12.4 million
and
$14.7 million
at
December 31, 2014, 2013, and 2012
, respectively.
80
The following table summarizes our operations by business segment:
|
(in millions)
|
YRC Freight
|
Regional Transportation
|
Corporate/Eliminations
|
Consolidated
|
|||||||||||
|
2014
|
|||||||||||||||
|
External revenue
|
$
|
3,237.4
|
|
$
|
1,831.4
|
|
$
|
—
|
|
$
|
5,068.8
|
|
|||
|
Intersegment revenue
|
—
|
|
—
|
|
—
|
|
—
|
|
|||||||
|
Operating income (loss)
|
0.5
|
|
66.1
|
|
(21.1
|
)
|
45.5
|
|
|||||||
|
Identifiable Assets
|
1,462.1
|
|
685.7
|
|
(162.8
|
)
|
1,985.0
|
|
|||||||
|
Acquisition of property and equipment
|
(37.0
|
)
|
(32.2
|
)
|
—
|
|
(69.2
|
)
|
|||||||
|
Proceeds from disposal of property and equipment
|
23.2
|
|
(2.4
|
)
|
—
|
|
20.8
|
|
|||||||
|
Depreciation and amortization
|
98.0
|
|
65.8
|
|
(0.2
|
)
|
163.6
|
|
|||||||
|
2013
|
|||||||||||||||
|
External revenue
|
$
|
3,136.8
|
|
$
|
1,728.6
|
|
$
|
—
|
|
$
|
4,865.4
|
|
|||
|
Intersegment revenue
|
—
|
|
—
|
|
—
|
|
—
|
|
|||||||
|
Operating income (loss)
|
(31.2
|
)
|
79.9
|
|
(20.3
|
)
|
28.4
|
|
|||||||
|
Identifiable Assets
|
1,513.4
|
|
698.4
|
|
(146.9
|
)
|
2,064.9
|
|
|||||||
|
Acquisition of property and equipment
|
(43.4
|
)
|
(23.3
|
)
|
(0.2
|
)
|
(66.9
|
)
|
|||||||
|
Proceeds from disposal of property and equipment
|
6.7
|
|
3.0
|
|
0.1
|
|
9.8
|
|
|||||||
|
Depreciation and amortization
|
109.1
|
|
63.1
|
|
0.1
|
|
172.3
|
|
|||||||
|
2012
|
|||||||||||||||
|
External revenue
|
$
|
3,206.9
|
|
$
|
1,640.4
|
|
$
|
3.2
|
|
$
|
4,850.5
|
|
|||
|
Intersegment revenue
|
—
|
|
0.2
|
|
(0.2
|
)
|
—
|
|
|||||||
|
Operating income (loss)
|
(37.3
|
)
|
70.0
|
|
(8.6
|
)
|
24.1
|
|
|||||||
|
Identifiable Assets
|
1,315.4
|
|
745.5
|
|
164.6
|
|
2,225.5
|
|
|||||||
|
Acquisition of property and equipment
|
(47.2
|
)
|
(19.0
|
)
|
(0.2
|
)
|
(66.4
|
)
|
|||||||
|
Proceeds from disposal of property and equipment
|
54.1
|
|
(0.2
|
)
|
(3.5
|
)
|
50.4
|
|
|||||||
|
Depreciation and amortization
|
119.8
|
|
63.3
|
|
0.7
|
|
183.8
|
|
|||||||
|
Equity investment impairment
|
—
|
|
—
|
|
30.8
|
|
30.8
|
|
|||||||
13. Shareholders’ Deficit
As discussed in the “2014 Financing Transactions” footnote, on January 31, 2014, we issued
14,333,334
shares of our Common Stock and
583,334
shares of our Convertible Preferred Stock pursuant to the Stock Purchase Agreements, for an aggregate
$250.0 million
in cash. On March 14, 2014, the Company held a special meeting of stockholders at which our stockholders approved amending our Certificate of Incorporation to increase the number of authorized shares of Common Stock to 95.0 million and to allow an investor involved in the 2014 Financing Transactions to own more than
19.99%
of outstanding Common Stock. Upon approval of these amendments, each outstanding share of Convertible Preferred Stock automatically converted into four shares of Common Stock and the Company recorded
$18.1 million
related to the amortization of the beneficial conversion feature on preferred stock on the statements of consolidated comprehensive income (loss).
The Company designated
one
of the authorized shares of preferred stock as its Series A Voting Preferred Stock. The Series A Voting Preferred Stock has a
$1
liquidation value and entitles the holder to elect two directors to the Company’s Board of Directors. The
one
share of Series A Voting Preferred Stock was issued to the IBT on July 22, 2011 in connection with the restructuring. The Series A Voting Preferred Stock was recorded at its liquidation value.
The following reflects the activity in the shares of our preferred and common stock for the years ended December 31:
81
|
Preferred Shares
|
Common Shares
|
||||||||||||
|
2014
|
2013
|
2012
|
2014
|
2013
|
|
2012
|
|
||||||
|
Beginning balance
|
—
|
|
—
|
|
—
|
|
10,173
|
|
7,976
|
|
6,847
|
|
|
|
Issuance of Common Shares
|
—
|
|
—
|
|
—
|
|
14,333
|
|
|||||
|
Issuance of Convertible Preferred Shares
|
583
|
|
—
|
|
—
|
|
—
|
|
—
|
|
—
|
|
|
|
Conversion of Preferred Shares to Common Shares
|
(583
|
)
|
—
|
|
—
|
|
2,333
|
|
—
|
|
—
|
|
|
|
Issuance of equity in exchange for debt
|
—
|
|
—
|
|
—
|
|
3,471
|
|
1,929
|
|
1,112
|
|
|
|
Issuance of equity awards, net
|
—
|
|
—
|
|
—
|
|
357
|
|
268
|
|
17
|
|
|
|
Ending balance
|
—
|
|
—
|
|
—
|
|
30,667
|
|
10,173
|
|
7,976
|
|
|
Our amended and restated credit agreement in place as of
December 31, 2014
, restricts the ability of YRC Worldwide to declare dividends on its outstanding capital stock.
14. Loss Per Share
We present both basic and diluted EPS amounts. Basic EPS is calculated by dividing net loss by the weighted average number of common shares outstanding during the year. We calculate earnings per share using the two class method where unvested share-based payment awards that contain non-forfeitable rights to dividends or dividend equivalents (whether paid or unpaid) are considered participating securities and shall be included in the computation of earnings per share. The two-class method is an earnings allocation formula that treats a participating security as having rights to earnings that would otherwise have been available to common shareholders.
In periods with net income, diluted EPS is based upon the weighted average number of common and common equivalent shares outstanding during the year which is calculated using the treasury stock method for stock options and restricted stock units, the if-converted method for convertible notes, and assumes conversion of our convertible senior notes based on the related fiscal year financial data. In periods with net loss, diluted EPS uses the same shares as basic EPS with no consideration of the if-converted method on the numerator.
Given our net loss position for the years ended
December 31, 2014, 2013, and 2012
, there are no dilutive securities for these periods. Our anti-dilutive securities for the years ended December 31 are as follows:
|
2014
|
2013
|
2012
|
||||
|
Anti-dilutive share and option units
|
1,072,000
|
|
691,000
|
|
771,700
|
|
|
Anti-dilutive 6% Notes
|
—
|
|
17,600
|
|
17,600
|
|
|
Anti-dilutive Series A Notes
|
—
|
|
5,226,000
|
|
4,740,000
|
|
|
Anti-dilutive Series B Notes
|
982,000
|
|
4,219,000
|
|
6,149,000
|
|
15. Commitments, Contingencies, and Uncertainties
Financial Matters
We incur rental expenses under noncancelable lease agreements for certain buildings and operating equipment. Rental expense is charged to “Operating expense and supplies” or “Purchased transportation” on the accompanying statements of operations. Rental expense was
$98.7 million
,
$76.0 million
and
$78.0 million
for the
years ended December 31, 2014, 2013 and 2012
, respectively.
At
December 31, 2014
, we were committed under noncancelable lease agreements requiring minimum annual rentals payable as follows:
|
(in millions)
|
2015
|
2016
|
2017
|
2018
|
2019
|
Thereafter
|
||||||||||||
|
Minimum annual rentals
|
$
|
63.6
|
|
$
|
43.6
|
|
$
|
35.3
|
|
$
|
23.0
|
|
$
|
11.3
|
|
$
|
17.7
|
|
82
We expect in the ordinary course of business that leases will be renewed or replaced as they expire. The leases provide for fixed and escalating rentals and contingent escalating rentals based on the Consumer Price Index not to exceed certain specified amounts. We record rent expense for our operating leases on a straight-line basis over the base term of the lease agreements.
As of
December 31, 2014
, we have
$8.3 million
committed for capital expenditures to be completed during 2015.
Bryant Holdings Securities Litigation
On February 7, 2011, a putative class action was filed by Bryant Holdings LLC in the U.S. District Court for the District of Kansas on behalf of purchasers of our common stock between April 24, 2008 and November 2, 2009, inclusive (the “Class Period”), seeking damages under the federal securities laws for statements and/or omissions allegedly made by us and the individual defendants during the Class Period which plaintiffs claimed to be false and misleading.
The individual defendants are former officers of our Company. No current officers or directors were named in the lawsuit. The parties participated in voluntary mediation between March 11, 2013 and April 15, 2013. The mediation resulted in the execution of a mutually acceptable settlement agreement by the parties, which agreement remains subject to approval by the court. Court approval cannot be assured. Substantially all of the payments contemplated by the settlement will be covered by our liability insurance. The self-insured retention on this matter has been accrued.
On August 19, 2013, the Court entered an Order denying plaintiffs’ Motion for Preliminary Approval of the Settlement. Plaintiffs filed an Amended Motion for Preliminary Approval and, on November 18, 2013, the Court denied that Motion. Each denial was based primarily on deficiencies that the Court perceived in the plan that plaintiffs proposed for allocation of the settlement proceeds among class members. On February 18, 2014, plaintiffs filed a Second Amended Motion for Preliminary Approval. On February 11, 2015, the Court denied Plaintiffs’ Second Amended Motion for Preliminary Approval, based primarily on deficiencies that the Court perceived in the evidence plaintiffs submitted to show compliance with the procedural requirements for certifying a settlement class, including appropriate procedures regarding notice to the settlement class. The Court ordered Plaintiffs to show cause, by February 20, 2015, why Plaintiffs’ individual claims should not be set for trial beginning July 13, 2015.
Other Legal Matters
We are involved in other litigation or proceedings that arise in ordinary business activities. When possible, we insure against these risks to the extent we deem prudent, but no assurance can be given that the nature or amount of such insurance will be sufficient to fully indemnify us against liabilities arising out of pending and future legal proceedings. Many of these insurance policies contain self-insured retentions in amounts we deem prudent. Based on our current assessment of information available as of the date of these financial statements, we believe that our financial statements include adequate provisions for estimated costs and losses that may be incurred within the litigation and proceedings to which we are a party.
16. Related Party Transactions
On February 20, 2013, we entered into an Advisory Agreement with MAEVA Group, LLC (“MAEVA”), a company owned and controlled by Harry J. Wilson and of which Mr. Wilson is Chairman and CEO. Mr. Wilson served until March 2, 2014 as a director of the Company appointed by the IBT pursuant to its rights as a holder of the Series A Voting Preferred Stock and was not an independent director of the Company. Under the Advisory Agreement MAEVA provided advisory, analytical, consulting and other services to us in connection with one or more potential transactions and/or other strategic initiatives.
We paid MAEVA a
$5.5 million
completion fee in January 2014 in connection with the completion of the 2014 Financing Transactions. Additionally in February 2014, we paid MAEVA an incremental fee of
$3.5 million
in recognition of its critical role and performance in designing and leading a series of highly complicated, challenging and interdependent transactions that were critical to the Company’s 2014 Financing Transactions. The term of the Advisory Agreement was extended for the first two months of 2014 in connection with the implementation of the 2014 Financing Transactions. Our entry into the Advisory Agreement and the fees paid to MAEVA in connection with the 2014 Financing Transactions were approved by the independent members of the board.
83
Report of Independent Registered Public Accounting Firm
The Board of Directors and Shareholders
YRC Worldwide Inc.:
We have audited the accompanying consolidated balance sheets of YRC Worldwide Inc. and subsidiaries (the Company) as of December 31, 2014 and 2013, and the related consolidated statements of operations, comprehensive loss, shareholders’ deficit, and cash flows for each of the years in the three-year period ended December 31, 2014. These consolidated financial statements are the responsibility of the Company’s management. Our responsibility is to express an opinion on these consolidated financial statements based on our audits.
We conducted our audits in accordance with the standards of the Public Company Accounting Oversight Board (United States). Those standards require that we plan and perform the audit to obtain reasonable assurance about whether the financial statements are free of material misstatement. An audit includes examining, on a test basis, evidence supporting the amounts and disclosures in the financial statements. An audit also includes assessing the accounting principles used and significant estimates made by management, as well as evaluating the overall financial statement presentation. We believe that our audit provides a reasonable basis for our opinion.
In our opinion, the consolidated financial statements referred to above present fairly, in all material respects, the financial position of YRC Worldwide Inc. and subsidiaries as of December 31, 2014 and 2013, and the results of their operations and their cash flows for each of the years in the three-year period ended December 31, 2014, in conformity with U.S. generally accepted accounting principles.
We also have audited, in accordance with the standards of the Public Company Accounting Oversight Board (United States), YRC Worldwide Inc.’s internal control over financial reporting as of December 31, 2014, based on criteria established in
Internal Control - Integrated Framework
(2013) issued by the Committee of Sponsoring Organizations of the Treadway Commission (COSO), and our report dated
February 20, 2015
expressed an unqualified opinion on the effectiveness of the Company’s internal control over financial reporting.
/s/ KPMG LLP
Kansas City, Missouri
February 20, 2015
84
Report of Independent Registered Public Accounting Firm
The Board of Directors and Shareholders
YRC Worldwide Inc.:
We have audited YRC Worldwide Inc.’s internal control over financial reporting as of December 31, 2014, based on criteria established in
Internal Control - Integrated Framework
(2013) issued by the Committee of Sponsoring Organizations of the Treadway Commission (COSO). YRC Worldwide Inc.’s management is responsible for maintaining effective internal control over financial reporting and for its assessment of the effectiveness of internal control over financial reporting, included in the accompanying Management’s Report on Internal Control over Financial Reporting appearing under Item 9A of the December 31, 2014 annual report on Form 10-K. Our responsibility is to express an opinion on YRC Worldwide Inc.’s internal control over financial reporting based on our audit.
We conducted our audit in accordance with the standards of the Public Company Accounting Oversight Board (United States). Those standards require that we plan and perform the audit to obtain reasonable assurance about whether effective internal control over financial reporting was maintained in all material respects. Our audit included obtaining an understanding of internal control over financial reporting, assessing the risk that a material weakness exists, and testing and evaluating the design and operating effectiveness of internal control based on the assessed risk. Our audit also included performing such other procedures as we considered necessary in the circumstances. We believe that our audit provides a reasonable basis for our opinion.
A company’s internal control over financial reporting is a process designed to provide reasonable assurance regarding the reliability of financial reporting and the preparation of financial statements for external purposes in accordance with generally accepted accounting principles. A company’s internal control over financial reporting includes those policies and procedures that (1) pertain to the maintenance of records that, in reasonable detail, accurately and fairly reflect the transactions and dispositions of the assets of the company; (2) provide reasonable assurance that transactions are recorded as necessary to permit preparation of financial statements in accordance with generally accepted accounting principles, and that receipts and expenditures of the company are being made only in accordance with authorizations of management and directors of the company; and (3) provide reasonable assurance regarding prevention or timely detection of unauthorized acquisition, use, or disposition of the company’s assets that could have a material effect on the financial statements.
Because of its inherent limitations, internal control over financial reporting may not prevent or detect misstatements. Also, projections of any evaluation of effectiveness to future periods are subject to the risk that controls may become inadequate because of changes in conditions, or that the degree of compliance with the policies or procedures may deteriorate.
In our opinion, YRC Worldwide Inc. maintained, in all material respects, effective internal control over financial reporting as of December 31, 2014, based on criteria established in
Internal Control - Integrated Framework
(2013) issued by the Committee of Sponsoring Organizations of the Treadway Commission (COSO).
We also have audited, in accordance with the standards of the Public Company Accounting Oversight Board (United States), the consolidated balance sheets of YRC Worldwide Inc. and subsidiaries as of December 31, 2014 and 2013, and the related consolidated statements of operations, comprehensive loss, shareholders’ deficit, and cash flows for each of the years in the three-year period ended December 31, 2014, and our report dated
February 20, 2015
expressed an unqualified opinion on those consolidated financial statements.
/s/ KPMG LLP
Kansas City, Missouri
February 20, 2015
85
Not applicable.
Evaluation of Disclosure Controls and Procedures
As required by Exchange Act, we maintain disclosure controls and procedures designed to ensure that information we are required to disclose in reports that we file or submit under the Exchange Act, is recorded, processed, summarized and reported within the time periods specified in the SEC’s rules and forms. Our disclosure controls and procedures include, without limitation, controls and procedures designed to ensure that information we are required to disclose in reports that we file or submit under the Exchange Act is accumulated and communicated to our management, including our principal executive and principal financial officers, as appropriate to allow timely decisions regarding required disclosure. Our management, with the participation of our principal executive and financial officers, has evaluated our disclosure controls and procedures as of
December 31, 2014
and has concluded that our disclosure controls and procedures were effective as of
December 31, 2014
.
Management’s Report on Internal Control Over Financial Reporting
The Company’s management is responsible for establishing and maintaining effective internal control over our financial reporting, which is designed to provide reasonable assurance regarding the reliability of financial reporting and the preparation of financial statements for external purposes in accordance with generally accepted accounting principles.
Our management assessed the effectiveness of our system of internal control over financial reporting as of
December 31, 2014
based on the framework established in
Internal Control - Integrated Framework
(2013) issued by the Committee of Sponsoring Organizations of the Treadway Commission
Based on its assessment using those criteria, our management concluded that, as of
December 31, 2014
, our system of internal control over financial reporting was effective.
KPMG LLP, the independent registered public accounting firm that audited our
December 31, 2014
consolidated financial statements, has issued an audit report on our system of internal control over financial reporting. The KPMG LLP audit report is included herein.
Changes in Internal Control Over Financial Reporting
There were no changes in our internal control over financial reporting that occurred during the fiscal quarter ended
December 31, 2014
that have materially affected, or are reasonably likely to materially affect, the Company’s internal control over financial reporting.
None.
86
Pursuant to General Instruction G to Form 10-K, the information required by this item, other than information regarding (i) our executive officers, which is incorporated by reference to Part I of this Form 10-K under the heading “Executive Officers of the Registrant,” and (ii) our code of ethics, which is described below and titled the “Code of Business Conduct,” is included under the captions “Directors to be Elected by our Stockholders,” “Directors Selected by the Holder of our Series A Preferred Stock,” “Structure and Functioning of the Board — Audit & Ethics Committee” and “Section 16(a) Beneficial Ownership Reporting Compliance” in our Proxy Statement related to the 2015 Annual Meeting of Stockholders and is incorporated herein by reference.
Code of Business Conduct
We have adopted a written Code of Business Conduct that applies to all of our directors, officers and employees, including our chief executive officer, chief financial officer and chief accounting officer. It is available under “Board Committee Charters and Code of Business Conduct” on our website located at www.yrcw.com. We intend to disclose any amendments to our Code of Business Conduct by posting such information on our website located at www.yrcw.com, other than technical, administrative or non-substantive amendments, and any waivers, including implicit waivers, from any provision of our Code of Business Conduct that applies to our principal executive officer, principal financial officer, principal accounting officer or controller, which information will be disclosed via SEC filing.
Pursuant to General Instruction G to Form 10-K, the information required by this item is included under the captions “Compensation Committee Interlocks and Insider Participation,” “Director Compensation,” “Compensation Discussion and Analysis,” “Compensation Committee Report” and “Executive Compensation” in our Proxy Statement related to the 2015 Annual Meeting of Stockholders and is incorporated herein by reference.
Pursuant to General Instruction G to Form 10-K, the information required by this item is included under the captions “Security Ownership of Management and Directors,” “Security Ownership of Certain Beneficial Owners” and “Equity Compensation Plan Information” in our Proxy Statement related to the 2015 Annual Meeting of Stockholders and is incorporated herein by reference.
Pursuant to General Instruction G to Form 10-K, the information required by this item is included under the captions “Structure and Functioning of the Board” and “Certain Relationships and Related Transactions” in our Proxy Statement related to the 2015 Annual Meeting of Stockholders and is incorporated herein by reference.
Pursuant to General Instruction G to Form 10-K, the information required by this item is included under the caption “Audit and Audit-Related Fees” in our Proxy Statement related to the 2015 Annual Meeting of Stockholders and is incorporated herein by reference.
87
(a)(1) Financial Statements
The consolidated financial statements of the Company included under Item 8 - Financial Statements and Supplementary Data.
(a)(3) Exhibits
|
2.1
|
Equity Interest Purchase Agreement, dated June 25, 2010, between the Company and CEG Holdings, Inc. (incorporated by reference to Exhibit 2.1 to Quarterly Report on Form 10-Q for the quarter ended June 30, 2010, filed on August 9, 2010, File No. 000-12255).
|
|
3.1.1
|
Amended and Restated Certificate of Incorporation of the Company (incorporated by reference to Exhibit 3.1 to Current Report on Form 8-K, filed on September 16, 2011, File No. 000-12255).
|
|
3.1.2
|
Certificate of Amendment to the Certificate of Incorporation of the Company reducing the number of authorized shares (incorporated by reference to Exhibit 3.1 to Current Report on Form 8-K, filed on December 1, 2011, File No. 000-12255).
|
|
3.1.3
|
Certificate of Elimination of Series B Convertible Preferred Stock (incorporated by reference to Exhibit 3.2 to Current Report on Form 8-K, filed on December 1, 2011, File No. 000-12255).
|
|
3.1.4
|
Certificate of Designations of Series A Voting Preferred Stock (incorporated by reference to Exhibit 3.1 to Current Report on Form 8-K, filed on July 25, 2011, File No. 000-12255).
|
|
3.1.5
|
Certificate of Amendment of the Certificate of Incorporation of the Company amending the number of authorized capital stock (incorporated by reference to Exhibit 3.1 to Current Report on Form 8-K, filed on March 17, 2014, File No. 000-12255).
|
|
3.2
|
Amended and Restated Bylaws of the Company, adopted as of September 16, 2011 (incorporated by reference to Exhibit 3.2 to Current Report on Form 8-K, filed on September 16, 2011, File No. 000-12255).
|
|
4.1
|
Amended and Restated Certificate of Incorporation of the Company (incorporated by reference to Exhibit 3.1.1 to this Annual Report on Form 10-K), Certificate of Amendment to the Certificate of Incorporation (incorporated by reference to Exhibit 3.1.2 to this Annual Report on Form 10-K) and Certificate of Elimination of Series B Convertible Preferred Stock (incorporated by reference to Exhibit 3.1.3 to this Annual Report on Form 10-K) and Certificate of Amendment to the Certificate of Incorporation (incorporated by reference to Exhibit 3.1.5 to this Annual Report on Form 10-K.
|
|
4.2
|
Amended and Restated Bylaws of the Company (incorporated by reference to Exhibit 3.2 to this Annual Report on Form 10-K).
|
|
4.3
|
Certificate of Designations of Series A Voting Preferred Stock (incorporated by reference to Exhibit 3.1.4 to this Annual Report on Form 10-K).
|
|
4.4.1
|
Indenture (including form of note), dated as of July 22, 2011, among the Company, as issuer, the subsidiaries party thereto as guarantors and U.S. Bank National Association, as trustee, related to the Company’s 10% Series B Convertible Senior Secured Notes due 2015 (incorporated by reference to Exhibit 10.8 to Quarterly Report on Form 10-Q, for the quarter ended June 30, 2011, filed on August 8, 2011, File No. 000-12255).
|
|
4.4.2
|
Supplemental Indenture dated as of September 14, 2011, among the Company, as issuer, the subsidiaries party thereto as guarantors and U.S. Bank National Association, as trustee, supplementing the Indenture, dated as of July 22, 2011 (as supplemented and in effect as of the date of the Supplemental Indenture), relating to the Company’s 10% Series B Convertible Senior Secured Notes due 2015 (incorporated by reference to Exhibit 4.5.2 to Registration Statement on Form S-1, filed on September 23, 2011, File No. 333-176971).
|
|
4.4.3
|
Third Supplemental Indenture, dated as of January 31, 2014, among the Company, as issuer, the subsidiaries party thereto as guarantors and U.S. Bank National Association, as trustee, supplementing the Indenture, dated as of July 22, 2011 (as supplemented and in effect as of the date of the Supplemental Indenture), relating to the Company’s 10% Series B Convertible Senior Secured Notes due 2015 (incorporated by reference to Exhibit 4.1 to Current Report on Form 8-K, filed on January 31, 2014, File No. 000-12255).
|
(10) Material Contracts
|
10.1.1
|
National Master Freight Agreement, effective April 1, 2008, among the International Brotherhood of Teamsters, YRC Inc. (formerly, Yellow Transportation, Inc. and Roadway Express, Inc.), USF Holland Inc. and New Penn Motor
|
88
Express, Inc. (incorporated by reference to Exhibit 10.1 to Current Report on Form 8-K, filed on February 11, 2008, File No. 000-12255).
|
10.1.2
|
Amended and Restated Memorandum of Understanding on the Job Security Plan, dated July 9, 2009, among the International Brotherhood of Teamsters, YRC Inc., USF Holland Inc. and New Penn Motor Express, Inc. (incorporated by reference to Exhibit 10.1 to Current Report on Form 8-K, filed on July 14, 2009, File No. 000-12255).
|
|
10.1.3
|
Agreement for the Restructuring of the YRC Worldwide Inc. Operating Companies and related Term Sheet/Proposal (the “Restructuring Plan”), dated September 24, 2010, among the International Brotherhood of Teamsters, YRC Inc., USF Holland Inc. and New Penn Motor Express, Inc. (incorporated by reference to Exhibit 10.1 to Current Report on Form 8-K, filed on September 29, 2010, File No. 000-12255).
|
|
10.1.4
|
Certification and Amendment (dated December 31, 2010) and Certification and Second Amendment (dated February 28, 2011) to the Restructuring Plan Term Sheet (incorporated by reference to Exhibit 10.3.4 to Annual Report on Form 10-K for the year ended December 31, 2010, filed on March 14, 2011, File No. 000-12255).
|
|
10.1.5
|
Extension of the Agreement for the Restructuring of the YRC Worldwide Inc. Operating Companies, dated February 7, 2014, by and among YRC Inc. (d/b/a YRC Freight), USF Holland Inc., New Penn Motor Express, Inc., USF Reddaway Inc. and the Teamsters National Freight Industry Negotiating Committee of the International Brotherhood of Teamsters (incorporated by reference to Exhibit 10.1 to Current Report on Form 8-K, filed on February 10, 2014, File No. 000-12255).
|
|
10.2.1
|
Amended and Restated Contribution Deferral Agreement, dated as of July 22, 2011, among YRC Inc., USF Holland Inc., New Penn Motor Express, Inc. and USF Reddaway Inc., collectively as primary obligors, the Trustees for the Central States, Southeast and Southwest Areas Pension Fund, the Wilmington Trust Company, as agent, and the other funds party thereto (incorporated by reference to Exhibit 10.6 to Quarterly Report on Form 10-Q for the quarter ended June 30, 2011, filed on August 8, 2011, File No. 000-12255).
|
|
10.2.2
|
Consent and First Amendment to the Amended and Restated Contribution Deferral Agreement, dated as of October 17, 2011, among YRC Inc., USF Holland Inc., New Penn Motor Express, Inc. and USF Reddaway Inc., collectively as primary obligors, the Trustees for the Central States, Southeast and Southwest Areas Pension Fund, the Wilmington Trust Company, as agent, and the other funds party thereto (incorporated by reference to Exhibit 10.8.2 to Annual Report on Form 10-K for the year ended December 31, 2011, filed February 28, 2012, File No. 000-12255).
|
|
10.2.3
|
Consent and Second Amendment to the Amended and Restated Contribution Deferral Agreement, dated as of January 31, 2014, among YRC Inc., USF Holland Inc., New Penn Motor Express, Inc. and USF Reddaway Inc., collectively as primary obligors, the Trustees for the Central States, Southeast and Southwest Areas Pension Fund, the Wilmington Trust Company, as agent, and the other funds party thereto (incorporated by reference to Exhibit 10.1 to the Current Report on Form 8-K, filed on January 31, 2014, File No. 000-12255).
|
|
10.2.4
|
Letter Agreement, dated as of January 29, 2014 and effective as of January 31, 2014, among Central States, Southeast and Southwest Areas Pension Fund, YRC, Inc., USF Holland Inc., New Penn Motor Express, Inc., USF Reddaway Inc., as primary obligors, YRC Worldwide Inc., as primary guarantor, and certain additional guarantors (incorporated by reference to Exhibit 10.2 to Current Report on Form 8-K, filed on January 31, 2014, File No. 000-12255).
|
|
10.3
|
Credit Agreement dated as of February 13, 2014, by and among the Company, as borrower, the subsidiaries of the borrower party thereto from time to time, the lenders from time to time party thereto, and Credit Suisse AG, Cayman Islands Branch, as administrative agent and collateral agent for the lenders (incorporated by reference to Exhibit 10.10 to the Annual Report on Form 10-K for the year ended December 31, 2013, filed on March 10, 2014, File No. 000-12255).
|
|
10.3.1
|
Amendment No. 1 to Credit Agreement dated as of September 25, 2014, by and among the Company, as borrower, the subsidiaries of the borrower party thereto from time to time, the lenders from time to time party thereto, and Credit Suisse AG, Cayman Islands Branch, as administrative agent and collateral agent for the lenders (incorporated by reference to Exhibit 10.1 to Current Report on Form 8-K, filed on September 25, 2014, File No. 000-12255).
|
|
10.4†
|
Loan and Security Agreement, dated as of February 13, 2014, among the Company, as administrative borrower, the other borrowers named therein, the guarantors named therein, certain financial institutions, as lenders, and RBS Citizens Business Capital a division of RBS Asset Finance, Inc., a subsidiary of RBS Citizens, N.A., as agent, and RBS Citizens, N.A., Merrill Lynch, Pierce, Fenner & Smith and CIT Finance LLC, as joint lead arrangers and joint bookrunners (incorporated by reference to Exhibit 10.11 to Annual Report on Form 10-K for the year ended December 31, 2013, File No. 000-12255).
|
(10) Management Contracts, Compensatory Plans and Arrangements
|
10.5.1
|
YRC Worldwide Inc. Director Compensation Plan, effective August 30, 2011 (incorporated by reference to Exhibit 10.53.1 to Registration Statement on Form S-1, filed on September 23, 2011, File No. 333-176971).
|
|
10.5.2
|
Form of Director Share Unit Agreement (incorporated by reference to Exhibit 10.53.2 to Registration Statement on Form S-1, filed on September 23, 2011, File No. 333-176971).
|
89
|
10.5.3
|
YRC Worldwide Inc. Director Compensation Plan, effective December 13, 2013 (incorporated by reference to Exhibit 10.12.3 to the Annual Report on Form 10-K for the year ended December 31, 2013, filed on March 10, 2014, File No. 000-12255).
|
|
10.5.4
|
Form of Director Share Unit Agreement for Non-Employee Director under 2013 Director Compensation Plan (incorporated by reference to the Annual Report on Form 10-K for the year ended December 31, 2013, filed on March 10, 2014, File No. 000-12255).
|
|
10.6
|
Form of Indemnification Agreement between the Company and each of its directors and executive officers (incorporated by reference to Exhibit 10.5 to Current Report on Form 8-K, filed on March 15, 2007, File No. 000-12255).
|
|
10.7.1
|
YRC Worldwide Inc. 2011 Incentive and Equity Award Plan (incorporated by reference to Exhibit 99.1 to Registration Statement on Form S-8, filed on November 30, 2011, File No. 333-178223).
|
|
10.7.2
|
YRC Worldwide Inc. Amended and Restated 2011 Incentive and Equity Award Plan (incorporated by reference to Exhibit 10.7 to Quarterly Report on Form 10-Q for the quarter ended March 31, 2014, filed on May 1, 2014, File No. 000-12255).
|
|
10.8
|
Form of Restricted Stock Agreement under YRC Worldwide Inc. 2011 Incentive and Equity Award Plan (incorporated by reference to Exhibit 10.29 to Annual Report on Form 10-K for the year ended December 31, 2011, filed on February 28, 2012, File No. 000-12255).
|
|
10.9.1
|
YRC Worldwide Inc. Supplemental Executive Pension Plan, effective January 1, 2005 (incorporated by reference to Exhibit 10.1 to Current Report on Form 8-K, filed on July 25, 2006, File No. 000-12255).
|
|
10.9.2
|
Amendment to YRC Worldwide Inc. Supplemental Executive Pension Plan (incorporated by reference to Exhibit 10.3 to Current Report on Form 8-K, filed on July 8, 2008, File No. 000-12255).
|
|
10.9.3
|
Second Amendment to YRC Worldwide Inc. Supplemental Executive Pension Plan (incorporated by reference to Exhibit 10.30.3 to Annual Report on Form 10-K for the year ended December 31, 2011, filed February 28, 2012, File No. 000-12255).
|
|
10.10.1
|
Yellow Corporation Pension Plan, amended and restated as of January 1, 2004 (incorporated by reference to Exhibit 10.27 to Annual Report on Form 10-K for the year ended December 31, 2003, filed on March 15, 2004, File No. 000-12255).
|
|
10.10.2
|
Amendment No. 1 to Yellow Corporation Pension Plan, as amended and restated as of January 1, 2004 (incorporated by reference to Exhibit 10.2 to Quarterly Report on Form 10-Q for the quarter ended September 30, 2005, filed on November 9, 2005, File No. 000-12255).
|
|
10.10.3
|
Amendment No. 2 to Yellow Corporation Pension Plan, as amended and restated as of January 1, 2004 (incorporated by reference to Exhibit 10.28.3 to Annual Report on Form 10-K for the year ended December 31, 2010, filed on March 14, 2011, File No. 000-12255).
|
|
10.10.4
|
Amendment No. 3 to Yellow Corporation Pension Plan, as amended and restated as of January 1, 2004 (incorporated by reference to Exhibit 10.2 to Current Report on Form 8-K, filed on July 8, 2008, File No. 000-12255).
|
|
10.10.5
|
Amendment No. 4 to Yellow Corporation Pension Plan, as amended and restated as of January 1, 2004 (incorporated by reference to Exhibit 10.22.5 to Annual Report on Form 10-K for the year ended December 31, 2008, filed on March 2, 2009, File No. 000-12255).
|
|
10.10.6
|
Amendment No. 5 and Amendment No. 6 to Yellow Corporation Pension Plan, as amended and restated as of January 1, 2004 (incorporated by reference to Exhibit 10.28.6 to Annual Report on Form 10-K for the year ended December 31, 2009, filed on March 16, 2010, File No. 000-12255).
|
|
10.10.7
|
Amendment No. 7 to Yellow Corporation Pension Plan, as amended and restated as of January 1, 2004 (incorporated by reference to Exhibit 10.7 to Quarterly Report on Form 10-Q for the quarter ended June 30, 2010, filed on August 9, 2010, File No. 000-12255).
|
|
10.11
|
YRC Worldwide Inc. Non-Union Employee Option Plan (incorporated by reference to Exhibit 10.3 to Current Report on Form 8-K, filed on January 6, 2009, File No. 000-12255).
|
|
10.12
|
YRC Worldwide Inc. Union Employee Option Plan (incorporated by reference to Exhibit 10.25 to Annual Report on Form 10-K for the year ended December 31, 2008, filed on March 2, 2009, File No. 000-12255).
|
|
10.13
|
YRC Worldwide Inc. Second Union Employee Option Plan (incorporated by reference to Exhibit 10.1 to Current Report on Form 8-K, filed on March 5, 2010, File No. 000-12255).
|
|
10.14
|
Form of YRC Worldwide Inc. Cash Performance and Restricted Stock Award Agreement (incorporated by reference to Exhibit 10.1 to Current Report on Form 8-K, filed on April 3, 2009, File No. 000-12255).
|
|
10.15.1
|
Employment Agreement, dated as of July 22, 2011, between the Company and James L. Welch (incorporated by reference to Exhibit 10.16 to Quarterly Report on Form 10-Q for the quarter ended June 30, 2011, filed on August 8, 2011, File No. 000-12255).
|
|
10.15.2
|
Amendment No. 1 to Employment Agreement, dated as of October 30, 2012, between the Company and James L. Welch (incorporated by reference to Exhibit 10.1 to Quarterly Report on Form 10-Q for the quarter ended September 30, 2012, filed on November 2, 2012, File No. 000-12255).
|
90
|
10.15.3
|
Employment Agreement Cancellation Agreement, dated as of December 30, 2014, between the Company and James L. Welch (incorporated by reference to Exhibit 10.1 to Current Report on Form 8-K, filed on January 2, 2015, File No. 000-12255).
|
|
10.16.1
|
Employment Agreement, dated as of November 3, 2011, between the Company and Jamie G. Pierson (incorporated by reference to Exhibit 10.46 to Annual Report on Form 10-K for the year ended December 31, 2011, filed on February 28, 2012, File No. 000-12255).
|
|
10.16.2
|
Amendment No. 1 to Employment Agreement, dated as of October 30, 2012, between the Company and Jamie G. Pierson (incorporated by reference to Exhibit 10.2 to Quarterly Report on Form 10-Q for the quarter ended September 30, 2012, filed on November 2, 2012, File No. 000-12255).
|
|
10.16.3
|
Employment Agreement Cancellation Agreement, dated as of December 30, 2014, between the Company and Jamie G. Pierson (incorporated by reference to Exhibit 10.2 to Current Report on Form 8-K, filed on January 2, 2015, File No. 000-12255).
|
|
10.17
|
Escrow Agreement, dated as of November 3, 2011, among the Company, Jamie G. Pierson and BOKF, N.A., as escrow agent (incorporated by reference to Exhibit 10.47 to Annual Report on Form 10-K for the year ended December 31, 2011, filed on February 28, 2012, File No. 000-12255).
|
|
10.18*
|
General Release and Separation Agreement, dated as of November 21, 2014, between the Company and Michelle A. Friel.
|
|
10.19
|
Severance Agreement, dated as of December 30, 2014, between the Company and James L. Welch (incorporated by reference to Exhibit 10.3 to Current Report on Form 8-K, filed on January 2, 2015, File No. 000-12255).
|
|
10.20
|
Severance Agreement, dated as of December 30, 2014, between the Company and Jamie G. Pierson (incorporated by reference to Exhibit 10.4 to Current Report on Form 8-K, filed on January 2, 2015, File No. 000-12255).
|
|
10.21
|
General Release and Separation Agreement, dated as of September 23, 2013, between the Company and Jeffrey A. Rogers (incorporated by reference to the Annual Report on Form 10-K for the year ended December 31, 2013, filed on March 10, 2014, File No. 000-12255).
|
|
21.1*
|
Subsidiaries of the Company.
|
|
23.1*
|
Consent of KPMG LLP, Independent Registered Public Accounting Firm.
|
|
31.1*
|
Certification of James L. Welch pursuant to Exchange Act Rules 13a-14 and 15d-14, as adopted pursuant to Section 302 of the Sarbanes-Oxley Act of 2002.
|
|
31.2*
|
Certification of Jamie G. Pierson pursuant to Exchange Act Rules 13a-14 and 15d-14, as adopted pursuant to Section 302 of the Sarbanes-Oxley Act of 2002.
|
|
32.1*
|
Certification of James L. Welch pursuant to 18 U.S.C. Section 1350, as adopted pursuant to Section 906 of the Sarbanes-Oxley Act of 2002.
|
|
32.2*
|
Certification of Jamie G. Pierson pursuant to 18 U.S.C. Section 1350, as adopted pursuant to Section 906 of the Sarbanes-Oxley Act of 2002.
|
|
101.INS*
|
XBRL Instance Document
|
|
101.SCH*
|
XBRL Taxonomy Extension Schema
|
|
101.CAL*
|
XBRL Taxonomy Extension Calculation Linkbase
|
|
101.DEF*
|
XBRL Taxonomy Extension Definition Linkbase
|
|
101.LAB*
|
XBRL Taxonomy Extension Label Linkbase
|
|
101.PRE*
|
XBRL Taxonomy Extension Presentation Linkbase
|
__________________________
* Indicates documents filed herewith.
|
†
|
Confidential portions of this exhibit have been filed separately with the SEC pursuant to a request for confidential treatment.
|
91
SIGNATURES
Pursuant to the requirements of Section 13 or 15(d) of the Securities Exchange Act of 1934, the registrant has duly caused this report to be signed on its behalf by the undersigned, thereunto duly authorized.
|
YRC Worldwide Inc.
|
||
|
Date: February 20, 2015
|
BY:
/s/ James L. Welch
|
|
|
James L. Welch
|
||
|
Chief Executive Officer
|
||
POWER OF ATTORNEY
Know all people by these presents, that each person whose signature appears below constitutes and appoints James L. Welch and Jamie G. Pierson, and each of them, his or her true and lawful attorneys-in-fact and agents, with full power of substitution and resubstitution, for him or her and in his or her name, place and stead, in any and all capacities, to sign any amendments to this annual report on Form 10-K, and to file the same, with all exhibits thereto, with the Securities and Exchange Commission, granting unto said attorneys-in-fact and agents, and each of them, full power and authority to do and perform each and every act and thing requisite and necessary to be done in and about the premises, as fully and to all intents and purposes as he or she might or could do in person, hereby confirming all that said attorneys-in-fact and agents or either of them, or his or their substitute or substitutes, may lawfully do or cause to be done by virtue hereof.
Pursuant to the requirements of the Securities Exchange Act of 1934, this report has been signed below by the following persons on behalf of the registrant and in the capacities and on the dates indicated.
|
/s/ James L. Welch
|
Chief Executive Officer
|
February 20, 2015
|
|
|
James L. Welch
|
|||
|
/s/ Jamie G. Pierson
|
Executive Vice President &
|
February 20, 2015
|
|
|
Jamie G. Pierson
|
Chief Financial Officer
|
||
|
/s/ Stephanie D. Fisher
|
Vice President & Controller
|
February 20, 2015
|
|
|
Stephanie D. Fisher
|
|||
|
/s/ Raymond J. Bromark
|
Director
|
February 20, 2015
|
|
|
Raymond J. Bromark
|
|||
|
/s/ Douglas A. Carty
|
Director
|
February 20, 2015
|
|
|
Douglas A. Carty
|
|||
|
/s/ William R. Davidson
|
Director
|
February 20, 2015
|
|
|
William R. Davidson
|
|||
|
/s/ Matthew Doheny
|
Director
|
February 20, 2015
|
|
|
Matthew Doheny
|
|||
|
/s/ Robert L. Friedman
|
Director
|
February 20, 2015
|
|
|
Robert L. Friedman
|
|||
|
/s/ James E. Hoffman
|
Director
|
February 20, 2015
|
|
|
James E. Hoffman
|
|||
|
/s/ Michael J. Kneeland
|
Director
|
February 20, 2015
|
|
|
Michael J. Kneeland
|
|||
|
/s/ James F. Winestock
|
Director
|
February 20, 2015
|
|
|
James F. Winestock
|
|||
92
TABLE OF CONTENTS
Part IItem 1. BusinessItem 1A. Risk FactorsItem 1B. Unresolved Staff CommentsItem 2. PropertiesItem 3. Legal ProceedingsItem 4. Mine Safety DisclosuresPart IIItem 5. Market For Registrant S Common Equity, Related Stockholder Matters and Issuer Purchases Of Equity SecuritiesItem 6. Selected Financial DataItem 7. Management S Discussion and Analysis Of Financial Condition and Results Of OperationsItem 7A. Quantitative and Qualitative Disclosures About Market RiskItem 8. Financial Statements and Supplementary DataItem 9. Changes in and Disagreements with Accountants on Accounting and Financial DisclosureItem 9A. Controls and ProceduresItem 9B. Other InformationPart IIIItem 10. Directors and Executive Officers Of The RegistrantItem 11. Executive CompensationItem 12. Security Ownership Of Certain Beneficial Owners and ManagementItem 13. Certain Relationships and Related Transactions, and Director IndependenceItem 14. Principal Accounting Fees and ServicesPart IVItem 15. Exhibits, Financial Statement Schedules