YUM BRANDS INC
10-Ks and 10-Qs
|
|
|
|
|
|
|
|
|
|
|
|
|
|
|
|
|
|
|
|
|
|
|
|
|
|
|
|
|
|
|
|
|
|
|
|
|
|
|
|
|
|
|
|
|
|
|
|
|
|
|
|
|
|
|
|
UNITED STATES
SECURITIES AND EXCHANGE COMMISSION
Washington, D. C. 20549
FORM 10-K
|
[
ü
]
|
|
ANNUAL REPORT PURSUANT TO SECTION 13 OR 15(d) OF THE SECURITIES
|
|
|
|
EXCHANGE ACT OF 1934
for the fiscal year ended December 28, 2013
|
|
|
|
|
|
|
|
OR
|
|
|
|
|
|
[ ]
|
|
TRANSITION REPORT PURSUANT TO SECTION 13 OR 15(d) OF THE SECURITIES
|
|
|
|
EXCHANGE ACT OF 1934
|
For the transition period from ____________ to _________________
Commission file number 1-13163
YUM! BRANDS, INC.
(Exact name of registrant as specified in its charter)
|
|
North Carolina
|
|
13-3951308
|
|
|
(State or other jurisdiction of
|
|
(I.R.S. Employer
|
|
|
incorporation or organization)
|
|
Identification No.)
|
|
|
|
|
|
|
|
1441 Gardiner Lane, Louisville, Kentucky
|
|
40213
|
|
|
(Address of principal executive offices)
|
|
(Zip Code)
|
|
|
|
|
|
|
Registrant’s telephone number, including area code: (502) 874-8300
|
|||
|
Securities registered pursuant to Section 12(b) of the Act
|
|||
|
|
|
|
|
|
|
Title of Each Class
|
|
Name of Each Exchange on Which Registered
|
|
|
Common Stock, no par value
|
|
New York Stock Exchange
|
|
|
|
||
|
|
Securities registered pursuant to Section 12(g) of the Act:
|
||
|
|
None
|
||
Indicate by check mark if the registrant is a well-known seasoned issuer, as defined in Rule 405 of the Securities Act. Yes
ü
No
Indicate by check mark if the registrant is not required to file reports pursuant to Section 13 or Section 15(d) of the Act. Yes
No
ü
Indicate by check mark whether the registrant (1) has filed all reports required to be filed by Section 13 or 15(d) of the Securities Exchange Act of 1934 during the preceding 12 months (or for such shorter period that the registrant was required to file such reports), and (2) has been subject to such filing requirements for the past 90 days. Yes
ü
No
Indicate by check mark whether the registrant has submitted electronically and posted on its corporate Website, if any, every Interactive Data File required to be submitted and posted pursuant to Rule 405 of Regulation S-T during the preceding 12 months (or for such shorter period that the registrant was required to submit and post such files). Yes
ü
No
Indicate by check mark if disclosure of delinquent filers pursuant to Item 405 of Regulation S-K is not contained herein, and will not be contained, to the best of registrant’s knowledge, in definitive proxy or information statements incorporated by reference in Part III of this Form 10-K or any amendment to this Form 10-K. [
ü
]
Indicate by check mark whether the registrant is a large accelerated filer, an accelerated filer, a non-accelerated filer or a smaller reporting company. See definitions of “large accelerated filer”, “accelerated filer” and “smaller reporting company” in Rule 12b-2 of the Exchange Act (Check one): Large accelerated filer: [
ü
] Accelerated filer: [ ] Non-accelerated filer: [ ] Smaller reporting company: [ ]
Indicate by check mark whether the registrant is a shell company (as defined in Rule 12b-2 of the Exchange Act). Yes
No
_
ü
The aggregate market value of the voting stock (which consists solely of shares of Common Stock) held by non-affiliates of the registrant as of June 15, 2013 computed by reference to the closing price of the registrant’s Common Stock on the New York Stock Exchange Composite Tape on such date was approximately $31,700,000,000. All executive officers and directors of the registrant have been deemed, solely for the purpose of the foregoing calculation, to be “affiliates” of the registrant. The number of shares outstanding of the registrant’s Common Stock as of February 11, 2014 was 442,931,286 shares.
Documents Incorporated by Reference
Portions of the definitive proxy statement furnished to shareholders of the registrant in connection with the annual meeting of shareholders to be held on May 1, 2014 are incorporated by reference into Part III.
Forward-Looking Statements
In this Form 10-K, as well as in other written reports and oral statements that we make from time to time, we present “forward-looking statements” within the meaning of Section 27A of the Securities Act of 1933, as amended, and Section 21E of the Securities Exchange Act of 1934, as amended. We intend such forward-looking statements to be covered by the safe harbor provisions of the Private Securities Litigation Reform Act of 1995, and we are including this statement for purposes of complying with those safe harbor provisions.
Forward-looking statements can be identified by the fact that they do not relate strictly to historical or current facts. These statements often include words such as “may,” “will,” “estimate,” “intend,” “seek,” “expect,” “project,” “anticipate,” “believe,” “plan” or other similar terminology. These forward-looking statements are based on current expectations and assumptions and upon data available at the time of the statements and are neither predictions nor guarantees of future events or circumstances. The forward-looking statements are subject to risks and uncertainties, which may cause actual results to differ materially from those projected. Factors that could cause our actual results to differ materially from our expectations and forward-looking statements include (i) the risks and uncertainties described in the Risk Factors included in Part I, Item 1A of this Form 10-K and (ii) the factors described in Management's Discussion and Analysis of Financial Condition and Results of Operations included in Part II, Item 7 of this Form 10-K. You should not place undue reliance on forward-looking statements, which speak only as of the date hereof. In making these statements, we are not undertaking to address or update any of our forward-looking statements set forth herein in future filings or communications regarding our business results.
2
|
Item 1.
|
Business.
|
YUM! Brands, Inc. (referred to herein as “YUM”, the “Registrant” or the “Company”), was incorporated under the laws of the state of North Carolina in 1997. The principal executive offices of YUM are located at 1441 Gardiner Lane, Louisville, Kentucky 40213, and the telephone number at that location is (502) 874-8300. Our website address is
http://yum.com
.
YUM, together with its subsidiaries, is referred to in this Form 10-K annual report (“Form 10-K”) as the Company. The terms “we,” “us” and “our” are also used in the Form 10-K to refer to the Company. Throughout this Form 10-K, the terms “restaurants,” “stores” and “units” are used interchangeably. While YUM! Brands, Inc., referred to as the Company, does not directly own or operate any restaurants, throughout this document we may refer to restaurants as being Company-owned.
Financial Information about Operating Segments
As of and through December 28, 2013, YUM consisted of six operating segments: YUM Restaurants China ("China" or “China Division”), YUM Restaurants International (“YRI” or “International Division”), Taco Bell U.S., KFC U.S., Pizza Hut U.S. and YUM Restaurants India ("India" or "India Division"). The China Division includes mainland China, and the India Division includes India, Bangladesh, Mauritius, Nepal and Sri Lanka. YRI includes the remainder of our international operations.
For financial reporting purposes, management considers the three U.S. operating segments to be similar and, therefore, has aggregated them into a single reportable operating segment (“U.S.”). In 2012, our India Division began being reported as a standalone reporting segment separate from YRI as a result of changes to our management reporting structure. While our consolidated results are not impacted, our historical segment information has been restated to be consistent with the current period presentation. In December 2011, the Company sold the Long John Silver's ("LJS") and A&W All-American Food Restaurants ("A&W") brands to key franchisee leaders and strategic investors in separate transactions. Financial information prior to these transactions reflects our ownership of these brands.
Operating segment information for the years ended
December 28, 2013
,
December 29, 2012
and
December 31, 2011
for the Company is included in Management’s Discussion and Analysis of Financial Condition and Results of Operations (“MD&A”) in Part II, Item 7, pages 21 through 51 and in the related Consolidated Financial Statements in Part II, Item 8, pages 52 through 101.
In the first quarter of 2014, we will combine our YRI and U.S. businesses and begin reporting segment information for three global divisions: KFC, Pizza Hut and Taco Bell. China and India will remain separate reporting segments due to their strategic importance and growth potential. This new structure is designed to drive greater global brand focus, enabling us to more effectively share know-how and accelerate growth. While our consolidated results will not be impacted, we will restate our historical segment information during 2014 for consistent presentation.
Narrative Description of Business
General
YUM has over 40,000 restaurants in more than 125 countries and territories. Primarily through the three concepts of KFC, Pizza Hut and Taco Bell (the “Concepts”), the Company develops, operates, franchises and licenses a worldwide system of restaurants which prepare, package and sell a menu of competitively priced food items. Units are operated by a Concept or by independent franchisees or licensees under the terms of franchise or license agreements. Franchisees can range in size from individuals owning just one restaurant to large publicly traded companies.
The China Division, based in Shanghai, China, comprises approximately 6,200 system restaurants, primarily Company-owned KFCs and Pizza Huts. In 2013, the China Division recorded revenues of approximately $6.9 billion and Operating Profit of $777 million. On February 1, 2012, we acquired a controlling interest in Little Sheep Group Limited ("Little Sheep"), a casual dining concept headquartered in Inner Mongolia, China. See Note 4 for details. The Company also owns non-controlling interests in Chinese entities who operate in a manner similar to KFC franchisees and a meat processing entity that supplies lamb primarily to our recently acquired Little Sheep business. YRI, based in Plano, Texas, comprises approximately 15,200 system restaurants, primarily franchised KFCs and Pizza Huts, operating in over 120 countries outside the U.S., China and India. In 2013 YRI recorded revenues of approximately $3.1 billion and Operating Profit of $760 million. We have approximately 18,100 system restaurants, primarily franchised restaurants, in the U.S. and recorded revenues of approximately $3.0 billion and Operating Profit of $684 million in 2013. The India Division, based in Delhi, India comprises approximately 700 system restaurants. In 2013, India recorded revenues of approximately $125 million and an Operating Loss of $15 million.
3
Restaurant Concepts
Most restaurants in each Concept offer consumers the ability to dine in and/or carry out food. In addition, Taco Bell and KFC offer a drive-thru option in many stores. Pizza Hut offers a drive-thru option on a much more limited basis. Pizza Hut and KFC, on a more limited basis primarily in China, offer delivery service.
Each Concept has proprietary menu items and emphasizes the preparation of food with high quality ingredients, as well as unique recipes and special seasonings to provide appealing, tasty, convenient and attractive food at competitive prices.
The franchise programs of the Company are designed to promote consistency and quality, and the Company is selective in granting franchises. Under standard franchise agreements, franchisees supply capital – initially by paying a franchise fee to YUM, purchasing or leasing the land, building, equipment, signs, seating, inventories and supplies and, over the longer term, by reinvesting in the business. Franchisees contribute to the Company’s revenues on an ongoing basis through the payment of royalties based on a percentage of sales.
The Company believes that it is important to maintain strong and open relationships with its franchisees and their representatives. To this end, the Company invests a significant amount of time working with the franchisee community and their representative organizations on key aspects of the business, including products, equipment, operational improvements and standards and management techniques.
Following is a brief description of each Concept:
KFC
|
•
|
KFC was founded in Corbin, Kentucky by Colonel Harland D. Sanders, an early developer of the quick service food business and a pioneer of the restaurant franchise concept. The Colonel perfected his secret blend of 11 herbs and spices for Kentucky Fried Chicken in 1939 and signed up his first franchisee in 1952.
|
|
•
|
KFC operates in 118 countries and territories throughout the world. As of year end 2013, KFC had 4,563 units in China, 9,460 units in YRI, 4,491 units in the U.S. and 361 units in India. Approximately 78 percent of the China units, 11 percent of the YRI units, 5 percent of the U.S. units and 47 percent of the India units are Company-owned.
|
|
•
|
KFC restaurants across the world offer fried and non-fried chicken products such as sandwiches, chicken strips, chicken-on-the-bone and other chicken products marketed under a variety of names. KFC restaurants also offer a variety of entrees and side items suited to local preferences and tastes. Restaurant decor throughout the world is characterized by the image of the Colonel.
|
Pizza Hut
|
•
|
The first Pizza Hut restaurant was opened in 1958 in Wichita, Kansas, and within a year, the first franchise unit was opened. Today, Pizza Hut is the largest restaurant chain in the world specializing in the sale of ready-to-eat pizza products.
|
|
•
|
Pizza Hut operates in 91 countries and territories throughout the world. As of year end 2013, Pizza Hut had 1,264 units in China, 5,490 units in YRI, 7,846 units in the U.S. and 367 units in India. Nearly 100 percent of the China units and approximately 4 percent of the YRI units, 6 percent of the U.S. units and 5 percent of the India units are Company-owned.
|
|
•
|
Pizza Hut operates in the delivery, carryout and casual dining segments around the world. Outside of the U.S., Pizza Hut often uses unique branding to differentiate these segments.
|
|
•
|
Pizza Hut features a variety of pizzas which are marketed under varying names. Each of these pizzas is offered with a variety of different toppings suited to local preferences and tastes. Many Pizza Huts also offer pasta and chicken wings, including over 4,800 stores offering wings under the brand WingStreet, primarily in the U.S. Outside the U.S., Pizza Hut casual dining restaurants offer a variety of core menu products other than pizza, which are typically suited to local preferences and tastes. Pizza Hut units feature a distinctive red roof logo on their signage.
|
4
Taco Bell
|
•
|
The first Taco Bell restaurant was opened in 1962 by Glen Bell in Downey, California, and in 1964, the first Taco Bell franchise was sold.
|
|
•
|
Taco Bell operates in 21 countries and territories throughout the world. As of year end 2013, there were 5,769 Taco Bell units in the U.S., 279 units in YRI and 5 units in India. Approximately 15 percent of the U.S. units, none of the YRI units and 100 percent of the India units are Company-owned.
|
|
•
|
Taco Bell specializes in Mexican-style food products, including various types of tacos, burritos, quesadillas, salads, nachos and other related items. Taco Bell units feature a distinctive bell logo on their signage.
|
Restaurant Operations
Through its Concepts, YUM develops, operates, franchises and licenses a worldwide system of both traditional and non-traditional Quick Service Restaurants ("QSR"). Traditional units feature dine-in, carryout and, in some instances, drive-thru or delivery services. Non-traditional units, which are typically licensed outlets, include express units and kiosks which have a more limited menu, usually lower sales volumes and operate in non-traditional locations like malls, airports, gasoline service stations, train stations, subways, convenience stores, stadiums, amusement parks and colleges, where a full-scale traditional outlet would not be practical or efficient.
Restaurant management structure varies by Concept and unit size. Generally, each Concept-owned restaurant is led by a restaurant general manager (“RGM”), together with one or more assistant managers, depending on the operating complexity and sales volume of the restaurant. Most of the employees work on a part-time basis. Each Concept issues detailed manuals, which may then be customized to meet local regulations and customs. These manuals set forth standards and requirements for all aspects of restaurant operations, including food safety and quality, food handling and product preparation procedures, equipment maintenance, facility standards and accounting control procedures. The restaurant management teams are responsible for the day-to-day operation of each unit and for ensuring compliance with operating standards. CHAMPS – which stands for Cleanliness, Hospitality, Accuracy, Maintenance, Product Quality and Speed of Service – is our proprietary systemwide program for training, measuring and rewarding employee performance against key customer measures. CHAMPS is intended to align the operating processes of our entire system around one core set of standards. RGMs’ efforts, including CHAMPS performance measures, are monitored by Area Coaches. Area Coaches typically work with approximately six to twelve restaurants. Various senior operators visit Concept-owned restaurants from time to time to promote adherence to system standards and mentor restaurant team members.
Supply
and Distribution
The Company’s Concepts, including Concept units operated by its franchisees, are substantial purchasers of a number of food and paper products, equipment and other restaurant supplies. The principal items purchased include chicken, cheese, beef and pork products, paper and packaging materials. The Company has not experienced any significant continuous shortages of supplies, and alternative sources for most of these products are generally available. Prices paid for these supplies fluctuate. When prices increase, the Concepts may attempt to pass on such increases to their customers, although there is no assurance that this can be done practically.
China Division
In China, we work with approximately 650 independent suppliers, mostly China-based, providing a wide range of products. We own most of the distribution system which includes approximately 20 logistics centers. We also own a non-controlling interest in a meat processing facility in Inner Mongolia that supplies meat to our Little Sheep business.
U.S. Division
The Company, along with the representatives of the Company’s KFC, Pizza Hut and Taco Bell franchisee groups, are members in the Restaurant Supply Chain Solutions, LLC (“RSCS"), formerly known as the Unified Foodservice Purchasing Co-op, LLC, which is responsible for purchasing certain restaurant products and equipment in the U.S. The core mission of the RSCS is to provide the lowest possible sustainable store-delivered prices for restaurant products and equipment. This arrangement combines the purchasing power of the Company-owned and franchisee restaurants in the U.S. which the Company believes leverages the system’s scale to drive cost savings and effectiveness in the purchasing function. The Company also believes that the RSCS fosters closer alignment of interests and a stronger relationship with its franchisee community.
5
Most food products, paper and packaging supplies, and equipment used in restaurant operations are distributed to individual restaurant units by third-party distribution companies. McLane Company, Inc. (“McLane”) is the exclusive distributor for the majority of items used in Company-owned restaurants and for a substantial number of franchisee and licensee stores. The Company entered into an agreement with McLane effective January 1, 2011 relating to distribution to Company-owned restaurants. This agreement extends through December 31, 2016 and generally restricts Company-owned restaurants from using alternative distributors for most products.
International and India Divisions
Outside China and the U.S., we and our franchisees use decentralized sourcing and distribution systems involving many different global, regional, and local suppliers and distributors. In our YRI markets and India Division, we have approximately 3,000 and 150 suppliers, respectively, including U.S.-based suppliers that export to many countries.
Trademarks and Patents
The Company and its Concepts own numerous registered trademarks and service marks. The Company believes that many of these marks, including its Kentucky Fried Chicken®, KFC®, Pizza Hut® and Taco Bell® marks, have significant value and are materially important to its business. The Company’s policy is to pursue registration of its important marks whenever feasible and to oppose vigorously any infringement of its marks.
The use of these marks by franchisees and licensees has been authorized in our franchise and license agreements. Under current law and with proper use, the Company’s rights in its marks can generally last indefinitely. The Company also has certain patents on restaurant equipment which, while valuable, are not material to its business.
Working Capital
Information about the Company’s working capital is included in MD&A in Part II, Item 7, pages 21 through 51 and the Consolidated Statements of Cash Flows in Part II, Item 8, page 56.
Seasonal Operations
The Company does not consider its operations to be seasonal to any material degree.
Competition
The retail food industry, in which our Concepts compete, is made up of supermarkets, supercenters, warehouse stores, convenience stores, coffee shops, snack bars, delicatessens and restaurants (including the QSR segment), and is intensely competitive with respect to food quality, price, service, convenience, location and concept. The industry is often affected by changes in consumer tastes; national, regional or local economic conditions; currency fluctuations; demographic trends; traffic patterns; the type, number and location of competing food retailers and products; and disposable purchasing power. Each of the Concepts competes with international, national and regional restaurant chains as well as locally-owned restaurants, not only for customers, but also for management and hourly personnel, suitable real estate sites and qualified franchisees. Given the various types and vast number of competitors, our Concepts do not constitute a significant portion of the retail food industry in terms of number of system units or system sales, either on a worldwide or individual country basis.
Research and Development (“R&D”)
The Company operates R&D facilities in Shanghai, China (China Division); Plano, Texas (Pizza Hut U.S. and YRI); Irvine, California (Taco Bell); Louisville, Kentucky (KFC U.S.) and several other locations outside the U.S. The Company expensed $31 million, $30 million and $34 million in
2013
,
2012
and
2011
, respectively, for R&D activities. From time to time, independent suppliers also conduct research and development activities for the benefit of the YUM system.
Environmental Matters
The Company is not aware of any federal, state or local environmental laws or regulations that will materially affect its earnings or competitive position, or result in material capital expenditures. However, the Company cannot predict the effect on its operations of possible future environmental legislation or regulations. During
2013
, there were no material capital expenditures for environmental control facilities and no such material expenditures are anticipated.
6
Government Regulation
U.S. Division.
The Company and its U.S. Division are subject to various federal, state and local laws affecting its business. Each of the Concepts’ restaurants in the U.S. must comply with licensing and regulation by a number of governmental authorities, which include health, sanitation, safety, fire and zoning agencies in the state and/or municipality in which the restaurant is located. In addition, each Concept must comply with various state and federal laws that regulate the franchisor/franchisee relationship. To date, the Company has not been materially adversely affected by such licensing and regulation or by any difficulty, delay or failure to obtain required licenses or approvals.
The Company and each Concept are also subject to federal and state laws governing such matters as immigration, employment and pay practices, overtime, tip credits and working conditions. The bulk of the Concepts’ employees are paid on an hourly basis. The Company has not been materially adversely affected by such laws to date.
The Company and each Concept are also subject to federal and state child labor laws which, among other things, prohibit the use of certain “hazardous equipment” by employees younger than 18 years of age. The Company has not been materially adversely affected by such laws to date.
The Company and each Concept are also subject to laws relating to information security, privacy, cashless payments, consumer credit, protection and fraud. The Company has not been materially adversely affected by such laws to date.
The Company and each Concept are also subject to laws relating to nutritional content, nutritional labeling, product safety and menu labeling. The Company has not been materially adversely affected by such laws to date.
The Company and each Concept, as applicable, continue to monitor their facilities for compliance with the Americans with Disabilities Act (“ADA”) in order to conform to its requirements. Under the ADA, the Company or the relevant Concept could be required to expend funds to modify its restaurants to better provide service to, or make reasonable accommodation for the employment of, disabled persons. The Company has not been materially adversely affected by such laws to date.
International,
China and India Divisions
.
The Company’s restaurants outside the U.S. are subject to national and local laws and regulations which are similar to those affecting U.S. restaurants, including laws and regulations concerning information security, labor, health, sanitation and safety. The restaurants outside the U.S. are also subject to tariffs and regulations on imported commodities and equipment and laws regulating foreign investment. International compliance with environmental requirements has not had a material adverse effect on the Company’s results of operations, capital expenditures or competitive position.
The Company is also subject to anti-bribery and anti-corruption laws and regulations, which are the focus of increasing enforcement around the world.
See Item 1A "Risk Factors" on page 8 for a discussion of risks relating to federal, state, local and international regulation of our business.
Employees
As of year end
2013
, the Company and its Concepts employed approximately 539,000 persons, approximately 86 percent of whom were part-time. The Company believes that it provides working conditions and compensation that compare favorably with those of its principal competitors. The majority of employees are paid on an hourly basis. Some employees are subject to labor council relationships that vary due to the diverse cultures in which the Company operates. The Company and its Concepts consider their employee relations to be good.
Financial Information about Geographic Areas
Financial information about our significant geographic areas (China Division, International Division, the U.S. and India) is incorporated herein by reference from Selected Financial Data in Part II, Item 6, pages 19 and 20; MD&A in Part II, Item 7, pages 21 through 51; and in the related Consolidated Financial Statements in Part II, Item 8, pages 52 through 101.
Available Information
The Company makes available through the Investor Relations section of its internet website at
http://yum.com
its annual report on Form 10-K, quarterly reports on Form 10-Q, current reports on Form 8-K and amendments to those reports filed or furnished pursuant to Section 13(a) or 15(d) of the Exchange Act, as soon as reasonably practicable after electronically filing such material
7
with the Securities and Exchange Commission ("SEC") at
http://www.sec.gov
. These reports may also be obtained by visiting the SEC's Public Reference Room at 100 F Street, NE, Washington, DC 20549 or by calling the SEC at 1 (800) SEC-0330.
Our Corporate Governance Principles and our Code of Conduct are also located within the Investor Relations section of the Company's website. The reference to the Company’s website address does not constitute incorporation by reference of the information contained on the website and should not be considered part of this document. These documents, as well as our SEC filings, are available in print free of charge to any shareholder who requests a copy from our Investor Relations Department.
|
Item 1A.
|
Risk Factors.
|
You should carefully review the risks described below as they identify important factors that could cause our actual results to differ materially from our forward-looking statements and historical trends.
Food safety and food-borne illness concerns may have an adverse effect on our business.
Food-borne illnesses, such as E. coli, hepatitis A, trichinosis or salmonella, and food safety issues, such as food tampering, contamination or adulteration, have occurred in the past and could occur in the future. Any report or publicity linking us or one of our Concept restaurants, including restaurants operated by our Concepts’ franchisees, to instances of food-borne illness or food safety issues could adversely affect our Concepts’ brands and reputations as well as our revenues and profits and possibly lead to litigation. If a customer of our Concepts becomes ill from food-borne illnesses or as a result of food safety issues, restaurants in our system may be temporarily closed, which would decrease our revenues. In addition, instances or allegations of food-borne illness or food safety issues, real or perceived, involving our restaurants, restaurants of competitors, suppliers or distributors (regardless of whether we use or have used those suppliers or distributors), or otherwise involving the types of food served at our restaurants, could result in negative publicity that could adversely affect our sales. The occurrence of food-borne illnesses or food safety issues could also adversely affect the price and availability of affected ingredients, which could result in disruptions in our supply chain and/or lower margins for us and our Concepts’ franchisees.
Our significant China operations subject us to risks that could negatively affect our business.
A significant and growing portion of our restaurants are located, and our revenues and profits originate, in China. As a consequence, our financial results are increasingly dependent on our results in China, and our business is increasingly exposed to risks there. These risks include changes in economic conditions (including consumer spending, unemployment levels and wage and commodity inflation), income and non-income based tax rates and laws and consumer preferences, as well as changes in the regulatory environment and increased competition. In addition, our results of operations in China and the value of our Chinese assets are affected by fluctuations in currency exchange rates, which may adversely affect reported earnings. There can be no assurance as to the future effect of any such changes on our results of operations, financial condition or cash flows.
In addition, any significant or prolonged deterioration in U.S.-China relations could adversely affect our China business. Certain risks and uncertainties of doing business in China are solely within the control of the Chinese government, and Chinese law regulates the scope of our foreign investments and business conducted within China. There are also uncertainties regarding the interpretation and application of laws and regulations and the enforceability of intellectual property and contract rights in China. If we were unable to enforce our intellectual property or contract rights in China, our business would be adversely impacted.
Health concerns arising from outbreaks of viruses or other diseases may have an adverse effect on our business.
Outbreaks of avian flu occur from time to time around the world, including in China where a significant portion of our profits and revenues originate. It is possible that outbreaks in China and elsewhere could reach pandemic levels. Public concern over avian flu generally may cause fear about the consumption of chicken, eggs and other products derived from poultry, which could cause customers to consume less poultry and related products. This would likely result in lower revenues and profits. Avian flu outbreaks could also adversely affect the price and availability of poultry, which could negatively impact our profit margins and revenues. Widespread outbreaks could also affect our ability to attract and retain employees.
Furthermore, other viruses such as H1N1 or “swine flu” may be transmitted through human contact, and the risk of contracting viruses could cause employees or guests to avoid gathering in public places, which could adversely affect restaurant guest traffic or the ability to adequately staff restaurants. We could also be adversely affected if jurisdictions in which we have restaurants impose mandatory closures, seek voluntary closures or impose restrictions on operations of restaurants. Even if such measures are not implemented and a virus or other disease does not spread significantly, the perceived risk of infection or health risk may affect our business.
8
Our foreign operations subject us to risks that could negatively affect our business.
A significant portion of our Concepts’ restaurants are operated in countries and territories outside of the U.S., and we intend to continue expansion of our international operations. As a result, our business is increasingly exposed to risks inherent in foreign operations. These risks, which can vary substantially by country, include political instability, corruption, social and ethnic unrest, changes in economic conditions (including consumer spending, unemployment levels and wage and commodity inflation), the regulatory environment, income and non-income based tax rates and laws and consumer preferences as well as changes in the laws and policies that govern foreign investment in countries where our restaurants are operated.
In addition, our results of operations and the value of our foreign assets are affected by fluctuations in currency exchange rates, which may adversely affect reported earnings. More specifically, an increase in the value of the U.S. Dollar relative to other currencies, such as the Australian Dollar, the British Pound, the Canadian Dollar and the Euro, as well as currencies in certain emerging markets, could have an adverse effect on our reported earnings. There can be no assurance as to the future effect of any such changes on our results of operations, financial condition or cash flows.
Failure to protect the integrity and security of personal information of our customers and employees could result in substantial costs, expose us to litigation and damage our reputation.
We receive and maintain certain personal information about our customers and employees. The use of this information is regulated by applicable law, as well as by certain third-party contracts. If our security and information systems are compromised or our employees, franchisees or vendors fail to comply with these laws and regulations and this information is obtained by unauthorized persons or used inappropriately, it could result in liabilities and penalties and could damage our reputation, cause us to incur substantial costs and result in a loss of customer confidence, which could adversely affect our restaurant operations and results of operations and financial condition. Additionally, we could be subject to litigation, government enforcement actions and private litigation as a result of any such failure.
Shortages or interruptions in the availability and delivery of food and other supplies may increase costs or reduce revenues.
The products sold by our Concepts and their franchisees are sourced from a wide variety of domestic and international suppliers. We are also dependent upon third parties to make frequent deliveries of food products and supplies that meet our specifications at competitive prices. Shortages or interruptions in the supply of food items and other supplies to our restaurants could adversely affect the availability, quality and cost of items we buy and the operations of our restaurants. Such shortages or disruptions could be caused by inclement weather, natural disasters such as floods, drought and hurricanes, increased demand, problems in production or distribution, the inability of our vendors to obtain credit, political instability in the countries in which foreign suppliers and distributors are located, the financial instability of suppliers and distributors, suppliers’ or distributors’ failure to meet our standards, product quality issues, inflation, other factors relating to the suppliers and distributors and the countries in which they are located, food safety warnings or advisories or the prospect of such pronouncements or other conditions beyond our control. A shortage or interruption in the availability of certain food products or supplies could increase costs and limit the availability of products critical to restaurant operations, which in turn could lead to restaurant closures and/or a decrease in sales. In addition, failure by a principal distributor for our Concepts and/or our Concepts’ franchisees to meet its service requirements could lead to a disruption of service or supply until a new distributor is engaged, and any disruption could have an adverse effect on our business.
We may not attain our target development goals, and aggressive development could cannibalize existing sales.
Our growth strategy depends in large part on our ability to increase our net restaurant count in markets outside the U.S., especially China and other emerging markets. The successful development of new units will depend in large part on our ability and the ability of our Concepts’ franchisees to open new restaurants and to operate these restaurants on a profitable basis. We cannot guarantee that we, or our Concepts’ franchisees, will be able to achieve our expansion goals or that new restaurants will be operated profitably. Further, there is no assurance that any new restaurant will produce operating results similar to those of our existing restaurants. Other risks which could impact our ability to increase our net restaurant count include prevailing economic conditions and our, or our Concepts’ franchisees’ ability to obtain suitable restaurant locations, negotiate acceptable lease or purchase terms for the locations, obtain required permits and approvals in a timely manner, hire and train qualified personnel and meet construction schedules.
Expansion into target markets could also be affected by our Concepts’ franchisees’ ability to obtain financing to construct and open new restaurants. If it becomes more difficult or more expensive for our Concepts’ franchisees to obtain financing to develop new restaurants, the expected growth of our system could slow and our future revenues and operating cash flows could be adversely impacted.
9
In addition, the new restaurants could impact the sales of our existing restaurants nearby. There can be no assurance that sales cannibalization will not occur or become more significant in the future as we increase our presence in existing markets.
Changes in commodity and other operating costs could adversely affect our results of operations.
Any increase in certain commodity prices, such as food, supply and energy costs, could adversely affect our operating results. Because our Concepts and their franchisees provide competitively priced food, our ability to pass along commodity price increases to our customers is limited. Significant increases in gasoline prices could also result in a decrease of customer traffic at our restaurants or the imposition of fuel surcharges by our distributors, each of which could adversely affect our profit margins. Our operating expenses also include employee wages and benefits and insurance costs (including workers’ compensation, general liability, property and health) which may increase over time. Any such increase could adversely affect our profit margins.
Our operating results are closely tied to the success of our Concepts’ franchisees.
A significant portion of our restaurants are operated by franchisees from whom we derive a significant portion of our revenues in the form of royalty payments. As a result, the success of our business depends in part upon the operational and financial success of our Concepts’ franchisees. We have limited control over how our Concepts’ franchisees’ businesses are run, and the inability of our Concepts’ franchisees to operate successfully could adversely affect our operating results through decreased royalty payments.
If franchisees incur too much debt or if economic or sales trends deteriorate such that they are unable to operate profitably or repay existing debt, it could result in financial distress, including insolvency or bankruptcy. If a significant franchisee or a significant number of our Concepts’ franchisees become financially distressed, our operating results could be impacted through reduced or delayed royalty payments or increased rent obligations for leased properties on which we are contingently liable.
Our success depends substantially on the value and perception of our brands.
Our success depends in large part upon our ability to maintain and enhance the value of our brands and our customers’ connection to our brands. Brand value is based in part on consumer perceptions on a variety of subjective qualities. Business incidents, whether isolated or recurring and whether originating from us, our franchisees or suppliers, can significantly reduce brand value and consumer trust, particularly if the incidents receive considerable publicity or result in litigation. For example, our brands could be damaged by claims or perceptions about the quality or safety of our products or the quality of our suppliers, regardless of whether such claims or perceptions are true. Any such incident could cause a decline in consumer confidence in, or the perception of, our Concepts and/or our products and decrease the value of our brands as well as consumer demand for our products, which would likely result in lower revenues and profits.
Our inability or failure to recognize, respond to and effectively manage the accelerated impact of social media could materially adversely impact our business.
There has been a marked increase in the use of social media platforms, including weblogs (blogs), social media websites, and other forms of Internet-based communications which allow individuals access to a broad audience of consumers and other interested persons. Many social media platforms immediately publish the content their subscribers and participants post, often without filters or checks on accuracy of the content posted. Information posted on such platforms at any time may be adverse to our interests and/or may be inaccurate. The dissemination of information online could harm our business, prospects, financial condition, and results of operations, regardless of the information’s accuracy. The harm may be immediate without affording us an opportunity for redress or correction.
Other risks associated with the use of social media include improper disclosure of proprietary information, negative comments about our Concepts, exposure of personally identifiable information, fraud and out-of-date information. The inappropriate use of social media by our customers or employees could increase our costs, lead to litigation or result in negative publicity that could damage our reputation.
A suspension of the Chinese affiliates of the “Big Four” accounting firms may impact our ability to access capital markets and could result in other material adverse effects.
In January 2014, a U.S. administrative law court issued an initial ruling to suspend Chinese affiliates of the global “Big Four” accounting firms, including the Chinese affiliate of our independent auditor, from auditing U.S.-listed companies for six months. While we believe the likelihood of the suspension becoming effective is remote, it is difficult to determine the potential consequences
10
if the ruling is sustained. However, given the significance of our China Division to our consolidated financial statements, it is possible that we would be unable to include audited and/or reviewed consolidated financial statements in the Quarterly Reports on Form 10-Q and Annual Reports on Form 10-K that we are required to file with the SEC. As a result, we could be unable to file our reports in a timely manner or such filings would be considered deficient. Until such reviews or audits are completed, our filings under the Exchange Act could continue to be deficient or untimely, and our ability to access the capital markets could be significantly limited. These issues could render us temporarily ineligible for use of both shelf registration and “short-form” registration that allows us to incorporate our prior filings by reference. Our inability to satisfy our reporting obligations as a public company may lead the New York Stock Exchange to commence delisting procedures with respect to our common shares. In addition, the failure to deliver audited financial statements could also constitute an event of default under our Credit Facility. Moreover, any negative news about the proceedings against the “Big Four” audit firms could erode investor confidence in financial statements relating to our Chinese operations.
We could be party to litigation that could adversely affect us by increasing our expenses or subjecting us to significant monetary damages and other remedies.
From time to time we are involved in a number of legal proceedings, which include consumer, employment, tort, patent, securities, derivative and other litigation (see the discussion of Legal Proceedings in Note 19 to the consolidated financial statements included in Item 8 of this Report). We are currently a defendant in cases containing class action allegations in which the plaintiffs have brought claims under federal and state wage and hour, disability and other laws. We are also currently a defendant in securities and derivative lawsuits alleging inadequate disclosures in violation of federal securities laws. Plaintiffs in these types of lawsuits often seek recovery of very large or indeterminate amounts, and the magnitude of the potential loss relating to such lawsuits may not be accurately estimated. Regardless of whether any claims against us are valid, or whether we are ultimately held liable, such litigation may be expensive to defend and may divert resources away from our operations and negatively impact reported earnings. With respect to insured claims, a judgment for monetary damages in excess of any insurance coverage could adversely affect our financial condition or results of operations. Any adverse publicity resulting from these allegations may also adversely affect our reputation, which in turn could adversely affect our results.
In addition, the restaurant industry has been subject to claims that relate to the nutritional content of food products, as well as claims that the menus and practices of restaurant chains have led to the obesity of some customers. We may also be subject to this type of claim in the future and, even if we are not, publicity about these matters (particularly directed at the quick service and fast-casual segments of the industry) may harm our reputation and adversely affect our results.
Changes in, or noncompliance with, governmental regulations may adversely affect our business operations, growth prospects or financial condition.
Our Concepts and their franchisees are subject to numerous laws and regulations around the world. These laws change regularly and are increasingly complex. For example, we are subject to:
|
•
|
The Americans with Disabilities Act in the U.S. and similar state laws that give civil rights protections to individuals with disabilities in the context of employment, public accommodations and other areas.
|
|
•
|
The U.S. Fair Labor Standards Act, which governs matters such as minimum wages, overtime and other working conditions, family leave mandates and a variety of similar state laws that govern these and other employment law matters.
|
|
•
|
Anti-bribery and corruption laws and regulations, such as the Foreign Corrupt Practices Act, the UK Bribery Act and similar laws, which are the subject of increasing scrutiny and enforcement around the world.
|
|
•
|
New or changing laws and regulations in government-mandated health care benefits such as the Patient Protection and Affordable Care Act.
|
|
•
|
New or changing laws and regulations relating to nutritional content, nutritional labeling, product safety and menu labeling.
|
|
•
|
New or changing laws relating to state and local licensing.
|
|
•
|
New or changing laws and regulations relating to health, sanitation, food, workplace safety and fire safety and prevention.
|
|
•
|
New or changing laws and regulations relating to union organizing rights and activities.
|
|
•
|
New or changing laws relating to information security, privacy, cashless payments and consumer credit, protection and fraud.
|
|
•
|
New or changing environmental regulations.
|
|
•
|
New or changing federal and state immigration laws and regulations in the U.S.
|
Compliance with new or existing laws and regulations could impact our operations. In addition, the compliance costs associated with these laws and regulations could be substantial. Any failure or alleged failure to comply with these laws or regulations could adversely affect our reputation, international expansion efforts, growth prospects and financial condition or result in, among other things, litigation, revocation of required licenses, governmental investigations or proceedings, administrative enforcement actions,
11
fines and civil and criminal liability. Publicity relating to any such noncompliance could also harm our reputation and adversely affect our revenues.
Tax matters, including changes in tax rates, disagreements with taxing authorities and imposition of new taxes could impact our results of operations and financial condition.
A significant percentage of our profits are earned outside the U.S. and taxed at lower rates than the U.S. statutory rates. Historically, the cash we generate outside the U.S. has principally been used to fund our international development. However, if the cash generated by our U.S. business is not sufficient to meet our need for cash in the U.S., we may need to repatriate a greater portion of our international earnings to the U.S. in the future. We are required to record U.S. income tax expense in our financial statements at the point in time when our management determines that such funds are not permanently invested outside the U.S. This could cause our worldwide effective tax rate to increase materially.
We are subject to income taxes as well as non-income based taxes, such as payroll, sales, use, value-added, net worth, property, withholding and franchise taxes in both the U.S. and various foreign jurisdictions. We are also subject to regular reviews, examinations and audits by the Internal Revenue Service and other taxing authorities with respect to such income and non-income based taxes inside and outside of the U.S. If the IRS or another taxing authority disagrees with our tax positions, we could face additional tax liability, including interest and penalties. Payment of such additional amounts upon final settlement or adjudication of any disputes could have a material impact on our results of operations and financial position.
In addition, we are directly and indirectly affected by new tax legislation and regulation and the interpretation of tax laws and regulations worldwide. Changes in such legislation, regulation or interpretation could increase our taxes and have an adverse effect on our operating results and financial condition.
Our business may be adversely impacted by general economic conditions.
Our results of operations are dependent upon discretionary spending by consumers, which may be affected by general economic conditions globally or in one or more of the markets we serve. Some of the factors that impact discretionary consumer spending include unemployment, disposable income and consumer confidence. These and other macroeconomic factors could have an adverse effect on our sales, profitability or development plans, which could harm our financial condition and operating results.
The retail food industry in which we operate is highly competitive.
The retail food industry in which we operate is highly competitive with respect to price and quality of food products, new product development, advertising levels and promotional initiatives, customer service, reputation, restaurant location, and attractiveness and maintenance of properties. If consumer or dietary preferences change, or our restaurants are unable to compete successfully with other retail food outlets in new and existing markets, our business could be adversely affected. We also face growing competition as a result of convergence in grocery, deli and restaurant services, including the offering by the grocery industry of convenient meals, including pizzas and entrees with side dishes. In addition, in the retail food industry, labor is a primary operating cost component. Competition for qualified employees could also require us to pay higher wages to attract a sufficient number of employees, which could adversely impact our profit margins.
12
|
Item 1B.
|
Unresolved Staff Comments.
|
The Company has received no written comments regarding its periodic or current reports from the staff of the Securities and Exchange Commission that were issued 180 days or more preceding the end of its
2013
fiscal year and that remain unresolved.
|
Item 2.
|
Properties.
|
As of year end
2013
, the Company’s Concepts owned approximately 850 units and leased land, building or both for approximately 7,275 units worldwide. These units are further detailed as follows:
|
•
|
The China Division leased land, building or both in approximately 5,000 units.
|
|
•
|
The International Division owned approximately 150 units and leased land, building or both in approximately 1,175 units.
|
|
•
|
The U.S. Division owned approximately 675 units and leased land, building or both in approximately 900 units.
|
|
•
|
The India Division leased land, building or both in approximately 200 units.
|
Company-owned restaurants in China are generally leased for initial terms of 10 to 15 years and generally do not have renewal options. Historically, the Company has either been able to renew its China Division leases or enter into competitive leases at replacement sites without a significant impact on our operations, cash flows or capital resources. Company-owned restaurants in the U.S. with leases are generally leased for initial terms of 15 or 20 years and generally have renewal options; however, Pizza Hut delivery/carryout units in the U.S. generally are leased for significantly shorter initial terms with shorter renewal options. Company-owned restaurants outside of China and the U.S. with leases have initial lease terms and renewal options that vary by country. The Company currently has approximately 825 units worldwide that it leases or subleases to franchisees, principally in the U.S., U.K. and Mexico.
The China Division leases their corporate headquarters and research facilities in Shanghai, China. The Pizza Hut U.S. and YRI corporate headquarters and a research facility in Plano, Texas are owned by Pizza Hut. Taco Bell leases its corporate headquarters and research facility in Irvine, California. The KFC U.S. and YUM corporate headquarters and a research facility in Louisville, Kentucky are owned by the Company. In addition, YUM leases office facilities for the U.S. Division shared service center in Louisville, Kentucky. YUM sub-leases a portion of its shared service office facility in Louisville, Kentucky to a company that performs certain of our information technology, accounting and payroll services. Additional information about the Company’s properties is included in the Consolidated Financial Statements in Part II, Item 8, pages 52 through 101.
The Company believes that its properties are generally in good operating condition and are suitable for the purposes for which they are being used.
|
Item 3.
|
Legal Proceedings
.
|
The Company is subject to various lawsuits covering a variety of allegations. The Company believes that the ultimate liability, if any, in excess of amounts already provided for these matters in the Consolidated Financial Statements, is not likely to have a material adverse effect on the Company’s annual results of operations, financial condition or cash flows. The following is a brief description of the more significant of the categories of lawsuits and other matters we face from time to time. Descriptions of specific claims and contingencies appear in Note 19, Contingencies, to the Consolidated Financial Statements included in Part II, Item 8, which Note is incorporated by reference into this item.
Franchisees
A substantial number of the restaurants of each of the Concepts are franchised to independent businesses. In the course of the franchise relationship, occasional disputes arise with franchisees relating to a broad range of subjects, including, without limitation, marketing, operational standards, quality, service and cleanliness issues, grants, transfers or terminations of franchise rights, territorial disputes and delinquent payments.
13
Suppliers
The Company and its Concepts purchase food, paper, equipment and other restaurant supplies as well as certain services from numerous independent suppliers throughout the world. Disputes arise from time-to-time with suppliers on a number of issues, including, but not limited to, general performance, compliance with product specifications and terms of procurement and service requirements.
Employees
At any given time, the Company or its Concepts employ hundreds of thousands of persons, primarily in its restaurants. In addition, each year thousands of persons seek employment with the Company and its Concepts. From time to time, disputes arise regarding employee hiring, compensation, termination and promotion practices.
Like other retail employers, the Company and its Concepts have been faced with allegations of class-wide wage and hour, employee classification and other labor law violations.
Customers
The Concepts' restaurants serve a large and diverse cross-section of the public, and in the course of serving so many people, disputes arise regarding products, service, accidents and other matters typical of large restaurant systems.
Intellectual Property
The Company has registered trademarks and service marks, many of which are of material importance to the Company’s business. From time to time, the Company and its Concepts may become involved in litigation to defend and protect its use and ownership of its registered marks.
Shareholders
As a publicly-traded company, from time-to-time, disputes arise with our shareholders, including allegations that the Company breached federal securities laws as a result of material misstatements or omissions. In addition, shareholders may bring claims derivatively on behalf of the Company against officers and/or directors alleging claims such as breaches of fiduciary duties, waste of corporate assets or unjust enrichment.
14
|
Item 4.
|
Mine Safety Disclosures.
|
Not applicable
Executive Officers of the Registrant
The executive officers of the Company as of February 18, 2014, and their ages and current positions as of that date are as follows:
David C. Novak
, 61, is Chairman of the Board and Chief Executive Officer of YUM. He has served in this position since January 2001.
Jing-Shyh S. Su
, 61, is Vice-Chairman of the Board of YUM and Chairman and Chief Executive Officer of YUM Restaurants China. He has served in this position since May 2010. He has served as Vice-Chairman of the Board of YUM since March 2008, and he served as President of YUM Restaurants China from 1997 to May 2010.
Scott O. Bergren
, 67, is Chief Executive Officer of Pizza Hut and Chief Innovation Officer of YUM. He has served as Chief Executive Officer of Pizza Hut since January 2014 and as Chief Innovation Officer of YUM since February 2011. Prior to these positions, Mr. Bergren served as Chief Executive Officer of Pizza Hut U.S. from February 2011 to December 2013 and as President and Chief Concept Officer of Pizza Hut U.S. from November 2006 to January 2011.
Jonathan D. Blum
, 55, is Senior Vice President, Chief Public Affairs Officer and Global Nutrition Officer of YUM. He has served as Senior Vice President and Chief Public Affairs Officer since July 1997. In March of 2012, his title and job responsibilities were expanded to include Global Nutrition Officer.
Anne P. Byerlein
, 55, is Chief People Officer of YUM. She has served in this position since December 2002.
Christian L. Campbell
, 63,
is Senior Vice President, General Counsel, Secretary and Chief Franchise Policy Officer of YUM. He has served as Senior Vice President, General Counsel and Secretary since September 1997 and Chief Franchise Policy Officer since January 2003.
Richard T. Carucci
, 56, is President of YUM. He has served in this position since May 2012. Prior to this position, Mr. Carucci served as Chief Financial Officer of YUM, a position he held beginning in March 2005. Mr. Carucci will retire as President of YUM in March 2014.
Greg Creed
, 56, is Chief Executive Officer of Taco Bell. He has served in this position since February 2011. Prior to this position, Mr. Creed served as President and Chief Concept Officer of Taco Bell, a position he held beginning in December 2006.
Roger Eaton
, 53, is President of KFC and Chief Operations Officer of YUM. He has served as President of KFC since January 2014 and as Chief Operations Officer of YUM since November 2011. Prior to these positions, Mr. Eaton served as Chief Executive Officer of KFC U.S. and YUM Operational Excellence Officer from February 2011 to November 2011. He was President and Chief Concept Officer of KFC U.S. from June 2008 to February 2011.
Patrick Grismer
, 52, is Chief Financial Officer of YUM. He has served in this position since May 2012. Prior to this position, Mr. Grismer served as Chief Planning and Control Officer, a position he held beginning January 2011. Mr. Grismer served in as Chief Financial Officer of YRI from June 2008 to January 2011.
Muktesh Pant
, 59, is Chief Executive Officer of KFC. He has served in this position since January 2014. Prior to this position he served as Chief Executive Officer of YRI from December 2011 to December 2013. Mr. Pant served as President of YRI from May 2010 to December 2011 and as President of Global Brand Building for YUM from February 2009 to December 2011. He served as the Chief Marketing Officer of YRI from July 2005 to May 2010.
David E. Russell
, 44, is Vice President, Finance and Corporate Controller of YUM. He has served in this position since December 2012. He has been Vice President and Corporate Controller since February 2011. Effective December 2012, his duties and title were expanded to include Vice President, Finance. From November 2010 to February 2011, Mr. Russell served as Vice President, Controller-Designate. From January 2008 to November 2010, he served as Vice President and Assistant Controller.
Executive officers are elected by and serve at the discretion of the Board of Directors.
15
|
Item 5.
|
Market for the Registrant’s Common Stock, Related Stockholder Matters and Issuer Purchases of Equity Securities.
|
The Company’s Common Stock trades under the symbol YUM and is listed on the New York Stock Exchange (“NYSE”). The following sets forth the high and low NYSE composite closing sale prices by quarter for the Company’s Common Stock and dividends per common share.
|
2013
|
||||||||||||||||
|
Quarter
|
High
|
Low
|
Dividends
Declared
|
Dividends
Paid
|
||||||||||||
|
First
|
$
|
70.20
|
|
$
|
62.08
|
|
$
|
0.335
|
|
$
|
0.335
|
|
||||
|
Second
|
73.52
|
|
64.15
|
|
0.335
|
|
0.335
|
|
||||||||
|
Third
|
74.82
|
|
68.10
|
|
—
|
|
0.335
|
|
||||||||
|
Fourth
|
78.30
|
|
65.17
|
|
0.74
|
|
0.37
|
|
||||||||
|
2012
|
||||||||||||||||
|
Quarter
|
High
|
Low
|
Dividends
Declared
|
Dividends
Paid
|
||||||||||||
|
First
|
$
|
70.72
|
|
$
|
58.57
|
|
$
|
0.285
|
|
$
|
0.285
|
|
||||
|
Second
|
73.93
|
|
62.86
|
|
0.285
|
|
0.285
|
|
||||||||
|
Third
|
67.53
|
|
61.95
|
|
—
|
|
0.285
|
|
||||||||
|
Fourth
|
74.47
|
|
63.88
|
|
0.67
|
|
0.335
|
|
||||||||
In
2013
, the Company declared two cash dividends of $0.335 per share and two cash dividends of $0.37 per share of Common Stock, one of which had a distribution date of February 7, 2014. In
2012
, the Company declared two cash dividends of $0.285 per share and two cash dividends of $0.335 per share of Common Stock, one of which had a distribution date of February 1, 2013. The Company targets an annual dividend payout ratio of 35% to 40% of net income.
As of February 11, 2014, there were 61,700 registered holders of record of the Company’s Common Stock.
16
Issuer Purchases of Equity Securities
The following table provides information as of
December 28, 2013
with respect to shares of Common Stock repurchased by the Company during the quarter then ended:
|
Fiscal Periods
|
Total number
of shares
purchased(thousands)
|
Average price
paid per share
|
Total number of shares purchased as part of publicly announced plans or programs (thousands)
|
Approximate dollar value of shares that may yet be purchased under the plans or programs (millions)
|
||||||||
|
Period 10
|
—
|
$
|
—
|
|
—
|
$
|
463
|
|
||||
|
9/8/13 - 10/5/13
|
||||||||||||
|
Period 11
|
2,967
|
$
|
66.59
|
|
2,967
|
$
|
266
|
|
||||
|
10/6/13 - 11/2/13
|
||||||||||||
|
Period 12
|
387
|
$
|
73.36
|
|
387
|
$
|
987
|
|
||||
|
11/3/13 - 11/30/13
|
||||||||||||
|
Period 13
|
467
|
$
|
73.47
|
|
467
|
$
|
953
|
|
||||
|
12/1/13 - 12/28/13
|
|
|
|
|||||||||
|
Total
|
3,821
|
$
|
68.11
|
|
3,821
|
$
|
953
|
|
||||
On November 16, 2012, our Board of Directors authorized share repurchases through May 2014 of up to $1 billion (excluding applicable transaction fees) of our outstanding Common Stock. On November 22, 2013, our Board of Directors authorized additional share repurchases through May 2015 of up to $750 million (excluding applicable transaction fees) of our outstanding Common Stock. As of December 28, 2013, we have remaining capacity to repurchase up to $953 million of Common Stock under these authorizations.
17
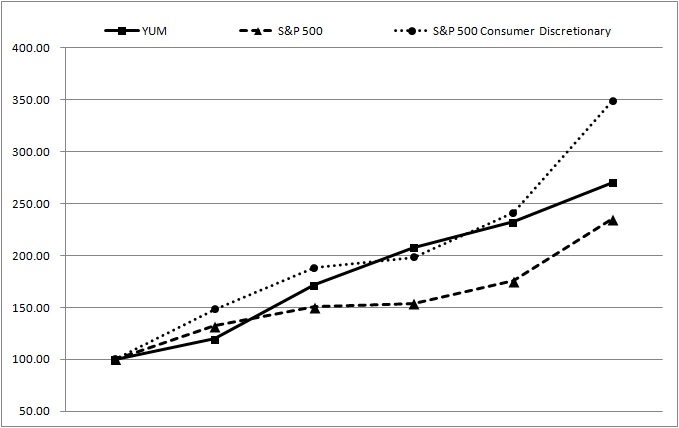
Stock Performance Graph
This graph compares the cumulative total return of our Common Stock to the cumulative total return of the S&P 500 Stock Index and the S&P 500 Consumer Discretionary Sector, a peer group that includes YUM, for the period from December 26, 2008 to December 27, 2013, the last trading day of our 2013 fiscal year. The graph assumes that the value of the investment in our Common Stock and each index was $100 at December 26, 2008 and that all dividends were reinvested.
|
12/26/2008
|
12/24/2009
|
12/23/2010
|
12/30/2011
|
12/28/2012
|
12/27/2013
|
||||||||||||||||||||
|
YUM!
|
$
|
100
|
|
$
|
120
|
|
$
|
172
|
|
$
|
208
|
|
$
|
232
|
|
$
|
271
|
|
|||||||
|
S&P 500
|
$
|
100
|
|
$
|
132
|
|
$
|
151
|
|
$
|
154
|
|
$
|
176
|
|
$
|
235
|
|
|||||||
|
S&P Consumer Discretionary
|
$
|
100
|
|
$
|
148
|
|
$
|
188
|
|
$
|
198
|
|
$
|
241
|
|
$
|
349
|
|
|||||||
18
|
Item 6.
|
Selected Financial Data.
|
Selected Financial Data
YUM! Brands, Inc. and Subsidiaries
(in millions, except per share and unit amounts)
|
|
Fiscal Year
|
||||||||||||||||||
|
|
2013
|
2012
|
2011
|
2010
|
2009
|
||||||||||||||
|
Summary of Operations
|
|
|
|
||||||||||||||||
|
Revenues
|
|
|
|
||||||||||||||||
|
Company sales
|
$
|
11,184
|
|
$
|
11,833
|
|
|
$
|
10,893
|
|
|
$
|
9,783
|
|
|
$
|
9,413
|
|
|
|
Franchise and license fees and income
|
1,900
|
|
1,800
|
|
|
1,733
|
|
|
1,560
|
|
|
1,423
|
|
||||||
|
Total
|
13,084
|
|
13,633
|
|
|
12,626
|
|
|
11,343
|
|
|
10,836
|
|
||||||
|
Closures and impairment income (expenses)
(a)
|
(331
|
)
|
(37
|
)
|
|
(135
|
)
|
|
(47
|
)
|
|
(103
|
)
|
||||||
|
Refranchising gain (loss)
(b)
|
100
|
|
78
|
|
|
(72
|
)
|
|
(63
|
)
|
|
26
|
|
||||||
|
Operating Profit
(c)
|
1,798
|
|
2,294
|
|
|
1,815
|
|
|
1,769
|
|
|
1,590
|
|
||||||
|
Interest expense, net
(c)
|
247
|
|
149
|
|
|
156
|
|
|
175
|
|
|
194
|
|
||||||
|
Income before income taxes
|
1,551
|
|
2,145
|
|
|
1,659
|
|
|
1,594
|
|
|
1,396
|
|
||||||
|
Net Income – including noncontrolling interest
|
1,064
|
|
1,608
|
|
|
1,335
|
|
|
1,178
|
|
|
1,083
|
|
||||||
|
Net Income – YUM! Brands, Inc.
|
1,091
|
|
1,597
|
|
|
1,319
|
|
|
1,158
|
|
|
1,071
|
|
||||||
|
Basic earnings per common share
|
2.41
|
|
3.46
|
|
|
2.81
|
|
|
2.44
|
|
|
2.28
|
|
||||||
|
Diluted earnings per common share
|
2.36
|
|
3.38
|
|
|
2.74
|
|
|
2.38
|
|
|
2.22
|
|
||||||
|
Diluted earnings per common share before Special Items
(c)
|
2.97
|
|
3.25
|
|
|
2.87
|
|
|
2.53
|
|
|
2.17
|
|
||||||
|
Cash Flow Data
|
|
|
|
||||||||||||||||
|
Provided by operating activities
|
$
|
2,139
|
|
$
|
2,294
|
|
|
$
|
2,170
|
|
|
$
|
1,968
|
|
|
$
|
1,404
|
|
|
|
Capital spending, excluding acquisitions and investments
|
1,049
|
|
1,099
|
|
|
940
|
|
|
796
|
|
|
797
|
|
||||||
|
Proceeds from refranchising of restaurants
|
260
|
|
364
|
|
|
246
|
|
|
265
|
|
|
194
|
|
||||||
|
Repurchase shares of Common Stock
|
770
|
|
965
|
|
|
752
|
|
|
371
|
|
|
—
|
|
||||||
|
Dividends paid on Common Stock
|
615
|
|
544
|
|
|
481
|
|
|
412
|
|
|
362
|
|
||||||
|
|
|
|
|
||||||||||||||||
|
Total assets
|
$
|
8,695
|
|
$
|
9,013
|
|
|
$
|
8,834
|
|
|
$
|
8,316
|
|
|
$
|
7,148
|
|
|
|
Long-term debt
|
2,918
|
|
2,932
|
|
|
2,997
|
|
|
2,915
|
|
|
3,207
|
|
||||||
|
Total debt
|
2,989
|
|
2,942
|
|
|
3,317
|
|
|
3,588
|
|
|
3,266
|
|
||||||
|
Other Data
|
|
|
|
||||||||||||||||
|
Number of stores at year end
|
|
|
|
||||||||||||||||
|
Company
|
8,131
|
|
7,578
|
|
|
7,437
|
|
|
7,271
|
|
|
7,666
|
|
||||||
|
Unconsolidated Affiliates
|
716
|
|
660
|
|
|
587
|
|
|
525
|
|
|
469
|
|
||||||
|
Franchisees
|
29,349
|
|
28,608
|
|
|
26,928
|
|
|
27,852
|
|
|
26,745
|
|
||||||
|
Licensees
|
2,115
|
|
2,168
|
|
|
2,169
|
|
|
2,187
|
|
|
2,200
|
|
||||||
|
System
|
40,311
|
|
39,014
|
|
37,121
|
|
37,835
|
|
37,080
|
|
|||||||||
|
China system sales growth
(d)
|
|
|
|
||||||||||||||||
|
Reported
|
(1
|
)%
|
23
|
%
|
|
35
|
%
|
|
18
|
%
|
|
11
|
%
|
||||||
|
Local currency
(e)
|
(4
|
)%
|
20
|
%
|
|
29
|
%
|
|
17
|
%
|
|
10
|
%
|
||||||
|
YRI system sales growth
(d)
|
|
|
|
||||||||||||||||
|
Reported
|
1
|
%
|
2
|
%
|
|
12
|
%
|
|
9
|
%
|
|
(4
|
)%
|
||||||
|
Local currency
(e)
|
5
|
%
|
5
|
%
|
|
7
|
%
|
|
4
|
%
|
|
5
|
%
|
||||||
|
India system sales growth
(d)
|
|||||||||||||||||||
|
Reported
|
11
|
%
|
13
|
%
|
|
36
|
%
|
|
43
|
%
|
|
10
|
%
|
||||||
|
Local currency
(e)
|
20
|
%
|
29
|
%
|
|
35
|
%
|
|
36
|
%
|
|
24
|
%
|
||||||
|
U.S. same store sales growth
(d)
|
—
|
%
|
5
|
%
|
|
(1
|
)%
|
|
1
|
%
|
|
(5
|
)%
|
||||||
|
Shares outstanding at year end
|
443
|
|
451
|
|
460
|
|
469
|
|
469
|
|
|||||||||
|
Cash dividends declared per Common Share
|
$
|
1.41
|
|
$
|
1.24
|
|
|
$
|
1.07
|
|
|
$
|
0.92
|
|
|
$
|
0.80
|
|
|
|
Market price per share at year end
|
$
|
73.87
|
|
$
|
64.72
|
|
$
|
59.01
|
|
$
|
49.66
|
|
$
|
35.38
|
|
||||
Fiscal years 2013, 2012, 2010 and 2009 include 52 weeks and fiscal year 2011 includes 53 weeks. See Management's Discussion and Analysis of Financial Condition and Results of Operations ("MD&A") for discussion of the impact of the 53
rd
week in fiscal year 2011.
19
The selected financial data should be read in conjunction with the Consolidated Financial Statements.
|
(a)
|
Closures and impairment income (expense) includes $295 million of Little Sheep impairment losses in 2013, $80 million of net losses related to the LJS and A&W divestitures in 2011 and $26 million and $12 million of goodwill impairment charges in 2009 recorded within our U.S. Division and Pizza Hut Korea business, respectively.
|
|
(b)
|
See Note 4 for discussion of Refranchising Gain (Loss) for fiscal years 2013, 2012 and 2011. Fiscal year 2010 included a $52 million loss on the refranchising of our Mexico equity market.
|
|
(c)
|
In addition to the results provided in accordance with U.S. Generally Accepted Accounting Principles (“GAAP”) throughout this document, the Company has provided non-GAAP measurements which present operating results on a basis before Special Items. The Company uses earnings before Special Items as a key performance measure of results of operations for the purpose of evaluating performance internally. This non-GAAP measurement is not intended to replace the presentation of our financial results in accordance with GAAP. Rather, the Company believes that the presentation of earnings before Special Items provides additional information to investors to facilitate the comparison of past and present operations, excluding items that the Company does not believe are indicative of our ongoing operations due to their size and/or nature.
|
2013, 2012 and 2011 Special Items are described in further detail within our MD&A. Special Items in 2010 negatively impacted Operating Profit by $77 million, primarily due to $59 million in refranchising losses for equity markets outside the U.S. and U.S. refranchising net losses of $18 million. Special Items in 2009 positively impacted Operating Profit by $18 million, primarily due to a gain of $68 million upon our acquisition of additional ownership interest in, and consolidation of, the operating entity that owns KFCs in Shanghai China, U.S. refranchising net gains of $34 million, offset by investments in our U.S. brands of $32 million, a U.S. goodwill impairment charge of $26 million and charges of $16 million relating to U.S. General and Administrative (“G&A”) productivity initiatives and realignment of resources. These items above resulted in cumulative net tax benefits of $7 million and $5 million in 2010 and 2009, respectively.
|
(d)
|
System sales growth includes the results of all restaurants regardless of ownership, including Company-owned, franchise, unconsolidated affiliate and license restaurants that operate our concepts, except for non-Company-owned restaurants for which we do not receive a sales-based royalty. Sales of franchise, unconsolidated affiliate and license restaurants generate franchise and license fees for the Company (typically at a rate of 4% to 6% of sales). Franchise, unconsolidated affiliate and license restaurant sales are not included in Company sales on the Consolidated Statements of Income; however, the franchise and license fees are included in the Company’s revenues. We believe system sales growth is useful to investors as a significant indicator of the overall strength of our business as it incorporates all of our revenue drivers, Company and franchise same-store sales as well as net unit development. Same-store sales growth includes the estimated growth in sales of all restaurants that have been open and in the YUM system one year or more.
|
|
(e)
|
Local currency represents the percentage change excluding the impact of foreign currency translation. These amounts are derived by translating current year results at prior year average exchange rates. We believe the elimination of the foreign currency translation impact provides better year-to-year comparability without the distortion of foreign currency fluctuations.
|
20
|
Item 7.
|
Management’s Discussion and Analysis of Financial Condition and Results of Operations.
|
Introduction and Overview
The following Management’s Discussion and Analysis (“MD&A”), should be read in conjunction with the Consolidated Financial Statements on pages 53 through 100 (“Financial Statements”) and the Forward-Looking Statements on page 2 and the Risk Factors set forth in Item 1A. Throughout the MD&A, YUM! Brands, Inc. (“YUM” or the “Company”) makes reference to certain performance measures as described below.
|
•
|
The Company provides the percentage changes excluding the impact of foreign currency translation (“FX” or “Forex”). These amounts are derived by translating current year results at prior year average exchange rates. We believe the elimination of the foreign currency translation impact provides better year-to-year comparability without the distortion of foreign currency fluctuations.
|
|
•
|
System sales growth includes the results of all restaurants regardless of ownership, including Company-owned, franchise, unconsolidated affiliate and license restaurants that operate our Concepts, except for non-company-owned restaurants for which we do not receive a sales-based royalty. Sales of franchise, unconsolidated affiliate and license restaurants generate franchise and license fees for the Company (typically at a rate of 4% to 6% of sales). Franchise, unconsolidated affiliate and license restaurant sales are not included in Company sales on the Consolidated Statements of Income; however, the franchise and license fees are included in the Company’s revenues. We believe system sales growth is useful to investors as a significant indicator of the overall strength of our business as it incorporates all of our revenue drivers, Company and franchise same-store sales as well as net unit development.
|
|
•
|
Same-store sales is the estimated growth in sales of all restaurants that have been open and in the YUM system one year or more. The impact of same-store sales growth on both our Company-owned store results and Franchise and license fees and income is described elsewhere in this MD&A.
|
|
•
|
Company restaurant profit is defined as Company sales less expenses incurred directly by our Company restaurants in generating Company sales. Company restaurant margin as a percentage of sales is defined as Company restaurant profit divided by Company sales.
|
|
•
|
Operating margin is defined as Operating Profit divided by Total revenue.
|
All Note references herein refer to the Notes to the Financial Statements on pages 59 through 100. Tabular amounts are displayed in millions of U.S. dollars except per share and unit count amounts, or as otherwise specifically identified. Percentages may not recompute due to rounding.
Description of Business
YUM has over 40,000 restaurants in more than 125 countries and territories operating primarily under the KFC, Pizza Hut or Taco Bell brands, which are the global leaders in the chicken, pizza and Mexican-style food categories, respectively. Of the over 40,000 restaurants, 20% are operated by the Company, 75% are operated by franchisees and unconsolidated affiliates and 5% are operated by licensees.
As of and through December 28, 2013, YUM’s business consists of four reporting segments: YUM China ("China" or "China Division"), YUM Restaurants International (“YRI” or “International Division”), United States ("U.S.") and YUM Restaurants India ("India" or "India Division"). The China Division includes mainland China and the India Division includes India, Bangladesh, Mauritius, Nepal and Sri Lanka. YRI includes the remainder of our international operations. The China Division, YRI and Taco Bell U.S. represent approximately 90% of the Company’s operating profits, excluding Corporate and unallocated income and expenses.
In the first quarter of 2014, we will combine our YRI and U.S. businesses and begin reporting segment information for three global divisions: KFC, Pizza Hut and Taco Bell. China and India will remain separate reporting segments due to their strategic importance and growth potential. This new structure is designed to drive greater global brand focus, enabling us to more effectively share know-how and accelerate growth. While our consolidated results will not be impacted, we will restate our historical segment information during 2014 for consistent presentation.
21
In 2012, our India Division began being reported as a standalone reporting segment separate from YRI as a result of changes to our management reporting structure. While our consolidated results are not impacted, our historical segment information has been restated to be consistent with the current period presentation.
In December of 2011 we sold our Long John Silver's ("LJS") and A&W All American Food Restaurants ("A&W") brands to key franchise leaders and strategic investors in separate transactions. The results for these businesses through the sale dates are included in the Company's results for 2011.
Strategies
The Company has historically focused on the following four key strategies:
Build Leading Brands in China in Every Significant Category
– The Company has developed the KFC and Pizza Hut brands into the leading quick service and casual dining restaurant brands, respectively, in mainland China. Additionally, the Company owns and operates the distribution system for its restaurants in China which we believe provides a significant competitive advantage. Given this strong competitive position, a growing economy and a population of 1.4 billion in mainland China, the Company is rapidly adding KFC and Pizza Hut Casual Dining restaurants, beginning to develop Pizza Hut Home Service (home delivery) and testing the additional restaurant concept of East Dawning (Chinese food). Additionally, on February 1, 2012 we acquired an additional 66% interest in Little Sheep Group Ltd. ("Little Sheep"), a leading casual dining concept in China. This acquisition brought our total ownership to approximately 93% of the business. Our ongoing earnings growth model in China includes low double-digit percentage unit growth, mid-single digit same-store sales growth and moderate margin improvement, which we expect to drive Operating Profit growth of 15%.
Drive Aggressive International Expansion and Build Strong Brands Everywhere
– Outside the U.S. and China the Company and its franchisees opened over 1,200 new restaurants in 2013, representing 14 straight years of opening over 700 restaurants, and the Company is one of the leading international retail developers in terms of units opened. The Company expects to continue to experience strong growth by building out existing markets and growing in new markets including India, France, Germany, Russia and across Africa. The International Division’s Operating Profit has experienced a 10-year compound annual growth rate of approximately 12%. Our ongoing earnings growth model for YRI includes Operating Profit growth of 10% driven by 3-4% unit growth, system sales growth of 6%, at least 2-3% same-store sales growth, margin improvement and leverage of our G&A infrastructure.
Dramatically Improve U.S. Brand Positions, Consistency and Returns
– The Company continues to focus on improving its U.S. position through differentiated products and marketing and an improved customer experience. The Company also strives to provide industry-leading new product innovation which adds sales layers and expands day parts. We continue to evaluate our returns and ownership positions with an earn-the-right-to-own philosophy on Company-owned restaurants. Our ongoing earnings growth model for the U.S. calls for Operating Profit growth of 5% driven by same-store sales growth of at least 2%, margin improvement and leverage of our G&A infrastructure.
Drive Industry-Leading, Long-Term Shareholder and Franchisee Value
– The Company is focused on delivering high returns and returning substantial cash flows to its shareholders via dividends and share repurchases. The Company has one of the highest returns on invested capital in the QSR industry. The Company’s dividend and share repurchase programs have returned over $3.3 billion and $8.5 billion to shareholders, respectively, since 2004. The Company targets an annual dividend payout ratio of 35% to 40% of net income and has increased the quarterly dividend at a double-digit percentage rate each year since first initiating a dividend in 2004. Shares are repurchased opportunistically as part of our regular capital structure decisions.
Our ongoing earnings growth model, including the components above, is expected to generate EPS growth of at least 10% annually. However, due primarily to poor performance in our China Division, the Company's 2013 EPS prior to Special Items declined 9%. Our 2014 EPS prior to Special Items is expected to grow at least 20% due in large part to our expectations that China Division Operating Profit for 2014 will grow at a rate significantly above the ongoing growth rate of 15% indicated above.
22
2013 Highlights
|
●
|
KFC China sales and profits were significantly impacted by the effects of the December 2012 poultry supply incident, as well as subsequent news of avian flu.
|
|
|
●
|
Worldwide system sales grew 2%, prior to foreign currency translation, including 5% growth at YRI and 1% growth in the U.S. System sales declined 4% in China.
|
|
|
●
|
Same-store sales declined 13% in China. Same-store sales grew 1% at YRI and were flat in the U.S.
|
|
|
●
|
Total international development was 1,952 new restaurants.
|
|
|
●
|
Worldwide restaurant margin declined 1.6 percentage points to 15.0%, including a decline of 2.7 percentage points in China. Restaurant margin was even at YRI and increased 0.6 percentage points in the U.S.
|
|
|
●
|
Worldwide operating profit declined 10%, prior to foreign currency translation, including a decline of 26% in China. Operating profit grew 10% at YRI and 3% in the U.S.
|
|
|
●
|
Worldwide effective tax rate increased to 28.0% from 25.8%, driven primarily by a tax reserve adjustment in the third quarter. The tax rate increase negatively impacted 2013 EPS results by 3 percentage points.
|
|
|
●
|
A non-cash, Special Items net charge of $258 million related to the write-down of Little Sheep intangible assets was recorded in the third quarter. This charge impacted reported EPS by 16 percentage points for the full year.
|
|
|
●
|
The Company repurchased $550 million of outstanding debt in the fourth quarter and recorded a Special Items net charge of approximately $75 million, primarily due to premiums paid related to this transaction. This charge impacted reported EPS by 5 percentage points for the full year.
|
|
All preceding comparisons are versus the same period a year ago and exclude the impact of Special Items unless otherwise noted. See the Significant Known Events, Trends or Uncertainties Impacting or Expected to Impact Comparisons of Reported or Future Results section of this MD&A for a description of Special Items.
23
Results of Operations
|
|
Amount
|
% B/(W)
|
|||||||||||||||||||
|
|
2013
|
2012
|
2011
|
2013
|
2012
|
||||||||||||||||
|
Company sales
|
$
|
11,184
|
|
$
|
11,833
|
|
|
$
|
10,893
|
|
|
(5
|
)
|
|
9
|
|
|||||
|
Franchise and license fees and income
|
1,900
|
|
1,800
|
|
|
1,733
|
|
|
6
|
|
|
4
|
|
||||||||
|
Total revenues
|
$
|
13,084
|
|
$
|
13,633
|
|
|
$
|
12,626
|
|
|
(4
|
)
|
|
8
|
|
|||||
|
Company restaurant profit
|
$
|
1,683
|
|
$
|
1,981
|
|
|
$
|
1,753
|
|
|
(15
|
)
|
|
13
|
|
|
||||
|
% of Company sales
|
15.0
|
%
|
16.7
|
%
|
16.1
|
%
|
(1.7
|
)
|
ppts.
|
0.6
|
|
ppts.
|
|||||||||
|
Operating Profit
|
$
|
1,798
|
|
$
|
2,294
|
|
|
$
|
1,815
|
|
|
(22
|
)
|
|
26
|
|
|
||||
|
Interest expense, net
|
247
|
|
149
|
|
|
156
|
|
|
(66
|
)
|
|
5
|
|
|
|||||||
|
Income tax provision
|
487
|
|
537
|
|
|
324
|
|
|
9
|
|
(66
|
)
|
|
||||||||
|
Net Income – including noncontrolling interests
|
1,064
|
|
1,608
|
|
|
1,335
|
|
|
(34
|
)
|
|
20
|
|
|
|||||||
|
Net Income (loss) – noncontrolling interests
|
(27
|
)
|
11
|
|
|
16
|
|
|
NM
|
|
35
|
|
|||||||||
|
Net Income – YUM! Brands, Inc.
|
$
|
1,091
|
|
$
|
1,597
|
|
|
$
|
1,319
|
|
|
(32
|
)
|
|
21
|
|
|
||||
|
Diluted EPS
(a)
|
$
|
2.36
|
|
$
|
3.38
|
|
|
$
|
2.74
|
|
|
(30
|
)
|
|
23
|
|
|
||||
|
Diluted EPS before Special Items
(a)
|
$
|
2.97
|
|
$
|
3.25
|
|
|
$
|
2.87
|
|
|
(9
|
)
|
|
13
|
|
|
||||
|
Reported Effective tax rate
|
31.4%
|
25.0%
|
|
19.5%
|
|
|
|
||||||||||||||
|
Effective tax rate before Special Items
|
28.0%
|
25.8%
|
|
24.2%
|
|
||||||||||||||||
|
(a)
|
See Note 3 for the number of shares used in these calculations.
|
Significant Known Events, Trends or Uncertainties Impacting or Expected to Impact Comparisons of Reported or Future Results
Special Items
In addition to the results provided in accordance with U.S. Generally Accepted Accounting Principles (“GAAP”) above and throughout this document, the Company has provided non-GAAP measurements which present operating results in 2013, 2012 and 2011 on a basis before Special Items.
The Company uses earnings before Special Items as a key performance measure of results of operations for the purpose of evaluating performance internally, and Special Items are not included in our China, YRI, U.S. or India segment results. This non-GAAP measurement is not intended to replace the presentation of our financial results in accordance with GAAP. Rather, the Company believes that the presentation of earnings before Special Items provides additional information to investors to facilitate the comparison of past and present operations, excluding items in 2013, 2012 and 2011 that the Company does not believe are indicative of our ongoing operations due to their size and/or nature.
24
The table below details items classified as Special Items.
|
|
Year
|
|||||||||||
|
Detail of Special Items
|
2013
|
2012
|
2011
|
|||||||||
|
U.S. Refranchising gain (loss)
|
$
|
91
|
|
$
|
122
|
|
$
|
(17
|
)
|
|||
|
Pension settlement charges
|
(10
|
)
|
(84
|
)
|
—
|
|
||||||
|
Little Sheep impairment
|
(295
|
)
|
—
|
|
—
|
|
||||||
|
Gain upon acquisition of Little Sheep
|
—
|
|
74
|
|
—
|
|
||||||
|
Losses associated with the refranchising of the Pizza Hut UK dine-in business
|
(1
|
)
|
(70
|
)
|
(76
|
)
|
||||||
|
Losses and other costs relating to the LJS and A&W divestitures
|
—
|
|
—
|
|
(86
|
)
|
||||||
|
Other Special Items Income (Expense)
|
(7
|
)
|
16
|
|
(8
|
)
|
||||||
|
Special Items Income (Expense) - Operating Profit
|
(222
|
)
|
58
|
|
(187
|
)
|
||||||
|
Losses related to the extinguishment of debt - Interest Expense, net
|
(118
|
)
|
—
|
|
—
|
|
||||||
|
Special Items Income (Expense) before income taxes
|
(340
|
)
|
58
|
|
(187
|
)
|
||||||
|
Tax Benefit (Expense) on Special Items
(a)
|
41
|
|
1
|
|
123
|
|
||||||
|
Special Items Income (Expense), net of tax - including noncontrolling interests
|
(299
|
)
|
59
|
|
(64
|
)
|
||||||
|
Special Items Income (Expense), net of tax - noncontrolling interests
|
19
|
|
—
|
|
—
|
|
||||||
|
Special Items Income (Expense), net of tax - YUM! Brands, Inc.
|
$
|
(280
|
)
|
$
|
59
|
|
$
|
(64
|
)
|
|||
|
Average diluted shares outstanding
|
461
|
|
473
|
|
481
|
|
||||||
|
Special Items diluted EPS
|
$
|
(0.61
|
)
|
$
|
0.13
|
|
$
|
(0.13
|
)
|
|||
|
Reconciliation of Operating Profit Before Special Items to Reported Operating Profit
|
|
|
||||||||||
|
Operating Profit before Special Items
|
$
|
2,020
|
|
$
|
2,236
|
|
$
|
2,002
|
|
|||
|
Special Items Income (Expense) - Operating Profit
|
(222
|
)
|
58
|
|
(187
|
)
|
||||||
|
Reported Operating Profit
|
$
|
1,798
|
|
|
$
|
2,294
|
|
|
$
|
1,815
|
|
|
|
Reconciliation of EPS Before Special Items to Reported EPS
|
|
|
||||||||||
|
Diluted EPS before Special Items
|
$
|
2.97
|
|
|
$
|
3.25
|
|
|
$
|
2.87
|
|
|
|
Special Items EPS
|
(0.61
|
)
|
0.13
|
|
(0.13
|
)
|
||||||
|
Reported EPS
|
$
|
2.36
|
|
|
$
|
3.38
|
|
|
$
|
2.74
|
|
|
|
Reconciliation of Effective Tax Rate Before Special Items to Reported Effective Tax Rate
|
|
|
|
|||||||||
|
Effective Tax Rate before Special Items
|
28.0
|
%
|
25.8
|
%
|
24.2
|
%
|
||||||
|
Impact on Tax Rate as a result of Special Items
(a)
|
3.4
|
%
|
(0.8
|
)%
|
(4.7
|
)%
|
||||||
|
Reported Effective Tax Rate
|
31.4
|
%
|
|
25.0
|
%
|
|
19.5
|
%
|
||||
|
(a)
|
The tax benefit (expense) was determined based upon the impact of the nature, as well as the jurisdiction of the respective individual components within Special Items.
|
25
U.S. Refranchising gain (loss)
In the years ended December 28, 2013 and December 29, 2012, we recorded pre-tax refranchising gains of $91 million and $122 million, respectively, in the U.S. primarily due to gains on sales of Taco Bell restaurants. In the year ended December 31, 2011, we recorded pre-tax losses of $17 million from refranchising in the U.S., which were primarily the net result of gains from restaurants sold and non-cash impairment charges related to our offers to refranchise restaurants in the U.S., principally a substantial portion of our Company-owned KFC restaurants. Refranchising gains and losses are more fully discussed in Note 4 and the Store Portfolio Strategy Section of the MD&A.
Pension Settlement Charges
During the fourth quarter of 2012 and continuing through 2013, the Company allowed certain former employees with deferred vested balances in our U.S. pension plans an opportunity to voluntarily elect an early payout of their pension benefits. The majority of these payouts were funded from existing pension assets.
As a result of settlement payments from the programs discussed above exceeding the sum of service and interest costs within these U.S. pension plans in 2013 and 2012, pursuant to our accounting policy we recorded pre-tax settlement charges of $10 million and $84 million for the years ended December 28, 2013 and December 29, 2012, respectively, in General and administrative expenses. See Note 14 for further discussion of our pension plans.
Little Sheep Acquisition and Subsequent Impairment
On February 1, 2012 we acquired an additional 66% interest in Little Sheep Group Limited (“Little Sheep”) for $540 million, net of cash acquired of $44 million, increasing our ownership to 93%. The acquisition was driven by our strategy to build leading brands across China in every significant category. Prior to our acquisition of this additional interest, our 27% interest in Little Sheep was accounted for under the equity method of accounting. As a result of the acquisition we obtained voting control of Little Sheep, and thus we began consolidating Little Sheep upon acquisition. As required by GAAP, we remeasured our previously held 27% ownership in Little Sheep, which had a recorded value of $107 million at the date of acquisition, at fair value based on Little Sheep's traded share price immediately prior to our offer to purchase the business and recognized a non-cash gain of $74 million. This gain, which resulted in no related income tax expense, was recorded in Other (income) expense on our Consolidated Statement of Income in 2012.
Under the equity method of accounting, we previously reported our 27% share of the net income of Little Sheep as Other (income) expense in the Consolidated Statements of Income. Since the acquisition, we have reported Little Sheep's results of operations in the appropriate line items of our Consolidated Statement of Income. We no longer report Other (income) expense as we did under the equity method of accounting. Net income attributable to our partner's ownership percentage is recorded in Net Income (loss) - noncontrolling interests. In 2012, the consolidation of Little Sheep increased China Division Revenues by 4%, decreased China Restaurant Margin by 0.4 percentage points and did not have a significant impact on China Division Operating Profit versus 2011.
The purchase price paid for the additional 66% interest and the resulting purchase price allocation assumed same-store sales growth and new unit development for the brand. As a result of consolidating Little Sheep, the primary assets recorded in 2012 were an indefinite-lived Little Sheep trademark and goodwill of approximately $400 million and $375 million, respectively. The goodwill was assigned to the newly formed Little Sheep reporting unit within our China Division.
Little Sheep's sales were negatively impacted by a longer than expected purchase approval and ownership transition phase. Our efforts to regain sales momentum were significantly compromised in May 2013 due to negative publicity regarding quality issues with unrelated hot pot concepts in China, even though there was not an issue with the quality of Little Sheep products.
While we remain confident in the long-term potential of Little Sheep, the sustained declines in sales and profits that began in May 2013 and continued through the third quarter, coupled with the anticipated time it will now take for the business to recover, resulted in a determination during the quarter ended September 7, 2013 that it was not more likely than not that the Little Sheep trademark and reporting unit fair values were in excess of their carrying values. Therefore, our Little Sheep trademark and goodwill were tested for impairment in the quarter ended September 7, 2013, prior to the annual impairment reviews performed in the fourth quarter of each year in accordance with our accounting policy.
26
As a result of comparing the trademark’s fair value of $345 million to its carrying value of $414 million, an impairment charge of $69 million was recorded. Additionally, after determining the fair value of the Little Sheep reporting unit was less than its carrying value, goodwill was written down to $162 million, resulting in an impairment charge of $222 million. The Company also evaluated other Little Sheep long-lived assets for impairment and recorded a $4 million impairment charge related to restaurant-level PP&E.
These non-cash impairment charges totalling $295 million were recorded in Closures and impairment (income) expense on our Consolidated Statement of Income. We recorded an $18 million tax benefit associated with these impairments and allocated $19 million of the after-tax impairment charges to Net Income (loss) - noncontrolling interests, which resulted in a net impairment charge of $258 million allocated to Net Income - YUM! Brands, Inc.
Losses Associated With the Refranchising of the Pizza Hut UK Dine-in Business
During the fourth quarter of 2012, we refranchised our remaining 331 Company-owned Pizza Hut dine-in restaurants in the United Kingdom ("UK"). The franchise agreement for these stores allows the franchisee to pay continuing franchise fees in the initial years of the agreement at a reduced rate. We agreed to allow the franchisee to pay these reduced fees in part as consideration for their assumption of lease liabilities related to underperforming stores that we anticipate they will close that were part of the refranchising. We recognize the estimated value of terms in franchise agreements entered into concurrently with a refranchising transaction that are not consistent with market terms as part of the upfront refranchising gain (loss). Accordingly, upon the closing of this refranchising in the fourth quarter of 2012, we recognized a loss of $53 million representing the estimated value of these reduced continuing fees. The associated deferred credit is being amortized into YRI's Franchise and license fees and income through 2016. This upfront loss largely contributed to a $70 million Refranchising loss we recognized in Special Items during 2012, net of income tax benefits of $9 million. During 2011, we recorded a $76 million charge in Refranchising gain (loss) as a result of our decision to refranchise or close all of the remaining Company-owned Pizza Hut UK dine-in restaurants, primarily to write down these restaurants' long-lived assets to their then estimated fair value.
For the year ended December 28, 2013, the refranchising of the Pizza Hut UK dine-in restaurants decreased Company sales by 18% and increased Franchise and license fees and income and Operating Profit by 2% and 3%, respectively, for the YRI Division versus 2012.
Losses and Other Costs Relating to the LJS and A&W Divestitures
In 2011, we sold the Long John Silver's and A&W All American Food Restaurants brands to key franchise leaders and strategic investors in separate transactions. We recognized $86 million of losses and other costs primarily in Closures and impairment (income) expenses as a result of our decision to sell these businesses. Additionally, we recognized $104 million of tax benefits related to these divestitures. In 2012 as compared to 2011, System sales and Franchise and license fees and income in the U.S. were negatively impacted by 5% and 6%, respectively, due to these divestitures while YRI's system sales and Franchise and license fees and income were both negatively impacted by 1%. While these divestitures negatively impacted both the U.S. and YRI segments' Operating Profit by 1% in 2012, the impact on our consolidated Operating Profit was not significant.
Other Special Items Income (Expense)
In connection with the aforementioned refranchising of stores in the U.S., we have taken several measures to transform our U.S. business, including G&A productivity initiatives and realignment of resources (primarily severance and early retirement costs). Other Special Items Income (Expense) in 2013 includes charges relating to these U.S. G&A productivity initiatives and realignment of resources of $5 million as well as $2 million of costs recorded in G&A that were part of the $120 million charge related to the extinguishment of debt. Other Special Items Income (Expense) in 2012 includes the depreciation reduction from the Pizza Hut UK and KFC U.S. restaurants impaired upon our decision or offer to refranchise that remained Company stores for some or all of the periods presented of $13 million and $3 million, respectively, gains from real estate sales related to our previously refranchised Mexico business of $3 million and charges relating to U.S. G&A productivity initiatives and realignment of resources of $5 million. Other Special Items Income (Expense) in 2011 includes the depreciation reduction from the Pizza Hut UK and KFC U.S. restaurants impaired upon our decision or offer to refranchise that remained Company stores for some or all of the periods presented of $3 million and $10 million, respectively, and charges relating to U.S. G&A productivity initiatives and realignment of resources of $21 million.
27
Losses Related to the Extinguishment of Debt
During the fourth quarter of 2013, we completed a cash tender offer to repurchase $550 million of our Senior Unsecured Notes due either March 2018 or November 2037. This transaction resulted in $120 million of losses as a result of premiums paid and other costs, $118 million of which was classified as Interest expense, net in our Consolidated Statement of Income. The repurchase of the Senior Unsecured Notes was funded primarily by proceeds of $599 million received from the issuance of new Senior Unsecured Notes. See Note 10 for further discussion on the issuance of Senior Unsecured Notes.
China Poultry Supply Incident and Avian Flu
In late December 2012 our KFC China sales began to be negatively impacted by intense media attention surrounding an investigation by the Shanghai FDA (SFDA) into poultry supply management at our China Division. In January 2013 the SFDA concluded its investigation and released its recommendations to Yum! China. During 2013 our team in China undertook a comprehensive review of our supply chain, incorporated the SFDA’s recommendations and, as part of our commitment to quality, took additional steps to further strengthen our overall poultry supply chain practices, including increased testing of product received from suppliers. As a result of increased product testing and additional regulatory scrutiny, instances of supplier noncompliance are identified from time to time, leading to related actions by us and regulatory authorities, including the termination of certain suppliers in accordance with our policies.
KFC China sales were further negatively impacted beginning in April of 2013 by the intense media surrounding avian flu in China. The combined impacts of the media attention surrounding the SFDA investigation and avian flu resulted in a 13% decline in China Division same-store sales for the full year. Operating Profit for 2013 declined 26%, prior to foreign currency translation, due primarily to sales de-leverage at KFC.
As the extensive publicity in 2013 around these two events subsided, KFC China’s sales began to recover, and same-store sales improved in each consecutive month during China Division's fourth quarter. KFC China’s fourth quarter same-store sales declined 4% compared to same store sales declines of 15% for the full year.
Given the momentum of the KFC business and the continued strength of Pizza Hut Casual Dining, China Division 2014 Operating Profit is expected to return to 2012 levels of more than $1 billion.
In light of increased attention on food safety issues in China generally, and on poultry supply in particular, as well as recent reports of avian flu in China, further reports relating to either issue could have a material adverse effect on our sales and results of operations for our China Division. See Item IA “Risk Factors” on page 8 for a discussion of risks relating to food safety and avian flu.
Extra Week in 2011
Our fiscal calendar results in a 53
rd
week every five or six years. Fiscal year 2011 included a 53
rd
week in the fourth quarter for all our U.S. businesses and certain of our YRI businesses that report on a period, as opposed to a monthly, basis. Our China and India Divisions report on a monthly basis and thus did not have a 53
rd
week in 2011.
28
See the System Sales Growth section within our MD&A for further discussion on the impact of 53
rd
week in 2011 on system sales. The following table summarizes the estimated impact of the 53
rd
week in 2011 on revenues and Operating Profit:
|
U.S.
|
YRI
|
Unallocated
|
Total
|
|||||||||||||
|
Revenues
|
||||||||||||||||
|
Company sales
|
$
|
43
|
|
$
|
29
|
|
$
|
—
|
|
$
|
72
|
|
||||
|
Franchise and license fees
|
13
|
|
6
|
|
—
|
|
19
|
|
||||||||
|
Total Revenues
|
$
|
56
|
|
$
|
35
|
|
$
|
—
|
|
$
|
91
|
|
||||
|
Operating Profit
|
||||||||||||||||
|
Franchise and license fees
|
$
|
13
|
|
$
|
6
|
|
$
|
—
|
|
$
|
19
|
|
||||
|
Restaurant profit
|
9
|
|
6
|
|
—
|
|
15
|
|
||||||||
|
General and administrative expenses
|
(4
|
)
|
(4
|
)
|
(1
|
)
|
(9
|
)
|
||||||||
|
Operating Profit
(a)
|
$
|
18
|
|
$
|
8
|
|
$
|
(1
|
)
|
$
|
25
|
|
||||
|
(a)
|
The $25 million benefit was offset throughout 2011 by investments, including franchise development incentives, as well as higher-than-normal spending, such as restaurant closures in the U.S. and YRI.
|
Store Portfolio Strategy
From time to time we sell Company restaurants to existing and new franchisees where geographic synergies can be obtained or where franchisees’ expertise can generally be leveraged to improve our overall operating performance, while retaining Company ownership of strategic U.S. and international markets in which we choose to continue investing capital. We refranchised 214, 468 and 404 Company restaurants in the U.S. in the years ended December 28, 2013, December 29, 2012 and December 31, 2011, respectively. Additionally, in December 2012 we refranchised 331 remaining Company-owned dine-in restaurants in the Pizza Hut UK business.
The following table summarizes our worldwide refranchising activities, including amounts characterized as Special Items:
|
2013
|
2012
|
2011
|
||||||||||
|
Number of units refranchised
|
286
|
|
897
|
|
529
|
|
||||||
|
Refranchising proceeds, pre-tax
|
$
|
260
|
|
$
|
364
|
|
|
$
|
246
|
|
||
|
Refranchising (gain) loss, pre-tax
|
$
|
(100
|
)
|
$
|
(78
|
)
|
|
$
|
72
|
|
||
Refranchisings reduce our reported revenues and restaurant profits and increase the importance of system sales growth as a key performance measure. Additionally, G&A expenses will decline and franchise and license expense can increase over time as a result of these refranchising activities. The timing of G&A declines will vary and often lag the actual refranchising activities as the synergies are typically dependent upon the size and geography of the respective deals. G&A expenses included in the tables below reflect only direct G&A expenses that we no longer incurred as a result of stores that were operated by us for all or a portion of the respective previous year and were no longer operated by us as of the last day of the respective current year.
The impact on Operating Profit arising from refranchising is the net of (a) the estimated reductions in restaurant profit and G&A expenses and (b) the increase in franchise fees and expenses from the restaurants that have been refranchised. The tables presented below reflect the impacts on Total revenues and on Operating Profit from stores that were operated by us for all or some portion of the respective previous year and were no longer operated by us as of the last day of the respective current year. In these tables, Decreased Company sales and Decreased Restaurant profit represents the amount of Company sales or restaurant profit earned by the refranchised restaurants during the period we owned them in the prior year but did not own them in the current year. Increased Franchise and license fees and income represents the franchise and license fees and rent income from the refranchised restaurants that were recorded by the Company in the current year during periods in which the restaurants were Company stores in the prior year. Increased Franchise and license expenses represent primarily rent and depreciation where we continue to own or lease the underlying property for the refranchised restaurants that were recorded by the Company in the current year during periods in which the restaurants were Company stores in the prior year.
29
The following table summarizes the impact of refranchising on Total revenues as described above:
|
|
2013
|
|||||||||||||||||||
|
|
China
|
YRI
|
U.S.
|
India
|
Worldwide
|
|||||||||||||||
|
Decreased Company sales
|
$
|
(54
|
)
|
$
|
(439
|
)
|
$
|
(481
|
)
|
$
|
—
|
|
$
|
(974
|
)
|
|||||
|
Increased Franchise and license fees and income
|
7
|
|
23
|
|
32
|
|
—
|
|
62
|
|
||||||||||
|
Decrease in Total revenues
|
$
|
(47
|
)
|
$
|
(416
|
)
|
$
|
(449
|
)
|
$
|
—
|
|
$
|
(912
|
)
|
|||||
|
|
2012
|
|||||||||||||||||||
|
|
China
|
YRI
|
U.S.
|
India
|
Worldwide
|
|||||||||||||||
|
Decreased Company sales
|
$
|
(54
|
)
|
$
|
(113
|
)
|
$
|
(606
|
)
|
$
|
—
|
|
$
|
(773
|
)
|
|||||
|
Increased Franchise and license fees and income
|
9
|
|
10
|
|
43
|
|
—
|
|
62
|
|
||||||||||
|
Decrease in Total revenues
|
$
|
(45
|
)
|
$
|
(103
|
)
|
$
|
(563
|
)
|
$
|
—
|
|
$
|
(711
|
)
|
|||||
The following table summarizes the impact of refranchising on Operating Profit as described above:
|
|
2013
|
|||||||||||||||||||
|
|
China
|
YRI
|
U.S.
|
India
|
Worldwide
|
|||||||||||||||
|
Decreased Restaurant profit
|
$
|
(6
|
)
|
$
|
(32
|
)
|
$
|
(59
|
)
|
$
|
—
|
|
$
|
(97
|
)
|
|||||
|
Increased Franchise and license fees and income
|
7
|
|
23
|
|
32
|
|
—
|
|
62
|
|
||||||||||
|
Increased Franchise and license expenses
|
(4
|
)
|
(3
|
)
|
(2
|
)
|
—
|
|
(9
|
)
|
||||||||||
|
Decreased G&A
|
—
|
|
22
|
|
7
|
|
—
|
|
29
|
|
||||||||||
|
Increase (decrease) in Operating Profit
|
$
|
(3
|
)
|
$
|
10
|
|
$
|
(22
|
)
|
$
|
—
|
|
$
|
(15
|
)
|
|||||
|
|
2012
|
|||||||||||||||||||
|
|
China
|
YRI
|
U.S.
|
India
|
Worldwide
|
|||||||||||||||
|
Decreased Restaurant profit
|
$
|
(8
|
)
|
$
|
(7
|
)
|
$
|
(46
|
)
|
$
|
—
|
|
$
|
(61
|
)
|
|||||
|
Increased Franchise and license fees and income
|
9
|
|
10
|
|
43
|
|
—
|
|
62
|
|
||||||||||
|
Increased Franchise and license expenses
|
(4
|
)
|
(4
|
)
|
(6
|
)
|
—
|
|
(14
|
)
|
||||||||||
|
Decreased G&A
|
—
|
|
2
|
|
12
|
|
—
|
|
14
|
|
||||||||||
|
Increase (decrease) in Operating Profit
|
$
|
(3
|
)
|
$
|
1
|
|
$
|
3
|
|
$
|
—
|
|
$
|
1
|
|
|||||
Internal Revenue Service Proposed Adjustments
On June 23, 2010, the Company received a Revenue Agent Report (RAR) from the Internal Revenue Service (the "IRS") relating to its examination of our U.S. federal income tax returns for fiscal years 2004 through 2006. The IRS has proposed an adjustment to increase the taxable value of rights to intangibles used outside the U.S. that YUM transferred to certain of its foreign subsidiaries. The proposed adjustment would result in approximately $700 million of additional taxes plus net interest to date of approximately $255 million for fiscal years 2004-2006. On January 9, 2013, the Company received an RAR from the IRS for fiscal years 2007 and 2008. As expected, the IRS proposed an adjustment similar to their proposal for 2004-2006 that would result in approximately $270 million of additional taxes plus net interest to date of approximately $40 million for fiscal years 2007 and 2008. Furthermore, the Company expects the IRS to make similar claims for years subsequent to fiscal 2008. The potential additional taxes for 2009 through 2013, computed on a similar basis to the 2004-2008 additional taxes, would be approximately $140 million plus net interest to date of approximately $10 million.
30
For 2013, our effective tax rate, excluding Special Items, increased from 25.8% in 2012 to 28.0% primarily as a result of an incremental provision recorded related to this matter. We believe we have properly reported our taxable income and paid taxes consistent with all applicable laws and intend to vigorously defend our position, including through litigation, if we are unable to settle with the IRS through administrative proceedings. As the final resolution of the proposed adjustments remains uncertain, there can be no assurance that payments due upon final resolution of this issue will not exceed our currently recorded reserve and such payments could have a material adverse effect on our financial position. Additionally, if increases to our reserves are deemed necessary due to future developments related to this issue, such increases could have a material adverse effect on our results of operations as they are recorded. The Company does not expect resolution of this matter within twelve months and cannot predict with certainty the timing of such resolution.
Restaurant Unit Activity
|
Worldwide
|
Franchisees
|
Company
|
Unconsolidated Affiliates
|
Total Excluding Licensees
(a)
|
||||
|
Balance at end of 2011
|
26,928
|
7,437
|
587
|
34,952
|
||||
|
New Builds
|
1,274
|
989
|
82
|
2,345
|
||||
|
Acquisitions
(b)
|
268
|
204
|
—
|
472
|
||||
|
Refranchising
|
897
|
(897)
|
—
|
—
|
||||
|
Closures
|
(756)
|
(155)
|
(9)
|
(920)
|
||||
|
Other
|
(3)
|
—
|
—
|
(3)
|
||||
|
Balance at end of 2012
|
28,608
|
7,578
|
660
|
36,846
|
||||
|
New Builds
|
1,358
|
940
|
66
|
2,364
|
||||
|
Acquisitions
|
(138)
|
138
|
—
|
—
|
||||
|
Refranchising
|
286
|
(286)
|
—
|
—
|
||||
|
Closures
|
(773)
|
(239)
|
(10)
|
(1,022)
|
||||
|
Other
|
8
|
—
|
—
|
8
|
||||
|
Balance at end of 2013
|
29,349
|
8,131
|
716
|
38,196
|
||||
|
% of Total
|
77%
|
21%
|
2%
|
100%
|
||||
|
China
|
Franchisees
|
Company
|
Unconsolidated Affiliates
|
Total Excluding Licensees
(a)
|
||||
|
Balance at end of 2011
|
201
|
3,705
|
587
|
4,493
|
||||
|
New Builds
|
25
|
782
|
82
|
889
|
||||
|
Acquisitions
(b)
|
273
|
199
|
—
|
472
|
||||
|
Refranchising
|
53
|
(53)
|
—
|
—
|
||||
|
Closures
|
(33)
|
(86)
|
(9)
|
(128)
|
||||
|
Balance at end of 2012
|
519
|
4,547
|
660
|
5,726
|
||||
|
New Builds
|
10
|
664
|
66
|
740
|
||||
|
Acquisitions
|
(1)
|
1
|
—
|
—
|
||||
|
Refranchising
|
28
|
(28)
|
—
|
—
|
||||
|
Closures
|
(55)
|
(158)
|
(10)
|
(223)
|
||||
|
Balance at end of 2013
|
501
|
5,026
|
716
|
6,243
|
||||
|
% of Total
|
8%
|
81%
|
11%
|
100%
|
||||
31
|
YRI
|
Franchisees
|
Company
|
Unconsolidated Affiliates
|
Total Excluding Licensees
(a)
|
||||
|
Balance at end of 2011
|
12,476
|
1,511
|
—
|
13,987
|
||||
|
New Builds
|
873
|
76
|
—
|
949
|
||||
|
Acquisitions
|
(2)
|
2
|
—
|
—
|
||||
|
Refranchising
|
376
|
(376)
|
—
|
—
|
||||
|
Closures
|
(400)
|
(35)
|
—
|
(435)
|
||||
|
Other
|
(1)
|
—
|
—
|
(1)
|
||||
|
Balance at end of 2012
|
13,322
|
1,178
|
—
|
14,500
|
||||
|
New Builds
|
936
|
119
|
—
|
1,055
|
||||
|
Acquisitions
|
(112)
|
112
|
—
|
—
|
||||
|
Refranchising
|
44
|
(44)
|
—
|
—
|
||||
|
Closures
|
(408)
|
(39)
|
—
|
(447)
|
||||
|
Other
|
2
|
—
|
—
|
2
|
||||
|
Balance at end of 2013
|
13,784
|
1,326
|
—
|
15,110
|
||||
|
% of Total
|
91%
|
9%
|
—%
|
100%
|
||||
|
U.S.
|
Franchisees
|
Company
|
Unconsolidated Affiliates
|
Total Excluding Licensees
(a)
|
||||
|
Balance at end of 2011
|
13,867
|
2,139
|
—
|
16,006
|
||||
|
New Builds
|
273
|
96
|
—
|
369
|
||||
|
Refranchising
|
468
|
(468)
|
—
|
—
|
||||
|
Closures
|
(312)
|
(34)
|
—
|
(346)
|
||||
|
Other
|
(2)
|
—
|
—
|
(2)
|
||||
|
Balance at end of 2012
|
14,294
|
1,733
|
—
|
16,027
|
||||
|
New Builds
|
323
|
89
|
—
|
412
|
||||
|
Acquisitions
|
(19)
|
19
|
—
|
—
|
||||
|
Refranchising
|
214
|
(214)
|
—
|
—
|
||||
|
Closures
|
(296)
|
(39)
|
—
|
(335)
|
||||
|
Other
|
6
|
—
|
—
|
6
|
||||
|
Balance at end of 2013
|
14,522
|
1,588
|
—
|
16,110
|
||||
|
% of Total
|
90%
|
10%
|
—%
|
100%
|
||||
32
|
India
|
Franchisees
|
Company
|
Unconsolidated Affiliates
|
Total Excluding Licensees
(a)
|
||||||||
|
Balance at end of 2011
|
384
|
|
82
|
|
—
|
|
466
|
|
||||
|
New Builds
|
103
|
|
35
|
|
—
|
|
138
|
|
||||
|
Acquisitions
|
(3
|
)
|
3
|
|
—
|
|
—
|
|
||||
|
Closures
|
(11
|
)
|
—
|
|
—
|
|
(11
|
)
|
||||
|
Balance at end of 2012
|
473
|
|
120
|
|
—
|
|
593
|
|
||||
|
New Builds
|
89
|
|
68
|
|
—
|
|
157
|
|
||||
|
Acquisitions
|
(6
|
)
|
6
|
|
—
|
|
—
|
|
||||
|
Closures
|
(14
|
)
|
(3
|
)
|
—
|
|
(17
|
)
|
||||
|
Balance at end of 2013
|
542
|
|
191
|
|
—
|
|
733
|
|
||||
|
% of Total
|
74
|
%
|
26
|
%
|
—
|
%
|
100
|
%
|
||||
|
(a)
|
The Worldwide, YRI and U.S. totals exclude 2,115, 119 and 1,996 licensed units, respectively, at December 28, 2013. While there are no licensed units in China, we have excluded from the Worldwide and China totals 7 Company-owned units that are similar to licensed units. There are no licensed units in India. The units excluded offer limited menus and operate in non-traditional locations like malls, airports, gasoline service stations, train stations, subways, convenience stores, stadiums and amusement parks where a full scale traditional outlet would not be practical or efficient. As licensed units have lower average unit sales volumes than our traditional units and our current strategy does not place a significant emphasis on expanding our licensed units, we do not believe that providing further detail of licensed unit activity provides significant or meaningful information at this time.
|
|
(b)
|
Includes 472 Little Sheep units acquired on February 1, 2012.
|
Multibrand restaurants are included in the totals above. Multibrand conversions increase the sales and points of distribution for the second brand added to a restaurant but do not result in an additional unit count. Similarly, a new multibrand restaurant, while increasing sales and points of distribution for two brands, results in just one additional unit count.
33
System Sales Growth
The following tables detail the key drivers of system sales growth for each reportable segment by year. Net unit growth represents the net impact of actual system sales growth due to new unit openings and historical system sales lost due to closures as well as any necessary rounding.
|
2013 vs. 2012
|
|||||||||||||||
|
China
|
YRI
|
U.S.
|
India
(a)
|
Worldwide
|
|||||||||||
|
Same store sales growth (decline)
|
(13
|
)%
|
1
|
%
|
—
|
%
|
—
|
%
|
(2
|
)%
|
|||||
|
Net unit growth and other
|
9
|
|
4
|
|
1
|
|
20
|
|
4
|
|
|||||
|
Foreign currency translation
|
3
|
|
(4
|
)
|
N/A
|
|
(9
|
)
|
(1
|
)
|
|||||
|
% Change
|
(1
|
)%
|
1
|
%
|
1
|
%
|
11
|
%
|
1
|
%
|
|||||
|
% Change, excluding forex
|
(4
|
)%
|
5
|
%
|
N/A
|
|
20
|
%
|
2
|
%
|
|||||
|
|
2012 vs. 2011
|
||||||||||||||
|
|
China
|
YRI
|
U.S.
|
India
|
Worldwide
|
||||||||||
|
Same store sales growth (decline)
|
4
|
%
|
3
|
%
|
5
|
%
|
5
|
%
|
4
|
%
|
|||||
|
Net unit growth and other
(b)
|
16
|
|
3
|
|
(5
|
)
|
24
|
|
2
|
|
|||||
|
Foreign currency translation
|
3
|
|
(3
|
)
|
N/A
|
|
(16
|
)
|
(1
|
)
|
|||||
|
53
rd
week in 2011
|
N/A
|
|
(1
|
)
|
(1
|
)
|
N/A
|
|
(1
|
)
|
|||||
|
% Change
|
23
|
%
|
2
|
%
|
(1
|
)%
|
13
|
%
|
4
|
%
|
|||||
|
% Change, excluding forex and 53
rd
week in 2011
|
20
|
%
|
6
|
%
|
—
|
%
|
29
|
%
|
6
|
%
|
|||||
|
(a)
|
At the beginning of fiscal 2013, we eliminated the period lag that was previously used to facilitate the reporting of our India Division’s results. Accordingly, the India Division’s 2013 results include the months of January through December 2013. Due to the immateriality of the India Division’s results we did not restate the prior year’s operating results for the elimination of this period lag. Therefore, the 2012 results continue to include the months of December 2011 through November 2012. Additionally, the table above compares these months. If we had compared like months in 2013 to 2012, India Division system sales, excluding the impact of foreign currency translation, would have been 2% higher and same-store sales would have been 1% lower versus what is shown above, respectively for the year ended December 28, 2013.
|
|
(b)
|
For the year ended
December 29, 2012
, system sales growth includes a 1% and 5% negative impact for YRI and the U.S., respectively, related to the LJS and A&W divestitures and a 3% positive impact for China related to the acquisition of Little Sheep. Combined these items had a 2% net negative impact for Worldwide system sales for the year ended
December 29, 2012
.
|
Company-Operated Store Results
The following tables detail the key drivers of the year-over-year changes of Company sales and Restaurant profit for each reportable segment by year.
Store portfolio actions represent the net impact of new unit openings, acquisitions, refranchisings and store closures on Company sales or Restaurant profit. The impact of new unit openings and acquisitions represent the actual Company sales or Restaurant profit for the periods the Company operated the restaurants in the current year but did not operate them in the prior year. The impact of refranchisings and store closures represent the actual Company sales or Restaurant profit for the periods in the prior year while the Company operated the restaurants but did not operate them in the current year.
The impact on Company sales within the Other column primarily represents the impact of same-store sales. The impact on Cost of sales, Cost of labor and Occupancy and other within the Other column represents the impact of same-store sales, as well as the impact of changes in costs such as inflation/deflation. The impact on costs from same-store sales varies to the extent the same-store sales change is due to a change in pricing, the number of transactions or sales mix.
34
The dollar changes in Company Restaurant profit by year were as follows:
|
China
|
|
|||||||||||||||||||
|
|
2013 vs. 2012
|
|||||||||||||||||||
|
Income / (Expense)
|
2012
|
Store Portfolio Actions
|
Other
|
FX
|
2013
|
|||||||||||||||
|
Company sales
|
$
|
6,797
|
|
$
|
611
|
|
$
|
(785
|
)
|
$
|
177
|
|
$
|
6,800
|
|
|||||
|
Cost of sales
|
(2,312
|
)
|
(190
|
)
|
303
|
|
(59
|
)
|
(2,258
|
)
|
||||||||||
|
Cost of labor
|
(1,259
|
)
|
(129
|
)
|
62
|
|
(34
|
)
|
(1,360
|
)
|
||||||||||
|
Occupancy and other
|
(1,993
|
)
|
(211
|
)
|
127
|
|
(55
|
)
|
(2,132
|
)
|
||||||||||
|
Restaurant profit
|
$
|
1,233
|
|
$
|
81
|
|
$
|
(293
|
)
|
$
|
29
|
|
$
|
1,050
|
|
|||||
|
Restaurant margin
|
18.1
|
%
|
|
|
|
15.4
|
%
|
|||||||||||||
|
|
||||||||||||||||||||
|
|
2012 vs. 2011
|
|||||||||||||||||||
|
Income / (Expense)
|
2011
|
Store Portfolio Actions
|
Other
|
FX
|
2012
|
|||||||||||||||
|
Company sales
|
$
|
5,487
|
|
$
|
910
|
|
$
|
249
|
|
$
|
151
|
|
$
|
6,797
|
|
|||||
|
Cost of sales
|
(1,947
|
)
|
(318
|
)
|
3
|
|
(50
|
)
|
(2,312
|
)
|
||||||||||
|
Cost of labor
|
(890
|
)
|
(207
|
)
|
(134
|
)
|
(28
|
)
|
(1,259
|
)
|
||||||||||
|
Occupancy and other
|
(1,568
|
)
|
(336
|
)
|
(45
|
)
|
(44
|
)
|
(1,993
|
)
|
||||||||||
|
Restaurant profit
|
$
|
1,082
|
|
$
|
49
|
|
$
|
73
|
|
$
|
29
|
|
$
|
1,233
|
|
|||||
|
Restaurant margin
|
19.7
|
%
|
|
|
|
18.1
|
%
|
|||||||||||||
In 2013, the increase in China Company sales and Restaurant profit associated with store portfolio actions was driven by new unit development and the 2012 acquisition of Little Sheep, partially offset by restaurant closures. Significant other factors impacting Company sales and/or Restaurant profit were Company same-store sales declines of 12% and the impact of wage rate inflation of 7%, partially offset by restaurant operating efficiencies.
In 2012, the increase in China Company sales associated with store portfolio actions was primarily driven by new unit development and the acquisition of Little Sheep, partially offset by restaurant closures. The increase in China Restaurant profit associated with store portfolio actions was primarily driven by new unit development, partially offset by restaurant closures. Significant other factors impacting Company sales and/or Restaurant profit were Company same-store sales growth of 4%, which was partially offset by wage rate inflation of 10% and higher rent and utilities.
|
YRI
|
|
|||||||||||||||||||
|
|
2013 vs. 2012
|
|||||||||||||||||||
|
Income / (Expense)
|
2012
|
Store Portfolio Actions
|
Other
|
FX
|
2013
|
|||||||||||||||
|
Company sales
|
$
|
2,402
|
|
$
|
(252
|
)
|
$
|
42
|
|
$
|
(33
|
)
|
$
|
2,159
|
|
|||||
|
Cost of sales
|
(787
|
)
|
39
|
|
(15
|
)
|
15
|
|
(748
|
)
|
||||||||||
|
Cost of labor
|
(599
|
)
|
88
|
|
(2
|
)
|
5
|
|
(508
|
)
|
||||||||||
|
Occupancy and other
|
(705
|
)
|
95
|
|
(24
|
)
|
9
|
|
(625
|
)
|
||||||||||
|
Restaurant profit
|
$
|
311
|
|
$
|
(30
|
)
|
$
|
1
|
|
$
|
(4
|
)
|
$
|
278
|
|
|||||
|
Restaurant margin
|
12.9
|
%
|
12.9
|
%
|
||||||||||||||||
35
|
|
||||||||||||||||||||||||
|
|
||||||||||||||||||||||||
|
|
2012 vs. 2011
|
|||||||||||||||||||||||
|
Income / (Expense)
|
2011
|
Store Portfolio Actions
|
Other
|
FX
|
53
rd
Week in 2011
|
2012
|
||||||||||||||||||
|
Company sales
|
$
|
2,341
|
|
$
|
100
|
|
$
|
72
|
|
$
|
(82
|
)
|
$
|
(29
|
)
|
$
|
2,402
|
|
||||||
|
Cost of sales
|
(743
|
)
|
(65
|
)
|
(18
|
)
|
30
|
|
9
|
|
(787
|
)
|
||||||||||||
|
Cost of labor
|
(608
|
)
|
(3
|
)
|
(15
|
)
|
19
|
|
8
|
|
(599
|
)
|
||||||||||||
|
Occupancy and other
|
(700
|
)
|
(16
|
)
|
(18
|
)
|
23
|
|
6
|
|
(705
|
)
|
||||||||||||
|
Restaurant profit
|
$
|
290
|
|
$
|
16
|
|
$
|
21
|
|
$
|
(10
|
)
|
$
|
(6
|
)
|
$
|
311
|
|
||||||
|
Restaurant margin
|
12.4
|
%
|
12.9
|
%
|
||||||||||||||||||||
In 2013, the decrease in YRI Company sales and Restaurant profit associated with store portfolio actions was driven by the refranchising of our remaining Company-owned Pizza Hut dine-in restaurants in the UK in the fourth quarter of 2012. Net new unit development and the acquisition of 106 stores in Turkey from a franchisee partially offset the decline in Company sales related to refranchising. Significant other factors impacting Company sales and/or Restaurant profit were Company same-store sales growth of 2%, partially offset by higher restaurant operating costs.
In 2012, the increase in YRI Company sales and Restaurant profit associated with store portfolio actions was driven by the acquisition of restaurants in South Africa in the fourth quarter of 2011 and net new unit development, partially offset by refranchising. Significant other factors impacting Company sales and/or Restaurant profit were Company same-store sales growth of 3%, which was offset by the combination of higher labor costs and commodity inflation.
|
U.S.
|
|
|||||||||||||||
|
|
2013 vs. 2012
|
|||||||||||||||
|
Income / (Expense)
|
2012
|
Store Portfolio Actions
|
Other
|
2013
|
||||||||||||
|
Company sales
|
$
|
2,550
|
|
$
|
(431
|
)
|
$
|
(3
|
)
|
$
|
2,116
|
|
||||
|
Cost of sales
|
(740
|
)
|
130
|
|
(5
|
)
|
(615
|
)
|
||||||||
|
Cost of labor
|
(751
|
)
|
131
|
|
5
|
|
(615
|
)
|
||||||||
|
Occupancy and other
|
(643
|
)
|
119
|
|
(5
|
)
|
(529
|
)
|
||||||||
|
Restaurant profit
|
$
|
416
|
|
$
|
(51
|
)
|
$
|
(8
|
)
|
$
|
357
|
|
||||
|
Restaurant margin
|
16.3
|
%
|
16.9
|
%
|
||||||||||||
|
|
||||||||||||||||||||
|
|
2012 vs. 2011
|
|||||||||||||||||||
|
Income / (Expense)
|
2011
|
Store Portfolio Actions
|
Other
|
53
rd
Week in 2011
|
2012
|
|||||||||||||||
|
Company sales
|
$
|
3,000
|
|
$
|
(535
|
)
|
$
|
128
|
|
$
|
(43
|
)
|
$
|
2,550
|
|
|||||
|
Cost of sales
|
(917
|
)
|
177
|
|
(13
|
)
|
13
|
|
(740
|
)
|
||||||||||
|
Cost of labor
|
(912
|
)
|
165
|
|
(16
|
)
|
12
|
|
(751
|
)
|
||||||||||
|
Occupancy and other
|
(809
|
)
|
164
|
|
(7
|
)
|
9
|
|
(643
|
)
|
||||||||||
|
Restaurant profit
|
$
|
362
|
|
$
|
(29
|
)
|
$
|
92
|
|
$
|
(9
|
)
|
$
|
416
|
|
|||||
|
Restaurant margin
|
12.1
|
%
|
16.3
|
%
|
||||||||||||||||
36
In 2013, the decrease in U.S. Company sales and Restaurant profit associated with store portfolio actions was driven by refranchising, partially offset by net new unit development. Significant other factors impacting Company sales and/or Restaurant profit were higher commodity costs and promotional activities. Company same-store sales were flat in 2013.
In 2012, the decrease in U.S. Company sales and Restaurant profit associated with store portfolio actions was primarily driven by refranchising. Significant other factors impacting Company sales and/or Restaurant profit were same-store sales growth of 5%, including the positive impact of less discounting, combined with the positive impact of sales mix shifts as well as supply chain efficiencies, partially offset by higher restaurant-level incentive compensation costs.
Franchise and license fees and income
|
Amount
|
% Increase
(Decrease)
|
% Increase
(Decrease) excluding
foreign currency translation
|
% Increase
(Decrease) excluding
foreign currency translation
and 53
rd
week
|
|||||||||||||||||||||||||||
|
|
2013
|
2012
|
2011
|
2013
|
2012
|
2013
|
2012
|
2013
|
2012
|
|||||||||||||||||||||
|
China
|
$
|
105
|
|
$
|
101
|
|
|
$
|
79
|
|
4
|
|
29
|
|
2
|
|
25
|
|
2
|
|
25
|
|
||||||||
|
YRI
|
940
|
|
879
|
|
|
851
|
|
7
|
|
3
|
|
10
|
|
7
|
|
10
|
|
8
|
|
|||||||||||
|
U.S.
|
837
|
|
802
|
|
|
786
|
|
4
|
|
2
|
|
4
|
|
2
|
|
4
|
|
4
|
|
|||||||||||
|
India
|
18
|
|
18
|
|
17
|
|
—
|
|
6
|
|
8
|
|
18
|
|
8
|
|
18
|
|
||||||||||||
|
Worldwide
|
$
|
1,900
|
|
$
|
1,800
|
|
|
$
|
1,733
|
|
6
|
|
4
|
|
7
|
|
6
|
|
7
|
|
7
|
|
||||||||
China Franchise and license fees and income increased 2% in 2013, excluding the impact of foreign currency translation. The increase was driven by refranchising and franchise new unit development, partially offset by franchise same-store sales declines. China Franchise and license fees and income increased 25% in 2012, excluding the impact of foreign currency translation. The increase was driven by refranchising, franchise new unit development and franchise same-store sales growth.
YRI Franchise and license fees and income increased 10% in 2013, excluding the impact of foreign currency translation. The increase was driven by franchise net new unit development, franchise same-store sales growth and refranchising. YRI Franchise and license fees and income increased 8% in 2012, excluding the impact of foreign currency translation and the 53
rd
week in 2011. The increase was driven by franchise net new unit development and franchise same-store sales growth.
U.S. Franchise and license fees and income increased 4% in 2013 driven by refranchising. U.S. Franchise and license fees and income increased 4% in 2012, excluding the 53
rd
week in 2011. The increase was driven by refranchising and franchise same-store sales growth, partially offset by the LJS and A&W divestitures.
37
General and Administrative Expenses
|
|
Amount
|
% Increase
(Decrease)
|
% Increase
(Decrease) excluding
foreign currency translation
|
% Increase
(Decrease) excluding
foreign currency translation
and 53
rd
week
|
||||||||||||||||||||||||||
|
|
2013
|
2012
|
2011
|
2013
|
2012
|
2013
|
2012
|
2013
|
2012
|
|||||||||||||||||||||
|
China
|
$
|
357
|
|
$
|
334
|
|
$
|
275
|
|
7
|
|
21
|
|
5
|
|
19
|
|
5
|
|
19
|
|
|||||||||
|
YRI
|
394
|
|
414
|
|
400
|
|
(5
|
)
|
3
|
|
(3
|
)
|
6
|
|
(3
|
)
|
7
|
|
||||||||||||
|
U.S.
|
427
|
|
467
|
|
450
|
|
(9
|
)
|
4
|
|
(9)
|
|
4
|
|
(9
|
)
|
5
|
|
||||||||||||
|
India
|
27
|
|
24
|
|
22
|
|
14
|
|
9
|
|
25
|
|
25
|
|
25
|
|
25
|
|
||||||||||||
|
Unallocated
|
207
|
|
271
|
|
225
|
|
(24
|
)
|
21
|
|
(24)
|
|
21
|
|
(24
|
)
|
22
|
|
||||||||||||
|
Worldwide
|
$
|
1,412
|
|
$
|
1,510
|
|
|
$
|
1,372
|
|
(6
|
)
|
10
|
|
(6
|
)
|
11
|
|
(6
|
)
|
11
|
|
||||||||
China G&A expenses for 2013, excluding the impact of foreign currency translation, increased due to higher headcount and wage inflation and additional G&A as a result of consolidating Little Sheep beginning in the second quarter of 2012, partially offset by lower incentive compensation costs.
China G&A expenses for 2012, excluding the impact of foreign currency translation, increased due to higher headcount and wage inflation and additional G&A as a result of consolidating Little Sheep beginning in the second quarter of 2012.
YRI G&A expenses for 2013, excluding the impact of foreign currency translation, decreased due to the impact of refranchising our remaining Company-owned Pizza Hut UK dine-in restaurants in the fourth quarter of 2012, lapping certain prior year headquarter restructuring costs and a pension curtailment gain in the first quarter of 2013 related to one of our UK pension plans, partially offset by higher headcount in strategic growth markets.
YRI G&A expenses for 2012, excluding the impact of foreign currency translation, increased due to investments in strategic growth markets, including the acquisition of restaurants in South Africa in 2011, and increased compensation costs in the remaining markets.
U.S. G&A expenses for 2013 decreased due to lower incentive compensation costs, lapping higher litigation costs recorded in 2012, our restaurant refranchising initiatives and lower pension costs.
U.S. G&A expenses for 2012 increased due to higher pension costs, incentive compensation costs and litigation costs, partially offset by the LJS and A&W divestitures and our restaurant refranchising initiatives.
Unallocated G&A expenses for 2013 decreased due to lower pension costs, which includes lower settlement charges, and lower incentive compensation costs, partially offset by higher legal and professional fees.
Unallocated G&A expenses for 2012 increased due to higher pension costs, including a pension settlement charge of $87 million, partially offset by lapping costs related to the actions taken as part of our U.S. business transformation measures, lower litigation costs and costs related to the LJS and A&W divestitures in 2011.
38
Franchise and License Expenses
|
Amount
|
% Increase
(Decrease)
|
% Increase
(Decrease) excluding
foreign currency translation
|
% Increase
(Decrease) excluding
foreign currency translation
and 53
rd
week
|
|||||||||||||||||||||||||||
|
|
2013
|
2012
|
2011
|
2013
|
2012
|
2013
|
2012
|
2013
|
2012
|
|||||||||||||||||||||
|
China
|
$
|
13
|
|
$
|
9
|
|
$
|
4
|
|
41
|
|
NM
|
|
38
|
|
NM
|
|
38
|
|
NM
|
|
|||||||||
|
YRI
|
65
|
|
50
|
|
51
|
|
29
|
|
—
|
|
27
|
|
4
|
|
27
|
|
4
|
|
||||||||||||
|
U.S.
|
78
|
|
74
|
|
92
|
|
6
|
|
(20
|
)
|
6
|
|
(20
|
)
|
6
|
|
(19
|
)
|
||||||||||||
|
India
|
2
|
|
—
|
|
—
|
|
NM
|
|
—
|
|
NM
|
|
—
|
|
NM
|
|
—
|
|
||||||||||||
|
Unallocated
|
—
|
|
—
|
|
(2
|
)
|
—
|
|
78
|
|
—
|
|
78
|
|
—
|
|
78
|
|
||||||||||||
|
Worldwide
|
$
|
158
|
|
$
|
133
|
|
|
$
|
145
|
|
19
|
|
(8
|
)
|
19
|
|
(7
|
)
|
19
|
|
(7
|
)
|
||||||||
China Franchise and license expenses for 2013 and 2012, excluding the impact of foreign currency translation, increased due to higher franchise-related rent expense and depreciation as a result of refranchising.
YRI Franchise and license expenses for 2013, excluding the impact of foreign currency translation, increased due to costs associated with our bi-annual franchise convention, higher marketing costs and higher franchise-related rent expense and depreciation as a result of refranchising.
YRI Franchise and license expenses for 2012, excluding foreign currency translation, were higher due to higher franchise rent expense and depreciation as a result of refranchising, partially offset by lapping costs associated with our bi-annual franchise convention.
U.S. Franchise and license expenses for 2013 increased due to higher franchise development incentives, lapping recoveries of past due receivables in 2012 and higher franchise-related rent expense and depreciation as a result of refranchising.
U.S. Franchise and license expenses for 2012 were positively impacted by 15% due to the LJS and A&W divestitures. The remaining decrease was driven by lower franchise development incentives, partially offset by higher franchise-related rent expense and depreciation as a result of refranchising.
|
Worldwide Other (Income) Expense
|
2013
|
2012
|
2011
|
|||||||||
|
Equity income from investments in unconsolidated affiliates
(a)
|
$
|
(26
|
)
|
$
|
(47
|
)
|
$
|
(47
|
)
|
|||
|
Gain upon acquisition of Little Sheep
(b)
|
—
|
|
(74
|
)
|
—
|
|
||||||
|
Foreign exchange net (gain) loss and other
|
10
|
|
6
|
|
(6
|
)
|
||||||
|
Other (income) expense
|
$
|
(16
|
)
|
$
|
(115
|
)
|
|
$
|
(53
|
)
|
||
|
(a)
|
Declines in the year ended December 28, 2013 are due to the impact of KFC sales declines in China on net income of our unconsolidated affiliates.
|
|
(b)
|
See the Little Sheep Acquisition and Subsequent Impairment section of Note 4 for further discussion of the gain upon acquisition of Little Sheep.
|
Worldwide Closure and Impairment (Income) Expenses and Refranchising (Gain) Loss
See the Store Portfolio Strategy section for more detail of our refranchising activity and Note 4 for a summary of the Closure and impairment (income) expenses and Refranchising (gain) loss by reportable operating segment. See Significant Known Events, Trends or Uncertainties Impacting or Expected to Impact Comparisons of Reported or Future Results and the Little Sheep Acquisition and Subsequent Impairment section of Note 4 for information on Little Sheep Impairment.
39
Operating Profit
|
|
Amount
|
% B/(W)
|
% B/(W) excluding foreign currency translation
|
|||||||||||||||||||||||||||
|
|
2013
|
2012
|
2011
|
2013
|
2012
|
2013
|
2012
|
|||||||||||||||||||||||
|
China
|
$
|
777
|
|
$
|
1,015
|
|
|
$
|
908
|
|
(23
|
)
|
|
12
|
|
|
(26
|
)
|
9
|
|
||||||||||
|
YRI
|
760
|
|
715
|
|
|
673
|
|
6
|
|
|
6
|
|
10
|
|
10
|
|
||||||||||||||
|
U.S.
|
684
|
|
666
|
|
|
589
|
|
3
|
|
|
13
|
|
|
3
|
|
13
|
|
|||||||||||||
|
India
|
(15
|
)
|
(1
|
)
|
|
—
|
|
NM
|
|
NM
|
|
NM
|
|
NM
|
|
|||||||||||||||
|
Unallocated Occupancy and other
|
—
|
|
16
|
|
|
14
|
|
NM
|
|
|
14
|
|
|
NM
|
|
14
|
|
|||||||||||||
|
Unallocated and corporate expenses
|
(207
|
)
|
(271
|
)
|
|
(223
|
)
|
24
|
|
(22
|
)
|
|
24
|
|
(22
|
)
|
||||||||||||||
|
Unallocated Closures and impairment expense
|
(295
|
)
|
—
|
|
|
(80
|
)
|
NM
|
|
|
NM
|
|
|
NM
|
|
NM
|
|
|||||||||||||
|
Unallocated Other income (expense)
|
(6
|
)
|
76
|
|
|
6
|
|
NM
|
|
|
NM
|
|
|
NM
|
|
NM
|
|
|||||||||||||
|
Unallocated Refranchising gain (loss)
|
100
|
|
78
|
|
|
(72
|
)
|
29
|
|
|
NM
|
|
|
29
|
|
NM
|
|
|||||||||||||
|
Operating Profit
|
$
|
1,798
|
|
|
$
|
2,294
|
|
|
$
|
1,815
|
|
(22
|
)
|
|
26
|
|
|
(22
|
)
|
26
|
|
|||||||||
|
China Operating margin
|
11.3%
|
14.7%
|
16.3
|
%
|
(3.4
|
)
|
ppts.
|
(1.6
|
)
|
ppts.
|
(3.5
|
)
|
ppts.
|
(1.7
|
)
|
ppts.
|
||||||||||||||
|
YRI Operating margin
|
24.5%
|
21.8%
|
21.1
|
%
|
2.7
|
|
ppts.
|
0.7
|
|
ppts.
|
3.1
|
|
ppts.
|
0.7
|
|
ppts.
|
||||||||||||||
|
U.S. Operating margin
|
23.2%
|
19.9%
|
15.5
|
%
|
3.3
|
|
ppts.
|
4.4
|
|
ppts.
|
N/A
|
|
N/A
|
|
||||||||||||||||
China Division Operating Profit decreased 26% in 2013, excluding the impact of foreign currency, driven by same-store sales declines at KFC, partially offset by the impact of new unit development and restaurant operating efficiencies. See the China Poultry Supply Incident and Avian Flu section for further details on KFC China's 2013 same-store sales declines.
China Division Operating Profit increased 9% in 2012, excluding the impact of foreign currency, driven by the impact of same-store sales growth and new unit development, partially offset by higher restaurant operating costs and higher G&A expenses. Leap year added an extra day in the year ended December 29, 2012 and resulted in an additional $5 million of Operating Profit. This was offset by deal costs related to the acquisition of Little Sheep.
YRI Division Operating Profit increased 10% in 2013, excluding the impact of foreign currency. The refranchising of our Pizza Hut UK dine-in business in the fourth quarter of 2012 favorably impacted Operating Profit by 3%, including lapping restaurant impairment charges recorded in the fourth quarter of 2012. Excluding foreign currency and the Pizza Hut UK refranchising, the increase was driven by the impact of same-store sales growth and net new unit development, partially offset by higher restaurant operating costs and higher franchise and license expenses.
YRI Division Operating Profit increased 10% in 2012, excluding the impact of foreign currency, driven by the impact of same-store sales growth and net new unit development, partially offset by higher restaurant operating costs and higher G&A expenses.
U.S. Operating Profit increased 3% in 2013. Refranchising unfavorably impacted Operating Profit by 3%. Excluding the unfavorable impact from refranchising, the increase was driven by lower G&A expenses and net new unit development.
U.S. Operating Profit increased 13% in 2012. The increase was driven by the impact of same-store sales growth and net new unit development, partially offset by higher G&A expenses.
Unallocated and corporate expenses in 2013, 2012 and 2011 are discussed in the General and Administrative Expenses section of the MD&A.
Unallocated Closure and impairment expenses for 2013 represents an impairment charge of $295 million related to Little Sheep. See the Little Sheep Acquisition and Impairment section of Note 4.
Unallocated Closure and impairment expense in 2011 represents $80 million of losses related to the LJS and A&W divestitures.
Unallocated Other income (expense) in 2012 includes a non-cash gain of $74 million related to our acquisition of Little Sheep. See Note 4.
40
Unallocated Refranchising gain (loss) in 2013, 2012 and 2011 is discussed in Note 4.
Interest Expense, Net
|
|
2013
|
2012
|
2011
|
|||||||||
|
Interest expense
|
$
|
270
|
|
$
|
169
|
|
$
|
184
|
|
|||
|
Interest income
|
(23
|
)
|
(20
|
)
|
(28
|
)
|
||||||
|
Interest expense, net
|
$
|
247
|
|
$
|
149
|
|
|
$
|
156
|
|
||
The increase in Interest expense, net for 2013 was primarily driven by $118 million of premiums paid and other costs related to the extinguishment of debt, partially offset by lower average borrowings outstanding and lower interest rates versus 2012. See Losses Related to the Extinguishment of Debt section of Note 4. Additionally, Interest income increased by $9 million due to recoveries of franchise notes.
The decrease in Interest expense, net for 2012 was primarily driven by lower average borrowings outstanding versus 2011.
Income Taxes
The reconciliation of income taxes calculated at the U.S. federal tax statutory rate to our effective tax rate is set forth below:
|
|
2013
|
2012
|
2011
|
||||||||||||||||||
|
U.S. federal statutory rate
|
$
|
543
|
|
35.0
|
%
|
$
|
751
|
|
35.0
|
%
|
$
|
580
|
|
35.0
|
%
|
||||||
|
State income tax, net of federal tax benefit
|
3
|
|
0.2
|
|
4
|
|
0.2
|
|
2
|
|
0.1
|
|
|||||||||
|
Statutory rate differential attributable to foreign operations
|
(177
|
)
|
(11.4
|
)
|
(165
|
)
|
(7.7
|
)
|
(218
|
)
|
(13.1
|
)
|
|||||||||
|
Adjustments to reserves and prior years
|
49
|
|
3.1
|
|
(47
|
)
|
(2.2
|
)
|
24
|
|
1.4
|
|
|||||||||
|
Net benefit from LJS and A&W divestitures
|
—
|
|
—
|
|
—
|
|
—
|
|
(72
|
)
|
(4.3
|
)
|
|||||||||
|
Change in valuation allowances
|
23
|
|
1.5
|
|
14
|
|
0.6
|
|
22
|
|
1.3
|
|
|||||||||
|
Other, net
|
46
|
|
3.0
|
|
(20
|
)
|
(0.9
|
)
|
(14
|
)
|
(0.9
|
)
|
|||||||||
|
Income Tax Provision
|
$
|
487
|
|
31.4
|
%
|
$
|
537
|
|
25.0
|
%
|
$
|
324
|
|
19.5
|
%
|
||||||
Statutory rate differential attributable to foreign operations.
This item includes local taxes, withholding taxes, and shareholder-level taxes, net of foreign tax credits. The favorable impact is primarily attributable to a majority of our income being earned outside the U.S. where tax rates are generally lower than the U.S. rate.
In 2012, this benefit was negatively impacted by the repatriation of current year foreign earnings to the U.S. as we recognized additional tax expense, resulting from the related effective tax rate being lower than the U.S. federal statutory rate.
In 2011, this benefit was positively impacted by the repatriation of current year foreign earnings as we recognized excess foreign tax credits, resulting from the related effective tax rate being higher than the U.S. federal statutory rate.
Adjustments to reserves and prior years.
This item includes: (1) changes in tax reserves, including interest thereon, established for potential exposure we may incur if a taxing authority takes a position on a matter contrary to our position; and (2) the effects of reconciling income tax amounts recorded in our Consolidated Statements of Income to amounts reflected on our tax returns, including any adjustments to the Consolidated Balance Sheets. The impact of certain effects or changes may offset items reflected in the
'Statutory rate differential attributable to foreign operations'
line.
In 2013, this item was negatively impacted by the provision recorded to the continuing dispute with the IRS regarding the valuation of rights to intangibles transferred to certain foreign subsidiaries. See Internal Revenue Service Proposed Adjustments section of Note 17.
In 2012, this item was favorably impacted by the resolution of uncertain tax positions in certain foreign jurisdictions.
41
Net benefit from LJS and A&W divestitures.
This item includes a one-time $117 million tax benefit, including approximately $8 million state benefit, recognized on the LJS and A&W divestitures in 2011, partially offset by $45 million of valuation allowance, including approximately $4 million state expense related to capital loss carryforwards recognized as a result of the divestitures. In addition, we recorded $32 million of tax benefits on $86 million of pre-tax losses and other costs which resulted in $104 million of total net tax benefits related to the divestitures.
Change in valuation allowances.
This item relates to changes for deferred tax assets generated or utilized during the current year and changes in our judgment regarding the likelihood of using deferred tax assets that existed at the beginning of the year. The impact of certain changes may offset items reflected in the
'Statutory rate differential attributable to foreign operations'
line.
In 2013, $23 million of net tax expense was driven by $32 million for valuation allowances recorded against deferred tax assets generated during the current year, partially offset by a $9 million net tax benefit resulting from a change in judgment regarding the future use of certain deferred tax assets that existed at the beginning of the year.
In 2012, $14 million of net tax expense was driven by $16 million for valuation allowances recorded against deferred tax assets generated during the current year, partially offset by a $2 million net tax benefit resulting from a change in judgment regarding the future use of certain deferred tax assets that existed at the beginning of the year.
In 2011, $22 million of net tax expense was driven by $15 million for valuation allowances recorded against deferred tax assets generated during the current year and $7 million of tax expense resulting from a change in judgment regarding the future use of certain foreign deferred tax assets that existed at the beginning of the year. These amounts exclude $45 million in valuation allowance additions related to capital losses recognized as a result of the LJS and A&W divestitures, which are presented within '
Net Benefit from LJS and A&W divestitures'
.
Other.
This item primarily includes the impact of permanent differences related to current year earnings as well as U.S. tax credits and deductions.
In 2013, this item was negatively impacted by the $222 million non-cash impairment of Little Sheep goodwill, which resulted in no related tax benefit.
In 2012, this item was positively impacted by a one-time pre-tax gain of $74 million, with no related income tax expense, recognized on our acquisition of additional interest in, and consolidation of Little Sheep.
Consolidated Cash Flows
Net cash provided by operating activities
was $2,139 million in 2013 compared to $2,294 million in 2012. The decrease was primarily due to lower Operating Profit before Special Items and higher income taxes paid.
In 2012, net cash provided by operating activities was $2,294 million compared to $2,170 million in 2011. The increase was primarily driven by higher Operating Profit before Special Items, partially offset by timing of cash payments for operating expenses and higher income taxes paid.
Net cash used in investing activities
was $886 million in 2013 compared to $1,005 million in 2012. The decrease was primarily driven by lapping the acquisition of Little Sheep and release of related restricted cash. See Little Sheep Acquisition and Subsequent Impairment section of Note 4.
In 2012, net cash used in investing activities was $1,005 million compared to $1,006 million in 2011. The acquisition of Little Sheep, increased capital spending in China and the lapping of proceeds from the 2011 divestitures of LJS and A&W were offset by the release of restricted cash related to the Little Sheep acquisition and higher proceeds from refranchising in 2012.
Net cash used in financing activities
was $1,451 million in 2013 compared to $1,716 million in 2012. The decrease was primarily driven by lower net debt payments and lower share repurchases in 2013, partially offset by higher dividends paid on common stock and lower tax benefits from share-based compensation.
In 2012, net cash used in financing activities was $1,716 million compared to $1,413 million in 2011. The increase was driven by increased share repurchases.
42
Consolidated Financial Condition
The changes in our Goodwill and Intangible assets, net are primarily the result of the partial impairment of Little Sheep’s goodwill and trademark. See the Little Sheep Acquisition and Subsequent Impairment section of Note 4.
The changes in our Other liabilities and deferred credits and Accumulated other comprehensive income (loss) are primarily the result of actuarial gains in our U.S. pension plans recognized in 2013. See Note 14.
Liquidity and Capital Resources
Operating in the QSR industry allows us to generate substantial cash flows from the operations of our Company-owned stores and from our extensive franchise operations which require a limited YUM investment. Net cash provided by operating activities has exceeded $1 billion in each of the last twelve fiscal years, including over $2 billion in 2013, 2012 and 2011. We expect these levels of net cash provided by operating activities to continue in the foreseeable future. However, unforeseen downturns in our business could adversely impact our cash flows from operations from the levels historically realized.
In the event our cash flows are negatively impacted by business downturns, we believe we have the ability to temporarily reduce our discretionary spending without significant impact to our long-term business prospects. Our discretionary spending includes capital spending for new restaurants, acquisitions of restaurants from franchisees, repurchases of shares of our Common Stock and dividends paid to our shareholders. As of December 28, 2013 we had approximately $1.2 billion in unused capacity under our revolving credit facility that expires in March 2017.
China and YRI represented approximately 70% of the Company’s segment operating profit in 2013 and both generate a significant amount of positive cash flows that we have historically used to fund our international development. To the extent we have needed to repatriate international cash to fund our U.S. discretionary cash spending, including share repurchases, dividends and debt repayments, we have historically been able to do so in a tax-efficient manner.
If we experience an unforeseen decrease in our cash flows from our U.S. business or are unable to refinance future U.S. debt maturities we may be required to repatriate future international earnings at tax rates higher than we have historically experienced.
We currently have investment-grade ratings from Standard & Poor’s Rating Services (BBB) and Moody’s Investors Service (Baa3). While we do not anticipate a downgrade in our credit rating, a downgrade would increase the Company’s current borrowing costs and could impact the Company’s ability to access the credit markets cost-effectively if necessary. Based on the amount and composition of our debt at December 28, 2013, which included no borrowings outstanding under our revolving credit facility, our interest expense would not materially increase on a full-year basis should we receive a one-level downgrade in our ratings.
Discretionary Spending
During 2013, we invested $1,049 million in capital spending, including $568 million in China, $289 million in YRI, $161 million in the U.S. and $31 million in India. For 2014, we estimate capital spending will be approximately $1.2 billion.
During the year ended December 28, 2013 we repurchased shares for $750 million, which excluded the effect of $20 million in shares repurchased with trade dates prior to the 2012 fiscal year end but cash settlement dates subsequent to the 2012 fiscal year. On November 16, 2012 our Board of Directors authorized share repurchases through May 2014 of up to $1 billion (excluding applicable transaction fees) of our outstanding Common Stock. On November 22, 2013, our Board of Directors authorized additional share repurchases through May 2015 of up to $750 million (excluding applicable transaction fees) of our outstanding Common Stock. At December 28, 2013, we had remaining capacity to repurchase up to $953 million of outstanding Common Stock (excluding applicable transaction fees) under these authorizations. Shares are repurchased opportunistically as part of our regular capital structure decisions.
During the year ended December 28, 2013, we paid cash dividends of $615 million. Additionally, on November 22, 2013 our Board of Directors approved cash dividends of $0.37 per share of Common Stock that were distributed on February 7, 2014 to shareholders of record at the close of business on January 17, 2014. The Company targets an ongoing annual dividend payout ratio of 35% to 40% of net income.
43
Borrowing Capacity
Our primary bank credit agreement comprises a $1.3 billion syndicated senior unsecured revolving credit facility (the "Credit Facility") which matures in March 2017 and includes 24 participating banks with commitments ranging from $23 million to $115 million. We believe the syndication reduces our dependency on any one bank.
Under the terms of the Credit Facility, we may borrow up to the maximum borrowing limit, less outstanding letters of credit or banker’s acceptances, where applicable. At
December 28, 2013
, our unused Credit Facility totaled $1.2 billion net of outstanding letters of credit of $65 million. There were no borrowings outstanding under the Credit Facility at
December 28, 2013
. The interest rate for most borrowings under the Credit Facility ranges from 1.0% to 1.75% over the “London Interbank Offered Rate” (“LIBOR”). The exact spread over LIBOR under the Credit Facility depends upon our performance against specified financial criteria. Interest on any outstanding borrowings under the Credit Facility is payable at least quarterly.
The Credit Facility is unconditionally guaranteed by our principal domestic subsidiaries. This agreement contains financial covenants relating to maintenance of leverage and fixed-charge coverage ratios and also contains affirmative and negative covenants including, among other things, limitations on certain additional indebtedness and liens, and certain other transactions specified in the agreement. Given the Company’s strong balance sheet and cash flows we were able to comply with all debt covenant requirements at
December 28, 2013
with a considerable amount of cushion. Additionally, the Credit Facility contains cross-default provisions whereby our failure to make any payment on our indebtedness in a principal amount in excess of $125 million, or the acceleration of the maturity of any such indebtedness, will constitute a default under such agreement.
The majority of our remaining long-term debt primarily comprises Senior Unsecured Notes with varying maturity dates from 2014 through 2043 and interest rates ranging from 2.38% to 6.88%. The Senior Unsecured Notes represent senior, unsecured obligations and rank equally in right of payment with all of our existing and future unsecured unsubordinated indebtedness. Amounts outstanding under Senior Unsecured Notes were $2.8 billion at
December 28, 2013
. Our Senior Unsecured Notes provide that the acceleration of the maturity of any of our indebtedness in a principal amount in excess of $50 million will constitute a default under the Senior Unsecured Notes if such acceleration is not annulled, or such indebtedness is not discharged, within 30 days after notice.
During the fourth quarter of 2013, we issued $325 million aggregate principal amount of 3.88% 10 year Senior Unsecured Notes and $275 million aggregate principal amount of 5.35% 30 year Senior Unsecured Notes. We used the proceeds from our issuances of these Senior Unsecured Notes in part to repurchase certain of our Senior Unsecured Notes due March 2018 and November 2037 with principal amounts of $275 million each totaling $550 million. See Significant Known Events, Trends or Uncertainties Impacting or Expected to Impact Comparisons of Reported or Future Results and Note 10 for information on the Repurchase of those Senior Unsecured Notes.
Contractual Obligations
In addition to any discretionary spending we may choose to make, our significant contractual obligations and payments as of
December 28, 2013
included:
|
|
Total
|
Less than 1 Year
|
1-3 Years
|
3-5 Years
|
More than 5 Years
|
|||||||||||||||
|
Long-term debt obligations
(a)
|
$
|
4,300
|
|
$
|
186
|
|
$
|
791
|
|
$
|
529
|
|
$
|
2,794
|
|
|||||
|
Capital leases
(b)
|
276
|
|
18
|
|
38
|
|
34
|
|
186
|
|
||||||||||
|
Operating leases
(b)
|
5,697
|
|
721
|
|
1,299
|
|
1,084
|
|
2,593
|
|
||||||||||
|
Purchase obligations
(c)
|
784
|
|
604
|
|
87
|
|
55
|
|
38
|
|
||||||||||
|
Deferred compensation and unfunded benefit plans
(d)
|
160
|
|
21
|
|
33
|
|
29
|
|
77
|
|
||||||||||
|
Total contractual obligations
|
$
|
11,217
|
|
$
|
1,550
|
|
$
|
2,248
|
|
$
|
1,731
|
|
$
|
5,688
|
|
|||||
|
(a)
|
Debt amounts include principal maturities and expected interest payments on a nominal basis. Debt amounts exclude a fair value adjustment of $14 million related to interest rate swaps that hedge the fair value of a portion of our debt. See Note 10.
|
|
(b)
|
These obligations, which are shown on a nominal basis, relate to nearly 7,300 restaurants. See Note 11.
|
44
|
(c)
|
Purchase obligations include agreements to purchase goods or services that are enforceable and legally binding on us and that specify all significant terms, including: fixed or minimum quantities to be purchased; fixed, minimum or variable price provisions; and the approximate timing of the transaction. We have excluded agreements that are cancelable without penalty. Purchase obligations relate primarily to information technology, marketing, supply agreements, purchases of property, plant and equipment ("PP&E") as well as consulting, maintenance and other agreements.
|
|
(d)
|
Includes actuarially determined timing of payments from our most significant unfunded pension plan as well as scheduled payments from our deferred compensation plan. This table excludes $113 million of future benefit payments for deferred compensation and other unfunded benefit plans to be paid upon separation of employee's service or retirement from the company, as we cannot reasonably estimate the dates of these future cash payments.
|
We have not included in the contractual obligations table approximately $224 million of long-term liabilities for unrecognized tax benefits relating to various tax positions we have taken. These liabilities may increase or decrease over time as a result of tax examinations, and given the status of the examinations, we cannot reliably estimate the period of any cash settlement with the respective taxing authorities. These liabilities exclude amounts that are temporary in nature and for which we anticipate that over time there will be no net cash outflow.
We sponsor noncontributory defined benefit pension plans covering certain salaried and hourly employees, the most significant of which are in the U.S. and UK. The most significant of the U.S. plans, the YUM Retirement Plan (the “Plan”), is funded while benefits from our other significant U.S. plan are paid by the Company as incurred. Our funding policy for the Plan is to contribute annually amounts that will at least equal the minimum amounts required to comply with the Pension Protection Act of 2006. However, additional voluntary contributions are made from time to time to improve the Plan’s funded status. At December 28, 2013 the Plan was in a net overfunded position of $10 million. The UK pension plans are in a net overfunded position of $33 million at our 2013 measurement date.
Based on the current funding status of the Plan and our UK pension plans, we currently estimate that we will not be required to make any contributions in 2014. Investment performance and corporate bond rates have a significant effect on our net funding position as they drive our asset balances and discount rate assumption. Future changes in investment performance and corporate bond rates could impact our funded status and the timing and amounts of required contributions in 2014 and beyond.
Our post-retirement plan in the U.S. is not required to be funded in advance, but is pay as you go. We made post-retirement benefit payments of $7 million in 2013 and no future funding amounts are included in the contractual obligations table. See Note 14 for further details about our pension and post-retirement plans.
We have excluded from the contractual obligations table payments we may make for exposures for which we are self-insured, including workers’ compensation, employment practices liability, general liability, automobile liability, product liability and property losses (collectively “property and casualty losses”) and employee healthcare and long-term disability claims. The majority of our recorded liability for self-insured property and casualty losses and employee healthcare and long-term disability claims represents estimated reserves for incurred claims that have yet to be filed or settled.
Off-Balance Sheet Arrangements
We have agreed to provide financial support, if required, to a variable interest entity that operates a franchisee lending program used primarily to assist franchisees in the development of new restaurants or the upgrade of existing restaurants and, to a lesser extent, in connection with the Company’s refranchising programs in the U.S. We have provided guarantees of approximately $35 million in support of the franchisee loan program at December 28, 2013. The total loans outstanding under the loan pool were $38 million with an additional $42 million available for lending at
December 28, 2013
.
Our unconsolidated affiliates had approximately $85 million and $60 million of debt outstanding as of
December 28, 2013
and
December 29, 2012
, respectively.
New Accounting Pronouncements Not Yet Adopted
In March 2013, the Financial Accounting Standards Board (“FASB”) issued Accounting Standards Update ("ASU") No. 2013-05,
Foreign Currency Matters, (Topic 830): Parent's Accounting for the Cumulative Translation Adjustment upon Derecognition of Certain Subsidiaries or Groups of Assets within a Foreign Entity or of an Investment in a Foreign Entity
(ASU 2013-05), to resolve a diversity in accounting for the cumulative translation adjustment of foreign currency upon derecognition of a foreign subsidiary or group of assets. ASU 2013-05 requires the parent to apply the guidance in Subtopic 830-30 to release any related cumulative translation adjustment into net income when a reporting entity (parent) ceases to have a controlling financial interest in a subsidiary
45
or group of assets within a foreign entity. Accordingly, the cumulative translation adjustment should be released into net income only if the sale or transfer results in the complete or substantially complete liquidation of the foreign entity in which the subsidiary or group of assets had resided. Further, ASU 2013-05 clarified that the parent should apply the guidance in Subtopic 810-10 if there is a sale of an investment in a foreign entity, including both (1) events that result in the loss of a controlling financial interest in a foreign entity and (2) events that result in an acquirer obtaining control of an acquiree in which it held an equity interest immediately before the acquisition date. Accordingly, the cumulative translation adjustment should be released into net income upon the occurrence of those events. ASU 2013-05 is effective prospectively for the Company in our first quarter of fiscal 2014. We do not believe the adoption of this standard will have a significant impact on our consolidated financial statements.
In July 2013, the FASB issued ASU No. 2013-11,
Presentation of an Unrecognized Tax Benefit When a Net Operating Loss Carryforward, a Similar Tax Loss, or a Tax Credit Carryforward Exists
(ASU 2013-11), to require that in certain cases, an unrecognized tax benefit, or portion of an unrecognized tax benefit, should be presented in the financial statements as a reduction to a deferred tax asset for a net operating loss carryforward, a similar tax loss, or a tax credit carryforward when such items exist in the same taxing jurisdiction. ASU 2013-11 is effective for the Company in our first quarter of fiscal 2014. The amendments should be applied prospectively to all unrecognized tax benefits that exist at the effective date, and retrospective application is permitted. We do not believe the adoption of this standard will have a significant impact on our consolidated financial statements.
Critical Accounting Policies and Estimates
Our reported results are impacted by the application of certain accounting policies that require us to make subjective or complex judgments. These judgments involve estimations of the effect of matters that are inherently uncertain and may significantly impact our quarterly or annual results of operations or financial condition. Changes in the estimates and judgments could significantly affect our results of operations, financial condition and cash flows in future years. A description of what we consider to be our most significant critical accounting policies follows.
Impairment or Disposal of Long-Lived Assets
We review long-lived assets of restaurants (primarily PP&E and allocated intangible assets subject to amortization) semi-annually for impairment, or whenever events or changes in circumstances indicate that the carrying amount of a restaurant may not be recoverable. We evaluate recoverability based on the restaurant’s forecasted undiscounted cash flows, which incorporate our best estimate of sales growth and margin improvement based upon our plans for the unit and actual results at comparable restaurants. For restaurant assets that are deemed to not be recoverable, we write down the impaired restaurant to its estimated fair value. Key assumptions in the determination of fair value are the future after-tax cash flows of the restaurant, which are reduced by future royalties a franchisee would pay, and a discount rate. The after-tax cash flows incorporate reasonable sales growth and margin improvement assumptions that would be used by a franchisee in the determination of a purchase price for the restaurant. Estimates of future cash flows are highly subjective judgments and can be significantly impacted by changes in the business or economic conditions.
We perform an impairment evaluation at a restaurant group level if it is more likely than not that we will refranchise restaurants as a group. Expected net sales proceeds are generally based on actual bids from the buyer, if available, or anticipated bids given the discounted projected after-tax cash flows for the group of restaurants. Historically, these anticipated bids have been reasonably accurate estimations of the proceeds ultimately received. The after-tax cash flows used in determining the anticipated bids incorporate reasonable assumptions we believe a franchisee would make such as sales growth and margin improvement as well as expectations as to the useful lives of the restaurant assets, including a deduction for the anticipated, future royalties we would receive under a franchise agreement with terms substantially at market entered into simultaneously with the refranchising transaction.
The discount rate used in the fair value calculations is our estimate of the required rate of return that a franchisee would expect to receive when purchasing a similar restaurant or groups of restaurants and the related long-lived assets. The discount rate incorporates rates of returns for historical refranchising market transactions and is commensurate with the risks and uncertainty inherent in the forecasted cash flows.
We evaluate indefinite-lived intangible assets for impairment on an annual basis or more often if an event occurs or circumstances change that indicates impairment might exist. We perform our annual test for impairment of our indefinite-lived intangible assets at the beginning of our fourth quarter. We may elect to perform a qualitative assessment to determine whether it is more likely than not that the fair value of an indefinite-lived intangible asset is greater than its carrying value. If a qualitative assessment is not performed, or if as a result of a qualitative assessment it is not more likely than not that the fair value of an indefinite-lived intangible asset exceeds its carrying value, then the asset's fair value is compared to its carrying value. Fair value is an estimate
46
of the price a willing buyer would pay for the intangible asset and is generally estimated by discounting the expected future after-tax cash flows associated with the intangible asset.
Our most significant indefinite-lived intangible asset is our Little Sheep trademark. We wrote down the Little Sheep trademark from $414 million to $345 million as a result of an impairment charge of $69 million recorded in the quarter ended September 7, 2013. See the Little Sheep Acquisition and Subsequent Impairment section of Note 4 for details. No additional indefinite-lived intangible asset impairment was recorded as a result of our annual testing at the beginning of the fourth quarter.
The fair value of the Little Sheep trademark was based on the estimated price a willing buyer would pay for the asset, and was determined using a relief from royalty valuation approach that included future estimated sales as a significant input. This fair value incorporated a discount rate of 13% as our estimate of the required rate of return that a third-party buyer would expect to receive when purchasing the Little Sheep trademark.
While future business results are difficult to predict, we believe the decline in Little Sheep same-store sales and profit that were deemed an impairment indicator will be reversed over time and significant new unit development will take place. The inputs used in determining the fair value of the Little Sheep trademark assumed that the business will recover to pre-acquisition average unit sales volumes and profit over the next three years. At such pre-acquisition sales and profit levels, we believe that the Little Sheep restaurant-level unit economics will support the new unit development we assumed in the fair value estimation of the trademark. Long-term average growth assumptions subsequent to this assumed recovery include same-store sales growth of 4% and average annual net unit growth of approximately 75 units.
See Note 2 for a further discussion of our policies regarding the impairment or disposal of property, plant and equipment and intangible assets.
Impairment of Goodwill
We evaluate goodwill for impairment on an annual basis or more often if an event occurs or circumstances change that indicates impairment might exist. Goodwill is evaluated for impairment by determining whether the fair value of our reporting units exceed their carrying values. Our reporting units are our operating segments in the U.S., our YRI business units (which are aligned based on geography) and individual brands in our India and China Divisions. We may elect to perform a qualitative assessment for our reporting units to determine whether it is more likely than not that the fair value of the reporting unit is greater than its carrying value. If a qualitative assessment is not performed, or if as a result of a qualitative assessment it is not more likely than not that the fair value of a reporting unit exceeds its carrying value, then the reporting unit’s fair value is compared to its carrying value. Fair value is the price a willing buyer would pay for the reporting unit, and is generally estimated using discounted expected future after-tax cash flows from Company-owned restaurant operations and franchise royalties.
Future cash flow estimates and the discount rate are the key assumptions when estimating the fair value of a reporting unit. Future cash flows are based on growth expectations relative to recent historical performance and incorporate sales growth and margin improvement assumptions that we believe a third-party buyer would assume when determining a purchase price for the reporting unit. The sales growth and margin improvement assumptions that factor into the discounted cash flows are highly correlated as cash flow growth can be achieved through various interrelated strategies such as product pricing and restaurant productivity initiatives. The discount rate is our estimate of the required rate of return that a third-party buyer would expect to receive when purchasing a business from us that constitutes a reporting unit. We believe the discount rate is commensurate with the risks and uncertainty inherent in the forecasted cash flows.
We perform our annual goodwill impairment review as of the beginning of our fourth quarter. Other than the Little Sheep reporting unit discussed below, the fair values of each of our other reporting units were substantially in excess of their respective carrying values as of the 2013 goodwill impairment testing date.
Our most significant goodwill balance is attributed to our Little Sheep reporting unit. We wrote down Little Sheep's goodwill from $384 million to $162 million as a result of an impairment charge of $222 million recorded in the quarter ended September 7, 2013. See the Little Sheep Acquisition and Subsequent Impairment section of Note 4 for details on this impairment. No additional impairment was recorded as a result of our annual impairment review performed at the beginning of the fourth quarter of 2013. The fair value of the Little Sheep reporting unit was based on the estimated price a willing buyer would pay, and was determined using an income approach with future cash flow estimates generated by the business as a significant input. Future cash flow estimates are impacted by new unit development, sales growth and margin improvement. This fair value incorporated a discount rate of 13% as our estimate of the required rate of return that a third-party buyer would expect to receive when purchasing the Little Sheep reporting unit.
47
While future business results are difficult to predict, we believe the decline in Little Sheep same-store sales and profits that were deemed an impairment indicator will be reversed over time and significant new unit development will take place. As such, the inputs used in determining the fair value of the Little Sheep reporting unit assumed that the business will recover to pre-acquisition average unit sales volumes and profit levels over the next three years. At such pre-acquisition sales and profit levels, we believe that the Little Sheep restaurant-level unit economics will support the new unit development we assumed in the fair value estimation of the reporting unit. Long-term average growth assumptions subsequent to this assumed recovery include same-store sales growth of 4% and average annual net unit growth of approximately 75 units.
When we refranchise restaurants, we include goodwill in the carrying amount of the restaurants disposed of based on the relative fair values of the portion of the reporting unit disposed of in the refranchising versus the portion of the reporting unit that will be retained. The fair value of the portion of the reporting unit disposed of in a refranchising is determined by reference to the discounted value of the future cash flows expected to be generated by the restaurant and retained by the franchisee, which include a deduction for the anticipated, future royalties the franchisee will pay us associated with the franchise agreement entered into simultaneously with the refranchising transaction. Appropriate adjustments are made to the fair value determinations if such franchise agreement is determined to not be at prevailing market rates. When determining whether such franchise agreement is at prevailing market rates our primary consideration is consistency with the terms of our current franchise agreements both within the country that the restaurants are being refranchised in and around the world. The Company believes consistency in royalty rates as a percentage of sales is appropriate as the Company and franchisee share in the impact of near-term fluctuations in sales results with the acknowledgment that over the long-term the royalty rate represents an appropriate rate for both parties.
The discounted value of the future cash flows expected to be generated by the restaurant and retained by the franchisee is reduced by future royalties the franchisee will pay the Company. The Company thus considers the fair value of future royalties to be received under the franchise agreement as fair value retained in its determination of the goodwill to be written off when refranchising. Others may consider the fair value of these future royalties as fair value disposed of and thus would conclude that a larger percentage of a reporting unit’s fair value is disposed of in a refranchising transaction.
During 2013, the Company's most significant refranchising activity was within our Taco Bell U.S. operating segment, where 178 restaurants were refranchised (representing 17% of beginning-of-year company units) and $4 million in goodwill was written off (representing 4% of beginning-of-year goodwill).
See Note 2 for a further discussion of our policies regarding goodwill.
Allowances for Franchise and License Receivables/Guarantees
Franchise and license receivable balances include continuing fees, initial fees, rent and other ancillary receivables such as fees for support services. Our reserve for franchisee or licensee receivable balances is based upon pre-defined aging criteria or upon the occurrence of other events that indicate that we may not collect the balance due. This methodology results in an immaterial amount of unreserved past due receivable balances at December 28, 2013. As such, we believe our allowance for franchise and license receivables is adequate to cover potential exposure from uncollectible receivable balances at December 28, 2013.
We issue certain guarantees on behalf of franchisees primarily as a result of 1) assigning our interest in obligations under operating leases, primarily as a condition to the refranchising of certain Company restaurants, 2) facilitating franchisee development and 3) equipment financing arrangements to facilitate the launch of new sales layers by franchisees. We recognize a liability for the fair value of such guarantees upon inception of the guarantee and upon any subsequent modification, such as franchise lease renewals, when we remain contingently liable. The fair value of a guarantee is the estimated amount at which the liability could be settled in a current transaction between willing unrelated parties.
The present value of the minimum payments of the assigned leases, discounted at our pre-tax cost of debt, is approximately $625 million at December 28, 2013. Current franchisees are the primary lessees under the vast majority of these leases. Additionally, we have guaranteed approximately $40 million of franchisee loans for various programs. We generally have cross-default provisions with these franchisees that would put them in default of their franchise agreement in the event of non-payment under assigned leases and certain of the loan programs. We believe these cross-default provisions significantly reduce the risk that we will be required to make payments under these guarantees and, historically, we have not been required to make significant payments for guarantees. If payment on these guarantees becomes probable and estimable, we record a liability for our exposure under these guarantees. At
December 28, 2013
we have recorded an immaterial liability for our probable exposure under these guarantees. If we begin to be required to perform under these guarantees to a greater extent, our results of operations could be negatively impacted.
See Note 2 for a further discussion of our policies regarding franchise and license operations.
48
See Note 19 for a further discussion of our guarantees.
Self-Insured Property and Casualty Losses
We record our best estimate of the remaining cost to settle incurred self-insured workers' compensation, employment practices liability, general liability, automobile liability, product liability and property losses (collectively "property and casualty losses"). The estimate is based on the results of an independent actuarial study and considers historical claim frequency and severity as well as changes in factors such as our business environment, benefit levels, medical costs and the regulatory environment that could impact overall self-insurance costs. Additionally, our reserve includes a risk margin to cover unforeseen events that may occur over the several years required to settle claims, increasing our confidence level that the recorded reserve is adequate.
See Note 19 for a further discussion of our insurance programs.
Pension Plans
Certain of our employees are covered under defined benefit pension plans. Our two most significant plans are in the U.S. and combined had a projected benefit obligation (“PBO”) of $1,025 million and a fair value of plan assets of $933 million at December 28, 2013.
The PBO reflects the actuarial present value of all benefits earned to date by employees and incorporates assumptions as to future compensation levels. Due to the relatively long time frame over which benefits earned to date are expected to be paid, our PBOs are highly sensitive to changes in discount rates. For our U.S. plans, we measured our PBOs using a discount rate of 5.4% at
December 28, 2013
. This discount rate was determined with the assistance of our independent actuary. The primary basis for our discount rate determination is a model that consists of a hypothetical portfolio of ten or more corporate debt instruments rated Aa or higher by Moody’s or S&P with cash flows that mirror our expected benefit payment cash flows under the plans. We exclude from the model those corporate debt instruments flagged by Moody’s or S&P for a potential downgrade (if the potential downgrade would result in a rating below Aa by both Moody's and S&P) and bonds with yields that were two standard deviations or more above the mean. In considering possible bond portfolios, the model allows the bond cash flows for a particular year to exceed the expected benefit cash flows for that year. Such excesses are assumed to be reinvested at appropriate one-year forward rates and used to meet the benefit payment cash flows in a future year. The weighted-average yield of this hypothetical portfolio was used to arrive at an appropriate discount rate. We also ensure that changes in the discount rate as compared to the prior year are consistent with the overall change in prevailing market rates and make adjustments as necessary. A 50 basis-point increase in this discount rate would have decreased our U.S. plans’ PBOs by approximately $70 million at our measurement date. Conversely, a 50 basis-point decrease in this discount rate would have increased our U.S. plans’ PBOs by approximately $79 million at our measurement date.
The pension expense we will record in
2014
is also impacted by the discount rate we selected at our measurement date. We expect pension expense for our U.S. plans to decrease approximately $60 million in
2014
. The decrease is primarily driven by a decrease in amortization of net loss due to lower net unrecognized losses in Accumulated other comprehensive income as well as lapping pension settlement charges from 2013, including settlement charges allocated to Special Items of $10 million. Lower net unrecognized losses in Accumulated other comprehensive income are primarily a result of a higher discount rate at our 2013 measurement date. A 50 basis-point change in our discount rate assumption at our measurement date would impact our
2014
U.S. pension expense by approximately $9 million.
The assumption we make regarding our expected long-term rates of return on plan assets also impacts our pension expense. Our estimated long-term rate of return on U.S. plan assets is based upon the weighted-average of historical returns for each asset category. Our expected long-term rate of return on U.S. plan assets, for purposes of determining
2014
pension expense, at
December 28, 2013
was 6.9%. We believe this rate is appropriate given the composition of our plan assets and historical market returns thereon. A one percentage-point change in our expected long-term rate of return on plan assets assumption would impact our
2014
U.S. pension expense by approximately $8 million.
A decrease in discount rates over time has largely contributed to an unrecognized pre-tax actuarial net loss of $119 million included in Accumulated other comprehensive income (loss) for the U.S. plans at
December 28, 2013
. For purposes of determining 2013 pension expense, we recognized $48 million of net loss in net periodic benefit cost. We will recognize approximately $17 million of such loss in 2014.
See Note 14 for further discussion of our pension plans.
49
Stock Options and Stock Appreciation Rights Expense
Compensation expense for stock options and stock appreciation rights (“SARs”) is estimated on the grant date using a Black-Scholes option pricing model. See Note 15 for details of the risk-free interest rate, expected term, expected volatility and expected dividend yield used in valuing these awards. Additionally, we estimate pre-vesting forfeitures for purposes of determining compensation expense to be recognized. Future expense amounts for any particular quarterly or annual period could be affected by changes in our assumptions or changes in market conditions.
We have determined that it is appropriate to group our stock option and SAR awards into two homogeneous groups when estimating expected term and pre-vesting forfeitures. These groups consist of grants made primarily to restaurant-level employees under our Restaurant General Manager Stock Option Plan (the “RGM Plan”) and grants made to executives under our other stock award plans. Historically, less than 10% of total options and SARs granted have been made under the RGM Plan.
Stock option and SAR grants under the RGM Plan typically cliff-vest after four years and grants made to executives under our other stock award plans typically have a graded vesting schedule and vest 25% per year over four years. We use a single weighted-average expected term for our awards that have a graded vesting schedule. We re-evaluate our expected term assumptions using historical exercise and post-vesting employment termination behavior on a regular basis. We have determined that 5 years and 6.25 years are appropriate expected terms for awards to restaurant-level employees and to executives, respectively.
Upon each significant stock award grant we re-evaluate the expected volatility, including consideration of both historical volatility of our common stock as well as implied volatility associated with our publicly traded options. We have estimated pre-vesting forfeitures based on historical data. Based on such data, we believe that approximately 50% of all awards granted under the RGM Plan will be forfeited and approximately 20% of all awards granted to above-store executives will be forfeited.
Income Taxes
At December 28, 2013, we had valuation allowances of approximately $200 million to reduce our $1.0 billion of deferred tax assets to amounts that are more likely than not to be realized. The net deferred tax assets primarily relate to temporary differences in profitable U.S. federal and state and foreign jurisdictions, net operating losses in certain foreign jurisdictions, the majority of which do not expire, and U.S. foreign tax credit carryovers that expire 10 years from inception and for which we anticipate having foreign earnings to utilize. In evaluating our ability to recover our deferred tax assets, we consider future taxable income in the various jurisdictions as well as carryforward periods and restrictions on usage. The estimation of future taxable income in these jurisdictions and our resulting ability to utilize deferred tax assets can significantly change based on future events, including our determinations as to feasibility of certain tax planning strategies. Thus, recorded valuation allowances may be subject to material future changes.
As a matter of course, we are regularly audited by federal, state and foreign tax authorities. We recognize the benefit of positions taken or expected to be taken in our tax returns in our Income Tax Provision when it is more likely than not that the position would be sustained upon examination by these tax authorities. A recognized tax position is then measured at the largest amount of benefit that is greater than fifty percent likely of being realized upon settlement. At December 28, 2013 we had $243 million of unrecognized tax benefits, $170 million of which, if recognized, would impact the effective tax rate. We evaluate unrecognized tax benefits, including interest thereon, on a quarterly basis to ensure that they have been appropriately adjusted for events, including audit settlements, which may impact our ultimate payment for such exposures.
Additionally, we have not provided deferred tax for investments in foreign subsidiaries where the carrying values for financial reporting exceed the tax basis, totaling approximately $2.6 billion at December 28, 2013, as we believe the excess is essentially permanently invested. If our intentions regarding the duration of these investments change, deferred tax may need to be provided on this excess that could materially impact the provision for income taxes.
See Note 17 for a further discussion of our income taxes.
|
Item 7A.
|
Quantitative and Qualitative Disclosures About Market Risk.
|
The Company is exposed to financial market risks associated with interest rates, foreign currency exchange rates and commodity prices. In the normal course of business and in accordance with our policies, we manage these risks through a variety of strategies, which may include the use of financial and commodity derivative instruments to hedge our underlying exposures. Our policies prohibit the use of derivative instruments for trading purposes, and we have processes in place to monitor and control their use.
50
Interest Rate Risk
We have a market risk exposure to changes in interest rates, principally in the U.S. We attempt to minimize this risk and lower our overall borrowing costs on a portion of our debt through the utilization of derivative financial instruments, primarily interest rate swaps. These swaps are entered into with financial institutions and have reset dates and critical terms that match those of the underlying debt. Accordingly, any change in fair value associated with interest rate swaps is offset by the opposite impact on the related debt.
At both
December 28, 2013
and
December 29, 2012
a hypothetical 100 basis-point increase in short-term interest rates would result, over the following twelve-month period, in a reduction of approximately $3 million in income before income taxes. The estimated reductions are based upon the current level of variable rate debt and assume no changes in the volume or composition of that debt and include no impact from interest income related to cash and cash equivalents. In addition, the fair value of our derivative financial instruments at
December 28, 2013
and
December 29, 2012
would decrease approximately $7 million and $10 million, respectively, as a result of the same hypothetical 100 basis-point increase and the fair value of our Senior Unsecured Notes at
December 28, 2013
and
December 29, 2012
would decrease approximately $185 million and $225 million, respectively. Fair value was determined based on the present value of expected future cash flows considering the risks involved and using discount rates appropriate for the duration.
Foreign Currency Exchange Rate Risk
Changes in foreign currency exchange rates impact the translation of our reported foreign currency denominated earnings, cash flows and net investments in foreign operations and the fair value of our foreign currency denominated financial instruments. Historically, we have chosen not to hedge foreign currency risks related to our foreign currency denominated earnings and cash flows through the use of financial instruments. We attempt to minimize the exposure related to our net investments in foreign operations by financing those investments with local currency debt when practical. In addition, we attempt to minimize the exposure related to foreign currency denominated financial instruments by purchasing goods and services from third parties in local currencies when practical. Consequently, foreign currency denominated financial instruments consist primarily of intercompany short-term receivables and payables. At times, we utilize forward contracts to reduce our exposure related to these intercompany short-term receivables and payables. The notional amount and maturity dates of these contracts match those of the underlying receivables or payables such that our foreign currency exchange risk related to these instruments is minimized.
The combined Operating Profits of China, YRI and India constitute approximately 70% of our segment Operating Profit in
2013
. In addition, the Company’s foreign currency net asset exposure (defined as foreign currency assets less foreign currency liabilities) totaled approximately $4.2 billion as of
December 28, 2013
. Operating in international markets exposes the Company to movements in foreign currency exchange rates. The Company’s primary exposures result from our operations in Asia-Pacific, Europe and the Americas. For the fiscal year ended
December 28, 2013
Operating Profit would have decreased approximately $155 million if all foreign currencies had uniformly weakened 10% relative to the U.S. dollar. This estimated reduction assumes no changes in sales volumes or local currency sales or input prices.
Commodity Price Risk
We are subject to volatility in food costs as a result of market risk associated with commodity prices. Our ability to recover increased costs through higher pricing is, at times, limited by the competitive environment in which we operate. We manage our exposure to this risk primarily through pricing agreements with our vendors.
51
|
Item 8.
|
Financial Statements and Supplementary Data.
|
INDEX TO FINANCIAL INFORMATION
|
|
Page Reference
|
|
|
|
Consolidated Financial Statements
|
|
|
|
|
|
|
|
|
|
Report of Independent Registered Public Accounting Firm
|
|
|
|
|
|
|
|
|
|
Consolidated Statements of Income for the fiscal years ended December 28, 2013, December 29, 2012 and December 31, 2011
|
|
|
|
|
|
|
|
|
|
Consolidated Statements of Comprehensive Income for the fiscal years ended December 28, 2013, December 29, 2012 and December 31, 2011
|
|
||
|
Consolidated Statements of Cash Flows for the fiscal years ended December 28, 2013, December 29, 2012 and December 31, 2011
|
|
|
|
|
|
|
|
|
|
Consolidated Balance Sheets as of December 28, 2013 and December 29, 2012
|
|
|
|
|
|
|
|
|
|
Consolidated Statements of Shareholders’ Equity for the fiscal years ended December 28, 2013, December 29, 2012 and December 31, 2011
|
|
|
|
|
|
|
|
|
|
Notes to Consolidated Financial Statements
|
|
|
|
|
|
|
|
|
|
Management’s Responsibility for Financial Statements
|
101
|
|
|
Financial Statement Schedules
No schedules are required because either the required information is not present or not present in amounts sufficient to require submission of the schedule, or because the information required is included in the above-listed financial statements or notes thereto.
52
Report of Independent Registered Public Accounting Firm
The Board of Directors and Shareholders
YUM! Brands, Inc.
We have audited the accompanying consolidated balance sheets of YUM! Brands, Inc. and Subsidiaries (YUM) as of December 28, 2013 and December 29, 2012, and the related consolidated statements of income, comprehensive income, shareholders’ equity, and cash flows for each of the fiscal years in the three-year period ended December 28, 2013. We also have audited YUM’s internal control over financial reporting as of December 28, 2013, based on criteria established in
Internal Control - Integrated Framework (1992)
issued by the Committee of Sponsoring Organizations of the Treadway Commission. YUM’s management is responsible for these consolidated financial statements, for maintaining effective internal control over financial reporting, and for its assessment of the effectiveness of internal control over financial reporting, included in the accompanying Item 9A, “Management’s Report on Internal Control over Financial Reporting”. Our responsibility is to express an opinion on these consolidated financial statements and an opinion on YUM’s internal control over financial reporting based on our audits.
We conducted our audits in accordance with the standards of the Public Company Accounting Oversight Board (United States). Those standards require that we plan and perform the audits to obtain reasonable assurance about whether the financial statements are free of material misstatement and whether effective internal control over financial reporting was maintained in all material respects. Our audits of the consolidated financial statements included examining, on a test basis, evidence supporting the amounts and disclosures in the financial statements, assessing the accounting principles used and significant estimates made by management, and evaluating the overall financial statement presentation. Our audit of internal control over financial reporting included obtaining an understanding of internal control over financial reporting, assessing the risk that a material weakness exists, and testing and evaluating the design and operating effectiveness of internal control based on the assessed risk. Our audits also included performing such other procedures as we considered necessary in the circumstances. We believe that our audits provide a reasonable basis for our opinions.
A company’s internal control over financial reporting is a process designed to provide reasonable assurance regarding the reliability of financial reporting and the preparation of financial statements for external purposes in accordance with generally accepted accounting principles. A company’s internal control over financial reporting includes those policies and procedures that (1) pertain to the maintenance of records that, in reasonable detail, accurately and fairly reflect the transactions and dispositions of the assets of the company; (2) provide reasonable assurance that transactions are recorded as necessary to permit preparation of financial statements in accordance with generally accepted accounting principles, and that receipts and expenditures of the company are being made only in accordance with authorizations of management and directors of the company; and (3) provide reasonable assurance regarding prevention or timely detection of unauthorized acquisition, use, or disposition of the company’s assets that could have a material effect on the financial statements.
Because of its inherent limitations, internal control over financial reporting may not prevent or detect misstatements. Also, projections of any evaluation of effectiveness to future periods are subject to the risk that controls may become inadequate because of changes in conditions, or that the degree of compliance with the policies or procedures may deteriorate.
In our opinion, the consolidated financial statements referred to above present fairly, in all material respects, the financial position of YUM as of December 28, 2013 and December 29, 2012, and the results of its operations and its cash flows for each of the fiscal years in the three-year period ended December 28, 2013, in conformity with U.S. generally accepted accounting principles. Also in our opinion, YUM maintained, in all material respects, effective internal control over financial reporting as of December 28, 2013, based on criteria established in
Internal Control - Integrated Framework (1992)
issued by the Committee of Sponsoring Organizations of the Treadway Commission.
/s/ KPMG LLP
Louisville, Kentucky
February 18, 2014
53
|
|
||||||||||||
|
YUM! Brands, Inc. and Subsidiaries
|
||||||||||||
|
Fiscal years ended December 28, 2013, December 29, 2012 and December 31, 2011
|
||||||||||||
|
(in millions, except per share data)
|
||||||||||||
|
|
2013
|
2012
|
2011
|
|||||||||
|
Revenues
|
|
|
|
|||||||||
|
Company sales
|
$
|
11,184
|
|
|
$
|
11,833
|
|
|
$
|
10,893
|
|
|
|
Franchise and license fees and income
|
1,900
|
|
|
1,800
|
|
|
1,733
|
|
||||
|
Total revenues
|
13,084
|
|
|
13,633
|
|
|
12,626
|
|
||||
|
Costs and Expenses, Net
|
||||||||||||
|
Company restaurants
|
||||||||||||
|
Food and paper
|
3,669
|
|
3,874
|
|
3,633
|
|
||||||
|
Payroll and employee benefits
|
2,499
|
|
2,620
|
|
2,418
|
|
||||||
|
Occupancy and other operating expenses
|
3,333
|
|
3,358
|
|
3,089
|
|
||||||
|
Company restaurant expenses
|
9,501
|
|
|
9,852
|
|
|
9,140
|
|
||||
|
General and administrative expenses
|
1,412
|
|
|
1,510
|
|
|
1,372
|
|
||||
|
Franchise and license expenses
|
158
|
|
|
133
|
|
|
145
|
|
||||
|
Closures and impairment (income) expenses
|
331
|
|
|
37
|
|
|
135
|
|
||||
|
Refranchising (gain) loss
|
(100
|
)
|
|
(78
|
)
|
|
72
|
|
||||
|
Other (income) expense
|
(16
|
)
|
|
(115
|
)
|
|
(53
|
)
|
||||
|
Total costs and expenses, net
|
11,286
|
|
11,339
|
|
10,811
|
|
||||||
|
Operating Profit
|
1,798
|
|
|
2,294
|
|
|
1,815
|
|
||||
|
Interest expense, net
|
247
|
|
|
149
|
|
|
156
|
|
||||
|
Income Before Income Taxes
|
1,551
|
|
|
2,145
|
|
|
1,659
|
|
||||
|
Income tax provision
|
487
|
|
|
537
|
|
|
324
|
|
||||
|
Net Income – including noncontrolling interests
|
1,064
|
|
|
1,608
|
|
|
1,335
|
|
||||
|
Net Income (loss) – noncontrolling interests
|
(27
|
)
|
|
11
|
|
|
16
|
|
||||
|
Net Income – YUM! Brands, Inc.
|
$
|
1,091
|
|
|
$
|
1,597
|
|
|
$
|
1,319
|
|
|
|
Basic Earnings Per Common Share
|
$
|
2.41
|
|
|
$
|
3.46
|
|
|
$
|
2.81
|
|
|
|
Diluted Earnings Per Common Share
|
$
|
2.36
|
|
|
$
|
3.38
|
|
|
$
|
2.74
|
|
|
|
Dividends Declared Per Common Share
|
$
|
1.41
|
|
|
$
|
1.24
|
|
|
$
|
1.07
|
|
|
|
See accompanying Notes to Consolidated Financial Statements.
|
||||||||||||
54
|
Consolidated Statements of Comprehensive Income
|
||||||||||||
|
YUM! Brands, Inc. and Subsidiaries
|
||||||||||||
|
Fiscal years ended December 28, 2013, December 29, 2012 and December 31, 2011
|
||||||||||||
|
(in millions)
|
||||||||||||
|
2013
|
2012
|
2011
|
||||||||||
|
Net income - including noncontrolling interests
|
$
|
1,064
|
|
|
$
|
1,608
|
|
|
$
|
1,335
|
|
|
|
Other comprehensive income (loss), net of tax:
|
||||||||||||
|
Translation adjustments and gains (losses) from intra-entity transactions of a long-term investment nature
|
10
|
|
27
|
|
88
|
|
||||||
|
Tax (expense) benefit
|
(2
|
)
|
(3
|
)
|
3
|
|
||||||
|
Reclassifications of currency translation adjustments into Net Income
|
—
|
|
3
|
|
—
|
|
||||||
|
Tax expense (benefit)
|
—
|
|
—
|
|
—
|
|
||||||
|
Net unrealized gains (losses) arising during the year on pension and post-retirement plans
|
221
|
|
(19
|
)
|
(205
|
)
|
||||||
|
Tax (expense) benefit
|
(85
|
)
|
9
|
|
77
|
|
||||||
|
Reclassification of pension and post-retirement losses to Net Income
|
83
|
|
156
|
|
34
|
|
||||||
|
Tax expense (benefit)
|
(30
|
)
|
(57
|
)
|
(12
|
)
|
||||||
|
Net unrealized gains (losses) on derivative instruments arising during the year
|
6
|
|
(6
|
)
|
(3
|
)
|
||||||
|
Tax (expense) benefit
|
(2
|
)
|
2
|
|
1
|
|
||||||
|
Reclassification of derivative (gains) losses into Net Income
|
(2
|
)
|
6
|
|
4
|
|
||||||
|
Tax expense (benefit)
|
1
|
|
(2
|
)
|
(1
|
)
|
||||||
|
Other comprehensive income (loss), net of tax
|
200
|
|
116
|
|
(14
|
)
|
||||||
|
Comprehensive Income - including noncontrolling interests
|
1,264
|
|
1,724
|
|
1,321
|
|
||||||
|
Comprehensive Income (loss) - noncontrolling interests
|
(23
|
)
|
12
|
|
22
|
|
||||||
|
Comprehensive Income - Yum! Brands, Inc.
|
$
|
1,287
|
|
$
|
1,712
|
|
$
|
1,299
|
|
|||
|
See accompanying Notes to Consolidated Financial Statements.
|
||||||||||||
55
|
|
||||||||||||
|
YUM! Brands, Inc. and Subsidiaries
|
||||||||||||
|
Fiscal years ended December 28, 2013, December 29, 2012 and December 31, 2011
|
||||||||||||
|
(in millions)
|
||||||||||||
|
|
2013
|
2012
|
2011
|
|||||||||
|
Cash Flows – Operating Activities
|
|
|
|
|||||||||
|
Net Income – including noncontrolling interests
|
$
|
1,064
|
|
|
$
|
1,608
|
|
|
$
|
1,335
|
|
|
|
Depreciation and amortization
|
721
|
|
665
|
|
637
|
|
||||||
|
Closures and impairment (income) expenses
|
331
|
|
37
|
|
135
|
|
||||||
|
Refranchising (gain) loss
|
(100
|
)
|
(78
|
)
|
72
|
|
||||||
|
Contributions to defined benefit pension plans
|
(23
|
)
|
(119
|
)
|
(63
|
)
|
||||||
|
Pension settlement charges
|
30
|
|
89
|
|
—
|
|
||||||
|
Losses and other costs related to the extinguishment of debt
|
120
|
|
—
|
|
—
|
|
||||||
|
Gain upon acquisition of Little Sheep
|
—
|
|
(74
|
)
|
—
|
|
||||||
|
Deferred income taxes
|
(24
|
)
|
28
|
|
(137
|
)
|
||||||
|
Equity income from investments in unconsolidated affiliates
|
(26
|
)
|
(47
|
)
|
(47
|
)
|
||||||
|
Distributions of income received from unconsolidated affiliates
|
43
|
|
41
|
|
39
|
|
||||||
|
Excess tax benefit from share-based compensation
|
(44
|
)
|
(98
|
)
|
(66
|
)
|
||||||
|
Share-based compensation expense
|
49
|
|
50
|
|
59
|
|
||||||
|
Changes in accounts and notes receivable
|
(12
|
)
|
(18
|
)
|
(39
|
)
|
||||||
|
Changes in inventories
|
18
|
|
9
|
|
(75
|
)
|
||||||
|
Changes in prepaid expenses and other current assets
|
(21
|
)
|
(14
|
)
|
(25
|
)
|
||||||
|
Changes in accounts payable and other current liabilities
|
(102
|
)
|
9
|
|
144
|
|
||||||
|
Changes in income taxes payable
|
14
|
|
126
|
|
109
|
|
||||||
|
Other, net
|
101
|
|
80
|
|
92
|
|
||||||
|
Net Cash Provided by Operating Activities
|
2,139
|
|
2,294
|
|
2,170
|
|
||||||
|
Cash Flows – Investing Activities
|
|
|
|
|||||||||
|
Capital spending
|
(1,049
|
)
|
(1,099
|
)
|
(940
|
)
|
||||||
|
Proceeds from refranchising of restaurants
|
260
|
|
364
|
|
246
|
|
||||||
|
Acquisitions
|
(99
|
)
|
(543
|
)
|
(81
|
)
|
||||||
|
Changes in restricted cash
|
—
|
|
300
|
|
(300
|
)
|
||||||
|
Other, net
|
2
|
|
(27
|
)
|
69
|
|
||||||
|
Net Cash Used in Investing Activities
|
(886
|
)
|
(1,005
|
)
|
(1,006
|
)
|
||||||
|
Cash Flows – Financing Activities
|
|
|
|
|||||||||
|
Proceeds from long-term debt
|
599
|
|
—
|
|
404
|
|
||||||
|
Repayments of long-term debt
|
(666
|
)
|
(282
|
)
|
(666
|
)
|
||||||
|
Revolving credit facilities, three months or less, net
|
—
|
|
—
|
|
—
|
|
||||||
|
Short-term borrowings, by original maturity
|
||||||||||||
|
More than three months – proceeds
|
56
|
|
—
|
|
—
|
|
||||||
|
More than three months – payments
|
(56
|
)
|
—
|
|
—
|
|
||||||
|
Three months or less, net
|
—
|
|
—
|
|
—
|
|
||||||
|
Repurchase shares of Common Stock
|
(770
|
)
|
(965
|
)
|
(752
|
)
|
||||||
|
Excess tax benefit from share-based compensation
|
44
|
|
98
|
|
66
|
|
||||||
|
Employee stock option proceeds
|
37
|
|
62
|
|
59
|
|
||||||
|
Dividends paid on Common Stock
|
(615
|
)
|
(544
|
)
|
(481
|
)
|
||||||
|
Other, net
|
(80
|
)
|
(85
|
)
|
(43
|
)
|
||||||
|
Net Cash Used in Financing Activities
|
(1,451
|
)
|
(1,716
|
)
|
(1,413
|
)
|
||||||
|
Effect of Exchange Rates on Cash and Cash Equivalents
|
(5
|
)
|
5
|
|
21
|
|
||||||
|
Net Increase (Decrease) in Cash and Cash Equivalents
|
(203
|
)
|
(422
|
)
|
(228
|
)
|
||||||
|
Cash and Cash Equivalents – Beginning of Year
|
776
|
|
1,198
|
|
1,426
|
|
||||||
|
Cash and Cash Equivalents – End of Year
|
$
|
573
|
|
|
$
|
776
|
|
$
|
1,198
|
|
||
|
See accompanying Notes to Consolidated Financial Statements.
|
||||||||||||
56
|
Consolidated Balance Sheets
|
||||||||
|
YUM! Brands, Inc. and Subsidiaries
|
||||||||
|
December 28, 2013 and December 29, 2012
|
||||||||
|
(in millions)
|
||||||||
|
|
2013
|
2012
|
||||||
|
ASSETS
|
|
|
||||||
|
Current Assets
|
|
|
||||||
|
Cash and cash equivalents
|
$
|
573
|
|
|
$
|
776
|
|
|
|
Accounts and notes receivable, net
|
319
|
|
|
301
|
|
|||
|
Inventories
|
294
|
|
313
|
|
||||
|
Prepaid expenses and other current assets
|
286
|
|
|
272
|
|
|||
|
Deferred income taxes
|
123
|
|
|
127
|
|
|||
|
Advertising cooperative assets, restricted
|
96
|
|
136
|
|
||||
|
Total Current Assets
|
1,691
|
|
1,925
|
|
||||
|
Property, plant and equipment, net
|
4,459
|
|
|
4,250
|
|
|||
|
Goodwill
|
889
|
|
|
1,034
|
|
|||
|
Intangible assets, net
|
638
|
|
|
690
|
|
|||
|
Investments in unconsolidated affiliates
|
53
|
|
72
|
|
||||
|
Other assets
|
566
|
|
575
|
|
||||
|
Deferred income taxes
|
399
|
|
|
467
|
|
|||
|
Total Assets
|
$
|
8,695
|
|
$
|
9,013
|
|
||
|
LIABILITIES AND SHAREHOLDERS’ EQUITY
|
|
|
||||||
|
Current Liabilities
|
|
|
||||||
|
Accounts payable and other current liabilities
|
$
|
1,929
|
|
|
$
|
2,036
|
|
|
|
Income taxes payable
|
169
|
|
97
|
|
||||
|
Short-term borrowings
|
71
|
|
|
10
|
|
|||
|
Advertising cooperative liabilities
|
96
|
|
136
|
|
||||
|
Total Current Liabilities
|
2,265
|
|
2,279
|
|
||||
|
Long-term debt
|
2,918
|
|
|
2,932
|
|
|||
|
Other liabilities and deferred credits
|
1,244
|
|
1,490
|
|
||||
|
Total Liabilities
|
6,427
|
|
6,701
|
|
||||
|
Redeemable noncontrolling interest
|
39
|
|
59
|
|
||||
|
Shareholders’ Equity
|
|
|
||||||
|
Common Stock, no par value, 750 shares authorized; 443 shares and 451 shares issued in 2013 and 2012, respectively
|
—
|
|
—
|
|
||||
|
Retained earnings
|
2,102
|
|
|
2,286
|
|
|||
|
Accumulated other comprehensive income (loss)
|
64
|
|
|
(132
|
)
|
|||
|
Total Shareholders’ Equity – YUM! Brands, Inc.
|
2,166
|
|
2,154
|
|
||||
|
Noncontrolling interests
|
63
|
|
|
99
|
|
|||
|
Total Shareholders’ Equity
|
2,229
|
|
|
2,253
|
|
|||
|
Total Liabilities, Redeemable Noncontrolling Interest and Shareholders’ Equity
|
$
|
8,695
|
|
$
|
9,013
|
|
||
|
See accompanying Notes to Consolidated Financial Statements.
|
||||||||
57
|
Consolidated Statements of Shareholders’ Equity
|
|||||||||||||||||||||||||||
|
YUM! Brands, Inc. and Subsidiaries
|
|||||||||||||||||||||||||||
|
Fiscal years ended December 28, 2013, December 29, 2012 and December 31, 2011
|
|||||||||||||||||||||||||||
|
(in millions)
|
|||||||||||||||||||||||||||
|
|
Yum! Brands, Inc.
|
|
|
||||||||||||||||||||||||
|
|
Issued Common Stock
|
Retained Earnings
|
Accumulated
Other Comprehensive Income(Loss)
|
Noncontrolling Interests
|
Total Shareholders' Equity
|
Redeemable Noncontrolling Interest
|
|||||||||||||||||||||
|
|
Shares
|
Amount
|
|||||||||||||||||||||||||
|
Balance at December 25, 2010
|
469
|
|
$
|
86
|
|
$
|
1,717
|
|
$
|
(227
|
)
|
$
|
93
|
|
$
|
1,669
|
|
$
|
—
|
|
|||||||
|
Net Income (loss)
|
1,319
|
|
16
|
|
1,335
|
|
|||||||||||||||||||||
|
Translation adjustments and gains (losses) from intra-entity transactions of a long-term investment nature (net of tax impact of $3 million)
|
85
|
|
6
|
|
91
|
|
|||||||||||||||||||||
|
Pension and post-retirement benefit plans (net of tax impact of $65 million)
|
(106
|
)
|
(106
|
)
|
|||||||||||||||||||||||
|
Net unrealized gain on derivative instruments (net of tax impact of less than $1 million)
|
1
|
|
1
|
|
|||||||||||||||||||||||
|
Comprehensive Income (loss)
|
|
|
1,321
|
|
—
|
|
|||||||||||||||||||||
|
Dividends declared
|
|
|
(501
|
)
|
|
(22
|
)
|
(523
|
)
|
||||||||||||||||||
|
Repurchase of shares of Common Stock
|
(14
|
)
|
(250
|
)
|
(483
|
)
|
|
|
(733
|
)
|
|||||||||||||||||
|
Employee stock option and SARs exercises (includes tax impact of $71 million)
|
5
|
|
119
|
|
|
|
|
119
|
|
||||||||||||||||||
|
Compensation-related events (includes tax impact of $5 million)
|
—
|
|
63
|
|
|
|
|
63
|
|
||||||||||||||||||
|
Balance at December 31, 2011
|
460
|
|
$
|
18
|
|
$
|
2,052
|
|
$
|
(247
|
)
|
$
|
93
|
|
$
|
1,916
|
|
$
|
—
|
|
|||||||
|
Net Income (loss)
|
1,597
|
|
11
|
|
1,608
|
|
|||||||||||||||||||||
|
Translation adjustments and gains (losses) from intra-entity transactions of a long-term investment nature (net of tax impact of $3 million)
|
23
|
|
1
|
|
24
|
|
|||||||||||||||||||||
|
Reclassification of translation adjustments into income
|
3
|
|
3
|
|
|||||||||||||||||||||||
|
Pension and post-retirement benefit plans (net of tax impact of $48 million)
|
89
|
|
89
|
|
|||||||||||||||||||||||
|
Comprehensive Income (loss)
|
1,724
|
|
—
|
|
|||||||||||||||||||||||
|
Noncontrolling Interest - Little Sheep acquisition
|
16
|
|
16
|
|
59
|
|
|||||||||||||||||||||
|
Dividends declared
|
(569
|
)
|
(22
|
)
|
(591
|
)
|
|||||||||||||||||||||
|
Repurchase of shares of Common Stock
|
(15
|
)
|
(191
|
)
|
(794
|
)
|
|
|
|
|
(985
|
)
|
|||||||||||||||
|
Employee stock option and SARs exercises (includes tax impact of $89 million)
|
6
|
|
111
|
|
111
|
|
|||||||||||||||||||||
|
Compensation-related events (includes tax impact of $11 million)
|
|
|
62
|
|
62
|
|
|||||||||||||||||||||
|
Balance at December 29, 2012
|
451
|
|
$
|
—
|
|
$
|
2,286
|
|
$
|
(132
|
)
|
$
|
99
|
|
$
|
2,253
|
|
$
|
59
|
|
|||||||
|
Net Income (loss)
|
1,091
|
|
(5
|
)
|
1,086
|
|
(22
|
)
|
|||||||||||||||||||
|
Translation adjustments and gains (losses) from intra-entity transactions of a long-term investment nature (net of tax impact of $2 million)
|
4
|
|
2
|
|
6
|
|
2
|
|
|||||||||||||||||||
|
Pension and post-retirement benefit plans (net of tax impact of $115 million)
|
189
|
|
189
|
|
|||||||||||||||||||||||
|
Net unrealized gain on derivative instruments (net of tax impact of $1 million)
|
3
|
|
3
|
|
|||||||||||||||||||||||
|
Comprehensive Income (loss)
|
1,284
|
|
(20
|
)
|
|||||||||||||||||||||||
|
Dividends declared
|
(635
|
)
|
(18
|
)
|
(653
|
)
|
|||||||||||||||||||||
|
Acquisition of Little Sheep store-level noncontrolling interests
|
(15
|
)
|
(15
|
)
|
|||||||||||||||||||||||
|
Repurchase of shares of Common Stock
|
(11
|
)
|
(110
|
)
|
(640
|
)
|
(750
|
)
|
|||||||||||||||||||
|
Employee stock option and SARs exercises (includes tax impact of $42 million)
|
3
|
|
49
|
|
49
|
|
|||||||||||||||||||||
|
Compensation-related events (includes tax impact of $8 million)
|
61
|
|
61
|
|
|||||||||||||||||||||||
|
Balance at December 28, 2013
|
443
|
|
$
|
—
|
|
$
|
2,102
|
|
$
|
64
|
|
$
|
63
|
|
$
|
2,229
|
|
$
|
39
|
|
|||||||
|
See accompanying Notes to Consolidated Financial Statements.
|
|||||||||||||||||||||||||||
58
Notes to Consolidated Financial Statements
(Tabular amounts in millions, except share data)
YUM! Brands, Inc. and Subsidiaries (collectively referred to herein as “YUM” or the “Company”) comprise primarily the worldwide operations of its KFC, Pizza Hut and Taco Bell (collectively the “Concepts”). YUM has over
40,000
units of which
55%
are located outside the U.S. in more than
125
countries and territories. YUM was created as an independent, publicly-owned company on October 6, 1997 via a tax-free distribution by our former parent, PepsiCo, Inc., of our Common Stock to its shareholders. References to YUM throughout these Consolidated Financial Statements are made using the first person notations of “we,” “us” or “our.”
Through our widely-recognized Concepts, we develop, operate, franchise and license a system of both traditional and non-traditional quick service restaurants. Each Concept has proprietary menu items and emphasizes the preparation of food with high quality ingredients as well as unique recipes and special seasonings to provide appealing, convenient, tasty and attractive food at competitive prices. Our traditional restaurants feature dine-in, carryout and, in some instances, drive-thru or delivery service. Non-traditional units, which are principally licensed outlets, include express units and kiosks which have a more limited menu and operate in non-traditional locations like malls, airports, gasoline service stations, train stations, subways, convenience stores, stadiums, amusement parks and colleges, where a full-scale traditional outlet would not be practical or efficient. We also operate multibrand units, where two or more of our Concepts are operated in a single unit.
As of and through December 28, 2013, YUM consisted of
six
operating segments: YUM Restaurants China ("China" or “China Division”), YUM Restaurants International (“YRI” or “International Division”), KFC U.S., Pizza Hut U.S., Taco Bell U.S., and YUM Restaurants India ("India" or "India Division"). The China Division includes mainland China, and the India Division includes India, Bangladesh, Mauritius, Nepal and Sri Lanka. YRI includes the remainder of our international operations. For financial reporting purposes, management considers the
three
U.S. operating segments to be similar and, therefore, has aggregated them into a single reportable operating segment (“U.S.”). As a result of changes to our management reporting structure, in 2012 we began reporting information for our India business as a standalone reporting segment separated from YRI. While our consolidated results are not impacted, our historical segment information has been restated to be consistent with the current period presentation. In December 2011 we sold our Long John Silver's ("LJS") and A&W All American Food Restaurants ("A&W") brands to key franchise leaders and strategic investors in separate transactions. The results for these businesses through the sale date are included in the Company's results for 2011.
In the first quarter of 2014, we will combine our YRI and U.S. businesses and begin reporting segment information for
three
global divisions: KFC, Pizza Hut and Taco Bell. China and India will remain separate reporting segments due to their strategic importance and growth potential. This new structure is designed to drive greater global brand focus, enabling us to more effectively share know-how and accelerate growth. While our consolidated results will not be impacted, we will restate our historical segment information during 2014 for consistent presentation.
Our preparation of the accompanying Consolidated Financial Statements in conformity with Generally Accepted Accounting Principles in the United States of America (“GAAP”) requires us to make estimates and assumptions that affect reported amounts of assets and liabilities, disclosure of contingent assets and liabilities at the date of the financial statements, and the reported amounts of revenues and expenses during the reporting period. Actual results could differ from these estimates.
Principles of Consolidation and Basis of Preparation.
Intercompany accounts and transactions have been eliminated in consolidation. We consolidate entities in which we have a controlling financial interest, the usual condition of which is ownership of a majority voting interest. We also consider for consolidation an entity, in which we have certain interests, where the controlling financial interest may be achieved through arrangements that do not involve voting interests. Such an entity, known as a variable interest entity (“VIE”), is required to be consolidated by its primary beneficiary. The primary beneficiary is the entity that possesses the power to direct the activities of the VIE that most significantly impact its economic performance and has the obligation to absorb losses or the right to receive benefits from the VIE that are significant to it.
Our most significant variable interests are in entities that operate restaurants under our Concepts’ franchise and license arrangements. We do not generally have an equity interest in our franchisee or licensee businesses with the exception of certain entities in China as discussed below. Additionally, we do not typically provide significant financial support such as loans or guarantees to our franchisees and licensees. However, we do have variable interests in certain franchisees through real estate lease arrangements with them to which we are a party. At the end of
2013
, YUM has future lease payments due from franchisees, on
59
a nominal basis, of approximately
$400 million
. As our franchise and license arrangements provide our franchisee and licensee entities the power to direct the activities that most significantly impact their economic performance, we do not consider ourselves the primary beneficiary of any such entity that might otherwise be considered a VIE.
See Note 19 for additional information on an entity that operates a franchise lending program that is a VIE in which we have a variable interest but for which we are not the primary beneficiary and thus do not consolidate.
Certain investments in entities that operate KFCs in China are accounted for by the equity method. These entities are not VIEs and our lack of majority voting rights precludes us from controlling these affiliates. Thus, we do not consolidate these affiliates, instead accounting for them under the equity method. Our share of the net income or loss of those unconsolidated affiliates is included in Other (income) expense. On February 1, 2012, we acquired an additional
66%
interest in Little Sheep Group Limited ("Little Sheep"), increasing our ownership to
93%
. As a result, we began consolidating this business, which was previously accounted for using the equity method. See Note 4 for a further description of the accounting upon acquisition of additional interest in Little Sheep. A meat processing entity affiliated with our Little Sheep business is accounted for by the equity method.
We report Net income attributable to non-controlling interests, which includes the minority shareholders of the entities that operate the KFCs in Beijing and Shanghai, China and the minority shareholders of Little Sheep, separately on the face of our Consolidated Statements of Income. The portion of equity not attributable to the Company for KFC Beijing and KFC Shanghai is reported within equity, separately from the Company’s equity on the Consolidated Balance Sheets. The shareholder that owns the remaining
7%
ownership interest in Little Sheep holds an option that, if exercised, requires us to redeem their non-controlling interest. Redemption may occur any time after the third anniversary of the acquisition. This Redeemable non-controlling interest is classified outside permanent equity and recorded in the Consolidated Balance Sheet as the greater of the initial carrying amount adjusted for the non-controlling interest's share of net income (loss), or its redemption value.
We participate in various advertising cooperatives with our franchisees and licensees established to collect and administer funds contributed for use in advertising and promotional programs designed to increase sales and enhance the reputation of the Company and its franchise owners. Contributions to the advertising cooperatives are required for both Company-owned and franchise restaurants and are generally based on a percentage of restaurant sales. We maintain certain variable interests in these cooperatives. As the cooperatives are required to spend all funds collected on advertising and promotional programs, total equity at risk is not sufficient to permit the cooperatives to finance their activities without additional subordinated financial support. Therefore, these cooperatives are VIEs. As a result of our voting rights, we consolidate certain of these cooperatives for which we are the primary beneficiary. The Advertising cooperatives assets, consisting primarily of cash received from the Company and franchisees and accounts receivable from franchisees, can only be used to settle obligations of the respective cooperative. The Advertising cooperative liabilities represent the corresponding obligation arising from the receipt of the contributions to purchase advertising and promotional programs for which creditors do not have recourse to the general credit of the primary beneficiary. Therefore, we report all assets and liabilities of these advertising cooperatives that we consolidate as Advertising cooperative assets, restricted and Advertising cooperative liabilities in the Consolidated Balance Sheet. As the contributions to these cooperatives are designated and segregated for advertising, we act as an agent for the franchisees and licensees with regard to these contributions. Thus, we do not reflect franchisee and licensee contributions to these cooperatives in our Consolidated Statements of Income or Consolidated Statements of Cash Flows.
Fiscal Year.
Our fiscal year ends on the last Saturday in December and, as a result, a
53
rd
week is added every
five or six
years. The first three quarters of each fiscal year consist of
12
weeks and the fourth quarter consists of
16
weeks in fiscal years with 52 weeks and
17
weeks in fiscal years with 53 weeks. Our subsidiaries operate on similar fiscal calendars except that China, India and certain other international subsidiaries operate on a monthly calendar, and thus never have a
53
rd
week, with
two
months in the first quarter,
three
months in the second and third quarters and
four
months in the fourth quarter. YRI closes
one
period earlier to facilitate consolidated reporting.
Fiscal year 2011 included 53 weeks for our U.S. businesses and a portion of our YRI business. The
53
rd
week in 2011 added
$91 million
to total revenues,
$15 million
to Restaurant profit and
$25 million
to Operating Profit in our 2011 Consolidated Statement of Income. The
$25 million
benefit was offset throughout 2011 by investments, including franchise development incentives, as well as higher-than-normal spending, such as restaurant closures in the U.S. and YRI.
Foreign Currency.
The functional currency of our foreign entities is the currency of the primary economic environment in which the entity operates. Functional currency determinations are made based upon a number of economic factors, including but not limited to cash flows and financing transactions. The operations, assets and liabilities of our entities outside the United States are initially measured using the functional currency of that entity. Income and expense accounts for our operations of these foreign entities are then translated into U.S. dollars at the average exchange rates prevailing during the period. Assets and liabilities of these foreign entities are then translated into U.S. dollars at exchange rates in effect at the balance sheet date. As of
December 28,
60
2013
, net cumulative translation adjustment gains of
$170 million
are recorded in Accumulated other comprehensive income (loss) in the Consolidated Balance Sheet.
As we manage and share resources at either the country level for all of our brands in a country or, for some countries in which we have more significant operations, at the individual brand level within the country, cumulative translation adjustments are recorded and tracked at the foreign-entity level that represents either our entire operations within a country or the operations of our individual brands within that country. Translation adjustments recorded in Accumulated other comprehensive income (loss) are subsequently recognized as income or expense generally only upon sale or upon complete or substantially complete liquidation of the related investment in a foreign entity. For purposes of determining whether a sale or complete or substantially complete liquidation of an investment in a foreign entity has occurred, we consider those same foreign entities for which we record and track cumulative translation adjustments. Restaurant closures and refranchising transactions during the periods presented constituted disposals or sales of assets within our foreign entities and thus did not result in any translation adjustments being recognized as income or expense. The adoption of Accounting Standards Update No. 2013-05,
Foreign Currency Matters, (Topic 830): Parent's Accounting for the Cumulative Translation Adjustment upon Derecognition of Certain Subsidiaries or Groups of Assets within a Foreign Entity or of an Investment in a Foreign Entity,
in 2014 is not anticipated to have a significant impact on our accounting for foreign currency matters.
Gains and losses arising from the impact of foreign currency exchange rate fluctuations on transactions in foreign currency are included in Other (income) expense in our Consolidated Statement of Income.
Reclassifications.
We have reclassified certain items in the Consolidated Financial Statements for prior periods to be comparable with the classification for the fiscal year ended
December 28, 2013
. These reclassifications had no effect on previously reported Net Income - YUM! Brands, Inc.
Franchise and License Operations.
We execute franchise or license agreements for each unit operated by third parties which set out the terms of our arrangement with the franchisee or licensee. Our franchise and license agreements typically require the franchisee or licensee to pay an initial, non-refundable fee and continuing fees based upon a percentage of sales. Subject to our approval and their payment of a renewal fee, a franchisee may generally renew the franchise agreement upon its expiration.
The internal costs we incur to provide support services to our franchisees and licensees are charged to General and Administrative (“G&A”) expenses as incurred. Certain direct costs of our franchise and license operations are charged to franchise and license expenses. These costs include provisions for estimated uncollectible fees, rent or depreciation expense associated with restaurants we lease or sublease to franchisees, franchise and license marketing funding, amortization expense for franchise-related intangible assets and certain other direct incremental franchise and license support costs.
Revenue Recognition.
Revenues from Company-owned restaurants are recognized when payment is tendered at the time of sale. The Company presents sales net of sales-related taxes. Income from our franchisees and licensees includes initial fees, continuing fees, renewal fees and rental income from restaurants we lease or sublease to them. We recognize initial fees received from a franchisee or licensee as revenue when we have performed substantially all initial services required by the franchise or license agreement, which is generally upon the opening of a store. We recognize continuing fees, which are based upon a percentage of franchisee and licensee sales and rental income as earned. We recognize renewal fees when a renewal agreement with a franchisee or licensee becomes effective. We present initial fees collected upon the sale of a restaurant to a franchisee in Refranchising (gain) loss.
While the majority of our franchise agreements are entered into with terms and conditions consistent with those at a prevailing market rate, there are instances when we enter into franchise agreements with terms that are not at market rates (for example, below-market continuing fees) for a specified period of time. We recognize the estimated value of terms in franchise agreements entered into concurrently with a refranchising transaction that are not consistent with market terms as part of the upfront refranchising gain (loss) and amortize that amount into Franchise and license fees and income over the period such terms are in effect. The value of terms that are not considered to be at market within franchise agreements is estimated based upon the difference between cash expected to be received under the franchise agreement and cash that would have been expected to be received under a franchise agreement with terms substantially consistent with market.
Direct Marketing Costs.
We charge direct marketing costs to expense ratably in relation to revenues over the year in which incurred and, in the case of advertising production costs, in the year the advertisement is first shown. Deferred direct marketing costs, which are classified as prepaid expenses, consist of media and related advertising production costs which will generally be used for the first time in the next fiscal year and have historically not been significant. To the extent we participate in advertising cooperatives, we expense our contributions as incurred which are generally based on a percentage of sales. Our advertising
61
expenses were
$607 million
,
$608 million
and
$593 million
in
2013
,
2012
and
2011
, respectively. We report substantially all of our direct marketing costs in Occupancy and other operating expenses.
Research and Development Expenses.
Research and development expenses, which we expense as incurred, are reported in G&A expenses. Research and development expenses were
$31 million
,
$30 million
and
$34 million
in
2013
,
2012
and
2011
, respectively.
Share-Based Employee Compensation.
We recognize all share-based payments to employees, including grants of employee stock options and stock appreciation rights (“SARs”), in the Consolidated Financial Statements as compensation cost over the service period based on their fair value on the date of grant. This compensation cost is recognized over the service period on a straight-line basis for awards that actually vest. We present this compensation cost consistent with the other compensation costs for the employee recipient in either Payroll and employee benefits or G&A expenses. See Note 15 for further discussion of our share-based compensation plans.
Legal Costs.
Settlement costs are accrued when they are deemed probable and reasonably estimable. Anticipated legal fees related to self-insured workers' compensation, employment practices liability, general liability, automobile liability, product liability and property losses (collectively, "property and casualty losses") are accrued when deemed probable and reasonably estimable. Legal fees not related to self-insured property and casualty losses are recognized as incurred. See Note 19 for further discussion of our legal proceedings.
Impairment or Disposal of Property, Plant and Equipment.
Property, plant and equipment (“PP&E”) is tested for impairment whenever events or changes in circumstances indicate that the carrying value of the assets may not be recoverable. The assets are not recoverable if their carrying value is less than the undiscounted cash flows we expect to generate from such assets. If the assets are not deemed to be recoverable, impairment is measured based on the excess of their carrying value over their fair value.
For purposes of impairment testing for our restaurants, we have concluded that an individual restaurant is the lowest level of independent cash flows unless our intent is to refranchise restaurants as a group. We review our long-lived assets of such individual restaurants (primarily PP&E and allocated intangible assets subject to amortization) semi-annually for impairment, or whenever events or changes in circumstances indicate that the carrying amount of a restaurant may not be recoverable. We use
two
consecutive years of operating losses as our primary indicator of potential impairment for our semi-annual impairment testing of these restaurant assets. We evaluate the recoverability of these restaurant assets by comparing the estimated undiscounted future cash flows, which are based on our entity-specific assumptions, to the carrying value of such assets. For restaurant assets that are not deemed to be recoverable, we write-down an impaired restaurant to its estimated fair value, which becomes its new cost basis. Fair value is an estimate of the price a franchisee would pay for the restaurant and its related assets and is determined by discounting the estimated future after-tax cash flows of the restaurant, which include a deduction for royalties we would receive under a franchise agreement with terms substantially at market. The after-tax cash flows incorporate reasonable assumptions we believe a franchisee would make such as sales growth and margin improvement. The discount rate used in the fair value calculation is our estimate of the required rate of return that a franchisee would expect to receive when purchasing a similar restaurant and the related long-lived assets. The discount rate incorporates rates of returns for historical refranchising market transactions and is commensurate with the risks and uncertainty inherent in the forecasted cash flows.
In executing our refranchising initiatives, we most often offer groups of restaurants for sale. When we believe a restaurant or groups of restaurants will be refranchised for a price less than their carrying value, but do not believe the restaurant(s) have met the criteria to be classified as held for sale, we review the restaurants for impairment. We evaluate the recoverability of these restaurant assets at the date it is considered more likely than not that they will be refranchised by comparing estimated sales proceeds plus holding period cash flows, if any, to the carrying value of the restaurant or group of restaurants. For restaurant assets that are not deemed to be recoverable, we recognize impairment for any excess of carrying value over the fair value of the restaurants, which is based on the expected net sales proceeds. To the extent ongoing agreements to be entered into with the franchisee simultaneous with the refranchising are expected to contain terms, such as royalty rates, not at prevailing market rates, we consider the off-market terms in our impairment evaluation. We recognize any such impairment charges in Refranchising (gain) loss. We classify restaurants as held for sale and suspend depreciation and amortization when (a) we make a decision to refranchise; (b) the restaurants can be immediately removed from operations; (c) we have begun an active program to locate a buyer; (d) the restaurant is being actively marketed at a reasonable market price; (e) significant changes to the plan of sale are not likely; and (f) the sale is probable within
one
year. Restaurants classified as held for sale are recorded at the lower of their carrying value or fair value less cost to sell. We recognize estimated losses on restaurants that are classified as held for sale in Refranchising (gain) loss.
Refranchising (gain) loss includes the gains or losses from the sales of our restaurants to new and existing franchisees, including impairment charges discussed above, and the related initial franchise fees. We recognize gains on restaurant refranchisings when
62
the sale transaction closes, the franchisee has a minimum amount of the purchase price in at-risk equity, and we are satisfied that the franchisee can meet its financial obligations. If the criteria for gain recognition are not met, we defer the gain to the extent we have a remaining financial exposure in connection with the sales transaction. Deferred gains are recognized when the gain recognition criteria are met or as our financial exposure is reduced. When we make a decision to retain a store, or group of stores, previously held for sale, we revalue the store at the lower of its (a) net book value at our original sale decision date less normal depreciation and amortization that would have been recorded during the period held for sale or (b) its current fair value. This value becomes the store’s new cost basis. We record any resulting difference between the store’s carrying amount and its new cost basis to Closure and impairment (income) expense.
When we decide to close a restaurant, it is reviewed for impairment and depreciable lives are adjusted based on the expected disposal date. Other costs incurred when closing a restaurant such as costs of disposing of the assets as well as other facility-related expenses from previously closed stores are generally expensed as incurred. Additionally, at the date we cease using a property under an operating lease, we record a liability for the net present value of any remaining lease obligations, net of estimated sublease income, if any. Any costs recorded upon store closure as well as any subsequent adjustments to liabilities for remaining lease obligations as a result of lease termination or changes in estimates of sublease income are recorded in Closures and impairment (income) expenses. To the extent we sell assets, primarily land, associated with a closed store, any gain or loss upon that sale is also recorded in Closures and impairment (income) expenses.
Considerable management judgment is necessary to estimate future cash flows, including cash flows from continuing use, terminal value, sublease income and refranchising proceeds. Accordingly, actual results could vary significantly from our estimates.
Impairment of Investments in Unconsolidated Affiliates.
We record impairment charges related to an investment in an unconsolidated affiliate whenever events or circumstances indicate that a decrease in the fair value of an investment has occurred which is other than temporary. In addition, we evaluate our investments in unconsolidated affiliates for impairment when they have experienced
two
consecutive years of operating losses. We recorded no impairment associated with our investments in unconsolidated affiliates during
2013
,
2012
and
2011
.
Guarantees.
We recognize, at inception of a guarantee, a liability for the fair value of certain obligations undertaken. The majority of our guarantees are issued as a result of assigning our interest in obligations under operating leases as a condition to the refranchising of certain Company restaurants. We recognize a liability for the fair value of such lease guarantees upon refranchising
and upon subsequent renewals of such leases when we remain contingently liable. The related expense and any subsequent changes in the guarantees are included in Refranchising (gain) loss. The related expense and subsequent changes in the guarantees for other franchise support guarantees not associated with a refranchising transaction are included in Franchise and license expense.
Income Taxes.
We record deferred tax assets and liabilities for the future tax consequences attributable to temporary differences between the financial statement carrying amounts of existing assets and liabilities and their respective tax bases as well as operating loss, capital loss and tax credit carryforwards. Deferred tax assets and liabilities are measured using enacted tax rates expected to apply to taxable income in the years in which those differences are expected to be recovered or settled. The effect on deferred tax assets and liabilities of a change in tax rates is recognized in income in the period that includes the enactment date.
Additionally, in determining the need for recording a valuation allowance against the carrying amount of deferred tax assets, we consider the amount of taxable income and periods over which it must be earned, actual levels of past taxable income and known trends and events or transactions that are expected to affect future levels of taxable income. Where we determine that it is more likely than not that all or a portion of an asset will not be realized, we record a valuation allowance.
We recognize the benefit of positions taken or expected to be taken in our tax returns in our Income tax provision when it is more likely than not (i.e. a likelihood of more than fifty percent) that the position would be sustained upon examination by tax authorities. A recognized tax position is then measured at the largest amount of benefit that is greater than
fifty percent
likely of being realized upon settlement. We evaluate these amounts on a quarterly basis to insure that they have been appropriately adjusted for audit settlements and other events we believe may impact the outcome. Changes in judgment that result in subsequent recognition, derecognition or a change in measurement of a tax position taken in a prior annual period (including any related interest and penalties) are recognized as a discrete item in the interim period in which the change occurs. We recognize accrued interest and penalties related to unrecognized tax benefits as components of our Income tax provision.
We do not record a U.S. deferred tax liability for the excess of the book basis over the tax basis of our investments in foreign subsidiaries to the extent that the basis difference results from earnings that meet the indefinite reversal criteria. This criteria is met if the foreign subsidiary has invested, or will invest, the undistributed earnings indefinitely. The decision as to the amount of undistributed earnings that we intend to maintain in non-U.S. subsidiaries considers items including, but not limited to, forecasts and budgets of financial needs of cash for working capital, liquidity plans and expected cash requirements in the United States.
63
See Note 17 for a further discussion of our income taxes.
Fair Value Measurements.
Fair value is the price we would receive to sell an asset or pay to transfer a liability (exit price) in an orderly transaction between market participants. For those assets and liabilities we record or disclose at fair value, we determine fair value based upon the quoted market price, if available. If a quoted market price is not available for identical assets, we determine fair value based upon the quoted market price of similar assets or the present value of expected future cash flows considering the risks involved, including counterparty performance risk if appropriate, and using discount rates appropriate for the duration. The fair values are assigned a level within the fair value hierarchy, depending on the source of the inputs into the calculation.
|
Level 1
|
Inputs based upon quoted prices in active markets for identical assets.
|
|
|
|
|
Level 2
|
Inputs other than quoted prices included within Level 1 that are observable for the asset, either directly or indirectly.
|
|
|
|
|
Level 3
|
Inputs that are unobservable for the asset.
|
Cash and Cash Equivalents.
Cash equivalents represent funds we have temporarily invested (with original maturities not exceeding three months), including short-term, highly liquid debt securities. Cash and overdraft balances that meet the criteria for right to offset are presented net on our Consolidated Balance Sheet.
Receivables.
The Company’s receivables are primarily generated from ongoing business relationships with our franchisees and licensees as a result of franchise, license and lease agreements. Trade receivables consisting of royalties from franchisees and licensees are generally due within
30
days of the period in which the corresponding sales occur and are classified as Accounts and notes receivable on our Consolidated Balance Sheets. Our provision for uncollectible franchise and licensee receivable balances is based upon pre-defined aging criteria or upon the occurrence of other events that indicate that we may not collect the balance due. Additionally, we monitor the financial condition of our franchisees and licensees and record provisions for estimated losses on receivables when we believe it probable that our franchisees or licensees will be unable to make their required payments. While we use the best information available in making our determination, the ultimate recovery of recorded receivables is also dependent upon future economic events and other conditions that may be beyond our control. We recorded
$2 million
in net provisions,
$1 million
in net recoveries and
$7 million
in net provisions within Franchise and license expenses in
2013
,
2012
and
2011
, respectively, related to uncollectible franchise and license trade receivables. Trade receivables that are ultimately deemed to be uncollectible, and for which collection efforts have been exhausted, are written off against the allowance for doubtful accounts.
|
|
2013
|
2012
|
||||||
|
Accounts and notes receivable
|
$
|
330
|
|
$
|
313
|
|
||
|
Allowance for doubtful accounts
|
(11
|
)
|
(12
|
)
|
||||
|
Accounts and notes receivable, net
|
$
|
319
|
|
$
|
301
|
|
||
Our financing receivables primarily consist of notes receivables and direct financing leases with franchisees which we enter into from time to time. As these receivables primarily relate to our ongoing business agreements with franchisees and licensees, we consider such receivables to have similar risk characteristics and evaluate them as one collective portfolio segment and class for determining the allowance for doubtful accounts. We monitor the financial condition of our franchisees and licensees and record provisions for estimated losses on receivables when we believe it is probable that our franchisees or licensees will be unable to make their required payments. Balances of notes receivable and direct financing leases due within
one
year are included in Accounts and notes receivable while amounts due beyond
one
year are included in Other assets. Amounts included in Other assets totaled
$22 million
(net of an allowance of
$1 million
) and
$18 million
(net of an allowance of
$3 million
) at
December 28, 2013
and
December 29, 2012
, respectively. Financing receivables that are ultimately deemed to be uncollectible, and for which collection efforts have been exhausted, are written off against the allowance for doubtful accounts. Interest income recorded on financing receivables has traditionally been insignificant.
Inventories.
We value our inventories at the lower of cost (computed on the first-in, first-out method) or market.
64
Property, Plant and Equipment.
We state PP&E at cost less accumulated depreciation and amortization. We calculate depreciation and amortization on a straight-line basis over the estimated useful lives of the assets as follows:
5
to
25
years for buildings and improvements,
3
to
20
years for machinery and equipment and
3
to
7
years for capitalized software costs. As discussed above, we suspend depreciation and amortization on assets related to restaurants that are held for sale.
Leases and Leasehold Improvements.
The Company leases land, buildings or both for nearly
7,300
of its restaurants worldwide. The length of our lease terms, which vary by country and often include renewal options, are an important factor in determining the appropriate accounting for leases including the initial classification of the lease as capital or operating and the timing of recognition of rent expense over the duration of the lease. We include renewal option periods in determining the term of our leases when failure to renew the lease would impose a penalty on the Company in such an amount that a renewal appears to be reasonably assured at the inception of the lease. The primary penalty to which we are subject is the economic detriment associated with the existence of leasehold improvements which might be impaired if we choose not to continue the use of the leased property. Leasehold improvements, which are a component of buildings and improvements described above, are amortized over the shorter of their estimated useful lives or the lease term. We generally do not receive leasehold improvement incentives upon opening a store that is subject to a lease.
We expense rent associated with leased land or buildings while a restaurant is being constructed whether rent is paid or we are subject to a rent holiday. Additionally, certain of the Company's operating leases contain predetermined fixed escalations of the minimum rent during the lease term. For leases with fixed escalating payments and/or rent holidays, we record rent expense on a straight-line basis over the lease term, including any option periods considered in the determination of that lease term. Contingent rentals are generally based on sales levels in excess of stipulated amounts, and thus are not considered minimum lease payments and are included in rent expense when attainment of the contingency is considered probable (e.g. when Company sales occur).
Internal Development Costs and Abandoned Site Costs.
We capitalize direct costs associated with the site acquisition and construction of a Company unit on that site, including direct internal payroll and payroll-related costs. Only those site-specific costs incurred subsequent to the time that the site acquisition is considered probable are capitalized. If we subsequently make a determination that it is probable a site for which internal development costs have been capitalized will not be acquired or developed, any previously capitalized internal development costs are expensed and included in G&A expenses.
Goodwill and Intangible Assets.
From time to time, the Company acquires restaurants from one of our Concept’s franchisees or acquires another business. Goodwill from these acquisitions represents the excess of the cost of a business acquired over the net of the amounts assigned to assets acquired, including identifiable intangible assets and liabilities assumed. Goodwill is not amortized and has been assigned to reporting units for purposes of impairment testing. Our reporting units are our operating segments in the U.S. (see Note 18), our YRI business units (which are aligned based on geography) and individual brands in our India and China Divisions. Goodwill is assigned to reporting units that are expected to benefit from the synergies of the combination even though other assets or liabilities acquired may not be assigned to that reporting unit. The amount of goodwill assigned to a reporting unit that has not been assigned any of the other assets acquired or liabilities assumed is determined by comparing the fair value of the reporting unit before the acquisition to the fair value of the reporting unit after the acquisition.
We evaluate goodwill for impairment on an annual basis or more often if an event occurs or circumstances change that indicate impairment might exist. We have selected the beginning of our fourth quarter as the date on which to perform our ongoing annual impairment test for goodwill. We may elect to perform a qualitative assessment for our reporting units to determine whether it is more likely than not that the fair value of the reporting unit is greater than its carrying value. If a qualitative assessment is not performed, or if as a result of a qualitative assessment it is not more likely than not that the fair value of a reporting unit exceeds its carrying value, then the reporting unit’s fair value is compared to its carrying value. Fair value is the price a willing buyer would pay for a reporting unit, and is generally estimated using discounted expected future after-tax cash flows from Company-owned restaurant operations and franchise royalties. The discount rate is our estimate of the required rate of return that a third-party buyer would expect to receive when purchasing a business from us that constitutes a reporting unit. We believe the discount rate is commensurate with the risks and uncertainty inherent in the forecasted cash flows. If the carrying value of a reporting unit exceeds its fair value, goodwill is written down to its implied fair value.
If we record goodwill upon acquisition of a restaurant(s) from a franchisee and such restaurant(s) is then sold within
two
years of acquisition, the goodwill associated with the acquired restaurant(s) is written off in its entirety. If the restaurant is refranchised
two
years or more subsequent to its acquisition, we include goodwill in the carrying amount of the restaurants disposed of based on the relative fair values of the portion of the reporting unit disposed of in the refranchising and the portion of the reporting unit that will be retained. The fair value of the portion of the reporting unit disposed of in a refranchising is determined by reference to the discounted value of the future cash flows expected to be generated by the restaurant and retained by the franchisee, which includes a deduction for the anticipated, future royalties the franchisee will pay us associated with the franchise agreement entered into simultaneously with the refranchising transition. The fair value of the reporting unit retained is based on the price a willing
65
buyer would pay for the reporting unit and includes the value of franchise agreements. Appropriate adjustments are made if a franchise agreement includes terms that are determined to not be at prevailing market rates. As such, the fair value of the reporting unit retained can include expected cash flows from future royalties from those restaurants currently being refranchised, future royalties from existing franchise businesses and company restaurant operations. As a result, the percentage of a reporting unit’s goodwill that will be written off in a refranchising transaction will be less than the percentage of the reporting unit’s Company-owned restaurants that are refranchised in that transaction and goodwill can be allocated to a reporting unit with only franchise restaurants.
We evaluate the remaining useful life of an intangible asset that is not being amortized each reporting period to determine whether events and circumstances continue to support an indefinite useful life. If an intangible asset that is not being amortized is subsequently determined to have a finite useful life, we amortize the intangible asset prospectively over its estimated remaining useful life. Intangible assets that are deemed to have a definite life are generally amortized on a straight-line basis to their residual value.
We evaluate our indefinite-lived intangible assets for impairment on an annual basis or more often if an event occurs or circumstances change that indicate impairments might exist. We perform our annual test for impairment of our indefinite-lived intangible assets at the beginning of our fourth quarter. We may elect to perform a qualitative assessment to determine whether it is more likely than not that the fair value of an indefinite-lived intangible asset is greater than its carrying value. If a qualitative assessment is not performed, or if as a result of a qualitative assessment it is not more likely than not that the fair value of an indefinite-lived intangible asset exceeds its carrying value, then the asset's fair value is compared to its carrying value.
Fair value is an estimate of the price a willing buyer would pay for the intangible asset and is generally estimated by discounting the expected future after-tax cash flows associated with the intangible asset.
Our definite-lived intangible assets that are not allocated to an individual restaurant are evaluated for impairment whenever events or changes in circumstances indicate that the carrying amount of the intangible asset may not be recoverable. An intangible asset that is deemed not recoverable on a undiscounted basis is written down to its estimated fair value, which is our estimate of the price a willing buyer would pay for the intangible asset based on discounted expected future after-tax cash flows. For purposes of our impairment analysis, we update the cash flows that were initially used to value the definite-lived intangible asset to reflect our current estimates and assumptions over the asset’s future remaining life.
Derivative Financial Instruments.
We use derivative instruments primarily to hedge interest rate and foreign currency risks. These derivative contracts are entered into with financial institutions. We do not use derivative instruments for trading purposes and we have procedures in place to monitor and control their use.
We record all derivative instruments on our Consolidated Balance Sheet at fair value. For derivative instruments that are designated and qualify as a fair value hedge, the gain or loss on the derivative instrument as well as the offsetting gain or loss on the hedged item attributable to the hedged risk are recognized in the results of operations. For derivative instruments that are designated and qualify as a cash flow hedge, the effective portion of the gain or loss on the derivative instrument is reported as a component of other comprehensive income (loss) and reclassified into earnings in the same period or periods during which the hedged transaction affects earnings. For derivative instruments that are designated and qualify as a net investment hedge, the effective portion of the gain or loss on the derivative instrument is reported in the foreign currency translation component of other comprehensive income (loss). Any ineffective portion of the gain or loss on the derivative instrument for a cash flow hedge or net investment hedge is recorded in the results of operations immediately. For derivative instruments not designated as hedging instruments, the gain or loss is recognized in the results of operations immediately. See Note 12 for a discussion of our use of derivative instruments, management of credit risk inherent in derivative instruments and fair value information.
Common Stock Share Repurchases.
From time to time, we repurchase shares of our Common Stock under share repurchase programs authorized by our Board of Directors. Shares repurchased constitute authorized, but unissued shares under the North Carolina laws under which we are incorporated. Additionally, our Common Stock has no par or stated value. Accordingly, we record the full value of share repurchases, upon the trade date, against Common Stock on our Consolidated Balance Sheet except when to do so would result in a negative balance in such Common Stock account. In such instances, on a period basis, we record the cost of any further share repurchases as a reduction in retained earnings. Due to the large number of share repurchases and the increase in the market value of our stock over the past several years, our Common Stock balance is frequently zero at the end of any period. Accordingly,
$640 million
,
$794 million
and
$483 million
in share repurchases were recorded as a reduction in Retained Earnings in
2013
,
2012
and
2011
, respectively. See Note 16 for additional information.
Pension and Post-retirement Medical Benefits.
We measure and recognize the overfunded or underfunded status of our pension and post-retirement plans as an asset or liability in our Consolidated Balance Sheet as of our fiscal year end. The funded status represents the difference between the projected benefit obligations and the fair value of plan assets, which is calculated on a plan-
66
by-plan basis. The projected benefit obligation and related funded status are determined using assumptions as of the end of each year. The projected benefit obligation is the present value of benefits earned to date by plan participants, including the effect of future salary increases, as applicable. The difference between the projected benefit obligations and the fair value of plan assets that has not previously been recognized in our Consolidated Statement of Income is recorded as a component of Accumulated other comprehensive income (loss).
The net periodic benefit costs associated with the Company's defined benefit pension and post-retirement medical plans are determined using assumptions regarding the projected benefit obligation and, for funded plans, the market-related value of plan assets as of the beginning of each year. We have elected to use a market-related value of plan assets to calculate the expected return on assets in net periodic benefit costs. We recognize differences in the fair value versus the market-related value of plan assets evenly over five years. For each individual plan we amortize into pension expense the net amounts in Accumulated other comprehensive income (loss), as adjusted for the difference between the fair value and market-related value of plan assets, to the extent that such amounts exceed
10%
of the greater of a plan’s projected benefit obligation or market-related value of assets, over the remaining service period of active participants in the plan or, for plans with no active participants, over the expected average life expectancy of the inactive participants in the plan. We record a curtailment when an event occurs that significantly reduces the expected years of future service or eliminates the accrual of defined benefits for the future services of a significant number of employees. We record a curtailment gain when the employees who are entitled to the benefits terminate their employment; we record a curtailment loss when it becomes probable a loss will occur.
We recognize settlement gains or losses only when we have determined that the cost of all settlements in a year will exceed the sum of the service and interest costs within an individual plan.
Note 3 –
Earnings Per Common Share (“EPS”)
|
|
2013
|
2012
|
2011
|
|||||||||
|
Net Income – YUM! Brands, Inc.
|
$
|
1,091
|
|
|
$
|
1,597
|
|
|
$
|
1,319
|
|
|
|
Weighted-average common shares outstanding (for basic calculation)
|
452
|
|
461
|
|
469
|
|
||||||
|
Effect of dilutive share-based employee compensation
|
9
|
|
12
|
|
12
|
|
||||||
|
Weighted-average common and dilutive potential common shares outstanding (for diluted calculation)
|
461
|
|
473
|
|
481
|
|
||||||
|
Basic EPS
|
$
|
2.41
|
|
|
$
|
3.46
|
|
|
$
|
2.81
|
|
|
|
Diluted EPS
|
$
|
2.36
|
|
|
$
|
3.38
|
|
|
$
|
2.74
|
|
|
|
Unexercised employee stock options and stock appreciation rights (in millions) excluded from the diluted EPS computation
(a)
|
4.9
|
|
3.1
|
|
4.2
|
|
||||||
|
(a)
|
These unexercised employee stock options and stock appreciation rights were not included in the computation of diluted EPS because to do so would have been antidilutive for the periods presented.
|
Note 4 –
Items Affecting Comparability of Net Income and Cash Flows
Little Sheep Acquisition and Subsequent Impairment
On February 1, 2012 we acquired an additional
66%
interest in Little Sheep Group Limited (“Little Sheep”) for
$540 million
, net of cash acquired of
$44 million
, increasing our ownership to
93%
. The acquisition was driven by our strategy to build leading brands across China in every significant category. Prior to our acquisition of this additional interest, our
27%
interest in Little Sheep was accounted for under the equity method of accounting. As a result of the acquisition we obtained voting control of Little Sheep, and thus we began consolidating Little Sheep upon acquisition. As required by GAAP, we remeasured our previously held
27%
ownership in Little Sheep, which had a recorded value of
$107 million
at the date of acquisition, at fair value based on Little Sheep's traded share price immediately prior to our offer to purchase the business and recognized a non-cash gain of
$74 million
. This gain, which resulted in no related income tax expense, was recorded in Other (income) expense on our Consolidated Statement of Income in 2012 and was not allocated to any segment for performance reporting purposes.
67
We recorded the following assets acquired and liabilities assumed upon acquisition of Little Sheep as a result of our purchase price allocation:
|
Current assets, including cash of $44
|
$
|
109
|
|
||
|
Property, plant and equipment
|
64
|
|
|||
|
Goodwill
|
376
|
|
|||
|
Intangible assets, including indefinite-lived trademark of $404
|
421
|
|
|||
|
Other assets
|
35
|
|
|||
|
Total assets acquired
|
1,005
|
|
|||
|
Deferred taxes
|
105
|
|
|||
|
Other liabilities
|
60
|
|
|||
|
Total liabilities assumed
|
165
|
|
|||
|
Redeemable noncontrolling interest
|
59
|
|
|||
|
Other noncontrolling interests
|
16
|
|
|||
|
Net assets acquired
|
$
|
765
|
|
||
The fair values of intangible assets were determined using an income approach based on expected cash flows. The goodwill recorded resulted from the value expected to be generated from applying YUM's processes and knowledge in China, including YUM's development capabilities, to the Little Sheep business. The goodwill is not expected to be deductible for income tax purposes and has been allocated to the China operating segment.
As part of the acquisition, YUM granted an option to the shareholder that holds the remaining
7%
ownership interest in Little Sheep that would require us to purchase their remaining shares owned upon exercise, which may occur any time after the third anniversary of the acquisition. This noncontrolling interest has been recorded as a Redeemable noncontrolling interest in the Consolidated Balance Sheet. The Redeemable noncontrolling interest was reported at its fair value of
$59 million
at the date of acquisition, which was based on the Little Sheep traded share price immediately subsequent to our offer to purchase the additional interest.
Under the equity method of accounting, we previously reported our
27%
share of the net income of Little Sheep as Other (income) expense in the Consolidated Statements of Income. Since the acquisition, we have reported Little Sheep's results of operations in the appropriate line items of our Consolidated Statement of Income. We no longer report Other (income) expense as we did under the equity method of accounting. Net income attributable to our partner's ownership percentage is recorded in Net Income (loss) - noncontrolling interests. Little Sheep reports on a one month lag, and as a result, their consolidated results were included in the China Division starting the second quarter of 2012. In 2012, the consolidation of Little Sheep increased China Division Revenues by
4%
and did not have a significant impact on China Division Operating Profit versus 2011.
The purchase price paid for the additional
66%
interest and the resulting purchase price allocation assumed same-store sales growth and new unit development for the brand. Little Sheep's sales were negatively impacted by a longer than expected purchase approval and ownership transition phase. Our efforts to regain sales momentum were significantly compromised in May 2013 due to negative publicity regarding quality issues with unrelated hot pot concepts in China, even though there was not an issue with the quality of Little Sheep products.
The sustained declines in sales and profits that began in May 2013 and continued through the third quarter, coupled with the anticipated time it will now take for the business to recover, resulted in a determination during the quarter ended September 7, 2013 that it is not more likely than not that the Little Sheep trademark and reporting unit fair values are in excess of their carrying values. Therefore, our Little Sheep trademark and goodwill were tested for impairment in the quarter ended September 7, 2013, prior to the annual impairment reviews performed at the beginning of the fourth quarter of each year in accordance with our accounting policy.
As a result of comparing the trademark’s fair value of
$345 million
to its carrying value of
$414 million
, an impairment charge of
$69 million
was recorded in the quarter ended September 7, 2013. Additionally, after determining the fair value of the Little Sheep reporting unit was less than its carrying value, goodwill was written down to
$162 million
, resulting in an impairment
68
charge of
$222 million
. The Company also evaluated other Little Sheep long-lived assets for impairment and recorded a
$4 million
impairment charge related to restaurant-level PP&E.
These non-cash impairment charges totalling
$295 million
were recorded in Closures and impairment (income) expense on our Consolidated Statement of Income and were not allocated to any segment for performance reporting purposes, consistent with the classification of the
$74 million
gain that was recorded upon acquisition. We recorded an
$18 million
tax benefit associated with these impairments and allocated
$19 million
of the net impairment charges to Net Income (loss) - noncontrolling interests, which resulted in a net impairment charge of
$258 million
allocated to Net Income - YUM! Brands, Inc.
The fair values of the Little Sheep trademark and reporting unit were based on the estimated prices a willing buyer would pay. The fair value of the trademark was determined using a relief from royalty valuation approach that included future estimated sales as a significant input. The reporting unit fair value was determined using an income approach with future cash flow estimates generated by the business as a significant input. Future cash flow estimates are impacted by new unit development, sales growth and margin improvement. Both fair values incorporated a discount rate of
13%
as our estimate of the required rate of return that a third-party buyer would expect to receive when purchasing the Little Sheep trademark or reporting unit.
The inputs used in determining the fair values of the Little Sheep trademark and reporting unit assumed that the business will recover to pre-acquisition average-unit sales volumes and profit levels over the next three years. At such pre-acquisition sales and profit levels, we believe that the Little Sheep restaurant-level unit economics will support the new unit development we assumed in the fair value estimations of the trademark and reporting unit. Long-term average growth assumptions subsequent to this assumed recovery include same-store-sales growth of
4%
and average annual net unit growth of approximately
75
units.
Losses Related to the Extinguishment of Debt
During the fourth quarter of 2013, we completed a cash tender offer to repurchase
$550 million
of our Senior Unsecured Notes due either March 2018 or November 2037. This transaction resulted in
$120 million
of losses as a result of premiums paid and other costs,
$118 million
of which was classified as Interest expense, net in our Consolidated Statement of Income. The repurchase of the Senior Unsecured Notes was funded primarily by proceeds of
$599 million
received from the issuance of new Senior Unsecured Notes. See Note 10 for further discussion on the issuance of Senior Unsecured Notes.
Pension Settlement Charges
During the fourth quarter of 2012 and continuing through 2013, the Company allowed certain former employees with deferred vested balances in our U.S. pension plans an opportunity to voluntarily elect an early payout of their pension benefits. The majority of these payouts were funded from existing pension plan assets.
As a result of settlement payments exceeding the sum of service and interest costs within these U.S. pension plans in 2013 and 2012, pursuant to our accounting policy we recorded pre-tax settlement charges of
$30 million
and
$89 million
for the years ended December 28, 2013 and December 29, 2012, respectively, in General and administrative expenses. These amounts included settlement charges of
$10 million
and
$84 million
in the years ended December 28, 2013 and December 29, 2012, respectively, related to the programs discussed above that were not allocated for performance reporting purposes. See Note 14 for further discussion of our pension plans.
U.S. Business Transformation
As part of our plan to transform our U.S. business we took several measures in
2013
,
2012
and
2011
("the U.S. business transformation measures"). These measures included: continuation of our U.S. refranchising; G&A productivity initiatives and realignment of resources (primarily severance and early retirement costs).
For information on our U.S. refranchising, see the Refranchising (Gain) Loss section on pages 70 and 71.
In connection with our G&A productivity initiatives and realignment of resources (primarily severance and early retirement costs), we recorded pre-tax charges of
$5 million
,
$5 million
and
$21 million
in the years ended
December 28, 2013
,
December 29, 2012
and
December 31, 2011
, respectively. The unpaid current liability for the severance portion of these charges was
$1 million
and
$5 million
as of
December 28, 2013
and
December 29, 2012
, respectively. Severance payments in the years ended
December 28, 2013
,
December 29, 2012
and
December 31, 2011
totaled approximately
$4 million
,
$14 million
and
$4 million
respectively.
69
We are not including the impacts of these U.S. business transformation measures in our U.S. segment for performance reporting purposes as we do not believe they are indicative of our ongoing operations.
LJS and A&W Divestitures
In 2011 we sold the Long John Silver's and A&W All American Food Restaurants brands to key franchise leaders and strategic investors in separate transactions.
We recognized
$86 million
of pre-tax losses and other costs primarily in Closures and impairment (income) expenses during 2011 as a result of these transactions. Additionally, we recognized
$104 million
of tax benefits related to tax losses associated with the transactions.
We are not including the pre-tax losses and other costs in our U.S. and YRI segments for performance reporting purposes as we do not believe they are indicative of our ongoing operations. In 2012, System sales and Franchise and license fees and income in the U.S. were negatively impacted versus 2011 by
5%
and
6%
, respectively, due to these divestitures while YRI's system sales and Franchise and license fees and income were both negatively impacted by
1%
. While these divestitures negatively impacted both the U.S. and YRI segments' Operating Profit by
1%
in 2012, the impact on our consolidated Operating Profit was not significant.
Refranchising (Gain) Loss
The Refranchising (gain) loss by reportable segment is presented below. We do not allocate such gains and losses to our segments for performance reporting purposes.
|
|
Refranchising (gain) loss
|
||||||||||||||||
|
|
2013
|
2012
|
2011
|
||||||||||||||
|
China
|
$
|
(5
|
)
|
$
|
(17
|
)
|
$
|
(14
|
)
|
||||||||
|
YRI
(a)
|
(4
|
)
|
61
|
|
69
|
|
|||||||||||
|
U.S.
(b)
|
(91
|
)
|
(122
|
)
|
17
|
|
|||||||||||
|
India
|
—
|
|
—
|
|
—
|
|
|||||||||||
|
Worldwide
|
$
|
(100
|
)
|
|
$
|
(78
|
)
|
|
$
|
72
|
|
||||||
|
(a)
|
During the fourth quarter of 2012, we refranchised our remaining
331
Company-owned Pizza Hut dine-in restaurants in the United Kingdom ("UK"). The franchise agreement for these stores allows the franchisee to pay continuing franchise fees in the initial years of the agreement at a reduced rate. We agreed to allow the franchisee to pay these reduced fees in part as consideration for their assumption of lease liabilities related to underperforming stores that we anticipate they will close that were part of the refranchising. We recognize the estimated value of terms in franchise agreements entered into concurrently with a refranchising transaction that are not consistent with market terms as part of the upfront refranchising (gain) loss. Accordingly, upon the closing of this refranchising we recognized a loss of
$53 million
representing the estimated value of these reduced continuing fees. The associated deferred credit is being amortized into YRI's Franchise and license fees and income through 2016. This upfront loss largely contributed to a
$70 million
Refranchising loss we recognized during 2012 as a result of this refranchising. Also included in that loss was the write-off of
$14 million
in goodwill allocated to the Pizza Hut UK reporting unit. The remaining carrying value of goodwill allocated to our Pizza Hut UK business of
$87 million
, immediately subsequent to the aforementioned write-off, was determined not to be impaired as the fair value of the Pizza Hut UK reporting unit exceeded its carrying amount. For the year ended December 28, 2013, the refranchising of the Pizza Hut UK dine-in restaurants decreased Company sales by
18%
and increased Franchise and license fees and income and Operating Profit by
2%
and
3%
, respectively, for the YRI Division versus 2012.
|
During 2011, we recorded a
$76 million
charge in Refranchising (gain) loss as a result of our decision to refranchise or close all of our remaining Company-owned Pizza Hut UK dine-in restaurants, primarily to write down these restaurants' long-lived assets to their then estimated fair value. Impairment charges of Pizza Hut UK long-lived assets incurred as a result of this decision, including the charge mentioned in the previous sentence, reduced depreciation expense versus what would have otherwise been recorded by
$13 million
and
$3 million
for the years ended
December 29, 2012
and
December 31, 2011
, respectively. These depreciation reductions were not allocated to the YRI segment resulting in depreciation expense in the YRI segment results continuing to be recorded at the rate which it was prior to the impairment charges being recorded for these restaurants.
70
|
(b)
|
U.S. Refranchising (gain) loss in the years ended
December 28, 2013
and
December 29, 2012
is primarily due to gains on sales of Taco Bell restaurants. U.S. Refranchising (gain) loss in the year ended
December 31, 2011
is primarily due to losses on sales of and offers to refranchise KFCs in the U.S. The non-cash impairment charges that were recorded related to our offers to refranchise these Company-owned KFC restaurants in the U.S. decreased depreciation expense versus what would have otherwise been recorded by
$3 million
and
$10 million
in the years ended
December 29, 2012
and
December 31, 2011
, respectively. These depreciation reductions were not allocated to the U.S. segment resulting in depreciation expense in the U.S. segment results continuing to be recorded at the rate at which it was prior to the impairment charges being recorded for these restaurants.
|
See Note 2 for our policy for writing off goodwill in a refranchising transaction.
Store Closure and Impairment Activity
Store closure (income) costs and Store impairment charges by reportable segment are presented below. These tables exclude
$295 million
of Little Sheep impairment losses in 2013 and
$80 million
of net losses related to the LJS and A&W divestitures in 2011, which were not allocated to any segment for performance reporting purposes.
|
|
2013
|
|||||||||||||||||||
|
|
China
|
YRI
|
U.S.
|
India
|
Worldwide
|
|||||||||||||||
|
Store closure (income) costs
(a)
|
$
|
(1
|
)
|
$
|
(4
|
)
|
$
|
—
|
|
$
|
—
|
|
$
|
(5
|
)
|
|||||
|
Store impairment charges
|
31
|
|
3
|
|
5
|
|
2
|
|
41
|
|
||||||||||
|
Closure and impairment (income) expenses
|
$
|
30
|
|
$
|
(1
|
)
|
$
|
5
|
|
$
|
2
|
|
$
|
36
|
|
|||||
|
|
2012
|
|||||||||||||||||||
|
|
|
China
|
YRI
|
U.S.
|
India
|
Worldwide
|
||||||||||||||
|
Store closure (income) costs
(a)
|
|
$
|
(4
|
)
|
|
$
|
12
|
|
|
$
|
—
|
|
|
$
|
—
|
|
|
$
|
8
|
|
|
Store impairment charges
|
|
13
|
|
|
7
|
|
|
9
|
|
|
—
|
|
|
29
|
|
|||||
|
Closure and impairment (income) expenses
|
|
$
|
9
|
|
|
$
|
19
|
|
|
$
|
9
|
|
|
$
|
—
|
|
|
$
|
37
|
|
|
|
2011
|
|||||||||||||||||||
|
|
China
|
YRI
|
U.S.
|
India
|
Worldwide
|
|||||||||||||||
|
Store closure (income) costs
(a)
|
$
|
(1
|
)
|
$
|
4
|
|
$
|
4
|
|
$
|
—
|
|
$
|
7
|
|
|||||
|
Store impairment charges
|
13
|
|
18
|
|
17
|
|
—
|
|
48
|
|
||||||||||
|
Closure and impairment (income) expenses
|
$
|
12
|
|
$
|
22
|
|
$
|
21
|
|
$
|
—
|
|
$
|
55
|
|
|||||
|
(a)
|
Store closure (income) costs include the net gain or loss on sales of real estate on which we formerly operated a Company-owned restaurant that was closed, lease reserves established when we cease using a property under an operating lease and subsequent adjustments to those reserves and other facility-related expenses from previously closed stores.
|
The following table summarizes the
2013
and
2012
activity related to reserves for remaining lease obligations for closed stores.
|
|
Beginning Balance
|
Amounts Used
|
New Decisions
|
Estimate/Decision Changes
|
CTA/
Other
|
Ending Balance
|
||||||||||||||
|
2013 Activity
|
$
|
27
|
|
(11
|
)
|
1
|
|
4
|
|
—
|
|
$
|
21
|
|
||||||
|
2012 Activity
|
$
|
34
|
|
(14
|
)
|
3
|
|
3
|
|
1
|
|
$
|
27
|
|
||||||
71
Changes in our Effective Tax Rate
For 2013 our effective tax rate was
6.4
percentage points higher than 2012. See Note 17 for further discussion of our effective tax rate.
|
|
2013
|
2012
|
2011
|
|||||||||
|
Cash Paid For:
|
|
|
|
|||||||||
|
Interest
(a)
|
$
|
269
|
|
$
|
166
|
|
$
|
199
|
|
|||
|
Income taxes
|
489
|
|
417
|
|
349
|
|
||||||
|
Significant Non-Cash Investing and Financing Activities:
|
|
|
|
|||||||||
|
Capital lease obligations incurred
|
$
|
15
|
|
$
|
17
|
|
$
|
58
|
|
|||
|
Capital lease obligations relieved, primarily through divestitures and refranchisings
|
2
|
|
112
|
|
65
|
|
||||||
|
Increase (decrease) in accrued capital expenditures
|
(41
|
)
|
35
|
|
55
|
|
||||||
|
(a)
|
2013 includes
$109 million
of cash premiums and fees paid related to the extinguishment of debt, which is the primary component of the
$120 million
loss on debt extinguishment which was not allocated for performance reporting purposes. See the Losses Related to the Extinguishment of Debt section of Note 4 for details.
|
|
|
2013
|
2012
|
2011
|
|||||||||
|
Initial fees, including renewal fees
|
$
|
90
|
|
$
|
92
|
|
$
|
83
|
|
|||
|
Initial franchise fees included in Refranchising (gain) loss
|
(13
|
)
|
(24
|
)
|
(21
|
)
|
||||||
|
|
77
|
|
68
|
|
62
|
|
||||||
|
Continuing fees and rental income
|
1,823
|
|
1,732
|
|
1,671
|
|
||||||
|
Franchise and license fees and income
|
$
|
1,900
|
|
|
$
|
1,800
|
|
|
$
|
1,733
|
|
|
|
|
2013
|
2012
|
2011
|
|||||||||
|
Equity (income) loss from investments in unconsolidated affiliates
|
$
|
(26
|
)
|
$
|
(47
|
)
|
$
|
(47
|
)
|
|||
|
Gain upon acquisition of Little Sheep
(a)
|
—
|
|
(74
|
)
|
—
|
|
||||||
|
Foreign exchange net (gain) loss and other
|
10
|
|
6
|
|
(6
|
)
|
||||||
|
Other (income) expense
|
$
|
(16
|
)
|
|
$
|
(115
|
)
|
|
$
|
(53
|
)
|
|
|
(a)
|
See Note 4 for further details on the acquisition of Little Sheep.
|
72
Note 8
–
Supplemental Balance Sheet Information
|
Prepaid Expenses and Other Current Assets
|
2013
|
2012
|
||||||
|
Income tax receivable
|
$
|
89
|
|
$
|
55
|
|
||
|
Assets held for sale
(a)
|
16
|
|
56
|
|
||||
|
Other prepaid expenses and current assets
|
181
|
|
161
|
|
||||
|
Prepaid expenses and other current assets
|
$
|
286
|
|
|
$
|
272
|
|
|
|
(a)
|
Reflects restaurants we have offered for sale to franchisees and excess properties that we do not intend to use for restaurant operations in the future.
|
|
Property, Plant and Equipment
|
2013
|
2012
|
||||||
|
Land
|
$
|
508
|
|
$
|
469
|
|
||
|
Buildings and improvements
|
4,393
|
|
4,093
|
|
||||
|
Capital leases, primarily buildings
|
199
|
|
200
|
|
||||
|
Machinery and equipment
|
2,750
|
|
2,627
|
|
||||
|
Property, plant and equipment, gross
|
7,850
|
|
7,389
|
|
||||
|
Accumulated depreciation and amortization
|
(3,391
|
)
|
(3,139
|
)
|
||||
|
Property, plant and equipment, net
|
$
|
4,459
|
|
|
$
|
4,250
|
|
|
Depreciation and amortization expense related to property, plant and equipment was
$686 million
,
$629 million
and
$599 million
in
2013
,
2012
and
2011
, respectively.
|
Accounts Payable and Other Current Liabilities
|
2013
|
2012
|
||||||
|
Accounts payable
|
$
|
704
|
|
$
|
684
|
|
||
|
Accrued capital expenditures
|
223
|
|
264
|
|
||||
|
Accrued compensation and benefits
|
442
|
|
487
|
|
||||
|
Dividends payable
|
164
|
|
151
|
|
||||
|
Accrued taxes, other than income taxes
|
93
|
|
103
|
|
||||
|
Other current liabilities
|
303
|
|
347
|
|
||||
|
Accounts payable and other current liabilities
|
$
|
1,929
|
|
|
$
|
2,036
|
|
|
73
The changes in the carrying amount of goodwill are as follows:
|
|
China
|
YRI
|
U.S.
|
India
|
Worldwide
|
|||||||||||||||
|
Balance as of December 31, 2011
|
|
|||||||||||||||||||
|
Goodwill, gross
|
$
|
88
|
|
$
|
299
|
|
$
|
311
|
|
$
|
—
|
|
$
|
698
|
|
|||||
|
Accumulated impairment losses
|
—
|
|
(17
|
)
|
—
|
|
—
|
|
(17
|
)
|
||||||||||
|
Goodwill, net
|
88
|
|
282
|
|
311
|
|
—
|
|
681
|
|
||||||||||
|
Acquisitions
(a)
|
376
|
|
—
|
|
—
|
|
—
|
|
376
|
|
||||||||||
|
Disposals and other, net
(b)
|
2
|
|
(11
|
)
|
(14
|
)
|
—
|
|
(23
|
)
|
||||||||||
|
Balance as of December 29, 2012
|
|
|||||||||||||||||||
|
Goodwill, gross
|
466
|
|
288
|
|
297
|
|
—
|
|
1,051
|
|
||||||||||
|
Accumulated impairment losses
|
—
|
|
(17
|
)
|
—
|
|
—
|
|
(17
|
)
|
||||||||||
|
Goodwill, net
|
466
|
|
271
|
|
297
|
|
—
|
|
1,034
|
|
||||||||||
|
Acquisitions
(c)
|
2
|
|
86
|
|
—
|
|
2
|
|
90
|
|
||||||||||
|
Impairment Losses
(d)
|
(222
|
)
|
—
|
|
—
|
|
—
|
|
(222
|
)
|
||||||||||
|
Disposals and other, net
(b)
|
10
|
|
(18
|
)
|
(5
|
)
|
—
|
|
(13
|
)
|
||||||||||
|
Balance as of December 28, 2013
|
||||||||||||||||||||
|
Goodwill, gross
|
478
|
|
356
|
|
292
|
|
2
|
|
1,128
|
|
||||||||||
|
Accumulated impairment losses
|
(222
|
)
|
(17
|
)
|
—
|
|
—
|
|
(239
|
)
|
||||||||||
|
Goodwill,net
|
$
|
256
|
|
$
|
339
|
|
$
|
292
|
|
$
|
2
|
|
$
|
889
|
|
|||||
|
(a)
|
We recorded goodwill of
$376 million
related to our acquisition of Little Sheep. See the Little Sheep Acquisition and Subsequent Impairment section of Note 4.
|
|
(b)
|
Disposals and other, net includes the impact of foreign currency translation on existing balances and goodwill write-offs associated with refranchising.
|
|
(c)
|
We recorded goodwill of
$86 million
in our YRI segment related to the acquisition of 65 KFC and 41 Pizza Hut restaurants in Turkey.
|
|
(d)
|
We recorded an impairment charge of
$222 million
to write down Little Sheep's goodwill in 2013. See the Little Sheep Acquisition and Subsequent Impairment section of Note 4 for details.
|
74
Intangible assets, net for the years ended
2013
and
2012
are as follows:
|
|
2013
|
2012
|
||||||||||||||
|
|
Gross Carrying Amount
|
Accumulated Amortization
|
Gross Carrying Amount
|
Accumulated Amortization
|
||||||||||||
|
Definite-lived intangible assets
|
|
|
|
|
||||||||||||
|
Reacquired franchise rights
|
$
|
188
|
|
$
|
(66
|
)
|
$
|
163
|
|
$
|
(47
|
)
|
||||
|
Franchise contract rights
|
130
|
|
(90
|
)
|
131
|
|
(84
|
)
|
||||||||
|
Lease tenancy rights
|
71
|
|
(12
|
)
|
57
|
|
(12
|
)
|
||||||||
|
Favorable operating leases
|
20
|
|
(12
|
)
|
21
|
|
(11
|
)
|
||||||||
|
Other
|
52
|
|
(22
|
)
|
51
|
|
(19
|
)
|
||||||||
|
|
$
|
461
|
|
$
|
(202
|
)
|
$
|
423
|
|
$
|
(173
|
)
|
||||
|
Indefinite-lived intangible assets
|
||||||||||||||||
|
KFC trademark
|
$
|
31
|
|
$
|
31
|
|
||||||||||
|
Little Sheep trademark
(a)
|
348
|
|
409
|
|
||||||||||||
|
$
|
379
|
|
$
|
440
|
|
|||||||||||
Amortization expense for all definite-lived intangible assets was
$28 million
in
2013
,
$28 million
in
2012
and
$31 million
in
2011
. Amortization expense for definite-lived intangible assets will approximate
$27 million
in 2014,
$26 million
in 2015,
$25 million
in 2016,
$23 million
in 2017 and
$22 million
in 2018.
|
(a)
|
We recorded an impairment charge of
$69 million
to write down the Little Sheep trademark in 2013. See the Little Sheep Acquisition and Subsequent Impairment section of Note 4 for details.
|
|
|
2013
|
2012
|
||||||
|
Short-term Borrowings
|
|
|
||||||
|
Current maturities of long-term debt
|
$
|
71
|
|
$
|
10
|
|
||
|
Long-term Debt
|
|
|
||||||
|
Senior Unsecured Notes
|
$
|
2,803
|
|
$
|
2,750
|
|
||
|
Capital lease obligations (See Note 11)
|
172
|
|
170
|
|
||||
|
|
2,975
|
|
2,920
|
|
||||
|
Less current maturities of long-term debt
|
(71
|
)
|
(10
|
)
|
||||
|
Long-term debt excluding long-term portion of hedge accounting adjustment
|
2,904
|
|
2,910
|
|
||||
|
Long-term portion of fair value hedge accounting adjustment (See Note 12)
|
14
|
|
22
|
|
||||
|
Long-term debt including hedge accounting adjustment
|
$
|
2,918
|
|
|
$
|
2,932
|
|
|
Our primary bank credit agreement comprises a
$1.3 billion
syndicated senior unsecured revolving credit facility (the "Credit Facility") which matures in March 2017. The Credit Facility includes
24
participating banks with commitments ranging from
$23 million
to
$115 million
. Under the terms of the Credit Facility, we may borrow up to the maximum borrowing limit, less outstanding letters of credit or banker’s acceptances, where applicable. At
December 28, 2013
, our unused Credit Facility totaled
$1.2 billion
net of outstanding letters of credit of
$65 million
. There were no borrowings outstanding under the Credit Facility at
December 28, 2013
. The interest rate for most borrowings under the Credit Facility ranges from
1.00%
to
1.75%
over the London Interbank Offered Rate (“
LIBOR
”). The exact spread over LIBOR under the Credit Facility depends upon our performance against specified financial criteria. Interest on any outstanding borrowings under the Credit Facility is payable at least quarterly.
The Credit Facility is unconditionally guaranteed by our principal domestic subsidiaries. This agreement contains financial covenants relating to maintenance of leverage and fixed charge coverage ratios and also contains affirmative and negative covenants including, among other things, limitations on certain additional indebtedness and liens, and certain other transactions specified in
75
the agreement. Given the Company’s strong balance sheet and cash flows, we were able to comply with all debt covenant requirements at
December 28, 2013
with a considerable amount of cushion. Additionally, the Credit Facility contains cross-default provisions whereby our failure to make any payment on our indebtedness in a principal amount in excess of
$125 million
, or the acceleration of the maturity of any such indebtedness, will constitute a default under such agreement.
The majority of our remaining long-term debt primarily comprises Senior Unsecured Notes with varying maturity dates from
2014
through
2043
and stated interest rates ranging from
2.38%
to
6.88%
. The Senior Unsecured Notes represent senior, unsecured obligations and rank equally in right of payment with all of our existing and future unsecured unsubordinated indebtedness. Our Senior Unsecured Notes provide that the acceleration of the maturity of any of our indebtedness in a principal amount in excess of
$50 million
will constitute a default under the Senior Unsecured Notes if such acceleration is not annulled, or such indebtedness is not discharged, within
30
days after notice.
During the fourth quarter of 2013, we issued
$325 million
aggregate principal amount of
3.88%
10 year Senior Unsecured Notes and
$275 million
aggregate principal amount of
5.35%
30 year Senior Unsecured Notes. We used the proceeds from our issuances of these Senior Unsecured Notes in part to repurchase
$550 million
of our Senior Unsecured Notes due either
March 2018
or
November 2037
with aggregate principal amounts of
$275 million
each. See Losses Related to the Extinguishment of Debt section of Note 4 for further detail.
The following table summarizes all Senior Unsecured Notes issued that remain outstanding at
December 28, 2013
:
|
|
|
|
Interest Rate
|
|||||||
|
Issuance Date
(a)
|
Maturity Date
|
Principal Amount (in millions)
|
Stated
|
Effective
(b)
|
||||||
|
April 2006
|
April 2016
|
$
|
300
|
|
6.25%
|
6.03%
|
||||
|
October 2007
|
March 2018
|
$
|
325
|
|
6.25%
|
6.36%
|
||||
|
October 2007
|
November 2037
|
$
|
325
|
|
6.88%
|
7.45%
|
||||
|
August 2009
|
September 2015
|
$
|
250
|
|
4.25%
|
4.44%
|
||||
|
August 2009
|
September 2019
|
$
|
250
|
|
5.30%
|
5.59%
|
||||
|
August 2010
|
November 2020
|
$
|
350
|
|
3.88%
|
4.01%
|
||||
|
August 2011
|
November 2021
|
$
|
350
|
|
3.75%
|
3.88%
|
||||
|
September 2011
|
September 2014
|
$
|
58
|
|
2.38%
|
2.89%
|
||||
|
October 2013
|
November 2023
|
$
|
325
|
|
3.88%
|
4.01%
|
||||
|
October 2013
|
November 2043
|
$
|
275
|
|
5.35%
|
5.42%
|
||||
|
(a)
|
Interest payments commenced approximately
six
months after issuance date and are payable
semi-annually
thereafter.
|
|
(b)
|
Includes the effects of the amortization of any (1) premium or discount; (2) debt issuance costs; and (3) gain or loss upon settlement of related treasury locks and forward-starting interest rate swaps utilized to hedge the interest rate risk prior to the debt issuance. Excludes the effect of any swaps that remain outstanding as described in Note 12.
|
The annual maturities of short-term borrowings and long-term debt as of
December 28, 2013
, excluding capital lease obligations of
$172 million
and fair value hedge accounting adjustments of
$14 million
, are as follows:
|
Year ended:
|
|
||
|
2014
|
$
|
58
|
|
|
2015
|
250
|
|
|
|
2016
|
300
|
|
|
|
2017
|
—
|
|
|
|
2018
|
325
|
|
|
|
Thereafter
|
1,875
|
|
|
|
Total
|
$
|
2,808
|
|
Interest expense on short-term borrowings and long-term debt was
$270 million
,
$169 million
and
$184 million
in
2013
,
2012
and
2011
, respectively. 2013 included
$118 million
in losses recorded in Interest expense, net as a result of premiums paid and other costs related to the extinguishment of debt. See Losses Related to the Extinguishment of Debt section of Note 4 for further discussion.
76
At
December 28, 2013
we operated more than
8,100
restaurants, leasing the underlying land and/or building in nearly
7,300
of those restaurants with the vast majority of our commitments expiring within
20
years from the inception of the lease. Our longest lease expires in
2087
. We also lease office space for headquarters and support functions, as well as certain office and restaurant equipment. We do not consider any of these individual leases material to our operations. Most leases require us to pay related executory costs, which include property taxes, maintenance and insurance.
Future minimum commitments and amounts to be received as lessor or sublessor under non-cancelable leases are set forth below:
|
|
Commitments
|
Lease Receivables
|
||||||||||||||
|
|
Capital
|
Operating
|
Direct
Financing
|
Operating
|
||||||||||||
|
2014
|
$
|
18
|
|
$
|
721
|
|
$
|
2
|
|
$
|
61
|
|
||||
|
2015
|
19
|
|
672
|
|
2
|
|
56
|
|
||||||||
|
2016
|
19
|
|
627
|
|
3
|
|
52
|
|
||||||||
|
2017
|
17
|
|
569
|
|
2
|
|
47
|
|
||||||||
|
2018
|
17
|
|
515
|
|
2
|
|
43
|
|
||||||||
|
Thereafter
|
186
|
|
2,593
|
|
7
|
|
152
|
|
||||||||
|
|
$
|
276
|
|
$
|
5,697
|
|
$
|
18
|
|
$
|
411
|
|
||||
At
December 28, 2013
and
December 29, 2012
, the present value of minimum payments under capital leases was
$172 million
and
$170 million
, respectively. At
December 28, 2013
, unearned income associated with direct financing lease receivables was
$6 million
.
The details of rental expense and income are set forth below:
|
|
2013
|
2012
|
2011
|
|||||||||
|
Rental expense
|
|
|
|
|||||||||
|
Minimum
|
$
|
759
|
|
$
|
721
|
|
$
|
625
|
|
|||
|
Contingent
|
293
|
|
290
|
|
233
|
|
||||||
|
|
$
|
1,052
|
|
$
|
1,011
|
|
$
|
858
|
|
|||
|
Rental income
|
$
|
94
|
|
$
|
77
|
|
$
|
66
|
|
|||
The Company is exposed to certain market risks relating to its ongoing business operations. The primary market risks managed by using derivative instruments are interest rate risk and cash flow volatility arising from foreign currency fluctuations.
We enter into interest rate swaps with the objective of reducing our exposure to interest rate risk and lowering interest expense for a portion of our fixed-rate debt. At
December 28, 2013
, our interest rate swaps outstanding had notional amounts of
$300 million
and have been designated as fair value hedges of a portion of our debt. These fair value hedges meet the shortcut method requirements and no ineffectiveness has been recorded.
We enter into foreign currency forward contracts with the objective of reducing our exposure to cash flow volatility arising from foreign currency fluctuations associated with certain foreign currency denominated intercompany short-term receivables and payables. The notional amount, maturity date, and currency of these contracts match those of the underlying receivables or payables. For those foreign currency exchange forward contracts that we have designated as cash flow hedges, we measure ineffectiveness by comparing the cumulative change in the fair value of the forward contract with the cumulative change in the fair value of the hedged item. At
December 28, 2013
, foreign currency forward contracts outstanding had a total notional amount of
$141 million
.
77
The fair values of derivatives designated as hedging instruments for the years ended
December 28, 2013
and
December 29, 2012
were:
|
|
Fair Value
|
Consolidated Balance Sheet Location
|
||||||||
|
|
2013
|
2012
|
|
|||||||
|
Interest Rate Swaps - Asset
|
$
|
17
|
|
$
|
24
|
|
Other assets
|
|||
|
Foreign Currency Forwards - Asset
|
2
|
|
|
—
|
|
Prepaid expenses and other current assets
|
||||
|
Foreign Currency Forwards - Liability
|
(1
|
)
|
|
(5
|
)
|
Accounts payable and other current liabilities
|
||||
|
Total
|
$
|
18
|
|
$
|
19
|
|
|
|||
The unrealized gains associated with our interest rate swaps that hedge the interest rate risk for a portion of our debt have been reported as an addition of
$14 million
and
$22 million
to Long-term debt at
December 28, 2013
and
December 29, 2012
, respectively. During the years ended
December 28, 2013
and
December 29, 2012
, Interest expense, net was reduced by
$8 million
and
$12 million
, respectively for recognized gains on these interest rate swaps.
Changes in fair value of derivative instruments:
|
2013
|
2012
|
||||||||||
|
Beginning of Year Balance
|
$
|
19
|
|
|
$
|
34
|
|
||||
|
Changes in fair value recognized into Other Comprehensive Income ("OCI")
|
6
|
|
|
(7
|
)
|
||||||
|
Changes in fair value recognized into income
|
2
|
|
|
16
|
|
||||||
|
Cash receipts
|
(9
|
)
|
|
(24
|
)
|
||||||
|
Ending Balance
|
$
|
18
|
|
|
$
|
19
|
|
||||
For our cash flow hedges the following effective portions of gains and losses were recognized into Accumulated OCI and reclassified into income from Accumulated OCI in the years ended
December 28, 2013
and
December 29, 2012
.
|
|
2013
|
2012
|
||||||
|
Gains (losses) recognized into Accumulated OCI, net of tax
|
$
|
4
|
|
$
|
(4
|
)
|
||
|
Gains (losses) reclassified from Accumulated OCI into income, net of tax
|
$
|
1
|
|
$
|
(4
|
)
|
||
The gains/losses reclassified from Accumulated OCI into income were recognized as Other income (expense) in our Consolidated Statement of Income, largely offsetting foreign currency transaction losses/gains recorded when the related intercompany receivables and payables were adjusted for foreign currency fluctuations. Changes in fair values of the foreign currency forwards recognized directly in our results of operations either from ineffectiveness or exclusion from effectiveness testing were insignificant in the years ended
December 28, 2013
and
December 29, 2012
.
Additionally, we had a net deferred loss of
$9 million
and
$12 million
, net of tax, as of
December 28, 2013
and
December 29, 2012
, respectively within Accumulated OCI due to treasury locks and forward-starting interest rate swaps that have been cash settled, as well as outstanding foreign currency forward contracts. The majority of this loss arose from the settlement of forward starting interest rate swaps entered into prior to the issuance of our Senior Unsecured Notes due in 2037, and is being reclassified into earnings through 2037 to interest expense. In
2013
,
2012
and
2011
an insignificant amount was reclassified from Accumulated OCI to Interest expense, net as a result of these previously settled cash flow hedges.
As a result of the use of derivative instruments, the Company is exposed to risk that the counterparties will fail to meet their contractual obligations. To mitigate the counterparty credit risk, we only enter into contracts with carefully selected major financial institutions based upon their credit ratings and other factors, and continually assess the creditworthiness of counterparties. At
December 28, 2013
and
December 29, 2012
, all of the counterparties to our interest rate swaps and foreign currency forwards had investment grade ratings according to the three major ratings agencies. To date, all counterparties have performed in accordance with their contractual obligations.
78
At
December 28, 2013
the carrying values of cash and cash equivalents, short-term investments, accounts receivable and accounts payable approximated their fair values because of the short-term nature of these instruments. The fair value of notes receivable net of allowances and lease guarantees less subsequent amortization approximates their carrying value. The Company’s debt obligations, excluding capital leases, were estimated to have a fair value of
$3.0 billion
(Level 2), compared to their carrying value of
$2.8 billion
. We estimated the fair value of debt using market quotes and calculations based on market rates.
Recurring Fair Value Measurements
The following table presents fair values for those assets and liabilities measured at fair value on a recurring basis and the level within the fair value hierarchy in which the measurements fall. No transfers among the levels within the fair value hierarchy occurred during the years ended
December 28, 2013
or
December 29, 2012
.
|
|
Fair Value
|
||||||||||
|
|
Level
|
2013
|
2012
|
||||||||
|
Foreign Currency Forwards, net
|
2
|
|
$
|
1
|
|
|
$
|
(5
|
)
|
||
|
Interest Rate Swaps, net
|
2
|
|
17
|
|
24
|
|
|||||
|
Other Investments
|
1
|
|
18
|
|
17
|
|
|||||
|
Total
|
|
$
|
36
|
|
$
|
36
|
|
||||
The fair value of the Company’s foreign currency forwards and interest rate swaps were determined based on the present value of expected future cash flows considering the risks involved, including nonperformance risk, and using discount rates appropriate for the duration based upon observable inputs. The other investments include investments in mutual funds, which are used to offset fluctuations in deferred compensation liabilities that employees have chosen to invest in phantom shares of a Stock Index Fund or Bond Index Fund. The other investments are classified as trading securities in Other assets in our Consolidated Balance Sheets and their fair value is determined based on the closing market prices of the respective mutual funds as of
December 28, 2013
and
December 29, 2012
.
Non-Recurring Fair Value Measurements
The following table presents (income) expense recognized from all non-recurring fair value measurements during the year ended
December 28, 2013
for assets and liabilities that remained on our Consolidated Balance Sheet as of
December 28, 2013
or for all non-recurring fair value measurements during the year ended
December 29, 2012
that remained on our Consolidated Balance Sheet as of
December 29, 2012
. These assets and liabilities include restaurants or groups of restaurants that were impaired either as a result of our semi-annual impairment review or when it was more likely than not a restaurant or restaurant group would be refranchised.
|
2013
|
2012
|
||||||||
|
Little Sheep impairment (Level 3)
(a)
|
$
|
295
|
|
|
$
|
—
|
|
||
|
Little Sheep acquisition gain (Level 2)
(a)
|
—
|
|
(74
|
)
|
|||||
|
Refranchising related impairment - other (Level 3)
(b)
|
—
|
|
4
|
|
|||||
|
Restaurant-level impairment (Level 3)
(c)
|
19
|
|
16
|
|
|||||
|
Total
|
$
|
314
|
|
|
$
|
(54
|
)
|
||
|
(a)
|
See the Little Sheep Acquisition and Subsequent Impairment section of Note 4 for further discussion.
|
|
(b)
|
Refranchising related impairment results from writing down the assets of restaurants or restaurant groups offered for refranchising, including certain instances where a decision has been made to refranchise restaurants that are deemed to be impaired. The fair value measurements used in our impairment evaluation are based on either actual bids received from potential buyers (Level 2), or on estimates of the sales prices we anticipated receiving from a buyer for the restaurant or restaurant groups (Level 3). The remaining net book value of assets measured at fair value during the years ended
December 28, 2013
and
December 29, 2012
is insignificant.
|
79
|
(c)
|
Restaurant-level impairment charges are recorded in Closures and impairment (income) expenses and resulted primarily from our semi-annual impairment evaluation of long-lived assets of individual restaurants that were being operated at the time of impairment and had not been offered for refranchising. The fair value measurements used in these impairment evaluations were based on discounted cash flow estimates using unobservable inputs (Level 3). The remaining net book value of assets measured at fair value during the years ended
December 28, 2013
and
December 29, 2012
is not significant.
|
Pension Benefits
We sponsor qualified and supplemental (non-qualified) noncontributory defined benefit plans covering certain full-time salaried and hourly U.S. employees. The qualified plan meets the requirements of certain sections of the Internal Revenue Code. A qualified plan typically provides benefits to a broad group of employees with restrictions on discriminating in favor of highly compensated employees with regard to coverage, benefits and contributions. The supplemental plans provide additional benefits to certain employees. We fund our supplemental plans as benefits are paid.
The most significant of these plans is the YUM Retirement Plan (the “Plan”), which is a qualified plan. Our funding policy with respect to the Plan is to contribute amounts necessary to satisfy minimum pension funding requirements, including requirements of the Pension Protection Act of 2006, plus additional amounts from time to time as are determined to be necessary to improve the Plan’s funded status. We currently do not anticipate making any contributions to the Plan in 2014. We expect to make
$8 million
in benefit payments related to our significant U.S. non-qualified plan in 2014. During 2001, our two significant U.S. plans were amended such that any salaried employee hired or rehired by YUM after September 30, 2001 is not eligible to participate in those plans.
We also sponsor various defined benefit plans covering certain of our non-U.S. employees, the most significant of which are in the UK. During the quarter ended March 23, 2013, one of our UK plans was frozen such that existing participants can no longer earn future service credits. Our other UK plan was previously frozen to future service credits in 2011.
The funding rules for our pension plans outside of the U.S. vary from country to country and depend on many factors including discount rates, performance of plan assets, local laws and regulations. We do not plan to make any significant contributions to any pension plan outside of the U.S. in 2014.
We do not anticipate any plan assets being returned to the Company during 2014 for any plans.
During the fourth quarter of 2012 and continuing through 2013, the Company allowed certain former employees with deferred vested balances in our U.S. pension plans an opportunity to voluntarily elect an early payout of their pension benefits. See Note 4 for details.
Obligation and Funded Status at Measurement Date:
The following chart summarizes the balance sheet impact, as well as benefit obligations, assets, and funded status associated with our significant U.S. and International pension plans. The actuarial valuations for all plans reflect measurement dates coinciding with our fiscal year ends.
80
|
|
U.S. Pension Plans
|
International Pension Plans
|
||||||||||||||
|
|
2013
|
2012
|
2013
|
2012
|
||||||||||||
|
Change in benefit obligation
|
|
|
|
|
||||||||||||
|
Benefit obligation at beginning of year
|
$
|
1,290
|
|
$
|
1,381
|
|
$
|
193
|
|
$
|
187
|
|
||||
|
Service cost
|
21
|
|
26
|
|
1
|
|
2
|
|
||||||||
|
Interest cost
|
54
|
|
66
|
|
8
|
|
8
|
|
||||||||
|
Participant contributions
|
—
|
|
—
|
|
—
|
|
1
|
|
||||||||
|
Plan amendments
|
—
|
|
5
|
|
—
|
|
—
|
|
||||||||
|
Curtailments
|
(3
|
)
|
(10
|
)
|
(5
|
)
|
—
|
|
||||||||
|
Special termination benefits
|
5
|
|
3
|
|
—
|
|
—
|
|
||||||||
|
Exchange rate changes
|
—
|
|
—
|
|
4
|
|
5
|
|
||||||||
|
Benefits paid
|
(21
|
)
|
(14
|
)
|
(3
|
)
|
(4
|
)
|
||||||||
|
Settlements
(a)(b)
|
(151
|
)
|
(278
|
)
|
—
|
|
—
|
|
||||||||
|
Actuarial (gain) loss
|
(170
|
)
|
111
|
|
28
|
|
(6
|
)
|
||||||||
|
Benefit obligation at end of year
|
$
|
1,025
|
|
$
|
1,290
|
|
$
|
226
|
|
$
|
193
|
|
||||
|
Change in plan assets
|
|
|
|
|
||||||||||||
|
Fair value of plan assets at beginning of year
|
$
|
945
|
|
$
|
998
|
|
$
|
226
|
|
$
|
183
|
|
||||
|
Actual return on plan assets
|
116
|
|
144
|
|
30
|
|
21
|
|
||||||||
|
Employer contributions
|
22
|
|
100
|
|
1
|
|
19
|
|
||||||||
|
Participant contributions
|
—
|
|
—
|
|
—
|
|
1
|
|
||||||||
|
Settlement payments
(a)
|
(123
|
)
|
(278
|
)
|
—
|
|
—
|
|
||||||||
|
Benefits paid
|
(21
|
)
|
(14
|
)
|
(3
|
)
|
(4
|
)
|
||||||||
|
Exchange rate changes
|
—
|
|
—
|
|
5
|
|
6
|
|
||||||||
|
Administrative expenses
|
(6
|
)
|
(5
|
)
|
—
|
|
—
|
|
||||||||
|
Fair value of plan assets at end of year
|
$
|
933
|
|
$
|
945
|
|
$
|
259
|
|
$
|
226
|
|
||||
|
Funded status at end of year
|
$
|
(92
|
)
|
$
|
(345
|
)
|
$
|
33
|
|
$
|
33
|
|
||||
|
Amounts recognized in the Consolidated Balance Sheet:
|
||||||||||||||||
|
|
U.S. Pension Plans
|
International Pension Plans
|
||||||||||||||
|
|
2013
|
2012
|
2013
|
2012
|
||||||||||||
|
Prepaid benefit asset - non-current
|
$
|
10
|
|
$
|
—
|
|
$
|
33
|
|
$
|
33
|
|
||||
|
Accrued benefit liability - current
|
(8
|
)
|
(19
|
)
|
—
|
|
—
|
|
||||||||
|
Accrued benefit liability - non-current
|
(94
|
)
|
(326
|
)
|
—
|
|
—
|
|
||||||||
|
|
$
|
(92
|
)
|
$
|
(345
|
)
|
$
|
33
|
|
$
|
33
|
|
||||
|
(a)
|
For discussion of the settlement payments and settlement losses, see Pension Settlement Charges section of Note 4.
|
|
(b)
|
2013 includes the transfer of certain non-qualified pension benefits into a defined benefit plan not included in the table above due to its insignificance.
|
The accumulated benefit obligation for the U.S. and International pension plans was
$1,209 million
and
$1,426 million
at
December 28, 2013
and
December 29, 2012
, respectively.
81
|
Information for pension plans with an accumulated benefit obligation in excess of plan assets:
|
||||||||||||||||
|
|
U.S. Pension Plans
|
International Pension Plans
|
||||||||||||||
|
|
2013
|
2012
|
2013
|
2012
|
||||||||||||
|
Projected benefit obligation
|
$
|
102
|
|
$
|
1,290
|
|
$
|
—
|
|
$
|
—
|
|
||||
|
Accumulated benefit obligation
|
94
|
|
1,239
|
|
—
|
|
—
|
|
||||||||
|
Fair value of plan assets
|
—
|
|
945
|
|
—
|
|
—
|
|
||||||||
|
Information for pension plans with a projected benefit obligation in excess of plan assets:
|
||||||||||||||||
|
|
U.S. Pension Plans
|
International Pension Plans
|
||||||||||||||
|
|
2013
|
2012
|
2013
|
2012
|
||||||||||||
|
Projected benefit obligation
|
$
|
102
|
|
$
|
1,290
|
|
$
|
—
|
|
$
|
—
|
|
||||
|
Accumulated benefit obligation
|
94
|
|
1,239
|
|
—
|
|
—
|
|
||||||||
|
Fair value of plan assets
|
—
|
|
945
|
|
—
|
|
—
|
|
||||||||
Components of net periodic benefit cost:
|
|
U.S. Pension Plans
|
International Pension Plans
|
||||||||||||||||||||||
|
Net periodic benefit cost
|
2013
|
2012
|
2011
|
2013
|
2012
|
2011
|
||||||||||||||||||
|
Service cost
|
$
|
21
|
|
$
|
26
|
|
$
|
24
|
|
$
|
1
|
|
$
|
2
|
|
$
|
5
|
|
||||||
|
Interest cost
|
54
|
|
66
|
|
64
|
|
8
|
|
8
|
|
10
|
|
||||||||||||
|
Amortization of prior service cost
(a)
|
2
|
|
|
1
|
|
|
1
|
|
—
|
|
—
|
|
—
|
|
||||||||||
|
Expected return on plan assets
|
(59
|
)
|
(71
|
)
|
(71
|
)
|
(12
|
)
|
(11
|
)
|
(12
|
)
|
||||||||||||
|
Amortization of net loss
|
48
|
|
63
|
|
31
|
|
1
|
|
1
|
|
2
|
|
||||||||||||
|
Net periodic benefit cost
|
$
|
66
|
|
$
|
85
|
|
$
|
49
|
|
$
|
(2
|
)
|
$
|
—
|
|
$
|
5
|
|
||||||
|
Additional (gain) loss recognized due to:
Settlements
(b)
|
$
|
30
|
|
$
|
89
|
|
$
|
—
|
|
$
|
—
|
|
$
|
—
|
|
$
|
—
|
|
||||||
|
Special termination benefits
(c)
|
$
|
5
|
|
$
|
3
|
|
$
|
5
|
|
$
|
—
|
|
$
|
—
|
|
$
|
—
|
|
||||||
|
Curtailment
(d)
|
$
|
—
|
|
$
|
—
|
|
$
|
—
|
|
$
|
(5
|
)
|
$
|
—
|
|
$
|
—
|
|
||||||
|
(a)
|
Prior service costs are amortized on a straight-line basis over the average remaining service period of employees expected to receive benefits.
|
|
(b)
|
Settlement losses result from benefit payments exceeding the sum of the service cost and interest cost for each plan during the year.
$10 million
and
$84 million
for 2013 and 2012, respectively of these settlement losses, were not allocated for performance reporting purposes. See Note 4 for discussion of the settlement payments and settlement losses.
|
|
(c)
|
Special termination benefits primarily related to the U.S. business transformation measures taken in
2013
,
2012
and
2011
.
|
|
(d)
|
Gain is a result of terminating future service benefits for all participants in one of our UK plans in 2013. The gain was recorded in YRI's G&A expenses, as amounts in Accumulated other comprehensive income (loss) related to this plan were in a net gain position.
|
82
|
Pension (gains) losses in Accumulated other comprehensive income (loss):
|
||||||||||||||||
|
|
U.S. Pension Plans
|
International Pension Plans
|
||||||||||||||
|
|
2013
|
2012
|
2013
|
2012
|
||||||||||||
|
Beginning of year
|
$
|
428
|
|
$
|
543
|
|
$
|
14
|
|
$
|
30
|
|
||||
|
Net actuarial (gain) loss
|
(221
|
)
|
43
|
|
10
|
|
(15
|
)
|
||||||||
|
Curtailments
|
(3
|
)
|
(10
|
)
|
—
|
|
—
|
|
||||||||
|
Amortization of net loss
|
(48
|
)
|
(63
|
)
|
(1
|
)
|
(1
|
)
|
||||||||
|
Amortization of prior service cost
|
(2
|
)
|
(1
|
)
|
—
|
|
—
|
|
||||||||
|
Prior service cost
|
—
|
|
5
|
|
—
|
|
—
|
|
||||||||
|
Settlement charges
|
(30
|
)
|
(89
|
)
|
—
|
|
—
|
|
||||||||
|
Exchange rate changes
|
—
|
|
—
|
|
—
|
|
—
|
|
||||||||
|
End of year
|
$
|
124
|
|
$
|
428
|
|
$
|
23
|
|
$
|
14
|
|
||||
|
Accumulated pre-tax losses recognized within Accumulated Other Comprehensive Income:
|
||||||||||||||||
|
|
U.S. Pension Plans
|
International Pension Plans
|
||||||||||||||
|
|
2013
|
2012
|
2013
|
2012
|
||||||||||||
|
Actuarial net loss
|
$
|
119
|
|
$
|
421
|
|
$
|
23
|
|
$
|
14
|
|
||||
|
Prior service cost
|
5
|
|
7
|
|
—
|
|
—
|
|
||||||||
|
|
$
|
124
|
|
$
|
428
|
|
$
|
23
|
|
$
|
14
|
|
||||
The estimated net loss for the U.S. and International pension plans that will be amortized from Accumulated other comprehensive income (loss) into net periodic pension cost in
2014
is
$17 million
and less than
$1 million
, respectively. The estimated prior service cost for the U.S. pension plans that will be amortized from Accumulated other comprehensive income (loss) into net periodic pension cost in
2014
is
$1 million
.
|
Weighted-average assumptions used to determine benefit obligations at the measurement dates:
|
||||||||||||
|
|
U.S. Pension Plans
|
International Pension Plans
|
||||||||||
|
|
2013
|
2012
|
2013
|
2012
|
||||||||
|
Discount rate
|
5.40
|
%
|
4.40
|
%
|
4.70
|
%
|
4.70
|
%
|
||||
|
Rate of compensation increase
|
3.75
|
%
|
3.75
|
%
|
N/A
|
|
(a)
|
3.70
|
%
|
|||
|
Weighted-average assumptions used to determine the net periodic benefit cost for fiscal years:
|
||||||||||||||||||
|
|
U.S. Pension Plans
|
International Pension Plans
|
||||||||||||||||
|
|
2013
|
2012
|
2011
|
2013
|
2012
|
2011
|
||||||||||||
|
Discount rate
|
4.40
|
%
|
4.90
|
%
|
5.90
|
%
|
4.69
|
%
|
4.75
|
%
|
5.40
|
%
|
||||||
|
Long-term rate of return on plan assets
|
7.25
|
%
|
7.25
|
%
|
7.75
|
%
|
5.37
|
%
|
5.55
|
%
|
6.64
|
%
|
||||||
|
Rate of compensation increase
|
3.75
|
%
|
3.75
|
%
|
3.75
|
%
|
1.74
|
%
|
3.85
|
%
|
4.41
|
%
|
||||||
(a) As of 2013, both plans presented are now frozen to future service cost credits.
Our estimated long-term rate of return on plan assets represents the weighted-average of expected future returns on the asset categories included in our target investment allocation based primarily on the historical returns for each asset category.
83
Plan Assets
The fair values of our pension plan assets at
December 28, 2013
by asset category and level within the fair value hierarchy are as follows:
|
|
U.S. Pension
Plans
|
International
Pension Plans
|
||||||
|
Level 1:
|
|
|
||||||
|
Cash
(a)
|
$
|
—
|
|
$
|
1
|
|
||
|
Level 2:
|
|
|
||||||
|
Cash Equivalents
(a)
|
5
|
|
—
|
|
||||
|
Equity Securities – U.S. Large cap
(b)
|
329
|
|
—
|
|
||||
|
Equity Securities – U.S. Mid cap
(b)
|
55
|
|
—
|
|
||||
|
Equity Securities – U.S. Small cap
(b)
|
53
|
|
—
|
|
||||
|
Equity Securities – Non-U.S.
(b)
|
110
|
|
159
|
|
||||
|
Fixed Income Securities – U.S. Corporate
(b)
|
234
|
|
—
|
|
||||
|
Fixed Income Securities – Non-U.S. Corporate
(b)
|
—
|
|
33
|
|
||||
|
Fixed Income Securities – U.S. Government and Government Agencies
(c)
|
129
|
|
—
|
|
||||
|
Fixed Income Securities – Other
(d)
|
15
|
|
66
|
|
||||
|
Total fair value of plan assets
(e)
|
$
|
930
|
|
$
|
259
|
|
||
|
(a)
|
Short-term investments in money market funds
|
|
(b)
|
Securities held in common trusts
|
|
(c)
|
Investments held directly by the Plan
|
|
(d)
|
Includes securities held in common trusts and investments held directly by the Plan
|
|
(e)
|
U. S. plans exclude net unsettled trades receivable of
$3 million
|
Our primary objectives regarding the investment strategy for the Plan’s assets, which make up
78%
of total pension plan assets at the 2013 measurement date, are to reduce interest rate and market risk and to provide adequate liquidity to meet immediate and future payment requirements. To achieve these objectives, we are using a combination of active and passive investment strategies. Our equity securities, currently targeted to be rebalanced to
45%
from
55%
of our investment mix, consist primarily of low-cost index funds focused on achieving long-term capital appreciation. We diversify our equity risk by investing in several different U.S. and foreign market index funds. Investing in these index funds provides us with the adequate liquidity required to fund benefit payments and plan expenses. The fixed income asset allocation, currently targeted to be rebalanced to
55%
from
45%
of our mix, is actively managed and consists of long-duration fixed income securities that help to reduce exposure to interest rate variation and to better correlate asset maturities with obligations. The fair values of all pension plan assets are determined based on closing market prices or net asset values.
A mutual fund held as an investment by the Plan includes shares of YUM common stock valued at
$0.2 million
at
December 28, 2013
and
$0.7 million
at
December 29, 2012
(less than
1%
of total plan assets in each instance).
84
Benefit Payments
The benefits expected to be paid in each of the next five years and in the aggregate for the five years thereafter are set forth below:
|
Year ended:
|
U.S.
Pension Plans
|
International
Pension Plans
|
||||||
|
2014
|
$
|
50
|
|
$
|
1
|
|
||
|
2015
|
46
|
|
1
|
|
||||
|
2016
|
48
|
|
1
|
|
||||
|
2017
|
47
|
|
1
|
|
||||
|
2018
|
50
|
|
1
|
|
||||
|
2019 - 2023
|
282
|
|
7
|
|
||||
Expected benefits are estimated based on the same assumptions used to measure our benefit obligation on the measurement date and include benefits attributable to estimated future employee service.
Retiree Medical Benefits
Our post-retirement plan provides health care benefits, principally to U.S. salaried retirees and their dependents, and includes retiree cost-sharing provisions. During 2001, the plan was amended such that any salaried employee hired or rehired by YUM after September 30, 2001 is not eligible to participate in this plan. Employees hired prior to September 30, 2001 are eligible for benefits if they meet age and service requirements and qualify for retirement benefits. We fund our post-retirement plan as benefits are paid.
At the end of
2013
and
2012
, the accumulated post-retirement benefit obligation was
$70 million
and
$83 million
, respectively. An actuarial gain of
$2 million
was recognized in Accumulated other comprehensive loss at the end of
2013
, and an actuarial loss of
$8 million
was recognized in Accumulated other comprehensive loss at the end of
2012
. The net periodic benefit cost recorded was
$5 million
in
2013
, and was
$6 million
in both
2012
and
2011
, the majority of which is interest cost on the accumulated post-retirement benefit obligation. The weighted-average assumptions used to determine benefit obligations and net periodic benefit cost for the post-retirement medical plan are identical to those as shown for the U.S. pension plans. Our assumed heath care cost trend rates for the following year as of
2013
and
2012
are
7.2%
and
7.4%
, respectively, with expected ultimate trend rates of
4.5%
reached in
2028
.
There is a cap on our medical liability for certain retirees. The cap for Medicare-eligible retirees was reached in 2000 and the cap for non-Medicare eligible retirees is expected to be reached in 2014; once the cap is reached, our annual cost per retiree will not increase. A one-percentage-point increase or decrease in assumed health care cost trend rates would have less than a
$1 million
impact on total service and interest cost and on the post-retirement benefit obligation. The benefits expected to be paid in each of the next five years are approximately
$6 million
and in aggregate for the five years thereafter are
$23 million
.
Retiree Savings Plan
We sponsor a contributory plan to provide retirement benefits under the provisions of Section 401(k) of the Internal Revenue Code (the “401(k) Plan”) for eligible U.S. salaried and hourly employees. Participants are able to elect to contribute up to
75%
of eligible compensation on a pre-tax basis. Participants may allocate their contributions to one or any combination of multiple investment options or a self-managed account within the 401(k) Plan. We match
100%
of the participant’s contribution to the 401(k) Plan up to
6%
of eligible compensation. We recognized as compensation expense our total matching contribution of
$12 million
in
2013
,
$13 million
in
2012
and
$14 million
in
2011
.
85
Overview
At year end
2013
, we had
four
stock award plans in effect: the YUM! Brands, Inc. Long-Term Incentive Plan and the 1997 Long-Term Incentive Plan (collectively the “LTIPs”), the YUM! Brands, Inc. Restaurant General Manager Stock Option Plan (“RGM Plan”) and the YUM! Brands, Inc. SharePower Plan (“SharePower”). Under all our plans, the exercise price of stock options and SARs granted must be equal to or greater than the average market price or the ending market price of the Company’s stock on the date of grant.
Potential awards to employees and non-employee directors under the LTIPs include stock options, incentive stock options, SARs, restricted stock, stock units, restricted stock units (“RSUs”), performance restricted stock units, performance share units (“PSUs”) and performance units. Through
December 28, 2013
, we have issued only stock options, SARs, RSUs and PSUs under the LTIPs. While awards under the LTIPs can have varying vesting provisions and exercise periods, outstanding awards under the LTIPs vest in periods ranging from
immediate
to
five
years. Stock options and SARs expire
ten
years after grant.
Potential awards to employees under the RGM Plan include stock options, SARs, restricted stock and RSUs. Through
December 28, 2013
, we have issued only stock options and SARs under this plan. RGM Plan awards granted have a
four
-year cliff vesting period and expire
ten
years after grant. Certain RGM Plan awards are granted upon attainment of performance conditions in the previous year. Expense for such awards is recognized over a period that includes the performance condition period.
Potential awards to employees under SharePower include stock options, SARs, restricted stock and RSUs. Through
December 28, 2013
, we have issued only stock options and SARs under this plan. These awards generally vest over a period of
four
years and expire no longer than
ten
years after grant.
At year end
2013
, approximately
16 million
shares were available for future share-based compensation grants under the above plans.
Our Executive Income Deferral (“EID”) Plan allows participants to defer receipt of a portion of their annual salary and all or a portion of their incentive compensation. As defined by the EID Plan, we credit the amounts deferred with earnings based on the investment options selected by the participants. These investment options are limited to cash, phantom shares of our Common Stock, phantom shares of a Stock Index Fund and phantom shares of a Bond Index Fund. Investments in cash and phantom shares of both index funds will be distributed in cash at a date as elected by the employee and therefore are classified as a liability on our Consolidated Balance Sheets. We recognize compensation expense for the appreciation or the depreciation, if any, of investments in cash and both of the index funds. Deferrals into the phantom shares of our Common Stock will be distributed in shares of our Common Stock, under the LTIPs, at a date as elected by the employee and therefore are classified in Common Stock on our Consolidated Balance Sheets. We do not recognize compensation expense for the appreciation or the depreciation, if any, of investments in phantom shares of our Common Stock. Our EID plan also allows participants to defer incentive compensation to purchase phantom shares of our Common Stock and receive a
33%
Company match on the amount deferred. Deferrals receiving a match are similar to a RSU award in that participants will generally forfeit both the match and incentive compensation amounts deferred if they voluntarily separate from employment during a vesting period that is
two
years from the date of deferral. We expense the intrinsic value of the match and the incentive compensation over the requisite service period which includes the vesting period.
Historically, the Company has repurchased shares on the open market in excess of the amount necessary to satisfy award exercises and expects to continue to do so in 2014.
86
Award Valuation
We estimated the fair value of each stock option and SAR award as of the date of grant using the Black-Scholes option-pricing model with the following weighted-average assumptions:
|
|
2013
|
2012
|
2011
|
||||||
|
Risk-free interest rate
|
0.8
|
%
|
0.8
|
%
|
2.0
|
%
|
|||
|
Expected term (years)
|
6.2
|
|
6.0
|
|
5.9
|
|
|||
|
Expected volatility
|
29.9
|
%
|
29.0
|
%
|
28.2
|
%
|
|||
|
Expected dividend yield
|
2.1
|
%
|
1.8
|
%
|
2.0
|
%
|
|||
We believe it is appropriate to group our stock option and SAR awards into
two
homogeneous groups when estimating expected term. These groups consist of grants made primarily to restaurant-level employees under the RGM Plan, which cliff-vest after
four
years and expire
ten
years after grant, and grants made to executives under our other stock award plans, which typically have a graded vesting schedule of
25% per year
over
four
years and expire
ten
years after grant. We use a single weighted-average term for our awards that have a graded vesting schedule. Based on analysis of our historical exercise and post-vesting termination behavior, we have determined that our restaurant-level employees and our executives exercised the awards on average after
5
years and
6.25
years, respectively.
When determining expected volatility, we consider both historical volatility of our stock as well as implied volatility associated with our publicly traded options. The expected dividend yield is based on the annual dividend yield at the time of grant.
The fair values of RSU and PSU awards granted prior to 2013 are based on the closing price of our stock on the date of grant. In 2013, the Company granted PSU awards with market-based conditions valued using a Monte Carlo simulation.
Award Activity
Stock Options and SARs
|
|
Shares
(in thousands)
|
Weighted-Average Exercise
Price
|
Weighted- Average Remaining Contractual Term
|
Aggregate Intrinsic Value (in millions)
|
||||||||||||
|
Outstanding at the beginning of the year
|
28,612
|
|
|
$
|
37.05
|
|
|
|
||||||||
|
Granted
|
3,767
|
|
|
63.83
|
|
|
|
|||||||||
|
Exercised
|
(4,030
|
)
|
27.15
|
|
|
|
||||||||||
|
Forfeited or expired
|
(636
|
)
|
47.69
|
|
|
|
||||||||||
|
Outstanding at the end of the year
|
27,713
|
|
(a)
|
$
|
41.77
|
|
5.72
|
|
$
|
890
|
|
|||||
|
Exercisable at the end of the year
|
17,787
|
|
|
$
|
33.58
|
|
4.45
|
|
$
|
717
|
|
|||||
|
(a)
|
Outstanding awards include
3,103
options and
24,610
SARs with average exercise prices of
$34.58
and
$42.68
, respectively.
|
The weighted-average grant-date fair value of stock options and SARs granted during
2013
,
2012
and
2011
was
$14.67
,
$15.00
and
$11.78
, respectively. The total intrinsic value of stock options and SARs exercised during the years ended
December 28, 2013
,
December 29, 2012
and
December 31, 2011
, was
$176 million
,
$319 million
and
$226 million
, respectively.
As of
December 28, 2013
, there was
$85 million
of unrecognized compensation cost related to stock options and SARs, which will be reduced by any forfeitures that occur, related to unvested awards that is expected to be recognized over a remaining weighted-average period of approximately
1.8
years. The total fair value at grant date of awards that vested during
2013
,
2012
and
2011
was
$51 million
,
$48 million
and
$43 million
, respectively.
RSUs and PSUs
As of
December 28, 2013
, there was
$7 million
of unrecognized compensation cost related to
0.9 million
unvested RSUs and PSUs.
87
Impact on Net Income
The components of share-based compensation expense and the related income tax benefits are shown in the following table:
|
|
2013
|
2012
|
2011
|
|||||||||
|
Options and SARs
|
$
|
44
|
|
$
|
42
|
|
$
|
49
|
|
|||
|
Restricted Stock Units
|
6
|
|
5
|
|
5
|
|
||||||
|
Performance Share Units
|
(1
|
)
|
3
|
|
5
|
|
||||||
|
Total Share-based Compensation Expense
|
$
|
49
|
|
$
|
50
|
|
$
|
59
|
|
|||
|
Deferred Tax Benefit recognized
|
$
|
15
|
|
$
|
15
|
|
$
|
18
|
|
|||
|
EID compensation expense not share-based
|
$
|
11
|
|
$
|
5
|
|
$
|
2
|
|
|||
Cash received from stock option exercises for
2013
,
2012
and
2011
, was
$37 million
,
$62 million
and
$59 million
, respectively. Tax benefits realized on our tax returns from tax deductions associated with share-based compensation for
2013
,
2012
and
2011
totaled
$65 million
,
$120 million
and
$82 million
, respectively.
Under the authority of our Board of Directors, we repurchased shares of our Common Stock during
2013
,
2012
and
2011
. All amounts exclude applicable transaction fees.
|
|
Shares Repurchased
(thousands)
|
Dollar Value of Shares
Repurchased
|
|||||||||||||||||||||||||
|
Authorization Date
|
2013
|
|
2012
|
|
2011
|
|
2013
|
|
2012
|
|
2011
|
|
|||||||||||||||
|
November 2013
|
—
|
|
—
|
|
—
|
|
$
|
—
|
|
$
|
—
|
|
$
|
—
|
|
||||||||||||
|
November 2012
|
10,922
|
|
1,069
|
|
—
|
|
750
|
|
47
|
|
—
|
|
|||||||||||||||
|
November 2011
|
—
|
|
11,035
|
|
—
|
|
—
|
|
750
|
|
—
|
|
|||||||||||||||
|
January 2011
|
—
|
|
2,787
|
|
10,864
|
|
—
|
|
188
|
|
562
|
|
|||||||||||||||
|
March 2010
|
—
|
|
—
|
|
3,441
|
|
—
|
|
—
|
|
171
|
|
|||||||||||||||
|
Total
|
10,922
|
|
(a)
|
14,891
|
|
(a)
|
14,305
|
|
(b)
|
$
|
750
|
|
(a)
|
$
|
985
|
|
(a)
|
$
|
733
|
|
(b)
|
||||||
|
(a)
|
2013 amount excludes and 2012 amount includes the effect of
$20 million
in share repurchases (
0.3 million
shares) with trade dates prior to the 2012 fiscal year end but with settlement dates subsequent to the 2012 fiscal year end.
|
|
(b)
|
2011 amount excludes the effect of
$19 million
in share repurchases (
0.4 million
shares) with trade dates prior to the 2010 fiscal year end but cash settlement dates subsequent to the 2010 fiscal year.
|
On November 16, 2012, our Board of Directors authorized share repurchases through
May 2014
of up to
$1 billion
(excluding applicable transaction fees) of our outstanding Common Stock. On November 22, 2013, our Board of Directors authorized additional share repurchases through
May 2015
of up to
$750 million
(excluding applicable transaction fees) of our outstanding Common Stock. As of
December 28, 2013
, we have
$953 million
available for future repurchases under these authorizations.
88
Changes in accumulated other comprehensive income (loss) ("OCI") are presented below.
|
Translation Adjustments and Gains (Losses) From Intra-Entity Transactions of a Long-Term Nature
|
Pension and Post-Retirement Benefit Plan Losses
(a)(b)
|
Net Unrealized Loss on Derivative Instruments
|
Total
|
|||||||||||||
|
Balance at December 31, 2011, net of tax
|
$
|
140
|
|
$
|
(375
|
)
|
$
|
(12
|
)
|
$
|
(247
|
)
|
||||
|
Amounts classified into OCI, net of tax
|
23
|
|
(10
|
)
|
(4
|
)
|
9
|
|
||||||||
|
Amounts reclassified from accumulated OCI, net of tax
|
3
|
|
99
|
|
4
|
|
106
|
|
||||||||
|
OCI, net of tax
|
26
|
|
89
|
|
—
|
|
115
|
|
||||||||
|
Balance at December 29, 2012, net of tax
|
166
|
|
(286
|
)
|
(12
|
)
|
(132
|
)
|
||||||||
|
Amounts classified into OCI, net of tax
|
4
|
|
136
|
|
4
|
|
144
|
|
||||||||
|
Amounts reclassified from accumulated OCI, net of tax
|
—
|
|
53
|
|
(1
|
)
|
52
|
|
||||||||
|
OCI, net of tax
|
4
|
|
189
|
|
3
|
|
196
|
|
||||||||
|
Balance at December 28, 2013, net of tax
|
$
|
170
|
|
$
|
(97
|
)
|
$
|
(9
|
)
|
$
|
64
|
|
||||
|
(a)
|
Amounts reclassified from accumulated OCI to pension and post-retirement benefit plan losses during 2012 include amortization of net losses of
$66 million
, settlement charges of
$89 million
, amortization of prior service cost of
$1 million
and the related income tax benefit of
$57 million
. See Note 14 Pension Benefits for further information.
|
|
(b)
|
Amounts reclassified from accumulated OCI for pension and post-retirement benefit plan losses during 2013 include amortization of net losses of
$51 million
, settlement charges of
$30 million
, amortization of prior service cost of
$2 million
and the related income tax benefit of
$30 million
. See Note 14 Pension Benefits for further information.
|
U.S. and foreign income before taxes are set forth below:
|
|
2013
|
2012
|
2011
|
|||||||||
|
U.S.
|
$
|
464
|
|
$
|
504
|
|
$
|
266
|
|
|||
|
Foreign
|
1,087
|
|
1,641
|
|
1,393
|
|
||||||
|
|
$
|
1,551
|
|
$
|
2,145
|
|
$
|
1,659
|
|
|||
The details of our income tax provision (benefit) are set forth below:
89
|
|
|
2013
|
2012
|
2011
|
||||||||||
|
Current:
|
Federal
|
$
|
159
|
|
$
|
160
|
|
$
|
78
|
|
||||
|
|
Foreign
|
330
|
|
314
|
|
374
|
|
|||||||
|
|
State
|
22
|
|
35
|
|
9
|
|
|||||||
|
|
|
$
|
511
|
|
$
|
509
|
|
461
|
|
|||||
|
Deferred:
|
Federal
|
$
|
42
|
|
$
|
91
|
|
(83
|
)
|
|||||
|
|
Foreign
|
(53
|
)
|
(57
|
)
|
(40
|
)
|
|||||||
|
|
State
|
(13
|
)
|
(6
|
)
|
(14
|
)
|
|||||||
|
|
|
(24
|
)
|
28
|
|
(137
|
)
|
|||||||
|
|
|
$
|
487
|
|
|
$
|
537
|
|
|
$
|
324
|
|
||
The reconciliation of income taxes calculated at the U.S. federal tax statutory rate to our effective tax rate is set forth below:
|
|
2013
|
2012
|
2011
|
||||||||||||||||||
|
U.S. federal statutory rate
|
$
|
543
|
|
35.0
|
%
|
$
|
751
|
|
35.0
|
%
|
$
|
580
|
|
35.0
|
%
|
||||||
|
State income tax, net of federal tax benefit
|
3
|
|
0.2
|
|
4
|
|
0.2
|
|
2
|
|
0.1
|
|
|||||||||
|
Statutory rate differential attributable to foreign operations
|
(177
|
)
|
(11.4
|
)
|
(165
|
)
|
(7.7
|
)
|
(218
|
)
|
(13.1
|
)
|
|||||||||
|
Adjustments to reserves and prior years
|
49
|
|
3.1
|
|
(47
|
)
|
(2.2
|
)
|
24
|
|
1.4
|
|
|||||||||
|
Net benefit from LJS and A&W divestitures
|
—
|
|
—
|
|
—
|
|
—
|
|
(72
|
)
|
(4.3
|
)
|
|||||||||
|
Change in valuation allowances
|
23
|
|
1.5
|
|
14
|
|
0.6
|
|
22
|
|
1.3
|
|
|||||||||
|
Other, net
|
46
|
|
3.0
|
|
(20
|
)
|
(0.9
|
)
|
(14
|
)
|
(0.9
|
)
|
|||||||||
|
Effective income tax rate
|
$
|
487
|
|
31.4
|
%
|
$
|
537
|
|
25.0
|
%
|
$
|
324
|
|
19.5
|
%
|
||||||
Statutory rate differential attributable to foreign operations.
This item includes local taxes, withholding taxes, and shareholder-level taxes, net of foreign tax credits. The favorable impact is primarily attributable to a majority of our income being earned outside of the U.S. where tax rates are generally lower than the U.S. rate.
In 2012, this benefit was negatively impacted by the repatriation of current year foreign earnings to the U.S. as we recognized additional tax expense, resulting from the related effective tax rate being lower than the U.S. federal statutory rate.
In 2011, this benefit was positively impacted by the repatriation of current year foreign earnings as we recognized excess foreign tax credits, resulting from the related effective tax rate being higher than the U.S. federal statutory rate.
Adjustments to reserves and prior years.
This item includes: (1) changes in tax reserves, including interest thereon, established for potential exposure we may incur if a taxing authority takes a position on a matter contrary to our position; and (2) the effects of reconciling income tax amounts recorded in our Consolidated Statements of Income to amounts reflected on our tax returns, including any adjustments to the Consolidated Balance Sheets. The impact of certain effects or changes may offset items reflected in the
'Statutory rate differential attributable to foreign operations'
line.
In 2013, this item was negatively impacted by the provision recorded related to the continuing dispute with the IRS regarding the valuation of rights to intangibles transferred to certain foreign subsidiaries. See discussion below in the Internal Revenue Service Proposed Adjustments for details.
In 2012, this item was favorably impacted by the resolution of uncertain tax positions in certain foreign jurisdictions.
Net benefit from LJS and A&W divestitures.
This item includes a one-time
$117 million
tax benefit, including approximately
$8 million
U.S. state benefit, recognized on the LJS and A&W divestitures in 2011, partially offset by
$45 million
of valuation allowance, including approximately
$4 million
state expense, related to capital loss carryforwards recognized as a result of the divestitures. In addition, we recorded
$32 million
of tax benefits on
$86 million
of pre-tax losses and other costs, which resulted in
$104 million
of total net tax benefits related to the divestitures.
90
Change in valuation allowances.
This item relates to changes for deferred tax assets generated or utilized during the current year and changes in our judgment regarding the likelihood of using deferred tax assets that existed at the beginning of the year. The impact of certain changes may offset items reflected in the
'Statutory rate differential attributable to foreign operations'
line.
In 2013,
$23 million
of net tax expense was driven by
$32 million
for valuation allowances recorded against deferred tax assets generated during the current year, partially offset by a
$9 million
net tax benefit resulting from a change in judgment regarding the future use of certain deferred tax assets that existed at the beginning of the year.
In 2012,
$14 million
of net tax expense was driven by
$16 million
for valuation allowances recorded against deferred tax assets generated during the current year, partially offset by a
$2 million
net tax benefit resulting from a change in judgment regarding the future use of certain deferred tax assets that existed at the beginning of the year.
In 2011,
$22 million
of net tax expense was driven by
$15 million
for valuation allowances recorded against deferred tax assets generated during the current year and
$7 million
of tax expense resulting from a change in judgment regarding the future use of certain foreign deferred tax assets that existed at the beginning of the year. These amounts exclude
$45 million
in valuation allowance additions related to capital losses recognized as a result of the LJS and A&W divestitures, which are presented within
Net Benefit from LJS and A&W divestitures
.
Other.
This item primarily includes the impact of permanent differences related to current year earnings as well as U.S. tax credits and deductions.
In 2013, this item was negatively impacted by the
$222 million
non-cash impairment of Little Sheep goodwill, which resulted in no related tax benefit.
In 2012, this item was positively impacted by a one-time pre-tax gain of
$74 million
, with no related income tax expense, recognized on our acquisition of additional interest in, and consolidation of Little Sheep.
The details of
2013
and
2012
deferred tax assets (liabilities) are set forth below:
|
|
2013
|
2012
|
||||||
|
Operating losses and tax credit carryforwards
|
$
|
310
|
|
$
|
337
|
|
||
|
Employee benefits
|
182
|
|
251
|
|
||||
|
Share-based compensation
|
118
|
|
108
|
|
||||
|
Self-insured casualty claims
|
48
|
|
50
|
|
||||
|
Lease-related liabilities
|
120
|
|
115
|
|
||||
|
Various liabilities
|
88
|
|
82
|
|
||||
|
Property, plant and equipment
|
42
|
|
39
|
|
||||
|
Deferred income and other
|
58
|
|
57
|
|
||||
|
Gross deferred tax assets
|
966
|
|
1,039
|
|
||||
|
Deferred tax asset valuation allowances
|
(203
|
)
|
(200
|
)
|
||||
|
Net deferred tax assets
|
$
|
763
|
|
$
|
839
|
|
||
|
Intangible assets, including goodwill
|
$
|
(233
|
)
|
$
|
(256
|
)
|
||
|
Property, plant and equipment
|
(93
|
)
|
(95
|
)
|
||||
|
Other
|
(55
|
)
|
(48
|
)
|
||||
|
Gross deferred tax liabilities
|
$
|
(381
|
)
|
$
|
(399
|
)
|
||
|
Net deferred tax assets (liabilities)
|
$
|
382
|
|
|
$
|
440
|
|
|
91
|
Reported in Consolidated Balance Sheets as:
|
|
|
||||||
|
Deferred income taxes – current
|
$
|
123
|
|
|
$
|
127
|
|
|
|
Deferred income taxes – long-term
|
399
|
|
|
467
|
|
|||
|
Accounts payable and other current liabilities
|
(2
|
)
|
(5
|
)
|
||||
|
Other liabilities and deferred credits
|
(138
|
)
|
(149
|
)
|
||||
|
|
$
|
382
|
|
|
$
|
440
|
|
|
We have investments in foreign subsidiaries where the carrying values for financial reporting exceed the tax basis. We have not provided deferred tax on the portion of the excess that we believe is essentially permanent in duration. This amount may become taxable upon an actual or deemed repatriation of assets from the subsidiaries or a sale or liquidation of the subsidiaries. We estimate that our total temporary difference upon which we have not provided deferred tax is approximately
$2.6 billion
at
December 28, 2013
. A determination of the deferred tax liability on this amount is not practicable.
At
December 28, 2013
, the Company has foreign operating and capital loss carryforwards of
$0.6 billion
and U.S. state operating loss, capital loss and tax credit carryforwards of
$1.2 billion
and U.S. federal capital loss and tax credit carryforwards of
$0.2 billion
. These losses are being carried forward in jurisdictions where we are permitted to use tax losses from prior periods to reduce future taxable income and will expire as follows:
|
|
Year of Expiration
|
|
||||||||||||||||||
|
|
2014
|
2015-2018
|
2019-2033
|
Indefinitely
|
Total
|
|||||||||||||||
|
Foreign
|
$
|
38
|
|
$
|
132
|
|
$
|
91
|
|
$
|
325
|
|
$
|
586
|
|
|||||
|
U.S. state
|
16
|
|
105
|
|
1,040
|
|
—
|
|
1,161
|
|
||||||||||
|
U.S. federal
|
—
|
|
90
|
|
64
|
|
—
|
|
154
|
|
||||||||||
|
|
$
|
54
|
|
$
|
327
|
|
$
|
1,195
|
|
$
|
325
|
|
$
|
1,901
|
|
|||||
We recognize the benefit of positions taken or expected to be taken in tax returns in the financial statements when it is more likely than not that the position would be sustained upon examination by tax authorities. A recognized tax position is measured at the largest amount of benefit that is greater than
fifty percent
likely of being realized upon settlement.
The Company had
$243 million
and
$309 million
of unrecognized tax benefits at
December 28, 2013
and
December 29, 2012
, respectively,
$170 million
and
$184 million
of which, if recognized, would impact the effective income tax rate. A reconciliation of the beginning and ending amount of unrecognized tax benefits follows:
|
|
2013
|
2012
|
||||||
|
Beginning of Year
|
$
|
309
|
|
$
|
348
|
|
||
|
Additions on tax positions - current year
|
19
|
|
50
|
|
||||
|
Additions for tax positions - prior years
|
55
|
|
23
|
|
||||
|
Reductions for tax positions - prior years
|
(102
|
)
|
(90
|
)
|
||||
|
Reductions for settlements
|
(23
|
)
|
(6
|
)
|
||||
|
Reductions due to statute expiration
|
(16
|
)
|
(16
|
)
|
||||
|
Foreign currency translation adjustment
|
1
|
|
—
|
|
||||
|
End of Year
|
$
|
243
|
|
$
|
309
|
|
||
The Company believes it is reasonably possible its unrecognized tax benefits may decrease by approximately
$26 million
in the next
twelve
months, including approximately
$20 million
which, if recognized upon audit settlement or statute expiration, would affect the
2014
effective tax rate. Each of these positions is individually insignificant.
The Company’s income tax returns are subject to examination in the U.S. federal jurisdiction and numerous foreign jurisdictions. The following table summarizes our major jurisdictions and the tax years that are either currently under audit or remain open and subject to examination:
92
|
Jurisdiction
|
|
Open Tax Years
|
|
U.S. Federal
|
|
2004 – 2013
|
|
China
|
|
2010 – 2013
|
|
United Kingdom
|
|
2010 – 2013
|
|
Mexico
|
|
2006 – 2013
|
|
Australia
|
|
2009 – 2013
|
In addition, the Company is subject to various U.S. state income tax examinations, for which, in the aggregate, we had significant unrecognized tax benefits at
December 28, 2013
, each of which is individually insignificant.
The accrued interest and penalties related to income taxes at
December 28, 2013
and
December 29, 2012
are set forth below:
|
|
2013
|
2012
|
||||||
|
Accrued interest and penalties
|
$
|
64
|
|
$
|
50
|
|
||
During
2013
,
2012
and
2011
, a net expense of
$18 million
, net benefit of
$3 million
and net benefit of
$2 million
, respectively, for interest and penalties was recognized in our Consolidated Statements of Income as components of its income tax provision.
Internal Revenue Service Proposed Adjustments
On June 23, 2010, the Company received a Revenue Agent Report (RAR) from the Internal Revenue Service (the "IRS") relating to its examination of our U.S. federal income tax returns for fiscal years 2004 through 2006. The IRS has proposed an adjustment to increase the taxable value of rights to intangibles used outside the U.S. that YUM transferred to certain of its foreign subsidiaries. The proposed adjustment would result in approximately
$700 million
of additional taxes plus net interest to date of approximately
$255 million
for fiscal years 2004-2006. On January 9, 2013, the Company received an RAR from the IRS for fiscal years 2007 and 2008. As expected, the IRS proposed an adjustment similar to their proposal for 2004-2006 that would result in approximately
$270 million
of additional taxes plus net interest to date of approximately
$40 million
for fiscal years 2007 and 2008. Furthermore, the Company expects the IRS to make similar claims for years subsequent to fiscal 2008. The potential additional taxes for 2009 through 2013, computed on a similar basis to the 2004-2008 additional taxes, would be approximately
$140 million
plus net interest to date of approximately
$10 million
.
We believe we have properly reported our taxable income and paid taxes consistent with all applicable laws and intend to vigorously defend our position, including through litigation, if we are unable to settle with the IRS through administrative proceedings. As the final resolution of the proposed adjustments remains uncertain, there can be no assurance that payments due upon final resolution of this issue will not exceed our currently recorded reserve and such payments could have a material adverse effect on our financial position. Additionally, if increases to our reserves are deemed necessary due to future developments related to this issue, such increases could have a material adverse effect on our results of operations as they are recorded. The Company does not expect resolution of this matter within twelve months and cannot predict with certainty the timing of such resolution.
We are principally engaged in developing, operating, franchising and licensing the worldwide KFC, Pizza Hut and Taco Bell concepts. KFC, Pizza Hut and Taco Bell operate in
118
,
91
, and
21
countries and territories, respectively. Our five largest international markets based on Operating Profit in
2013
are China, Asia Franchise, United Kingdom, Australia and Latin America Franchise.
We identify our operating segments based on management responsibility. The China Division includes mainland China and the India Division includes India, Bangladesh, Mauritius, Nepal and Sri Lanka. YRI includes the remainder of our international operations. We consider our KFC, Pizza Hut and Taco Bell operating segments in the U.S. to be similar and therefore have aggregated them into a single reportable operating segment. Our U.S. and YRI segment results also include the operating results of our LJS and A&W businesses prior to our disposal of those businesses in December 2011.
93
|
|
Revenues
|
|||||||||||
|
|
2013
|
2012
|
2011
|
|||||||||
|
China
|
$
|
6,905
|
|
|
$
|
6,898
|
|
|
$
|
5,566
|
|
|
|
YRI
|
3,099
|
|
|
3,281
|
|
|
3,192
|
|
||||
|
U.S.
|
2,953
|
|
|
3,352
|
|
|
3,786
|
|
||||
|
India
|
127
|
|
102
|
|
82
|
|
||||||
|
|
$
|
13,084
|
|
|
$
|
13,633
|
|
|
$
|
12,626
|
|
|
|
|
Operating Profit; Interest Expense, Net; and
Income Before Income Taxes
|
|||||||||||
|
|
2013
|
2012
|
2011
|
|||||||||
|
China
(b)
|
$
|
777
|
|
|
$
|
1,015
|
|
|
$
|
908
|
|
|
|
YRI
|
760
|
|
|
715
|
|
|
673
|
|
||||
|
U.S.
|
684
|
|
|
666
|
|
|
589
|
|
||||
|
India
|
(15
|
)
|
|
(1
|
)
|
|
—
|
|
||||
|
Unallocated Occupancy and other
(a)(c)
|
—
|
|
|
16
|
|
|
14
|
|
||||
|
Unallocated and corporate expenses
(a)(d)
|
(207
|
)
|
|
(271
|
)
|
|
(223
|
)
|
||||
|
Unallocated Closures and impairment expense
(a)(e)
|
(295
|
)
|
|
—
|
|
|
(80
|
)
|
||||
|
Unallocated Other income (expense)
(a)(f)
|
(6
|
)
|
|
76
|
|
|
6
|
|
||||
|
Unallocated Refranchising gain (loss)
(a)(g)
|
100
|
|
|
78
|
|
|
(72
|
)
|
||||
|
Operating Profit
|
1,798
|
|
|
2,294
|
|
|
1,815
|
|
||||
|
Interest expense, net
(h)
|
(247
|
)
|
|
(149
|
)
|
|
(156
|
)
|
||||
|
Income Before Income Taxes
|
$
|
1,551
|
|
|
$
|
2,145
|
|
|
$
|
1,659
|
|
|
|
|
Depreciation and Amortization
|
|||||||||||
|
|
2013
|
2012
|
2011
|
|||||||||
|
China
|
$
|
394
|
|
$
|
337
|
|
$
|
258
|
|
|||
|
YRI
|
175
|
|
167
|
|
183
|
|
||||||
|
U.S.
|
135
|
|
147
|
|
179
|
|
||||||
|
India
|
9
|
|
6
|
|
5
|
|
||||||
|
Corporate
(c)
|
8
|
|
8
|
|
12
|
|
||||||
|
|
$
|
721
|
|
$
|
665
|
|
$
|
637
|
|
|||
|
|
Capital Spending
|
|||||||||||
|
|
2013
|
2012
|
2011
|
|||||||||
|
China
|
$
|
568
|
|
$
|
655
|
|
$
|
405
|
|
|||
|
YRI
|
289
|
|
251
|
|
240
|
|
||||||
|
U.S.
|
157
|
|
173
|
|
256
|
|
||||||
|
India
|
31
|
|
18
|
|
16
|
|
||||||
|
Corporate
|
4
|
|
2
|
|
23
|
|
||||||
|
|
$
|
1,049
|
|
$
|
1,099
|
|
$
|
940
|
|
|||
94
|
|
Identifiable Assets
|
|||||||||||
|
|
2013
|
2012
|
2011
|
|||||||||
|
China
(i)
|
$
|
3,720
|
|
$
|
3,752
|
|
$
|
2,527
|
|
|||
|
YRI
|
2,618
|
|
2,663
|
|
2,847
|
|
||||||
|
U.S.
|
1,705
|
|
1,844
|
|
2,070
|
|
||||||
|
India
|
99
|
|
68
|
|
52
|
|
||||||
|
Corporate
(j)
|
553
|
|
686
|
|
1,338
|
|
||||||
|
|
$
|
8,695
|
|
$
|
9,013
|
|
$
|
8,834
|
|
|||
|
|
Long-Lived Assets
(k)
|
|||||||||||
|
|
2013
|
2012
|
2011
|
|||||||||
|
China
|
$
|
2,667
|
|
$
|
2,779
|
|
$
|
1,546
|
|
|||
|
YRI
|
1,732
|
|
1,561
|
|
1,600
|
|
||||||
|
U.S.
|
1,489
|
|
1,555
|
|
1,805
|
|
||||||
|
India
|
66
|
|
47
|
|
35
|
|
||||||
|
Corporate
|
32
|
|
32
|
|
36
|
|
||||||
|
|
$
|
5,986
|
|
$
|
5,974
|
|
$
|
5,022
|
|
|||
|
(a)
|
Amounts have not been allocated to any segment for performance reporting purposes.
|
|
(b)
|
Includes equity income from investments in unconsolidated affiliates of
$26 million
,
$47 million
and
$47 million
in
2013
,
2012
and
2011
, respectively, for China.
|
|
(c)
|
2012
and 2011 include depreciation reductions arising from the impairments of Pizza Hut UK restaurants we sold in 2012 of
$13 million
and
$3 million
, respectively.
2012
and
2011
include depreciation reductions arising from the impairment of KFC restaurants we offered to sell of
$3 million
and
$10 million
, respectively. See Note 4.
|
|
(d)
|
2013
and
2012
include pension settlement charges of
$22 million
and
$87 million
, respectively.
2013
,
2012
and
2011
include approximately
$5 million
,
$5 million
and
$21 million
, respectively, of charges relating to U.S. G&A productivity initiatives and realignment of resources. See Note 4.
|
|
(e)
|
2013
represents impairment loss related to Little Sheep.
2011
represents net losses resulting from the LJS and A&W divestitures. See Note 4.
|
|
(f)
|
2012 includes gain upon acquisition of Little Sheep of
$74 million
. See Note 4.
|
|
(g)
|
See Note 4 for further discussion of Refranchising gain (loss).
|
|
(h)
|
Includes
$118 million
of premiums and other costs related to the extinguishment of debt. See Losses Related to the Extinguishment of Debt section of Note 4.
|
|
(i)
|
China includes investments in
4
unconsolidated affiliates totaling
$53 million
,
$72 million
and
$167 million
for
2013
,
2012
and
2011
, respectively.
|
|
(j)
|
Primarily includes cash, deferred tax assets and property, plant and equipment, net, related to our office facilities. 2011 includes
$300 million
of restricted cash related to the 2012 Little Sheep acquisition.
|
|
(k)
|
Includes property, plant and equipment, net, goodwill, and intangible assets, net.
|
See Note 4 for additional operating segment disclosures related to impairment and store closure (income) costs.
95
Lease Guarantees
As a result of (a) assigning our interest in obligations under real estate leases as a condition to the refranchising of certain Company restaurants; (b) contributing certain Company restaurants to unconsolidated affiliates; and (c) guaranteeing certain other leases, we are frequently contingently liable on lease agreements. These leases have varying terms, the latest of which expires in
2066
. As of
December 28, 2013
, the potential amount of undiscounted payments we could be required to make in the event of non-payment by the primary lessee was approximately
$725 million
. The present value of these potential payments discounted at our pre-tax cost of debt at
December 28, 2013
was approximately
$625 million
. Our franchisees are the primary lessees under the vast majority of these leases. We generally have cross-default provisions with these franchisees that would put them in default of their franchise agreement in the event of non-payment under the lease. We believe these cross-default provisions significantly reduce the risk that we will be required to make payments under these leases. Accordingly, the liability recorded for our probable exposure under such leases at
December 28, 2013
and
December 29, 2012
was not material.
Franchise Loan Pool and Equipment Guarantees
We have agreed to provide financial support, if required, to a variable interest entity that operates a franchisee lending program used primarily to assist franchisees in the development of new restaurants or the upgrade of existing restaurants and, to a lesser extent, in connection with the Company’s refranchising programs in the U.S. We have determined that we are not required to consolidate this entity as we share the power to direct this entity’s lending activity with other parties. We have provided guarantees of approximately
$35 million
in support of the franchisee loan program at
December 28, 2013
. The total loans outstanding under the loan pool were
$38 million
at
December 28, 2013
with an additional
$42 million
available for lending at
December 28, 2013
.
In addition to the guarantees described above, YUM has provided guarantees of up to approximately
$100 million
on behalf of franchisees for several financing programs related to specific initiatives. The total loans outstanding under these financing programs were approximately
$44 million
at
December 28, 2013
.
Unconsolidated Affiliates Guarantees
From time to time we have guaranteed certain lines of credit and loans of unconsolidated affiliates. At
December 28, 2013
there are no guarantees outstanding for unconsolidated affiliates. Our unconsolidated affiliates had total revenues of approximately
$1.1 billion
for the year ended
December 28, 2013
and assets and debt of approximately
$365 million
and
$85 million
, respectively, at
December 28, 2013
.
Insurance Programs
We are self-insured for a substantial portion of our current and prior years’ coverage including property and casualty losses. To mitigate the cost of our exposures for certain property and casualty losses, we self-insure the risks of loss up to defined maximum per occurrence retentions on a line-by-line basis. The Company then purchases insurance coverage, up to a certain limit, for losses that exceed the self-insurance per occurrence retention. The insurers’ maximum aggregate loss limits are significantly above our actuarially determined probable losses; therefore, we believe the likelihood of losses exceeding the insurers’ maximum aggregate loss limits is remote.
The following table summarizes the
2013
and
2012
activity related to our net self-insured property and casualty reserves as of
December 28, 2013
.
|
|
Beginning Balance
|
Expense
|
Payments
|
Ending Balance
|
||||||||||
|
2013 Activity
|
$
|
142
|
|
47
|
|
(61
|
)
|
$
|
128
|
|
||||
|
2012 Activity
|
$
|
140
|
|
58
|
|
(56
|
)
|
$
|
142
|
|
||||
In the U.S. and in certain other countries, we are also self-insured for healthcare claims and long-term disability for eligible participating employees subject to certain deductibles and limitations. We have accounted for our retained liabilities for property and casualty losses, healthcare and long-term disability claims, including reported and incurred but not reported claims, based on information provided by independent actuaries.
96
Due to the inherent volatility of actuarially determined property and casualty loss estimates, it is reasonably possible that we could experience changes in estimated losses which could be material to our growth in quarterly and annual Net income. We believe that we have recorded reserves for property and casualty losses at a level which has substantially mitigated the potential negative impact of adverse developments and/or volatility.
Legal Proceedings
We are subject to various claims and contingencies related to lawsuits, real estate, environmental and other matters arising in the normal course of business. An accrual is recorded with respect to claims or contingencies for which a loss is determined to be probable and reasonably estimable.
In early 2013,
four
putative class action complaints were filed in the U.S. District Court for the Central District of California against the Company and certain executive officers alleging claims under sections 10(b) and 20(a) of the Securities Exchange Act of 1934. Plaintiffs alleged that defendants made false and misleading statements concerning the Company’s current and future business and financial condition. The
four
complaints were subsequently consolidated and transferred to the U.S. District Court for the Western District of Kentucky. On August 5, 2013, lead plaintiff, Frankfurt Trust Investment GmbH, filed a Consolidated Class Action Complaint (“Amended Complaint”) on behalf of a putative class of all persons who purchased the Company’s stock between February 6, 2012 and February 4, 2013 (the “Class Period”). The Amended Complaint no longer includes allegations relating to misstatements regarding the Company’s business or financial condition and instead alleges that, during the Class Period, defendants purportedly omitted information about the Company’s supply chain in China, thereby inflating the prices at which the Company’s securities traded. On October 4, 2013, the Company and individual defendants filed a motion to dismiss the Amended Complaint. Briefing on the motion to dismiss is now complete. The Company denies liability and intends to vigorously defend against all claims in the Amended Complaint. A reasonable estimate of the amount of any possible loss or range of loss cannot be made at this time.
On January 24, 2013, Bert Bauman, a purported shareholder of the Company, submitted a letter demanding that the Board of Directors initiate an investigation of alleged breaches of fiduciary duties by directors, officers and employees of the Company. The breaches of fiduciary duties are alleged to have arisen primarily as a result of the failure to implement proper controls in connection with the Company’s purchases of poultry from suppliers to the Company’s China operations. Subsequently, similar demand letters by other purported shareholders were submitted. Those letters were referred to a special committee of the Board of Directors (the “Special Committee”) for consideration. The Special Committee, upon conclusion of an independent inquiry of the matters described in the letters, unanimously determined that it is not in the best interests of the Company to pursue the claims described in the letters and, accordingly, rejected each shareholder’s demand.
On May 9, 2013, Mr. Bauman filed a putative derivative action in Jefferson Circuit Court, Commonwealth of Kentucky against certain current and former officers and directors of the Company asserting breach of fiduciary duty, waste of corporate assets and unjust enrichment in connection with an alleged failure to implement proper controls in the Company’s purchases of poultry from suppliers to the Company’s China operations and with an alleged scheme to mislead investors about the Company’s growth prospects in China. By agreement of the parties, the matter is temporarily stayed pending the outcome of the motion to dismiss the securities class action. A reasonable estimate of the amount of any possible loss or range of loss cannot be made at this time.
On February 14, 2013, Jennifer Zona, another purported shareholder of the Company, submitted a demand letter similar to the demand letters described above. On May 21, 2013, Ms. Zona filed a putative derivative action in the U.S. District Court for the Western District of Kentucky against certain officers and directors of the Company asserting claims similar to those asserted by Mr. Bauman. The case was subsequently reassigned to the same judge that the securities class action is before. On October 14, 2013, the Company filed a motion to dismiss on the basis of the Special Committee’s findings.
By agreement of the parties, the matter is temporarily stayed pending the outcome of the motion to dismiss the securities class action. A reasonable estimate of the amount of any possible loss or range of loss cannot be made at this time.
On May 17, 2013, Sandra Wollman, another purported shareholder of the Company, submitted a demand letter similar to the demand letters described above. On December 9, 2013, Ms. Wollman filed a putative derivative action in the U.S. District Court for the Western District of Kentucky against certain current and former officers and directors of the Company asserting claims similar to those asserted by Mr. Bauman and Ms. Zona. By agreement of the parties, the matter was consolidated with the
Zona
action and is temporarily stayed pending the outcome of the motion to dismiss the securities class action. A reasonable estimate of the amount of any possible loss or range of loss cannot be made at this time.
Taco Bell was named as a defendant in a number of putative class action suits filed in 2007, 2008, 2009 and 2010 alleging violations of California labor laws including unpaid overtime, failure to timely pay wages on termination, failure to pay accrued vacation wages, failure to pay minimum wage, denial of meal and rest breaks, improper wage statements, unpaid business expenses, wrongful
97
termination, discrimination, conversion and unfair or unlawful business practices in violation of California Business & Professions Code §17200. Some plaintiffs also seek penalties for alleged violations of California’s Labor Code under California’s Private Attorneys General Act as well as statutory “waiting time” penalties and allege violations of California’s Unfair Business Practices Act. Plaintiffs seek to represent a California state-wide class of hourly employees.
These matters were consolidated, and the consolidated case is styled
In Re Taco Bell Wage and Hour Actions
. The
In Re Taco Bell Wage and Hour Actions
plaintiffs filed a consolidated complaint in June 2009, and in March 2010 the court approved the parties’ stipulation to dismiss the Company from the action. Plaintiffs filed their motion for class certification on the vacation and final pay claims in December 2010, and on September 26, 2011 the court issued its order denying the certification of the vacation and final pay claims. Plaintiffs then sought to certify
four
separate meal and rest break classes. On January 2, 2013, the District Court rejected three of the proposed classes but granted certification with respect to the late meal break class. The parties thereafter agreed on a list of putative class members, and the class notice and opportunity to opt out of the litigation were mailed on January 21, 2014.
Taco Bell denies liability and intends to vigorously defend against all claims in this lawsuit. We have provided for a reasonable estimate of the possible loss relating to this lawsuit. However, in view of the inherent uncertainties of litigation, there can be no assurance that this lawsuit will not result in losses in excess of those currently provided for in our Consolidated Financial Statements. A reasonable estimate of the amount of any possible loss or range of loss in excess of that currently provided for in our Consolidated Financial Statements cannot be made at this time.
On May 16, 2013, a putative class action styled
Bernardina Rodriguez v. Taco Bell Corp.
was filed in California Superior Court. The plaintiff seeks to represent a class of current and former California hourly restaurant employees alleging various violations of California labor laws including failure to provide meal and rest periods, failure to pay hourly wages, failure to provide accurate written wage statements, failure to timely pay all final wages, and unfair or unlawful business practices in violation of California Business & Professions Code §17200. This case appears to be duplicative of the
In Re Taco Bell Wage and Hour Actions
case described above. Taco Bell removed the case to federal court and, on June 25, 2013, plaintiff filed a first amended complaint to include a claim seeking penalties for alleged violations of California’s Labor Code under California’s Private Attorneys General Act. Taco Bell's motion to dismiss or stay the action in light of the
In Re Taco Bell Wage and Hour Actions
case was denied on October 30, 2013.
Taco Bell denies liability and intends to vigorously defend against all claims in this lawsuit. A reasonable estimate of the amount of any possible loss or range of loss cannot be made at this time.
In December 2002, Taco Bell was named as the defendant in a class action lawsuit filed in the U.S. District Court for the Northern District of California styled
Moeller, et al. v. Taco Bell Corp.
In August 2003, plaintiffs filed an amended complaint alleging, among other things, that Taco Bell has discriminated against the class of people who use wheelchairs or scooters for mobility by failing to make its approximately
200
Company-owned restaurants in California accessible to the class. Plaintiffs contend that queue rails and other architectural and structural elements of the Taco Bell restaurants relating to the path of travel and use of the facilities by persons with mobility-related disabilities do not comply with the U.S. Americans with Disabilities Act (the “ADA”), the Unruh Civil Rights Act (the “Unruh Act”), and the California Disabled Persons Act (the “CDPA”). Plaintiffs have requested: (a) an injunction from the District Court ordering Taco Bell to comply with the ADA and its implementing regulations; (b) that the District Court declare Taco Bell in violation of the ADA, the Unruh Act, and the CDPA; and (c) monetary relief under the Unruh Act or CDPA. Plaintiffs, on behalf of the class, are seeking the minimum statutory damages per offense of either
$4,000
under the Unruh Act or
$1,000
under the CDPA for each aggrieved member of the class. Plaintiffs contend that there may be in excess of
100,000
individuals in the class. In February 2004, the District Court granted plaintiffs’ motion for class certification. The class included claims for injunctive relief and minimum statutory damages.
In May 2007, a hearing was held on plaintiffs’ Motion for Partial Summary Judgment seeking judicial declaration that Taco Bell was in violation of accessibility laws as to
three
specific issues: indoor seating, queue rails and door opening force. In August 2007, the court granted plaintiffs’ motion in part with regard to dining room seating. In addition, the court granted plaintiffs’ motion in part with regard to door opening force at some restaurants (but not all) and denied the motion with regard to queue lines.
In December 2009, the court denied Taco Bell’s motion for summary judgment on the ADA claims and ordered plaintiffs to select
one
restaurant to be the subject of a trial. The trial for the exemplar restaurant began on June 6, 2011, and on October 5, 2011 the court issued Findings of Fact and Conclusions of Law ruling that plaintiffs established that classwide injunctive relief was warranted with regard to maintaining compliance as to corporate Taco Bell restaurants in California. The court declined to order injunctive relief at the time, however, citing the pendency of Taco Bell’s motions to decertify both the injunctive and damages class. The court also found that
twelve
specific items at the exemplar store were once out of compliance with applicable state and/or federal accessibility standards.
98
Taco Bell filed a motion to decertify the class in August 2011, and in July 2012, the court granted Taco Bell’s motion to decertify the previously certified state law damages class but denied Taco Bell’s motion to decertify the ADA injunctive relief class. In September 2012, the court set a discovery and briefing schedule concerning the trials of the
four
individual plaintiffs’ state law damages claims, which the court stated will be tried before holding further proceedings regarding the possible issuance of an injunction. The court subsequently issued an order modifying its October 2011 Findings of Facts and Conclusions of Law deleting the statement that an injunction was warranted. Plaintiffs appealed that order, and on June 24, 2013 the Ninth Circuit Court of Appeals dismissed plaintiff’s appeal. On January 15, 2014, plaintiffs filed a motion seeking issuance of a classwide injunction, and Taco Bell filed a motion to dismiss both the individual and class ADA claims based on a lack of jurisdiction.
Taco Bell denies liability and intends to vigorously defend against all claims in this lawsuit. Taco Bell has taken steps to address potential architectural and structural compliance issues at the restaurants in accordance with applicable state and federal disability access laws. The costs associated with addressing these issues have not significantly impacted our results of operations. We have provided for a reasonable estimate of the possible loss relating to this lawsuit. However, in view of the inherent uncertainties of litigation, there can be no assurance that this lawsuit will not result in losses in excess of those currently provided for in our Consolidated Financial Statements. A reasonable estimate of the amount of any possible loss or range of loss in excess of that currently provided for in our Consolidated Financial Statements cannot be made at this time.
In July 2009, a putative class action styled
Mark Smith v. Pizza Hut, Inc.
was filed in the U.S. District Court for the District of Colorado. The complaint alleged that Pizza Hut did not properly reimburse its delivery drivers for various automobile costs, uniforms costs, and other job-related expenses and seeks to represent a class of delivery drivers nationwide under the Fair Labor Standards Act (FLSA) and Colorado state law. In January 2010, plaintiffs filed a motion for conditional certification of a nationwide class of current and former Pizza Hut, Inc. delivery drivers. However, in March 2010, the court granted Pizza Hut’s pending motion to dismiss for failure to state a claim, with leave to amend. Plaintiffs subsequently filed an amended complaint, which dropped the uniform claims but, in addition to the federal FLSA claims, asserted state-law class action claims under the laws of
sixteen
different states. Pizza Hut filed a motion to dismiss the amended complaint, and plaintiffs sought leave to amend their complaint a second time. In August 2010, the court granted plaintiffs’ motion to amend. Pizza Hut filed another motion to dismiss the Second Amended Complaint. In July 2011, the Court granted Pizza Hut’s motion with respect to plaintiffs’ state law claims but allowed the FLSA claims to go forward. Plaintiffs filed their Motion for Conditional Certification in August 2011, and the Court granted plaintiffs’ motion in April 2012. The opt-in period closed on August 23, 2012, and approximately
6,000
individuals opted in.
Pizza Hut denies liability and intends to vigorously defend against all claims in this lawsuit. A reasonable estimate of the amount of any possible loss or range of loss cannot be made at this time.
We are engaged in various other legal proceedings and have certain unresolved claims pending, the ultimate liability for which, if any, cannot be determined at this time. However, based upon consultation with legal counsel, we are of the opinion that such proceedings and claims are not expected to have a material adverse effect, individually or in the aggregate, on our Consolidated Financial Statements.
99
N
ote 20
–
Selected Quarterly Financial Data (Unaudited
)
|
|
2013
|
|||||||||||||||||||
|
|
First
Quarter
|
Second
Quarter
|
Third
Quarter
|
Fourth
Quarter
|
Total
|
|||||||||||||||
|
Revenues:
|
|
|
|
|
|
|||||||||||||||
|
Company sales
|
$
|
2,099
|
|
$
|
2,474
|
|
$
|
3,021
|
|
$
|
3,590
|
|
$
|
11,184
|
|
|||||
|
Franchise and license fees and income
|
436
|
|
430
|
|
445
|
|
589
|
|
1,900
|
|
||||||||||
|
Total revenues
|
2,535
|
|
2,904
|
|
3,466
|
|
4,179
|
|
13,084
|
|
||||||||||
|
Restaurant profit
|
333
|
|
310
|
|
531
|
|
509
|
|
1,683
|
|
||||||||||
|
Operating Profit
(a)
|
487
|
|
390
|
|
350
|
|
571
|
|
1,798
|
|
||||||||||
|
Net Income – YUM! Brands, Inc.
(c)
|
337
|
|
281
|
|
152
|
|
321
|
|
1,091
|
|
||||||||||
|
Basic earnings per common share
|
0.74
|
|
0.62
|
|
0.34
|
|
0.72
|
|
2.41
|
|
||||||||||
|
Diluted earnings per common share
|
0.72
|
|
0.61
|
|
0.33
|
|
0.70
|
|
2.36
|
|
||||||||||
|
Dividends declared per common share
|
0.335
|
|
0.335
|
|
—
|
|
0.74
|
|
1.41
|
|
||||||||||
|
|
2012
|
|||||||||||||||||||
|
|
First
Quarter
|
Second
Quarter
|
Third
Quarter
|
Fourth
Quarter
|
Total
|
|||||||||||||||
|
Revenues:
|
|
|
|
|
|
|||||||||||||||
|
Company sales
|
$
|
2,344
|
|
$
|
2,762
|
|
$
|
3,142
|
|
$
|
3,585
|
|
$
|
11,833
|
|
|||||
|
Franchise and license fees and income
|
399
|
|
406
|
|
427
|
|
568
|
|
1,800
|
|
||||||||||
|
Total revenues
|
2,743
|
|
3,168
|
|
3,569
|
|
4,153
|
|
13,633
|
|
||||||||||
|
Restaurant profit
|
440
|
|
423
|
|
599
|
|
519
|
|
1,981
|
|
||||||||||
|
Operating Profit
(b)
|
645
|
|
473
|
|
671
|
|
505
|
|
2,294
|
|
||||||||||
|
Net Income – YUM! Brands, Inc.
|
458
|
|
331
|
|
471
|
|
337
|
|
1,597
|
|
||||||||||
|
Basic earnings per common share
|
0.99
|
|
0.71
|
|
1.02
|
|
0.74
|
|
3.46
|
|
||||||||||
|
Diluted earnings per common share
|
0.96
|
|
0.69
|
|
1.00
|
|
0.72
|
|
3.38
|
|
||||||||||
|
Dividends declared per common share
|
0.285
|
|
0.285
|
|
—
|
|
0.67
|
|
1.24
|
|
||||||||||
|
(a)
|
Includes a non-cash charge of
$295 million
in the third quarter related primarily to the impairment of Little Sheep intangible assets and net U.S. refranchising gains of
$17 million
,
$28 million
,
$37 million
and
$9 million
in the first, second, third and fourth quarters, respectively. See Note 4 for further discussion.
|
|
(b)
|
Includes a non-cash gain recognized upon acquisition of Little Sheep of
$74 million
in the first quarter, refranchising losses associated with the Pizza Hut UK dine-in business of
$24 million
and
$46 million
in the first and fourth quarters, respectively, net U.S. refranchising gains of
$45 million
and
$69 million
in the first and fourth quarters, respectively and a pension settlement charge of
$84 million
in the fourth quarter. See Note 4 for further discussion.
|
|
(c)
|
Includes an after-tax charge of
$75 million
in the fourth quarter related to the repurchase of Senior Unsecured Notes. See Note 4 for further discussion.
|
100
Management’s Responsibility for Financial Statements
To Our Shareholders:
We are responsible for the preparation, integrity and fair presentation of the Consolidated Financial Statements, related notes and other information included in this annual report. The financial statements were prepared in accordance with accounting principles generally accepted in the United States of America and include certain amounts based upon our estimates and assumptions, as required. Other financial information presented in the annual report is derived from the financial statements.
We maintain a system of internal control over financial reporting, designed to provide reasonable assurance as to the reliability of the financial statements, as well as to safeguard assets from unauthorized use or disposition. The system is supported by formal policies and procedures, including an active Code of Conduct program intended to ensure employees adhere to the highest standards of personal and professional integrity. We have conducted an evaluation of the effectiveness of our internal control over financial reporting based on the framework in
Internal Control – Integrated Framework
(1992)
issued by the Committee of Sponsoring Organizations of the Treadway Commission. Based on our evaluation, we concluded that our internal control over financial reporting was effective as of
December 28, 2013
. Our internal audit function monitors and reports on the adequacy of and compliance with the internal control system, and appropriate actions are taken to address significant control deficiencies and other opportunities for improving the system as they are identified.
The Consolidated Financial Statements have been audited and reported on by our independent auditors, KPMG LLP, who were given free access to all financial records and related data, including minutes of the meetings of the Board of Directors and Committees of the Board. We believe that management representations made to the independent auditors were valid and appropriate. Additionally, the effectiveness of our internal control over financial reporting has been audited and reported on by KPMG LLP.
The Audit Committee of the Board of Directors, which is composed solely of outside directors, provides oversight to our financial reporting process and our controls to safeguard assets through periodic meetings with our independent auditors, internal auditors and management. Both our independent auditors and internal auditors have free access to the Audit Committee.
Although no cost-effective internal control system will preclude all errors and irregularities, we believe our controls as of
December 28, 2013
provide reasonable assurance that our assets are reasonably safeguarded.
Patrick J. Grismer
Chief Financial Officer
101
|
Item 9.
|
Changes In and Disagreements with Accountants on Accounting and Financial Disclosure
.
|
None.
|
Item 9A.
|
Controls and Procedures.
|
Evaluation of Disclosure Controls and Procedures
The Company has evaluated the effectiveness of the design and operation of its disclosure controls and procedures pursuant to Rules 13a-15(e) and 15d-15(e) under the Securities Exchange Act of 1934 as of the end of the period covered by this report. Based on the evaluation, performed under the supervision and with the participation of the Company’s management, including the Chairman and Chief Executive Officer (the “CEO”) and the Chief Financial Officer (the “CFO”), the Company’s management, including the CEO and CFO, concluded that the Company’s disclosure controls and procedures were effective as of the end of the period covered by this report.
Management’s Report on Internal Control Over Financial Reporting
Our management is responsible for establishing and maintaining adequate internal control over financial reporting, as such term is defined in Rules 13a-15(f) under the Securities Exchange Act of 1934. Under the supervision and with the participation of our management, including our principal executive officer and principal financial officer, we conducted an evaluation of the effectiveness of our internal control over financial reporting based on the framework in
Internal Control – Integrated Framework
(1992)
issued by the Committee of Sponsoring Organizations of the Treadway Commission. Based on our evaluation under the framework in
Internal Control – Integrated Framework (1992)
, our management concluded that our internal control over financial reporting was effective as of
December 28, 2013
.
KPMG LLP, an independent registered public accounting firm, has audited the Consolidated Financial Statements included in this Annual Report on Form 10-K and the effectiveness of our internal control over financial reporting and has issued their report, included herein.
Changes in Internal Control
There were no changes with respect to the Company’s internal control over financial reporting or in other factors that materially affected, or are reasonably likely to materially affect, internal control over financial reporting during the quarter ended
December 28, 2013
.
|
Item 9B.
|
Other Information.
|
None.
102
|
Item 10.
|
Directors, Executive Officers and Corporate Governance.
|
Information regarding Section 16(a) compliance, the Audit Committee and the Audit Committee financial expert, the Company’s code of ethics and background of the directors appearing under the captions “Stock Ownership Information,” “Governance of the Company,” “Executive Compensation” and “Item 1: Election of Directors and Director biographies” is incorporated by reference from the Company’s definitive proxy statement which will be filed with the Securities and Exchange Commission no later than 120 days after
December 28, 2013
.
Information
regarding executive officers of the Company is included in Part I.
|
Item 11.
|
Executive Compensation.
|
Information regarding executive and director compensation and the Compensation Committee appearing under the captions “Governance of the Company” and “Executive Compensation” is incorporated by reference from the Company’s definitive proxy statement which will be filed with the Securities and Exchange Commission no later than 120 days after
December 28, 2013
.
|
Item 12.
|
Security Ownership of Certain Beneficial Owners and Management and Related Stockholder Matters.
|
Information regarding equity compensation plans and security ownership of certain beneficial owners and management appearing under the captions “Executive Compensation” and “Stock Ownership Information” is incorporated by reference from the Company’s definitive proxy statement which will be filed with the Securities and Exchange Commission no later than 120 days after
December 28, 2013
.
|
Item 13.
|
Certain Relationships and Related Transactions, and Director Independence.
|
Information regarding certain relationships and related transactions and information regarding director independence appearing under the caption “Governance of the Company” is incorporated by reference from the Company’s definitive proxy statement which will be filed with the Securities and Exchange Commission no later than 120 days after
December 28, 2013
.
|
Item 14.
|
Principal Accountant Fees and Services.
|
Information regarding principal accountant fees and services and audit committee pre-approval policies and procedures appearing under the caption “Item 2: Ratification of Independent Auditors” is incorporated by reference from the Company’s definitive proxy statement which will be filed with the Securities and Exchange Commission no later than 120 days after
December 28, 2013
.
103
|
Item 15.
|
Exhibits and Financial Statement Schedules.
|
|
(a)
|
(1
|
)
|
Financial Statements: Consolidated Financial Statements filed as part of this report are listed under Part II, Item 8 of this Form 10-K.
|
|
|
(2
|
)
|
Financial Statement Schedules: No schedules are required because either the required information is not present or not present in amounts sufficient to require submission of the schedule, or because the information required is included in the Consolidated Financial Statements thereto filed as a part of this Form 10-K.
|
||
|
(3
|
)
|
Exhibits: The exhibits listed in the accompanying Index to Exhibits are filed as part of this Form 10-K. The Index to Exhibits specifically identifies each management contract or compensatory plan required to be filed as an exhibit to this Form 10-K.
|
||
104
|
|
SIGNATURES
|
Pursuant to the requirements of Section 13 or 15(d) of the Securities Exchange Act of 1934, the registrant has duly caused this Form 10-K annual report to be signed on its behalf by the undersigned, thereunto duly authorized.
|
Date:
|
February 18, 2014
|
|
|
YUM! BRANDS, INC.
|
|
By:
|
/s/ David C. Novak
|
105
Pursuant to the requirements of the Securities Exchange Act of 1934, this annual report has been signed below by the following persons on behalf of the registrant and in the capacities and on the dates indicated.
|
Signature
|
Title
|
Date
|
||
|
/s/ David C. Novak
|
Chairman of the Board,
|
February 18, 2014
|
||
|
David C. Novak
|
Chief Executive Officer
|
|||
|
(principal executive officer)
|
||||
|
/s/ Patrick J. Grismer
|
Chief Financial Officer
|
February 18, 2014
|
||
|
Patrick J. Grismer
|
(principal financial officer)
|
|||
|
/s/ David E. Russell
|
Vice President, Finance and
Corporate Controller
|
February 18, 2014
|
||
|
David E. Russell
|
(principal accounting officer)
|
|||
|
/s/ Michael J. Cavanagh
|
Director
|
February 18, 2014
|
||
|
Michael J. Cavanagh
|
||||
|
/s/ David W. Dorman
|
Director
|
February 18, 2014
|
||
|
David W. Dorman
|
||||
|
/s/ Massimo Ferragamo
|
Director
|
February 18, 2014
|
||
|
Massimo Ferragamo
|
||||
|
/s/ Mirian Graddick-Weir
|
Director
|
February 18, 2014
|
||
|
Mirian Graddick-Weir
|
||||
|
/s/ J. David Grissom
|
Director
|
February 18, 2014
|
||
|
J. David Grissom
|
||||
|
/s/ Bonnie G. Hill
|
Director
|
February 18, 2014
|
||
|
Bonnie G. Hill
|
||||
|
/s/ Jonathan S. Linen
|
Director
|
February 18, 2014
|
||
|
Jonathan S. Linen
|
||||
|
/s/ Thomas C. Nelson
|
Director
|
February 18, 2014
|
||
|
Thomas C. Nelson
|
||||
|
/s/ Thomas M. Ryan
|
Director
|
February 18, 2014
|
||
|
Thomas M. Ryan
|
||||
|
/s/ Jing-Shyh S. Su
|
Vice-Chairman of the Board
|
February 18, 2014
|
||
|
Jing-Shyh S. Su
|
||||
|
/s/ Robert D. Walter
|
Director
|
February 18, 2014
|
||
|
Robert D. Walter
|
||||
106
YUM! Brands, Inc.
Exhibit Index
(Item 15)
|
Exhibit
Number
|
|
Description of Exhibits
|
||
|
|
|
|
||
|
3.1
|
|
Restated Articles of Incorporation of YUM, effective May 26, 2011, which is incorporated herein by reference from Exhibit 3.1 to YUM's Report on Form 8-K filed on May 31, 2011.
|
||
|
|
|
|
||
|
3.2
|
|
Amended and restated Bylaws of YUM, effective May 26, 2011, which are incorporated herein by reference from Exhibit 3.2 to YUM's Report on Form 8-K filed on May 31, 2011.
|
||
|
|
|
|
||
|
4.1
|
|
Indenture, dated as of May 1, 1998, between YUM and The Bank of New York Mellon Trust Company, N.A., successor in interest to The First National Bank of Chicago, which is incorporated herein by reference from Exhibit 4.1 to YUM's Report on Form 8-K filed on May 13, 1998.
|
||
|
|
|
|
||
|
|
|
(i)
|
6.25% Senior Notes due April 15, 2016 issued under the foregoing May 1, 1998 indenture, which notes are incorporated by reference from Exhibit 4.2 to YUM's Report on Form 8-K filed on April 17, 2006.
|
|
|
|
(ii)
|
6.25% Senior Notes due March 15, 2018 issued under the foregoing May 1, 1998 indenture, which notes are incorporated by reference from Exhibit 4.2 to YUM's Report on Form 8-K filed on October 22, 2007.
|
||
|
|
|
|
||
|
|
|
(iii)
|
6.875% Senior Notes due November 15, 2037 issued under the foregoing May 1, 1998 indenture, which notes are incorporated by reference from Exhibit 4.3 to YUM's Report on Form 8-K filed on October 22, 2007.
|
|
|
|
|
|
|
|
|
|
|
(iv)
|
4.25% Senior Notes due September 15, 2015 issued under the foregoing May 1, 1998 indenture, which notes are incorporated by reference from Exhibit 4.1 to YUM's Report on Form 8-K filed on August 25, 2009.
|
|
|
|
|
|
|
|
|
|
|
(v)
|
5.30% Senior Notes due September 15, 2019 issued under the foregoing May 1, 1998 indenture, which notes are incorporated by reference from Exhibit 4.1 to YUM's Report on Form 8-K filed on August 25, 2009.
|
|
|
|
|
|
||
|
|
|
(vi)
|
3.875% Senior Notes due November 1, 2020 issued under the foregoing May 1, 1998 indenture, which notes are incorporated by reference from Exhibit 4.2 to YUM's Report on Form 8-K filed on August 31, 2010.
|
|
|
(vii)
|
3.750% Senior Notes due November 1, 2021 issued under the foregoing May 1, 1998 indenture, which notes are incorporated by reference from Exhibit 4.2 to YUM's Report on Form 8-K filed August 29, 2011.
|
|||
|
(viii)
|
3.875% Senior Notes due November 1, 2023 issued under the foregoing May 1, 1998 indenture, which notes are incorporated by reference from Exhibit 4.2 to YUM's Report on Form 8-K filed October 31, 2013.
|
|||
|
(ix)
|
5.350% Senior Notes due November 1, 2043 issued under the foregoing May 1, 1998 indenture, which notes are incorporated by reference from Exhibit 4.3 to YUM's Report on Form 8-K filed October 31, 2013.
|
|||
107
|
10.1 +
|
|
Master Distribution Agreement between Unified Foodservice Purchasing Co-op, LLC, for and on behalf of itself as well as the Participants, as defined therein (including certain subsidiaries of Yum! Brands, Inc.) and McLane Foodservice, Inc., effective as of January 1, 2011 and Participant Distribution Joinder Agreement between Unified Foodservice Purchasing Co-op, LLC, McLane Foodservice, Inc., and certain subsidiaries of Yum! Brands, Inc., which are incorporated herein by reference from Exhibit 10.1 to YUM's Quarterly Report on Form 10-Q for the quarter ended September 4, 2010.
|
|||
|
|
|
|
|||
|
10.2
|
|
Credit Agreement, dated March 22, 2012 among YUM, the lenders party thereto, JPMorgan Chase Bank, N.A., as Administrative Agent, Citibank, N.A. and Wells Fargo Bank, National Association, as Syndication Agents, J.P. Morgan Securities LLC, Citigroup Global Markets Inc. and Wells Fargo Securities, LLC, as Lead Arrangers and Bookrunners and HSBC Bank USA, National Association, US Bank, National Association and Fifth Third Bank, as Documentation Agents, which is incorporated herein by reference from Exhibit 10.26 to YUM's Quarterly Report on Form 10-Q for quarter ended March 24, 2012.
|
|||
|
|
|
|
|||
|
10.3†
|
|
YUM Director Deferred Compensation Plan, as effective October 7, 1997, which is incorporated herein by reference from Exhibit 10.7 to YUM's Annual Report on Form 10-K for the fiscal year ended December 27, 1997.
|
|||
|
|
|
|
|||
|
10.3.1†
|
|
YUM Director Deferred Compensation Plan, Plan Document for the 409A Program, as effective January 1, 2005, and as Amended through November 14, 2008, which is incorporated by reference from Exhibit 10.7.1 to YUM's Quarterly Report on Form 10-Q for the quarter ended June 13, 2009.
|
|||
|
|
|
|
|||
|
10.4†
|
|
YUM 1997 Long Term Incentive Plan, as effective October 7, 1997, which is incorporated herein by reference from Exhibit 10.8 to YUM's Annual Report on Form 10-K for the fiscal year ended December 27, 1997.
|
|||
|
|
|
|
|||
|
10.5†
|
|
YUM Executive Incentive Compensation Plan, as effective May 20, 2004, and as Amended through the Second Amendment, as effective May 21, 2009, which is incorporated herein by reference from Exhibit A of YUM's Definitive Proxy Statement on Form DEF 14A for the Annual Meeting of Shareholders held on May 21, 2009.
|
|||
|
|
|
|
|||
|
10.6†
|
|
YUM Executive Income Deferral Program, as effective October 7, 1997, and as amended through May 16, 2002, which is incorporated herein by reference from Exhibit 10.10 to YUM's Annual Report on Form 10-K for the fiscal year ended December 31, 2005.
|
|||
|
|
|
|
|||
|
10.6.1†
|
|
YUM! Brands Executive Income Deferral Program, Plan Document for the 409A Program, as effective January 1, 2005, and as Amended through June 30, 2009, which is incorporated by reference from Exhibit 10.10.1 to YUM's Quarterly Report on Form 10-Q for the quarter ended June 13, 2009.
|
|||
|
|
|
|
|||
|
10.7†
|
|
YUM! Brands Pension Equalization Plan, Plan Document for the Pre-409A Program, as effective January 1, 2005, and as Amended through December 31, 2010, which is incorporated by reference from Exhibit 10.7 to Yum's Quarterly Report on Form 10-Q for the quarter ended March 19, 2011.
|
|||
|
10.7.1†
|
|
YUM! Brands, Inc. Pension Equalization Plan, Plan Document for the 409A Program, as effective January 1, 2005, and as Amended through December 30, 2008, which is incorporated by reference from Exhibit 10.13.1 to YUM's Quarterly Report on Form 10-Q for the quarter ended June 13, 2009.
|
|||
|
|
|
|
|||
|
10.7.2†
|
YUM! Brands Pension Equalization Plan Amendment, as effective January 1, 2012, which is incorporated by reference from Exhibit 10.7.2 to Yum’s Quarterly Report on Form 10-Q for the quarter ended March 23, 2013.
|
||||
|
10.7.3†
|
YUM! Brands Pension Equalization Plan Amendment, as effective January 1, 2013, which is incorporated by reference from Exhibit 10.7.3 to Yum’s Quarterly Report on Form 10-Q for the quarter ended March 23, 2013.
|
||||
|
10.8†
|
|
Form of Directors' Indemnification Agreement, which is incorporated herein by reference from Exhibit 10.17 to YUM's Annual Report on Form 10-K for the fiscal year ended December 27, 1997.
|
|||
|
|
|
|
|||
108
|
10.9†
|
|
Form of YUM! Brands, Inc. Change in Control Severance Agreement, which is incorporated herein by reference from Exhibit 10.1 to Yum’s Report on Form 8-K filed on March 21, 2013.
|
|||
|
10.10†
|
|
YUM Long Term Incentive Plan, as Amended through the Fourth Amendment, as effective November 21, 2008, which is incorporated by reference from Exhibit 10.18 to YUM's Quarterly Report on Form 10-Q for the quarter ended June 13, 2009.
|
|||
|
|
|
|
|||
|
10.11
|
|
Second Amended and Restated YUM Purchasing Co-op Agreement, dated as of January 1, 2012, between YUM and the Unified Foodservice Purchasing Co-op, LLC, which is incorporated herein by reference from Exhibit 10.11 to YUM’s Annual Report on Form 10-K for the fiscal year ended December 31, 2011.
|
|||
|
|
|
|
|||
|
10.12†
|
|
YUM Restaurant General Manager Stock Option Plan, as effective April 1, 1999, and as amended through June 23, 2003, which is incorporated herein by reference from Exhibit 10.22 to YUM's Annual Report on Form 10-K for the fiscal year ended December 31, 2005.
|
|||
|
|
|
|
|||
|
10.13†
|
|
YUM SharePower Plan, as effective October 7, 1997, and as amended through June 23, 2003, which is incorporated herein by reference from Exhibit 10.23 to YUM's Annual Report on Form 10-K for the fiscal year ended December 31, 2005.
|
|||
|
|
|
|
|||
|
10.14†
|
|
Form of YUM Director Stock Option Award Agreement, which is incorporated herein by reference from Exhibit 10.25 to YUM's Quarterly Report on Form 10-Q for the quarter ended September 4, 2004.
|
|||
|
|
|
|
|||
|
10.15†
|
|
Form of YUM 1999 Long Term Incentive Plan Award Agreement, which is incorporated herein by reference from Exhibit 10.26 to YUM's Quarterly Report on Form 10-Q for the quarter ended September 4, 2004.
|
|||
|
|
|
|
|||
|
10.15.1†
|
Form of YUM 1999 Long Term Incentive Plan Award Agreement (2013) (Stock Options), as incorporated by reference from Exhibit 10.15.1 to YUM’s Quarterly Report on Form 10-Q for the quarter ended March 23, 2013.
|
||||
|
10.16†
|
|
YUM! Brands, Inc. International Retirement Plan, as in effect January 1, 2005, which is incorporated herein by reference from Exhibit 10.27 to YUM's Annual Report on Form 10-K for the fiscal year ended December 25, 2004.
|
|||
|
|
|
|
|||
|
10.17†
|
|
Letter of Understanding, dated July 13, 2004, and as amended on May 18, 2011, by and between the Company and Samuel Su, which is incorporated herein by reference from Exhibit 10.28 to YUM's Annual Report on Form 10-K for the fiscal year ended December 25, 2004, and from Item 5.02 of Form 8-K on May 24, 2011.
|
|||
|
|
|
|
|||
|
10.18†
|
|
Form of 1999 Long Term Incentive Plan Award Agreement (Stock Appreciation Rights) which is incorporated by reference from Exhibit 99.1 to YUM's Report on Form 8-K as filed on January 30, 2006.
|
|||
|
10.18.1†
|
Form of YUM 1999 Long Term Incentive Plan Award Agreement (2013) (Stock Appreciation Rights), which is incorporated by reference from Exhibit 10.18.1 to YUM’s Quarterly Report on Form 10-Q for the quarter ended March 23, 2013.
|
||||
|
10.20†
|
|
YUM! Brands Leadership Retirement Plan, as in effect January 1, 2005, which is incorporated herein by reference from Exhibit 10.32 to YUM's Quarterly Report on Form 10-Q for the quarter ended March 24, 2007.
|
||||
|
|
|
|
||||
|
10.20.1†
|
|
YUM! Brands Leadership Retirement Plan, Plan Document for the 409A Program, as effective January 1, 2005, and as Amended through December, 2009, which is incorporated by reference from Exhibit 10.21.1 to YUM's Annual Report on Form 10-K for the fiscal year ended December 26, 2009.
|
||||
|
|
|
|
||||
109
|
10.21†
|
|
1999 Long Term Incentive Plan Award (Restricted Stock Unit Agreement) by and between the Company and David C. Novak, dated as of January 24, 2008, which is incorporated herein by reference from Exhibit 10.33 to YUM's Annual Report on Form 10-K for the fiscal year ended December 29, 2007.
|
||||
|
|
|
|
||||
|
10.22†
|
YUM! Performance Share Plan, as effective January 1, 2009, which is incorporated by reference from Exhibit 10.24 to YUM's Annual Report on Form 10-K for the fiscal year ended December 26, 2009.
|
|||||
|
|
|
|||||
|
10.23†
|
YUM! Brands Third Country National Retirement Plan, as effective January 1, 2009, which is incorporated by reference from Exhibit 10.25 to YUM's Annual Report on Form 10-K for the fiscal year ended December 26, 2009.
|
|||||
|
|
|
|||||
|
10.24†
|
2010 YUM! Brands Supplemental Long Term Disability Coverage Summary, as effective January 1, 2010, which is incorporated by reference from Exhibit 10.26 to YUM's Annual Report on Form 10-K for the fiscal year ended December 26, 2009.
|
|||||
|
10.25†
|
1999 Long Term Incentive Plan Award (Restricted Stock Unit Agreement) by and between the Company and Jing-Shyh S. Su, dated as of May 20, 2010, which is incorporated by reference from Exhibit 10.27 to YUM's Annual Report on Form 10-K for the fiscal year ended December 25, 2010.
|
|||||
|
12.1
|
Computation of ratio of earnings to fixed charges.
|
|||||
|
|
|
|||||
|
21.1
|
Active Subsidiaries of YUM.
|
|||||
|
|
|
|||||
|
23.1
|
Consent of KPMG LLP.
|
|||||
|
|
|
|||||
|
31.1
|
Certification of the Chairman and Chief Executive Officer pursuant to Rule 13a-14(a) of Securities Exchange Act of 1934, as adopted pursuant to Section 302 of the Sarbanes-Oxley Act of 2002.
|
|||||
|
|
|
|
||||
|
31.2
|
|
Certification of the Chief Financial Officer pursuant to Rule 13a-14(a) of Securities Exchange Act of 1934, as adopted pursuant to Section 302 of the Sarbanes-Oxley Act of 2002.
|
||||
|
|
|
|
||||
|
32.1
|
|
Certification of the Chairman and Chief Executive Officer pursuant to 18 U.S.C. Section 1350, as adopted pursuant to Section 906 of the Sarbanes-Oxley Act of 2002.
|
||||
|
|
|
|
||||
|
32.2
|
|
Certification of the Chief Financial Officer pursuant to 18 U.S.C. Section 1350, as adopted pursuant to Section 906 of the Sarbanes-Oxley Act of 2002.
|
||||
|
|
|
|
||||
|
101.INS
|
|
XBRL Instance Document
|
||||
|
|
|
|
||||
|
101.SCH
|
|
XBRL Taxonomy Extension Schema Document
|
||||
|
|
|
|
||||
|
101.CAL
|
|
XBRL Taxonomy Extension Calculation Linkbase Document
|
||||
|
|
|
|
||||
|
101.LAB
|
|
XBRL Taxonomy Extension Label Linkbase Document
|
||||
|
|
|
|
||||
|
101.PRE
|
|
XBRL Taxonomy Extension Presentation Linkbase Document
|
||||
|
|
|
|
||||
|
101.DEF
|
|
XBRL Taxonomy Extension Definition Linkbase Document
|
||||
|
|
|
|
||||
110
|
+
|
Confidential treatment has been granted for certain portions which are omitted in the copy of the exhibit electronically filed with the SEC. The omitted information has been filed separately with the SEC pursuant to our application for confidential treatment.
|
|||||
|
|
|
|
||||
|
†
|
Indicates a management contract or compensatory plan.
|
|||||
111
TABLE OF CONTENTS
Part IItem 1. BusinessItem 1A. Risk FactorsItem 1B. Unresolved Staff CommentsItem 2. PropertiesItem 3. Legal ProceedingsItem 4. Mine Safety DisclosuresPart IIItem 5. Market For The Registrant S Common Stock, Related Stockholder Matters and Issuer Purchases Of Equity SecuritiesItem 6. Selected Financial DataItem 7. Management S Discussion and Analysis Of Financial Condition and Results Of OperationsItem 7A. Quantitative and Qualitative Disclosures About Market RiskItem 8. Financial Statements and Supplementary DataNote 1 Description Of BusinessNote 2 Summary Of Significant Accounting PoliciesNote 3 Earnings Per Common Share ( Eps )Note 4 Items Affecting Comparability Of Net Income and Cash FlowsNote 5 Supplemental Cash Flow DataNote 6 Franchise and License Fees and IncomeNote 7 Other (income) ExpenseNote 8 Supplemental Balance Sheet InformationNote 9 Goodwill and Intangible AssetsNote 10 Short-term Borrowings and Long-term DebtNote 11 LeasesNote 12 Derivative InstrumentsNote 13 Fair Value DisclosuresNote 14 Pension, Retiree Medical and Retiree Savings PlansNote 15 Share-based and Deferred Compensation PlansNote 16 Shareholders EquityNote 17 Income TaxesNote 18 Reportable Operating SegmentsNote 19 ContingenciesItem 9. Changes in and Disagreements with Accountants on Accounting and Financial DisclosureItem 9A. Controls and ProceduresItem 9B. Other InformationPart IIIItem 10. Directors, Executive Officers and Corporate GovernanceItem 11. Executive CompensationItem 12. Security Ownership Of Certain Beneficial Owners and Management and Related Stockholder MattersItem 13. Certain Relationships and Related Transactions, and Director IndependenceItem 14. Principal Accountant Fees and ServicesPart IVItem 15. Exhibits and Financial Statement Schedules