YUM BRANDS INC
10-Ks and 10-Qs
|
|
|
|
|
|
|
|
|
|
|
|
|
|
|
|
|
|
|
|
|
|
|
|
|
|
|
|
|
|
|
|
|
|
|
|
|
|
|
|
|
|
|
|
|
|
|
|
|
|
|
|
|
|
|
|
UNITED STATES
SECURITIES AND EXCHANGE COMMISSION
Washington, D. C. 20549
FORM 10-K
|
[
]
|
|
ANNUAL REPORT PURSUANT TO SECTION 13 OR 15(d) OF THE SECURITIES
|
|
|
|
EXCHANGE ACT OF 1934
for the fiscal year ended December 31, 2017
|
|
|
|
|
|
|
|
OR
|
|
|
|
|
|
[ ]
|
|
TRANSITION REPORT PURSUANT TO SECTION 13 OR 15(d) OF THE SECURITIES
|
|
|
|
EXCHANGE ACT OF 1934
|
For the transition period from ____________ to _________________
Commission file number 1-13163
YUM! BRANDS, INC.
(Exact name of registrant as specified in its charter)
|
|
North Carolina
|
|
13-3951308
|
|
|
(State or other jurisdiction of
|
|
(I.R.S. Employer
|
|
|
incorporation or organization)
|
|
Identification No.)
|
|
|
|
|
|
|
|
1441 Gardiner Lane, Louisville, Kentucky
|
|
40213
|
|
|
(Address of principal executive offices)
|
|
(Zip Code)
|
|
|
|
|
|
|
Registrant’s telephone number, including area code: (502) 874-8300
|
|||
|
Securities registered pursuant to Section 12(b) of the Act
|
|||
|
|
|
|
|
|
|
Title of Each Class
|
|
Name of Each Exchange on Which Registered
|
|
|
Common Stock, no par value
|
|
New York Stock Exchange
|
|
|
|
||
|
|
Securities registered pursuant to Section 12(g) of the Act:
|
||
|
|
None
|
||
Indicate by check mark if the registrant is a well-known seasoned issuer, as defined in Rule 405 of the Securities Act. Yes
ü
No
Indicate by check mark if the registrant is not required to file reports pursuant to Section 13 or Section 15(d) of the Act. Yes
No
ü
Indicate by check mark whether the registrant (1) has filed all reports required to be filed by Section 13 or 15(d) of the Securities Exchange Act of 1934 during the preceding 12 months (or for such shorter period that the registrant was required to file such reports), and (2) has been subject to such filing requirements for the past 90 days. Yes
ü
No
Indicate by check mark whether the registrant has submitted electronically and posted on its corporate Website, if any, every Interactive Data File required to be submitted and posted pursuant to Rule 405 of Regulation S-T during the preceding 12 months (or for such shorter period that the registrant was required to submit and post such files). Yes
ü
No
Indicate by check mark if disclosure of delinquent filers pursuant to Item 405 of Regulation S-K is not contained herein, and will not be contained, to the best of registrant’s knowledge, in definitive proxy or information statements incorporated by reference in Part III of this Form 10-K or any amendment to this Form 10-K. [
ü
]
Indicate by check mark whether the registrant is a large accelerated filer, an accelerated filer, a non-accelerated filer, a smaller reporting company or an emerging growth company. See definitions of “large accelerated filer”, “accelerated filer”, “smaller reporting company” and"emerging growth company" in Rule 12b-2 of the Exchange Act (Check one): Large accelerated filer: [
ü
] Accelerated filer: [ ] Non-accelerated filer: [ ] Smaller reporting company: [ ] Emerging growth company: [ ]
If an emerging growth company, indicate by check mark if the registrant has elected not to use the extended transition period for complying with any new or revised financial accounting standards provided pursuant to Section 13(a) of the Exchange Act. [ ]
Indicate by check mark whether the registrant is a shell company (as defined in Rule 12b-2 of the Exchange Act). Yes
No
ü
The aggregate market value of the voting stock (which consists solely of shares of Common Stock) held by non-affiliates of the registrant as of June 30, 2017 computed by reference to the closing price of the registrant’s Common Stock on the New York Stock Exchange Composite Tape on such date was approximately $25.4 billion. All executive officers and directors of the registrant have been deemed, solely for the purpose of the foregoing calculation, to be “affiliates” of the registrant. The number of shares outstanding of the registrant’s Common Stock as of February 14, 2018 was 332,513,103 shares.
Documents Incorporated by Reference
Portions of the definitive proxy statement furnished to shareholders of the registrant in connection with the annual meeting of shareholders to be held on May 17, 2018 are incorporated by reference into Part III.
Forward-Looking Statements
In this Form 10-K, as well as in other written reports and oral statements, we present “forward-looking statements” within the meaning of Section 27A of the Securities Act of 1933, as amended, and Section 21E of the Securities Exchange Act of 1934, as amended. We intend all forward-looking statements to be covered by the safe harbor provisions of the Private Securities Litigation Reform Act of 1995, and we are including this statement for purposes of complying with those safe harbor provisions.
Forward-looking statements can be identified by the fact that they do not relate strictly to historical or current facts and by the use of forward-looking words such as “expect,” “expectation,” “believe,” “anticipate,” “may,” “could,” “intend,” “belief,” “plan,” “estimate,” “target,” “predict,” “likely,” “seek,” “project,” “model,” “ongoing,” “will,” “should,” “forecast,” “outlook” or similar terminology. Forward-looking statements are based on our current expectations, estimates, assumptions and/or projections, our perception of historical trends and current conditions, as well as other factors that we believe are appropriate and reasonable under the circumstances. Forward-looking statements are neither predictions nor guarantees of future events, circumstances or performance and are inherently subject to known and unknown risks, uncertainties and assumptions that could cause our actual results to differ materially from those indicated by those statements. There can be no assurance that our expectations, estimates, assumptions and/or projections will be achieved. Factors that could cause actual results and events to differ materially from our expectations and forward-looking statements include (i) the risks and uncertainties described in the Risk Factors included in Part I, Item 1A of this Form 10-K and (ii) the factors described in Management’s Discussion and Analysis of Financial Condition and Results of Operations included in Part II, Item 7 of this Form 10-K. You should not place undue reliance on forward-looking statements, which speak only as of the date hereof. The forward-looking statements included in this Form 10-K are only made as of the date of this Form 10-K and we disclaim any obligation to publicly update any forward-looking statement to reflect subsequent events or circumstances.
2
|
Item 1.
|
Business.
|
YUM! Brands, Inc. (referred to herein as “YUM”, the “Registrant” or the “Company”), was incorporated under the laws of the state of North Carolina in 1997. The principal executive offices of YUM are located at 1441 Gardiner Lane, Louisville, Kentucky 40213, and the telephone number at that location is (502) 874-8300. Our website address is
http://yum.com
.
YUM, together with its subsidiaries, is referred to in this Form 10-K annual report (“Form 10-K”) as the Company. The terms “we,” “us” and “our” are also used in the Form 10-K to refer to the Company. Throughout this Form 10-K, the terms “restaurants,” “stores” and “units” are used interchangeably. While YUM! Brands, Inc., referred to as the Company, does not directly own or operate any restaurants, throughout this document we may refer to restaurants that are owned or operated by our subsidiaries as being Company-owned.
Financial Information about Operating Segments and General Development of the Business
As of December 31, 2017, YUM consists of three operating segments:
|
•
|
The KFC Division which includes the worldwide operations of the KFC concept
|
|
•
|
The Pizza Hut Division which includes the worldwide operations of the Pizza Hut concept
|
|
•
|
The Taco Bell Division which includes the worldwide operations of the Taco Bell concept
|
On October 31, 2016 (the “Distribution Date”), we completed the spin-off of our China business (the "Separation") into an independent, publicly-traded company under the name of Yum China Holdings, Inc. (“Yum China”). On the Distribution Date, we distributed to each of our shareholders of record as of the close of business on October 19, 2016 (the “Record Date”) one share of Yum China common stock for each share of our Common Stock held as of the Record Date. The distribution was structured to be a tax free distribution to our U.S. shareholders for federal income tax purposes in the United States. Yum China’s common stock trades on the New York Stock Exchange under the symbol “YUMC.” After the distribution, we do not beneficially own any shares of Yum China common stock.
Concurrent with the Separation, a subsidiary of the Company entered into a Master License Agreement with a subsidiary of Yum China for the exclusive right to use and sublicense the use of intellectual property owned by YUM and its affiliates for the development and operation of KFC, Pizza Hut and Taco Bell restaurants in China. Prior to the Separation, our operations in mainland China were reported in our former China Division segment results. As a result of the Separation, the results of operations and cash flows of the separated business are presented as discontinued operations in our Consolidated Statements of Income and Consolidated Statements of Cash Flows for periods presented prior to the Separation. See additional information related to the impact of the Separation in Item 8, Note 4 to the Consolidated Financial Statements.
Operating segment information for the years ended December 31, 2017, 2016 and 2015 for the Company is included in Part II, Item 7, Management's Discussion and Analysis of Financial Condition and Results of Operations ("MD&A") and in the related Consolidated Financial Statements in Part II, Item 8.
Narrative Description of Business
General
YUM has over 45,000 restaurants in more than 135 countries and territories. The Company's three concepts of KFC, Pizza Hut and Taco Bell (the “Concepts”), develop, operate or franchise a worldwide system of restaurants which prepare, package and sell a menu of competitively priced food items. Units are operated by the Concepts or by independent franchisees or licensees under the terms of franchise or license agreements, which typically require an initial non-refundable fee upon an individual store opening and the payment of sales-based fees for use of our Concepts' brands. The terms "franchise" or "franchisee" within this Form 10-K are meant to describe third parties that operate units under either franchise or license agreements. Franchisees can range in size from individuals owning just one restaurant to large publicly-traded companies.
3
Restaurant Concepts
Most restaurants in each Concept offer consumers the ability to dine in and/or carry out food. In addition, Taco Bell and KFC offer a drive-thru option in many stores. Pizza Hut offers a drive-thru option on a much more limited basis. Pizza Hut typically offers delivery service, while, on a more limited but expanding basis, KFC and Taco Bell allow for consumers to have the Concepts' food delivered either through store-level or third-party delivery services. In February 2018, we entered into an agreement with GrubHub, Inc., ("Grubhub") the leading online and mobile take out food-ordering company in the U.S. Under the agreement, Grubhub will provide support in the U.S. for the KFC and Taco Bell branded online delivery channels, along with access to Grubhub's online ordering platform, logistics and last-mile support for delivery orders, and point-of-sale integration to streamline operations.
Each Concept has proprietary menu items and emphasizes the preparation of food with high quality ingredients, as well as unique recipes and special seasonings to provide appealing, tasty and convenient food at competitive prices.
The franchise programs of the Company are designed to promote consistency and quality, and the Company is selective in granting franchises. The Company utilizes both store-level franchise and master franchise programs to grow its businesses. Under store-level franchise agreements, franchisees supply capital – initially by paying a franchise fee to YUM, by purchasing or leasing the land, building, equipment, signs, seating, inventories and supplies and, over the longer term, by reinvesting in the business. In certain refranchising transactions the Company may retain ownership of land and building and lease them to the franchisee. Franchisees contribute to the Company’s revenues by paying non-refundable upfront fees at inception of the franchise agreement and on an ongoing basis through the payment of royalties based on a percentage of sales (usually 4% - 6%). Under master franchise arrangements, the Company enters into agreements that allow master franchisees to operate restaurants as well as sub-franchise within certain geographic territories. Master franchisees are responsible for overseeing development within their territories and collect initial fees and royalties from sub-franchisees. Master franchisees generally pay upfront fees and ongoing royalties at a reduced rate to the Company. Our largest master franchisee, Yum China, pays a 3% license fee on system sales of our Concepts in mainland China to the Company.
The Company believes that it is important to maintain strong and open relationships with its franchisees and their representatives. To this end, the Company invests a significant amount of time working with the franchisee community and their representative organizations on key aspects of the business, including products, equipment, operational improvements and standards and management techniques.
Following is a brief description of each Concept:
KFC
|
•
|
KFC was founded in Corbin, Kentucky by Colonel Harland D. Sanders, an early developer of the quick service food business and a pioneer of the restaurant franchise concept. The Colonel perfected his secret blend of 11 herbs and spices for Kentucky Fried Chicken in 1939 and signed up his first franchisee in 1952.
|
|
•
|
KFC operates in 131 countries and territories throughout the world. As of year end 2017, KFC had 21,487 units, 97 percent of which are franchised.
|
|
•
|
KFC restaurants across the world offer fried and non-fried chicken products such as sandwiches, chicken strips, chicken-on-the-bone and other chicken products marketed under a variety of names. KFC restaurants also offer a variety of entrees and side items suited to local preferences and tastes. Restaurant decor throughout the world is characterized by the image of the Colonel.
|
Pizza Hut
|
•
|
The first Pizza Hut restaurant was opened in 1958 in Wichita, Kansas, and within a year, the first franchise unit was opened. Today, Pizza Hut is the largest restaurant chain in the world specializing in the sale of ready-to-eat pizza products.
|
|
•
|
Pizza Hut operates in 106 countries and territories throughout the world. As of year end 2017, Pizza Hut had 16,748 units, 99 percent of which are franchised.
|
|
•
|
Pizza Hut operates in the delivery, carryout and casual dining segments around the world. Outside of the U.S., Pizza Hut often uses unique branding to differentiate these segments. Additionally, a growing percentage of Pizza Hut's customer orders are being generated digitally.
|
4
|
•
|
Pizza Hut features a variety of pizzas which are marketed under varying names. Each of these pizzas is offered with a variety of different toppings suited to local preferences and tastes. Many Pizza Huts also offer pasta and chicken wings, including approximately 5,900 stores offering wings under the WingStreet brand in the U.S. Outside the U.S., Pizza Hut casual dining restaurants offer a variety of core menu products other than pizza, which are typically suited to local preferences and tastes. Pizza Hut units feature a distinctive red roof logo on their signage.
|
Taco Bell
|
•
|
The first Taco Bell restaurant was opened in 1962 by Glen Bell in Downey, California, and in 1964, the first Taco Bell franchise was sold.
|
|
•
|
Taco Bell operates in 27 countries and territories throughout the world. As of year end 2017, there were 6,849 Taco Bell units, primarily in the U.S., 90 percent of which are franchised.
|
|
•
|
Taco Bell specializes in Mexican-style food products, including various types of tacos, burritos, quesadillas, salads, nachos and other related items. Taco Bell offers breakfast items in its U.S. stores. Taco Bell units feature a distinctive bell logo on their signage.
|
Restaurant Operations
Through its Concepts, YUM develops, operates and franchises a worldwide system of both traditional and non-traditional Quick Service Restaurants ("QSR"). Traditional units can feature dine-in, carryout, drive-thru and delivery services. Non-traditional units include express units and kiosks which have a more limited menu, usually generate lower sales volumes and operate in non-traditional locations like malls, airports, gasoline service stations, train stations, subways, convenience stores, stadiums, amusement parks and colleges, where a full-scale traditional outlet would not be practical or efficient.
Restaurant management structure varies by Concept and unit size. Generally, each restaurant is led by a restaurant general manager (“RGM”), together with one or more assistant managers, depending on the operating complexity and sales volume of the restaurant. Each Concept issues detailed manuals, which may then be customized to meet local regulations and customs. These manuals set forth standards and requirements for all aspects of restaurant operations, including food safety and quality, food handling and product preparation procedures, equipment maintenance, facility standards and accounting control procedures. The restaurant management teams are responsible for the day-to-day operation of each unit and for ensuring compliance with operating standards. CHAMPS – which stands for Cleanliness, Hospitality, Accuracy, Maintenance, Product Quality and Speed of Service – is our proprietary systemwide program for training, measuring and rewarding employee performance against key customer measures. CHAMPS is intended to align the operating processes of our entire system around one core set of standards. RGMs’ efforts, including CHAMPS performance measures, are monitored by Area Coaches, where sufficient scale allows. Area Coaches typically work with approximately six to twelve restaurants.
Supply
and Distribution
The Company and franchisees of the Concepts are substantial purchasers of a number of food and paper products, equipment and other restaurant supplies. The principal items purchased include chicken, cheese, beef and pork products, paper and packaging materials. The Company has not experienced any significant continuous shortages of supplies, and alternative sources for most of these products are generally available. Prices paid for these supplies fluctuate. When prices increase, the Concepts may attempt to pass on such increases to their customers, although there is no assurance that this can be done practically.
In the U.S., the Company, along with the representatives of the Company’s KFC, Pizza Hut and Taco Bell franchisee groups, are members of Restaurant Supply Chain Solutions, LLC (“RSCS"), which is responsible for purchasing certain restaurant products and equipment. The core mission of RSCS is to provide the lowest possible sustainable store-delivered prices for restaurant products and equipment. This arrangement combines the purchasing power of the Company-owned and franchisee restaurants, which the Company believes leverages the system’s scale to drive cost savings and effectiveness in the purchasing function. The Company also believes that RSCS fosters closer alignment of interests and a stronger relationship with its franchisee community.
Most food products, paper and packaging supplies, and equipment used in restaurant operations are distributed to individual restaurant units by third-party distribution companies. In the U.S., McLane Foodservice, Inc. is the exclusive distributor for the majority of items used in Company-owned restaurants and for a substantial number of franchisee stores.
5
Outside the U.S., we and our Concepts' franchisees primarily use decentralized sourcing and distribution systems involving many different global, regional and local suppliers and distributors. We and our franchisees have approximately 6,400 food and paper suppliers, including U.S.-based suppliers that export to many countries.
Trademarks and Patents
The Company and its Concepts own numerous registered trademarks and service marks. The Company believes that many of these marks, including its Kentucky Fried Chicken®, KFC®, Pizza Hut® and Taco Bell® marks, have significant value and are materially important to its business. The Company’s policy is to pursue registration of its important marks whenever feasible and to oppose vigorously any infringement of its marks.
The use of certain of these marks by franchisees has been authorized in our franchise agreements. Under current law and with proper use, the Company’s rights in its marks can generally last indefinitely. The Company also has certain patents on restaurant equipment which, while valuable, are not material to its business.
Working Capital
Information about the Company’s working capital is included in MD&A in Part II, Item 7 and the Consolidated Statements of Cash Flows in Part II, Item 8.
Seasonal Operations
The Company does not consider its operations to be seasonal to any material degree.
Competition
The retail food industry, in which our Concepts compete, is made up of supermarkets, supercenters, warehouse stores, convenience stores, coffee shops, snack bars, delicatessens and restaurants (including the QSR segment), and is intensely competitive with respect to price and quality of food products, new product development, digital engagement, advertising levels and promotional initiatives, customer service reputation, restaurant location and attractiveness and maintenance of properties. Competition from delivery aggregators and other food delivery services has also increased in recent years, particularly in urbanized areas. The industry is often affected by changes in consumer tastes; national, regional or local economic conditions; currency fluctuations; demographic trends; traffic patterns; the type, number and location of competing food retailers and products; and disposable purchasing power. Each of the Concepts competes with international, national and regional restaurant chains as well as locally-owned restaurants, not only for customers, but also for management and hourly personnel, suitable real estate sites and qualified franchisees. Given the various types and vast number of competitors, our Concepts do not constitute a significant portion of the retail food industry in terms of number of system units or system sales, either on a worldwide or individual country basis.
Research and Development (“R&D”)
The Company operates R&D facilities in Plano, Texas (KFC and Pizza Hut Divisions); Irvine, California (Taco Bell Division); Louisville, Kentucky (KFC U.S.) and several other locations outside the U.S. In addition to Company R&D, we regularly also engage independent suppliers to conduct research and development activities for the benefit of the YUM system. The Company expensed $22 million, $24 million and $25 million in
2017
,
2016
and
2015
, respectively, for R&D activities.
Environmental Matters
The Company is not aware of any federal, state or local environmental laws or regulations that will materially affect its earnings or competitive position, or result in material capital expenditures. However, the Company cannot predict the effect on its operations of possible future environmental legislation or regulations. During
2017
, there were no material capital expenditures for environmental control facilities and no such material expenditures are anticipated.
Government Regulation
U.S. Operations.
The Company and its U.S. operations, as well as our franchisees, are subject to various federal, state and local laws affecting its business, including laws and regulations concerning information security, labor and employment, health, marketing, food labeling, sanitation and safety. Each of our and our Concepts’ franchisees' restaurants in the U.S. must comply with licensing and regulation by a number of governmental authorities, which include health, sanitation, safety, fire and zoning agencies in the state and/or municipality in which the restaurant is located. In addition, each Concept must comply with various
6
state and federal laws that regulate the franchisor/franchisee relationship. To date, the Company has not been materially adversely affected by such licensing and regulation or by any difficulty, delay or failure to obtain required licenses or approvals.
International Operations
.
Our and our Concepts' franchisees' restaurants outside the U.S. are subject to national and local laws and regulations which are similar to those affecting U.S. restaurants. The restaurants outside the U.S. are also subject to tariffs and regulations on imported commodities and equipment and laws regulating foreign investment, as well as anti-bribery and anti-corruption laws.
See Item 1A "Risk Factors" for a discussion of risks relating to federal, state, local and international regulation of our business.
Employees
As of year end
2017
, the Company and its subsidiaries employed approximately 60,000 persons. The Company believes that it provides working conditions and compensation that compare favorably with those of its principal competitors. The majority of employees are paid on an hourly basis. Some employees are subject to labor council relationships that vary due to the diverse cultures in which the Company operates. The Company and its Concepts consider their employee relations to be good.
Financial Information about Geographic Areas
Financial information about our significant geographic areas is incorporated herein by reference from the related Consolidated Financial Statements in Part II, Item 8.
Available Information
The Company makes available, through the Investor Relations section of its internet website at
http://www.yum.com,
its annual report on Form 10-K, quarterly reports on Form 10-Q, current reports on Form 8-K and amendments to those reports filed or furnished pursuant to Section 13(a) or 15(d) of the Exchange Act, as soon as reasonably practicable after electronically filing such material with the Securities and Exchange Commission ("SEC") at
http://www.sec.gov
. These reports may also be obtained by visiting the SEC's Public Reference Room at 100 F Street, NE, Washington, DC 20549 or by calling the SEC at 1 (800) SEC-0330.
Our Corporate Governance Principles and our Code of Conduct are also located within the Investor Relations section of the Company's website. The reference to the Company’s website address does not constitute incorporation by reference of the information contained on the website and should not be considered part of this document. These documents, as well as our SEC filings, are available in print free of charge to any shareholder who requests a copy from our Investor Relations Department.
|
Item 1A.
|
Risk Factors.
|
You should carefully review the risks described below as they identify important factors that could cause our actual results to differ materially from our forward-looking statements and historical trends.
Food safety and food-borne illness concerns may have an adverse effect on our business.
Food-borne illnesses, such as E. coli, trichinosis, listeria and salmonella, occur or may occur within our system from time to time. In addition, food safety issues such as food tampering, contamination and adulteration occur or may occur within our system from time to time. Any report or publicity linking us or one of our Concepts’ restaurants, including restaurants operated by us or our Concepts’ franchisees, or linking our competitors or our industry generally, to instances of food-borne illness or food safety issues could adversely affect our Concepts’ brands and reputations as well as our revenues and profits, and possibly lead to product liability claims, litigation and damages. If a customer of one of our Concepts becomes ill as a result of food safety issues, restaurants in our system may be temporarily closed, which could disrupt our operations and have a material adverse effect on our business, financial condition and results of operations. In addition, instances or allegations of food-borne illness or food safety issues, real or perceived, involving our restaurants, restaurants of competitors, or suppliers or distributors (regardless of whether we use or have used those suppliers or distributors), or otherwise involving the types of food served at our restaurants, could result in negative publicity that could adversely affect our sales or the sales of our Concepts’ franchisees. The occurrence of food-borne illnesses or food safety issues could also adversely affect the price and availability of affected ingredients, which could result in disruptions in our supply chain and/or lower margins for us and our Concepts’ franchisees.
7
Health concerns arising from outbreaks of viruses or other diseases may have an adverse effect on our business.
Our business could be materially and adversely affected by the outbreak of a widespread health epidemic, including various strains of avian flu or swine flu, such as H1N1. The occurrence of such an outbreak of an epidemic, illness or other adverse public health developments could materially disrupt our business and operations. Such events could also significantly impact our industry and cause a temporary closure of restaurants, which would severely disrupt our operations and have a material adverse effect on our business, financial condition and results of operations.
Our operations could be disrupted if any of our employees or employees of our business partners were suspected of having the avian flu or swine flu, or other illnesses such as hepatitis A or norovirus, since this could require us or our business partners to quarantine some or all of such employees or disinfect our restaurant facilities. Outbreaks of avian flu occur from time to time around the world, and such outbreaks have resulted in confirmed human cases. It is possible that outbreaks could reach pandemic levels. Public concern over avian flu generally may cause fear about the consumption of chicken, eggs and other products derived from poultry, which could cause customers to consume less poultry and related products. Because poultry is a menu offering for our Concepts, this would likely result in lower revenues and profits for us and our Concepts’ franchisees. Avian flu outbreaks could also adversely affect the price and availability of poultry, which could negatively impact our profit margins and revenues.
Furthermore, other viruses may be transmitted through human contact, and the risk of contracting viruses could cause employees or guests to avoid gathering in public places, which could adversely affect restaurant guest traffic or the ability to adequately staff restaurants. We could also be adversely affected if government authorities impose mandatory closures, seek voluntary closures or impose restrictions on operations of restaurants. Even if such measures are not implemented and a virus or other disease does not spread significantly, the perceived risk of infection or health risk may affect our business.
Our operating results and growth strategies are closely and increasingly tied to the success of our Concepts’ franchisees.
A significant and growing portion of our restaurants are operated by our Concepts’ franchisees. In 2016, we announced our plan to become at least 98% franchised by the end of 2018. Our refranchising efforts have increased, and will continue to increase, our dependence on the financial success and cooperation of our Concepts’ franchisees. In addition, our long-term system sales growth targets depend on an acceleration of our historical net system unit growth rate. Nearly all of this unit growth is expected to result from new unit openings by our Concepts’ franchisees. If our Concepts’ franchisees do not meet our expectations for new unit development, we may fall short of our system sales growth targets.
We have limited control over how our Concepts’ franchisees’ businesses are run, and their inability to operate successfully could adversely affect our operating results through decreased royalty payments. If our Concepts’ franchisees incur too much debt, if their operating expenses or commodity prices increase or if economic or sales trends deteriorate such that they are unable to operate profitably or repay existing debt, it could result in their financial distress, including insolvency or bankruptcy. If a significant franchisee of one of our Concepts becomes, or a significant number of our Concepts’ franchisees in the aggregate become, financially distressed, our operating results could be impacted through reduced or delayed royalty payments and reduced new unit development. In addition, we are contingently liable on certain of our Concepts’ franchisees’ lease agreements, including lease agreements that we have guaranteed or assigned to franchisees in connection with the refranchising of certain Company-owned restaurants. Our operating results could be impacted by any increased rent obligations for such leased properties to the extent our Concepts’ franchisees default on such lease agreements.
Our success also depends on the willingness and ability of our Concepts’ franchisees to implement major initiatives such as restaurant remodels or equipment or technology upgrades, which may require financial investment. Our Concepts may be unable to successfully implement strategies that we believe are necessary for further growth if their franchisees do not participate, which in turn may harm the growth prospects and financial condition of the Company. Additionally, the failure of our Concepts’ franchisees to focus on the fundamentals of restaurant operations, such as quality service and cleanliness (even if such failures do not rise to the level of breaching the related franchise documents), could have a negative impact on our business.
We may not successfully implement our transformation initiatives or fully realize the anticipated benefits from the transformation.
We are in the process of implementing our strategic transformation plans to drive global expansion of our KFC, Pizza Hut and Taco Bell brands. Among other things, this transformation includes a plan to become at least 98% franchised by the end of 2018 and to significantly reduce annual capital expenditures and our general and administrative costs, each by the end of 2019. We cannot assure you that we will be able to successfully implement our transformation initiatives. Further, our ability to achieve the anticipated benefits of this transformation, including the anticipated levels of cost savings and efficiency, within expected timeframes is subject to many estimates and assumptions, which are, in turn, subject to significant economic, competitive and other uncertainties, some of which are beyond our control. There is no assurance that we will successfully implement, or fully
8
realize the anticipated positive impact of, our transformation initiatives, or execute successfully on our transformation strategy, in the expected timeframes or at all. In addition, there can be no assurance that our efforts, if properly executed, will result in our desired outcome of improved financial performance.
We have significant exposure to the Chinese market through our largest franchisee, Yum China, which subjects us to risks that could negatively affect our business.
In connection with the Separation, we entered into a Master License Agreement with Yum China pursuant to which Yum China is the exclusive licensee of the KFC, Pizza Hut and Taco Bell Concepts and their related marks and other intellectual property rights for restaurant services in China. Following the Separation, Yum China became, and continues to be, our largest franchisee. As a result, our overall financial results are significantly affected by Yum China’s results. Yum China's business is exposed to risks in China, which include, among others, changes in economic conditions (including consumer spending, unemployment levels and wage and commodity inflation), consumer preferences, and the regulatory environment, as well as increased media scrutiny of our Concepts and industry, fluctuations in foreign exchange rates and increased competition. Further, any significant or prolonged deterioration in U.S.-China relations could adversely affect our Concepts in China if Chinese consumers reduce the frequency of their visits to Yum China’s restaurants. Chinese law regulates Yum China's business conducted within China. Our royalty income from the Yum China business is therefore subject to numerous uncertainties based on the policies of the Chinese government, as they may change from time to time.
Our relationship with Yum China is governed by a Master License Agreement, which may be terminated upon the occurrence of certain events, such as the insolvency or bankruptcy of Yum China. In addition, if we are unable to enforce our intellectual property or contract rights in China, if Yum China is unable or unwilling to satisfy its obligations under the Master License Agreement, or if the Master License Agreement is otherwise terminated, it could result in an interruption in the operation of our brands that have been exclusively licensed to Yum China for use in China. Such interruption could cause a delay in, or loss of, royalty income to us, which would negatively impact our financial results.
Our international operations subject us to risks that could negatively affect our business.
A significant portion of our Concepts’ restaurants are operated in countries and territories outside of the U.S., including in emerging markets, and we intend to continue expansion of our international operations. As a result, our business is increasingly exposed to risks inherent in international operations. These risks, which can vary substantially by country, include political instability, corruption, anti-American sentiment and social and ethnic unrest, as well as changes in economic conditions (including consumer spending, unemployment levels and wage and commodity inflation), the regulatory environment, income and non-income based tax rates and laws, sanctions, foreign exchange control regimes, consumer preferences and the laws and policies that govern foreign investment in countries where our restaurants are operated. In addition, our franchisees do business in jurisdictions that may be subject to trade or economic sanction regimes and such sanctions could be expanded. Any failure to comply with such sanction regimes or other similar laws or regulations could result in the assessment of damages, the imposition of penalties, suspension of business licenses, or a cessation of operations at our franchisees’ businesses, as well as damage to our and our Concepts’ brands’ images and reputations, all of which could harm our profitability.
Foreign currency risks and foreign exchange controls could adversely affect our financial results.
Our results of operations and the value of our foreign assets are affected by fluctuations in currency exchange rates, which may adversely affect reported earnings. More specifically, an increase in the value of the U.S. dollar relative to other currencies, such as the Chinese Renminbi (“RMB”), Australian Dollar, the British Pound and the Euro, as well as currencies in certain other markets, such as the Malaysian Ringgit and Russian Ruble, could have an adverse effect on our reported earnings. There can be no assurance as to the future effect of any such changes on our results of operations, financial condition or cash flows. In addition, the Chinese government restricts the convertibility of RMB into foreign currencies and, in certain cases, the remittance of currency out of China. Yum China’s income is almost exclusively derived from the earnings of its Chinese subsidiaries, with substantially all revenues of its Chinese subsidiaries denominated in RMB. Any significant fluctuation in the value of the RMB could materially impact the U.S. dollar value of royalty payments made to us by Yum China, which could result in lower revenues. In addition restrictions on the conversion of RMB to U.S. dollars or further restrictions on the remittance of currency out of China could result in delays in the remittance of Yum China’s license fee, which could impact our liquidity.
Failure to protect the integrity and security of personal information of our customers and employees could result in substantial costs, expose us to litigation and damage our reputation.
We receive and maintain certain personal, financial and other information about our customers, employees and franchisees. In addition, our vendors and/or franchisees receive and maintain certain personal, financial and other information about our employees
9
and customers. The use and handling of this information is regulated by evolving and increasingly demanding laws and regulations in various jurisdictions, as well as by certain third-party contracts. If our security and information systems are compromised as a result of data corruption or loss, cyber-attack or a network security incident or if our employees, franchisees or vendors fail to comply with these laws and regulations and this information is obtained by unauthorized persons or used inappropriately, it could result in liabilities and penalties and could damage our reputation, cause us to incur substantial costs and result in a loss of customer confidence, which could adversely affect our results of operations and financial condition. Additionally, we could be subject to litigation and government enforcement actions as a result of any such failure.
Further, data privacy is subject to frequently changing rules and regulations, which sometimes conflict among the various jurisdictions and countries where we, our Concepts and our Concepts’ franchisees do business. For example, the European Union adopted a new regulation that becomes effective in May 2018, The General Data Protection Regulation ("GDPR"), which requires companies to meet new requirements regarding the handling of personal data. Our failure to adhere to or successfully implement appropriate processes to adhere to the requirements of GDPR and other laws and regulations in this area could result in financial penalties, legal liability and could damage our and our Concepts’ brands’ reputations.
There are risks associated with our increasing dependence on digital commerce platforms to maintain and grow sales. In addition, aspects of our information technology systems may experience disruptions, which could harm our ability to compete and conduct our business.
Customers are increasingly using e-commerce websites and apps, both domestically and internationally, like pizzahut.com, Pizza Hut, KFC and Taco Bell apps, as well as apps owned by third-party delivery aggregators such as Grubhub and third-party mobile payment processors, to order and pay for our Concepts’ products. As a result, our Concepts and our Concepts’ franchisees are increasingly reliant on digital ordering and payment as a sales channel. These digital ordering and payment platforms could be damaged or interrupted by power loss, technological failures, user errors, cyber-attacks, other forms of sabotage or acts of God. In particular, Pizza Hut relies on digital orders for a significant portion of its sales and could experience interruptions of its digital ordering platforms, which could limit or delay customers’ ability to order through such platforms. Any such limitation or delay would negatively impact Pizza Hut’s sales and customer experience and perception. In addition, if Pizza Hut’s digital ordering platforms do not meet customers’ expectations in terms of security, speed, attractiveness, or ease of use, customers may be less inclined to return to such digital ordering platforms, which could negatively impact our sales, results of operations and financial condition.
In addition, Yum China, our largest franchisee, relies heavily on third-party mobile payment apps such as Alipay and WeChat as a means through which to generate sales and process payments. Should customers become unable to access mobile payment apps in China, or should the relationship between Yum China and one or more third-party mobile payment processors become interrupted, our results of operations could be negatively impacted.
Our inability or failure to recognize, respond to and effectively manage the accelerated impact of social media could adversely impact our business.
In recent years, there has been a marked increase in the use of social media platforms, including blogs, chat platforms, social media websites, and other forms of Internet-based communications which allow individuals access to a broad audience of consumers and other interested persons. The rising popularity of social media and other consumer-oriented technologies has increased the speed and accessibility of information dissemination. Many social media platforms immediately publish the content their subscribers and participants post, often without filters or checks on accuracy of the content posted. Information posted on such platforms at any time may be adverse to our interests and/or may be inaccurate. The dissemination of information via social media could harm our business, reputation, financial condition, and results of operations, regardless of the information’s accuracy. The damage may be immediate without affording us an opportunity for redress or correction.
In addition, social media is frequently used by our Concepts to communicate with their respective customers and the public in general. Failure by our Concepts to use social media effectively or appropriately, particularly as compared to our Concepts’ respective competitors, could lead to a decline in brand value, customer visits and revenue. Other risks associated with the use of social media include improper disclosure of proprietary information, negative comments about our Concepts’ brands, exposure of personally identifiable information, fraud, hoaxes or malicious dissemination of false information. The inappropriate use of social media by our customers or employees could increase our costs, lead to litigation or result in negative publicity that could damage our reputation and adversely affect our results of operations.
10
Shortages or interruptions in the availability and delivery of food and other supplies may increase costs or reduce revenues.
The products sold by our Concepts and their franchisees are sourced from a wide variety of domestic and international suppliers. We, along with our Concepts’ franchisees, are also dependent upon third parties to make frequent deliveries of food products and supplies that meet our specifications at competitive prices. Shortages or interruptions in the supply of food items and other supplies to our Concepts’ restaurants could adversely affect the availability, quality and cost of items we use and the operations of our restaurants. Such shortages or disruptions could be caused by inclement weather, natural disasters, inaccurate forecasting of customer demand, problems in production or distribution, restrictions on imports or exports, the inability of vendors to obtain credit, political instability in the countries in which suppliers and distributors are located, the financial instability of suppliers and distributors, suppliers’ or distributors’ failure to meet our standards, product quality issues, inflation, other factors relating to the suppliers and distributors and the countries in which they are located, food safety warnings or advisories or the prospect of such pronouncements, the cancellation of supply or distribution agreements or an inability to renew such arrangements or to find replacements on commercially reasonable terms, or other conditions beyond our control or the control of our Concepts’ franchisees. In the U.S., the Company, along with representatives of the Company’s KFC, Pizza Hut and Taco Bell franchisee groups, are members of Restaurant Supply Chain Solutions, LLC (“RSCS"), which is responsible for purchasing certain restaurant products and equipment. Any failure or inability of RSCS to perform its purchasing obligations could result in shortages or interruptions in the availability of food and other supplies.
A shortage or interruption in the availability of certain food products or supplies could increase costs and limit the availability of products critical to restaurant operations, which in turn could lead to restaurant closures and/or a decrease in sales. In addition, failure by a key supplier or distributor for our Concepts and/or our Concepts’ franchisees to meet its service requirements could lead to a disruption of service or supply until a new supplier or distributor is engaged, and any disruption could have an adverse effect on our business.
We may not achieve our target development goals, aggressive development could cannibalize existing sales and new restaurants may not be profitable.
Our growth strategy depends on our and our Concepts’ franchisees’ ability to increase our net restaurant count in markets around the world, especially in emerging markets. The successful development of new units depends in large part on the ability of our Concepts’ franchisees to open new restaurants and to operate these restaurants profitably. We cannot guarantee that we, or our Concepts’ franchisees, including Yum China, will be able to achieve our expansion goals or that new restaurants will be operated profitably. Further, there is no assurance that any new restaurant will produce operating results similar to those of our existing restaurants. Other risks that could impact our ability to increase the number of our restaurants include prevailing economic conditions and trade or economic sanctions and our, or our Concepts’ franchisees’, ability to obtain suitable restaurant locations, negotiate acceptable lease or purchase terms for the locations, obtain required permits and approvals in a timely manner, hire and train qualified restaurant crews and meet construction schedules.
Expansion into target markets could also be affected by our Concepts’ franchisees’ ability to obtain financing to construct and open new restaurants. If it becomes more difficult or more expensive for our Concepts’ franchisees to obtain financing to develop new restaurants, the expected growth of our system could slow and our future revenues and operating cash flows could be adversely impacted.
In addition, the development of new restaurants could impact the sales of our Concepts’ existing restaurants nearby. There can be no assurance that sales cannibalization will not occur or become more significant in the future as we increase our presence in existing markets.
Labor shortages or difficulty finding qualified employees could slow our growth, harm our business and reduce our profitability.
Restaurant operations are highly service-oriented and our success depends in part upon our and our Concepts’ franchisees’ ability to attract, retain and motivate a sufficient number of qualified employees, including restaurant managers and other crew members. The market for qualified employees in our industry is very competitive. Any future inability to recruit and retain qualified individuals may delay the planned openings of new restaurants by us and our Concepts’ franchisees and could adversely impact operation of our Concepts’ existing restaurants. Any such delays, material increases in employee turnover rate in existing restaurants or widespread employee dissatisfaction could have a material adverse effect on our and our Concepts’ franchisees’ business and results of operations.
In addition, strikes, work slowdowns or other job actions may become more common. In the event of a strike, work slowdown or other labor unrest, the ability to adequately staff our Concepts’ restaurants could be impaired, which could result in reduced revenue and customer claims, and may distract our management from focusing on our business and strategic priorities.
11
Changes in labor and other operating costs could adversely affect our results of operations.
An increase in the costs of employee wages, benefits and insurance (including workers’ compensation, general liability, property and health) as well as other operating costs such as rent and energy costs could adversely affect our operating results. Such increases could result from government imposition of higher minimum wages or from general economic or competitive conditions. Any increase in such operating expenses could adversely affect our and our Concepts’ franchisees’ profit margins. In addition, competition for qualified employees could also compel us or our Concepts’ franchisees to pay higher wages to attract or retain key crew members, which could result in higher labor costs and decreased profitability.
The standard for determining joint employer status could adversely affect our business operations and increase our liabilities resulting from actions by our Concepts’ franchisees.
The National Labor Relations Board’s (the “NLRB”) standard for determining when two or more otherwise unrelated employers may be found to be a joint employer of the same employees under the National Labor Relations Act is uncertain and subject to change. In addition, the general counsel’s office of the NLRB has issued complaints naming McDonald’s Corporation as a joint employer of workers at its franchisees for alleged violations of the U.S. Fair Labor Standards Act. The NLRB’s joint employer liability standard could cause us or our Concepts to be liable or held responsible for unfair labor practices, violations of wage and hour laws, and other violations and could also require our Concepts to conduct collective bargaining negotiations regarding employees of our Concepts’ franchisees. Further, there is no assurance that we or our Concepts will not receive similar complaints as McDonald’s Corporation in the future, which could result in legal proceedings based on the actions of our Concepts’ franchisees. In such events, our operating expenses may increase as a result of required modifications to our business practices, increased litigation, governmental investigations or proceedings, administrative enforcement actions, fines and civil liability.
An increase in food prices may have an adverse impact on our and our Concepts’ franchisees’ profit margins.
Our and our Concepts’ franchisees’ businesses depend on reliable sources of large quantities of raw materials such as proteins (including poultry, pork, beef and seafood), cheese, oil, flour and vegetables (including potatoes and lettuce). Raw materials purchased for use in our Concepts’ restaurants are subject to price volatility caused by any fluctuation in aggregate supply and demand, or other external conditions, such as weather conditions or natural events or disasters that affect expected harvests of such raw materials. As a result, the historical prices of raw materials used in the operation of our Concepts’ restaurants have fluctuated. We cannot assure you that we or our Concepts’ franchisees will continue to be able to purchase raw materials at reasonable prices, or that the cost of raw materials will remain stable in the future. In addition, a significant increase in gasoline prices could result in the imposition of fuel surcharges by our distributors.
Because we and our Concepts’ franchisees provide competitively priced food, we may not have the ability to pass through to our customers the full amount of any commodity price increases. If we and our Concepts’ franchisees are unable to manage the cost of raw materials or to increase the prices of products proportionately, our and our franchisees’ profit margins may be adversely impacted.
Our Concepts’ brands may be limited or diluted through franchisee and third-party activity.
Although we monitor and regulate franchisee activities through our Concepts’ franchise agreements, franchisees or other third parties may refer to or make statements about our Concepts’ brands that do not make proper use of our trademarks or required designations, that improperly alter trademarks or branding, or that are critical of our Concepts’ brands or place our Concepts’ brands in a context that may tarnish their reputation. This may result in dilution of, or harm to, our intellectual property or the value of our Concepts’ brands.
Franchisee noncompliance with the terms and conditions of our franchise agreements may reduce the overall goodwill of our Concepts’ brands, whether through the failure to meet health and safety standards, engage in quality control or maintain product consistency, or through the participation in improper or objectionable business practices. Moreover, unauthorized third parties, including our Concepts’ current and former franchisees, may use our intellectual property to trade on the goodwill of our Concepts’ brands, resulting in consumer confusion or dilution. Any reduction of our Concepts’ brands’ goodwill, consumer confusion, or dilution is likely to impact sales, and could materially and adversely impact our business and results of operations.
Our success depends substantially on our corporate reputation and on the value and perception of our brands.
Our success depends in large part upon our ability and our Concepts’ franchisees’ ability to maintain and enhance the value of our brands and our customers’ loyalty to our brands. Brand value is based in part on consumer perceptions on a variety of subjective
12
qualities. Business incidents, whether isolated or recurring, and whether originating from us, franchisees, competitors, suppliers or distributors, can significantly reduce brand value and consumer trust, particularly if the incidents receive considerable publicity or result in litigation. For example, our Concepts’ brands could be damaged by claims or perceptions about the quality or safety of our products or the quality or reputation of our suppliers, distributors or franchisees, regardless of whether such claims or perceptions are true. Similarly, entities in our supply chain may engage in conduct, including alleged human rights abuses or environmental wrongdoing, and any such conduct could damage our or our Concepts’ brands’ reputations. Any such incidents (even if resulting from actions of a competitor or franchisee) could cause a decline directly or indirectly in consumer confidence in, or the perception of, our Concepts’ brands and/or our products and reduce consumer demand for our products, which would likely result in lower revenues and profits. Additionally, our corporate reputation could suffer from a real or perceived failure of corporate governance or misconduct by a Company officer, or an employee or representative of us or a franchisee.
We could be party to litigation that could adversely affect us by increasing our expenses, diverting management attention or subjecting us to significant monetary damages and other remedies.
We are regularly involved in legal proceedings, which include consumer, employment, real estate related, tort, intellectual property, breach of contract, securities, derivative and other litigation. See the discussion of legal proceedings in Note 20 to the Consolidated Financial Statements included in Item 8 of this Form 10-K. Plaintiffs in these types of lawsuits often seek recovery of very large or indeterminate amounts, and the magnitude of the potential loss relating to such lawsuits may not be accurately estimated. Regardless of whether any such claims have merit, or whether we are ultimately held liable or settle, such litigation may be expensive to defend and may divert resources and management attention away from our operations and negatively impact reported earnings. With respect to insured claims, a judgment for monetary damages in excess of any insurance coverage could adversely affect our financial condition or results of operations. Any adverse publicity resulting from these allegations may also adversely affect our reputation, which in turn could adversely affect our results of operations.
In addition, the restaurant industry around the world has been subject to claims that relate to the nutritional content of food products, as well as claims that the menus and practices of restaurant chains have led to customer health issues, including weight gain and other adverse effects. These concerns could lead to an increase in the regulation of the content or marketing of our products. We may also be subject to such claims in the future and, even if we are not, publicity about these matters (particularly directed at the quick service and fast-casual segments of the retail food industry) may harm our reputation and adversely affect our business, financial condition and results of operations.
Changes in, or noncompliance with, governmental regulations may adversely affect our business operations, growth prospects or financial condition.
Our Concepts and their franchisees are subject to numerous laws and regulations around the world. These laws change regularly and are increasingly complex. For example, we are subject to:
|
•
|
The Americans with Disabilities Act in the U.S. and similar state laws that give civil rights protections to individuals with disabilities in the context of employment, public accommodations and other areas.
|
|
•
|
The U.S. Fair Labor Standards Act, which governs matters such as minimum wages, overtime and other working conditions, as well as family leave mandates and a variety of similar state laws that govern these and other employment law matters.
|
|
•
|
Laws and regulations in government-mandated health care benefits such as the Patient Protection and Affordable Care Act.
|
|
•
|
Laws and regulations relating to nutritional content, nutritional labeling, product safety, product marketing and menu labeling.
|
|
•
|
Laws relating to state and local licensing.
|
|
•
|
Laws relating to the relationship between franchisors and franchisees.
|
|
•
|
Laws and regulations relating to health, sanitation, food, workplace safety, child labor, including laws prohibiting the use of certain “hazardous equipment” by employees younger than the age of 18 years of age, and fire safety and prevention.
|
|
•
|
Laws and regulations relating to union organizing rights and activities.
|
|
•
|
Laws relating to information security, privacy (including the European Union's GDPR, which will become effective in May 2018), cashless payments, and consumer protection.
|
|
•
|
Laws relating to currency conversion or exchange.
|
|
•
|
Laws relating to international trade and sanctions.
|
|
•
|
Tax laws and regulations.
|
|
•
|
Anti-bribery and anti-corruption laws.
|
|
•
|
Environmental laws and regulations.
|
|
•
|
Federal and state immigration laws and regulations in the U.S.
|
13
Compliance with new or existing laws and regulations could impact our or our Concepts’ franchisees’ operations. The compliance costs associated with these laws and regulations could be substantial. Any failure or alleged failure to comply with these laws or regulations could adversely affect our reputation, international expansion efforts, growth prospects and financial results or result in, among other things, litigation, revocation of required licenses, internal investigations, governmental investigations or proceedings, administrative enforcement actions, fines and civil and criminal liability. Publicity relating to any such noncompliance could also harm our reputation and adversely affect our revenues.
Failure to comply with anti-bribery or anti-corruption laws could adversely affect our business operations.
The U.S. Foreign Corrupt Practices Act, the UK Bribery Act and other similar applicable laws prohibiting bribery of government officials and other corrupt practices are the subject of increasing emphasis and enforcement around the world. Although we have implemented policies and procedures designed to promote compliance with these laws, there can be no assurance that our employees, contractors, agents or other third parties will not take actions in violation of our policies or applicable law, particularly as we expand our operations in emerging markets and elsewhere. Any such violations or suspected violations could subject us to civil or criminal penalties, including substantial fines and significant investigation costs, and could also materially damage our reputation, brands, international expansion efforts and growth prospects, business and operating results. Publicity relating to any noncompliance or alleged noncompliance could also harm our reputation and adversely affect our revenues and results of operations.
Tax matters, including changes in tax rates or laws, disagreements with taxing authorities and imposition of new taxes could impact our results of operations and financial condition.
We are subject to income taxes as well as non-income based taxes, such as payroll, sales, use, value-added, net worth, property, withholding and franchise taxes in both the U.S. and various foreign jurisdictions. We are also subject to ongoing and/or regular reviews, examinations and audits by the U.S. Internal Revenue Service (“IRS”) and other taxing authorities with respect to such income and non-income based taxes inside and outside of the U.S. In connection with the Organisation for Economic Co-operation and Development’s Base Erosion and Profit Shifting project, companies are now required to disclose more information to tax authorities on their global operations, which may lead to greater audit scrutiny of profits earned in various countries. Our accruals for tax liabilities are based on past experience, interpretations of applicable law, and judgments about potential actions by tax authorities, but because such accruals require significant judgment the ultimate resolution of any tax matters may result in payments greater than the amounts accrued. If the IRS or another taxing authority disagrees with our tax positions, we could face additional tax liabilities, including interest and penalties. Payment of additional amounts upon final settlement or adjudication of any disputes could have a material impact on our results of operations and financial position.
In addition, we are directly and indirectly affected by new tax laws and regulation and the interpretation of tax laws and regulations worldwide. Changes in laws, regulation or interpretation of existing laws and regulations in the U.S. and other jurisdictions where we are subject to taxation could increase our taxes and have an adverse effect on our results of operations and financial condition.
On December 22, 2017, the U.S. government enacted comprehensive Federal tax legislation commonly referred to as the Tax Cuts and Jobs Act of 2017 (the “Tax Act”) which significantly modifies the U.S. corporate income tax system. Due to the timing of the enactment and the complexity involved in applying the provisions of the Tax Act, we have made reasonable estimates of its effects and recorded provisional amounts for the year ended December 31, 2017, consistent with applicable SEC guidance. (See details of the charge we recorded upon enactment of the Tax Act in Note 18 to the Consolidated Financial Statements included in Item 8 of this Form 10-K.) These provisional amounts include a one-time mandatory deemed repatriation tax on accumulated foreign earnings, the remeasurement of certain net deferred tax assets and liabilities and the establishment of a valuation allowance on our foreign tax credits. We are continuing to evaluate the Tax Act and its requirements, as well as its application to our business and its impact on our ongoing effective tax rate. The final impacts of the Tax Act may differ from current estimates and provisional amounts recorded, possibly materially, due to, among other things, changes in interpretations of the Tax Act, changes in accounting standards for income taxes or related accounting interpretations in response to the Tax Act, or updates or changes to estimates the Company has utilized to calculate the provisional impacts.
The Yum China spin-off and certain related transactions could result in substantial U.S. tax liability.
We received opinions of outside counsel substantially to the effect that, for U.S. federal income tax purposes, the Yum China spin-off and certain related transactions qualified as generally tax-free under Sections 355 and 361 of the U.S. Internal Revenue Code. The opinions relied on various facts and assumptions, as well as certain representations as to factual matters and undertakings (including with respect to future conduct) made by Yum China and us. If any of these facts, assumptions, representations or undertakings are incorrect or not satisfied, we may not be able to rely on these opinions of outside counsel. Accordingly, notwithstanding receipt of the opinions of outside counsel, the conclusions reached in the tax opinions may be challenged by the
14
IRS. Because the opinions are not binding on the IRS or the courts, there can be no assurance that the IRS or the courts will not prevail in any such challenge.
If, notwithstanding receipt of any opinion, the IRS were to conclude that the Yum China spin-off was taxable, in general, we would recognize taxable gain as if we had sold the Yum China common stock in a taxable sale for its fair market value. In addition, each U.S. holder of our Common Stock who received shares of Yum China common stock in connection with the spin-off transaction would generally be treated as having received a taxable distribution of property in an amount equal to the fair market value of the shares of Yum China common stock received. That distribution would be taxable to each such U.S. stockholder as a dividend to the extent of our current and accumulated earnings and profits. For each such U.S. stockholder, any amount that exceeded our earnings and profits would be treated first as a non-taxable return of capital to the extent of such stockholder’s tax basis in our shares of Common Stock with any remaining amount being taxed as a capital gain.
The Yum China spin-off may be subject to China indirect transfer tax.
In February 2015, the Chinese State Administration of Taxation (“SAT”) issued the Bulletin on Several Issues of Enterprise Income Tax on Income Arising from Indirect Transfers of Property by Non-resident Enterprises (“Bulletin 7”). Pursuant to Bulletin 7, an “indirect transfer” of Chinese taxable assets, including equity interests in a China resident enterprise (“Chinese interests”), by a non-resident enterprise, may be recharacterized and treated as a direct transfer of Chinese taxable assets, if such arrangement does not have reasonable commercial purpose and the transferor has avoided payment of Chinese enterprise income tax. Using general anti-tax avoidance provisions, the SAT may treat an indirect transfer as a direct transfer of Chinese interests if the transfer has avoided Chinese tax by way of an arrangement without reasonable commercial purpose. As a result, gains derived from such indirect transfer may be subject to Chinese enterprise income tax, and the transferee or other person who is obligated to pay for the transfer would be obligated to withhold the applicable taxes, currently at a rate of up to 10% of the capital gain in the case of an indirect transfer of equity interests in a China resident enterprise.
We evaluated the potential applicability of Bulletin 7 in connection with the Separation in the form of a tax free restructuring and believe it is more likely than not that Bulletin 7 does not apply. We believe that the restructuring has reasonable commercial purpose.
However, there are significant uncertainties regarding what constitutes a reasonable commercial purpose, how the safe harbor provisions for group restructurings are to be interpreted and how the Chinese tax authorities will ultimately view the spin-off. As a result, our position could be challenged by the Chinese tax authorities resulting in a tax at a rate of 10% assessed on the difference between the fair market value and the tax basis of Yum China. As our tax basis in Yum China was minimal, the amount of such a tax could be significant and have a material adverse effect on our results of operations and our financial condition.
Failure to protect our service marks or other intellectual property could harm our business.
We regard our Yum®, KFC®, Pizza Hut® and Taco Bell® service marks, and other service marks and trademarks related to our restaurant businesses, as having significant value and being important to our marketing efforts. We rely on a combination of protections provided by contracts, copyrights, patents, trademarks, service marks and other common law rights, such as trade secret and unfair competition laws, to protect our restaurants and services from infringement. We have registered certain trademarks and service marks in the U.S. and foreign jurisdictions. However, from time to time we become aware of names and marks identical or confusingly similar to our service marks being used by other persons. Although our policy is to oppose any such infringement, further or unknown unauthorized uses or other misappropriation of our trademarks or service marks could diminish the value of our brands and adversely affect our business. In addition, effective intellectual property protection may not be available in every country in which our Concepts have, or intend to open or franchise, a restaurant. There can be no assurance that these protections will be adequate, and defending or enforcing our service marks and other intellectual property could result in the expenditure of significant resources. We may also face claims of infringement that could interfere with the use of the proprietary know-how, concepts, recipes, or trade secrets used in our business. Defending against such claims may be costly, and we may be prohibited from using such proprietary information in the future or forced to pay damages, royalties, or other fees for using such proprietary information, any of which could negatively affect our business, reputation, financial condition, and results of operations.
15
Our business may be adversely impacted by changes in consumer discretionary spending and general economic conditions.
Purchases at our Concepts’ restaurants are discretionary for consumers and, therefore, our results of operations are susceptible to economic slowdowns and recessions. Our results of operations are dependent upon discretionary spending by consumers, which may be affected by general economic conditions globally or in one or more of the markets we serve. Some of the factors that impact discretionary consumer spending include unemployment rates, fluctuations in the level of disposable income, the price of gasoline, stock market performance and changes in the level of consumer confidence. These and other macroeconomic factors could have an adverse effect on our sales, profitability or development plans, which could harm our financial condition and operating results.
The retail food industry in which we operate is highly competitive.
The retail food industry in which we operate is highly competitive with respect to price and quality of food products, new product development, digital engagement, advertising levels and promotional initiatives, customer service, reputation, restaurant location, and attractiveness and maintenance of properties. If consumer or dietary preferences change, if our marketing efforts are unsuccessful, or if our Concepts’ restaurants are unable to compete successfully with other retail food outlets in new and existing markets, our business could be adversely affected. We also face growing competition as a result of convergence in grocery, convenience, deli and restaurant services, including the offering by the grocery industry of convenient meals, including pizzas and entrees with side dishes. Competition from delivery aggregators and other food delivery services has also increased in recent years, particularly in urbanized areas, and is expected to continue to increase. Increased competition could have an adverse effect on our sales, profitability or development plans, which could harm our financial condition and operating results.
Our substantial indebtedness makes us more sensitive to adverse economic conditions, may limit our ability to plan for or respond to significant changes in our business, and requires a significant amount of cash to service our debt payment obligations that we may be unable to generate or obtain.
In connection with the announcement of our strategic transformation plans, we have increased our indebtedness from approximately $4 billion to approximately $10 billion. The proceeds from the debt were primarily used to return capital to shareholders through share repurchases and dividends. Subject to the limits contained in the agreements governing our indebtedness, we may be able to incur additional debt from time to time, which would intensify the risks related to our high level of indebtedness.
Specifically, our high level of indebtedness could have important potential consequences, including, but not limited to:
|
•
|
increasing our vulnerability to, and reducing our flexibility to plan for and respond to, adverse economic and industry conditions and changes in our business and the competitive environment;
|
|
•
|
requiring the dedication of a substantial portion of our cash flow from operations to the payment of principal of, and interest on, indebtedness, thereby reducing the availability of such cash flow to fund working capital, capital expenditures, acquisitions, dividends, share repurchases or other corporate purposes;
|
|
•
|
increasing our vulnerability to a further downgrade of our credit rating, which could adversely affect our cost of funds, liquidity and access to capital markets;
|
|
•
|
restricting us from making strategic acquisitions or causing us to make non-strategic divestitures;
|
|
•
|
placing us at a disadvantage compared to other less leveraged competitors or competitors with comparable debt at more favorable interest rates;
|
|
•
|
increasing our exposure to the risk of increased interest rates insofar as current and future borrowings are subject to variable rates of interest;
|
|
•
|
making it more difficult for us to repay, refinance or satisfy our obligations with respect to our debt;
|
|
•
|
limiting our ability to borrow additional funds in the future and increasing the cost of any such borrowing;
|
|
•
|
imposing restrictive covenants on our operations, which, if not complied with, could result in an event of default, which in turn, if not cured or waived, could result in the acceleration of the applicable debt, and may result in the acceleration of any other debt to which a cross-acceleration or cross-default provision applies; and
|
|
•
|
increasing our exposure to risks related to fluctuations in foreign currency as we earn profits in a variety of currencies around the world and our debt is denominated in U.S. dollars.
|
There is no assurance that we will generate cash flow from operations or that future debt or equity financings will be available to us to enable us to pay our indebtedness or to fund other liquidity needs. If our business does not generate sufficient cash flow from operation in the amounts projected or at all, or if future borrowings are not available to us in amounts sufficient to pay our indebtedness or to fund other liquidity needs, our financial condition and results of operations may be adversely affected. As a result, we may need to refinance all or a portion of our indebtedness on or before maturity. There is no assurance that we will be
16
able to refinance any of our indebtedness on favorable terms, or at all. Any inability to generate sufficient cash flow or refinance our indebtedness on favorable terms could have a material adverse effect on our business and financial condition.
|
Item 1B.
|
Unresolved Staff Comments.
|
The Company has received no written comments regarding its periodic or current reports from the staff of the Securities and Exchange Commission that were issued 180 days or more preceding the end of its
2017
fiscal year and that remain unresolved.
|
Item 2.
|
Properties.
|
As of year end
2017
, the Company’s Concepts owned land, building or both for 580 units and leased land, building or both for 901 properties worldwide in connection with the operation of Company-owned restaurants. These units are further detailed as follows:
|
•
|
The KFC Division owned land, building or both for 184 units and leased land, building or both for 484 units.
|
|
•
|
The Pizza Hut Division owned land, building or both for 9 units and leased land, building or both for 151 units.
|
|
•
|
The Taco Bell Division owned land, building or both for 387 units and leased land, building or both for 266 units.
|
The Company currently owns or leases land, building or both related to approximately 900 units, not included in the property counts above, that it leases or subleases to franchisees, principally in the U.S., United Kingdom, Germany, Australia and France.
Company-owned restaurants in the U.S. with leases are generally leased for initial terms of 15 or 20 years and generally have renewal options; however, Pizza Hut delivery/carryout units in the U.S. generally are leased for significantly shorter initial terms with shorter renewal options. Company-owned restaurants outside the U.S. with leases have initial lease terms and renewal options that vary by country.
The KFC Division and Pizza Hut Division corporate headquarters and a KFC and Pizza Hut research facility in Plano, Texas are owned by Pizza Hut. Taco Bell leases its corporate headquarters and research facility in Irvine, California. The YUM corporate headquarters and a KFC research facility in Louisville, Kentucky are owned by KFC. Additional information about the Company’s properties is included in the Consolidated Financial Statements in Part II, Item 8.
The Company believes that its properties are generally in good operating condition and are suitable for the purposes for which they are being used.
|
Item 3.
|
Legal Proceedings
.
|
The Company is subject to various lawsuits covering a variety of allegations. The Company believes that the ultimate liability, if any, in excess of amounts already provided for these matters in the Consolidated Financial Statements, is not likely to have a material adverse effect on the Company’s annual results of operations, financial condition or cash flows. Matters faced by the Company include, but are not limited to, claims from franchisees, suppliers, employees, customers and others related to operational, contractual or employment issues as well as claims that the Company has infringed on third-party intellectual property rights. In addition, the Company brings claims from time-to-time relating to infringement of, or challenges to, our intellectual property, including registered marks. Finally, as a publicly-traded company, disputes arise from time-to-time with our shareholders, including allegations that the Company breached federal securities laws or that officers and/or directors breached fiduciary duties. Descriptions of significant current specific claims and contingencies, if any, appear in Note 20, Contingencies, to the Consolidated Financial Statements included in Part II, Item 8, which is incorporated by reference into this item.
17
|
Item 4.
|
Mine Safety Disclosures.
|
Not applicable.
Executive Officers of the Registrant.
The executive officers of the Company as of February 21, 2018, and their ages and current positions as of that date are as follows:
Greg Creed
, 60, is Chief Executive Officer of YUM. He has served in this position since January 2015. He served as Chief Executive Officer of Taco Bell Division from January 2014 to December 2014 and as Chief Executive Officer of Taco Bell U.S. from 2011 to December 2013. Prior to this position, Mr. Creed served as President and Chief Concept Officer of Taco Bell U.S., a position he held beginning in December 2006.
Roger Eaton
, 57, is Chief Executive Officer of KFC Division, a position he has held since August 2015. Prior to that, he served as President of KFC Division from January 2014 to August 2015 and as Chief Operations Officer of YUM from November 2011 to August 2015. Prior to these positions, Mr. Eaton served as Chief Executive Officer of KFC U.S. and YUM Operational Excellence Officer from February 2011 to November 2011.
David Gibbs
, 54, is President and Chief Financial Officer of YUM. He has served in this position since May 2016. Prior to this position, he served as Chief Executive Officer of Pizza Hut Division from January 2015 to April 2016. From January 2014 to December 2014, Mr. Gibbs served as President of Pizza Hut U.S. Prior to this position, Mr. Gibbs served as President and Chief Financial Officer of Yum! Restaurants International, Inc. (“YRI”) from May 2012 through December 2013. Mr. Gibbs served as Chief Financial Officer of YRI from January 2011 to April 2012. He was Chief Financial Officer of Pizza Hut U.S. from September 2005 to December 2010.
Marc Kesselman
, 46, is General Counsel, Corporate Secretary and Chief Government Affairs Officer of YUM. He has served as General Counsel and Corporate Secretary of YUM since February 2016 and as Chief Government Affairs Officer since November 2016. Mr. Kesselman joined YUM from Dean Foods where he held the position of Executive Vice President, General Counsel, Corporate Secretary & Government Affairs from January 2015 to January 2016. Prior to this position, he worked at PepsiCo from January 2009 to January 2015, most recently serving as Senior Vice President and General Counsel of PepsiCo Americas Foods & Frito Lay North America. From May 2006 to December 2008 he served as General Counsel of the United States Department of Agriculture.
David Russell
, 48, is Senior Vice President, Finance and Corporate Controller of YUM. He has served as YUM's Corporate Controller since February 2011 and as Senior Vice President, Finance since February 2017. Prior to serving as Corporate Controller, Mr. Russell served in various positions at the Vice President-level in the Yum Finance Department, including Controller-Designate from November 2010 to February 2011 and Vice President, Assistant Controller from January 2008 to December 2010.
Tracy Skeans,
45,
is Chief Transformation and People Officer of YUM. She has served as Chief People Officer since January 2016 and Chief Transformation Officer since November 2016. From January 2015 to December 2015, she was President of Pizza Hut International. Prior to this position, Ms. Skeans served as Chief People Officer of Pizza Hut Division from December 2013 to December 2014 and Chief People Officer of Pizza Hut U.S. from October 2011 to November 2013. From June 2006 to September 2011, she served as Director of Human Resources for Pizza Hut U.S.
Executive officers are elected by and serve at the discretion of the Board of Directors.
18
|
Item 5.
|
Market for the Registrant’s Common Stock, Related Stockholder Matters and Issuer Purchases of Equity Securities.
|
The Company’s Common Stock trades under the symbol YUM and is listed on the New York Stock Exchange ("NYSE"). The following sets forth the high and low NYSE composite closing sale prices by quarter for the Company’s Common Stock and dividends per common share. On October 31, 2016 (the "Distribution Date"), we completed the spin-off of our China business (the "Separation") into an independent, publicly-traded company under the name Yum China Holdings, Inc. ("Yum China"). On the Distribution Date we distributed to each of our shareholders of record as of the close of business on October 19, 2016 (the "Record Date"), one share of Yum China common stock for each share of our Common Stock held as of the Record Date. Stock prices prior to November 1, 2016, do not reflect any adjustment for the impact of the Separation.
|
2017
|
||||||||||||
|
Quarter
|
High
|
Low
|
Dividends
Declared
|
|||||||||
|
First
|
$
|
68.65
|
|
$
|
63.18
|
|
$
|
0.30
|
|
|||
|
Second
|
74.82
|
|
63.55
|
|
0.30
|
|
||||||
|
Third
|
77.80
|
|
72.65
|
|
—
|
|
||||||
|
Fourth
|
83.47
|
|
73.75
|
|
0.30
|
|
||||||
|
2016 (As Restated)
(a)
|
||||||||||||
|
Quarter
|
High
|
Low
|
Dividends
Declared
|
|||||||||
|
First
|
$
|
82.25
|
|
$
|
65.24
|
|
$
|
0.46
|
|
|||
|
Second
|
85.90
|
|
79.33
|
|
0.46
|
|
||||||
|
Third
|
91.26
|
|
83.04
|
|
0.51
|
|
||||||
|
Fourth (to October 31)
|
90.92
|
|
85.36
|
|
—
|
|
||||||
|
Fourth (from November 1)
|
64.74
|
|
59.70
|
|
0.30
|
|
||||||
In 2017, the Company paid four cash dividends of $0.30 per share. This included a dividend distributed February 3, 2017, that had been declared on December 21, 2016, which was the first dividend declared subsequent to the Separation of the Company's China business. Over the long term, the Company targets an annual dividend payout ratio of 45% to 50% of net income, before Special Items.
As of February 14, 2018, there were 49,843 registered holders of record of the Company’s Common Stock.
|
(a)
|
Stock price information presented for 2016 is now reflective of our current reporting calendar. See Note 2 to the Consolidated Financial Statements in Item 8 of this Form 10-K for discussion of the change in our reporting calendar.
|
19
Issuer Purchases of Equity Securities
The following table provides information as of
December 31, 2017
, with respect to shares of Common Stock repurchased by the Company during the quarter then ended.
|
Fiscal Periods
|
Total number
of shares
purchased
(thousands)
|
Average price
paid per share
|
Total number of shares
purchased as part of
publicly announced plans
or programs
(thousands)
|
Approximate dollar value
of shares that may yet be
purchased under the plans
or programs
(millions)
|
||||||||
|
10/1/17 - 10/31/17
|
2,686
|
$
|
75.47
|
|
2,686
|
$
|
385
|
|
||||
|
11/1/17- 11/30/17
|
3,162
|
$
|
79.68
|
|
3,162
|
$
|
1,633
|
|
||||
|
12/1/17 - 12/31/17
|
1,603
|
$
|
82.95
|
|
1,603
|
$
|
1,500
|
|
||||
|
Total
|
7,451
|
$
|
78.87
|
|
7,451
|
$
|
1,500
|
|
||||
On November 16, 2017, our Board of Directors authorized share repurchases through December 2018 of up to
$1.5 billion
(excluding applicable transaction fees) of our outstanding Common Stock. As of December 31, 2017, we have remaining capacity to repurchase up to
$1.5 billion
of Common Stock under this authorization.
20
Stock Performance Graph
This graph compares the cumulative total return of our Common Stock to the cumulative total return of the S&P 500 Index and the S&P 500 Consumer Discretionary Sector Index, a peer group that includes YUM, for the period from December 31, 2012 to December 29, 2017, the last trading day of our 2017 fiscal year. The graph assumes that the value of the investment in our Common Stock and each index was $100 at December 31, 2012 and that all cash dividends were reinvested.
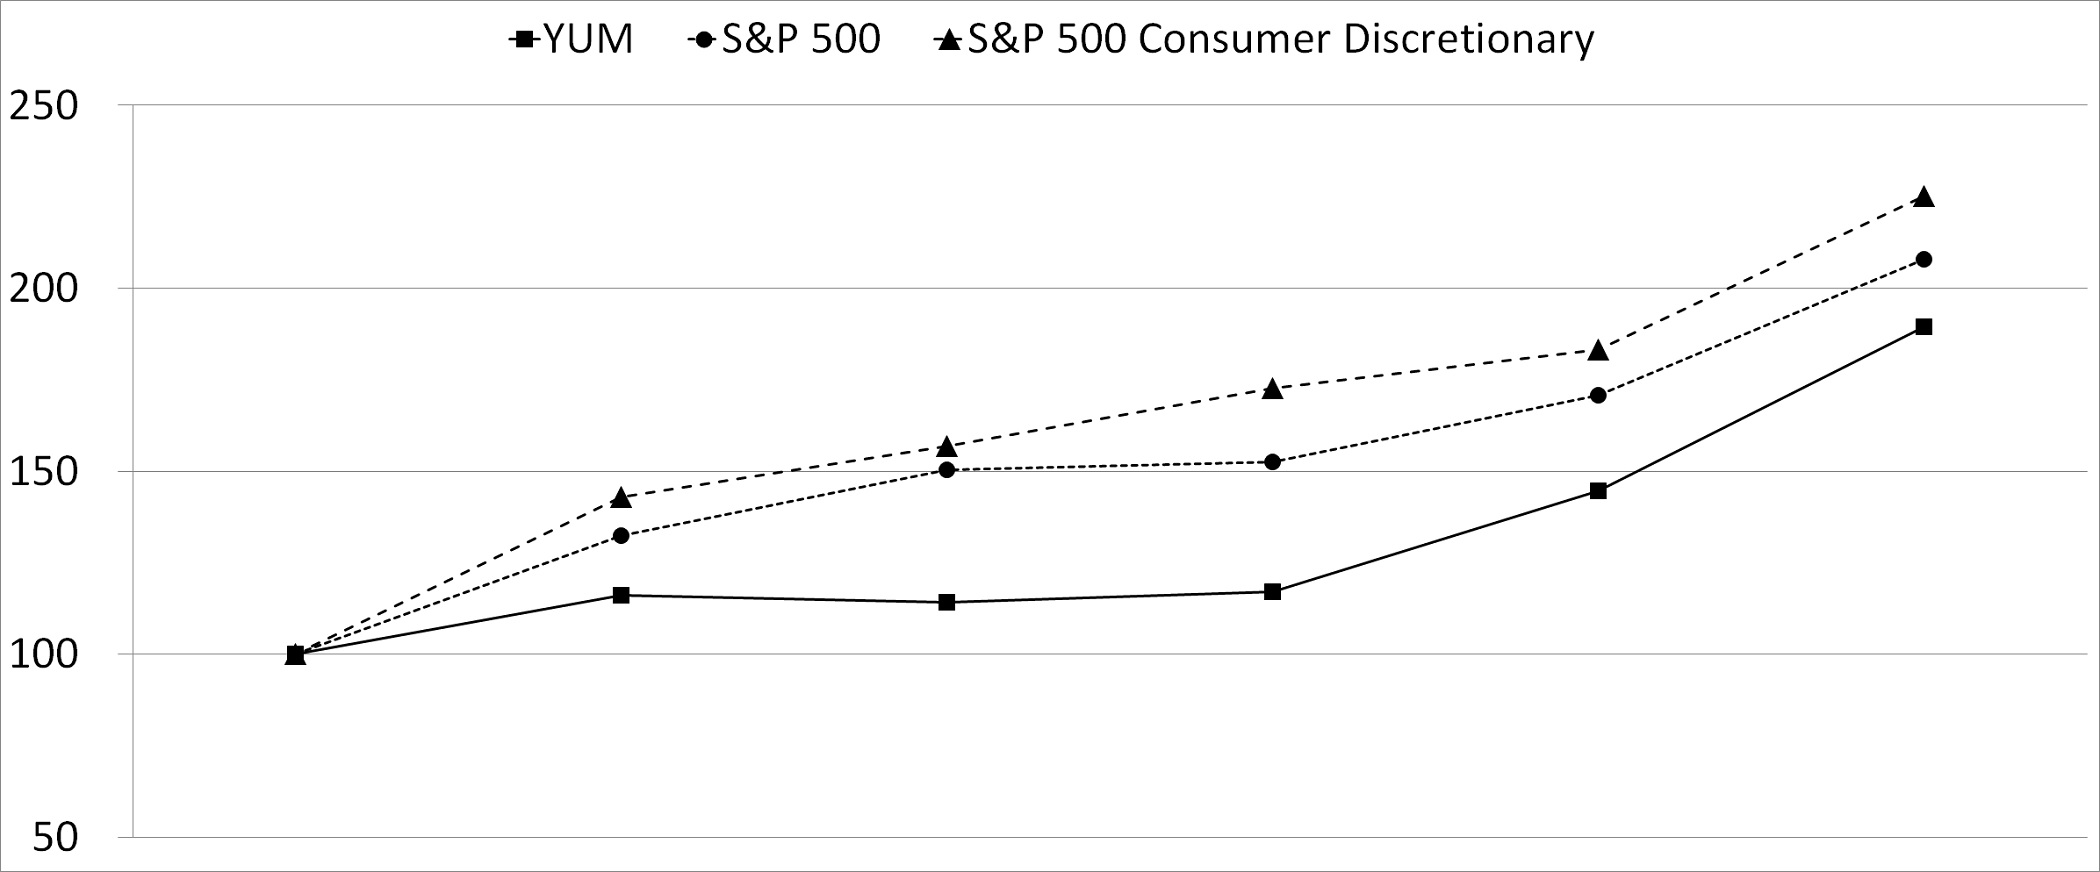
|
12/31/2012
|
12/31/2013
|
12/31/2014
|
12/31/2015
|
12/30/2016
|
12/29/2017
|
|||||||||||||||||||
|
YUM
|
$
|
100
|
|
$
|
116
|
|
$
|
114
|
|
$
|
117
|
|
$
|
145
|
|
$
|
190
|
|
||||||
|
S&P 500
|
$
|
100
|
|
$
|
132
|
|
$
|
150
|
|
$
|
153
|
|
$
|
171
|
|
$
|
208
|
|
||||||
|
S&P Consumer Discretionary
|
$
|
100
|
|
$
|
143
|
|
$
|
157
|
|
$
|
173
|
|
$
|
183
|
|
$
|
225
|
|
||||||
Source: Bloomberg
21
|
Item 6.
|
Selected Financial Data.
|
Selected Financial Data
YUM! Brands, Inc. and Subsidiaries
(in millions, except per share and unit amounts)
|
|
Fiscal Year
|
||||||||||||||||||
|
|
2017
|
2016
(a)(d)
|
2015
(a)
|
2014
(a)
|
2013
(a)
|
||||||||||||||
|
Income Statement Data
|
|||||||||||||||||||
|
Revenues
|
|||||||||||||||||||
|
Company sales
|
$
|
3,572
|
|
$
|
4,189
|
|
$
|
4,336
|
|
$
|
4,503
|
|
$
|
4,384
|
|
||||
|
Franchise and license fees and income
|
2,306
|
|
2,167
|
|
2,082
|
|
2,084
|
|
2,033
|
|
|||||||||
|
Total
|
5,878
|
|
6,356
|
|
6,418
|
|
6,587
|
|
6,417
|
|
|||||||||
|
Refranchising (gain) loss
(b)
|
(1,083
|
)
|
(163
|
)
|
23
|
|
(16
|
)
|
(95
|
)
|
|||||||||
|
Operating Profit
(b)
|
2,761
|
|
1,682
|
|
1,434
|
|
1,517
|
|
1,530
|
|
|||||||||
|
Other pension (income) expense
(b)
|
47
|
|
32
|
|
40
|
|
N/A
|
|
N/A
|
|
|||||||||
|
Interest expense, net
(b)
|
440
|
|
305
|
|
141
|
|
143
|
|
251
|
|
|||||||||
|
Income from continuing operations before income taxes
(b)
|
2,274
|
|
1,345
|
|
1,253
|
|
1,374
|
|
1,279
|
|
|||||||||
|
Income from continuing operations
(b)
|
1,340
|
|
1,018
|
|
926
|
|
1,006
|
|
922
|
|
|||||||||
|
Income from discontinued operations, net of tax
|
N/A
|
|
625
|
|
357
|
|
45
|
|
169
|
|
|||||||||
|
Net Income
(b)
|
1,340
|
|
1,643
|
|
1,283
|
|
1,051
|
|
1,091
|
|
|||||||||
|
Basic earnings per common share from continuing operations
(b)
|
3.86
|
|
2.58
|
|
2.13
|
|
2.27
|
|
2.04
|
|
|||||||||
|
Basic earnings per common share from discontinued operations
|
N/A
|
|
1.59
|
|
0.82
|
|
0.10
|
|
0.37
|
|
|||||||||
|
Basic earnings per common share
(b)
|
3.86
|
|
4.17
|
|
2.95
|
|
2.37
|
|
2.41
|
|
|||||||||
|
Diluted earnings per common share from continuing operations
(b)
|
3.77
|
|
2.54
|
|
2.09
|
|
2.22
|
|
2.00
|
|
|||||||||
|
Diluted earnings per common share from discontinued operations
|
N/A
|
|
1.56
|
|
0.81
|
|
0.10
|
|
0.36
|
|
|||||||||
|
Diluted earnings per common share
(b)
|
3.77
|
|
4.10
|
|
2.90
|
|
2.32
|
|
2.36
|
|
|||||||||
|
Diluted earnings per common share from continuing operations excluding Special Items
(c)
|
2.96
|
|
2.46
|
|
2.31
|
|
2.20
|
|
2.04
|
|
|||||||||
|
Cash Flow Data
|
|||||||||||||||||||
|
Provided by operating activities
|
$
|
1,030
|
|
$
|
1,248
|
|
$
|
1,260
|
|
$
|
1,217
|
|
$
|
1,289
|
|
||||
|
Capital spending
|
318
|
|
427
|
|
442
|
|
508
|
|
481
|
|
|||||||||
|
Proceeds from refranchising of restaurants
|
1,773
|
|
370
|
|
213
|
|
83
|
|
250
|
|
|||||||||
|
Repurchase shares of Common Stock
|
1,960
|
|
5,403
|
|
1,200
|
|
820
|
|
770
|
|
|||||||||
|
Dividends paid on Common Stock
|
416
|
|
744
|
|
730
|
|
669
|
|
615
|
|
|||||||||
|
Balance Sheet Data
|
|||||||||||||||||||
|
Total assets
|
$
|
5,311
|
|
$
|
5,453
|
|
$
|
4,939
|
|
$
|
5,073
|
|
$
|
4,975
|
|
||||
|
Long-term debt
|
9,429
|
|
9,059
|
|
2,988
|
|
3,003
|
|
2,888
|
|
|||||||||
|
Total debt
|
9,804
|
|
9,125
|
|
3,908
|
|
3,268
|
|
2,958
|
|
|||||||||
|
Other Data
|
|||||||||||||||||||
|
Number of stores at year end
|
|||||||||||||||||||
|
Franchise
|
43,603
|
|
40,834
|
|
39,320
|
|
37,959
|
|
36,746
|
|
|||||||||
|
Company
|
1,481
|
|
2,841
|
|
3,163
|
|
3,279
|
|
3,071
|
|
|||||||||
|
System
|
45,084
|
|
43,675
|
|
42,483
|
|
41,238
|
|
39,817
|
|
|||||||||
|
System Sales
(c)
|
|||||||||||||||||||
|
KFC Division system sales
|
24,515
|
|
23,242
|
|
22,628
|
|
23,458
|
|
23,147
|
|
|||||||||
|
Reported growth
|
5
|
%
|
3
|
%
|
(3
|
)%
|
1
|
%
|
(2
|
)%
|
|||||||||
|
Growth in local currency
|
6
|
%
|
7
|
%
|
5
|
%
|
4
|
%
|
—
|
%
|
|||||||||
|
Pizza Hut Division system sales
|
12,034
|
|
12,019
|
|
11,999
|
|
12,106
|
|
11,948
|
|
|||||||||
|
Reported growth
|
—
|
%
|
—
|
%
|
(1
|
)%
|
1
|
%
|
3
|
%
|
|||||||||
|
Growth in local currency
|
1
|
%
|
2
|
%
|
3
|
%
|
2
|
%
|
4
|
%
|
|||||||||
|
Taco Bell Division system sales
|
10,145
|
|
9,660
|
|
9,102
|
|
8,459
|
|
8,107
|
|
|||||||||
|
Reported growth
|
5
|
%
|
6
|
%
|
8
|
%
|
4
|
%
|
4
|
%
|
|||||||||
|
Growth in local currency
|
5
|
%
|
6
|
%
|
8
|
%
|
4
|
%
|
4
|
%
|
|||||||||
|
Shares outstanding at year end
|
332
|
|
355
|
|
420
|
|
434
|
|
443
|
|
|||||||||
|
Cash dividends declared per Common Share
|
$
|
0.90
|
|
$
|
1.73
|
|
$
|
1.74
|
|
$
|
1.56
|
|
$
|
1.41
|
|
||||
|
Market price per share at year end
(e)
|
$
|
81.61
|
|
$
|
63.33
|
|
$
|
73.05
|
|
$
|
73.14
|
|
$
|
73.87
|
|
||||
22
|
(a)
|
Selected financial data for years 2016 and 2015 has been recast to present the change in our reporting calendar and retroactively adopting a new accounting standard related to the presentation of net periodic pension cost and net periodic postretirement benefit cost (collectively,"Benefit Costs"). See Notes 2 and 5 to the Consolidated Financial Statements in Item 8 of this Form 10-K for discussion related to adopting a new accounting standard on Benefit Costs and the change in our reporting calendar, respectively. 2014 reflects our Balance Sheet and store count data that were recast for purposes of presenting 2015 Consolidated Statement of Cash Flows and unit growth. No other data presented in 2014 or 2013 has been recast.
|
|
(b)
|
Includes amounts deemed as Special Items for some or all years presented. See discussion of our 2017, 2016 and 2015 Special Items in our Management's Discussion and Analysis ("MD&A"). Special Items in 2014 positively impacted Operating Profit by $16 million, primarily due to Refranchising gains. Special Items in 2013 positively impacted Operating Profit by $73 million, primarily due to Refranchising gains, partially offset by $10 million in pension settlement charges and $5 million of expense related to U.S. productivity initiatives and realignment of resources. Additionally, in 2013, we incurred $118 million of premiums paid and other costs related to the extinguishment of debt that were considered Special Items and were recorded in Interest expense, net. Special Items resulted in cumulative net tax benefits of $23 million 2013.
|
|
(c)
|
These non-GAAP measures are discussed in further detail in our MD&A.
|
|
(d)
|
Fiscal years for our U.S. and certain international subsidiaries that operate on a weekly periodic calendar include 52 weeks in 2017, 2015, 2014 and 2013 and 53 weeks in 2016. Refer to Note 2 for additional details related to our fiscal calendar.
|
|
(e)
|
Historical stock prices prior to November 1, 2016, do not reflect any adjustment for the impact of the Separation.
|
The selected financial data should be read in conjunction with the Consolidated Financial Statements.
23
|
Item 7.
|
Management’s Discussion and Analysis of Financial Condition and Results of Operations.
|
Introduction and Overview
The following Management’s Discussion and Analysis (“MD&A”), should be read in conjunction with the Consolidated Financial Statements (“Financial Statements”) in Item 8 and the Forward-Looking Statements and the Risk Factors set forth in Item 1A. All Note references herein refer to the Notes to the Financial Statements. Tabular amounts are displayed in millions of U.S. dollars except per share and unit count amounts, or as otherwise specifically identified. Unless otherwise stated, financial results herein reflect continuing operations of the Company. Percentages may not recompute due to rounding.
YUM! Brands, Inc. (“YUM” or the “Company”) operates or franchises a worldwide system of over 45,000 restaurants in more than 135 countries and territories, under the concepts of KFC, Pizza Hut and Taco Bell (collectively, the "Concepts"). These three Concepts are global leaders of the chicken, pizza and Mexican-style food categories, respectively. Of the over 45,000 restaurants, 3% are operated by the Company and its subsidiaries and 97% are operated by franchisees.
As of December 31, 2017, YUM consists of three operating segments:
|
•
|
The KFC Division which includes our worldwide operations of the KFC concept
|
|
•
|
The Pizza Hut Division which includes our worldwide operations of the Pizza Hut concept
|
|
•
|
The Taco Bell Division which includes our worldwide operations of the Taco Bell concept
|
On October 31, 2016 (the “Distribution Date”), we completed the spin-off of our China business (the "Separation") into an independent, publicly-traded company under the name of Yum China Holdings, Inc. (“Yum China”). Concurrent with the Separation, a subsidiary of the Company entered into a Master License Agreement with a subsidiary of Yum China for the exclusive right to use and sublicense the use of intellectual property owned by YUM and its affiliates for the development and operation of KFC, Pizza Hut and Taco Bell restaurants in China. Prior to the Separation, our operations in mainland China were reported in our former China Division segment results. As a result of the Separation, the results of operations and cash flows of the separated business are presented as discontinued operations in our Consolidated Statements of Income and Consolidated Statements of Cash Flows for periods prior to the Separation. See additional information related to the impact of the Separation in Note 4.
On October 11, 2016, we announced our strategic transformation plans to drive global expansion of our KFC, Pizza Hut and Taco Bell brands (“YUM’s Strategic Transformation Initiatives”) following the Separation. Major features of the Company’s transformation and growth strategy involve being more focused, franchised and efficient. YUM’s Strategic Transformation Initiatives below represent the continuation of YUM’s transformation of its operating model and capital structure.
|
•
|
More Focused. Four growth drivers form the basis of YUM’s strategic plans and repeatable business model to accelerate same-store sales growth and net-new restaurant development at KFC, Pizza Hut and Taco Bell around the world over the long term. The Company is focused on becoming best-in-class in:
|
|
•
|
Building Distinctive, Relevant and Easy Brands
|
|
•
|
Developing Unmatched Franchise Operating Capability
|
|
•
|
Driving Bold Restaurant Development
|
|
•
|
Growing Unrivaled Culture and Talent
|
|
•
|
More Franchised. YUM intends franchise restaurant ownership to be at least 98% by the end of 2018.
|
|
•
|
More Efficient. The Company is revamping its financial profile, improving the efficiency of its organization and cost structure globally, by:
|
|
•
|
Reducing annual capital expenditures to approximately $100 million in 2019;
|
|
•
|
Lowering General and administrative expenses ("G&A") to 1.7% of system sales in 2019; and
|
|
•
|
Maintaining an optimized capital structure of ~5.0x Earnings Before Interest, Taxes, Depreciation and Amortization (“EBITDA”) leverage.
|
From 2017 through 2019, we intend to return an additional $6.5 - $7.0 billion to shareholders through share repurchases and cash dividends. We intend to fund these shareholder returns through a combination of refranchising proceeds, free cash flow generation and maintenance of our five times EBITDA leverage. We anticipate generating proceeds in excess of $2 billion, net of tax, through our refranchising initiatives. Refer to the Liquidity and Capital Resources section of this MD&A for additional details.
24
Beginning in 2017, we changed our fiscal year from a year ending on the last Saturday of December to a year beginning on January 1 and ending on December 31 of each year. Concurrently, we removed the reporting lags from the fiscal calendars of our international subsidiaries. Our MD&A has been recast to reflect the change in our reporting calendar. See Notes 2 and 5 for additional details related to our fiscal calendar.
We intend for this MD&A to provide the reader with information that will assist in understanding our results of operations, including performance metrics that management uses to assess the Company's performance. Throughout this MD&A, we commonly discuss the following performance metrics:
|
•
|
Same-store sales growth is the estimated percentage change in sales of all restaurants that have been open and in the YUM system for one year or more.
|
|
•
|
Net new units represents new unit openings, offset by store closures.
|
|
•
|
Company restaurant profit ("Restaurant profit") is defined as Company sales less expenses incurred directly by our Company-owned restaurants in generating Company sales. Company restaurant margin as a percentage of sales is defined as Restaurant profit divided by Company sales. Within the Company sales and Restaurant profit sections of this MD&A, Store Portfolio Actions represent the net impact of new unit openings, acquisitions, refranchising and store closures, and Other primarily represents the impact of same-store sales as well as the impact of changes in costs such as inflation/deflation.
|
|
•
|
Operating margin is Operating Profit divided by Total revenues.
|
In addition to the results provided in accordance with Generally Accepted Accounting Principles in the United States of America ("GAAP"), the Company provides the following non-GAAP measurements.
|
•
|
System sales, System sales excluding the impacts of foreign currency translation ("FX"), and System sales excluding FX and the impact of the 53rd week in 2016. System sales include the results of all restaurants regardless of ownership, including Company-owned and franchise restaurants that operate our Concepts. Sales of franchise restaurants typically generate ongoing franchise and license fees for the Company at a rate of 3% to 6% of sales. Franchise restaurant sales are not included in Company sales on the Consolidated Statements of Income; however, the franchise and license fees are included in the Company’s revenues. We believe System sales growth is useful to investors as a significant indicator of the overall strength of our business as it incorporates all of our revenue drivers, Company and franchise same-store sales as well as net unit growth.
|
|
•
|
Diluted Earnings Per Share from Continuing Operations excluding Special Items (as defined below);
|
|
•
|
Effective Tax Rate excluding Special Items;
|
|
•
|
Core Operating Profit and Core Operating Profit excluding the impact of the 53rd week in 2016. Core Operating Profit excludes Special Items and FX and we use Core Operating Profit for the purposes of evaluating performance internally.
|
These non-GAAP measurements are not intended to replace the presentation of our financial results in accordance with GAAP. Rather, the Company believes that the presentation of these non-GAAP measurements provide additional information to investors to facilitate the comparison of past and present operations, excluding items that the Company does not believe are indicative of our ongoing operations due to their size and/or nature.
Special Items are not included in any of our Division segment results as our chief operating decision maker does not consider the impact of these items when assessing segment performance.
Certain non-GAAP measurements are presented excluding the impact of FX. These amounts are derived by translating current year results at prior year average exchange rates. We believe the elimination of the FX impact provides better year-to-year comparability without the distortion of foreign currency fluctuations.
We provide Core Operating Profit excluding 53rd week and System sales excluding 53rd week to further enhance the comparability with the lapping of the 53rd week that was part of our fiscal calendar in 2016.
25
Results of Operations
Summary
All comparisons within this summary are versus the same period a year ago and include the impact of lapping a 53
rd
week in 2016, unless otherwise noted.
For 2017, GAAP diluted EPS from continuing operations increased 48% to $3.77 per share, and diluted EPS from continuing operations excluding Special Items, increased 20% to $2.96 per share.
2017 financial highlights:
|
% Change
|
|||||||||
|
System Sales, Ex FX
|
Same-Store Sales
|
Net New Units
|
GAAP Operating Profit
|
Core Operating Profit
|
|||||
|
KFC Division
|
+6
|
+3
|
+4
|
+13
|
+12
|
||||
|
Pizza Hut Division
|
+1
|
Even
|
+2
|
(7)
|
(6)
|
||||
|
Taco Bell Division
|
+5
|
+4
|
+4
|
+4
|
+4
|
||||
|
Worldwide
|
+4
|
+2
|
+3
|
+64
|
+7
|
||||
|
Results Excluding 53
rd
Week in 2016
(% Change)
|
|||
|
System Sales, Ex FX
|
Core Operating Profit
|
||
|
KFC Division
|
+6
|
+14
|
|
|
Pizza Hut Division
|
+2
|
(5)
|
|
|
Taco Bell Division
|
+7
|
+6
|
|
|
Worldwide
|
+5
|
+9
|
|
Additionally:
|
•
|
During the year, we opened 1,407 net new units for 3% net new unit growth.
|
|
•
|
During the year, we refranchised 1,470 restaurants, including 828 KFC, 389 Pizza Hut and 253 Taco Bell units, for pre-tax proceeds of $1.8 billion. We recorded net refranchising gains of $1.1 billion in Special Items.
|
|
•
|
During the year, we repurchased 26.6 million shares totaling $1.9 billion at an average share price of $72.
|
26
Worldwide
GAAP Results
|
|
Amount
|
% B/(W)
|
|||||||||||||||||||
|
|
2017
|
2016
|
2015
|
2017
|
2016
|
||||||||||||||||
|
Company sales
|
$
|
3,572
|
|
$
|
4,189
|
|
$
|
4,336
|
|
|
(15
|
)
|
|
(3
|
)
|
||||||
|
Franchise and license fees and income
|
2,306
|
|
2,167
|
|
2,082
|
|
|
6
|
|
|
4
|
|
|||||||||
|
Total revenues
|
$
|
5,878
|
|
$
|
6,356
|
|
$
|
6,418
|
|
|
(8
|
)
|
|
(1
|
)
|
||||||
|
Restaurant profit
|
$
|
618
|
|
$
|
700
|
|
$
|
709
|
|
|
(12
|
)
|
|
(1
|
)
|
|
|||||
|
Restaurant margin %
|
17.3
|
%
|
16.7
|
%
|
16.3
|
%
|
0.6
|
|
ppts.
|
0.4
|
|
ppts.
|
|||||||||
|
G&A expenses
|
$
|
999
|
|
$
|
1,129
|
|
$
|
1,058
|
|
12
|
|
(7
|
)
|
||||||||
|
Franchise and license expenses
|
237
|
|
201
|
|
240
|
|
(18
|
)
|
16
|
|
|||||||||||
|
Closures and impairment expenses
|
3
|
|
15
|
|
16
|
|
82
|
|
8
|
|
|||||||||||
|
Refranchising (gain) loss
|
(1,083
|
)
|
(163
|
)
|
23
|
|
NM
|
|
NM
|
|
|||||||||||
|
Other (income) expense
|
7
|
|
3
|
|
20
|
|
(103
|
)
|
83
|
|
|||||||||||
|
Operating Profit
|
$
|
2,761
|
|
$
|
1,682
|
|
$
|
1,434
|
|
|
64
|
|
|
17
|
|
|
|||||
|
Other pension (income) expense
|
47
|
|
32
|
|
40
|
|
(45
|
)
|
18
|
|
|||||||||||
|
Interest expense, net
|
440
|
|
305
|
|
141
|
|
|
(44
|
)
|
|
NM
|
|
|
||||||||
|
Income tax provision
|
934
|
|
327
|
|
327
|
|
|
NM
|
|
—
|
|
|
|||||||||
|
Income from continuing operations
|
1,340
|
|
1,018
|
|
926
|
|
32
|
|
10
|
|
|||||||||||
|
Income from discontinued operations, net of tax
|
N/A
|
|
625
|
|
357
|
|
NM
|
|
75
|
|
|||||||||||
|
Net Income
|
$
|
1,340
|
|
$
|
1,643
|
|
$
|
1,283
|
|
|
(18
|
)
|
|
28
|
|
|
|||||
|
Diluted EPS from continuing operations
(a)
|
$
|
3.77
|
|
$
|
2.54
|
|
$
|
2.09
|
|
48
|
|
22
|
|
||||||||
|
Diluted EPS from discontinued operations
(a)
|
N/A
|
|
$
|
1.56
|
|
$
|
0.81
|
|
NM
|
|
93
|
|
|||||||||
|
Diluted EPS
(a)
|
$
|
3.77
|
|
$
|
4.10
|
|
$
|
2.90
|
|
|
(8
|
)
|
|
42
|
|
|
|||||
|
Effective tax rate - continuing operations
|
41.1%
|
24.3%
|
26.1%
|
|
(16.8
|
)
|
ppts.
|
1.8
|
|
ppts.
|
|||||||||||
|
(a)
|
See Note 3 for the number of shares used in these calculations.
|
Performance Metrics
|
% Increase (Decrease)
|
||||||||||||||
|
Unit Count
|
2017
|
2016
|
2015
|
2017
|
2016
|
|||||||||
|
Franchise
|
43,603
|
|
40,834
|
|
39,320
|
|
7
|
|
4
|
|
||||
|
Company-owned
|
1,481
|
|
2,841
|
|
3,163
|
|
(48
|
)
|
(10
|
)
|
||||
|
45,084
|
|
43,675
|
|
42,483
|
|
3
|
|
3
|
|
|||||
27
|
% B/(W)
|
||||||
|
2017
|
2016
|
|||||
|
System Sales Growth, reported
|
4
|
|
3
|
|
||
|
System Sales Growth, excluding FX
|
4
|
|
5
|
|
||
|
System Sales Growth, excluding FX and 53
rd
week
|
5
|
|
4
|
|
||
|
Same-Store Sales Growth
|
2
|
|
1
|
|
||
|
Non-GAAP Items
|
||||||
|
Core Operating Profit Growth
|
7
|
|
11
|
|
||
|
Core Operating Profit Growth, excluding 53
rd
week
|
9
|
|
9
|
|
||
|
Diluted EPS from Continuing Operations, excluding Special Items
|
20
|
|
7
|
|
||
Extra Week in 2016 (As Restated)
Fiscal 2016 included a 53
rd
week for all of our U.S. businesses and certain of our non-U.S. businesses that report 13 four-week periods versus 12 months. See Notes 2 and 5 for additional details related to our fiscal calendar. The following table summarizes the estimated impact of the 53
rd
week on Revenues and Operating Profit for the year ended December 31, 2016:
|
KFC Division
|
Pizza Hut Division
|
Taco Bell Division
|
Total
|
||||||||||||
|
Revenues
|
|||||||||||||||
|
Company sales
|
$
|
26
|
|
$
|
5
|
|
$
|
24
|
|
$
|
55
|
|
|||
|
Franchise and license fees and income
|
8
|
|
6
|
|
7
|
|
21
|
|
|||||||
|
Total revenues
|
$
|
34
|
|
$
|
11
|
|
$
|
31
|
|
$
|
76
|
|
|||
|
Operating Profit
|
|||||||||||||||
|
Franchise and license fees and income
|
$
|
8
|
|
$
|
6
|
|
$
|
7
|
|
$
|
21
|
|
|||
|
Restaurant profit
|
6
|
|
1
|
|
7
|
|
14
|
|
|||||||
|
G&A expenses
|
(3
|
)
|
(2
|
)
|
(2
|
)
|
(7
|
)
|
|||||||
|
Operating Profit
|
$
|
11
|
|
$
|
5
|
|
$
|
12
|
|
$
|
28
|
|
|||
28
Non-GAAP Items
Non-GAAP Items, along with the reconciliation to the most comparable GAAP financial measure, are presented below.
|
|
Year
|
|||||||||||
|
Detail of Special Items
|
2017
|
2016
|
2015
|
|||||||||
|
Refranchising gain (loss) (See Note 5)
|
$
|
1,083
|
|
$
|
163
|
|
$
|
(19
|
)
|
|||
|
YUM's Strategic Transformation Initiatives
(See Note 5)
|
(23
|
)
|
(67
|
)
|
—
|
|
||||||
|
Costs associated with Pizza Hut U.S. Transformation Agreement (See Note 5)
|
(31
|
)
|
—
|
|
—
|
|
||||||
|
Costs associated with KFC U.S. Acceleration Agreement (See Note 5)
|
(17
|
)
|
(26
|
)
|
(72
|
)
|
||||||
|
Non-cash charges associated with share-based compensation
(See Note 5)
|
(18
|
)
|
(30
|
)
|
—
|
|
||||||
|
Other Special Items Income (Expense)
|
7
|
|
(5
|
)
|
—
|
|
||||||
|
Special Items Income (Expense) - Operating Profit
|
1,001
|
|
35
|
|
(91
|
)
|
||||||
|
Special Items - Other Pension Income (Expense) (See Note 5)
|
(23
|
)
|
(26
|
)
|
—
|
|
||||||
|
Special Items Income (Expense) from Continuing Operations before Income Taxes
|
978
|
|
9
|
|
(91
|
)
|
||||||
|
Tax Benefit (Expense) on Special Items
(a)
|
(256
|
)
|
24
|
|
(4
|
)
|
||||||
|
Tax (Expense) - U.S. Tax Act
(a)
|
(434
|
)
|
—
|
|
—
|
|
||||||
|
Special Items Income (Expense), net of tax
|
$
|
288
|
|
$
|
33
|
|
$
|
(95
|
)
|
|||
|
Average diluted shares outstanding
|
355
|
|
400
|
|
443
|
|
||||||
|
Special Items diluted EPS
|
$
|
0.81
|
|
$
|
0.08
|
|
$
|
(0.22
|
)
|
|||
|
Reconciliation of GAAP Operating Profit to Core Operating Profit and Core Operating Profit, excluding 53
rd
Week
|
||||||||||||
|
Consolidated
|
||||||||||||
|
GAAP Operating Profit
|
$
|
2,761
|
|
$
|
1,682
|
|
$
|
1,434
|
|
|||
|
Special Items Income (Expense) - Operating Profit
|
1,001
|
|
35
|
|
(91
|
)
|
||||||
|
Foreign Currency Impact on Divisional Operating Profit
(b)
|
—
|
|
(47
|
)
|
N/A
|
|
||||||
|
Core Operating Profit
|
$
|
1,760
|
|
$
|
1,694
|
|
$
|
1,525
|
|
|||
|
Impact of 53
rd
Week
|
N/A
|
|
28
|
|
N/A
|
|
||||||
|
Core Operating Profit, excluding 53
rd
Week
|
$
|
1,760
|
|
$
|
1,666
|
|
$
|
1,525
|
|
|||
|
KFC Division
|
||||||||||||
|
GAAP Operating Profit
|
$
|
981
|
|
$
|
871
|
|
$
|
835
|
|
|||
|
Foreign Currency Impact on Divisional Operating Profit
(b)
|
4
|
|
(41
|
)
|
N/A
|
|
||||||
|
Core Operating Profit
|
977
|
|
912
|
|
835
|
|
||||||
|
Impact of 53
rd
Week
|
N/A
|
|
11
|
|
N/A
|
|
||||||
|
Core Operating Profit, excluding 53
rd
Week
|
$
|
977
|
|
$
|
901
|
|
$
|
835
|
|
|||
|
Pizza Hut Division
|
||||||||||||
|
GAAP Operating Profit
|
$
|
341
|
|
$
|
367
|
|
$
|
351
|
|
|||
|
Foreign Currency Impact on Divisional Operating Profit
(b)
|
(4
|
)
|
(7
|
)
|
N/A
|
|
||||||
|
Core Operating Profit
|
345
|
|
374
|
|
351
|
|
||||||
|
Impact of 53
rd
Week
|
N/A
|
|
5
|
|
N/A
|
|
||||||
|
Core Operating Profit, excluding 53
rd
Week
|
$
|
345
|
|
$
|
369
|
|
$
|
351
|
|
|||
29
|
Taco Bell Division
|
||||||||||||
|
GAAP Operating Profit
|
$
|
619
|
|
$
|
595
|
|
$
|
546
|
|
|||
|
Foreign Currency Impact on Divisional Operating Profit
(b)
|
—
|
|
1
|
|
N/A
|
|
||||||
|
Core Operating Profit
|
619
|
|
594
|
|
546
|
|
||||||
|
Impact of 53
rd
Week
|
N/A
|
|
12
|
|
N/A
|
|
||||||
|
Core Operating Profit, excluding 53
rd
Week
|
$
|
619
|
|
$
|
582
|
|
$
|
546
|
|
|||
|
Reconciliation of Diluted EPS from Continuing Operations to Diluted EPS from Continuing Operations, excluding Special Items
|
||||||||||||
|
Diluted EPS from Continuing Operations
|
$
|
3.77
|
|
$
|
2.54
|
|
$
|
2.09
|
|
|||
|
Special Items Diluted EPS
|
0.81
|
|
0.08
|
|
(0.22
|
)
|
||||||
|
Diluted EPS from Continuing Operations excluding Special Items
|
$
|
2.96
|
|
$
|
2.46
|
|
$
|
2.31
|
|
|||
|
Reconciliation of GAAP Effective Tax Rate to Effective Tax Rate, excluding Special Items
|
||||||||||||
|
GAAP Effective Tax Rate
|
41.1
|
%
|
24.3
|
%
|
26.1
|
%
|
||||||
|
Impact on Tax Rate as a result of Special Items
(a)
|
22.3
|
%
|
(2.0
|
)%
|
2.1
|
%
|
||||||
|
Effective Tax Rate excluding Special Items
(c)
|
18.8
|
%
|
26.3
|
%
|
24.0
|
%
|
||||||
|
Reconciliation of GAAP Company sales to System sales
|
||||||||||||
|
Consolidated
|
||||||||||||
|
GAAP Company sales
(d)
|
$
|
3,572
|
|
$
|
4,189
|
|
$
|
4,336
|
|
|||
|
Franchise sales
|
43,122
|
|
40,732
|
|
39,393
|
|
||||||
|
System sales
|
46,694
|
|
44,921
|
|
43,729
|
|
||||||
|
Foreign Currency Impact on System sales
(e)
|
(90
|
)
|
(1,123
|
)
|
N/A
|
|
||||||
|
System sales, excluding FX
|
46,784
|
|
46,044
|
|
43,729
|
|
||||||
|
Impact of 53
rd
week
|
N/A
|
|
434
|
|
N/A
|
|
||||||
|
System sales, excluding FX and 53
rd
Week
|
$
|
46,784
|
|
$
|
45,610
|
|
$
|
43,729
|
|
|||
|
KFC Division
|
||||||||||||
|
GAAP Company sales
(d)
|
$
|
1,928
|
|
$
|
2,156
|
|
$
|
2,191
|
|
|||
|
Franchise sales
|
22,587
|
|
21,086
|
|
20,437
|
|
||||||
|
System sales
|
24,515
|
|
23,242
|
|
22,628
|
|
||||||
|
Foreign Currency Impact on System sales
(e)
|
(28
|
)
|
(858
|
)
|
N/A
|
|
||||||
|
System sales, excluding FX
|
24,543
|
|
24,100
|
|
22,628
|
|
||||||
|
Impact of 53
rd
week
|
N/A
|
|
165
|
|
N/A
|
|
||||||
|
System sales, excluding FX and 53
rd
Week
|
$
|
24,543
|
|
$
|
23,935
|
|
$
|
22,628
|
|
|||
|
Pizza Hut Division
|
||||||||||||
|
GAAP Company sales
(d)
|
$
|
285
|
|
$
|
493
|
|
$
|
601
|
|
|||
|
Franchise sales
|
11,749
|
|
11,526
|
|
11,398
|
|
||||||
|
System sales
|
12,034
|
|
12,019
|
|
11,999
|
|
||||||
|
Foreign Currency Impact on System sales
(e)
|
(66
|
)
|
(258
|
)
|
N/A
|
|
||||||
|
System sales, excluding FX
|
12,100
|
|
12,277
|
|
11,999
|
|
||||||
|
Impact of 53
rd
week
|
N/A
|
|
113
|
|
N/A
|
|
||||||
|
System sales, excluding FX and 53
rd
Week
|
$
|
12,100
|
|
$
|
12,164
|
|
$
|
11,999
|
|
|||
30
|
Taco Bell Division
|
||||||||||||
|
GAAP Company sales
(d)
|
$
|
1,359
|
|
$
|
1,540
|
|
$
|
1,544
|
|
|||
|
Franchise sales
|
8,786
|
|
8,120
|
|
7,558
|
|
||||||
|
System sales
|
10,145
|
|
9,660
|
|
9,102
|
|
||||||
|
Foreign Currency Impact on System sales
(e)
|
4
|
|
$
|
(7
|
)
|
N/A
|
|
|||||
|
System sales, excluding FX
|
10,141
|
|
9,667
|
|
9,102
|
|
||||||
|
Impact of 53
rd
week
|
N/A
|
|
156
|
|
N/A
|
|
||||||
|
System sales, excluding FX and 53
rd
Week
|
$
|
10,141
|
|
$
|
9,511
|
|
$
|
9,102
|
|
|||
|
(a)
|
The tax benefit (expense) was determined based upon the impact of the nature, as well as the jurisdiction of the respective individual components within Special Items. In 2016, our tax rate on Special Items was favorably impacted by the recognition of capital loss carryforwards in anticipation of U.S. refranchising gains. In 2015, our tax rate on Special Items was unfavorably impacted by the non-deductibility of certain losses associated with international refranchising. See Note 18.
|
|
(b)
|
The foreign currency impact on reported Operating Profit is presented in relation only to the immediately preceding year presented. When determining applicable Core Operating Profit Growth percentages, the Core Operating Profit for the current year should be compared to the prior year Operating Profit, prior to adjustment for the prior year FX impact.
|
|
(c)
|
Our 2017 Effective Tax Rate excluding Special Items was lower than prior years due primarily to the inclusion of tax expense on the repatriation of certain foreign earnings in 2017 being included in the one-time Special Items charge referenced in (a) above. The majority of our foreign entities have a tax year-end of November 30. Amounts repatriated from these foreign entities after November 30, 2017, which were significant due to the timing of international refranchising proceeds, were required to be taxed as part of the mandatory deemed repatriation tax in connection with the Tax Act. See Note 18.
|
|
(d)
|
Company Sales represents sales from our Company-operated stores as presented on our Consolidated Statements of Income.
|
|
(e)
|
The foreign currency impact on System sales is presented in relation only to the immediately preceding year presented. When determining applicable System sales growth percentages, the System sales excluding FX for the current year should be compared to the prior year System sales prior to adjustment for the prior year FX impact.
|
31
KFC Division
The KFC Division has 21,487 units, 81% of which are located outside the U.S. The KFC Division has experienced significant unit growth in emerging markets, which comprised approximately 60% of both the Division’s units and profits, respectively, as of the end of 2017. Additionally, 97% of the KFC Division units were operated by franchisees as of the end of 2017.
|
% B/(W)
|
% B/(W)
|
|||||||||||||||||||||||||||||||||||
|
2017
|
2016
|
|||||||||||||||||||||||||||||||||||
|
2017
|
2016
|
2015
|
Reported
|
Ex FX
|
Ex FX and 53
rd
Week in 2016
|
Reported
|
Ex FX
|
|
Ex FX and 53
rd
Week in 2016
|
|||||||||||||||||||||||||||
|
System Sales
|
$
|
24,515
|
|
$
|
23,242
|
|
$
|
22,628
|
|
5
|
|
6
|
|
6
|
|
3
|
|
7
|
|
|
6
|
|
|
|||||||||||||
|
Same-Store Sales Growth (Decline)
|
3
|
|
N/A
|
|
N/A
|
2
|
|
N/A
|
|
|
N/A
|
|
||||||||||||||||||||||||
|
|
|
|
||||||||||||||||||||||||||||||||||
|
Company sales
|
$
|
1,928
|
|
$
|
2,156
|
|
$
|
2,191
|
|
(11
|
)
|
(12
|
)
|
(11
|
)
|
(2
|
)
|
4
|
|
|
3
|
|
|
|||||||||||||
|
Franchise and license fees and income
|
1,182
|
|
1,069
|
|
1,031
|
|
11
|
|
10
|
|
11
|
|
4
|
|
7
|
|
|
7
|
|
|
||||||||||||||||
|
Total revenues
|
$
|
3,110
|
|
$
|
3,225
|
|
$
|
3,222
|
|
(4
|
)
|
(4
|
)
|
(3
|
)
|
—
|
|
5
|
|
|
4
|
|
|
|||||||||||||
|
|
|
|
||||||||||||||||||||||||||||||||||
|
Restaurant profit
|
$
|
289
|
|
$
|
317
|
|
$
|
307
|
|
(9
|
)
|
(10
|
)
|
(8
|
)
|
3
|
|
9
|
|
|
7
|
|
|
|||||||||||||
|
Restaurant margin %
|
15.0
|
%
|
14.7
|
%
|
14.0
|
%
|
0.3
|
|
ppts.
|
0.3
|
|
ppts.
|
0.4
|
|
ppts.
|
0.7
|
|
ppts.
|
0.7
|
|
ppts.
|
|
0.6
|
|
ppts.
|
|||||||||||
|
|
|
|
||||||||||||||||||||||||||||||||||
|
G&A expenses
|
$
|
370
|
|
$
|
396
|
|
$
|
395
|
|
7
|
|
7
|
|
7
|
|
—
|
|
(3
|
)
|
|
(3
|
)
|
|
|||||||||||||
|
Operating Profit
|
$
|
981
|
|
$
|
871
|
|
$
|
835
|
|
13
|
|
12
|
|
14
|
|
4
|
|
9
|
|
|
8
|
|
|
|||||||||||||
|
% Increase (Decrease)
|
||||||||||||||||
|
Unit Count
|
2017
|
2016
|
2015
|
2017
|
2016
|
|||||||||||
|
Franchise
|
20,819
|
|
19,236
|
|
18,473
|
|
8
|
4
|
|
|||||||
|
Company-owned
|
668
|
|
1,407
|
|
1,513
|
|
(53
|
)
|
(7
|
)
|
||||||
|
21,487
|
|
20,643
|
|
19,986
|
|
4
|
3
|
|
||||||||
|
2016
|
New Builds
|
Closures
|
Refranchised
|
Acquired
|
Other
|
2017
|
|||||||||||||||
|
Franchise
|
19,236
|
|
1,169
|
|
(414
|
)
|
828
|
|
—
|
|
—
|
|
20,819
|
|
|||||||
|
Company-owned
|
1,407
|
|
102
|
|
(13
|
)
|
(828
|
)
|
—
|
|
—
|
|
668
|
|
|||||||
|
Total
|
20,643
|
|
1,271
|
|
(427
|
)
|
—
|
|
—
|
|
—
|
|
21,487
|
|
|||||||
|
2015
|
New Builds
|
Closures
|
Refranchised
|
Acquired
|
Other
|
2016
|
|||||||||||||||
|
Franchise
|
18,473
|
|
994
|
|
(412
|
)
|
180
|
|
—
|
|
1
|
|
19,236
|
|
|||||||
|
Company-owned
|
1,513
|
|
114
|
|
(39
|
)
|
(180
|
)
|
—
|
|
(1
|
)
|
1,407
|
|
|||||||
|
Total
|
19,986
|
|
1,108
|
|
(451
|
)
|
—
|
|
—
|
|
—
|
|
20,643
|
|
|||||||
32
Company Sales and Restaurant Profit
The changes in Company sales and Restaurant profit were as follows:
|
2017 vs. 2016
|
|||||||||||||||||||||||
|
Income / (Expense)
|
2016
|
Store Portfolio Actions
|
Other
|
FX
|
53
rd
Week
|
2017
|
|||||||||||||||||
|
Company sales
|
$
|
2,156
|
|
$
|
(286
|
)
|
$
|
61
|
|
$
|
23
|
|
$
|
(26
|
)
|
$
|
1,928
|
|
|||||
|
Cost of sales
|
(733
|
)
|
93
|
|
(22
|
)
|
(11
|
)
|
9
|
|
(664
|
)
|
|||||||||||
|
Cost of labor
|
(507
|
)
|
69
|
|
(16
|
)
|
(3
|
)
|
6
|
|
(451
|
)
|
|||||||||||
|
Occupancy and other
|
(599
|
)
|
82
|
|
(7
|
)
|
(5
|
)
|
5
|
|
(524
|
)
|
|||||||||||
|
Company restaurant expenses
|
$
|
(1,839
|
)
|
$
|
244
|
|
$
|
(45
|
)
|
$
|
(19
|
)
|
$
|
20
|
|
$
|
(1,639
|
)
|
|||||
|
Restaurant profit
|
$
|
317
|
|
$
|
(42
|
)
|
$
|
16
|
|
$
|
4
|
|
$
|
(6
|
)
|
$
|
289
|
|
|||||
|
2016 vs. 2015
|
|||||||||||||||||||||||
|
Income / (Expense)
|
2015
|
Store Portfolio Actions
|
Other
|
FX
|
53
rd
Week
|
2016
|
|||||||||||||||||
|
Company sales
|
$
|
2,191
|
|
$
|
24
|
|
$
|
39
|
|
$
|
(124
|
)
|
$
|
26
|
|
$
|
2,156
|
|
|||||
|
Cost of sales
|
(751
|
)
|
(10
|
)
|
(7
|
)
|
44
|
|
(9
|
)
|
(733
|
)
|
|||||||||||
|
Cost of labor
|
(511
|
)
|
(3
|
)
|
(14
|
)
|
27
|
|
(6
|
)
|
(507
|
)
|
|||||||||||
|
Occupancy and other
|
(622
|
)
|
3
|
|
(10
|
)
|
35
|
|
(5
|
)
|
(599
|
)
|
|||||||||||
|
Company restaurant expenses
|
$
|
(1,884
|
)
|
$
|
(10
|
)
|
$
|
(31
|
)
|
$
|
106
|
|
$
|
(20
|
)
|
$
|
(1,839
|
)
|
|||||
|
Restaurant profit
|
$
|
307
|
|
$
|
14
|
|
$
|
8
|
|
$
|
(18
|
)
|
$
|
6
|
|
$
|
317
|
|
|||||
In 2017, the decreases in Company sales and Restaurant profit associated with store portfolio actions was driven by refranchising, partially offset by international net new unit growth. Significant other factors impacting Company sales and/or Restaurant profit were company same-store sales growth of 4%, partially offset by higher commodity and labor costs.
In 2016, the increase in Company sales associated with store portfolio actions was driven by international net new unit growth, partially offset by refranchising. The increase in Restaurant profit associated with store portfolio actions was driven by international net new unit growth. Significant other factors impacting Company sales and/or Restaurant profit were company same-store sales growth of 2%, partially offset by higher labor and commodity costs.
Franchise and License Fees and Income
In 2017, the increase in Franchise and license fees and income, excluding the impacts of foreign currency translation and lapping the 53
rd
week in 2016, was driven by international net new unit growth, franchise same-store sales growth of 3%, refranchising and higher renewal and transfer fees.
In 2016, the increase in Franchise and license fees and income, excluding the impacts of foreign currency translation and the 53
rd
week, was driven by international net new unit growth, franchise same-store sales growth of 2% and refranchising.
G&A
In 2017, the decrease in G&A, excluding the impacts of foreign currency translation and lapping the 53
rd
week in 2016, were driven by the positive impact of YUM's Strategic Transformation Initiatives , including reductions in G&A directly attributable to refranchising, partially offset by higher incentive compensation.
33
In 2016, the increase in G&A, excluding the impacts of foreign currency translation and 53
rd
week, were driven by the impact of higher compensation costs due to increased headcount and wage inflation in international markets and higher incentive compensation.
Operating Profit
In 2017, the increase in Operating Profit, excluding the impacts of foreign currency translation and lapping the 53
rd
week in 2016, was driven by same-store sales growth, international net new unit growth, lower G&A and higher renewal and transfer fees, partially offset by higher restaurant operating costs and refranchising.
In 2016, the increase in Operating Profit, excluding the impacts of foreign currency translation and 53
rd
week, was driven by international net new unit growth and same-store sales growth, partially offset by higher restaurant operating costs and advertising contributions associated with the KFC U.S. Acceleration Agreement.
Pizza Hut Division
The Pizza Hut Division has 16,748 units, 55% of which are located outside the U.S. The Pizza Hut Division operates as one brand that uses multiple distribution channels including delivery, dine-in and express (e.g. airports). Emerging markets comprised approximately 35% of units and 40% of profits for the Division as of the end of 2017. Additionally, 99% of the Pizza Hut Division units were operated by franchisees as of the end of 2017.
|
% B/(W)
|
% B/(W)
|
|||||||||||||||||||||||||||||||||||
|
2017
|
2016
|
|||||||||||||||||||||||||||||||||||
|
2017
|
2016
|
2015
|
Reported
|
Ex FX
|
Ex FX and 53
rd
Week in 2016
|
Reported
|
Ex FX
|
Ex FX and 53
rd
Week in 2016
|
||||||||||||||||||||||||||||
|
System Sales
|
$
|
12,034
|
|
$
|
12,019
|
|
$
|
11,999
|
|
—
|
|
1
|
|
2
|
|
—
|
|
2
|
|
1
|
|
|||||||||||||||
|
Same-Store Sales Growth (Decline)
|
Even
|
N/A
|
|
N/A
|
(2
|
)
|
N/A
|
|
N/A
|
|||||||||||||||||||||||||||
|
Company sales
|
$
|
285
|
|
$
|
493
|
|
$
|
601
|
|
(42
|
)
|
(42
|
)
|
(41
|
)
|
(18
|
)
|
(16
|
)
|
(17
|
)
|
|||||||||||||||
|
Franchise and license fees and income
|
608
|
|
615
|
|
604
|
|
(1
|
)
|
(1
|
)
|
—
|
|
2
|
|
4
|
|
3
|
|
||||||||||||||||||
|
Total revenues
|
$
|
893
|
|
$
|
1,108
|
|
$
|
1,205
|
|
(19
|
)
|
(19
|
)
|
(18
|
)
|
(8
|
)
|
(6
|
)
|
(7
|
)
|
|||||||||||||||
|
Restaurant profit
|
$
|
14
|
|
$
|
41
|
|
$
|
58
|
|
(63
|
)
|
(63
|
)
|
(62
|
)
|
(31
|
)
|
(31
|
)
|
(31
|
)
|
|||||||||||||||
|
Restaurant margin %
|
5.3
|
%
|
8.3
|
%
|
9.8
|
%
|
(3.0
|
)
|
ppts.
|
(3.0
|
)
|
ppts.
|
(2.9
|
)
|
ppts.
|
(1.5)
|
|
ppts.
|
(1.7)
|
|
ppts.
|
(1.7
|
)
|
ppts.
|
||||||||||||
|
G&A expenses
|
$
|
211
|
|
$
|
242
|
|
$
|
262
|
|
13
|
|
13
|
|
12
|
|
7
|
|
6
|
|
6
|
|
|||||||||||||||
|
Operating Profit
|
$
|
341
|
|
$
|
367
|
|
$
|
351
|
|
(7
|
)
|
(6
|
)
|
(5
|
)
|
4
|
|
6
|
|
5
|
|
|||||||||||||||
|
% Increase (Decrease)
|
||||||||||||||||
|
Unit Count
|
2017
|
2016
|
2015
|
2017
|
2016
|
|||||||||||
|
Franchise
|
16,588
|
|
15,871
|
|
15,334
|
|
5
|
4
|
|
|||||||
|
Company-owned
|
160
|
|
549
|
|
750
|
|
(71
|
)
|
(27
|
)
|
||||||
|
16,748
|
|
16,420
|
|
16,084
|
|
2
|
2
|
|
||||||||
34
|
2016
|
New Builds
|
Closures
|
Refranchised
|
Acquired
|
Other
|
2017
|
|||||||||||||||
|
Franchise
|
15,871
|
|
1,035
|
|
(708
|
)
|
389
|
|
—
|
|
1
|
|
16,588
|
|
|||||||
|
Company-owned
|
549
|
|
12
|
|
(12
|
)
|
(389
|
)
|
—
|
|
—
|
|
160
|
|
|||||||
|
Total
|
16,420
|
|
1,047
|
|
(720
|
)
|
—
|
|
—
|
|
1
|
|
16,748
|
|
|||||||
|
2015
|
New Builds
|
Closures
|
Refranchised
|
Acquired
|
Other
|
2016
|
|||||||||||||||
|
Franchise
|
15,334
|
|
885
|
|
(554
|
)
|
206
|
|
—
|
|
—
|
|
15,871
|
|
|||||||
|
Company-owned
|
750
|
|
40
|
|
(35
|
)
|
(206
|
)
|
—
|
|
—
|
|
549
|
|
|||||||
|
Total
|
16,084
|
|
925
|
|
(589
|
)
|
—
|
|
—
|
|
—
|
|
16,420
|
|
|||||||
Company Sales and Restaurant Profit
The changes in Company sales and Restaurant profit were as follows:
|
2017 vs. 2016
|
|||||||||||||||||||||||
|
Income / (Expense)
|
2016
|
Store Portfolio Actions
|
Other
|
FX
|
53
rd
Week
|
2017
|
|||||||||||||||||
|
Company sales
|
$
|
493
|
|
$
|
(193
|
)
|
$
|
(9
|
)
|
$
|
(1
|
)
|
$
|
(5
|
)
|
$
|
285
|
|
|||||
|
Cost of sales
|
(137
|
)
|
56
|
|
(4
|
)
|
—
|
|
2
|
|
(83
|
)
|
|||||||||||
|
Cost of labor
|
(156
|
)
|
61
|
|
(1
|
)
|
1
|
|
1
|
|
(94
|
)
|
|||||||||||
|
Occupancy and other
|
(159
|
)
|
61
|
|
3
|
|
—
|
|
1
|
|
(94
|
)
|
|||||||||||
|
Company restaurant expenses
|
$
|
(452
|
)
|
$
|
178
|
|
$
|
(2
|
)
|
$
|
1
|
|
$
|
4
|
|
$
|
(271
|
)
|
|||||
|
Restaurant profit
|
$
|
41
|
|
$
|
(15
|
)
|
$
|
(11
|
)
|
$
|
—
|
|
$
|
(1
|
)
|
$
|
14
|
|
|||||
|
2016 vs. 2015
|
|||||||||||||||||||||||
|
Income / (Expense)
|
2015
|
Store Portfolio Actions
|
Other
|
FX
|
53
rd
Week
|
2016
|
|||||||||||||||||
|
Company sales
|
$
|
601
|
|
$
|
(120
|
)
|
$
|
16
|
|
$
|
(9
|
)
|
$
|
5
|
|
$
|
493
|
|
|||||
|
Cost of sales
|
(167
|
)
|
34
|
|
(5
|
)
|
3
|
|
(2
|
)
|
(137
|
)
|
|||||||||||
|
Cost of labor
|
(187
|
)
|
40
|
|
(11
|
)
|
3
|
|
(1
|
)
|
(156
|
)
|
|||||||||||
|
Occupancy and other
|
(189
|
)
|
33
|
|
(5
|
)
|
3
|
|
(1
|
)
|
(159
|
)
|
|||||||||||
|
Company restaurant expenses
|
$
|
(543
|
)
|
$
|
107
|
|
$
|
(21
|
)
|
$
|
9
|
|
$
|
(4
|
)
|
$
|
(452
|
)
|
|||||
|
Restaurant profit
|
$
|
58
|
|
$
|
(13
|
)
|
$
|
(5
|
)
|
$
|
—
|
|
$
|
1
|
|
$
|
41
|
|
|||||
In 2017, the decreases in Company sales and Restaurant profit associated with store portfolio actions were driven by refranchising. Significant other factors impacting Company sales and/or Restaurant profit were company same-store sales declines of 3% and higher commodity and labor costs, partially offset by lower property and casualty losses.
In 2016, the decreases in Company sales and Restaurant profit associated with store portfolio actions were driven by refranchising. Significant other factors impacting Company sales and/or Restaurant profit were higher labor costs and increased advertising spend in the U.S., partially offset by company same-store sales growth of 2%.
Franchise and License Fees and Income
In 2017, Franchise and license fees income, excluding the impact of foreign currency translation and lapping the 53
rd
week in 2016, was even with prior year as the favorable impacts of refranchising and net new unit growth were offset by lower fees from expiring development agreements. Franchise same-store sales were even.
35
In 2016, the increase in Franchise and license fees income, excluding the impacts of foreign currency translation and 53
rd
week, was driven by net new unit growth, refranchising and higher fees from expiring development agreements, partially offset by franchise same-store sales declines of 2%.
G&A
In 2017, the decrease in G&A, excluding the impact of foreign currency translation and lapping the 53
rd
week in 2016, was driven by the positive impact of YUM's Strategic Transformation Initiatives, including reductions in G&A directly attributable to refranchising, partially offset by increased litigation costs.
In 2016, the decrease in G&A, excluding the impacts of foreign currency translation and 53
rd
week, was driven by lower litigation settlement costs and legal fees and the positive impact of YUM's Strategic Transformation Initiatives, including reductions in G&A directly attributable to refranchising, partially offset by higher incentive compensation costs.
Operating Profit
In 2017, the decrease in Operating Profit, excluding the impact of foreign currency translation and lapping the 53
rd
week in 2016, was driven by increased advertising costs associated with the Pizza Hut U.S. Transformation Agreement, partially offset by lower G&A.
In 2016, the increase in Operating Profit, excluding the impacts of foreign currency translation and 53
rd
week, was driven by lower G&A and net new unit growth, partially offset by franchise same-store sales declines.
Taco Bell Division
The Taco Bell Division has 6,849 units, 94% of which are in the U.S. As of the end of 2017, the Company owns 10% of the Taco Bell units in the U.S., where the brand has historically achieved high restaurant margins and returns.
|
% B/(W)
|
% B/(W)
|
|||||||||||||||||||||||||||||||||||
|
2017
|
2016
|
|||||||||||||||||||||||||||||||||||
|
2017
|
2016
|
2015
|
Reported
|
Ex FX
|
Ex FX and 53
rd
Week in 2016
|
Reported
|
Ex FX
|
Ex FX and 53
rd
Week in 2016
|
||||||||||||||||||||||||||||
|
System Sales
|
$
|
10,145
|
|
$
|
9,660
|
|
$
|
9,102
|
|
5
|
|
5
|
|
7
|
|
6
|
|
6
|
|
5
|
|
|||||||||||||||
|
Same-Store Sales Growth
|
4
|
|
N/A
|
|
N/A
|
2
|
|
N/A
|
|
N/A
|
||||||||||||||||||||||||||
|
Company sales
|
$
|
1,359
|
|
$
|
1,540
|
|
$
|
1,544
|
|
(12
|
)
|
(12
|
)
|
(10
|
)
|
—
|
|
—
|
|
(2
|
)
|
|||||||||||||||
|
Franchise and license fees and income
|
521
|
|
485
|
|
447
|
|
7
|
|
7
|
|
9
|
|
9
|
|
9
|
|
7
|
|
||||||||||||||||||
|
Total revenues
|
$
|
1,880
|
|
$
|
2,025
|
|
$
|
1,991
|
|
(7
|
)
|
(7
|
)
|
(6
|
)
|
2
|
|
2
|
|
—
|
|
|||||||||||||||
|
Restaurant profit
|
$
|
305
|
|
$
|
342
|
|
$
|
344
|
|
(11
|
)
|
(11
|
)
|
(9
|
)
|
—
|
|
—
|
|
(3
|
)
|
|||||||||||||||
|
Restaurant margin %
|
22.4
|
%
|
22.2
|
%
|
22.2
|
%
|
0.2
|
|
ppts.
|
0.2
|
|
ppts.
|
0.3
|
|
ppts.
|
—
|
|
ppts.
|
—
|
|
ppts.
|
(0.2
|
)
|
ppts.
|
||||||||||||
|
G&A expenses
|
$
|
188
|
|
$
|
211
|
|
$
|
221
|
|
11
|
|
11
|
|
10
|
|
4
|
|
4
|
|
5
|
|
|||||||||||||||
|
Operating Profit
|
$
|
619
|
|
$
|
595
|
|
$
|
546
|
|
4
|
|
4
|
|
6
|
|
9
|
|
9
|
|
6
|
|
|||||||||||||||
36
|
% Increase (Decrease)
|
||||||||||||||||
|
Unit Count
|
2017
|
2016
|
2015
|
2017
|
2016
|
|||||||||||
|
Franchise
|
6,196
|
|
5,727
|
|
5,513
|
|
8
|
4
|
|
|||||||
|
Company-owned
|
653
|
|
885
|
|
900
|
|
(26
|
)
|
(2
|
)
|
||||||
|
6,849
|
|
6,612
|
|
|
6,413
|
|
4
|
3
|
|
|||||||
|
2016
|
New Builds
|
Closures
|
Refranchised
|
Acquired
|
Other
|
2017
|
|||||||||||||||
|
Franchise
|
5,727
|
|
293
|
|
(78
|
)
|
253
|
|
—
|
|
1
|
|
6,196
|
|
|||||||
|
Company-owned
|
885
|
|
21
|
|
—
|
|
(253
|
)
|
—
|
|
—
|
|
653
|
|
|||||||
|
Total
|
6,612
|
|
314
|
|
(78
|
)
|
—
|
|
—
|
|
1
|
|
6,849
|
|
|||||||
|
2015
|
New Builds
|
Closures
|
Refranchised
|
Acquired
|
Other
|
2016
|
|||||||||||||||
|
Franchise
|
5,513
|
|
263
|
|
(95
|
)
|
46
|
|
(1
|
)
|
1
|
|
5,727
|
|
|||||||
|
Company-owned
|
900
|
|
34
|
|
(4
|
)
|
(46
|
)
|
1
|
|
—
|
|
885
|
|
|||||||
|
Total
|
6,413
|
|
297
|
|
(99
|
)
|
—
|
|
—
|
|
1
|
|
6,612
|
|
|||||||
Company Sales and Restaurant Profit
The changes in Company sales and Restaurant profit were as follows:
|
2017 vs. 2016
|
|||||||||||||||||||
|
Income / (Expense)
|
2016
|
Store Portfolio Actions
|
Other
|
53
rd
Week
|
2017
|
||||||||||||||
|
Company sales
|
$
|
1,540
|
|
$
|
(195
|
)
|
$
|
38
|
|
$
|
(24
|
)
|
$
|
1,359
|
|
||||
|
Cost of sales
|
(397
|
)
|
50
|
|
(15
|
)
|
6
|
|
(356
|
)
|
|||||||||
|
Cost of labor
|
(443
|
)
|
55
|
|
(13
|
)
|
7
|
|
(394
|
)
|
|||||||||
|
Occupancy and other
|
(358
|
)
|
44
|
|
6
|
|
4
|
|
(304
|
)
|
|||||||||
|
Company restaurant expense
|
$
|
(1,198
|
)
|
$
|
149
|
|
$
|
(22
|
)
|
$
|
17
|
|
$
|
(1,054
|
)
|
||||
|
Restaurant profit
|
$
|
342
|
|
$
|
(46
|
)
|
$
|
16
|
|
$
|
(7
|
)
|
$
|
305
|
|
||||
|
2016 vs. 2015
|
|||||||||||||||||||
|
Income / (Expense)
|
2015
|
Store Portfolio Actions
|
Other
|
53
rd
Week
|
2016
|
||||||||||||||
|
Company sales
|
$
|
1,544
|
|
$
|
(37
|
)
|
$
|
9
|
|
$
|
24
|
|
$
|
1,540
|
|
||||
|
Cost of sales
|
(422
|
)
|
11
|
|
20
|
|
(6
|
)
|
(397
|
)
|
|||||||||
|
Cost of labor
|
(427
|
)
|
10
|
|
(19
|
)
|
(7
|
)
|
(443
|
)
|
|||||||||
|
Occupancy and other
|
(351
|
)
|
7
|
|
(10
|
)
|
(4
|
)
|
(358
|
)
|
|||||||||
|
Company restaurant expense
|
$
|
(1,200
|
)
|
$
|
28
|
|
$
|
(9
|
)
|
$
|
(17
|
)
|
$
|
(1,198
|
)
|
||||
|
Restaurant profit
|
$
|
344
|
|
$
|
(9
|
)
|
$
|
—
|
|
$
|
7
|
|
$
|
342
|
|
||||
In 2017, the decreases in Company sales and Restaurant profit associated with store portfolio actions were driven by refranchising, partially offset by net unit growth. Significant other factors impacting Company sales and/or Restaurant profit were company same-store sales growth of 3%, partially offset by higher labor costs, commodity cost inflation, and increased cost of sales associated with value offerings.
37
In 2016, the decrease in Company sales and Restaurant profit associated with store portfolio actions was driven by refranchising, partially offset by net new unit growth. Significant other factors impacting Company sales and/or Restaurant profit were company same-store sales growth of 1% and favorable commodity costs, partially offset by higher labor costs and store-level investments.
Franchise and License Fees and Income
In 2017, the increase in Franchise and license fees and income, excluding the impact of lapping the 53
rd
week in 2016, was driven by refranchising, franchise same-store sales growth of 4%, and net new unit growth.
In 2016, the increase in Franchise and license fees and income, excluding the impact of the 53
rd
week, was driven by net new unit growth, franchise same-store sales growth of 2% and refranchising.
G&A
In 2017, the decrease in G&A, excluding the impact of lapping the 53rd week in 2016, was driven by the positive impact of YUM's Strategic Transformation Initiatives, including reductions in G&A directly attributable to refranchising, and lower litigation costs.
In 2016, the decrease in G&A, excluding the impact of the 53rd week, was driven by lapping the Live Más Scholarship contribution and lower litigation costs.
Operating Profit
In 2017, the increase in Operating Profit, excluding the impact of lapping the 53
rd
week in 2016, was driven by same-store sales growth, lower G&A and net new unit growth, partially offset by refranchising and higher restaurant operating costs.
In 2016, the increase in Operating Profit, excluding the impact of the 53
rd
week, was driven by same-store sales growth, net new unit growth and lower G&A, partially offset by higher restaurant operating costs and refranchising.
Corporate & Unallocated
|
% B/(W)
|
||||||||||||||||||||
|
Income/(Expense)
|
2017
|
2016
|
2015
|
2017
|
2016
|
|||||||||||||||
|
Corporate and unallocated G&A
|
$
|
(230
|
)
|
$
|
(280
|
)
|
$
|
(180
|
)
|
18
|
|
(56
|
)
|
|||||||
|
Unallocated restaurant costs
|
10
|
|
—
|
|
—
|
|
NM
|
|
NM
|
|
||||||||||
|
Unallocated Franchise and license fees and income
|
(5
|
)
|
(2
|
)
|
—
|
|
NM
|
|
NM
|
|
||||||||||
|
Unallocated Franchise and license expenses
|
(30
|
)
|
(24
|
)
|
(71
|
)
|
(26
|
)
|
67
|
|
||||||||||
|
Refranchising gain (loss) (See Note 5)
|
1,083
|
|
163
|
|
(23
|
)
|
NM
|
|
NM
|
|
||||||||||
|
Unallocated Other income (expense)
|
(8
|
)
|
(8
|
)
|
(24
|
)
|
3
|
|
65
|
|
||||||||||
|
Other pension income (expense) (See Note 15)
|
(47
|
)
|
(32
|
)
|
(40
|
)
|
(45
|
)
|
18
|
|
||||||||||
|
Interest expense, net
|
(440
|
)
|
(305
|
)
|
(141
|
)
|
(44
|
)
|
(117
|
)
|
||||||||||
|
Income tax provision (See Note 18)
|
(934
|
)
|
(327
|
)
|
(327
|
)
|
NM
|
|
—
|
|
||||||||||
|
Effective tax rate (See Note 18)
|
41.1
|
%
|
24.3
|
%
|
26.1
|
%
|
(16.8
|
)
|
ppts.
|
1.8
|
|
ppts.
|
||||||||
Corporate and unallocated G&A
In 2017, the decrease in Corporate and unallocated G&A was driven by lower year-over-year spending associated with YUM’s Strategic Transformation Initiatives (See Note 5), current year G&A reductions due to the impact of YUM’s Strategic Transformation Initiatives and lower year-over-year non-cash charges associated with the modification of Executive Income Deferral (“EID”) share-based compensation awards (See Note 5), partially offset by charges related to the Pizza Hut U.S. Transformation Agreement (See Note 5).
In 2016, the increase in Corporate and unallocated G&A was driven by costs associated with YUM's Strategic Transformation Initiatives (See Note 5), non-cash charges associated with the modification of certain EID share-based compensation awards (See Note 5 ) and higher incentive compensation costs, partially offset by lower professional and legal fees.
38
Unallocated restaurant costs
In 2017, Unallocated restaurant costs represents depreciation reductions that were not allocated to the Division segments. See Note 5.
Unallocated Franchise and license fees and income
In 2017, Unallocated Franchise and license fees and income primarily reflects charges related to the Pizza Hut U.S. Transformation Agreement . See Note 5.
In 2016, Unallocated Franchise and license fees and income reflects charges related to the KFC U.S. Acceleration Agreement. See Note 5.
Unallocated Franchise and license expenses
Unallocated Franchise and license expenses reflect charges related to the KFC U.S. Acceleration Agreement and/or Pizza Hut U.S. Transformation Agreement. See Note 5.
Unallocated Other income (expense)
In 2017, Unallocated Other income (expense) primarily includes foreign exchange gains (losses). See Note 8.
In 2016, Unallocated Other income (expense) primarily includes write-downs related to our decision to dispose of our corporate aircraft and foreign exchange gains (losses). See Note 8.
In 2015, Unallocated Other income (expense) primarily includes foreign exchange gains (losses).
Interest expense, net
The increases in Interest expense, net for 2017 and 2016 were driven by increased outstanding borrowings. See Note 11.
Income from Discontinued Operations, Net of Tax
The following table is a summary of the operating results of the China business which have been reflected in discontinued operations. See Note 4 for additional information.
|
2016
(a)
|
2015
|
|||||||
|
Total revenues
|
$
|
5,776
|
|
$
|
6,909
|
|
||
|
Total income from discontinued operations before income taxes
(b)
|
571
|
|
526
|
|
||||
|
Income tax (benefit) provision
(c)
|
(65
|
)
|
164
|
|
||||
|
Income from discontinued operations, net of tax
|
625
|
|
357
|
|
||||
|
(a)
|
Includes Yum China financial results from January 1, 2016 to October 31, 2016.
|
|
(b)
|
Includes costs incurred to execute the Separation of
$68 million
and
$9 million
for 2016 and 2015, respectively. Such costs primarily relate to transaction advisors, legal and other consulting fees.
|
|
(c)
|
During 2016, we recorded a tax benefit of
$233 million
related to previously recorded losses associated with our Little Sheep business. The tax benefit associated with these losses was able to be recognized as a result of legal entity restructuring completed in anticipation of the China spin-off.
|
39
Significant Known Events, Trends or Uncertainties Expected to Impact Future Results
Strategic Transformation Initiatives Impact
We have refranchised a significant number of Company-owned restaurants since the announcement of YUM’s Strategic Transformation Initiatives in October 2016, and anticipate that additional, significant refranchising will occur in 2018. The impact on Operating profit due to refranchising includes the loss of restaurant profit, which reflects the decrease in Company sales, and the increase in franchise fees from restaurants that have been refranchised. We expect to reduce G&A, including reductions directly attributable to refranchising, such that upon completion of YUM’s Strategic Transformation Initiatives in 2019, on an annual basis, the impact of lost Operating profit from refranchising will be largely offset by G&A reductions we are making. However, we expect that Operating profit will be negatively impacted throughout 2018 as certain G&A reductions lag the loss of Operating profit due to refranchising. We expect the impact of refranchising, net of G&A reductions, to negatively impact Core Operating Profit growth for 2018 by 6 to 7 percentage points.
GAAP Required Change in Accounting for Revenue
See “Recent Accounting Pronouncements” in Note 2 for discussion of the expected impact of changes in GAAP related to revenue recognition.
Tax Cuts and Jobs Act of 2017 (“Tax Act”)
The Tax Act was enacted on December 22, 2017 (see Note 18 for discussion of the charge recorded upon enactment). The Tax Act significantly modifies the U.S. corporate income tax system by, among other things, reducing the federal income tax rate from 35% to 21% beginning in 2018, limiting certain deductions, including limiting the deductibility of interest expense to 30% of U.S. Earnings Before Interest, Taxes, Depreciation and Amortization ("EBITDA"), imposing a mandatory one-time deemed repatriation tax on accumulated foreign earnings and creating a territorial tax system that changes the manner in which future foreign earnings are subject to U.S. tax.
After considering the impacts of the Tax Act, we anticipate an ongoing effective tax rate of approximately 20-22% compared to our previous guidance of 26-27%. While we expect to benefit from the lower U.S. tax rate, we anticipate this benefit will be partially offset by the limitation on the deductibility of interest. The transition to a territorial tax system is expected to benefit our effective tax rate as a majority of our earnings are generated outside the U.S. However, this benefit is expected to be partially offset by taxes incurred under the Global Intangible Low-Taxed Income provisions of the Tax Act. We currently expect that our 2018 effective tax rate will be slightly below the ongoing anticipated range noted above due to a delay in the applicability of the Global Intangible Low-Taxed Income provision and increased 2018 EBITDA in the U.S. due to our planned U.S. refranchising gains, which will lead to higher interest deductibility.
KFC United Kingdom ("UK") Supply Availability Issues
On February 14, 2018 we and our franchisees transitioned to a new distributor for the food sold in our approximately 900 KFCs in the United Kingdom and Ireland (those restaurants accounted for approximately 3% of YUM’s global system sales in the year ended December 31, 2017). In connection with this transition, certain of these restaurants have experienced supply availability issues which have resulted in store closures or stores operating under a limited menu. These supply availability issues continue through the date of this filing, and it is difficult to predict with certainty when such issues may be resolved and all KFCs in the UK and Ireland will be fully operational. While the impact of lost profits as a result of these closures and limited menus has not been material through the date of this filing, prolonged supply availability issues could have a material impact on our revenues. Additionally, should the supply availability issues persist, our franchisees, suppliers and the distributor, whose affiliates also service KFCs located in other countries within Europe, may experience financial distress or require credit support, which could further impact our results of operations.
40
Consolidated Cash Flows
Net cash provided by operating activities from continuing operations
was $1,030 million in 2017 vs. $1,248 million in 2016. The decrease was primarily driven by an increase in interest payments and retirement and deferred compensation payouts to retirees, partially offset by an increase in Operating profit before Special Items.
In 2016, net cash provided by operating activities from continuing operations was $1,248 million compared to $1,260 million in 2015. The decrease was primarily driven by an increase in interest payments, partially offset by a decrease in income tax payments.
Net cash provided by investing activities from continuing operations
was $1,472 million in 2017 versus net cash used in investing activities of $4 million in 2016. The increase was primarily driven by higher proceeds from refranchising of restaurants and lower capital spending.
In 2016, net cash used in investing activities from continuing operations was $4 million compared to $199 million in 2015. The decrease was primarily driven by higher refranchising proceeds.
Net cash used in financing activities from continuing operations
was $1,795 million in 2017 compared to $744 million in 2016. The increase was primarily driven by lower net borrowings, partially offset by lower share repurchases.
In 2016, net cash used in financing activities from continuing operations was $744 million compared to $1,089 million in 2015. The decrease was primarily driven by higher proceeds from net borrowings, partially offset by higher share repurchases.
Consolidated Financial Condition
Cash and cash equivalents increased due to significant refranchising proceeds received late in the year ended December 31, 2017, as well as cash on hand to fund the March 2018 maturity of $325 million in YUM Senior Unsecured Notes.
The refranchising of Company-operated stores drove decreases in restaurant-level assets and liabilities on our Consolidated Balance Sheet, including within Property, plant and equipment ("PP&E").
Deferred income taxes decreased in connection with the tax charge we recorded upon enactment of the Tax Act (see Note 18).
Long-term debt increased during 2017 due to the issuance of $750 million of Subsidiary Senior Unsecured Notes, partially offset by the reclassification of $325 million of YUM Senior Unsecured Notes to Short-term borrowings due to their March 2018 maturity date.
Liquidity and Capital Resources
In October 2016, we announced YUM’s Strategic Transformation Initiatives to drive global expansion of the KFC, Pizza Hut and Taco Bell brands following the Separation on October 31, 2016. As part of this transformation we intend to own less than 1,000 stores by the end of 2018 and, by 2019, reduce annual recurring capital expenditures to approximately $100 million, improve our efficiency by lowering G&A to 1.7% of system sales and increase free cash flow conversion to 100%.
In 2017, we returned $2.4 billion to shareholders through share repurchases and cash dividends and we remain committed to returning between $6.5 and $7.0 billion from 2017 to 2019. We intend to fund these shareholder returns through a combination of refranchising proceeds, free cash flow generation and maintenance of our five times EBITDA leverage. We anticipate generating total proceeds in excess of $2 billion, net of tax, in connection with our refranchising initiatives.
We have historically generated substantial cash flows from the operations of our Company-owned stores and from our extensive franchise operations, which require a limited YUM investment. Our annual operating cash flows from continuing operations have historically been in excess of $1 billion. Going forward, we anticipate that any decrease in operating cash flows from the operation of fewer Company-owned stores due to refranchising will be offset with savings generated from decreased capital investment and G&A required to support company operations. To the extent operating cash flows plus other sources of cash such as refranchising proceeds do not cover our anticipated cash needs, we maintain $1 billion of undrawn capacity under our existing revolving credit facility.
O
ur balance sheet often reflects a working capital deficit, which is not uncommon in our industry and is also historically common for YUM. Company sales are paid in cash or by credit card (which is quickly converted into cash) and our royalty receivables from franchisees are generally due within 30 days of the period in which the related sales occur. Substantial amounts of cash
41
received have historically been either invested in new restaurant assets which are non-current in nature or returned to shareholders. As part of our working capital strategy, we negotiate favorable credit terms with vendors and, as a result, our on-hand inventory turns faster than the related short-term liabilities. Accordingly, it is not unusual for current liabilities to exceed current assets. We believe such a deficit has no significant impact on our liquidity or operations.
Debt Instruments
As of December 31, 2017, approximately 90%, including the impact of interest rate swaps, of our $9.8 billion of total debt outstanding is fixed with an effective overall interest rate of approximately 4.7%. We are managing a capital structure which is levered in-line with our target of approximately five times EBITDA, and which we believe provides an attractive balance between optimized interest rates, duration and flexibility with diversified sources of liquidity and maturities spread over multiple years. We have credit ratings of BB (Standard & Poor's)/Ba3 (Moody's) with a balance sheet more consistent with highly-levered peer restaurant franchise companies. See Note 11 for details of our financing activities supporting the return of capital initiative.
Securitization Notes.
In May 2016, Taco Bell Funding, LLC, a newly formed special purpose subsidiary of the Company, issued an aggregate of $2.3 billion of fixed rate senior secured notes (“Class A-2 Notes”). In connection with the issuance of the Class A-2 Notes, Taco Bell Funding, LLC also issued variable rate notes (the “Variable Funding Notes” and, together with the Class A-2 Notes, the “Securitization Notes”) pursuant to a new revolving financing facility, which allowed for the borrowing of up to $100 million including the issuance of letters of credit up to $50 million. On October 16, 2017, Taco Bell Funding, LLC terminated the Variable Funding Notes. The Securitization Notes contain cross-default provisions whereby the failure to pay principal on any outstanding Securitization Notes will constitute an event of default under any other Securitization Notes.
Credit Agreement.
On June 16, 2016, three wholly-owned subsidiaries of the Company, KFC Holding Co., Pizza Hut Holdings, LLC and Taco Bell of America, LLC, as co-borrowers (the "Borrowers") entered into a new credit agreement (the “Credit Agreement”) providing for the following (each of which may be increased subject to certain conditions): (i) a $500 million Term Loan A facility (the “Term Loan A Facility”), (ii) a $2 billion Term Loan B facility (the “Term Loan B Facility”) and (iii) a $1 billion revolving facility (the “Revolving Facility”) which has no outstanding borrowings and has $4 million in letters of credit outstanding as of December 31, 2017, each of which may be increased subject to certain conditions. Our Term Loan A Facility and Term Loan B Facility contain cross-default provisions whereby the failure to pay principal of or otherwise perform any agreement or condition under indebtedness of certain subsidiaries with a principal amount in excess of $100 million will constitute an event of default under the Credit Agreement.
Subsidiary Senior Unsecured Notes.
On June 16, 2016, the Borrowers
issued an aggregate of $1.05 billion Senior Unsecured Notes due 2024 and an aggregate of $1.05 billion Senior Unsecured Notes due 2026. On June 15, 2017, the Borrowers issued an aggregate of $750 million Senior Unsecured Notes due June 1, 2027 (together with the June 16, 2016 issuances, the “Subsidiary Senior Unsecured Notes”). Our Subsidiary Senior Unsecured Notes contain cross-default provisions whereby the acceleration of the maturity of the indebtedness of certain subsidiaries with a principal amount in excess of $100 million or the failure to pay principal of such indebtedness will constitute an event of default under the Subsidiary Senior Unsecured Notes.
The majority of our remaining long-term debt primarily comprises senior, unsecured obligations ("YUM Senior Unsecured Notes") which ranks equally in right of payment with all of our existing and future unsecured unsubordinated indebtedness. Amounts outstanding under YUM Senior Unsecured Notes were $2.2 billion at December 31, 2017. Our YUM Senior Unsecured Notes contain cross-default provisions whereby the acceleration of the maturity of any of our indebtedness in a principal amount in excess of $50 million will constitute a default under the YUM Senior Unsecured Notes unless such indebtedness is discharged, or the acceleration of the maturity of that indebtedness is annulled, within 30 days after notice.
The following table summarizes the future maturities of our outstanding long-term debt, excluding capital leases, as of December 31, 2017.
|
2018
|
2019
|
2020
|
2021
|
2022
|
2023
|
2024
|
2025
|
2026
|
2027
|
2037
|
2043
|
Total
|
||||||||||||||||||||||||||||||||||||||||
|
Securitization Notes
|
$
|
23
|
|
$
|
23
|
|
$
|
789
|
|
$
|
15
|
|
$
|
15
|
|
$
|
479
|
|
$
|
10
|
|
$
|
10
|
|
$
|
907
|
|
$
|
2,271
|
|
||||||||||||||||||||||
|
Credit Agreement
|
32
|
|
45
|
|
51
|
|
76
|
|
395
|
|
1,876
|
|
2,475
|
|
||||||||||||||||||||||||||||||||||||||
|
Subsidiary Senior Unsecured Notes
|
1,050
|
|
1,050
|
|
750
|
|
2,850
|
|
||||||||||||||||||||||||||||||||||||||||||||
|
YUM Senior Unsecured Notes
|
325
|
|
250
|
|
350
|
|
350
|
|
325
|
|
325
|
|
275
|
|
2,200
|
|
||||||||||||||||||||||||||||||||||||
|
Total
|
$
|
380
|
|
$
|
318
|
|
$
|
1,190
|
|
$
|
441
|
|
$
|
410
|
|
$
|
2,680
|
|
$
|
1,060
|
|
$
|
10
|
|
$
|
1,957
|
|
$
|
750
|
|
$
|
325
|
|
$
|
275
|
|
$
|
9,796
|
|
|||||||||||||
42
See Note 11 for details on the the Securitization Notes, Subsidiary Senior Unsecured Notes, the Credit Agreement and YUM Senior Unsecured Notes.
Contractual Obligations
Our significant contractual obligations and payments as of
December 31, 2017
included:
|
|
Total
|
Less than 1 Year
|
1-3 Years
|
3-5 Years
|
More than 5 Years
|
|||||||||||||||
|
Long-term debt obligations
(a)
|
$
|
12,970
|
|
$
|
801
|
|
$
|
2,301
|
|
$
|
1,538
|
|
$
|
8,330
|
|
|||||
|
Capital leases
(b)
|
136
|
|
13
|
|
25
|
|
22
|
|
76
|
|
||||||||||
|
Operating leases
(b)
|
899
|
|
124
|
|
198
|
|
142
|
|
435
|
|
||||||||||
|
Purchase obligations
(c)
|
377
|
|
216
|
|
123
|
|
38
|
|
—
|
|
||||||||||
|
Benefit plans and other
(d)
|
284
|
|
100
|
|
66
|
|
26
|
|
92
|
|
||||||||||
|
Total contractual obligations
|
$
|
14,666
|
|
$
|
1,254
|
|
$
|
2,713
|
|
$
|
1,766
|
|
$
|
8,933
|
|
|||||
|
(a)
|
Amounts include maturities of debt outstanding as of December 31, 2017 and expected interest payments on those outstanding amounts on a nominal basis. See Note 11.
|
|
(b)
|
These obligations, which are shown on a nominal basis, relate primarily to approximately 900 Company-owned restaurants. See Note 12.
|
|
(c)
|
Purchase obligations include agreements to purchase goods or services that are enforceable and legally binding on us and that specify all significant terms, including: fixed or minimum quantities to be purchased; fixed, minimum or variable price provisions; and the approximate timing of the transaction. We have excluded agreements that are cancelable without penalty. Purchase obligations relate primarily to supply agreements, marketing, information technology, purchases of PP&E as well as consulting, maintenance and other agreements. Amounts include estimated payments for our incremental advertising contributions related to the KFC U.S. Acceleration Agreement and the Pizza Hut U.S. Transformation Agreement. See Note 5.
|
|
(d)
|
Includes actuarially-determined timing of payments from our most significant unfunded pension plan as well as scheduled payments from our deferred compensation plan and other unfunded benefit plans where payment dates are determinable. This table excludes $39 million of future benefit payments for deferred compensation and other unfunded benefit plans to be paid upon separation of employee's service or retirement from the company, as we cannot reasonably estimate the dates of these future cash payments. Other amounts include a cash tax obligation related to the mandatory deemed repatriation tax provisions of the Tax Act (see Note 18) and anticipated investments, other than incremental advertising, related to the KFC U.S. Acceleration Agreement and the Pizza Hut U.S. Transformation Agreement (see Note 5).
|
We sponsor noncontributory defined benefit pension plans covering certain salaried and hourly employees, the most significant of which are in the U.S. and UK. The most significant of the U.S. plans, the YUM Retirement Plan (the “Plan”), is funded while benefits from our other significant U.S. plan are paid by the Company as incurred (see footnote (d) above). Our funding policy for the Plan is to contribute annually amounts that will at least equal the minimum amounts required to comply with the Pension Protection Act of 2006. However, additional voluntary contributions are made from time-to-time to improve the Plan’s funded status. At December 31, 2017 the Plan was in a net underfunded position of $59 million. The UK pension plans were in a net overfunded position of $71 million at our 2017 measurement date.
We do not anticipate making any significant contributions to the Plan in 2018. Investment performance and corporate bond rates have a significant effect on our net funding position as they drive our asset balances and discount rate assumptions. Future changes in investment performance and corporate bond rates could impact our funded status and the timing and amounts of required contributions in 2018 and beyond.
Our post-retirement health care plan in the U.S. is not required to be funded in advance, but is pay as you go. We made post-retirement benefit payments of $5 million in 2017 and no future funding amounts are included in the contractual obligations table. See Note 15.
We have excluded from the contractual obligations table payments we may make for exposures for which we are self-insured, including workers’ compensation, employment practices liability, general liability, automobile liability, product liability and
43
property losses (collectively “property and casualty losses”) and employee healthcare and long-term disability claims. The majority of our recorded liability for self-insured property and casualty losses and employee healthcare and long-term disability claims represents estimated reserves for incurred claims that have yet to be filed or settled.
We have not included in the contractual obligations table approximately $100 million of liabilities for unrecognized tax benefits relating to various tax positions we have taken. These liabilities may increase or decrease over time as a result of tax examinations, and given the status of the examinations, we cannot reliably estimate the period of any cash settlement with the respective taxing authorities.
Off-Balance Sheet Arrangements
See the Lease Guarantees and Franchise Loan Pool and Equipment Guarantees sections of Note 20 for discussion of our off-balance sheet arrangements.
New Accounting Pronouncements Not Yet Adopted
The Financial Accounting Standards Board (“FASB”) has issued standards to provide principles within a single framework for revenue recognition of transactions involving contracts with customers across all industries. These standards are effective for the Company in our first quarter of 2018, and we will adopt the standards using the modified retrospective transition method. See “Recent Accounting Pronouncements” in Note 2 for additional information regarding our adoption of the new revenue recognition standards.
In February 2016, the FASB issued a standard on the recognition and measurement of leases, which is intended to increase transparency and comparability among organizations by requiring that substantially all lease assets and liabilities be recognized on the balance sheet and by requiring the disclosure of key information about leasing arrangements. This standard is effective for the Company in our first quarter of 2019 with early adoption permitted. The standard must be adopted using a modified retrospective transition method. We currently plan to adopt this standard in the first quarter of 2019 and we are evaluating the impact the adoption of this standard will have on our Financial Statements. Based on our current volume of store leases and subleases to franchisees (see Note 12) we expect this adoption will result in a material increase in the assets and liabilities on our Consolidated Balance Sheets; however, we believe the impact will be less material over time as we execute our strategy to be at least 98% franchised by 2019 and thus are a party to fewer leases. Further, we do not anticipate adoption will have a significant impact on our Consolidated Statements of Income or Cash Flows.
In June 2016, the FASB issued a standard that requires measurement and recognition of expected versus incurred credit losses for financial assets held. The standard is effective for the Company in our first quarter of fiscal 2020 with early adoption permitted beginning in the first quarter of 2019. We are currently evaluating the impact the adoption of this standard will have on our Financial Statements.
In October 2016, the FASB issued a standard that requires the recognition of the income tax consequences of an intra-entity transfer of an asset, other than inventory, when the transfer occurs. The guidance will require a modified retrospective application with a cumulative adjustment to opening retained earnings at the beginning of our first quarter of 2018. We anticipate a reduction in Other assets of approximately $40 million upon adoption to write-off the unamortized tax consequences of certain historical intra-entity transfers of assets with an offsetting increase to our Accumulated deficit.
In August 2017, the FASB issued a standard that refines and expands existing hedge accounting guidance. The standard is effective for the Company in our first quarter of 2019 with early adoption permitted. We do not anticipate the impact of adopting this standard will be material to our Financial Statements.
Critical Accounting Policies and Estimates
Our reported results are impacted by the application of certain accounting policies that require us to make subjective or complex judgments. These judgments involve estimations of the effect of matters that are inherently uncertain and may significantly impact our quarterly or annual results of operations or financial condition. Changes in the estimates and judgments could significantly affect our results of operations and financial condition and cash flows in future years. A description of what we consider to be our most significant critical accounting policies follows.
44
Impairment or Disposal of Long-Lived Assets
We review long-lived assets of restaurants (primarily PP&E and allocated intangible assets subject to amortization) semi-annually for impairment, or whenever events or changes in circumstances indicate that the carrying amount of a restaurant may not be recoverable. We evaluate recoverability based on the restaurant’s forecasted undiscounted cash flows, which incorporate our best estimate of sales growth and margin improvement based upon our plans for the unit and actual results at comparable restaurants. For restaurant assets that are deemed to not be recoverable, we write-down the impaired restaurant to its estimated fair value. Key assumptions in the determination of fair value are the future after-tax cash flows of the restaurant, which are reduced by future royalties a franchisee would pay, and a discount rate. The after-tax cash flows incorporate reasonable sales growth and margin improvement assumptions that would be used by a franchisee in the determination of a purchase price for the restaurant. Estimates of future cash flows are highly subjective judgments and can be significantly impacted by changes in the business or economic conditions.
We perform an impairment evaluation at a restaurant group level if it is more likely than not that we will refranchise restaurants as a group. Expected net sales proceeds are generally based on actual bids from the buyer, if available, or anticipated bids given the discounted projected after-tax cash flows for the group of restaurants. Historically, these anticipated bids have been reasonably accurate estimations of the proceeds ultimately received. The after-tax cash flows used in determining the anticipated bids incorporate reasonable assumptions we believe a franchisee would make such as sales growth and margin improvement as well as expectations as to the useful lives of the restaurant assets. These after-tax cash flows also include a deduction for the anticipated, future royalties we would receive under a franchise agreement with terms substantially at market entered into simultaneously with the refranchising transaction.
The discount rate used in the fair value calculations is our estimate of the required rate of return that a franchisee would expect to receive when purchasing a similar restaurant or groups of restaurants and the related long-lived assets. The discount rate incorporates rates of returns for historical refranchising market transactions and is commensurate with the risks and uncertainty inherent in the forecasted cash flows.
Impairment of Goodwill
We evaluate goodwill for impairment on an annual basis as of the beginning of our fourth quarter or more often if an event occurs or circumstances change that indicates impairment might exist. Goodwill is evaluated for impairment by determining whether the fair value of our reporting units exceed their carrying values. Our reporting units are our business units (which are aligned based on geography) in our KFC, Pizza Hut and Taco Bell Divisions. Fair value is the price a willing buyer would pay for the reporting unit, and is generally estimated using discounted expected future after-tax cash flows from franchise royalties and Company-owned restaurant operations, if any.
Future cash flow estimates and the discount rate are the key assumptions when estimating the fair value of a reporting unit. Future cash flows are based on growth expectations relative to recent historical performance and incorporate sales growth (from net new restaurants or same-sales growth) and margin improvement (for those reporting units which include Company-owned restaurant operations) assumptions that we believe a third-party buyer would assume when determining a purchase price for the reporting unit. Any margin improvement assumptions that factor into the discounted cash flows are highly correlated with sales growth as cash flow growth can be achieved through various interrelated strategies such as product pricing and restaurant productivity initiatives. The discount rate is our estimate of the required rate of return that a third-party buyer would expect to receive when purchasing a business from us that constitutes a reporting unit. We believe the discount rate is commensurate with the risks and uncertainty inherent in the forecasted cash flows.
The fair values of all our reporting units with goodwill balances were substantially in excess of their respective carrying values as of the 2017 goodwill testing date.
When we refranchise restaurants, we include goodwill in the carrying amount of the restaurants disposed of based on the relative fair values of the portion of the reporting unit disposed of in the refranchising versus the portion of the reporting unit that will be retained. The fair value of the portion of the reporting unit disposed of in a refranchising is determined by reference to the discounted value of the future cash flows expected to be generated by the restaurant and retained by the franchisee, which include a deduction for the anticipated, future royalties the franchisee will pay us associated with the franchise agreement entered into simultaneously with the refranchising transaction. Appropriate adjustments are made to the fair value determinations if such franchise agreement is determined to not be at prevailing market rates. When determining whether such franchise agreement is at prevailing market rates our primary consideration is consistency with the terms of our current franchise agreements both within the country that the restaurants are being refranchised in and around the world. The Company believes consistency in royalty
45
rates as a percentage of sales is appropriate as the Company and franchisee share in the impact of near-term fluctuations in sales results with the acknowledgment that over the long-term the royalty rate represents an appropriate rate for both parties.
The discounted value of the future cash flows expected to be generated by the restaurant and retained by the franchisee is reduced by future royalties the franchisee will pay the Company. The Company thus considers the fair value of future royalties to be received under the franchise agreement as fair value retained in its determination of the goodwill to be written off when refranchising. Others may consider the fair value of these future royalties as fair value disposed of and thus would conclude that a larger percentage of a reporting unit’s fair value is disposed of in a refranchising transaction.
During 2017, refranchising activity completed by the Company resulted in the write-off of $36 million in Goodwill within Refranchising (gain) loss, representing 7% of beginning-of-year Company goodwill. Of the $36 million, the most significant write-offs were recognized by KFC Turkey and Taco Bell U.S. Within KFC Turkey, all remaining company restaurants were refranchised and $13 million in goodwill was written off (representing 33% of beginning-of-year goodwill). Within Taco Bell U.S., 251 restaurants were refranchised (representing 29% of beginning-of-year company units) and $8 million in goodwill was written off (representing 7% of beginning-of-year goodwill).
See Note 2 for a further discussion of our policies regarding goodwill.
Self-Insured Property and Casualty Losses
We record our best estimate of the remaining cost to settle incurred self-insured property and casualty losses. The estimate is based on the results of an independent actuarial study and considers historical claim frequency and severity as well as changes in factors such as our business environment, benefit levels, medical costs and the regulatory environment that could impact overall self-insurance costs. Additionally, our reserve includes a risk margin to cover unforeseen events that may occur over the several years required to settle claims, increasing our confidence level that the recorded reserve is adequate.
See Note 20 for a further discussion of our insurance programs.
Pension Plans
Certain of our employees are covered under defined benefit pension plans. Our two most significant plans are in the U.S. and combined had a projected benefit obligation (“PBO”) of $1,007 million and a fair value of plan assets of $864 million at December 31, 2017.
The PBO reflects the actuarial present value of all benefits earned to date by employees and incorporates assumptions as to future compensation levels. Due to the relatively long time frame over which benefits earned to date are expected to be paid, our PBOs are highly sensitive to changes in discount rates. For our U.S. plans, we measured our PBOs using a discount rate of 3.90% at
December 31, 2017
. This discount rate was determined with the assistance of our independent actuary. The primary basis for this discount rate determination is a model that consists of a hypothetical portfolio of ten or more corporate debt instruments rated Aa or higher by Moody’s or Standard & Poor's ("S&P") with cash flows that mirror our expected benefit payment cash flows under the plans. We exclude from the model those corporate debt instruments flagged by Moody’s or S&P for a potential downgrade (if the potential downgrade would result in a rating below Aa by both Moody's and S&P) and bonds with yields that were two standard deviations or more above the mean. In considering possible bond portfolios, the model allows the bond cash flows for a particular year to exceed the expected benefit payment cash flows for that year. Such excesses are assumed to be reinvested at appropriate one-year forward rates and used to meet the benefit payment cash flows in a future year. The weighted-average yield of this hypothetical portfolio was used to arrive at an appropriate discount rate. We also ensure that changes in the discount rate as compared to the prior year are consistent with the overall change in prevailing market rates and make adjustments as necessary. A 50 basis-point increase in this discount rate would have decreased these U.S. plans’ PBOs by approximately $65 million at our measurement date. Conversely, a 50 basis-point decrease in this discount rate would have increased our U.S. plans’ PBOs by approximately $75 million at our measurement date.
The net periodic benefit cost we will record in
2018
is also impacted by the discount rate, as well as the long-term rates of return on plan assets and mortality assumptions we selected at our measurement date. We expect net periodic benefit cost for our U.S. plans to increase approximately $6 million in
2018
. A 50 basis-point decrease in our discount rate assumption at our 2017 measurement date would further increase our
2018
U.S. net periodic benefit cost by approximately $9 million. A 50 basis-point increase in our discount rate assumption at our 2017 measurement date would decrease our 2018 U.S. net periodic benefit cost by approximately $8 million. The impacts of changes in net periodic benefit costs are reflected primarily in Other pension (income) expense.
46
Our estimated long-term rate of return on U.S. plan assets is based upon the weighted-average of historical and expected future returns for each asset category. Our expected long-term rate of return on U.S. plan assets, for purposes of determining
2018
pension expense, at
December 31, 2017
was 5.65%, net of administrative and investment fees paid from plan assets. We believe this rate is appropriate given the composition of our plan assets and historical market returns thereon. A 100 basis point change in our expected long-term rate of return on plan assets assumption would impact our
2018
U.S. net periodic benefit cost by approximately $8 million. Additionally, every 100 basis point variation in actual return on plan assets versus our expected return of 5.65% will impact our unrecognized pre-tax actuarial net loss by approximately $8 million. The impacts of changes in net periodic benefit costs are recorded to Other pension (income) expense.
A decrease in discount rates over time has largely contributed to an unrecognized pre-tax actuarial net loss of $134 million included in AOCI for these U.S. plans at
December 31, 2017
. We will recognize approximately $16 million of such loss in net periodic benefit cost in 2018 versus $5 million recognized in 2017. See Note 15.
In the first quarter of 2017, we adopted FASB issued guidance related to the presentation of non-service components of net periodic pension cost. As a result, expense associated with changes in actuarial assumptions, settlement charges and other non-service related charges are primarily recorded to Other pension (income) expense.
Income Taxes
At December 31, 2017, we had valuation allowances of approximately $421 million to reduce our $847 million of deferred tax assets to amounts that are more likely than not to be realized. The net deferred tax assets primarily relate to foreign tax credits and temporary differences in profitable U.S. federal, state and foreign jurisdictions and net operating losses in certain foreign jurisdictions, the majority of which do not expire. In evaluating our ability to recover our deferred tax assets, we consider future taxable income in the various jurisdictions as well as carryforward periods and restrictions on usage. The estimation of future taxable income in these jurisdictions and our resulting ability to utilize deferred tax assets can significantly change based on future events, including our determinations as to feasibility of certain tax planning strategies and refranchising plans. Thus, recorded valuation allowances may be subject to material future changes.
As a matter of course, we are regularly audited by federal, state and foreign tax authorities. We recognize the benefit of positions taken or expected to be taken in our tax returns in our Income tax provision when it is more likely than not that the position would be sustained upon examination by these tax authorities. A recognized tax position is then measured at the largest amount of benefit that is greater than fifty percent likely of being realized upon settlement. At December 31, 2017, we had $100 million of unrecognized tax benefits, $10 million of which are temporary in nature and, if recognized, would not impact the effective tax rate. We evaluate unrecognized tax benefits, including interest thereon, on a quarterly basis to ensure that they have been appropriately adjusted for events, including audit settlements, which may impact our ultimate payment for such exposures.
On December 22, 2017, the SEC staff issued SEC Staff Accounting Bulletin (“SAB”) 118 to address the accounting implications of the 2017 Tax Cuts and Jobs Act (“Tax Act”). SAB 118 permits a company to recognize provisional amounts for the one-time tax effects of the Tax Act upon enactment when it does not have the necessary information available, prepared or analyzed (including computations) in reasonable detail to complete its accounting for the change in tax law. The measurement period to finalize our calculations cannot extend beyond one year of the enactment date. Key provisions that have a significant impact on our Financial Statements and where we have recognized estimated amounts include the recognition of liabilities for taxes on mandatory one-time deemed repatriation of accumulated earnings of foreign subsidiaries, the remeasurement of certain net deferred tax assets and liabilities, and establishment of a valuation allowance on our foreign tax credit carryforwards.
The Tax Act includes a mandatory deemed repatriation tax on accumulated earnings of foreign subsidiaries, and as a result, previously unremitted earnings for which no U.S. deferred tax liability had been provided have now been subject to U.S. tax. Our cash currently held overseas is primarily limited to that necessary to fund working capital requirements. Thus, we have not provided taxes on our foreign unremitted earnings, other than U.S. federal taxes provided in connection with the mandatory deemed repatriation tax, as we believe they are indefinitely reinvested. See Note 18 for a further discussion of our Income taxes.
|
Item 7A.
|
Quantitative and Qualitative Disclosures About Market Risk.
|
The Company is exposed to financial market risks associated with interest rates, foreign currency exchange rates and commodity prices. In the normal course of business and in accordance with our policies, we manage these risks through a variety of strategies, which may include the use of financial and commodity derivative instruments to hedge our underlying exposures. Our policies prohibit the use of derivative instruments for trading purposes, and we have processes in place to monitor and control their use.
47
Interest Rate Risk
We have a market risk exposure to changes in interest rates, principally in the U.S. Our outstanding Long-term debt of $9.8 billion includes 75% fixed-rate debt and 25% variable-rate debt. We have attempted to minimize the interest rate risk related to $1.55 billion of this variable-rate debt through the use of interest rate swaps. As a result, approximately 90% of our $9.8 billion of outstanding debt at December 31, 2017 is effectively fixed-rate debt. See Note 11 for details on these issuances and repayments and Note 13 for details related to interest rate swaps.
As of December 31, 2017 and December 31, 2016 a hypothetical 100 basis-point increase in short-term interest rates would result, over the following twelve-month period after consideration of the aforementioned interest rate swaps, in an increase of approximately $9 million and $10 million, respectively, in Interest expense, net within our Consolidated Statements of Income. These estimated amounts are based upon the current level of variable-rate debt that has not been swapped to fixed and assume no changes in the volume or composition of that debt and exclude any impact from interest income related to cash and cash equivalents.
The fair value of our cumulative fixed-rate debt of $7.3 billion as of December 31, 2017, would decrease approximately $400 million as a result of the same hypothetical 100 basis-point increase. At December 31, 2017, a hypothetical 100 basis-point decrease in short-term interest rates would decrease the fair value of our interest rate swaps approximately $50 million. Fair value was determined based on the present value of expected future cash flows considering the risks involved and using discount rates appropriate for the durations.
Foreign Currency Exchange Rate Risk
Changes in foreign currency exchange rates impact the translation of our reported foreign currency denominated earnings, cash flows and net investments in foreign operations and the fair value of our foreign currency denominated financial instruments. Historically, we have chosen not to hedge foreign currency risks related to our foreign currency denominated earnings and cash flows through the use of financial instruments. We attempt to minimize the exposure related to our net investments in foreign operations by financing those investments with local currency denominated debt when practical. In addition, we attempt to minimize the exposure related to foreign currency denominated financial instruments by purchasing goods and services from third parties in local currencies when practical. Consequently, foreign currency denominated financial instruments consist primarily of intercompany receivables and payables. At times, we utilize forward contracts and cross-currency swaps to reduce our exposure related to these intercompany receivables and payables. The notional amount and maturity dates of these contracts match those of the underlying receivables or payables such that our foreign currency exchange risk related to these instruments is minimized.
The Company’s foreign currency net asset exposure (defined as foreign currency assets less foreign currency liabilities) totaled approximately $2.0 billion as of
December 31, 2017
. Operating in international markets exposes the Company to movements in foreign currency exchange rates. The Company’s primary exposures result from our operations in Asia-Pacific, Europe and the Americas. For the fiscal year ended
December 31, 2017
Operating Profit would have decreased approximately $180 million if all foreign currencies had uniformly weakened 10% relative to the U.S. dollar. This estimated reduction assumes no changes in sales volumes or local currency sales or input prices.
Commodity Price Risk
We are subject to volatility in food costs as a result of market risk associated with commodity prices. Our ability to recover increased costs through higher pricing is, at times, limited by the competitive environment in which we operate. We manage our exposure to this risk primarily through pricing agreements with our vendors.
48
|
Item 8.
|
Financial Statements and Supplementary Data.
|
INDEX TO FINANCIAL INFORMATION
|
|
Page Reference
|
|
|
Consolidated Financial Statements
|
|
|
|
|
|
|
|
Report of Independent Registered Public Accounting Firm
|
|
|
|
|
|
|
|
Consolidated Statements of Income
|
|
|
|
|
|
|
|
Consolidated Statements of Comprehensive Income
|
||
|
Consolidated Statements of Cash Flows
|
|
|
|
|
|
|
|
Consolidated Balance Sheets
|
|
|
|
|
|
|
|
Consolidated Statements of Shareholders’ Equity (Deficit)
|
|
|
|
|
|
|
|
Notes to Consolidated Financial Statements
|
|
|
Financial Statement Schedules
No schedules are required because either the required information is not present or not present in amounts sufficient to require submission of the schedule, or because the information required is included in the above-listed financial statements or notes thereto.
49
Report of Independent Registered Public Accounting Firm
The Board of Directors and Shareholders
YUM! Brands, Inc.:
Opinions on the Consolidated Financial Statements and Internal Control Over Financial Reporting
We have audited the accompanying consolidated balance sheets of YUM! Brands, Inc. and Subsidiaries (YUM) as of December 31, 2017 and 2016, the related consolidated statements of income, comprehensive income, cash flows and shareholders’ equity (deficit) for each of the fiscal years in the three‑year period ended December 31, 2017, and the related notes collectively, the “consolidated financial statements.” We also have audited YUM’s internal control over financial reporting as of December 31, 2017, based on criteria established in
Internal Control - Integrated Framework (2013)
issued by the Committee of Sponsoring Organizations of the Treadway Commission.
In our opinion, the consolidated financial statements referred to above present fairly, in all material respects, the financial position of YUM as of December 31, 2017 and 2016, and the results of its operations and its cash flows for each of the years in the three-year period ended December 31, 2017, in conformity with U.S. generally accepted accounting principles. Also in our opinion, YUM maintained, in all material respects, effective internal control over financial reporting as of December 31, 2017, based on criteria established in
Internal Control - Integrated Framework (2013)
issued by the Committee of Sponsoring Organizations of the Treadway Commission.
Change in Accounting Principle
As discussed in notes 2 and 5 to the consolidated financial statements, the comparative consolidated balance sheet as of December 31, 2016, and the comparative consolidated statements of income, comprehensive income, cash flows and shareholders’ equity (deficit) for the fiscal years ended December 31, 2016 and 2015 have been restated for the effects of the change in accounting principle whereby YUM changed its fiscal year from a 52-53 week fiscal year to a fiscal year ending on December 31 of each year and eliminated any of the one-month or one-period reporting lags of its international subsidiaries.
Basis for Opinions
YUM’s management is responsible for these consolidated financial statements, for maintaining effective internal control over financial reporting, and for its assessment of the effectiveness of internal control over financial reporting, included in the accompanying Item 9A, “Management’s Report on Internal Control over Financial Reporting.” Our responsibility is to express an opinion on YUM’s consolidated financial statements and an opinion on YUM’s internal control over financial reporting based on our audits. We are a public accounting firm registered with the Public Company Accounting Oversight Board (United States) (“PCAOB”) and are required to be independent with respect to YUM in accordance with the U.S. federal securities laws and the applicable rules and regulations of the Securities and Exchange Commission and the PCAOB.
We conducted our audits in accordance with the standards of the PCAOB. Those standards require that we plan and perform the audits to obtain reasonable assurance about whether the consolidated financial statements are free of material misstatement, whether due to error or fraud, and whether effective internal control over financial reporting was maintained in all material respects.
Our audits of the consolidated financial statements included performing procedures to assess the risks of material misstatement of the consolidated financial statements, whether due to error or fraud, and performing procedures that respond to those risks. Such procedures included examining, on a test basis, evidence regarding the amounts and disclosures in the consolidated financial statements. Our audits also included evaluating the accounting principles used and significant estimates made by management, as well as evaluating the overall presentation of the consolidated financial statements. Our audit of internal control over financial reporting included obtaining an understanding of internal control over financial reporting, assessing the risk that a material weakness exists, and testing and evaluating the design and operating effectiveness of internal control based on the assessed risk. Our audits also included performing such other procedures as we considered necessary in the circumstances. We believe that our audits provide a reasonable basis for our opinions.
Definition and Limitations of Internal Control Over Financial Reporting
A company’s internal control over financial reporting is a process designed to provide reasonable assurance regarding the reliability of financial reporting and the preparation of financial statements for external purposes in accordance with generally accepted accounting principles. A company’s internal control over financial reporting includes those policies and procedures that (1) pertain to the maintenance of records that, in reasonable detail, accurately and fairly reflect the transactions and dispositions of the assets of the company; (2) provide reasonable assurance that transactions are recorded as necessary to permit preparation of financial
50
statements in accordance with generally accepted accounting principles, and that receipts and expenditures of the company are being made only in accordance with authorizations of management and directors of the company; and (3) provide reasonable assurance regarding prevention or timely detection of unauthorized acquisition, use, or disposition of the company’s assets that could have a material effect on the financial statements.
Because of its inherent limitations, internal control over financial reporting may not prevent or detect misstatements. Also, projections of any evaluation of effectiveness to future periods are subject to the risk that controls may become inadequate because of changes in conditions, or that the degree of compliance with the policies or procedures may deteriorate.
/s/ KPMG LLP
We have served as YUM’s auditor since 1997.
Louisville, Kentucky
February 21, 2018
51
|
|
||||||||||||
|
YUM! Brands, Inc. and Subsidiaries
|
||||||||||||
|
Fiscal years ended December 31, 2017, 2016 and 2015
|
||||||||||||
|
(in millions, except per share data)
|
||||||||||||
|
|
2017
|
2016
(As Restated)
|
2015
(As Restated)
|
|||||||||
|
Revenues
|
|
|||||||||||
|
Company sales
|
$
|
|
|
$
|
|
|
$
|
|
|
|||
|
Franchise and license fees and income
|
|
|
|
|
|
|
||||||
|
Total revenues
|
|
|
|
|
|
|
||||||
|
Costs and Expenses, Net
|
||||||||||||
|
Company restaurants
|
||||||||||||
|
Food and paper
|
|
|
|
|
|
|
||||||
|
Payroll and employee benefits
|
|
|
|
|
|
|
||||||
|
Occupancy and other operating expenses
|
|
|
|
|
|
|
||||||
|
Company restaurant expenses
|
|
|
|
|
|
|
||||||
|
General and administrative expenses
|
|
|
|
|
|
|
||||||
|
Franchise and license expenses
|
|
|
|
|
|
|
||||||
|
Closures and impairment (income) expenses
|
|
|
|
|
|
|
||||||
|
Refranchising (gain) loss
|
(
|
)
|
(
|
)
|
|
|
||||||
|
Other (income) expense
|
|
|
|
|
|
|
||||||
|
Total costs and expenses, net
|
|
|
|
|
|
|
||||||
|
Operating Profit
|
|
|
|
|
|
|
||||||
|
Other pension (income) expense
|
|
|
|
|
|
|
||||||
|
Interest expense, net
|
|
|
|
|
|
|
||||||
|
Income from continuing operations before income taxes
|
|
|
|
|
|
|
||||||
|
Income tax provision
|
|
|
|
|
|
|
||||||
|
Income from continuing operations
|
|
|
|
|
|
|
||||||
|
Income from discontinued operations, net of tax
|
N/A
|
|
|
|
|
|
||||||
|
Net Income
|
$
|
|
|
$
|
|
|
$
|
|
|
|||
|
Basic Earnings per Common Share from continuing operations
|
$
|
|
|
$
|
|
|
$
|
|
|
|||
|
Basic Earnings per Common Share from discontinued operations
|
N/A
|
|
$
|
|
|
$
|
|
|
||||
|
Basic Earnings Per Common Share
|
$
|
|
|
$
|
|
|
$
|
|
|
|||
|
Diluted Earnings per Common Share from continuing operations
|
$
|
|
|
$
|
|
|
$
|
|
|
|||
|
Diluted Earnings per Common Share from discontinued operations
|
N/A
|
|
$
|
|
|
$
|
|
|
||||
|
Diluted Earnings Per Common Share
|
$
|
|
|
$
|
|
|
$
|
|
|
|||
|
Dividends Declared Per Common Share
|
$
|
|
|
$
|
|
|
$
|
|
|
|||
|
See accompanying Notes to Consolidated Financial Statements.
|
||||||||||||
52
|
Consolidated Statements of Comprehensive Income
|
||||||||||||
|
YUM! Brands, Inc. and Subsidiaries
|
||||||||||||
|
Fiscal years ended December 31, 2017, 2016 and 2015
|
||||||||||||
|
(in millions)
|
||||||||||||
|
2017
|
2016
(As Restated)
|
2015
(As Restated)
|
||||||||||
|
Net Income
|
$
|
|
|
$
|
|
|
$
|
|
|
|||
|
Other comprehensive income (loss), net of tax:
|
||||||||||||
|
Translation adjustments and gains (losses) from intra-entity transactions of a long-term investment nature
|
||||||||||||
|
Adjustments and gains (losses) arising during the year
|
|
|
(
|
)
|
(
|
)
|
||||||
|
Reclassifications of adjustments and (gains) losses into Net Income
|
|
|
(
|
)
|
|
|
||||||
|
|
|
(
|
)
|
(
|
)
|
|||||||
|
Tax (expense) benefit
|
(
|
)
|
|
|
|
|
||||||
|
|
|
(
|
)
|
(
|
)
|
|||||||
|
Changes in pension and post-retirement benefits
|
||||||||||||
|
Unrealized gains (losses) arising during the year
|
(
|
)
|
(
|
)
|
|
|
||||||
|
Reclassification of (gains) losses into Net Income
|
|
|
|
|
|
|
||||||
|
|
|
(
|
)
|
|
|
|||||||
|
Tax (expense) benefit
|
(
|
)
|
|
|
(
|
)
|
||||||
|
|
|
(
|
)
|
|
|
|||||||
|
Changes in derivative instruments
|
||||||||||||
|
Unrealized gains (losses) arising during the year
|
(
|
)
|
|
|
|
|
||||||
|
Reclassification of (gains) losses into Net Income
|
|
|
(
|
)
|
(
|
)
|
||||||
|
|
|
|
|
(
|
)
|
|||||||
|
Tax (expense) benefit
|
(
|
)
|
(
|
)
|
|
|
||||||
|
|
|
|
|
(
|
)
|
|||||||
|
Other comprehensive income (loss), net of tax
|
|
|
(
|
)
|
(
|
)
|
||||||
|
Comprehensive Income
|
$
|
|
|
$
|
|
|
$
|
|
|
|||
|
See accompanying Notes to Consolidated Financial Statements.
|
||||||||||||
53
|
|
||||||||||||
|
YUM! Brands, Inc. and Subsidiaries
|
||||||||||||
|
Fiscal years ended December 31, 2017, 2016 and 2015
|
||||||||||||
|
(in millions)
|
||||||||||||
|
|
2017
|
2016
(As Restated)
|
2015
(As Restated)
|
|||||||||
|
Cash Flows – Operating Activities from Continuing Operations
|
|
|||||||||||
|
Net Income
|
$
|
|
|
$
|
|
|
$
|
|
|
|||
|
Income from discontinued operations, net of tax
|
|
|
(
|
)
|
(
|
)
|
||||||
|
Depreciation and amortization
|
|
|
|
|
|
|
||||||
|
Closures and impairment (income) expenses
|
|
|
|
|
|
|
||||||
|
Refranchising (gain) loss
|
(
|
)
|
(
|
)
|
|
|
||||||
|
Contributions to defined benefit pension plans
|
(
|
)
|
(
|
)
|
(
|
)
|
||||||
|
Deferred income taxes
|
|
|
|
|
(
|
)
|
||||||
|
Share-based compensation expense
|
|
|
|
|
|
|
||||||
|
Changes in accounts and notes receivable
|
(
|
)
|
(
|
)
|
(
|
)
|
||||||
|
Changes in inventories
|
|
|
|
|
(
|
)
|
||||||
|
Changes in prepaid expenses and other current assets
|
(
|
)
|
(
|
)
|
(
|
)
|
||||||
|
Changes in accounts payable and other current liabilities
|
(
|
)
|
(
|
)
|
|
|
||||||
|
Changes in income taxes payable
|
(
|
)
|
|
|
|
|
||||||
|
Other, net
|
|
|
|
|
|
|
||||||
|
Net Cash Provided by Operating Activities from Continuing Operations
|
|
|
|
|
|
|
||||||
|
Cash Flows – Investing Activities from Continuing Operations
|
|
|||||||||||
|
Capital spending
|
(
|
)
|
(
|
)
|
(
|
)
|
||||||
|
Proceeds from refranchising of restaurants
|
|
|
|
|
|
|
||||||
|
Other, net
|
|
|
|
|
|
|
||||||
|
Net Cash Provided by (Used in) Investing Activities from Continuing Operations
|
|
|
(
|
)
|
(
|
)
|
||||||
|
Cash Flows – Financing Activities from Continuing Operations
|
|
|||||||||||
|
Proceeds from long-term debt
|
|
|
|
|
|
|
||||||
|
Repayments of long-term debt
|
(
|
)
|
(
|
)
|
(
|
)
|
||||||
|
Revolving credit facilities, three months or less, net
|
|
|
(
|
)
|
|
|
||||||
|
Short-term borrowings, by original maturity
|
|
|
||||||||||
|
More than three months – proceeds
|
|
|
|
|
|
|
||||||
|
More than three months – payments
|
|
|
(
|
)
|
|
|
||||||
|
Three months or less, net
|
|
|
|
|
|
|
||||||
|
Repurchase shares of Common Stock
|
(
|
)
|
(
|
)
|
(
|
)
|
||||||
|
Dividends paid on Common Stock
|
(
|
)
|
(
|
)
|
(
|
)
|
||||||
|
Debt issuance costs
|
(
|
)
|
(
|
)
|
|
|
||||||
|
Net transfers from discontinued operations
|
|
|
|
|
|
|
||||||
|
Other, net
|
(
|
)
|
(
|
)
|
(
|
)
|
||||||
|
Net Cash Used in Financing Activities from Continuing Operations
|
(
|
)
|
(
|
)
|
(
|
)
|
||||||
|
Effect of Exchange Rate on Cash and Cash Equivalents
|
|
|
(
|
)
|
|
|
||||||
|
Net Increase (Decrease) in Cash, Cash Equivalents, Restricted Cash and Restricted Cash Equivalents - Continuing Operations
|
|
|
|
|
(
|
)
|
||||||
|
Cash, Cash Equivalents, Restricted Cash and Restricted Cash Equivalents – Beginning of Year
|
|
|
|
|
|
|
||||||
|
Cash, Cash Equivalents, Restricted Cash and Restricted Cash Equivalents – End of Year
|
$
|
|
|
$
|
|
|
$
|
|
|
|||
|
|
|
|||||||||||
|
Cash Provided by Operating Activities from Discontinued Operations
|
$
|
|
|
$
|
|
|
$
|
|
|
|||
|
Cash Used in Investing Activities from Discontinued Operations
|
|
|
(
|
)
|
(
|
)
|
||||||
|
Cash Used in Financing Activities from Discontinued Operations
|
|
|
(
|
)
|
(
|
)
|
||||||
|
See accompanying Notes to Consolidated Financial Statements.
|
||||||||||||
54
|
|
||||||||
|
YUM! Brands, Inc. and Subsidiaries
|
||||||||
|
December 31, 2017 and 2016
|
||||||||
|
(in millions)
|
||||||||
|
|
2017
|
2016
(As Restated)
|
||||||
|
ASSETS
|
||||||||
|
Current Assets
|
||||||||
|
Cash and cash equivalents
|
$
|
|
|
$
|
|
|
||
|
Accounts and notes receivable, net
|
|
|
|
|
||||
|
Inventories
|
|
|
|
|
||||
|
Prepaid expenses and other current assets
|
|
|
|
|
||||
|
Advertising cooperative assets, restricted
|
|
|
|
|
||||
|
Total Current Assets
|
|
|
|
|
||||
|
Property, plant and equipment, net
|
|
|
|
|
||||
|
Goodwill
|
|
|
|
|
||||
|
Intangible assets, net
|
|
|
|
|
||||
|
Other assets
|
|
|
|
|
||||
|
Deferred income taxes
|
|
|
|
|
||||
|
Total Assets
|
$
|
|
|
$
|
|
|
||
|
LIABILITIES AND SHAREHOLDERS’ DEFICIT
|
||||||||
|
Current Liabilities
|
||||||||
|
Accounts payable and other current liabilities
|
$
|
|
|
$
|
|
|
||
|
Income taxes payable
|
|
|
|
|
||||
|
Short-term borrowings
|
|
|
|
|
||||
|
Advertising cooperative liabilities
|
|
|
|
|
||||
|
Total Current Liabilities
|
|
|
|
|
||||
|
Long-term debt
|
|
|
|
|
||||
|
Other liabilities and deferred credits
|
|
|
|
|
||||
|
Total Liabilities
|
|
|
|
|
||||
|
Shareholders’ Deficit
|
||||||||
|
Common Stock, no par value, 750 shares authorized; 332 shares and 355 shares issued in 2017 and 2016, respectively
|
|
|
|
|
||||
|
Accumulated deficit
|
(
|
)
|
(
|
)
|
||||
|
Accumulated other comprehensive loss
|
(
|
)
|
(
|
)
|
||||
|
Total Shareholders’ Deficit
|
(
|
)
|
(
|
)
|
||||
|
Total Liabilities and Shareholders’ Deficit
|
$
|
|
|
$
|
|
|
||
|
See accompanying Notes to Consolidated Financial Statements.
|
||||||||
55
|
Consolidated Statements of Shareholders’ Equity (Deficit)
|
|||||||||||||||||||||||||||
|
YUM! Brands, Inc. and Subsidiaries
|
|||||||||||||||||||||||||||
|
Fiscal years ended December 31, 2017, 2016 and 2015
|
|||||||||||||||||||||||||||
|
(in millions)
|
|||||||||||||||||||||||||||
|
|
Yum! Brands, Inc.
|
|
|
||||||||||||||||||||||||
|
|
Issued Common Stock
|
Retained Earnings (Accumulated Deficit)
|
Accumulated
Other Comprehensive Income(Loss)
|
Noncontrolling Interests
|
Total Shareholders' Equity (Deficit)
|
Redeemable Noncontrolling Interest
|
|||||||||||||||||||||
|
|
Shares
|
Amount
|
|||||||||||||||||||||||||
|
Balance at December 31, 2014 (As Restated)
|
|
|
$
|
|
|
$
|
|
|
$
|
(
|
)
|
$
|
|
|
$
|
|
|
$
|
|
|
|||||||
|
Net Income (loss)
|
|
|
|
|
|
|
(
|
)
|
|||||||||||||||||||
|
Translation adjustments and gains (losses) from intra-entity transactions of a long-term investment nature (net of tax impact of $3 million)
|
(
|
)
|
(
|
)
|
(
|
)
|
(
|
)
|
|||||||||||||||||||
|
Reclassification of translation adjustments into income (net of tax impact of $3 million)
|
|
|
|
|
|||||||||||||||||||||||
|
Pension and post-retirement benefit plans (net of tax impact of $57 million)
|
|
|
|
|
|||||||||||||||||||||||
|
Net loss on derivative instruments (net of tax impact of $0 million)
|
(
|
)
|
(
|
)
|
|||||||||||||||||||||||
|
Comprehensive Income (loss)
|
|
|
(
|
)
|
|||||||||||||||||||||||
|
Dividends declared
|
|
(
|
)
|
(
|
)
|
||||||||||||||||||||||
|
Acquisition of Little Sheep store-level noncontrolling interests
|
|
|
(
|
)
|
|
|
|||||||||||||||||||||
|
Repurchase of shares of Common Stock
|
(
|
)
|
(
|
)
|
(
|
)
|
(
|
)
|
|||||||||||||||||||
|
Employee share-based award exercises (includes tax impact of $50 million)
|
|
|
|
|
|
|
|||||||||||||||||||||
|
Share-based compensation events
|
|
|
|
|
|||||||||||||||||||||||
|
Balance at December 31, 2015 (As Restated)
|
|
|
$
|
|
|
$
|
|
|
$
|
(
|
)
|
$
|
|
|
$
|
|
|
$
|
|
|
|||||||
|
Net Income (loss)
|
|
|
|
|
|
|
(
|
)
|
|||||||||||||||||||
|
Translation adjustments and gains (losses) from intra-entity transactions of a long-term investment nature (net of tax impact of $21 million)
|
(
|
)
|
(
|
)
|
(
|
)
|
|
|
|||||||||||||||||||
|
Reclassification of translation adjustments into income
|
(
|
)
|
(
|
)
|
|
||||||||||||||||||||||
|
Pension and post-retirement benefit plans (net of tax impact of $4 million)
|
(
|
)
|
(
|
)
|
|||||||||||||||||||||||
|
Net gain on derivative instruments (net of tax impact of $16 million)
|
|
|
|
|
|||||||||||||||||||||||
|
Comprehensive Income (loss)
|
|
|
(
|
)
|
|||||||||||||||||||||||
|
Dividends declared
|
(
|
)
|
(
|
)
|
(
|
)
|
|||||||||||||||||||||
|
Separation of China business
|
(
|
)
|
(
|
)
|
(
|
)
|
(
|
)
|
|||||||||||||||||||
|
Repurchase of shares of Common Stock
|
(
|
)
|
(
|
)
|
(
|
)
|
(
|
)
|
|||||||||||||||||||
|
Employee share-based award exercises (includes tax impact of $85 million)
|
|
|
(
|
)
|
(
|
)
|
|||||||||||||||||||||
|
Share-based compensation events
|
|
|
|
|
|||||||||||||||||||||||
|
Balance at December 31, 2016 (As Restated)
|
|
|
$
|
|
|
$
|
(
|
)
|
$
|
(
|
)
|
$
|
|
|
$
|
(
|
)
|
$
|
|
|
|||||||
|
Net Income
|
|
|
|
|
|||||||||||||||||||||||
|
Translation adjustments and gains (losses) from intra-entity transactions of a long-term investment nature (net of tax impact of $8 million)
|
|
|
|
|
|||||||||||||||||||||||
|
Reclassification of translation adjustments into income
|
|
|
|
|
|||||||||||||||||||||||
|
Pension and post-retirement benefit plans (net of tax impact of $14 million)
|
|
|
|
|
|||||||||||||||||||||||
|
Net gain on derivative instruments (net of tax impact of $2 million)
|
|
|
|
|
|||||||||||||||||||||||
|
Comprehensive Income
|
|
|
|||||||||||||||||||||||||
|
Dividends declared
|
(
|
)
|
(
|
)
|
|||||||||||||||||||||||
|
Repurchase of shares of Common Stock
|
(
|
)
|
|
|
(
|
)
|
(
|
)
|
|||||||||||||||||||
|
Employee share-based award exercises
|
|
|
(
|
)
|
(
|
)
|
(
|
)
|
|||||||||||||||||||
|
Share-based compensation events
|
—
|
|
|
|
—
|
|
|
|
|||||||||||||||||||
|
Balance at December 31, 2017
|
|
|
$
|
|
|
$
|
(
|
)
|
$
|
(
|
)
|
$
|
|
|
$
|
(
|
)
|
$
|
|
|
|||||||
|
See accompanying Notes to Consolidated Financial Statements.
|
|||||||||||||||||||||||||||
56
Notes to Consolidated Financial Statements
(Tabular amounts in millions, except share data)
YUM! Brands, Inc. and its Subsidiaries (collectively referred to herein as “YUM” or the “Company”) comprise the worldwide operations of KFC, Pizza Hut and Taco Bell (collectively the “Concepts”). YUM has over
45,000
units of which
60
%
are located outside the U.S. in more than
135
countries and territories. YUM was created as an independent, publicly-owned company on October 6, 1997 via a tax-free distribution by our former parent, PepsiCo, Inc., of our Common Stock to its shareholders. References to YUM throughout these Consolidated Financial Statements are made using the first person notations of “we,” “us” or “our.”
Through our widely-recognized Concepts, we develop, operate or franchise a system of both traditional and non-traditional quick service restaurants. The terms "franchise" or "franchisee" within these Consolidated Financial Statements are meant to describe third parties that operate units under either franchise or license agreements. Each Concept has proprietary menu items and emphasizes the preparation of food with high quality ingredients as well as unique recipes and special seasonings to provide appealing, convenient, tasty and attractive food at competitive prices. Our traditional restaurants feature dine-in, carryout and, in some instances, drive-thru or delivery service. Non-traditional units include express units and kiosks which have a more limited menu and operate in non-traditional locations like malls, airports, gasoline service stations, train stations, subways, convenience stores, stadiums, amusement parks and colleges, where a full-scale traditional outlet would not be practical or efficient. We also operate multibrand units, where two or more of our Concepts are operated in a single unit.
As of
December 31, 2017
, YUM consisted of three operating segments:
|
•
|
The KFC Division which includes our worldwide operations of the KFC concept
|
|
•
|
The Pizza Hut Division which includes our worldwide operations of the Pizza Hut concept
|
|
•
|
The Taco Bell Division which includes our worldwide operations of the Taco Bell concept
|
On October 31, 2016 (the “Distribution Date”), we completed the spin-off of our China business (the "Separation") into an independent, publicly-traded company under the name of Yum China Holdings, Inc. (“Yum China”). On the Distribution Date, we distributed to each of our shareholders of record as of the close of business on October 19, 2016 (the “Record Date”) one share of Yum China common stock for each share of our Common Stock held as of the Record Date. The distribution was structured to be a tax free distribution to our U.S. shareholders for federal income tax purposes in the U.S. Yum China’s common stock trades on the New York Stock Exchange under the symbol “YUMC.” After the distribution, we do not beneficially own any shares of Yum China common stock.
Our preparation of the accompanying Consolidated Financial Statements in conformity with Generally Accepted Accounting Principles in the United States of America (“GAAP”) requires us to make estimates and assumptions that affect reported amounts of assets and liabilities, disclosure of contingent assets and liabilities at the date of the Consolidated Financial Statements, and the reported amounts of revenues and expenses during the reporting period. Actual results could differ from these estimates.
57
Our most significant variable interests are in entities that operate restaurants under our Concepts’ franchise and license arrangements. We do not have an equity interest in any of our franchisee businesses. Additionally, we do not typically provide significant financial support such as loans or guarantees to our franchisees. However, we do have variable interests in certain franchisees through real estate lease arrangements to which we are a party. At the end of
2017
, YUM has future lease payments due from franchisees, on a nominal basis, of approximately
$
725
million
, and we are contingently liable on certain other lease agreements that have been assigned to franchisees. See the Lease Guarantees and Franchise Loan Pool and Equipment Guarantees sections in Note 20. As our franchise and license arrangements provide our franchisee entities the power to direct the activities that most significantly impact their economic performance, we do not consider ourselves the primary beneficiary of any such entity that might otherwise be considered a VIE.
See Note 20 for additional information on our entity that operates a franchise lending program that is a VIE in which we have a variable interest but for which we are not the primary beneficiary and thus do not consolidate.
Fiscal year 2016 included 53 weeks for our U.S. businesses and for our international subsidiaries that reported on a period calendar. The 53
rd
week added
$
76
million
to Total revenues and
$
28
million
to Operating Profit in our 2016 Consolidated Statement of Income.
On January 27, 2017, YUM’s Board of Directors approved a change in the Company's fiscal year from a year ending on the last Saturday of December to a year beginning on January 1 and ending December 31 of each year, commencing with the year ending December 31, 2017. In connection with this change, the Company moved from a 52-week periodic fiscal calendar with three 12-week interim quarters and a 16-week fourth quarter to a monthly reporting calendar with each quarter comprised of three months. Our U.S. subsidiaries continue to report on a period calendar as described above.
Concurrent with the change in the Company's fiscal year, we also eliminated the one month or one period reporting lags of our international subsidiaries. As a result of removing these reporting lags, each international subsidiary operates either on a monthly calendar consistent with the Company’s new calendar or on a periodic calendar consistent with our U.S. subsidiaries. We believe this change in our international subsidiary reporting calendars and the resulting elimination of reporting lags is preferable because a more current reporting calendar allows the Consolidated Financial Statements to more consistently and more timely reflect the impact of current events, economic conditions and global trends.
58
The majority of our foreign currency net asset exposure is in countries where we have Company-owned restaurants. As we manage and share resources at the individual brand level within a country, cumulative translation adjustments are recorded and tracked at the foreign-entity level that represents the operations of our individual brands within that country. Translation adjustments recorded in AOCI are subsequently recognized as income or expense generally only upon sale of the related investment in a foreign entity, or upon a sale of assets and liabilities within a foreign entity that represents a complete or substantially complete liquidation of that foreign entity. For purposes of determining whether a sale or complete or substantially complete liquidation of an investment in a foreign entity has occurred, we consider those same foreign entities for which we record and track cumulative translation adjustments.
59
For purposes of impairment testing for our restaurants, we have concluded that an individual restaurant is the lowest level of independent cash flows unless it is more likely than not that we will refranchise restaurants as a group. We review our long-lived assets of such individual restaurants (primarily PP&E and allocated intangible assets subject to amortization) semi-annually for impairment, or whenever events or changes in circumstances indicate that the carrying amount of a restaurant may not be recoverable. We use two consecutive years of operating losses as our primary indicator of potential impairment for our semi-annual impairment testing of these restaurant assets. We evaluate the recoverability of these restaurant assets by comparing the estimated undiscounted future cash flows, which are based on our entity-specific assumptions, to the carrying value of such assets. For restaurant assets that are not deemed to be recoverable, we write-down an impaired restaurant to its estimated fair value, which becomes its new cost basis. Fair value is an estimate of the price a franchisee would pay for the restaurant and its related assets and is determined by discounting the estimated future after-tax cash flows of the restaurant, which include a deduction for royalties we would receive under a franchise agreement with terms substantially at market. The after-tax cash flows incorporate reasonable assumptions we believe a franchisee would make such as sales growth and margin improvement. The discount rate used in the fair value calculation is our estimate of the required rate of return that a franchisee would expect to receive when purchasing a similar restaurant and the related long-lived assets. The discount rate incorporates rates of returns for historical refranchising market transactions and is commensurate with the risks and uncertainty inherent in the forecasted cash flows.
In executing our refranchising initiatives, we most often offer groups of restaurants for sale. When we believe it is more likely than not a restaurant or groups of restaurants will be refranchised for a price less than their carrying value, but do not believe the restaurant(s) have met the criteria to be classified as held for sale, we review the restaurants for impairment. We evaluate the recoverability of these restaurant assets by comparing estimated sales proceeds plus holding period cash flows, if any, to the carrying value of the restaurant or group of restaurants. For restaurant assets that are not deemed to be recoverable, we recognize impairment for any excess of carrying value over the fair value of the restaurants, which is based on the expected net sales proceeds. To the extent ongoing agreements to be entered into with the franchisee simultaneous with the refranchising are expected to contain terms, such as royalty rates, not at prevailing market rates, we consider the off-market terms in our impairment evaluation. We recognize any such impairment charges in Refranchising (gain) loss. Refranchising (gain) loss includes the gains or losses from the sales of our restaurants to new and existing franchisees, including any impairment charges discussed above, and associated termination, relocation or retention costs associated with store-level employees of refranchised stores or employees of restaurant-support centers which we have closed due to refranchising. We recognize gains on restaurant refranchisings when the sale transaction closes and control of the restaurant operations have transferred to the franchisee.
60
When we decide to close a restaurant, it is reviewed for impairment and depreciable lives are adjusted based on the expected disposal date. Other costs incurred when closing a restaurant such as costs of disposing of the assets as well as other facility-related expenses from previously closed stores are generally expensed as incurred. Additionally, at the date we cease using a property under an operating lease, we record a liability for the net present value of any remaining lease obligations, net of estimated sublease income, if any. Any costs recorded upon store closure as well as any subsequent adjustments to liabilities for remaining lease obligations as a result of lease termination or changes in estimates of sublease income are recorded in Closures and impairment (income) expenses. To the extent we sell assets, primarily land, associated with a closed store, any gain or loss upon that sale is also recorded in Closures and impairment (income) expenses.
Considerable management judgment is necessary to estimate future cash flows, including cash flows from continuing use, terminal value, sublease income and refranchising proceeds. Accordingly, actual results could vary significantly from our estimates.
We recognize the benefit of positions taken or expected to be taken in our tax returns in our income tax provision when it is more likely than not (i.e. a likelihood of more than fifty percent) that the position would be sustained upon examination by tax authorities. A recognized tax position is then measured at the largest amount of benefit that is greater than
fifty percent
likely of being realized upon settlement. We evaluate these amounts on a quarterly basis to ensure that they have been appropriately adjusted for audit settlements and other events we believe may impact the outcome. Changes in judgment that result in subsequent recognition, derecognition or a change in measurement of a tax position taken in a prior annual period (including any related interest and penalties) are recognized as a discrete item in the interim period in which the change occurs. We recognize accrued interest and penalties related to unrecognized tax benefits as components of our income tax provision.
We do not record a deferred tax liability for unremitted earnings of our foreign subsidiaries (except for the U.S. tax provided for as part of the Tax Act enacted on December 22, 2017, see Note 18) to the extent that the earnings meet the indefinite reversal criteria. This criteria is met if the foreign subsidiary has invested, or will invest, the earnings indefinitely. The decision as to the amount of unremitted earnings that we intend to maintain in non-U.S. subsidiaries considers items including, but not limited to, forecasts and budgets of financial needs of cash for working capital, liquidity plans and expected cash requirements in the U.S.
See Note 18 for a further discussion of our income taxes.
61
|
Level 1
|
Inputs based upon quoted prices in active markets for identical assets.
|
|
|
|
|
Level 2
|
Inputs other than quoted prices included within Level 1 that are observable for the asset, either directly or indirectly.
|
|
|
|
|
Level 3
|
Inputs that are unobservable for the asset.
|
|
|
2017
|
2016
|
||||||
|
Accounts and notes receivable
|
$
|
|
|
$
|
|
|
||
|
Allowance for doubtful accounts
|
(
|
)
|
(
|
)
|
||||
|
Accounts and notes receivable, net
|
$
|
|
|
$
|
|
|
||
62
the use of the leased property. Leasehold improvements are amortized over the shorter of their estimated useful lives or the lease term. We generally do not receive leasehold improvement incentives upon opening a store that is subject to a lease.
We expense rent associated with leased land or buildings while a restaurant is being constructed whether rent is paid or we are subject to a rent holiday. Additionally, certain of the Company's operating leases contain predetermined fixed escalations of the minimum rent during the lease term. For leases with fixed escalating payments and/or rent holidays, we record rent expense on a straight-line basis over the lease term, including any option periods considered in the determination of that lease term. Contingent rentals are based on sales levels in excess of stipulated amounts, and thus are not considered minimum lease payments and are included in rent expense when attainment of the contingency is considered probable (e.g. when Company sales occur).
We evaluate goodwill for impairment on an annual basis or more often if an event occurs or circumstances change that indicate impairment might exist. We have selected the beginning of our fourth quarter as the date on which to perform our ongoing annual impairment test for goodwill. We may elect to perform a qualitative assessment for our reporting units to determine whether it is more likely than not that the fair value of the reporting unit is greater than its carrying value. If a qualitative assessment is not performed, or if as a result of a qualitative assessment it is not more likely than not that the fair value of a reporting unit exceeds its carrying value, then the reporting unit’s fair value is compared to its carrying value. Fair value is the price a willing buyer would pay for a reporting unit, and is generally estimated using discounted expected future after-tax cash flows from Company-owned restaurant operations and franchise royalties. The discount rate is our estimate of the required rate of return that a third-party buyer would expect to receive when purchasing a business from us that constitutes a reporting unit. We believe the discount rate is commensurate with the risks and uncertainty inherent in the forecasted cash flows. If the carrying value of a reporting unit exceeds its fair value, goodwill is written down to its implied fair value.
If we record goodwill upon acquisition of a restaurant(s) from a franchisee and such restaurant(s) is then sold within two years of acquisition, the goodwill associated with the acquired restaurant(s) is written off in its entirety. If the restaurant is refranchised two years or more subsequent to its acquisition, we include goodwill in the carrying amount of the restaurants disposed of based on the relative fair values of the portion of the reporting unit disposed of in the refranchising and the portion of the reporting unit that will be retained. The fair value of the portion of the reporting unit disposed of in a refranchising is determined by reference to the discounted value of the future cash flows expected to be generated by the restaurant and retained by the franchisee, which includes a deduction for the anticipated, future royalties the franchisee will pay us associated with the franchise agreement entered into simultaneously with the refranchising transition. The fair value of the reporting unit retained is based on the price a willing buyer would pay for the reporting unit and includes the value of franchise agreements. Appropriate adjustments are made if a franchise agreement includes terms that are determined to not be at prevailing market rates. As such, the fair value of the reporting unit retained can include expected cash flows from future royalties from those restaurants currently being refranchised, future royalties from existing franchise businesses and company restaurant operations. As a result, the percentage of a reporting unit’s goodwill that will be written off in a refranchising transaction will be less than the percentage of the reporting unit’s Company-owned restaurants that are refranchised in that transaction and goodwill can be allocated to a reporting unit with only franchise restaurants.
63
We record all derivative instruments on our Consolidated Balance Sheet at fair value. For derivative instruments that are designated and qualify as a cash flow hedge, the effective portion of the gain or loss on the derivative instrument is reported as a component of AOCI and reclassified into earnings in the same period or periods during which the hedged transaction affects earnings. Any ineffective portion of the gain or loss on the derivative instrument for a cash flow hedge is recorded in the results of operations immediately. For derivative instruments not designated as hedging instruments, the gain or loss is recognized in the results of operations immediately.
The net periodic benefit costs associated with the Company's defined benefit pension and post-retirement medical plans are determined using assumptions regarding the projected benefit obligation and, for funded plans, the market-related value of plan assets as of the beginning of each year, or remeasurement period, it applicable. We record the service cost component of net periodic benefit costs in G&A. Non-service cost components are recorded in Other pension (income) expense. We have elected to use a market-related value of plan assets to calculate the expected return on assets, net of administrative and investment fees paid from plan assets, in net periodic benefit costs. We recognize differences in the fair value versus the market-related value of plan assets evenly over five years. For each individual plan we amortize into pension expense the net amounts in AOCI, as adjusted for the difference between the fair value and market-related value of plan assets, to the extent that such amounts exceed 10% of the greater of a plan’s projected benefit obligation or market-related value of assets, over the remaining service period of active participants in the plan or, for plans with no active participants, over the expected average life expectancy of the inactive participants in the plan. We record a curtailment when an event occurs that significantly reduces the expected years of future service or eliminates the accrual of defined benefits for the future services of a significant number of employees. We record a curtailment gain when the employees who are entitled to the benefits terminate their employment; we record a curtailment loss when it becomes probable a loss will occur.
Recent Accounting Pronouncements.
The Financial Accounting Standards Board (“FASB”) has issued standards to provide principles within a single framework for revenue recognition of transactions involving contracts with customers across all industri
64
es. These standards are effective for the Company in our first quarter of 2018 and we will adopt the standards using the modified retrospective method. Upon adoption, we will record an increase in Total Shareholders’ Deficit of approximately
$
230
million
on our Consolidated Balance Sheet, which includes the impact to deferred taxes from adopting the standards. We expect the adoption of the standards to negatively impact 2018 Operating Profit by approximately
$
45
million
. Significant changes to the Company’s accounting policies are summarized below.
These standards require that the transaction price received from customers be allocated to each separate and distinct performance obligation. The transaction price attributable to each separate and distinct performance obligation is then recognized as the performance obligations are satisfied. The services we provide related to upfront fees we receive from franchisees such as initial or renewal fees do not contain separate and distinct performance obligations from the franchise right and thus those upfront fees will be recognized as revenue over the term of each respective franchise agreement. We currently recognize upfront franchise fees such as initial and renewal fees when the related services have been provided, which is when a store opens for initial fees and when renewal options become effective for renewal fees. These standards require any unamortized portion of fees received prior to adoption be presented in our Consolidated Balance Sheet as a contract liability. Upon adoption we expect the recognition of unamortized upfront fees to increase Total Liabilities by approximately
$
390
million
.
Similarly, the benefits we receive from incentive payments we may make to our franchisees (e.g. equipment funding provided under the KFC U.S. Acceleration Agreement, see Note 5) are not separate and distinct from the benefits we receive from the franchise right and thus those incentive payments will be amortized as a reduction of revenue over the period of expected cash flows from the franchise agreements to which the payment relates. Currently, we recognize any payments made to franchisees within our Consolidated Statements of Income when we are obligated to make the payment. These standards require any such unamortized portion of payments prior to adoption to be presented in our Consolidated Balance Sheet as an asset. Upon adoption we expect the recognition of unamortized incentive payments to increase Total Assets by approximately
$
140
million
.
These standards will also have an impact on transactions currently not included in our revenues and expenses such as franchisee contributions to and subsequent expenditures from advertising cooperatives that we are required to consolidate and other cost reimbursement arrangements we have with our franchisees. We do not currently include these contributions and expenditures in our Consolidated Statements of Income or Cash Flows. The new standards will impact the principal/agent determinations in these arrangements by superseding industry-specific guidance included in current GAAP. When we are the principal in these transactions we will include the related contributions and expenditures within our Consolidated Statements of Income and Cash Flows. As a result of this change, we expect the increase in both Total revenues and Total costs and expenses, net in 2018 will approximate
$
1.0
billion
, with no significant impact to Net Income. The assets and liabilities held by advertising cooperatives, which have historically been reported as Advertising cooperative assets, restricted and Advertising cooperative liabilities, respectively, will be included within the respective balance sheet caption to which the assets and liabilities relate.
These standards will not impact the recognition of our two largest sources of revenue, sales in company-owned restaurants and sales-based continuing fees from franchisees. Additionally, the new standards will not impact the recognition of refranchising gains and losses as these transactions are divestitures of businesses and thus outside the scope of the standards.
We are evaluating the impact of the standards on our disclosures of the Company’s revenues. Further, we are currently implementing internal controls related to the recognition and presentation of the Company’s revenues under these new standards.
In March 2016, the FASB issued guidance related to stock-based compensation which is intended to simplify several aspects of the accounting for employee share-based payment transactions, including their income tax consequences, classification of awards as either equity or liabilities and
classification on the statement of cash flows. We adopted this standard beginning with the quarter ended March 31, 2017.
The impact of adoption included the recognition of excess tax benefits within our income tax provision for share-based payments made of
$
117
million
during the year ended December 31, 2017. Additionally, the standard requires these excess tax benefits be reported as operating activities in the Consolidated Statements of Cash Flows as opposed to within financing activities as they have been historically reported. We elected retrospective presentation of excess tax benefits as operating cash flows for prior years. As a result,
$
83
million
and
$
46
million
of excess tax benefits previously presented as a financing activity have been reclassified to operating activities for the years ended December 31, 2016 and 2015, respectively, in our Consolidated Statements of Cash Flows. No other provisions of this standard had a material impact on the Company's Consolidated Financial Statements or disclosures.
In March 2017, the FASB issued guidance on the presentation of net periodic pension cost and net periodic postretirement benefit cost (collectively, "Benefit Costs"). The standard does not change the requirement that an employer report the service cost component of these Benefit Costs in the same line item or items as other compensation costs arising from services rendered by
65
Note 3 –
Earnings Per Common Share (“EPS”)
|
|
2017
|
2016
|
2015
|
|||||||||
|
Income from continuing operations
|
$
|
|
|
$
|
|
|
$
|
|
|
|||
|
Income from discontinued operations
|
N/A
|
|
|
|
|
|
||||||
|
Net Income
|
$
|
|
|
|
$
|
|
|
|
$
|
|
|
|
|
Weighted-average common shares outstanding (for basic calculation)
|
|
|
|
|
|
|
||||||
|
Effect of dilutive share-based employee compensation
|
|
|
|
|
|
|
||||||
|
Weighted-average common and dilutive potential common shares outstanding (for diluted calculation)
|
|
|
|
|
|
|
||||||
|
Basic EPS from continuing operations
|
$
|
|
|
$
|
|
|
$
|
|
|
|||
|
Basic EPS from discontinued operations
|
N/A
|
|
|
|
|
|
||||||
|
Basic EPS
|
$
|
|
|
|
$
|
|
|
|
$
|
|
|
|
|
Diluted EPS from continuing operations
|
$
|
|
|
$
|
|
|
$
|
|
|
|||
|
Diluted EPS from discontinued operations
|
N/A
|
|
|
|
$
|
|
|
|||||
|
Diluted EPS
|
$
|
|
|
|
$
|
|
|
|
$
|
|
|
|
|
Unexercised employee stock options and stock appreciation rights (in millions) excluded from the diluted EPS computation
(a)
|
|
|
|
|
|
|
||||||
|
(a)
|
|
As discussed in Note 1, on October 31, 2016, the Company completed the Separation of our China business.
In connection with the Separation, the Company and Yum China entered into a Separation and Distribution Agreement as well as various other agreements that provide a framework for the relationships between the parties, including among others a Tax Matters Agreement, an Employee Matters Agreement, a Transition Services Agreement and a Master License Agreement. These agreements provided for the allocation between the Company and Yum China of assets, employees, liabilities and obligations (including investments, property, employee benefits and tax-related assets and liabilities) attributable to periods prior to, at and after the Separation and govern certain relationships between the Company and Yum China after the Separation.
For all the periods prior to the Separation, the financial results of Yum China are presented as Income from discontinued operations, net of tax in the Consolidated Statements of Income and Cash flows from discontinued operations in our Consolidated Statements of Cash Flows.
The financial results of Yum China presented in discontinued operations reflect the results of the former China Division, an operating segment of the Company until the Separation, adjusted for the inclusion of certain G&A, non-cash impairment charges, refranchising gains, interest and income taxes that were previously not allocated to but were related to the former China Division's historical results of operations.
Additionally, these financial results reflect a deduction for royalties on sales of KFC and Pizza Hut Company-owned stores in China that prior to the Separation were paid, pursuant to an intercompany franchise agreement, by an entity of Yum China to a Company entity. This royalty expense was not reflected in our China Division results that were presented prior to the Separation,
66
as it was then an intercompany transaction that was eliminated in consolidation, but has been reflected in our Company's discontinued operations as such royalty arrangement continued pursuant to the Master License Agreement. Additionally, our China Division results that were presented prior to the Separation have been adjusted to exclude the portion of the royalties paid by third-party franchisees in China that have historically and continue to be remitted to a Company entity. These adjustments to our previously presented China Division results in determining Income from discontinued operations, net of tax were offset by adjustments to our KFC and Pizza Hut Divisions' results such that there was no impact on total reported Net Income.
|
|
2016
(a)
|
2015
|
||||||
|
Company sales
|
$
|
|
|
$
|
|
|
||
|
Franchise and license fees and income
|
|
|
|
|
||||
|
Company restaurant expenses
|
(
|
)
|
(
|
)
|
||||
|
G&A expenses
(b)
|
(
|
)
|
(
|
)
|
||||
|
Franchise and license expenses
|
(
|
)
|
(
|
)
|
||||
|
Closures and impairment expenses
|
(
|
)
|
(
|
)
|
||||
|
Refranchising gain
|
|
|
|
|
||||
|
Other income
(c)
|
|
|
|
|
||||
|
Interest income, net
|
|
|
|
|
||||
|
Income from discontinued operations before income taxes
|
|
|
|
|
||||
|
Income tax benefit (provision)
(d)
|
|
|
(
|
)
|
||||
|
Income from discontinued operations - including noncontrolling interests
|
|
|
|
|
||||
|
(Income) loss from discontinued operations - noncontrolling interests
|
(
|
)
|
(
|
)
|
||||
|
Income from discontinued operations, net of tax
|
$
|
|
|
$
|
|
|
||
|
(a)
|
|
|
(b)
|
|
|
(c)
|
|
|
(d)
|
|
Note 5 –
Items Affecting Comparability of Net Income and Cash Flows
Tax Cuts and Jobs Act of 2017 (“Tax Act”)
We recognized
$
434
million
in our 2017 Income tax provision as a result of the December 22, 2017 enactment of the Tax Act. See Note 18 for a discussion of the charge.
The Refranchising (gain) loss by reportable segment is presented below. Given the size and volatility of refranchising initiatives, our chief operating decision maker ("CODM") does not consider the impact of Refranchising (gain) loss when assessing segment performance. As such, we do not allocate such gains and losses to our segments for performance reporting purposes.
67
During the years ended December 31, 2017, 2016 and 2015, we refranchised
1,470
,
432
and
270
restaurants, respectively. We received
$
1,773
million
,
$
370
million
and
$
213
million
in pre-tax proceeds in 2017, 2016 and 2015, respectively, related to these transactions.
A summary of Refranchising (gain) loss is as follows:
|
|
Refranchising (gain) loss
|
||||||||||||||||
|
|
2017
|
2016
|
2015
|
||||||||||||||
|
KFC Division
(a)
|
$
|
(
|
)
|
$
|
(
|
)
|
$
|
|
|
||||||||
|
Pizza Hut Division
(a)
|
(
|
)
|
(
|
)
|
|
|
|||||||||||
|
Taco Bell Division
|
(
|
)
|
(
|
)
|
(
|
)
|
|||||||||||
|
Worldwide
|
$
|
(
|
)
|
$
|
(
|
)
|
$
|
|
|
||||||||
|
(a)
|
|
As a result of classifying restaurant and related assets as held-for-sale and ceasing depreciation expense as well as recording any related write-downs to fair value, depreciation expense was reduced versus what would have otherwise been recorded by
$
10
million
during the year ended December 31, 2017. Our CODM does not consider the impact of these depreciation reductions, which were recorded within Occupancy and other operating expenses when assessing segment performance. These depreciation reductions were not allocated to the Division segments resulting in depreciation expense continuing to be recorded within our Divisional results at the rate at which it was prior to the held-for-sale classification.
YUM's Strategic Transformation Initiatives
In October 2016, we announced our strategic transformation plans to drive global expansion of the KFC, Pizza Hut and Taco Bell brands ("YUM's Strategic Transformation Initiatives") following the then anticipated separation of our China business on October 31, 2016. Major features of the Company’s strategic transformation plans involve being more focused on the development of our three brands, increasing our franchise ownership and creating a leaner, more efficient cost structure. We incurred pre-tax costs of
$
23
million
and
$
67
million
related to our Strategic Transformation Initiatives in 2017 and 2016, respectively. In 2017, these costs were primarily recorded in G&A and included contract termination costs and relocation and severance costs for restaurant-support center employees. In 2016, these costs were primarily recorded in G&A and included restaurant-support center employee severance costs, charges associated with a voluntary retirement program offered to certain U.S. restaurant-support center employees, consulting costs incurred to facilitate YUM's Strategic Transformation Initiatives, and losses associated with our sale of Corporate aircraft upon our decision to no longer own aircraft. YUM's Strategic Transformation Initiatives represent the continuation of YUM's transformation of its operating model and capital structure following the Separation and recapitalization of YUM. Due to the scope of the initiatives as well as their significance, our CODM does not consider the associated cost when assessing segment performance. As such, these costs are not being allocated to any of our segment operating results for performance reporting purposes.
Modifications of Share-based Compensation Awards
In connection with the Separation, we modified certain share-based compensation awards held as part of our Executive Income Deferral ("EID") Plan in phantom shares of YUM Common Stock to provide one phantom Yum China share-based award for each outstanding phantom YUM share-based award. These Yum China awards may now be settled in cash, as opposed to stock, which requires recognition of the fair value of these awards within G&A in our Consolidated Income Statement. During 2017 and 2016, we recorded G&A charges related to these awards of
$
18
million
and
$
30
million
, respectively. Given these charges were a direct
68
result of the Separation, our CODM does not consider their impact when assessing segment performance. As such, these costs are not being allocated to any of our segment operating results for performance reporting purposes.
Pizza Hut U.S. Transformation Agreement
In May 2017, we reached an agreement with Pizza Hut U.S. franchisees that will improve brand marketing alignment, accelerate enhancements in operations and technology and includes a permanent commitment to incremental advertising and digital and technology contributions by franchisees. In connection with this agreement, we anticipate investing approximately
$
90
million
to upgrade restaurant equipment to improve operations, fund improvements in restaurant technology and enhance digital and e-commerce capabilities. We currently expect the majority of this investment will be split between 2017 and 2018. During 2017, we recorded pre-tax charges of
$
31
million
, primarily within Franchise and license expenses or G&A, and capitalized
$
8
million
of costs primarily related to digital and e-commerce initiatives. Due to their unique and long-term brand-building nature, our CODM does not consider the impact of these investments when assessing segment performance. As such, these investments are not being allocated to the Pizza Hut Division segment operating results for performance reporting purposes.
In addition to the investments above, we have agreed to fund
$
37.5
million
of incremental system advertising dollars from the second half of 2017 through 2018. During 2017, we incurred
$
25
million
in related incremental system advertising expense. These advertising amounts were recorded primarily in Franchise and license expenses and are included in Pizza Hut's segment operating results.
KFC U.S. Acceleration Agreement
During 2015, we reached an agreement with our KFC U.S. franchisees that gave us brand marketing control as well as an accelerated path to expanded menu offerings, improved assets and enhanced customer experience. In connection with this agreement we anticipate investing a total of approximately
$
130
million
from 2015 through 2018 primarily to fund new back-of house equipment for franchisees and to provide incentives to accelerate franchisee store remodels. We recorded pre-tax charges for the portion of these investments made in 2017, 2016 and 2015 of
$
17
million
,
$
26
million
and
$
72
million
, respectively. These amounts were recorded primarily as Franchise and license expenses. These payments constitute a significant portion of the approximately
$
140
million
asset for incentive payments made to franchisees which we will establish upon adoption of the new revenue recognition standard in 2018 (see Note 2). Due to their size and unique long-term brand building nature, our CODM does not consider the impact of these investments when assessing segment performance. As such, these charges are not being allocated to the KFC Division segment operating results for performance reporting purposes.
In addition to the investments above, we agreed to fund
$
60
million
of incremental system advertising. During 2017, 2016 and 2015, we incurred
$
20
million
,
$
20
million
and
$
10
million
in incremental system advertising expense, respectively, with the remaining funding of approximately
$
10
million
to occur in 2018. The incremental system advertising amounts recorded were primarily in Franchise and license expenses and are included in the KFC Division segment operating results.
Items Impacting Other Pension (Income) Expense
During the fourth quarter of 2016, the Company allowed certain former employees with deferred vested balances in the YUM Retirement Plan ("the Plan") an opportunity to voluntarily elect an early payout of their pension benefits. As a result of settlement payments made of approximately
$
205
million
related to this program, all of which were funded from existing Plan assets, we recorded a settlement charge of
$
24
million
to Other pension (income) expense. Due to the size and non-recurring nature of the program, our CODM does not consider the impact of these charges when assessing performance so they were not allocated to any of our segment operating results for performance reporting purposes.
During the first quarter of 2017, as a result of the completion of a pension data review and reconciliation, we recorded a non-cash, out-of-year charge of
$
22
million
to Other pension (income) expense to adjust our historical U.S. pension liability related to our deferred vested participants. Our CODM does not consider the impact of this charge when assessing segment performance given the number of years over which it accumulated. As such, this cost is not being allocated to any of our segment operating results for performance reporting purposes. See Note 15 for further discussion of our pension plans.
69
Store closure (income) costs and Store impairment charges by reportable segment are presented below.
|
|
2017
|
|||||||||||||||
|
|
KFC
|
Pizza Hut
|
Taco Bell
|
Worldwide
|
||||||||||||
|
Store closure (income) costs
(a)
|
$
|
|
|
$
|
|
|
$
|
(
|
)
|
$
|
(
|
)
|
||||
|
Store impairment charges
|
|
|
|
|
|
|
|
|
||||||||
|
Closure and impairment (income) expenses
|
$
|
|
|
$
|
|
|
$
|
|
|
$
|
|
|
||||
|
|
2016
|
|||||||||||||||
|
|
KFC
|
Pizza Hut
|
Taco Bell
|
Worldwide
|
||||||||||||
|
Store closure (income) costs
(a)
|
$
|
|
|
$
|
(
|
)
|
$
|
|
|
$
|
(
|
)
|
||||
|
Store impairment charges
|
|
|
|
|
|
|
|
|
||||||||
|
Closure and impairment (income) expenses
|
$
|
|
|
$
|
|
|
$
|
|
|
$
|
|
|
||||
|
|
2015
|
|||||||||||||||
|
|
|
KFC
|
Pizza Hut
|
Taco Bell
|
Worldwide
|
|||||||||||
|
Store closure (income) costs
(a)
|
|
$
|
|
|
$
|
(
|
)
|
$
|
(
|
)
|
$
|
(
|
)
|
|||
|
Store impairment charges
|
|
|
|
|
|
|
|
|
|
|||||||
|
Closure and impairment (income) expenses
|
|
$
|
|
|
$
|
|
|
$
|
|
|
$
|
|
|
|||
|
(a)
|
|
70
Impact of Change in Reporting Calendar
As discussed in Note 2, we have changed our fiscal year from a year ending on the last Saturday of December to a year beginning on January 1 and ending on December 31 of each year commencing with the year ending December 31, 2017. We also removed the monthly or period reporting lags certain of our international subsidiaries historically used to report results.
The impacts on our Consolidated Financial Statements of retrospectively applying these changes are included below:
|
2016
|
|||||||||||||
|
As Previously Reported
|
Adjustments
|
After Change in Reporting Calendar
|
|||||||||||
|
Total revenues
|
$
|
|
|
$
|
(
|
)
|
$
|
|
|
||||
|
Operating Profit
|
|
|
|
|
(a)
|
|
|
(b)
|
|||||
|
Income from continuing operations
|
|
|
|
|
|
|
|||||||
|
Income from discontinued operations, net of tax
|
|
|
|
|
|
|
|||||||
|
Net Income
|
$
|
|
|
$
|
|
|
|
|
|||||
|
Diluted EPS from continuing operations
|
$
|
|
|
$
|
|
|
$
|
|
|
||||
|
Diluted EPS from discontinued operations
|
|
|
|
|
|
|
|||||||
|
Diluted EPS
|
$
|
|
|
$
|
|
|
$
|
|
|
||||
|
2015
|
|||||||||||||
|
As Previously Reported
|
Adjustments
|
After Change in Reporting Calendar
|
|||||||||||
|
Total revenues
|
$
|
|
|
$
|
(
|
)
|
$
|
|
|
||||
|
Operating Profit
|
|
|
(
|
)
|
|
|
(b)
|
||||||
|
Income from continuing operations
|
|
|
(
|
)
|
|
|
|||||||
|
Income from discontinued operations, net of tax
|
|
|
|
|
|
|
|||||||
|
Net Income
|
$
|
|
|
$
|
(
|
)
|
$
|
|
|
||||
|
Diluted EPS from continuing operations
|
$
|
|
|
$
|
(
|
)
|
$
|
|
|
||||
|
Diluted EPS from discontinued operations
|
|
|
|
|
|
|
|||||||
|
Diluted EPS
|
$
|
|
|
$
|
(
|
)
|
$
|
|
|
||||
|
(a)
|
|
|
(b)
|
|
In 2016, the impact on our Consolidated Statement of Cash Flows was a decrease in cash provided by operating activities of
$
39
million
, a decrease in cash used in investing activities of
$
20
million
and a decrease in cash used in financing activities of
$
16
million
.
In 2015, the impact on our Consolidated Statement of Cash Flows was an increase in cash used in investing activities of
$
10
million
and a decrease in cash used in financing activities of
$
16
million
. There was no impact to cash provided by operating activities.
71
|
|
2017
|
2016
|
2015
|
|||||||||
|
Cash Paid For:
|
|
|
|
|||||||||
|
Interest
|
$
|
|
|
$
|
|
|
$
|
|
|
|||
|
Income taxes
|
|
|
|
|
|
|
||||||
|
Significant Non-Cash Investing and Financing Activities:
|
|
|
|
|||||||||
|
Capital lease obligations incurred
|
$
|
|
|
$
|
|
|
$
|
|
|
|||
|
Capital lease and other debt obligations transferred through refranchising
|
(
|
)
|
(
|
)
|
|
|
||||||
|
Reconciliation of Cash and cash equivalents to Consolidated Statements of Cash Flows:
|
||||||||||||
|
Cash and cash equivalents as presented in Consolidated Balance Sheets
|
$
|
|
|
$
|
|
|
$
|
|
|
|||
|
Restricted cash included in Prepaid expenses and other current assets
(a)
|
|
|
|
|
|
|
||||||
|
Restricted cash included in Other assets
(b)
|
|
|
|
|
|
|
||||||
|
Cash, Cash Equivalents and Restricted Cash as presented in Consolidated Statements of Cash Flows
|
$
|
|
|
$
|
|
|
$
|
|
|
|||
|
(a)
|
|
|
(b)
|
|
|
|
2017
|
2016
|
2015
|
|||||||||
|
Initial fees, including renewal fees
|
$
|
|
|
$
|
|
|
$
|
|
|
|||
|
Continuing fees and rental income
|
|
|
|
|
|
|
||||||
|
Franchise and license fees and income
|
$
|
|
|
|
$
|
|
|
|
$
|
|
|
|
|
|
2017
|
2016
|
2015
|
|||||||||
|
Foreign exchange net (gain) loss and other
|
$
|
|
|
$
|
(
|
)
|
$
|
|
|
|||
|
Loss associated with corporate aircraft
(a)
|
|
|
|
|
|
|
||||||
|
Other (income) expense
|
$
|
|
|
|
$
|
|
|
|
$
|
|
|
|
|
(a)
|
|
72
Note 9
–
Supplemental Balance Sheet Information
|
Prepaid Expenses and Other Current Assets
|
2017
|
2016
|
||||||
|
Income tax receivable
|
$
|
|
|
$
|
|
|
||
|
Assets held for sale
(a)
|
|
|
|
|
||||
|
Other prepaid expenses and current assets
|
|
|
|
|
||||
|
Prepaid expenses and other current assets
|
$
|
|
|
|
$
|
|
|
|
|
(a)
|
|
|
Property, Plant and Equipment
|
2017
|
2016
|
||||||
|
Land
|
$
|
|
|
$
|
|
|
||
|
Buildings and improvements
|
|
|
|
|
||||
|
Capital leases, primarily buildings
|
|
|
|
|
||||
|
Machinery and equipment
|
|
|
|
|
||||
|
Property, plant and equipment, gross
|
|
|
|
|
||||
|
Accumulated depreciation and amortization
|
(
|
)
|
(
|
)
|
||||
|
Property, plant and equipment, net
|
$
|
|
|
|
$
|
|
|
|
Depreciation and amortization expense related to PP&E was
$
238
million
,
$
295
million
and
$
302
million
in
2017
,
2016
and
2015
, respectively.
|
Accounts Payable and Other Current Liabilities
|
2017
|
2016
|
||||||
|
Accounts payable
|
$
|
|
|
$
|
|
|
||
|
Accrued capital expenditures
|
|
|
|
|
||||
|
Accrued compensation and benefits
|
|
|
|
|
||||
|
Dividends payable
|
|
|
|
|
||||
|
Accrued taxes, other than income taxes
|
|
|
|
|
||||
|
Other current liabilities
|
|
|
|
|
||||
|
Accounts payable and other current liabilities
|
$
|
|
|
|
$
|
|
|
|
73
|
|
KFC
|
Pizza Hut
|
Taco Bell
|
Worldwide
|
||||||||||||
|
Balance as of December 31, 2015
|
||||||||||||||||
|
Goodwill, gross
|
$
|
|
|
$
|
|
|
$
|
|
|
$
|
|
|
||||
|
Accumulated impairment losses
|
|
|
(
|
)
|
|
|
(
|
)
|
||||||||
|
Goodwill, net
|
|
|
|
|
|
|
|
|
||||||||
|
Disposals and other, net
(a)
|
|
|
(
|
)
|
(
|
)
|
(
|
)
|
||||||||
|
Balance as of December 31, 2016
|
||||||||||||||||
|
Goodwill, gross
|
|
|
|
|
|
|
|
|
||||||||
|
Accumulated impairment losses
|
|
|
(
|
)
|
|
|
(
|
)
|
||||||||
|
Goodwill, net
|
|
|
|
|
|
|
|
|
||||||||
|
Disposals and other, net
(a)
|
(
|
)
|
|
|
(
|
)
|
(
|
)
|
||||||||
|
Balance as of December 31, 2017
|
||||||||||||||||
|
Goodwill, gross
|
|
|
|
|
|
|
|
|
||||||||
|
Accumulated impairment losses
|
|
|
(
|
)
|
|
|
(
|
)
|
||||||||
|
Goodwill, net
|
$
|
|
|
$
|
|
|
$
|
|
|
$
|
|
|
||||
|
(a)
|
|
|
|
2017
|
2016
|
||||||||||||||
|
|
Gross Carrying Amount
|
Accumulated Amortization
|
Gross Carrying Amount
|
Accumulated Amortization
|
||||||||||||
|
Definite-lived intangible assets
|
|
|
|
|
||||||||||||
|
Reacquired franchise rights
|
$
|
|
|
$
|
(
|
)
|
$
|
|
|
$
|
(
|
)
|
||||
|
Franchise contract rights
|
|
|
(
|
)
|
|
|
(
|
)
|
||||||||
|
Lease tenancy rights
|
|
|
(
|
)
|
|
|
(
|
)
|
||||||||
|
Other
|
|
|
(
|
)
|
|
|
(
|
)
|
||||||||
|
|
$
|
|
|
$
|
(
|
)
|
$
|
|
|
$
|
(
|
)
|
||||
|
Indefinite-lived intangible assets
|
||||||||||||||||
|
KFC trademark
|
$
|
|
|
$
|
|
|
||||||||||
Amortization expense for all definite-lived intangible assets was
$
10
million
in
2017
,
$
12
million
in
2016
and
$
13
million
in
2015
. Amortization expense for definite-lived intangible assets is expected to approximate
$
7
million
in 2018,
$
7
million
in 2019,
$
6
million
in 2020,
$
6
million
in 2021 and
$
6
million
in 2022.
74
|
|
2017
|
2016
|
||||||
|
Short-term Borrowings
|
|
|
||||||
|
Current maturities of long-term debt
|
$
|
|
|
$
|
|
|
||
|
Other
|
|
|
|
|
||||
|
$
|
|
|
$
|
|
|
|||
|
Less current portion of debt issuance costs and discounts
|
(
|
)
|
(
|
)
|
||||
|
Short-term borrowings
|
$
|
|
|
$
|
|
|
||
|
Long-term Debt
|
|
|
||||||
|
Securitization Notes
|
$
|
|
|
$
|
|
|
||
|
Subsidiary Senior Unsecured Notes
|
|
|
|
|
||||
|
Term Loan A Facility
|
|
|
|
|
||||
|
Term Loan B Facility
|
|
|
|
|
||||
|
YUM Senior Unsecured Notes
|
|
|
|
|
||||
|
Capital lease obligations (See Note 12)
|
|
|
|
|
||||
|
|
|
|
|
|
||||
|
Less debt issuance costs and discounts
|
(
|
)
|
(
|
)
|
||||
|
Less current maturities of long-term debt
|
(
|
)
|
(
|
)
|
||||
|
Long-term debt
|
$
|
|
|
|
$
|
|
|
|
Securitization Notes
On May 11, 2016 Taco Bell Funding, LLC (the “Issuer”), a newly formed, special purpose limited liability company and a direct, wholly-owned subsidiary of Taco Bell Corp. ("TBC") completed a securitization transaction and issued
$
800
million
of its Series 2016-1
3.832
%
Fixed Rate Senior Secured Notes, Class A-2-I (the “Class A-2-I Notes”),
$
500
million
of its Series 2016-1
4.377
%
Fixed Rate Senior Secured Notes, Class A-2-II (the “Class A-2-II Notes”) and
$
1.0
billion
of its Series 2016-1
4.970
%
Fixed Rate Senior Secured Notes, Class A-2-III (the “Class A-2-III Notes” and, together with the Class A-2-I Notes and the Class A-2-II Notes, the “Class A-2 Notes”). In connection with the issuance of the Class A-2 Notes, the Issuer also entered into a revolving financing facility of Series 2016-1 Senior Notes, Class A-1 (the “Variable Funding Notes”), which allowed for the borrowing of up to
$
100
million
and the issuance of up to
$
50
million
in letters of credit. The Class A-2 Notes and the Variable Funding Notes are referred to collectively as the “Securitization Notes”. The Class A-2 Notes were issued under a Base Indenture, dated as of May 11, 2016 (the “Base Indenture”), and the related Series 2016-1 Supplement thereto, dated as of May 11, 2016 (the “Series 2016-1 Supplement”). The Base Indenture and the Series 2016-1 Supplement (collectively, the “Indenture”) allow the Issuer to issue additional series of notes. On October 16, 2017, the Issuer terminated the Variable Funding Notes.
The Securitization Notes were issued in a transaction pursuant to which certain of TBC’s domestic assets, consisting principally of franchise-related agreements and domestic intellectual property, were contributed to the Issuer and the Issuer’s special purpose, wholly-owned subsidiaries (the “Guarantors”, and collectively with the Issuer, the "Securitization Entities") to secure the Securitization Notes. The Securitization Notes are secured by substantially all of the assets of the Securitization Entities, and include a lien on all existing and future U.S. Taco Bell franchise and license agreements and the royalties payable thereunder, existing and future U.S. Taco Bell intellectual property, certain transaction accounts and a pledge of the equity interests in asset-owning Securitization Entities. The remaining U.S. Taco Bell assets that were excluded from the transfers to the Securitization Entities continue to be held by Taco Bell of America, LLC, a limited liability company ("TBA") and TBC. The Securitization Notes are not guaranteed by the remaining U.S. Taco Bell assets, the Company, or any other subsidiary of the Company.
Payments of interest and principal on the Securitization Notes are made from the royalty fees paid pursuant to the franchise and license agreements with all U.S. Taco Bell restaurants, including both company and franchise operated restaurants. Interest on and principal payments of the Class A-2 Notes are due on a
quarterly
basis. In general,
no amortization of principal of the Class A-2 Notes is required prior to their anticipated repayment dates
unless
as of any quarterly measurement date the consolidated leverage ratio (the ratio of total debt to Net Cash Flow (as defined in the Indenture)) for the preceding four fiscal quarters of either the Company and its subsidiaries or the Issuer and its subsidiaries exceeds 5.0:1, in which case amortization payments of 1% per year of the outstanding principal as of the closing of the Securitization Notes is required. As of the most recent quarterly measurement date the consolidated leverage ratio exceeded 5.0:1 and, as a result, amortization payments are required.
The legal final maturity
75
date of the Notes is in May 2046, but the anticipated repayment dates of the Class A-2-I Notes, the Class A-2-II Notes and the Class A-2-III Notes will be
4
,
7
and
10
years, respectively (the “Anticipated Repayment Dates”) from the date of issuance. If the Issuer has not repaid or refinanced a series of Class A-2 Notes prior to its respective Anticipated Repayment Dates, rapid amortization of principal on all Securitization Notes will occur and additional interest will accrue on the Class A-2 Notes, as stated in the Indenture.
The Company paid debt issuance costs of
$
31
million
in connection with the 2016 issuance of the Securitization Notes. The debt issuance costs are being amortized to Interest expense, net through the Anticipated Repayment Dates of the Securitization Notes utilizing the effective interest rate method. As of December 31, 2017, the effective interest rates, including the amortization of debt issuance costs, were
4.18
%
,
4.59
%
, and
5.14
%
for the Class A-2-I Notes, Class A-2-II Notes and Class A-2-III Notes, respectively. During 2017,
$
2
million
of unamortized debt issuance costs were recognized within Interest expense, net due to the termination of the Variable Funding Notes.
The Securitization Notes are subject to a series of covenants and restrictions customary for transactions of this type, including (i) that the Issuer maintains specified reserve accounts to be available to make required interest payments in respect of the Securitization Notes, (ii) provisions relating to optional and mandatory prepayments and the related payment of specified amounts, including specified make-whole payments in the case of the Class A-2 Notes under certain circumstances, (iii) certain indemnification payments relating to taxes, enforcement costs and other customary items and (iv) covenants relating to recordkeeping, access to information and similar matters. The Securitization Notes are also subject to rapid amortization events provided for in the Indenture, including events tied to failure to maintain a stated
debt service coverage ratio (as defined in the Indenture) of at least 1.1:1
, gross domestic sales for branded restaurants being below certain levels on certain measurement dates, a manager termination event, an event of default and the failure to repay or refinance the Class A-2 Notes on the Anticipated Repayment Date (subject to limited cure rights).
The Securitization Notes are also subject to certain customary events of default, including events relating to non-payment of required interest or principal due on the Securitization Notes, failure to comply with covenants within certain time frames, certain bankruptcy events, breaches of specified representations and warranties, failure of security interests to be effective, certain judgments and failure of the Securitization Entities to maintain a stated debt service coverage ratio
.
As of December 31, 2017, we were in compliance with all of our debt covenant requirements and were not subject to any rapid amortization events
.
In accordance with the Indenture, certain cash accounts have been established with the Indenture trustee for the benefit of the note holders, and are restricted in their use. The Indenture requires a certain amount of securitization cash flow collections to be allocated on a weekly basis and maintained in a cash reserve account. As of December 31, 2017, the Company had restricted cash of
$
60
million
primarily related to required interest reserves included in Prepaid expenses and other current assets on the Consolidated Balance Sheets. Once the required obligations are satisfied, there are no further restrictions, including payment of dividends, on the cash flows of the Securitization Entities.
Additional cash reserves are required if any of the rapid amortization events occur, as noted above, or in the event that as of any quarterly measurement date the Securitization Entities fail to maintain a
debt service coverage ratio (or the ratio of Net Cash Flow to all debt service payments for the preceding four fiscal quarters) of at least 1.75:1
. The amount of weekly securitization cash flow collections that exceed the required weekly allocations is generally remitted to the Company.
During the quarter ended December 31, 2017, the Securitization Entities maintained a debt service coverage ratio significantly in excess of the 1.75:1 requirement
.
Credit Facilities and Subsidiary Senior Unsecured Notes
On June 16, 2016, KFC Holding Co., Pizza Hut Holdings, LLC, a limited liability company, and TBA, each of which is a wholly-owned subsidiary of the Company, as co-borrowers (the "Borrowers"), entered into a credit agreement providing for senior secured credit facilities consisting of a
$
500
million
Term Loan A facility (the “Term Loan A Facility"), a
$
2.0
billion
Term Loan B facility (the “Term Loan B Facility”) and a
$
1.0
billion
revolving facility (the “Revolving Facility”), each of which may be increased subject to certain conditions. The Term Loan A Facility, the Term Loan B Facility, and the Revolving Facility are collectively referred to as the "Credit Agreement". There are no outstanding borrowings under the Revolving Facility and
$
4
million
of letters of credit outstanding as of December 31, 2017.
The Term Loan A Facility was originally subject to
quarterly
amortization payments beginning one full fiscal quarter after the first anniversary of the closing date
, in an amount equal to
1.25
%
of the initial principal amount of the facility, in each of the second and third years of the facility; in an amount equal to
1.875
%
of the initial principal amount of the facility, in the fourth year of the facility; and in an amount equal to
3.75
%
of the initial principal amount of the facility, in the fifth year of the facility, with the balance payable at maturity on the fifth anniversary of the closing date. (Subsequently, this amortization schedule was delayed by approximately one year and the maturity date was extended to June 7, 2022 as a result of the Term Loan A repricing in 2017. See
76
below.) The Term Loan B Facility is subject to
quarterly
amortization payments in an amount equal to
0.25
%
of the initial principal amount of the facility, with the balance payable at maturity on the seventh anniversary of the closing date.
On March 21, 2017, the Borrowers completed the repricing of the then existing
$
1.99
billion
under the Term Loan B Facility pursuant to an amendment to the Credit Agreement. The amendment reduces the interest rate applicable to the Term Loan B Facility by
75
basis points to LIBOR plus
2.00
%
or Base Rate plus
1.00
%
, at the Borrower’s election, with an additional rate stepdown to LIBOR plus
1.75
%
or Base Rate plus
0.75
%
in the event the secured net leverage ratio (as defined in the Credit Agreement) is less than 1 to 1. As a result of repricing the Term Loan B Facility,
$
192
million
in principal was assigned to new lenders or existing lenders electing to increase their holdings in the loan. The maturity date and all other material provisions under the Credit Agreement remained unchanged as a result of this amendment.
On June 7, 2017, the Borrowers completed the repricing of the existing
$
500
million
under the Term Loan A Facility and
$
1
billion
under the Revolving Facility pursuant to an amendment to the Credit Agreement. The amendment reduced the interest rate applicable to the Term Loan A Facility and for borrowings under the Revolving Facility by
75
basis points. Subsequent to the repricing the interest rate ranges from
1.25
%
to
1.75
%
plus LIBOR or from
0.25
%
to
0.75
%
plus the Base Rate, at the Borrower’s election, based upon the total net leverage ratio of the Borrowers and the Specified Guarantors (as defined in the Credit Agreement). As a result of repricing the Term Loan A Facility,
$
146
million
in principal was assigned to new lenders or existing lenders electing to increase their holdings in the loan. There was no change in lender participation in the Revolving Facility. The maturity date for the Term Loan A Facility and the Revolving Facility has been extended to June 7, 2022. Amortization payments on the Term Loan A Facility will begin one full fiscal quarter after the first anniversary of the amendment effective date, which delays the original amortization schedule by approximately one year. All other material provisions under the Credit Agreement remained unchanged.
The Credit Agreement is unconditionally guaranteed by the Company and certain of the Borrowers’ principal domestic subsidiaries and excludes Taco Bell Funding LLC and its special purpose, wholly-owned subsidiaries (see above). The Credit Agreement is also secured by first priority liens on substantially all assets of the Borrowers and each subsidiary guarantor, excluding the stock of certain subsidiaries and certain real property, and subject to other customary exceptions.
The Credit Agreement includes two financial maintenance covenants which
require the Borrowers to maintain a total leverage ratio (defined as the ratio of Consolidated Total Debt to Consolidated EBITDA (as these terms are defined in the Credit Agreement)) of 5.0:1 or less
and a
fixed charge coverage ratio (defined as the ratio of EBITDA minus capital expenditures to fixed charges (inclusive of rental expense and scheduled amortization)) of at least 1.5:1
, each as of the last day of each fiscal quarter. The Credit Agreement includes other affirmative and negative covenants and events of default that are customary for facilities of this type. The Credit Agreement contains, among other things, limitations on certain additional indebtedness and liens, and certain other transactions specified in the agreement.
We were in compliance with all debt covenants as of December 31, 2017
.
On June 16, 2016, the Borrowers issued
$
1.05
billion
aggregate principal amount of
5.00
%
Senior Unsecured Notes due 2024 and
$
1.05
billion
aggregate principal amount of
5.25
%
Senior Unsecured Notes due 2026 (together, the “Subsidiary Senior Unsecured Notes”). Interest on each series of Subsidiary Senior Unsecured Notes is payable
semi-annually
in arrears on June 1 and December 1, beginning on December 1, 2016. Additionally, on June 15, 2017, the Borrowers issued
$
750
million
aggregate principal amount of
4.75
%
Senior Notes due June 1, 2027 (the “2027 Notes”). Interest on the 2027 Notes is payable
semi-annually
in arrears on June 1 and December 1, beginning on December 1, 2017. The Subsidiary Senior Unsecured Notes are guaranteed on a senior unsecured basis by (i) the Company, (ii) the Specified Guarantors and (iii) by each of the Borrower's and the Specified Guarantors’ domestic subsidiaries that guarantees the Borrower's obligations under the Credit Agreement, except for any of the Company’s foreign subsidiaries. The indenture governing the Subsidiary Senior Unsecured Notes contains covenants and events of default that are customary for debt securities of this type.
We were in compliance with all debt covenants as of December 31, 2017
.
During 2016, the Company paid debt issuance costs of
$
56
million
in connection with the issuance of the Credit Agreement and the Subsidiary Senior Unsecured Notes. During 2017,
$
32
million
of fees related to the repricing of the Term Loan A, Term Loan B and Revolving Facilities and the issuance of the 2027 Notes were capitalized as debt issuance costs. The debt issuance costs are being amortized to Interest expense, net through the contractual maturity of the agreements utilizing the effective interest rate method. We classify these deferred costs on our Consolidated Balance Sheet as a reduction in the related debt when borrowings are outstanding or within Other assets if borrowings are not outstanding. Additionally,
$
8
million
of fees and unamortized debt issuance costs were recognized within Interest expense, net due to the repricings in the year ended December 31, 2017. As of December 31, 2017, the effective interest rates, including the amortization of debt issuance costs and the impact of the interest
77
rate swaps on Term Loan B Facility (See Note 13), were
5.16
%
,
5.39
%
,
4.90
%
,
3.24
%
, and
3.82
%
for the Subsidiary Senior Unsecured Notes due 2024, the Subsidiary Senior Unsecured Notes due 2026, the Subsidiary Senior Unsecured Notes due 2027, the Term Loan A Facility, and the Term Loan B Facility, respectively.
YUM Senior Unsecured Notes
The majority of our remaining long-term debt primarily comprises YUM Senior Unsecured Notes with varying maturity dates from 2019 through 2043 and stated interest rates ranging from
3.75
%
to
6.88
%
. The YUM Senior Unsecured Notes represent senior, unsecured obligations and rank equally in right of payment with all of our existing and future unsecured unsubordinated indebtedness.
Our YUM Senior Unsecured Notes contain cross-default provisions whereby the acceleration of the maturity of any of our indebtedness in a principal amount in excess of $50 million will constitute a default under the YUM Senior Unsecured Notes unless such indebtedness is discharged, or the acceleration of the maturity of that indebtedness is annulled, within 30 days after notice.
|
|
|
|
Interest Rate
|
|||||||||
|
Issuance Date
(a)
|
Maturity Date
|
Principal Amount (in millions)
|
Stated
|
Effective
(b)
|
||||||||
|
October 2007
|
March 2018
|
$
|
|
|
|
%
|
|
%
|
||||
|
October 2007
|
November 2037
|
|
|
|
%
|
|
%
|
|||||
|
August 2009
|
September 2019
|
|
|
|
%
|
|
%
|
|||||
|
August 2010
|
November 2020
|
|
|
|
%
|
|
%
|
|||||
|
August 2011
|
November 2021
|
|
|
|
%
|
|
%
|
|||||
|
October 2013
|
November 2023
|
|
|
|
%
|
|
%
|
|||||
|
October 2013
|
November 2043
|
|
|
|
%
|
|
%
|
|||||
|
(a)
|
|
|
(b)
|
|
|
Year ended:
|
|
||
|
2018
|
$
|
|
|
|
2019
|
|
|
|
|
2020
|
|
|
|
|
2021
|
|
|
|
|
2022
|
|
|
|
|
Thereafter
|
|
|
|
|
Total
|
$
|
|
|
78
At
December 31, 2017
, we operated
1,481
restaurants, leasing the underlying land and/or building in approximately
900
of those restaurants with the vast majority of our commitments expiring within
20
years from the inception of the lease. In addition, the Company leases or subleases approximately
900
units to franchisees, principally in the U.S., United Kingdom, Germany, Australia and France.
We also lease office space for headquarters and support functions, as well as certain office and restaurant equipment. We do not consider any of these individual leases material to our operations. Most leases require us to pay related executory costs, which include property taxes, maintenance and insurance.
|
|
Commitments
|
Lease Receivables
|
||||||||||||||
|
|
Capital
|
Operating
|
Direct
Financing
|
Operating
|
||||||||||||
|
2018
|
$
|
|
|
$
|
|
|
$
|
|
|
$
|
|
|
||||
|
2019
|
|
|
|
|
|
|
|
|
||||||||
|
2020
|
|
|
|
|
|
|
|
|
||||||||
|
2021
|
|
|
|
|
|
|
|
|
||||||||
|
2022
|
|
|
|
|
|
|
|
|
||||||||
|
Thereafter
|
|
|
|
|
|
|
|
|
||||||||
|
|
$
|
|
|
$
|
|
|
$
|
|
|
$
|
|
|
||||
At
December 31, 2017
and
December 31, 2016
, the present value of minimum payments under capital leases was
$
105
million
and
$
120
million
, respectively. At
December 31, 2017
, unearned income associated with direct financing lease receivables was
$
12
million
.
|
|
2017
|
2016
|
2015
|
|||||||||
|
Rental expense
|
|
|
|
|||||||||
|
Minimum
|
$
|
|
|
$
|
|
|
$
|
|
|
|||
|
Contingent
|
|
|
|
|
|
|
||||||
|
|
$
|
|
|
$
|
|
|
$
|
|
|
|||
|
Rental income
|
$
|
|
|
$
|
|
|
$
|
|
|
|||
We use derivative instruments to manage certain of our market risks related to fluctuations in interest rates and foreign currency exchange rates.
Interest Rate Swaps
We have entered into interest rate swaps with the objective of reducing our exposure to interest rate risk for our variable-rate debt interest payments related to
$
1.55
billion
of our Term Loan B Facility, resulting in a fixed rate of
3.92
%
on the swapped portion of the Term Loan B Facility. These interest rate swaps will expire in July 2021 and the notional amount, maturity date and variable rate of these swaps match those of the related debt. These interest rate swaps are designated cash flow hedges as the changes in the future cash flows of the swaps are expected to offset changes in interest payments on the related variable-rate debt. There were no other interest rate swaps outstanding as of December 31, 2017.
The effective portion of gains or losses on the interest rate swaps is reported as a component of AOCI and reclassified into Interest expense, net in our Consolidated Statement of Income in the same period or periods during which the related hedged interest payments affect earnings. Gains or losses on the swaps representing hedge ineffectiveness are recognized in current earnings. As of December 31, 2017, the swaps were highly effective cash flow hedges and no ineffectiveness has been recorded.
79
Foreign Currency Contracts
We have entered into foreign currency forward and swap contracts with the objective of reducing our exposure to earnings volatility arising from foreign currency fluctuations associated with certain foreign currency denominated intercompany receivables and payables. The notional amount, maturity date, and currency of these contracts match those of the underlying intercompany receivables or payables. Our foreign currency contracts are designated cash flow hedges as the future cash flows of the contracts are expected to offset changes in intercompany receivables and payables due to foreign currency exchange rate fluctuations.
The effective portion of gains or losses on the foreign currency contracts is reported as a component of AOCI. Amounts are reclassified from AOCI each quarter to offset foreign currency transaction gains or losses recorded within Other (income) expense when the related intercompany receivables and payables affect earnings due to their functional currency remeasurements. Gains or losses on the foreign currency contracts representing hedge ineffectiveness are recognized in current earnings. As of December 31, 2017, all foreign currency contracts outstanding have been highly effective cash flow hedges and no ineffectiveness has been recorded.
As of December 31, 2017 and December 31, 2016, foreign currency forward and swap contracts outstanding had total notional amounts of
$
456
million
and
$
437
million
, respectively. As of December 31, 2017, we have foreign currency forward and swap contracts with durations expiring as early as February 2018 and as late as 2020.
As a result of the use of derivative instruments, the Company is exposed to risk that the counterparties will fail to meet their contractual obligations. To mitigate the counterparty credit risk, we only enter into contracts with carefully selected major financial institutions based upon their credit ratings and other factors, and continually assess the creditworthiness of counterparties. At December 31, 2017, all of the counterparties to our interest rate swaps and foreign currency contracts had investment grade ratings according to the three major ratings agencies. To date, all counterparties have performed in accordance with their contractual obligations.
|
|
Gains/(Losses) Recognized in AOCI
|
|
(Gains)/Losses Reclassified from AOCI into Net Income
|
||||||||||||
|
|
2017
|
|
2016
|
|
2017
|
|
2016
|
||||||||
|
Interest rate swaps
|
$
|
|
|
$
|
|
|
$
|
|
|
$
|
(
|
)
|
|||
|
Foreign currency contracts
|
(
|
)
|
|
|
|
|
(
|
)
|
|||||||
|
Income tax benefit/(expense)
|
|
|
(
|
)
|
(
|
)
|
|
|
|||||||
As of December 31, 2017, the estimated net gain included in AOCI related to our cash flow hedges that will be reclassified into earnings in the next 12 months is
$
14
million
, based on current LIBOR interest rates.
80
As of December 31, 2017 the carrying values of cash and cash equivalents, restricted cash, short-term investments, accounts receivable, and accounts payable approximated their fair values because of the short-term nature of these instruments. The fair value of notes receivable net of allowances and lease guarantees less subsequent amortization approximates their carrying value.
The following table presents the carrying value and estimated fair value of the Company’s debt obligations:
|
|
12/31/2017
|
|
12/31/2016
|
||||||||||||
|
|
Carrying Value
|
|
Fair Value (Level 2)
|
|
Carrying Value
|
|
Fair Value (Level 2)
|
||||||||
|
Debt obligations
|
|
|
|
||||||||||||
|
Securitization Notes
(a)
|
$
|
|
|
$
|
|
|
|
$
|
|
|
|
$
|
|
|
|
|
Subsidiary Senior Unsecured Notes
(b)
|
|
|
|
|
|
|
|
|
|
|
|||||
|
Term Loan A Facility
(b)
|
|
|
|
|
|
|
|
|
|
|
|||||
|
Term Loan B Facility
(b)
|
|
|
|
|
|
|
|
|
|
|
|||||
|
YUM Senior Unsecured Notes
(b)
|
|
|
|
|
|
|
|
|
|||||||
|
(a)
|
|
|
(b)
|
|
Recurring Fair Value Measurements
The Company has interest rate swaps, foreign currency forwards and swaps accounted for as cash flow hedges and other investments, all of which are required to be measured at fair value on a recurring basis (See Note 13 for discussion regarding derivative instruments).
The following table presents fair values for those assets and liabilities measured at fair value on a recurring basis and the level within the fair value hierarchy in which the measurements fall. No transfers among the levels within the fair value hierarchy occurred during the years ended December 31, 2017 or December 31, 2016.
|
Fair Value
|
|||||||||||||
|
Level
|
2017
|
2016
|
Consolidated Balance Sheet
|
||||||||||
|
Interest Rate Swaps - Liability
|
2
|
|
$
|
|
|
$
|
|
|
Accounts payable and other current liabilities
|
||||
|
Interest Rate Swaps - Asset
|
2
|
|
|
|
|
|
Prepaid expenses and other current assets
|
||||||
|
Interest Rate Swaps - Asset
|
2
|
|
|
|
|
|
Other assets
|
||||||
|
Foreign Currency Contracts - Liability
|
2
|
|
|
|
|
|
Other Liabilities and deferred credits
|
||||||
|
Foreign Currency Contracts - Asset
|
2
|
|
|
|
|
|
Prepaid expenses and other current assets
|
||||||
|
Foreign Currency Contracts - Asset
|
2
|
|
|
|
|
|
Other assets
|
||||||
|
Other Investments
|
1
|
|
|
|
|
|
Other assets
|
||||||
The fair value of the Company’s foreign currency forwards and swaps and interest rate swaps were determined based on the present value of expected future cash flows considering the risks involved, including nonperformance risk, and using discount rates appropriate for the duration based upon observable inputs. The other investments include investments in mutual funds, which are used to offset fluctuations in deferred compensation liabilities that employees have chosen to invest in phantom shares of a Stock Index Fund or Bond Index Fund. The other investments are classified as trading securities in Other assets in our Consolidated Balance Sheet and their fair value is determined based on the closing market prices of the respective mutual funds as of December 31, 2017 and December 31, 2016.
Non-Recurring Fair Value Measurements
81
sed of prior to those respective year end dates. The remaining net book value of restaurant assets measured at fair value during the years ended December 31, 2017 and December 31, 2016 is insignificant.
|
2017
|
2016
|
||||||||
|
Aircraft impairment
(a)
|
$
|
|
|
$
|
|
|
|||
|
Restaurant-level impairment
(b)
|
|
|
|
|
|||||
|
Total
|
$
|
|
|
$
|
|
|
|||
|
(a)
|
|
|
(b)
|
|
U.S. Pension Plans
We sponsor qualified and supplemental (non-qualified) noncontributory defined benefit plans covering certain full-time salaried and hourly U.S. employees. The qualified plan meets the requirements of certain sections of the Internal Revenue Code and provides benefits to a broad group of employees with restrictions on discriminating in favor of highly compensated employees with regard to coverage, benefits and contributions. The supplemental plans provide additional benefits to certain employees. We fund our supplemental plans as benefits are paid.
The most significant of our U.S. plans is the YUM Retirement Plan (the “Plan”), which is a qualified plan. Our funding policy with respect to the Plan is to contribute amounts necessary to satisfy minimum pension funding requirements, including requirements of the Pension Protection Act of 2006, plus additional amounts from time-to-time as are determined to be necessary to improve the Plan’s funded status. We do not expect to make any significant contributions to the Plan in 2018. Our two significant U.S. plans were previously amended such that any salaried employee hired or rehired by YUM after September 30, 2001 is not eligible to participate in those plans.
During the fourth quarter of 2016, the Company allowed certain former employees with deferred vested balances in the Plan an opportunity to voluntarily elect an early payout of their benefits. See Note 5 for details.
Obligation and Funded Status at Measurement Date:
82
|
|
2017
|
2016
|
||||||
|
Change in benefit obligation:
|
|
|
||||||
|
Benefit obligation at beginning of year
|
$
|
|
|
$
|
|
|
||
|
Service cost
|
|
|
|
|
||||
|
Interest cost
|
|
|
|
|
||||
|
Plan amendments
|
|
|
|
|
||||
|
Curtailments
|
(
|
)
|
(
|
)
|
||||
|
Special termination benefits
|
|
|
|
|
||||
|
Benefits paid
|
(
|
)
|
(
|
)
|
||||
|
Settlement payments
(a)
|
(
|
)
|
(
|
)
|
||||
|
Actuarial (gain) loss
|
|
|
|
|
||||
|
Administrative expense
|
(
|
)
|
(
|
)
|
||||
|
Benefit obligation at end of year
|
$
|
|
|
$
|
|
|
||
|
Change in plan assets:
|
|
|
||||||
|
Fair value of plan assets at beginning of year
|
$
|
|
|
$
|
|
|
||
|
Actual return on plan assets
|
|
|
|
|
||||
|
Employer contributions
|
|
|
|
|
||||
|
Settlement payments
(a)
|
(
|
)
|
(
|
)
|
||||
|
Benefits paid
|
(
|
)
|
(
|
)
|
||||
|
Administrative expenses
|
(
|
)
|
(
|
)
|
||||
|
Fair value of plan assets at end of year
|
$
|
|
|
$
|
|
|
||
|
Funded status at end of year
|
$
|
(
|
)
|
$
|
(
|
)
|
||
|
(a)
|
|
|
Amounts recognized in the Consolidated Balance Sheet:
|
||||||||
|
|
2017
|
2016
|
||||||
|
Accrued benefit liability - current
|
$
|
(
|
)
|
$
|
(
|
)
|
||
|
Accrued benefit liability - non-current
|
(
|
)
|
(
|
)
|
||||
|
|
$
|
(
|
)
|
$
|
(
|
)
|
||
The accumulated benefit obligation was
$
976
million
and
$
960
million
at
December 31, 2017
and
December 31, 2016
, respectively.
|
Information for pension plans with an accumulated benefit obligation in excess of plan assets:
|
||||||||
|
|
2017
|
2016
|
||||||
|
Projected benefit obligation
|
$
|
|
|
$
|
|
|
||
|
Accumulated benefit obligation
|
|
|
|
|
||||
|
Fair value of plan assets
|
|
|
|
|
||||
|
Information for pension plans with a projected benefit obligation in excess of plan assets:
|
||||||||
|
|
2017
|
2016
|
||||||
|
Projected benefit obligation
|
$
|
|
|
$
|
|
|
||
|
Accumulated benefit obligation
|
|
|
|
|
||||
|
Fair value of plan assets
|
|
|
|
|
||||
83
|
2017
|
2016
|
2015
|
||||||||||
|
Service cost
|
$
|
|
|
$
|
|
|
$
|
|
|
|||
|
Interest cost
|
|
|
|
|
|
|
||||||
|
Amortization of prior service cost
(a)
|
|
|
|
|
|
|
|
|
||||
|
Expected return on plan assets
|
(
|
)
|
(
|
)
|
(
|
)
|
||||||
|
Amortization of net loss
|
|
|
|
|
|
|
||||||
|
Net periodic benefit cost
|
$
|
|
|
$
|
|
|
$
|
|
|
|||
|
Additional (gain) loss recognized due to:
Settlement charges
(b)
|
$
|
|
|
$
|
|
|
$
|
|
|
|||
|
Special termination benefits
|
$
|
|
|
$
|
|
|
$
|
|
|
|||
|
Pension data adjustment
(c)
|
$
|
|
|
$
|
|
|
$
|
|
|
|||
|
(a)
|
|
|
(b)
|
|
|
(c)
|
|
|
Pension gains (losses) in AOCI:
|
||||||||
|
|
2017
|
2016
|
||||||
|
Beginning of year
|
$
|
(
|
)
|
$
|
(
|
)
|
||
|
Net actuarial gain (loss)
|
(
|
)
|
(
|
)
|
||||
|
Curtailments
|
|
|
|
|
||||
|
Amortization of net loss
|
|
|
|
|
||||
|
Amortization of prior service cost
|
|
|
|
|
||||
|
Prior service cost
|
(
|
)
|
(
|
)
|
||||
|
Settlement charges
|
|
|
|
|
||||
|
End of year
|
$
|
(
|
)
|
$
|
(
|
)
|
||
|
Accumulated pre-tax losses recognized within AOCI:
|
||||||||
|
|
2017
|
2016
|
||||||
|
Actuarial net loss
|
$
|
(
|
)
|
$
|
(
|
)
|
||
|
Prior service cost
|
(
|
)
|
(
|
)
|
||||
|
|
$
|
(
|
)
|
$
|
(
|
)
|
||
The estimated net loss that will be amortized from AOCI into net periodic pension cost in
2018
is
$
16
million
. The estimated prior service cost that will be amortized from AOCI into net periodic pension cost in
2018
is
$
6
million
.
|
Weighted-average assumptions used to determine benefit obligations at the measurement dates:
|
||||||
|
|
2017
|
2016
|
||||
|
Discount rate
|
|
%
|
|
%
|
||
|
Rate of compensation increase
|
|
%
|
|
%
|
||
84
|
Weighted-average assumptions used to determine the net periodic benefit cost for fiscal years:
|
|||||||||
|
|
2017
(a)
|
2016
|
2015
|
||||||
|
Discount rate
|
|
%
|
|
%
|
|
%
|
|||
|
Long-term rate of return on plan assets
|
|
%
|
|
%
|
|
%
|
|||
|
Rate of compensation increase
|
|
%
|
|
%
|
|
%
|
|||
(a)
Reflects a weighted average due to interim remeasurements in 2017.
Our estimated long-term rate of return on plan assets represents the weighted-average of expected future returns on the asset categories included in our target investment allocation based primarily on the historical returns for each asset category and future growth expectations.
Plan Assets
|
|
2017
|
2016
|
||||||
|
Level 1:
|
||||||||
|
Cash
|
$
|
|
|
$
|
|
|
||
|
Cash Equivalents
(a)
|
|
|
|
|
||||
|
Fixed Income Securities - U.S. Corporate
(b)
|
|
|
|
|
||||
|
Equity Securities – U.S. Large cap
(b)
|
|
|
|
|
||||
|
Equity Securities – U.S. Mid cap
(b)
|
|
|
|
|
||||
|
Equity Securities – U.S. Small cap
(b)
|
|
|
|
|
||||
|
Equity Securities – Non-U.S.
(b)
|
|
|
|
|
||||
|
Level 2:
|
|
|
||||||
|
Fixed Income Securities – U.S. Corporate
(c)
|
|
|
|
|
||||
|
Fixed Income Securities – U.S. Government and Government Agencies
(d)
|
|
|
|
|
||||
|
Fixed Income Securities – Other
(d)
|
|
|
|
|
||||
|
Total fair value of plan assets
(e)
|
$
|
|
|
$
|
|
|
||
|
(a)
|
|
|
(b)
|
|
|
(c)
|
|
|
(d)
|
|
|
(e)
|
|
Our primary objectives regarding the investment strategy for the Plan’s assets are to reduce interest rate and market risk and to provide adequate liquidity to meet immediate and future payment requirements. To achieve these objectives, we are using a combination of active and passive investment strategies. The Plan's equity securities, currently targeted to be
50
%
of our investment mix, consist primarily of low-cost index funds focused on achieving long-term capital appreciation. The Plan diversifies its equity risk by investing in several different U.S. and foreign market index funds. Investing in these index funds provides the Plan with the adequate liquidity required to fund benefit payments and plan expenses. The fixed income asset allocation, currently targeted to be
50
%
of our mix, is actively managed and consists of long-duration fixed income securities that help to reduce exposure to interest rate variation and to better correlate asset maturities with obligations. The fair values of all pension plan assets are determined based on closing market prices or net asset values.
85
A mutual fund held as an investment by the Plan includes shares of Common Stock valued at
$
0.3
million
at both
December 31, 2017
and
December 31, 2016
(less than
1
%
of total plan assets in each instance).
Benefit Payments
|
Year ended:
|
||||
|
2018
|
$
|
|
|
|
|
2019
|
|
|
||
|
2020
|
|
|
||
|
2021
|
|
|
||
|
2022
|
|
|
||
|
2023 - 2027
|
|
|
||
International Pension Plans
We also sponsor various defined benefit plans covering certain of our non-U.S. employees, the most significant of which are in the UK. Both of our UK plans have previously been frozen such that they are closed to new participants and existing participants can no longer earn future service credits.
At the end of 2017 and 2016, the projected benefit obligations of these UK plans totaled
$
287
million
and
$
261
million
, respectively and plan assets totaled
$
358
million
and
$
305
million
, respectively. These plans were both in a net overfunded position at the end of 2017 and 2016 and related expense amounts recorded in each of 2017, 2016 and 2015 were not significant.
The funding rules for our pension plans outside of the U.S. vary from country to country and depend on many factors including discount rates, performance of plan assets, local laws and regulations. We do not plan to make significant contributions to either of our UK plans in 2018.
Retiree Medical Benefits
Our post-retirement plan provides health care benefits, principally to U.S. salaried retirees and their dependents, and includes retiree cost-sharing provisions. This plan was previously amended such that any salaried employee hired or rehired by YUM after September 30, 2001 is not eligible to participate in this plan. Employees hired prior to September 30, 2001 are eligible for benefits if they meet age and service requirements and qualify for retirement benefits. We fund our post-retirement plan as benefits are paid.
At the end of both
2017
and
2016
, the accumulated post-retirement benefit obligation was
$
55
million
. Actuarial gains of
$
8
million
and
$
10
million
were recognized in AOCI at the end of
2017
and
2016
, respectively. The net periodic benefit cost recorded was
$
2
million
in
2017
and
$
3
million
in both
2016
and
2015
, the majority of which is interest cost on the accumulated post-retirement benefit obligation. The weighted-average assumptions used to determine benefit obligations and net periodic benefit cost for the post-retirement medical plan are identical to those as shown for the U.S. pension plans. Our assumed heath care cost trend rates for the following year as of
2017
and
2016
are
6.3
%
and
6.6
%
, respectively, with expected ultimate trend rates of
4.5
%
reached in 2038.
There is a cap on our medical liability for certain retirees. The cap for Medicare-eligible retirees was reached in 2000 and the cap for non-Medicare eligible retirees was reached in 2014; with the cap, our annual cost per retiree will not increase. A one-percentage-point increase or decrease in assumed health care cost trend rates would have no impact on total service and interest cost or on the post-retirement benefit obligation. The benefits expected to be paid in each of the next five years are approximately
$
5
million
and in aggregate for the five years thereafter are
$
17
million
.
86
Retiree Savings Plan
Overview
At year end 2017, we had one stock award plan in effect: the YUM! Brands, Inc. Long-Term Incentive Plan (the “LTIP”). Under the LTIP, the exercise price of stock options and SARs granted must be equal to or greater than the average market price or the ending market price of the Company’s stock on the date of grant.
Potential awards to employees and non-employee directors under the LTIP include stock options, incentive stock options, SARs, restricted stock, restricted stock units (“RSUs”), performance restricted stock units, performance share units (“PSUs”) and performance units. We have issued only stock options, SARs, RSUs and PSUs under the LTIP. While awards under the LTIP can have varying vesting provisions and exercise periods, outstanding awards under the LTIP vest in periods ranging from
immediate
to five years. Stock options and SARs expire ten years after grant.
At year end
2017
, approximately
28
million
shares were available for future share-based compensation grants under the LTIP.
Our EID Plan allows participants to defer receipt of a portion of their annual salary and all or a portion of their incentive compensation. As defined by the EID Plan, we credit the amounts deferred with earnings based on the investment options selected by the participants. These investment options are limited to cash, phantom shares of our Common Stock, phantom shares of a Stock Index Fund and phantom shares of a Bond Index Fund. Investments in cash and phantom shares of both index funds will be distributed in cash at a date as elected by the employee and therefore are classified as a liability on our Consolidated Balance Sheets. We recognize compensation expense for the appreciation or the depreciation, if any, of investments in cash and both of the index funds. Deferrals into the phantom shares of our Common Stock will be distributed in shares of our Common Stock, under the LTIP, at a date as elected by the employee and therefore are classified in Common Stock on our Consolidated Balance Sheets. We do not recognize compensation expense for the appreciation or the depreciation, if any, of investments in phantom shares of our Common Stock. Our EID plan also allows certain participants to defer incentive compensation to purchase phantom shares of our Common Stock and receive a
33
%
Company match on the amount deferred. Deferrals receiving a match are similar to a RSU award in that participants will generally forfeit both the match and incentive compensation amounts deferred if they voluntarily separate from employment during a vesting period that is two years from the date of deferral. We expense the intrinsic value of the match and the incentive compensation over the requisite service period which includes the vesting period.
Historically, the Company has repurchased shares on the open market in excess of the amount necessary to satisfy award exercises and expects to continue to do so in 2018.
In connection with the Separation of our China business in the prior year, under the provisions of our LTIP, employee stock options, SARs, RSUs and PSUs were adjusted to maintain the pre-spin intrinsic value of the awards. Depending on the tax laws of the country of employment, awards were modified using either the shareholder method or the employer method. Share issuances for Yum China awards held by YUM employees will be satisfied by Yum China. Share issuances for YUM awards held by Yum China employees are being satisfied by YUM. Share-based compensation as recorded in Income from continuing operations is based on the amortization of the fair value for both YUM and Yum China awards held by YUM employees.
The shareholder method was based on the premise that employees holding YUM awards prior to the Separation should receive an equal number of awards of both YUM and Yum China. For stock options and SARs, exercise prices of these post-Separation YUM and Yum China awards were established that, on a combined basis, maintained the intrinsic value on the YUM award prior to the Separation. The exercise prices provided for an initial intrinsic value in each of the post-Separation YUM and YUM China awards that was proportionate to the market value of the two companies on November 1, 2016. For RSUs and PSUs modified under the shareholder method, each YUM award was modified into one YUM award and one Yum China award.
Under the employer method, employees holding YUM awards prior to the Separation had their awards converted into awards of the company that they worked for subsequent to the Separation. For stock options and SARs modified under the employer method,
87
The modifications to the outstanding equity awards resulted in an insignificant amount of additional compensation expense in the year ended December 31, 2016.
Investments in phantom shares of our Common Stock held within our EID Plan by employees that remained with YUM post-Separation that were converted into phantom investments in Yum China at Separation under the shareholder method are allowed to be transferred into cash, phantom shares of a Stock Index Fund and phantom shares of a Bond Index Fund within the EID Plan. As such, distributions of current investments in phantom shares of Yum China may now be settled in cash, as opposed to stock, at a date as elected by the employee and, therefore, are classified as a liability and remeasured to fair value at each reporting period in our Consolidated Balance Sheet. During 2017 and 2016, we recorded
$
18
million
and
$
30
million
, respectively, within G&A related to these awards (See Note 5).
Award Valuation
|
|
2017
|
2016
|
2015
|
||||||
|
Risk-free interest rate
|
|
%
|
|
%
|
|
%
|
|||
|
Expected term (years)
|
6.4 years
|
|
6.4 years
|
|
6.4 years
|
|
|||
|
Expected volatility
|
|
%
|
|
%
|
|
%
|
|||
|
Expected dividend yield
|
|
%
|
|
%
|
|
%
|
|||
We believe it is appropriate to group our stock option and SAR awards into
two
homogeneous groups when estimating expected term. These groups consist of grants made primarily to restaurant-level employees, which cliff-vest after
4
years and expire
10
years after grant, and grants made to executives, which typically have a graded vesting schedule of
25%
per year over
4
years and expire
10
years after grant. We use a single weighted-average term for our awards that have a graded vesting schedule. Based on analysis of our historical exercise and post-vesting termination behavior, we have determined that our restaurant-level employees and our executives exercised the awards on average after
5
years and
6.5
years, respectively.
When determining expected volatility, we consider both historical volatility of our stock as well as implied volatility associated with our publicly traded options. The expected dividend yield is based on the annual dividend yield at the time of grant.
The fair values of RSU awards are based on the closing price of our Common Stock on the date of grant. The fair values of PSU awards with market-based conditions have been valued based on the outcome of a Monte Carlo simulation.
88
Award Activity
|
|
Shares
(in thousands)
|
Weighted-Average Exercise
Price
|
Weighted- Average Remaining Contractual Term (years)
|
Aggregate Intrinsic Value (in millions)
|
||||||||||||
|
Outstanding at the beginning of the year
|
|
|
|
$
|
|
|
|
|
||||||||
|
Granted
|
|
|
|
|
|
|
|
|||||||||
|
Exercised
|
(
|
)
|
|
|
|
|
||||||||||
|
Forfeited or expired
|
(
|
)
|
|
|
|
|
||||||||||
|
Outstanding at the end of the year
|
|
|
(a)
|
|
|
5.42
|
|
$
|
|
|
||||||
|
Exercisable at the end of the year
|
|
|
|
$
|
|
|
4.00
|
|
$
|
|
|
|||||
|
(a)
|
|
The weighted-average grant-date fair value of stock options and SARs granted during
2017
,
2016
and
2015
was
$
14.08
,
$
14.40
and
$
15.95
, respectively. The total intrinsic value of stock options and SARs exercised during the years ended
December 31, 2017
,
December 31, 2016
and
December 31, 2015
, was
$
154
million
,
$
263
million
and
$
153
million
, respectively.
As of
December 31, 2017
,
$
55
million
of unrecognized compensation cost related to unvested stock options and SARs, which will be reduced by any forfeitures that occur, is expected to be recognized over a remaining weighted-average period of approximately
1.8
years. This reflects unrecognized cost for both YUM and Yum China awards held by YUM employees. The total fair value at grant date of awards for both YUM and Yum China awards held by YUM employees that vested during
2017
,
2016
and
2015
was
$
33
million
,
$
41
million
and
$
42
million
, respectively.
RSUs and PSUs
As of
December 31, 2017
, there was
$
20
million
of unrecognized compensation cost related to
1.0
million
unvested RSUs and PSUs. The total fair value at grant date of awards that vested during 2017, 2016 and 2015 was
$
10
million
,
$
7
million
and
$
11
million
, respectively.
Impact on Net Income
|
|
2017
|
2016
|
2015
|
|||||||||
|
Options and SARs
|
$
|
|
|
$
|
|
|
$
|
|
|
|||
|
Restricted Stock Units
|
|
|
|
|
|
|
||||||
|
Performance Share Units
|
|
|
|
|
|
|
||||||
|
Total Share-based Compensation Expense
|
$
|
|
|
(a)
|
$
|
|
|
(b)
|
$
|
|
|
|
|
Deferred Tax Benefit recognized
|
$
|
|
|
(c)
|
$
|
|
|
$
|
|
|
||
|
EID compensation expense not share-based
|
$
|
|
|
$
|
|
|
$
|
|
|
|||
(a)
Includes
$
18
million
due to appreciation in the market price of Yum China's stock. See Note 5.
(b)
Includes
$
30
million
due to modifications of awards in connection with the Separation that was not allocated to any of
89
Cash received from stock option exercises for
2017
,
2016
and
2015
, was
$
12
million
,
$
5
million
and
$
12
million
, respectively. Tax benefits realized on our tax returns from tax deductions associated with share-based compensation for
2017
,
2016
and
2015
totaled
$
153
million
,
$
109
million
and
$
62
million
, respectively.
Under the authority of our Board of Directors, we repurchased shares of our Common Stock during
2017
,
2016
and
2015
. All amounts exclude applicable transaction fees.
|
|
Shares Repurchased
(thousands)
|
Dollar Value of Shares
Repurchased
|
|||||||||||||||||||||||||
|
Authorization Date
|
2017
|
|
2016
|
|
2015
|
|
2017
|
|
2016
|
|
2015
|
|
|||||||||||||||
|
November 2017
|
|
|
|
|
|
|
$
|
|
|
$
|
|
|
$
|
|
|
||||||||||||
|
November 2016
|
|
|
|
|
|
|
|
|
|
|
|
|
|||||||||||||||
|
May 2016
|
|
|
|
|
|
|
|
|
|
|
|
|
|||||||||||||||
|
March 2016
|
|
|
|
|
|
|
|
|
|
|
|
|
|||||||||||||||
|
December 2015
|
|
|
|
|
|
|
|
|
|
|
|
|
|||||||||||||||
|
November 2014
|
|
|
|
|
|
|
|
|
|
|
|
|
|||||||||||||||
|
November 2013
|
|
|
|
|
|
|
|
|
|
|
|
|
|||||||||||||||
|
Total
|
|
|
(a)
|
|
|
(a)
|
|
|
$
|
|
|
(a)
|
$
|
|
|
(a)
|
$
|
|
|
||||||||
|
(a)
|
|
On November 16, 2017, our Board of Directors authorized share repurchases through December 2018 of up to
$
1.5
billion
(excluding applicable transaction fees) of our outstanding Common Stock. As of December 31, 2017, we have remaining capacity to repurchase up to
$
1.5
billion
of Common Stock under this authorization.
90
|
Translation Adjustments and Gains (Losses) From Intra-Entity Transactions of a Long-Term Nature
(a)
|
Pension and Post-Retirement Benefits
(b)
|
Derivative Instruments
(c)
|
Total
|
|||||||||||||
|
Balance at December 31, 2015, net of tax
|
$
|
(
|
)
|
$
|
(
|
)
|
$
|
(
|
)
|
$
|
(
|
)
|
||||
|
Gains (losses) arising during the year classified into AOCI, net of tax
|
(
|
)
|
(
|
)
|
|
|
(
|
)
|
||||||||
|
(Gains) losses reclassified from AOCI, net of tax
|
(
|
)
|
|
|
(
|
)
|
(
|
)
|
||||||||
|
OCI, net of tax
|
(
|
)
|
(
|
)
|
|
|
(
|
)
|
||||||||
|
Separation of China business
|
(
|
)
|
|
|
|
|
(
|
)
|
||||||||
|
Balance at December 31, 2016, net of tax
|
$
|
(
|
)
|
$
|
(
|
)
|
$
|
|
|
$
|
(
|
)
|
||||
|
Gains (losses) arising during the year classified into AOCI, net of tax
|
|
|
(
|
)
|
(
|
)
|
|
|
||||||||
|
(Gains) losses reclassified from AOCI, net of tax
|
|
|
|
|
|
|
|
|
||||||||
|
OCI, net of tax
|
|
|
|
|
|
|
|
|
||||||||
|
Balance at December 31, 2017, net of tax
|
$
|
(
|
)
|
$
|
(
|
)
|
$
|
|
|
(
|
)
|
|||||
|
(a)
|
|
|
(b)
|
|
|
(c)
|
|
91
|
|
2017
|
2016
|
2015
|
|||||||||
|
U.S.
|
$
|
|
|
$
|
|
|
$
|
|
|
|||
|
Foreign
|
|
|
|
|
|
|
||||||
|
|
$
|
|
|
$
|
|
|
$
|
|
|
|||
|
|
|
2017
|
2016
|
2015
|
||||||||||
|
Current:
|
Federal
|
$
|
(
|
)
|
$
|
|
|
$
|
|
|
||||
|
|
Foreign
|
|
|
|
|
|
|
|||||||
|
|
State
|
|
|
|
|
|
|
|||||||
|
|
|
$
|
|
|
$
|
|
|
|
|
|||||
|
Deferred:
|
Federal
|
$
|
|
|
$
|
|
|
(
|
)
|
|||||
|
|
Foreign
|
|
|
|
|
|
|
|||||||
|
|
State
|
|
|
|
|
|
|
|||||||
|
|
|
$
|
|
|
$
|
|
|
$
|
(
|
)
|
||||
|
|
|
$
|
|
|
|
$
|
|
|
|
$
|
|
|
||
|
|
2017
|
2016
|
2015
|
||||||||||||||||||
|
U.S. federal statutory rate
|
$
|
|
|
|
%
|
$
|
|
|
|
%
|
$
|
|
|
|
%
|
||||||
|
State income tax, net of federal tax benefit
|
|
|
|
|
|
|
|
|
|
|
|
|
|||||||||
|
Statutory rate differential attributable to foreign operations
|
(
|
)
|
(
|
)
|
(
|
)
|
(
|
)
|
(
|
)
|
(
|
)
|
|||||||||
|
Adjustments to reserves and prior years
|
|
|
|
|
(
|
)
|
(
|
)
|
|
|
|
|
|||||||||
|
Share-based payments
|
(
|
)
|
(
|
)
|
|
|
|
|
|
|
|
|
|||||||||
|
Change in valuation allowances
|
|
|
|
|
(
|
)
|
(
|
)
|
|
|
|
|
|||||||||
|
Other, net
|
(
|
)
|
(
|
)
|
(
|
)
|
(
|
)
|
(
|
)
|
(
|
)
|
|||||||||
|
Tax Act Enactment
|
|
|
|
|
|
|
|
|
|
|
|
|
|||||||||
|
Effective income tax rate
|
$
|
|
|
|
%
|
$
|
|
|
|
%
|
$
|
|
|
|
%
|
||||||
Statutory rate differential attributable to foreign operations.
This item includes local taxes, withholding taxes, and shareholder-level taxes, net of foreign tax credits. The favorable impact is primarily attributable to a majority of our income being earned outside of the U.S. where tax rates are generally lower than the U.S. rate.
In 2015, this benefit was positively impacted by the repatriation of current year foreign earnings as we recognized excess foreign tax credits, resulting from the related effective foreign tax rate being higher than the U.S. federal statutory rate.
Adjustments to reserves and prior years.
This item includes: (1) changes in tax reserves, including interest thereon, established for potential exposure we may incur if a taxing authority takes a position on a matter contrary to our position; and (2) the effects of reconciling income tax amounts recorded in our Consolidated Statements of Income to amounts reflected on our tax returns, including any adjustments to the Consolidated Balance Sheets. The impact of certain effects or changes may offset items reflected in the
'Statutory rate differential attributable to foreign operations'
line.
In 2016, this item was favorably impacted by the resolution of uncertain tax positions in the U.S.
92
Share-based payments.
2017 includes a
$
117
million
tax benefit related to the excess tax benefits from share-based payments. These excess benefits were largely associated with deferred compensation payouts to recently retired employees. See Note 2 for discussion related to the adoption of a new accounting standard for share based payments in 2017.
Change in valuation allowances.
This item relates to changes for deferred tax assets generated or utilized during the current year and changes in our judgment regarding the likelihood of using deferred tax assets that existed at the beginning of the year. The impact of certain changes may offset items reflected in the
'Statutory rate differential attributable to foreign operations'
line.
In 2017,
$
34
million
of net tax expense was driven by valuation allowances recorded against deferred tax assets generated in the current year. This amount excludes a valuation allowance of
$
189
million
related to the Tax Act.
In 2016,
$
3
million
of net tax benefit was driven by
$
14
million
in net tax expense for valuation allowances recorded against deferred tax assets generated in the current year and
$
17
million
in net tax benefit for valuation allowances resulting from a change in judgment regarding the future use of certain deferred tax assets that existed at the beginning of the year.
In 2015,
$
41
million
of net tax expense was driven by
$
17
million
for valuation allowances recorded against deferred tax assets generated in the current year and
$
24
million
in net tax expense resulting from a change in judgment regarding the future use of certain deferred tax assets that existed at the beginning of the year.
Other.
This item primarily includes the impact of permanent differences related to current year earnings as well as U.S. tax credits and deductions.
In 2017, this item was primarily driven by the favorable impact of certain international refranchising gains.
Tax Act Enactment.
On December 22, 2017, the U.S. government enacted comprehensive Federal tax legislation commonly referred to as the Tax Cuts and Jobs Act of 2017 (the "Tax Act"). The Tax Act significantly modifies the U.S. corporate income tax system by, among other things, reducing the federal income tax rate from
35
%
to
21
%
, limiting certain deductions, including limiting the deductibility of interest expense to
30
%
of U.S. Earnings Before Interest, Taxes, Depreciation and Amortization, imposing a mandatory one-time deemed repatriation tax on accumulated foreign earnings and creating a territorial tax system that changes the manner in which future foreign earnings are subject to U.S. tax. On December 22, 2017, the SEC staff issued Staff Accounting Bulletin 118 that allows us to record provisional amounts related to the impacts of the Tax Act during a measurement period not to extend beyond one year of the enactment date. We currently are analyzing the Tax Act and have made reasonable estimates of the effects on our Consolidated Financial Statements and tax disclosures, including the amount of the deemed repatriation tax and changes to our existing deferred tax balances.
The deemed repatriation tax is based on our accumulated foreign earnings and profits that we previously deferred from U.S. income taxes. We recorded an estimated amount for our repatriation tax liability of
$
170
million
as of December 31, 2017. In addition, we remeasured certain net deferred tax assets and liabilities based on the tax rates at which they are expected to reverse in the future. The estimated amount recorded related to the remeasurement of these balances was a net expense of
$
75
million
. Lastly, we recorded a valuation allowance of
$
189
million
on our remaining foreign tax credit carryforwards which are unlikely to be realized under the U.S. territorial tax system. The estimated total impact upon enactment of the Tax Act is
$
434
million
.
We consider the key estimates on the deemed repatriation tax, net deferred tax remeasurement and the impact on our foreign tax credit carryforwards to be incomplete due to our continuing analysis of final year-end data and tax positions. Our analysis could affect the measurement of these balances and give rise to new deferred and other tax assets and liabilities. Since the Tax Act was passed late in the fourth quarter of 2017, and further guidance and accounting interpretation is expected over the next 12 months, our review is still pending. We expect to complete our analysis of the amounts recorded upon enactment of the Tax Act within the measurement period of one year.
93
|
|
2017
|
2016
|
||||||
|
Operating losses
|
$
|
|
|
$
|
|
|
||
|
Capital losses
|
|
|
|
|
||||
|
Tax credit carryforwards
|
|
|
|
|
||||
|
Employee benefits
|
|
|
|
|
||||
|
Share-based compensation
|
|
|
|
|
||||
|
Self-insured casualty claims
|
|
|
|
|
||||
|
Lease-related liabilities
|
|
|
|
|
||||
|
Various liabilities
|
|
|
|
|
||||
|
Property, plant and equipment
|
|
|
|
|
||||
|
Deferred income and other
|
|
|
|
|
||||
|
Gross deferred tax assets
|
|
|
|
|
||||
|
Deferred tax asset valuation allowances
|
(
|
)
|
(
|
)
|
||||
|
Net deferred tax assets
|
$
|
|
|
$
|
|
|
||
|
Intangible assets, including goodwill
|
$
|
(
|
)
|
$
|
(
|
)
|
||
|
Property, plant and equipment
|
(
|
)
|
(
|
)
|
||||
|
Deemed repatriation tax
|
(
|
)
|
|
|
||||
|
Other
|
(
|
)
|
(
|
)
|
||||
|
Gross deferred tax liabilities
|
$
|
(
|
)
|
$
|
(
|
)
|
||
|
Net deferred tax assets (liabilities)
|
$
|
|
|
|
$
|
|
|
|
|
Reported in Consolidated Balance Sheets as:
|
|
|
||||||
|
Deferred income taxes
|
$
|
|
|
|
$
|
|
|
|
|
Other liabilities and deferred credits
|
(
|
)
|
(
|
)
|
||||
|
|
$
|
|
|
|
$
|
|
|
|
As of December 31, 2017, we had approximately
$
3.2
billion
of unremitted foreign earnings. We have historically reinvested all the unremitted earnings of our foreign subsidiaries and affiliates, and therefore have not recognized any U.S. deferred tax liability on these earnings. However, upon the enactment of the Tax Act, the unremitted earnings of our foreign subsidiaries and affiliates are subject to U.S. tax due to the mandatory deemed repatriation tax on accumulated foreign earnings provision. As a result, we recognized a one-time income tax expense of
$
170
million
. Our intent is to indefinitely reinvest our unremitted earnings outside the U.S. and our current plans do not demonstrate a need to repatriate these amounts to fund our U.S. operations. Thus, for our investments in foreign subsidiaries where the carrying values for financial reporting exceed the tax basis, we have not provided taxes, other than U.S. federal taxes, for the portion of the excess that we believe is permanently invested, as we have the ability and intent to indefinitely postpone these basis differences from reversing with a tax consequence. However, if these funds were repatriated, we would be required to accrue and pay applicable income taxes (if any) and withholding taxes payable to various countries. A determination of the deferred tax liability on this amount is not practicable.
At
December 31, 2017
, the Company has foreign operating and capital loss carryforwards of
$
0.5
billion
and U.S. state operating loss and tax credit carryforwards of
$
1.1
billion
and U.S. federal tax credit carryforwards of
$
0.3
billion
. A valuation allowance of
$
434
million
has been recorded against the carryforwards that are not likely to be realized.
These losses are being carried forward in jurisdictions where we are permitted to use tax losses from prior periods to reduce future taxable income and will expire as follows:
94
|
|
Year of Expiration
|
|
||||||||||||||||||
|
|
2018
|
2019-2022
|
2023-2036
|
Indefinitely
|
Total
|
|||||||||||||||
|
Foreign
|
$
|
|
|
$
|
|
|
$
|
|
|
$
|
|
|
$
|
|
|
|||||
|
U.S. state
|
|
|
|
|
|
|
|
|
|
|
||||||||||
|
U.S. federal
|
|
|
|
|
|
|
|
|
|
|
||||||||||
|
|
$
|
|
|
$
|
|
|
$
|
|
|
$
|
|
|
$
|
|
|
|||||
We recognize the benefit of positions taken or expected to be taken in tax returns in the Consolidated Financial Statements when it is more likely than not that the position would be sustained upon examination by tax authorities. A recognized tax position is measured at the largest amount of benefit that is greater than fifty percent likely of being realized upon settlement.
The Company had
$
100
million
and
$
91
million
of unrecognized tax benefits at
December 31, 2017
and
December 31, 2016
, respectively,
$
10
million
and
$
87
million
of which are temporary in nature and if recognized, would not impact the effective income tax rate.
A reconciliation of the beginning and ending amount of unrecognized tax benefits follows:
|
|
2017
|
2016
|
||||||
|
Beginning of Year
|
$
|
|
|
$
|
|
|
||
|
Additions on tax positions - current year
|
|
|
|
|
||||
|
Additions for tax positions - prior years
|
|
|
|
|
||||
|
Reductions for tax positions - prior years
|
|
|
(
|
)
|
||||
|
Reductions for settlements
|
(
|
)
|
(
|
)
|
||||
|
Reductions due to statute expiration
|
(
|
)
|
(
|
)
|
||||
|
Foreign currency translation adjustment
|
|
|
|
|
||||
|
End of Year
|
$
|
|
|
$
|
|
|
||
The Company believes its unrecognized tax benefits will not materially increase or decrease in the next 12 months.
The Company’s income tax returns are subject to examination in the U.S. federal jurisdiction and numerous U.S. state and foreign jurisdictions.
The Company has settled audits with the IRS through fiscal year 2010. Our operations in certain foreign jurisdictions remain subject to examination for tax years as far back as 2006, some of which years are currently under audit by local tax authorities.
|
|
2017
|
2016
|
||||||
|
Accrued interest and penalties
|
$
|
|
|
$
|
|
|
||
During
2017
,
2016
and
2015
, a net expense of
$
5
million
, a net benefit of
$
4
million
and a net expense of
$
5
million
, respectively, for interest and penalties was recognized in our Consolidated Statements of Income as components of its Income tax provision.
95
See Note 1 for a description of our operating segments.
|
|
Revenues
|
|||||||||||
|
|
2017
|
2016
|
2015
|
|||||||||
|
KFC Division
(a)
|
$
|
|
|
|
$
|
|
|
|
$
|
|
|
|
|
Pizza Hut Division
(a)
|
|
|
|
|
|
|
|
|
||||
|
Taco Bell Division
(a)
|
|
|
|
|
|
|
||||||
|
Unallocated
(b)(f)
|
(
|
)
|
(
|
)
|
|
|
||||||
|
|
$
|
|
|
|
$
|
|
|
|
$
|
|
|
|
|
|
Operating Profit; Interest Expense, Net; and
Income Before Income Taxes
|
|||||||||||
|
|
2017
|
2016
|
2015
|
|||||||||
|
KFC Division
|
$
|
|
|
|
$
|
|
|
|
$
|
|
|
|
|
Pizza Hut Division
|
|
|
|
|
|
|
|
|
||||
|
Taco Bell Division
|
|
|
|
|
|
|
||||||
|
Unallocated Franchise and license fees and income
(b)(f)
|
(
|
)
|
(
|
)
|
|
|
||||||
|
Unallocated restaurant costs
(b)(i)
|
|
|
|
|
|
|
|
|
||||
|
Unallocated Franchise and license expenses
(b)(f)
|
(
|
)
|
(
|
)
|
(
|
)
|
||||||
|
Corporate and unallocated G&A expenses
(b)(g)
|
(
|
)
|
|
(
|
)
|
|
(
|
)
|
||||
|
Unallocated Refranchising gain (loss)
(b)
|
|
|
|
|
|
|
(
|
)
|
||||
|
Unallocated Other income (expense)
(b)(h)
|
(
|
)
|
|
(
|
)
|
|
(
|
)
|
||||
|
Operating Profit
|
|
|
|
|
|
|
|
|
||||
|
Other pension income (expense)
(b)(j)
|
(
|
)
|
(
|
)
|
(
|
)
|
||||||
|
Interest expense, net
(b)
|
(
|
)
|
|
(
|
)
|
|
(
|
)
|
||||
|
Income from continuing operations before income taxes
|
$
|
|
|
|
$
|
|
|
|
$
|
|
|
|
|
|
Depreciation and Amortization
|
|||||||||||
|
|
2017
|
2016
|
2015
|
|||||||||
|
KFC Division
|
$
|
|
|
$
|
|
|
|
|
||||
|
Pizza Hut Division
|
|
|
|
|
|
|
||||||
|
Taco Bell Division
|
|
|
|
|
|
|
||||||
|
Corporate
|
|
|
|
|
|
|
||||||
|
|
$
|
|
|
$
|
|
|
$
|
|
|
|||
|
|
Capital Spending
|
|||||||||||
|
|
2017
|
2016
|
2015
|
|||||||||
|
KFC Division
|
$
|
|
|
$
|
|
|
$
|
|
|
|||
|
Pizza Hut Division
|
|
|
|
|
|
|
||||||
|
Taco Bell Division
|
|
|
|
|
|
|
||||||
|
Corporate
|
|
|
|
|
|
|
||||||
|
|
$
|
|
|
$
|
|
|
$
|
|
|
|||
96
|
|
Identifiable Assets
|
|||||||
|
2017
|
2016
|
|||||||
|
KFC Division
(e)
|
$
|
|
|
$
|
|
|
||
|
Pizza Hut Division
(e)
|
|
|
|
|
||||
|
Taco Bell Division
(e)
|
|
|
|
|
||||
|
Corporate
(c)(e)
|
|
|
|
|
||||
|
|
$
|
|
|
$
|
|
|
||
|
|
Long-Lived Assets
(d)
|
|||||||
|
|
2017
|
2016
|
||||||
|
KFC Division
|
$
|
|
|
$
|
|
|
||
|
Pizza Hut Division
|
|
|
|
|
||||
|
Taco Bell Division
|
|
|
|
|
||||
|
Corporate
|
|
|
|
|
||||
|
|
$
|
|
|
$
|
|
|
||
|
(a)
|
|
(b)
Amounts have not been allocated to any segment for performance reporting purposes.
(c)
Primarily includes cash and deferred tax assets.
(d)
Includes PP&E, goodwill, and intangible assets, net.
|
(e)
|
|
|
(f)
|
|
|
(g)
|
|
|
(h)
|
|
|
(i)
|
|
|
(j)
|
|
Lease Guarantees
As a result of having assigned our interest in obligations under real estate leases as a condition to the refranchising of certain Company-owned restaurants, and guaranteeing certain other leases, we are frequently contingently liable on lease agreements. These leases have varying terms, the latest of which expires in 2065. As of
December 31, 2017
, the potential amount of undiscounted payments we could be required to make in the event of non-payment by the primary lessee was approximately
$
600
million
. The present value of these potential payments discounted at our pre-tax cost of debt at
December 31, 2017
was
97
approximately
$
500
million
. Our franchisees are the primary lessees under the vast majority of these leases. We generally have cross-default provisions with these franchisees that would put them in default of their franchise agreement in the event of non-payment under the lease. We believe these cross-default provisions significantly reduce the risk that we will be required to make payments under these leases. Accordingly, the liability recorded for our probable exposure under such leases at
December 31, 2017
and
December 31, 2016
was not material.
Franchise Loan Pool and Equipment Guarantees
We have agreed to provide financial support, if required, to a variable interest entity that operates a franchisee lending program used primarily to assist franchisees in the development of new restaurants or the upgrade of existing restaurants and, to a lesser extent, in connection with the Company’s refranchising programs in the U.S. We have determined that we are not required to consolidate this entity as we share the power to direct this entity’s lending activity with other parties. We have provided guarantees of
20
%
of the outstanding loans of the franchisee loan program. As such, at
December 31, 2017
our guarantee exposure under this program is
$
3
million
based on total loans outstanding of
$
15
million
.
In addition to the guarantees described above, YUM has agreed to provide guarantees of up to
$
43
million
on behalf of franchisees for several financing programs related to equipment purchases and refranchising. At
December 31, 2017
, our guarantee exposure under these financing programs is
$
10
million
based on total loans outstanding of
$
31
million
.
Insurance Programs
We are self-insured for a substantial portion of our current and prior years’ coverage including property and casualty losses. To mitigate the cost of our exposures for certain property and casualty losses, we self-insure the risks of loss up to defined maximum per occurrence retentions on a line-by-line basis. The Company then purchases insurance coverage, up to a certain limit, for losses that exceed the self-insurance per occurrence retention. The insurers’ maximum aggregate loss limits are significantly above our actuarially determined probable losses; therefore, we believe the likelihood of losses exceeding the insurers’ maximum aggregate loss limits is remote.
|
|
Beginning Balance
|
Expense
|
Payments
|
Ending Balance
|
||||||||||
|
2017 Activity
|
$
|
|
|
|
|
(
|
)
|
$
|
|
|
||||
|
2016 Activity
|
$
|
|
|
|
|
(
|
)
|
$
|
|
|
||||
Due to the inherent volatility of actuarially determined property and casualty loss estimates, it is reasonably possible that we could experience changes in estimated losses which could be material to our growth in quarterly and annual Net Income. We believe that we have recorded reserves for property and casualty losses at a level which has substantially mitigated the potential negative impact of adverse developments and/or volatility.
In the U.S. and in certain other countries, we are also self-insured for healthcare claims and long-term disability for eligible participating employees subject to certain deductibles and limitations. We have accounted for our retained liabilities for property and casualty losses, healthcare and long-term disability claims, including reported and incurred but not reported claims, based on information provided by independent actuaries.
Legal Proceedings
We are subject to various claims and contingencies related to lawsuits, real estate, environmental and other matters arising in the normal course of business. An accrual is recorded with respect to claims or contingencies for which a loss is determined to be probable and reasonably estimable.
98
Note 21
–
Selected Quarterly Financial Data (Unaudited
)
|
|
2017
|
|||||||||||||||||||
|
|
First
Quarter
|
Second
Quarter
|
Third
Quarter
|
Fourth
Quarter
|
Total
|
|||||||||||||||
|
Revenues:
|
|
|
|
|
|
|||||||||||||||
|
Company sales
|
$
|
|
|
$
|
|
|
$
|
|
|
$
|
|
|
$
|
|
|
|||||
|
Franchise and license fees and income
|
|
|
|
|
|
|
|
|
|
|
||||||||||
|
Total revenues
|
|
|
|
|
|
|
|
|
|
|
||||||||||
|
Restaurant profit
|
|
|
|
|
|
|
|
|
|
|
||||||||||
|
Operating Profit
(a)
|
|
|
|
|
|
|
|
|
|
|
||||||||||
|
Net Income
|
|
|
|
|
|
|
|
|
|
|
||||||||||
|
Basic earnings per common share from continuing operations
|
|
|
|
|
|
|
|
|
|
|
||||||||||
|
Diluted earnings per common share from continuing operations
|
|
|
|
|
|
|
|
|
|
|
||||||||||
|
Dividends declared per common share
|
|
|
|
|
|
|
|
|
|
|
||||||||||
|
|
2016
|
|||||||||||||||||||
|
|
First
Quarter
|
Second
Quarter
|
Third
Quarter
|
Fourth
Quarter
|
Total
|
|||||||||||||||
|
Revenues:
|
|
|
|
|
|
|||||||||||||||
|
Company sales
|
$
|
|
|
$
|
|
|
$
|
|
|
$
|
|
|
$
|
|
|
|||||
|
Franchise and license fees and income
|
|
|
|
|
|
|
|
|
|
|
||||||||||
|
Total revenues
|
|
|
|
|
|
|
|
|
|
|
||||||||||
|
Restaurant profit
|
|
|
|
|
|
|
|
|
|
|
||||||||||
|
Operating Profit
(b)
|
|
|
|
|
|
|
|
|
|
|
||||||||||
|
Income from continuing operations, net of tax
|
|
|
|
|
|
|
|
|
|
|
||||||||||
|
Income (loss) from discontinued operations, net of tax
|
|
|
|
|
|
|
(
|
)
|
|
|
||||||||||
|
Net Income
|
|
|
|
|
|
|
|
|
|
|
||||||||||
|
Basic earnings per common share from continuing operations
|
|
|
|
|
|
|
|
|
|
|
||||||||||
|
Basic earnings (loss) per common share from discontinued operations
|
|
|
|
|
|
|
(
|
)
|
|
|
||||||||||
|
Basic earnings per common share
|
|
|
|
|
|
|
|
|
|
|
||||||||||
|
Diluted earnings per common share from continuing operations
|
|
|
|
|
|
|
|
|
|
|
||||||||||
|
Diluted earnings (loss) per common share from discontinued operations
|
|
|
|
|
|
|
(
|
)
|
|
|
||||||||||
|
Diluted earnings per common share
|
|
|
|
|
|
|
|
|
|
|
||||||||||
|
Dividends declared per common share
|
|
|
|
|
|
|
|
|
|
|
||||||||||
99
|
(a)
|
|
|
(b)
|
|
|
Item 9.
|
Changes In and Disagreements with Accountants on Accounting and Financial Disclosure
.
|
None.
|
Item 9A.
|
Controls and Procedures.
|
Evaluation of Disclosure Controls and Procedures
The Company has evaluated the effectiveness of the design and operation of its disclosure controls and procedures pursuant to Rules 13a-15(e) and 15d-15(e) under the Securities Exchange Act of 1934 as of the end of the period covered by this report. Based on the evaluation, performed under the supervision and with the participation of the Company’s management, including the Chief Executive Officer (the “CEO”) and the Chief Financial Officer (the “CFO”), the Company’s management, including the CEO and CFO, concluded that the Company’s disclosure controls and procedures were effective as of the end of the period covered by this report.
Management’s Report on Internal Control Over Financial Reporting
Our management is responsible for establishing and maintaining adequate internal control over financial reporting, as such term is defined in Rules 13a-15(f) under the Securities Exchange Act of 1934. Under the supervision and with the participation of our management, including our principal executive officer and principal financial officer, we conducted an evaluation of the effectiveness of our internal control over financial reporting based on the framework in
Internal Control – Integrated Framework
(2013)
issued by the Committee of Sponsoring Organizations of the Treadway Commission. Based on our evaluation under the framework in
Internal Control – Integrated Framework (2013)
, our management concluded that our internal control over financial reporting was effective as of
December 31, 2017
.
KPMG LLP, an independent registered public accounting firm, has audited the Consolidated Financial Statements included in this Annual Report on Form 10-K and the effectiveness of our internal control over financial reporting and has issued their report, included herein.
100
Changes in Internal Control
There were no changes with respect to the Company’s internal control over financial reporting or in other factors that materially affected, or are reasonably likely to materially affect, internal control over financial reporting during the quarter ended
December 31, 2017
.
|
Item 9B.
|
Other Information.
|
None.
101
|
Item 10.
|
Directors, Executive Officers and Corporate Governance.
|
Information regarding Section 16(a) compliance, the Audit Committee and the Audit Committee financial expert, the Company’s code of ethics and background of the directors appearing under the captions “Stock Ownership Information,” “Governance of the Company,” “Executive Compensation” and “Item 1: Election of Directors and Director biographies” is incorporated by reference from the Company’s definitive proxy statement which will be filed with the Securities and Exchange Commission no later than 120 days after
December 31, 2017
.
Information
regarding executive officers of the Company is included in Part I.
|
Item 11.
|
Executive Compensation.
|
Information regarding executive and director compensation and the Compensation Committee appearing under the captions “Governance of the Company” and “Executive Compensation” is incorporated by reference from the Company’s definitive proxy statement which will be filed with the Securities and Exchange Commission no later than 120 days after
December 31, 2017
.
|
Item 12.
|
Security Ownership of Certain Beneficial Owners and Management and Related Stockholder Matters.
|
Information regarding equity compensation plans and security ownership of certain beneficial owners and management appearing under the captions “Executive Compensation” and “Stock Ownership Information” is incorporated by reference from the Company’s definitive proxy statement which will be filed with the Securities and Exchange Commission no later than 120 days after
December 31, 2017
.
|
Item 13.
|
Certain Relationships and Related Transactions, and Director Independence.
|
Information regarding certain relationships and related transactions and information regarding director independence appearing under the caption “Governance of the Company” is incorporated by reference from the Company’s definitive proxy statement which will be filed with the Securities and Exchange Commission no later than 120 days after
December 31, 2017
.
|
Item 14.
|
Principal Accountant Fees and Services.
|
Information regarding principal accountant fees and services and audit committee pre-approval policies and procedures appearing under the caption “Item 2: Ratification of Independent Auditors” is incorporated by reference from the Company’s definitive proxy statement which will be filed with the Securities and Exchange Commission no later than 120 days after
December 31, 2017
.
102
|
Item 15.
|
Exhibits and Financial Statement Schedules.
|
|
(a)
|
(1
|
)
|
Financial Statements: Consolidated Financial Statements filed as part of this report are listed under Part II, Item 8 of this Form 10-K.
|
|
|
(2
|
)
|
Financial Statement Schedules: No schedules are required because either the required information is not present or not present in amounts sufficient to require submission of the schedule, or because the information required is included in the Consolidated Financial Statements thereto filed as a part of this Form 10-K.
|
||
|
(3
|
)
|
Exhibits: The exhibits listed in the accompanying Exhibit Index are filed as part of this Form 10-K. The Index to Exhibits specifically identifies each management contract or compensatory plan required to be filed as an exhibit to this Form 10-K.
|
||
103
|
|
SIGNATURES
|
Pursuant to the requirements of Section 13 or 15(d) of the Securities Exchange Act of 1934, the registrant has duly caused this Form 10-K annual report to be signed on its behalf by the undersigned, thereunto duly authorized.
|
Date:
|
February 21, 2018
|
|
|
YUM! BRANDS, INC.
|
|
By:
|
/s/ Greg Creed
|
104
Pursuant to the requirements of the Securities Exchange Act of 1934, this annual report has been signed below by the following persons on behalf of the registrant and in the capacities and on the dates indicated.
|
Signature
|
Title
|
Date
|
||
|
/s/ Greg Creed
|
Chief Executive Officer
|
February 21, 2018
|
||
|
Greg Creed
|
(principal executive officer)
|
|||
|
/s/ David W. Gibbs
|
President and Chief Financial Officer
|
February 21, 2018
|
||
|
David W. Gibbs
|
(principal financial officer)
|
|||
|
/s/ David E. Russell
|
Senior Vice President, Finance and Corporate Controller
|
February 21, 2018
|
||
|
David E. Russell
|
(principal accounting officer)
|
|||
|
/s/ Paget L. Alves
|
Director
|
February 21, 2018
|
||
|
Paget L. Alves
|
||||
|
/s/ Michael J. Cavanagh
|
Director
|
February 21, 2018
|
||
|
Michael J. Cavanagh
|
||||
|
/s/ Christopher M. Connor
|
Director
|
February 21, 2018
|
||
|
Christopher M. Connor
|
||||
|
/s/ Brian C. Cornell
|
Director
|
February 21, 2018
|
||
|
Brian C. Cornell
|
||||
|
/s/ Tanya L. Domier
|
Director
|
February 21, 2018
|
||
|
Tanya L. Domier
|
||||
|
/s/ Mirian M. Graddick-Weir
|
Director
|
February 21, 2018
|
||
|
Mirian M. Graddick-Weir
|
||||
|
/s/ Thomas C. Nelson
|
Director
|
February 21, 2018
|
||
|
Thomas C. Nelson
|
||||
|
/s/ P. Justin Skala
|
Director
|
February 21, 2018
|
||
|
P. Justin Skala
|
||||
|
/s/ Elane B. Stock
|
Director
|
February 21, 2018
|
||
|
Elane B. Stock
|
||||
|
/s/ Robert D. Walter
|
Director
|
February 21, 2018
|
||
|
Robert D. Walter
|
||||
105
YUM! Brands, Inc.
Exhibit Index
(Item 15)
|
Exhibit
Number
|
Description of Exhibits
|
|||
|
2.1
|
||||
|
3.1
|
||||
|
3.2
|
||||
|
4.1
|
||||
|
(i)
|
||||
|
(ii)
|
||||
|
(iii)
|
||||
|
(iv)
|
||||
|
(v)
|
||||
|
(vi)
|
||||
|
(vii)
|
||||
106
|
Exhibit
Number
|
Description of Exhibits
|
|||
|
10.1
|
||||
|
10.1.1
|
|
|||
|
10.1.2
|
||||
|
10.2†
|
||||
|
10.2.1†
|
||||
|
10.3†
|
||||
|
10.4†
|
||||
|
10.4.1†
|
||||
|
10.5†
|
||||
|
10.5.1†
|
||||
|
10.6†
|
||||
|
10.7†
|
||||
|
10.8†
|
||||
107
|
Exhibit
Number
|
Description of Exhibits
|
|||
|
10.9†
|
||||
|
10.10†
|
||||
|
10.11†
|
||||
|
10.11.1†
|
||||
|
10.11.2†
|
||||
|
10.12†
|
||||
|
10.13†
|
||||
|
10.13.1†
|
||||
|
10.13.2†
|
||||
|
10.14†
|
||||
|
10.14.1†
|
||||
|
10.15†
|
||||
|
10.16†
|
||||
|
10.17†
|
||||
|
10.18†
|
||||
|
10.19†
|
||||
108
|
Exhibit
Number
|
Description of Exhibits
|
|||
|
10.20
|
||||
|
10.21
|
||||
|
10.22
|
||||
|
10.23
|
||||
|
10.24
|
||||
|
10.25
|
||||
|
10.26
|
||||
|
10.27
|
||||
|
12.1
|
||||
|
21.1
|
||||
109
|
Exhibit
Number
|
Description of Exhibits
|
|||
|
23.1
|
||||
|
31.1
|
||||
|
31.2
|
||||
|
32.1
|
||||
|
32.2
|
||||
|
101.INS
|
Instance Document - the instance document does not appear in the Interactive Data File because its XBRL tags are embedded within the Inline XBRL document
|
|||
|
101.SCH
|
XBRL Taxonomy Extension Schema Document
|
|||
|
101.CAL
|
XBRL Taxonomy Extension Calculation Linkbase Document
|
|||
|
101.LAB
|
XBRL Taxonomy Extension Label Linkbase Document
|
|||
|
101.PRE
|
XBRL Taxonomy Extension Presentation Linkbase Document
|
|||
|
101.DEF
|
XBRL Taxonomy Extension Definition Linkbase Document
|
|||
|
†
|
Indicates a management contract or compensatory plan.
|
|||
110
TABLE OF CONTENTS
Part IItem 1. BusinessItem 1A. Risk FactorsItem 1B. Unresolved Staff CommentsItem 2. PropertiesItem 3. Legal ProceedingsItem 4. Mine Safety DisclosuresPart IIItem 5. Market For The Registrant S Common Stock, Related Stockholder Matters and Issuer Purchases Of Equity SecuritiesItem 6. Selected Financial DataItem 7. Management S Discussion and Analysis Of Financial Condition and Results Of OperationsItem 7A. Quantitative and Qualitative Disclosures About Market RiskItem 8. Financial Statements and Supplementary DataNote 1 Description Of BusinessNote 2 Summary Of Significant Accounting PoliciesNote 3 Earnings Per Common Share ( Eps )Note 4 - Discontinued OperationsNote 5 Items Affecting Comparability Of Net Income and Cash FlowsNote 6 Supplemental Cash Flow DataNote 7 Franchise and License Fees and IncomeNote 8 Other (income) ExpenseNote 9 Supplemental Balance Sheet InformationNote 10 Goodwill and Intangible AssetsNote 11 Short-term Borrowings and Long-term DebtNote 12 LeasesNote 13 - Derivative InstrumentsNote 14 Fair Value DisclosuresNote 15 Pension, Retiree Medical and Retiree Savings PlansNote 16 Share-based and Deferred Compensation PlansNote 17 Shareholders DeficitNote 18 Income TaxesNote 19 Reportable Operating SegmentsNote 20 ContingenciesNote 21 Selected Quarterly Financial Data (unaudited )Note 22 Subsequent EventsItem 9. Changes in and Disagreements with Accountants on Accounting and Financial DisclosureItem 9A. Controls and ProceduresItem 9B. Other InformationPart IIIItem 10. Directors, Executive Officers and Corporate GovernanceItem 11. Executive CompensationItem 12. Security Ownership Of Certain Beneficial Owners and Management and Related Stockholder MattersItem 13. Certain Relationships and Related Transactions, and Director IndependenceItem 14. Principal Accountant Fees and ServicesPart IVItem 15. Exhibits and Financial Statement Schedules