ZIFF DAVIS, INC.
10-Ks and 10-Qs
|
|
|
|
|
|
|
|
|
|
|
|
|
|
|
|
|
|
|
|
|
|
|
|
|
|
|
|
|
|
|
|
|
|
|
|
|
|
|
|
|
|
|
|
|
|
|
|
|
|
|
|
|
|
|
|
UNITED
STATES
SECURITIES
AND EXCHANGE COMMISSION
Washington,
D.C. 20549
FORM
10-K
|
x
|
ANNUAL REPORT PURSUANT TO
SECTION 13 OR 15(d) OF THE SECURITIES
EXCHANGE ACT OF
1934
|
For
the fiscal year ended December 31, 2009
OR
|
¨
|
TRANSITION REPORT PURSUANT TO
SECTION 13 OR 15(d) OF THE SECURITIES
EXCHANGE ACT OF
1934
|
For
the transition period from
to
Commission
File Number: 0-25965
j2
GLOBAL COMMUNICATIONS, INC.
(Exact
name of registrant as specified in its charter)
|
Delaware
|
51-0371142
|
|
(State
or other jurisdiction of incorporation or organization)
|
(I.R.S.
Employer Identification No.)
|
6922
Hollywood Boulevard, Suite 500, Los Angeles, California 90028, (323)
860-9200
(Address
and telephone number of principal executive offices)
Securities registered pursuant to
Section 12(b) of the Act:
None
Securities
registered pursuant to Section 12(g) of the Act:
Common
Stock, $0.01 par value
(Title of
class)
Indicate
by check mark if the registrant is a well-known seasoned issuer, as defined in
Rule 405 of the Securities Act.
|
Yes
o
|
No
x
|
Indicate
by check mark if the registrant is not required to file reports pursuant to
Section 13 or Section 15(d) of the Act.
|
Yes
o
|
No
x
|
Indicate
by check mark whether the registrant (1) has filed all reports required to be
filed by Section 13 or 15(d) of the Securities Exchange Act of 1934 during the
preceding 12 months (or for such shorter period that the registrant was required
to file such reports), and (2) has been subject to such filing requirements for
the past 90 days.
|
Yes
x
|
No
o
|
Indicate
by check mark whether the registrant has submitted electronically and posted on
its corporate Web site, if any, every Interactive Data File required to be
submitted and posted pursuant to Rule 405 of Regulation S-T (§ 232.405 of this
chapter) during the preceding 12 months (or for such shorter period that the
registrant was required to submit and post such files).
|
Yes
o
|
No
o
(Not
Applicable)
|
Indicate
by check mark if disclosure of delinquent filers pursuant to Item 405 of
Regulation S-K is not contained herein, and will not be contained, to the best
of registrant’s knowledge, in definitive proxy or information statements
incorporated by reference in Part III of this Form 10-K or any amendment to this
Form 10-K.
x
Indicate
by check mark whether the registrant is a large accelerated filer, an
accelerated filer, a non-accelerated filer, or a smaller reporting company. See
the definitions of “large accelerated filer”, “accelerated filer” and “small
reporting company” in Rule 12b-2 of the Exchange Act. (Check
one):
|
Large accelerated
filer
x
|
Accelerated filer
¨
|
Non-accelerated
filer
¨
|
Smaller reporting
company
¨
|
Indicate
by check mark whether the registrant is a shell company (as defined in Rule
12b-2 of the Act). Yes
¨
No
x
As of the
last business day of the registrant’s most recently completed second fiscal
quarter, the approximate aggregate market value of the common stock held by
non-affiliates, based upon the closing price of the common stock as quoted by
the NASDAQ Global Select Market was $695,301,411. Shares of common stock held by
executive officers, directors and holders of more than 5% of the outstanding
common stock have been excluded. This determination of affiliate status is not
necessarily a conclusive determination for other
purposes.
As of
February 16, 2010, the registrant had 45,176,381 shares of common stock
outstanding.
DOCUMENTS
INCORPORATED BY REFERENCE:
Portions
of the definitive Proxy Statement to be delivered to shareholders in connection
with the Annual Meeting of Shareholders to be held May 6, 2010 are incorporated
by reference into Part III of this Form 10-K.
This
Annual Report on Form 10-K includes 73 pages with the Index to Exhibits located
on page 65.
TABLE
OF CONTENTS
|
Page
|
|
|
PART
I.
|
|
|
Item
1. Business
|
3
|
|
Item
1A. Risk Factors
|
8
|
|
Item
1B. Unresolved Staff Comments
|
16
|
|
Item
2. Properties
|
16
|
|
Item
3. Legal
Proceedings
|
17
|
|
Item
4. Submission of Matters to a
Vote of Security Holders
|
18
|
|
PART
II.
|
|
|
Item
5. Market for Registrant’s Common
Equity, Related Stockholder Matters and Issuer Purchases of Equity
Securities
|
19
|
|
Item
6. Selected Financial
Data
|
22
|
|
Item
7. Management’s Discussion and
Analysis of Financial Condition and Results of Operations
|
23
|
|
Item
7A. Quantitative and Qualitative Disclosures About
Market Risk
|
32
|
|
Item
8. Financial Statements and
Supplementary Data
|
34
|
|
Item
9. Changes In and Disagreements with
Accountants on Accounting and Financial Disclosure
|
62
|
|
Item
9A. Controls and Procedures
|
62
|
|
Item
9B. Other Information
|
63
|
|
PART
III.
|
|
|
Item
10. Directors, Executive Officers and Corporate
Governance
|
64
|
|
Item
11. Executive Compensation
|
64
|
|
Item
12. Security Ownership of Certain Beneficial
Owners and Management and Related Stockholder Matters
|
64
|
|
Item
13. Certain Relationships and Related
Transactions, and Director Independence
|
64
|
|
Item
14. Principal Accounting Fees and
Services
|
64
|
|
PART
IV.
|
|
|
Item
15. Exhibits and Financial Statement
Schedules
|
65
|
- 2
-
Company
Overview
j2 Global
Communications, Inc. (“j2 Global”, “our”, “us” or “we”) is a Delaware
corporation founded in 1995. By leveraging the power of the Internet, we provide
outsourced, value-added messaging and communications services to individuals and
businesses throughout the world. We offer fax, voicemail, email and call
handling services and bundled suites of certain of these services. We market our
services principally under the brand names
eFax
®
,
eFax Corporate
®
,
Onebox
®
,
eVoice
®
and
Electric Mail
®
.
We
deliver many of our services through our global telephony/Internet Protocol
(“IP”) network, which spans more than 3,500 cities in 46 countries across six
continents. We have created this network, and continuously seek to expand it,
through negotiation with U.S. and foreign telecommunications and co-location
providers for telephone numbers (also referred to as Direct Inward Dial numbers
or “DIDs”), Internet bandwidth and co-location space for our equipment. We
maintain and seek to grow an inventory of telephone numbers to be assigned to
new customers. Most of these numbers are “local” (as opposed to toll-free),
which enables us to provide our paying subscribers telephone numbers with a
geographic identity. In addition to growing our business internally, we have
used acquisitions to grow our customer base, enhance our technology and acquire
skilled personnel.
Our core
services include fax, voicemail, email and call handling, as well as bundled
suites of certain of these services. These are business services that make our
customers more efficient, more mobile, more cost-effective and more secure than
traditional alternatives. We generate substantially all of our revenue from
subscribers that pay, subscription and usage fees. Subscription fees are
referred to as “fixed” revenues, while usage fees are referred to as “variable”
revenues. We also generate revenues from patent licensing and sales, advertising
and revenue share from our customers’ use of premium rate telephone numbers. Of
the 11.2 million telephone numbers deployed as of December 31, 2009,
approximately 1.3 million were serving paying subscribers, with the balance
deployed to free subscribers, including those with premium rate telephone
numbers. We operate in one reportable segment: value-added messaging and
communications services, which provides for the delivery of fax, voice and email
messages and communications via the telephone and/or Internet
networks.
During
the past three years, we have derived a substantial portion of our revenues from
our DID-based services, including
eFax, Onebox,
and
eVoice
. As a result, we
believe that paying DIDs and the revenues associated therewith are an important
metric for understanding our business. It has been and continues to be our
objective to increase the number of paying DIDs through a variety of
distribution channels and marketing arrangements and by enhancing our brand
awareness. In addition, we seek to increase revenues through a combination of
stimulating use by our customers of usage-based services and introducing new
services.
We market
our services to a broad spectrum of prospective customers including individuals,
small to medium-sized businesses and large enterprises and government
organizations. Our marketing efforts include enhancing brand awareness;
utilizing online advertising through Internet portals, Internet service
providers (“ISPs”), search engines and affiliate programs; and selling through
both a telesales and direct sales force. Currently, we have seven primary
methods by which we acquire paying subscribers: (i) selling direct through our
Websites, targeting primarily individuals; (ii) attracting direct paying
individual subscribers through various Internet portals, ISPs, search engines
and affiliate programs; (iii) promoting our solutions to small to mid-sized
businesses through our Websites targeting corporate, enterprise and governmental
customers; (iv) converting a portion of our free base of customers to a paid
solution; (v) selling our solutions to large enterprises and governmental
organizations through our direct sales force and tradeshows; (vi) attracting
international individual and business customers through our international
Websites and direct sales force; and (vii) offering additional services to our
existing customers. We continuously seek to extend the number of distribution
channels through which we acquire paying customers and improve the cost and
volume of customers obtained through our current channels.
In
addition to growing our business organically, we have used acquisitions to grow
our customer base, enhance our technology and acquire skilled personnel. During
2009, we completed the acquisition of the digital faxing business and certain
intellectual property of CallWave, Inc., a provider of Internet unified
communications solutions, and the email business of Quexion, LLC. During 2008,
we completed four acquisitions: (a) fax assets of Mediaburst Limited, a UK-based
provider of messaging services, (b) all of the outstanding shares of Phone
People Holdings Corporation, a U.S.-based provider of voice messaging services,
(c) assets of Mailwise, LLP, a U.S.-based provider of email services, and (d)
assets of Mijanda, Inc., a U.S.-based provider of fax and voice services. During
2007, we completed two acquisitions: (a) assets of YAC Limited, a provider of
messaging services primarily in the United Kingdom, and (b) the RapidFAX digital
fax business of Easylink Services International Corporation.
Through a
combination of internal technology development and acquisitions, we have built a
patent portfolio consisting of multiple U.S. and foreign patents and numerous
pending U.S. and foreign patent applications. We generate licensing revenues
from some of these patents. We intend to continue to invest in patents, to
aggressively protect our patent assets from unauthorized use and to continue to
generate patent licensing revenues from authorized users. For more information
on our patents and other intellectual property, please refer to the section
entitled Patents and Proprietary Rights contained in Item 1 of this Annual
Report on Form 10-K.
- 3
-
Our
Solutions
We
believe businesses and individuals are increasingly outsourcing their
communication and messaging needs. Their goal is to reduce or eliminate costs
while also enhancing the security of transmissions and user efficiency. Our core
eFax
solution enables
users to receive faxes into their email inboxes. Our core
eVoice
and
Onebox
solutions provide
customers a virtual receptionist with various available enhancements. These
services represent more efficient and less expensive solutions than many
existing alternatives, and provide for increased security, privacy and message
handling flexibility (e.g., the ability to store messages electronically and
forward them by simply forwarding an email).
We
currently offer integrated solutions designed to replace or augment individual
and corporate messaging and communication services. We tailor our solutions to
satisfy the differing needs of our customers. Our paid services allow a
subscriber to select a local telephone number from among more than 3,500 cities
around the world. Toll-free U.S. and Canadian telephone numbers are also
available, as are premium rate numbers in various countries in Western Europe.
In addition, our services enhance the ability of businesses to provide messaging
services to their remote workforces, increase their level of information
security and control and allocate costs more effectively.
We offer
the following services and solutions:
Fax
eFax
offers desktop faxing
services. Various tiers of service provide increasing levels of features and
functionality. Our
eFax
Plus
®
and
eFax Pro
TM
services allow a subscriber to choose either a toll-free telephone number that
covers both the U.S. and Canada or a local telephone number from among more than
3,500 cities worldwide. This service level enables subscribers to receive
inbound fax messages in their email inboxes, access these messages via a
full-featured Web-based email interface and send digital documents to any fax
number in the world directly from their desktops. This service offering is also
localized in many international currencies and the following languages,
including Chinese (Cantonese), Dutch, French, German, Italian, Polish,
Portuguese and Spanish, among others.
eFax Corporate
offers
capabilities similar to those offered by
eFax Plus
and
eFax Pro
, but with added
features and tools geared towards enterprises and their users. For example, we
provide our corporate customers a Web browser-based account administration
interface, which enables them to provision telephone numbers to employees, as
needed, without contacting our account representatives.
eFax Corporate
also offers
the option of enhanced security features, which are particularly attractive to
law firms and companies in regulated industries such as banking, brokerage and
healthcare.
eFax Developer
TM
offers high-volume, production fax solutions. Designed for quick and simple
integration with application environments,
eFax Developer
provides
inbound and outbound fax services through a secure XML interface. Enhanced
features such as bar-code recognition, dynamic retries and high speed
transmission are included and accessible 24/7/365. Robust fax capabilities can
easily be implemented through simple software development kits or through a
universal web post solution.
eFax Developer
provides the
scaling power of an outside fax service with the flexibility of an internal
server without requiring additional equipment, supplies or
expertise.
eFax Broadcast
TM
and
jBlast
®
offer
cost-effective solutions for high-volume outbound faxing. These services enable
users to send important documents simultaneously to hundreds or thousands of
recipients anywhere in the world. Customers do not need special computer
equipment, expensive fax boards or multiple phone lines. These services also
enable customers to accurately monitor the status of their faxes and update
their database of “Do Not Fax” names and undeliverable fax numbers.
We have
alternative desktop faxing solutions that are offered under a variety of brands
and pricing plans geared primarily toward the individual or small business
user. We also offer limited versions of certain services on a free
basis.
Voice
eVoice Receptionist
TM
and
Onebox
Receptionist
TM
are virtual PBX
solutions that provide small and medium-sized businesses on-demand voice
communications services, featuring a toll-free or local company telephone
number, a professionally-produced auto-attendant and menu tree. With these
services, a subscriber can assign departmental and individual extensions that
can connect to multiple U.S. or Canadian telephone numbers, including
traditional land-line telephones as well as mobile and IP networks, and can
enhance reachability through “find me/follow me” capabilities. These services
also include advanced integrated voicemail for each extension, effectively
unifying mobile, office and other separate voicemail services and improving
efficiency by delivering voicemails in both native audio format and as
transcribed text.
- 4
-
Onebox
®
is a full-featured
suite of unified communications services, including email, voicemail, fax and
“find me/follow me” capabilities.
Onebox Unified Messaging
provides the subscriber a unique toll-free or local number and enables him or
her to receive voicemail messages or faxes via email or access them by
telephone; to send, receive or reply to faxes or voicemail messages online or by
telephone; and to store faxes and email messages online.
Email
Electric Mail
®
is an
outsourced hosted email service that we offer to businesses.
Electric Mail
develops and
delivers email and related solutions that are hosted offsite and seamlessly
integrate into a customer’s existing email system. The services include
Electric WebMail
TM
, E-mmunity
TM
virus scanning,
SpamSMART
TM
SPAM
filtering, and
VaultSMART
TM
/
PolicySMART
TM
archiving which delivers a secure, scalable email archiving and customizable
compliance tools to correspond with a company’s retention policy.
Global
Network and Operations
We have
multiple physical Points of Presence (“POPs”) worldwide, a central data center
in Los Angeles and a remote disaster recovery facility. We connect our POPs to
our central data centers via redundant, and often times diverse, Virtual Private
Networks (“VPNs”) using the Internet. Our network is designed to deliver
value-added user applications, customer support, billing and a local presence
for our customers from among more than 3,500 cities in 46 countries on six
continents. Our network covers all major metropolitan areas in the U.S., U.K.
and Canada, and such other major cities as Berlin, Hong Kong, Madrid, Manila,
Mexico City, Milan, Paris, Rome, Singapore, Sydney, Taipei, Tokyo and Zurich.
For financial information about geographic areas, see Note 14 of the Notes to
Consolidated Financial Statements included elsewhere in this Annual Report on
Form 10-K.
We obtain
telephone numbers from various local carriers throughout the U.S. and
internationally. Our ability to continue to acquire additional telephone
numbers in desired locations in the future will depend on our relationships with
our local carriers, our ability to pay market prices for such telephone numbers,
our ability to secure telephone numbers from among growing number of alternate
providers and the regulatory environment. Please refer to the sections entitled
Government Regulation and Risk Factors contained in Item 1 and 1A, respectively,
of this Annual Report on Form 10-K.
Customer
Support Services
Our
Customer Service organization provides support to our customers through a
combination of online self-help, email messages, interactive chat sessions and
telephone calls. Our Internet-based online self-help tools enable customers to
resolve simple issues on their own, eliminating the need to speak or write to
our customer service representatives. We use internal personnel and contracted
third parties (on a dedicated personnel basis) to answer our customer emails and
telephone calls and to participate in interactive chat sessions.
We
provide email support seven days per week, 24 hours per day to all subscribers.
Paying subscribers have access to live-operator telephone support seven days per
week, 24 hours per day. Dedicated telephone support is provided for Corporate
customers 24 hours per day, seven days per week.
Competition
Competition
in the outsourced, value-added messaging and communications space is fierce and
continues to intensify. We face competition from, among others, fax-to-email
providers, broadcast fax companies, traditional fax machine or multi-function
printer companies, unified messaging/communications providers, telephone
companies, voicemail providers, companies offering PBX systems and outsourced
PBX solutions and email providers. We believe that the primary competitive
factors determining success in the market for value-added messaging and
communications services include financial strengths and stability, pricing,
reputation for reliability and security of service, intellectual property
ownership, effectiveness of customer support, service and software ease-of-use,
service scalability, customer messaging and branding, geographic coverage, scope
of services and local language sales, messaging and support.
Our most
popular solutions relate to faxing, including the ability to deliver faxes to
our customers via email and our outbound desktop faxing capabilities. These
solutions compete primarily against traditional fax machine manufacturers, which
are generally large and well established companies, providers of fax servers and
related software, such as Open Text Corporation as well as publicly traded and
privately-held application service providers, such as Premiere Global Services,
Inc. and Easylink Services International Corporation. Some of these companies
may have greater financial and other resources than we do. For more information
regarding the competition that we face, please refer to the section entitled
Risk Factors contained in Item 1A of this Annual Report on Form
10-K.
- 5
-
Patents
and Proprietary Rights
We regard
the protection of our intellectual property rights as important to our success.
We aggressively protect these rights by relying on a combination of patents,
trademarks, copyrights, trade dress and trade secret laws and by using the
domain name dispute resolution system. We also enter into confidentiality and
invention assignment agreements with employees and contractors, and
nondisclosure agreements with parties with whom we conduct business in order to
limit access to and disclosure of our proprietary information.
We have a
portfolio of multiple U.S. and foreign patents and have numerous pending U.S.
and foreign patent applications, all covering components of our technology and
in some cases technologies beyond those that we currently offer. Three of our
core U.S. patents have been reaffirmed through reexamination proceedings with
the United States Patent and Trademark Office. We seek patents for inventions
that contribute to our business and technology strategy. We have obtained patent
licenses for certain technologies where such licenses are necessary or
advantageous. Unless and until patents are issued on the pending applications,
no patent rights on those applications can be enforced.
Over the
past five years we have generated royalties from licensing certain of our
patents and have enforced these patents against companies using our patented
technology without our permission. We have pending patent infringement lawsuits
against several companies. In each case, we are seeking at least a reasonable
royalty for the infringement of the patent(s) in suit, a permanent injunction
against continued infringement and attorneys’ fees, interest and
costs.
We own
and use a number of trademarks in connection with our products and services,
including eFax and the eFax logo, eFax Corporate and the eFax Corporate logo,
eVoice and the eVoice logo, Onebox and the Onebox logo and Electric Mail and the
Electric Mail logo, among others. Many of these trademarks are registered in the
U.S. and other countries, and numerous trademark applications are pending in the
U.S. and several non-U.S. jurisdictions. We hold numerous Internet domain names,
including “efax.com”, “jconnect.com”, “fax.com”, “j2.com”, “j2global.com”,
“onebox.com”, “electricmail.com”, “efaxcorporate.com” and “evoice.com”, among
others. We have in place an active program to continue securing “eFax” and other
domain names in non-U.S. jurisdictions. We have filed to protect our rights
to the “eFax” and other names in certain alternative top-level domains such as
“.org”, “.net“, “.biz”, “.info” and “.us”, among others.
Like
other technology-based businesses, we face the risk that we will be unable to
protect our intellectual property and other proprietary rights, and the risk
that we will be found to have infringed the proprietary rights of others. For
more information regarding these risks, please refer to the section entitled
Risk Factors contained in Item 1A of this Annual Report on Form
10-K.
Government
Regulation
We are
subject to a number of foreign and domestic laws and regulations that affect
companies conducting business related to the Internet and telecommunications,
including, among others, those addressing privacy, data protection, indecency,
obscenity, defamation, libel, pricing, taxation, telephone numbers, advertising,
intellectual property and technological convergence. We face risks from proposed
legislation or new interpretations of existing legislation that could occur in
the future, and as Internet services and telecommunications services converge or
the services we offer expand, we may face increased domestic or foreign
regulation in areas such as delivery of broadband services, inter-carrier
compensation and continued regulation of competition.
Some of
our service providers are subject to regulation by the U.S. Federal
Communications Commission (“FCC”), state public utility commissions and foreign
governmental authorities. However, as an Internet messaging services provider,
we generally are not subject to direct regulation by any governmental agency in
the U.S., other than regulations applicable to businesses generally. This is not
the case in some international locations.
Continued
regulation arising from telephone number administration may also make it more
difficult for us to obtain necessary numbering resources. For example, several
years ago the FCC conditionally granted requests by California and Connecticut
to adopt special area codes for unified messaging. Although neither State has
implemented such area codes, if they or other states do so our ability to
compete in those states could be adversely affected. Similar regulation has
occurred internationally (e.g., Germany prohibits issuing a local telephone
number to anyone without a physical presence in the area) and may continue to be
enacted in additional locations in the future. As a user of toll-free
numbers and an organization that requests such numbers from the national numbers
database, we are subject to the FCC's rules regarding warehousing,
hoarding, and porting of toll-free numbers. Failure to comply with
such rules could result in substantial fines and penalties.
In
addition, Congress and the FCC are reviewing legislation and regulations related
to the Universal Service Fund (“USF”), which subsidizes the U.S.
telecommunications system. Congress and the FCC are considering altering the
formula by which entities contribute to the USF. If adopted, one proposal to
implement a flat-fee per phone number methodology could alter or eliminate the
provision of our non-paid (free advertising-supported) services and could cause
us to raise the price of our paid services. Other changes to the USF may also
increase our costs and impact our operations.
- 6
-
The FCC
is authorized to take enforcement action against companies that send so-called
“junk faxes” and has held numerous fax broadcasters liable for violating the
Telephone Consumer Protection Act of 1991 (“TCPA”), the Junk Fax Prevention Act
of 2005 (“Junk Fax Act”) and related FCC rules. Entities that merely transmit
facsimile messages on behalf of others may face FCC inquiry and enforcement,
civil litigation or private causes of action if they have a high degree of
involvement in transmitting junk faxes or have actual notice of illegal junk fax
transmissions and failed to take steps to prevent such transmissions. We take
significant steps to ensure that our services are not used to transmit
unsolicited faxes on a large scale and we do not believe that we have a high
degree of involvement or notice of the use of our service to broadcast junk
faxes. We are currently involved in litigation involving alleged violations of
the TCPA with Protus IP Solutions, Inc. For more information about this lawsuit,
see Item 3 of this Annual Report on Form 10-K entitled Legal
Proceedings.
We are
subject to a range of federal, state and foreign laws regarding privacy,
protection of user data, data breaches, and retention of certain data elements.
Any failure on our part to comply with these laws may subject us to significant
liabilities. Complying with these varying requirements could cause us to incur
additional costs and change our business practices. We also face risks due to
potential Internet neutrality laws and regulations as to the services and sites
that users can access through their broadband service providers.
Future
developments in laws that govern online activities might inhibit the growth of
the Internet, impose taxes, mandate costly technical requirements, create
uncertainty in the market or otherwise have an adverse effect on the Internet.
These developments could, in turn, have a material adverse effect on our
business, prospects, financial condition and results of operations.
Seasonality
and Backlog
Our
subscriber revenues are impacted by the number of effective business days in a
given period. We experience no material backlog in sales orders or the
provisioning of customer orders. We traditionally experience lower than average
usage and customer sign-ups in the fourth quarter.
Research
and Development
The
markets for our services are evolving rapidly, requiring ongoing expenditures
for research and development and timely introduction of new services and service
enhancements. Our future success will depend, in part, on our ability to enhance
our current services, to respond effectively to technological changes, to sell
additional services to our existing customer base and to introduce new services
and technologies that address the increasingly sophisticated needs of our
customers.
We devote
significant resources to develop new services and service enhancements. Our
research, development and engineering expenditures were $11.7 million, $12.0
million and $11.8 million for the fiscal years ended December 31, 2009, 2008 and
2007, respectively. For more information regarding the technological risks that
we face, please refer to the section entitled Risk Factors contained in Item 1A
of this Annual Report on Form 10-K.
Employees
As of
December 31, 2009, we had approximately 400 employees, the majority of whom are
in the U.S.
Our
future success will depend, in part, on our ability to continue to attract,
retain and motivate highly qualified technical, marketing and management
personnel. Our employees are not represented by any collective bargaining unit
or agreement. We have never experienced a work stoppage. We believe our
relationship with our employees is good.
Web
Availability of Reports
Our
corporate information Website is www.j2global.com. The information on our
Website is not part of this Annual Report on Form 10-K. However, on the Investor
Relations portion of this Website the public can access free of charge our
annual, quarterly and current reports, changes in the stock ownership of our
directors and executive officers and other documents filed with the Securities
and Exchange Commission (“SEC”) as soon as reasonably practicable after the
filing dates. Further, the SEC maintains an Internet site that contains reports,
proxy and information statements and other information regarding our filings at
www.sec.gov.
- 7
-
Before
deciding to invest in j2 Global or to maintain or increase your investment, you
should carefully consider the risks described below in addition to the other
cautionary statements and risks described elsewhere in this Annual Report on
Form 10-K and our other filings with the SEC, including our subsequent reports
on Forms 10-Q and 8-K. The risks and uncertainties described below are not the
only ones we face. Additional risks and uncertainties not presently known to us
or that we currently deem immaterial also may affect our business. If any of
these known or unknown risks or uncertainties actually occurs, our business,
prospects, financial condition, operating results and cash flows could be
materially adversely affected. In that event, the market price of our common
stock will likely decline and you may lose part or all of your
investment.
Risks
Related To Our Business
Weakness
in the financial markets and in the economy as a whole has adversely affected
and may continue to adversely affect segments of our customers, which has
resulted and may continue to result in decreased usage levels, customer
acquisitions and customer retention rates and, in turn, could lead to a decrease
in our revenues or rate of revenue growth.
Certain
segments of our customers - those whose business activity is tied to the health
of the credit markets and the broader economy, such as banks, brokerage firms
and those in the real estate industry - have been and may continue to be
adversely affected by the current weakness in the credit markets and in the
broader mortgage market and the general economy. To the extent our customers’
businesses have been adversely affected by these economic factors and their
usage levels of our services decline, we experienced and may continue to
experience a decrease in our average usage per subscriber and, therefore, a
decrease in our average variable revenue per subscriber. In addition,
continued weakness in the economy has adversely affected and may continue to
adversely affect our customer retention rates and the number of our new customer
acquisitions. These factors have adversely impacted, and may continue to
adversely impact, our revenues and profitability.
Increased
numbers of credit and debit card declines as a result of decreased availability
of credit and/or a weak economy which continues to experience heightened levels
of unemployment could lead to a decrease in our revenues or rate of revenue
growth.
A
significant number of our paid subscribers pay for their services through credit
and debit cards. Weakness in certain segments of the credit markets and in
the U.S. and global economies, which continue to experience heightened levels of
unemployment, has resulted in and may continue to result in increased numbers of
rejected credit and debit card payments. We believe this has resulted in and may
continue to result in increased customer cancellations and decreased customer
signups. This also has required and may continue to require us to increase
our reserves for doubtful accounts and write-offs of accounts
receivables. The foregoing may adversely impact our revenues and
profitability.
Our
financial results may be adversely impacted by higher-than-expected tax rates or
exposure to additional tax liabilities.
We are a
U.S.-based multinational company subject to tax in multiple U.S. and foreign tax
jurisdictions. Our provision for income taxes is based on a jurisdictional mix
of earnings, statutory rates and enacted tax rules, including transfer pricing.
Significant judgment is required in determining our provision for income taxes
and in evaluating our tax positions on a worldwide basis. It is possible that
these positions may be challenged or we may find tax-beneficial intercompany
transactions to be uneconomical, either of which may have a significant impact
on our effective tax rate.
A number
of factors affect our income tax rate and the combined effect of these factors
could result in an increase in our effective income tax rate. An increase in
future effective income tax rates would adversely affect net income in future
periods. We operate in different countries that have different income tax rates.
Effective tax rates could be adversely affected by earnings being lower than
anticipated in countries having lower statutory rates and higher than
anticipated in countries having higher statutory rates, by changes in the
valuation of deferred tax assets or liabilities or by changes in tax laws or
interpretations thereof.
A
substantial portion of our cash and investments are invested outside of the U.S.
We may be subject to incremental taxes upon repatriation of such funds to the
U.S.
We may be
subject to examination of our tax returns by the U.S. Internal Revenue Service
and other domestic and foreign tax authorities. We are currently under audit by
the Internal Revenue Service for tax years 2004 through 2008. In addition, we
are under audit by the California Franchise Tax Board for tax years 2005 through
2007 and by the Illinois Department of Revenue for 2005 and 2006. We are also
under audit by various other states for non-income related taxes. We
regularly assess the likelihood of adverse outcomes resulting from these
examinations to determine the adequacy of our income and other tax-related
reserves and expense. If our reserves are not sufficient to cover these
contingencies, such inadequacy could materially adversely affect our business,
prospects, financial condition, operating results and cash flows.
- 8
-
Our
growth will depend on our ability to develop our brands and market new brands,
and these efforts may be costly.
We
believe that continuing to strengthen our current brands and effectively launch
new brands will be critical to achieving widespread acceptance of our services,
and will require continued focus on active marketing efforts. The demand for and
cost of online and traditional advertising have been increasing and may continue
to increase. Accordingly, we may need to spend increasing amounts of money on,
and devote greater resources to, advertising, marketing and other efforts to
create and maintain brand loyalty among users. In addition, we are supporting an
increasing number of brands, each of which requires its own resources. Brand
promotion activities may not yield increased revenues, and even if they do, any
increased revenues may not offset the expenses incurred in building our brands.
If we fail to promote and maintain our brands, or if we incur substantial
expense in an unsuccessful attempt to promote and maintain our brands, our
business could be harmed.
If
our trademarks are not adequately protected or we are unable to protect our
domain names, our reputation and brand could be adversely affected.
Our
success depends, in part, on our ability to protect our trademarks. We rely on
some brands that use the letter “e” before a word, such as “eFax” and “eVoice”.
Some regulators and competitors have taken the view that the “e” is descriptive.
Others have claimed that these brands are generic when applied to the products
and services we offer. If we are unable to secure and protect trademark rights
to these or other brands, the value of these brands may be diminished,
competitors may be able to more effectively mimic our service and methods of
operations, the perception of our business and service to subscribers and
potential subscribers may become confused in the marketplace and our ability to
attract subscribers may be adversely affected.
We
currently hold various domain names relating to our brands, both in the U.S. and
internationally, including efax.com and various other international extensions,
evoice.com, fax.com, onebox.com and others. The acquisition and maintenance of
domain names generally are regulated by governmental agencies and their
designees. The regulation of domain names in the U.S. may change. Governing
bodies may establish additional top-level domains, appoint additional domain
name registrars or modify the requirements for holding domain names. As a
result, we may be unable to acquire or maintain relevant domain names in the
U.S. Furthermore, the relationship between regulations governing domain names
and laws protecting trademarks and similar proprietary rights in the U.S. is
unclear. Similarly, international rules governing the acquisition and
maintenance of domain names in foreign jurisdictions are sometimes different
from U.S. rules, and we may not be able to obtain all of our domains
internationally. As a result of these factors, we may be unable to prevent third
parties from acquiring domain names that are similar to, infringe upon or
otherwise decrease the value of our trademarks and other proprietary rights. In
addition, failure to protect our domain names domestically or internationally
could adversely affect our reputation and brands, and make it more difficult for
users to find our Websites and our services.
We
may be subject to risks from international operations.
As we
continue to expand our business operations in countries outside the U.S., our
future results could be materially adversely affected by a variety of
uncontrollable and changing factors including, among others, foreign currency
exchange rates; political or social unrest or economic instability in a specific
country or region; trade protection measures and other regulatory requirements
which may affect our ability to provide our services; difficulties in staffing
and managing international operations; and adverse tax consequences, including
imposition of withholding or other taxes on payments by subsidiaries and
affiliates. Any or all of these factors could have a material adverse impact on
our future business, prospects, financial condition, operating results and cash
flows.
We have
only limited experience in marketing and operating our services in certain
international markets. Moreover, we have in some cases experienced and expect to
continue to experience in some cases higher costs as a percentage of revenues in
connection with establishing and providing services in international markets
versus the U.S. In addition, certain international markets may be slower than
the U.S. in adopting the Internet and/or outsourced messaging and communications
solutions and so our operations in international markets may not develop at a
rate that supports our level of investments.
We
rely heavily on the revenue generated by our fax services.
Currently,
a substantial portion of the overall traffic on our network is fax related. Our
success is therefore dependent upon the continued use of fax as a messaging
medium and/or our ability to diversify our service offerings and derive more
revenue from other services, such as voice, email and unified messaging
solutions. If the demand for fax as a messaging medium decreases, and we are
unable to replace lost revenues from decreased usage of our fax services with a
proportional increase in our customer base or with revenues from our other
services, our business, financial condition, operating results and cash flows
could be materially and adversely affected.
- 9
-
We
believe that one of the attractions to fax versus alternatives, such as email,
is that fax signatures are a generally accepted method of executing contracts.
There are on-going efforts by governmental and non-governmental entities, many
of which possess greater resources than we do, to create a universally accepted
method for electronically signing documents. Widespread adoption of so-called
“digital signatures” could reduce demand for our fax services and, as a result,
could have a material adverse effect on our business, prospects, financial
condition, operating results and cash flows.
If
we experience excessive fraudulent activity or cannot meet evolving credit card
company merchant standards, we could incur substantial costs and lose the right
to accept credit cards for payment and our subscriber base could decrease
significantly.
A
significant number of our paid subscribers authorize us to bill their credit
card accounts directly for all service fees charged by us. If people use our
services using stolen credit cards, we could incur substantial third party
vendor costs for which we may not be reimbursed. We also incur losses
from claims that the customer did not authorize the credit card transaction to
purchase our service. If the numbers of unauthorized credit card transactions
become excessive, we could be assessed substantial fines for excess chargebacks
and we could lose the right to accept credit cards for payment. In addition,
credit card companies may change the merchant standards required to utilize
their services from time to time. If we are unable to meet these new standards,
we could be unable to accept credit cards. Substantial losses due to fraud or
our inability to accept credit card payments, which could cause our paid
subscriber base to significantly decrease, could have a material adverse effect
on our business, prospects, financial condition, operating results and cash
flows.
Our
business and users may be subject to sales tax and other
taxes.
The
application of indirect taxes (such as sales and use tax, value added tax
(“VAT”), goods and services tax, business tax and gross receipt tax) to
e-commerce businesses such as j2 Global and our users is a complex and evolving
issue. Many of the fundamental statutes and regulations that impose these taxes
were established before the growth of the Internet and e-commerce. In many
cases, it is not clear how existing statutes apply to the Internet or
e-commerce. In addition, some jurisdictions have implemented laws specifically
addressing the Internet or some aspect of e-commerce and several other proposals
have been made at the U.S. federal, state and local level that would impose
additional taxes on the sale of goods and services through the Internet. These
proposals, if adopted, could substantially impair the growth of e-commerce,
hamper our ability to retain and attract new customers and diminish our ability
to derive financial benefit from our activities. In November 2007, the
U.S. federal government enacted legislation extending the moratorium on
states and other local authorities imposing access or discriminatory taxes on
the Internet through November 2014. This moratorium does not prohibit federal,
state or local authorities from collecting taxes on our income or from
collecting taxes that are due under existing tax rules. The application of
existing, new or future laws could have adverse effects on our business,
prospects and operating results. There have been, and will continue to be,
substantial ongoing costs associated with complying with the various indirect
tax requirements in the numerous markets in which we conduct or will conduct
business.
A
system failure or security breach could delay or interrupt service to our
customers, harm our reputation or subject us to significant
liability.
Our
operations are dependent on our ability to protect our network from interruption
by damage from fire, earthquake, power loss, telecommunications failure,
unauthorized entry, computer viruses or other events beyond our control. There
can be no assurance that our existing and planned precautions of backup systems,
regular data backups, security protocols and other procedures will be adequate
to prevent significant damage, system failure or data loss. Also, despite the
implementation of security measures, our infrastructure may be vulnerable to
computer viruses, hackers or similar disruptive problems caused by our
subscribers, employees or other Internet users who attempt to invade public and
private data networks. Currently, a significant number of our users authorize us
to bill their credit or debit card accounts directly for all transaction fees
charged by us. We rely on encryption and authentication technology to effect
secure transmission of confidential information, including customer credit and
debit card numbers. Advances in computer capabilities, new discoveries in the
field of cryptography or other developments may result in a compromise or breach
of the technology used by us to protect transaction data. Any system
failure or security breach that causes interruptions or data loss in our
operations or in the computer systems of our customers or leads to the
misappropriation of our or our customers’ confidential information could result
in significant liability to us, cause considerable harm to us and our reputation
and deter current and potential customers from using our services. Any of these
events could have a material adverse effect on our business, prospects,
financial condition, operating results and cash flows.
Our
business is dependent on a small number of telecommunications carriers in each
region and our inability to maintain agreements at attractive rates with such
carriers may negatively impact our business.
Our
business substantially depends on the capacity, affordability, reliability and
security of our telecommunications networks. Only a small number of carriers in
each region, and in some cases only one carrier, offer the telephone number and
network services
- 10
-
we
require. Certain of our telecommunications services are provided pursuant to
short-term agreements that the providers can terminate or elect not to renew. As
a result, any or all of our current carriers could discontinue providing us with
service at rates acceptable to us, or at all, and we may not be able to obtain
adequate replacements, which could materially and adversely affect our business,
prospects, financial condition, operating results and cash flows.
The
successful operation of our business depends upon the supply of critical
elements and marketing relationships from other companies.
We depend
upon third parties for several critical elements of our business, including
various technology, infrastructure, customer service and marketing components.
We rely on private third-party providers for our Internet and telephony
connections and for co-location of a significant portion of our communications
servers. Any disruption in the services provided by any of these suppliers, or
any failure by them to handle current or higher volumes of activity, could have
a material adverse effect on our business, prospects, financial condition,
operating results and cash flows. To obtain new customers, we have marketing
agreements with operators of leading search engines and Websites. These
arrangements typically are not exclusive and do not extend over a significant
period of time. Failure to continue these relationships on terms that are
acceptable to us or to continue to create additional relationships could have a
material adverse effect on our business, prospects, financial condition,
operating results and cash flows.
Inadequate
intellectual property protections could prevent us from enforcing or defending
our proprietary technology.
Our
success depends in part upon our proprietary technology. We rely on a
combination of patents, trademarks, trade secrets, copyrights and contractual
restrictions to protect our proprietary technology. However, these measures
provide only limited protection, and we may not be able to detect unauthorized
use or take appropriate steps to enforce our intellectual property rights,
particularly in foreign countries where the laws may not protect our proprietary
rights as fully as in the U.S. While we have been issued a number of patents and
other patent applications are currently pending, there can be no assurance that
any of these patents will not be challenged, invalidated or circumvented, or
that any rights granted under these patents will in fact provide competitive
advantages to us.
In
addition, effective protection of patents, copyrights, trademarks, trade secrets
and other intellectual property may be unavailable or limited in some foreign
countries. As a result, we may not be able to effectively prevent competitors in
these regions from infringing our intellectual property rights, which could
reduce our competitive advantage and ability to compete in those regions and
negatively impact our business.
Companies
in the messaging industry have experienced substantial litigation regarding
intellectual property. Currently, we have pending patent infringement lawsuits,
both offensive and defensive, against several companies in this industry. This
or any other litigation to enforce our intellectual property rights may be
expensive and time-consuming, could divert management resources and may not be
adequate to protect our business.
We
may be found to have infringed the intellectual property rights of others, which
could expose us to substantial damages or restrict our operations.
We have
been and expect to continue to be subject to claims and legal proceedings that
we have infringed the intellectual property rights of others. The ready
availability of damages, royalties and the potential for injunctive relief has
increased the costs associated with the litigation and settlement of patent
infringement claims. In addition, we may be required to indemnify our resellers
and users for similar claims made against them. Any claims against us, whether
or not meritorious, could require us to spend significant time and money in
litigation, pay damages, develop new intellectual property or acquire licenses
to intellectual property that is the subject of the infringement claims. These
licenses, if required, may not be available at all or have acceptable terms. As
a result, intellectual property claims against us could have a material adverse
effect on our business, prospects, financial condition, operating results and
cash flows.
We
may be engaged in legal proceedings that could cause us to incur unforeseen
expenses and could occupy a significant amount of our management’s time and
attention.
From time
to time we are subject to litigation or claims, including in the areas of patent
infringement and anti-trust, that could negatively affect our business
operations and financial condition. Such disputes could cause us to incur
unforeseen expenses, occupy a significant amount of our management’s time and
attention and negatively affect our business operations and financial condition.
We are unable to predict the outcome of our currently pending cases. Some or all
of the amount we may be required to pay to defend or to satisfy a judgment or
settlement of any or all of these proceedings may not be covered by insurance.
Under indemnification agreements we have entered into with our current and
former officers and directors, we are required to indemnify them, and advance
expenses to them, in connection with their participation in proceedings arising
out of their service to us. These payments may be material. For a more detailed
description of the lawsuits in which we are involved, see Item 3. Legal
Proceedings.
- 11
-
The
markets in which we operate are highly competitive and our competitors may have
greater resources to commit to growth, superior technologies, cheaper pricing or
more effective marketing strategies.
For
information regarding our competition, and the risks arising out of the
competitive environment in which we operate, see the section entitled
Competition contained in Item 1 of this Annual Report on Form 10-K. In addition,
some of our competitors include major companies with much greater resources and
significantly larger subscriber bases than we have. Some of these competitors
offer their services at lower prices than we do. These companies may be able to
develop and expand their communications and network infrastructures more
quickly, adapt more swiftly to new or emerging technologies and changes in
customer requirements, take advantage of acquisition and other opportunities
more readily and devote greater resources to the marketing and sale of their
products and services than we can. There can be no assurance that additional
competitors will not enter markets that we are currently serving and plan to
serve or that we will be able to compete effectively. Competitive pressures may
reduce our revenue, operating profits or both.
Our
business is highly dependent on our billing systems.
A
significant part of our revenues depends on prompt and accurate billing
processes. Customer billing is a highly complex process, and our billing systems
must efficiently interface with third-party systems, such as those of credit
card processing companies. Our ability to accurately and efficiently bill our
subscribers is dependent on the successful operation of our billing systems and
the third-party systems upon which we rely, such as our credit card processor,
and our ability to provide these third parties the information required to
process transactions. In addition, our ability to offer new paid services or
alternative-billing plans is dependent on our ability to customize our billing
systems. We are in the process of upgrading our current billing systems to meet
the needs of our growing subscriber base. Any failures or errors in our billing
systems or procedures or resulting from any upgrades to our billing systems or
procedures could impair our ability to properly bill our current customers or
attract and service new customers, and thereby could materially and adversely
affect our business and financial results.
Future
acquisitions could result in dilution, operating difficulties and other harmful
consequences.
We may
acquire or invest in additional businesses, products, services and technologies
that complement or augment our service offerings and customer base. We cannot
assure you that we will successfully identify suitable acquisition candidates,
integrate disparate technologies and corporate cultures and manage a
geographically dispersed company. Acquisitions could divert attention from other
business concerns and could expose us to unforeseen liabilities. In addition, we
may lose key employees while integrating any new companies. We may pay for some
acquisitions by issuing additional common stock, which would dilute current
stockholders. We may also use cash to make acquisitions. We will be required to
review goodwill and other intangible assets for impairment in connection with
past and future acquisitions, which may materially increase operating expenses
if an impairment issue is identified.
Our
success depends on our retention of our executive officers, senior management
and our ability to hire and retain key personnel.
Our
success depends on the skills, experience and performance of executive officers,
senior management and other key personnel. The loss of the services of one or
more of our executive officers, senior managers or other key employees could
have a material adverse effect on our business, prospects, financial condition,
operating results and cash flows. Our future success also depends on our
continuing ability to attract, integrate and retain highly qualified technical,
sales and managerial personnel. Competition for these people is intense, and
there can be no assurance that we can retain our key employees or that we can
attract, assimilate or retain other highly qualified technical, sales and
managerial personnel in the future.
As
we continue to grow our international operations, adverse currency fluctuations
and foreign exchange controls could have a material adverse effect on our
balance sheet and results of operations.
As we
expand our international operations, we could be exposed to significant risks of
currency fluctuations. In some countries outside the U.S., we already offer our
services in the applicable local currency, including but not limited to the
Canadian Dollar, the Euro and the British Pound Sterling. As a result,
fluctuations in foreign currency exchange rates affect the results of our
operations, which in turn may materially adversely affect reported earnings and
the comparability of period-to-period results of operations. Changes in currency
exchange rates may also affect the relative prices at which we and foreign
competitors sell our services in the same market. In addition, changes in the
value of the relevant currencies may affect the cost of certain items required
in our operations. Furthermore, we may become subject to exchange control
regulations, which might restrict or prohibit our conversion of other currencies
into U.S. Dollars. We cannot assure you that future exchange rate movements will
not have a material adverse effect on our future business, prospects, financial
condition, operating results and cash flows. To date, we have not entered into
foreign currency hedging transactions to control or minimize these
risks.
- 12
-
We
are exposed to risk if we cannot maintain or adhere to our internal controls and
procedures.
We have
established and continue to maintain, assess and update our internal controls
and procedures regarding our business operations and financial reporting. Our
internal controls and procedures are designed to provide reasonable assurances
regarding our business operations and financial reporting. However, because
of the inherent limitations in this process, internal controls and procedures
may not prevent or detect all errors or misstatements. To the extent our
internal controls are inadequate or not adhered to by our employees, our
business, financial condition and operating results could be materially
adversely affected.
If we are
not able to maintain internal controls and procedures in a timely manner, or
without adequate compliance, we may be unable to accurately report our financial
results or prevent fraud and may be subject to sanctions or investigations by
regulatory authorities such as the SEC or NASDAQ. Any such action or restatement
of prior-period financial results could harm our business or investors’
confidence in j2 Global, and could cause our stock price to fall.
Risks
Related To Our Industry
Our
services may become subject to burdensome telecommunications regulation, which
could increase our costs or restrict our service offerings.
We
believe that our services are “information services” under the
Telecommunications Act of 1996 and related precedent and therefore would not
currently be subject to U.S. telecommunications services regulation. We provide
our services through data transmissions over public telephone lines and other
facilities provided by carriers. These transmissions are subject to foreign and
domestic laws and regulation by the FCC, state public utility commissions and
foreign governmental authorities. These regulations affect the availability of
telephone numbers, the prices we pay for transmission services, the competition
we face from telecommunications service providers and other aspects of our
market. However, as messaging and communications services converge and as the
services we offer expand, we may become subject to FCC or other regulatory
agency regulation. Changes in the regulatory environment could decrease our
revenues, increase our costs and restrict our service offerings. In many of our
international locations, we are subject to regulation by the governmental
authority.
In the
U.S., Congress and the FCC regulations subsidize portions of the
telecommunications system out of the USF. Congress and the FCC are reviewing the
way it collects USF payments from telecommunications carriers. Among the
proposed changes being considered is imposing a flat fee per telephone number,
which could have a material adverse effect on the provision of our non-paid
services and could cause us to raise the price of our paid service.
In August
2005, the FCC reclassified wireline broadband Internet access services (i.e.,
DSL) as information services, thereby allowing telephone companies to offer
their lines to competing providers for what they decide is a “fair value” rather
than at “low rates.” The decision enables incumbent local exchange carriers to
charge higher rates for underlying broadband transmission service to competitive
local exchange carriers that service some of our lines in various states. This
could have an indirect impact on our profitability and operations.
The TCPA
and FCC rules implementing the TCPA, as amended by the Junk Fax Act, prohibit
sending unsolicited facsimile advertisements to telephone fax machines. The FCC
may take enforcement action against companies that send “junk faxes” and
individuals also may have a private cause of action. Although entities that
merely transmit facsimile messages on behalf of others are not liable for
compliance with the prohibition on faxing unsolicited advertisements, the
exemption from liability does not apply to fax transmitters that have a high
degree of involvement or actual notice of an illegal use and have failed to take
steps to prevent such transmissions. We take significant steps to ensure that
our services are not used to transmit unsolicited faxes on a large scale, and we
do not believe that we have a high degree of involvement or notice of the use of
our service to broadcast junk faxes. However, because fax transmitters do not
enjoy an absolute exemption from liability under the TCPA and related FCC rules,
we could face FCC inquiry and enforcement or civil litigation, or private causes
of action, if someone uses our service for such impermissible purposes. If this
were to occur and we were to be held liable for someone’s use of our service for
transmitting unsolicited faxes, the financial penalties could cause a material
adverse effect on our operations. We are currently involved in litigation
involving alleged violations of the TCPA with Protus IP Solutions, Inc. For more
information about this lawsuit, see Item 3 of this Annual Report on Form 10-K
entitled Legal Proceedings.
Also in
the U.S., the Communications Assistance to Law Enforcement Act (“CALEA”)
requires telecommunications carriers to be capable of performing wiretaps and
recording other call identifying information. In September 2005, the FCC
released an order defining telecommunications carriers that are subject to CALEA
obligations as facilities-based broadband Internet access providers and
Voice-over-Internet-Protocol (“VoIP”) providers that interconnect with the
public switched telephone network. As a result of this definition, we do not
believe that j2 Global is subject to CALEA. However, if the category of service
providers to which CALEA applies broadens to also include information services,
that change may impact our operations.
- 13
-
In
addition, for calls placed to certain of our European telephone numbers we
receive revenue share payments from the local telecommunications
carrier. The per minute rates applicable to these "calling party pays"
telephone numbers is subject to foreign laws and regulations. A
reduction in the permitted per minute rates would reduce our revenues
and could cause us to restrict our service offerings.
For more
information regarding telecommunications regulation that may affect our
business, please see Item 1 of this Annual Report on Form 10-K entitled
Government Regulation.
Our
business could suffer if we cannot obtain or retain telephone numbers, are
prohibited from obtaining local numbers or are limited to distributing local
numbers to only certain customers.
Our
future success depends on our ability to procure large quantities of local
telephone numbers in the U.S. and foreign countries in desirable locations at a
reasonable cost and offer our services to our prospective customers without
restrictions. Our ability to procure and distribute telephone numbers depends on
factors such as applicable regulations, the practices of telecommunications
carriers that provide telephone numbers, the cost of these telephone numbers and
the level of demand for new telephone numbers. In addition, although we are the
customer of record for all of our U.S. telephone numbers, from time to time,
certain U.S. telephone carriers illegally inhibit our ability to port numbers or
illegally port our telephone numbers away from us to other carriers
.
Also, in some foreign
jurisdictions, under certain circumstances, our customers are permitted to port
their telephone numbers to another carrier. These factors could lead to
increased cancellations by our customers and loss of our telephone number
inventory. These factors may have a material adverse effect on our business,
prospects, financial condition, operating results, cash flows and growth in or
entry into foreign or domestic markets.
For
example, several years ago the FCC conditionally granted petitions by
Connecticut and California to adopt specialized “unified messaging” area codes,
but neither state has adopted such a code. Adoption of a specialized area code
within a state or nation could harm our ability to complete in that state or
nation if materially affecting our ability to acquire telephone numbers for our
operations or making our services less attractive due to unavailability of
telephone numbers with a local geographic identity.
In
addition, future growth in our subscriber base, together with growth in the
subscriber bases of providers of other fax and/or voicemail to email and unified
messaging services, has increased and may continue to increase the demand for
large quantities of telephone numbers, which could lead to insufficient capacity
and our inability to acquire sufficient telephone numbers to accommodate our
future growth. For more information regarding telecommunications regulation that
may affect our ability to obtain telephone numbers, please see Item 1 of this
Annual Report on Form 10-K entitled Government Regulation.
The
value-added messaging and communications services industry is undergoing rapid
technological changes and we may not be able to keep up.
The
value-added messaging and communications services industry is subject to rapid
and significant technological change. We cannot predict the effect of
technological changes on our business. We expect that new services and
technologies will emerge in the markets in which we compete. These new services
and technologies may be superior to the services and technologies that we use or
these new services may render our services and technologies obsolete. Our future
success will depend, in part, on our ability to anticipate and adapt to
technological changes and evolving industry standards. We may be unable to
obtain access to new technologies on acceptable terms or at all, and may
therefore be unable to offer services in a competitive manner. Any of the
foregoing risks could have a material adverse effect on our business, prospects,
financial condition, operating results and cash flows.
We
are subject to regulations relating to data privacy, security and
retention.
Many U.S.
states and foreign jurisdictions have passed laws in the area of data privacy,
security and retention. The costs of compliance with these laws may increase in
the future as a result of laws that conflict from country to country, changes in
those laws, changes in the interpretations or interpretations that are not
consistent with our current data protection practices. This could reduce demand
for our services, increase the cost of doing business as a result of litigation
costs, increase service or delivery costs or otherwise harm our business.
Failure to comply with these and other international data privacy, security and
retention laws could subject us to lawsuits, fines, criminal penalties,
statutory damages, adverse publicity and other losses that could harm our
business. Further, any failure by us to protect our users’ privacy and data
could result in a loss of user confidence in our services and ultimately in a
loss of users, which could adversely affect our business.
New
and existing regulations could harm our business.
We are
subject to the same foreign and domestic laws as other companies conducting
business on and off the Internet. There are relatively few laws specifically
directed towards online services. However, due to the increasing use of the
Internet and online services, laws relating to the Internet (such as user
privacy, freedom of expression, pricing, fraud, content and quality of products
and
- 14
-
services,
taxation, advertising, intellectual property rights and information security)
are being debated around the world. It is not clear how existing laws governing
issues such as property ownership, copyrights and other intellectual property
issues, taxation, libel and defamation, obscenity and personal privacy apply to
online businesses because many of these laws were adopted prior to the advent of
the Internet and related technologies and, as a result, do not contemplate or
address the related issues. Enactment of new laws and regulations, or the
interpretation of existing laws and regulations in a way that is adverse to us,
could have a material adverse effect on our business, prospects, financial
condition, operating results and cash flows.
The
Controlling the Assault of Non-Solicited Pornography and Marketing Act of 2003
(the “CAN-SPAM Act”), which allows for penalties that run into the millions of
dollars, requires commercial emails to include identifying information from the
sender and a mechanism for the receiver to opt out of receiving future emails.
We believe that our email practices comply with the requirements of the CAN-SPAM
Act. If we were ever found to be in violation of the CAN-SPAM Act, that could
have a material adverse effect on our business, financial condition, operating
results and cash flows.
In
addition, because our services are accessible worldwide and we continue to
expand our international activities, foreign jurisdictions may claim that we are
required to comply with their laws. Non-U.S. laws regulating Internet companies
may give different rights to consumers, content owners and users than comparable
U.S. laws. Compliance may be more costly or may require us to change our
business practices or restrict our service offerings relative to those in the
U.S. Our failure to comply with foreign laws could subject us to penalties
ranging from criminal prosecution to bans on our services.
Increased
cost of email transmissions could have a material adverse effect on our
business.
We rely
on email for the delivery of our fax and voicemail messages. In addition, we
derive some advertising revenues through the delivery of email messages to our
free subscribers and we regularly communicate with our subscribers via email. We
also offer email services through Electric Mail. If regulations or other changes
in the industry lead to a charge associated with the sending or receiving of
email messages, the cost of providing our services would increase and, if
significant, could materially adversely affect our business, prospects,
financial condition, operating results and cash flows.
Risks
Related To Our Stock
In
order to sustain our growth, we must continue to attract new paid subscribers at
a greater rate and with at least an equal amount of revenues per subscriber than
we lose existing paid subscribers.
We may
not be able to continue to grow or even sustain our current base of paid
customers on a quarterly or annual basis. Our future success depends heavily on
the continued growth of our paid user base. In order to sustain our growth we
must continuously obtain an increasing number of paid users to replace the users
who cancel their service. In addition, these new users must provide revenue
levels per subscriber that are greater than or equal to the levels of our
current customers or the customers they are replacing. We must also retain our
existing customers while continuing to attract new ones at desirable costs. We
cannot be certain that our continuous efforts to offer high quality services at
attractive prices will be sufficient to retain our customer base or attract new
customers at rates sufficient to offset customers who cancel their service. In
addition, we believe that competition from companies providing similar or
alternative services has caused, and may continue to cause, some of our
customers or prospective customers to sign up with or to switch to our
competitors’ services. Moreover, we have experienced, and may continue to
experience, an overall reduction in our average revenue per subscriber due to a
combination of a shift in the mix of products sold and reduced usage from
customers. These factors may adversely affect our customer retention rates, the
number of our new customer acquisitions, our average revenue per subscriber
and/or subscriber usage levels. Any combination of a decline in our rate of new
customer sign-ups, decline in usage rates of our customers, decline in average
revenue per subscriber, decline in customer retention rates or decline in the
size of our overall customer base may result in a decrease in our revenues,
which could have a material adverse effect on our business, prospects, financial
condition, operating results and cash flows.
Future
sales of our common stock may negatively affect our stock price.
As of
February 16, 2010, substantially all of our outstanding shares of common stock
were available for resale, subject to volume and manner of sale limitations
applicable to affiliates under SEC Rule 144. Sales of a substantial number of
shares of common stock in the public market or the perception of such sales
could cause the market price of our common stock to decline. These sales also
might make it more difficult for us to sell equity securities in the future at a
price that we think is appropriate, or at all.
Anti-takeover
provisions could negatively impact our stockholders.
Provisions
of Delaware law and of our certificate of incorporation and bylaws could make it
more difficult for a third party to
- 15
-
acquire
control of us. For example, we are subject to Section 203 of the Delaware
General Corporation Law, which would make it more difficult for another party to
acquire us without the approval of our board of directors. Additionally, our
certificate of incorporation authorizes our board of directors to issue
preferred stock without requiring any stockholder approval, and preferred stock
could be issued as a defensive measure in response to a takeover proposal. These
provisions could make it more difficult for a third party to acquire us even if
an acquisition might be in the best interest of our stockholders.
Our
stock price may be volatile or may decline.
Our stock
price and trading volumes have been volatile and we expect that this volatility
will continue in the future due to factors, such as:
|
|
•
|
Assessments
of the size of our subscriber base and our average revenue per subscriber,
and comparisons of our results in these and other areas versus prior
performance and that of our
competitors;
|
|
|
•
|
Variations
between our actual results and investor
expectations;
|
|
|
•
|
Regulatory
or competitive developments affecting our
markets;
|
|
|
•
|
Investor
perceptions of us and comparable public
companies;
|
|
|
•
|
Conditions
and trends in the communications, messaging and Internet-related
industries;
|
|
|
•
|
Announcements
of technological innovations and
acquisitions;
|
|
|
•
|
Introduction
of new services by us or our
competitors;
|
|
|
•
|
Developments
with respect to intellectual property
rights;
|
|
|
•
|
Conditions
and trends in the Internet and other technology
industries;
|
|
|
•
|
Rumors,
gossip or speculation published on public chat or bulletin
boards;
|
|
|
•
|
General
market conditions; and
|
|
|
•
|
Geopolitical
events such as war, threat of war or terrorist
actions.
|
In
addition, the stock market has from time to time experienced significant price
and volume fluctuations that have affected the market prices for the common
stocks of technology and other companies, particularly communications and
Internet companies. These broad market fluctuations have previously resulted in
a material decline in the market price of our common stock. In the past,
following periods of volatility in the market price of a particular company’s
securities, securities class action litigation has often been brought against
that company. We may become involved in this type of litigation in the future.
Litigation is often expensive and diverts management’s attention and resources,
which could have a material adverse effect on our business, prospects, financial
condition, operating results and cash flows.
None.
As of
December 31, 2009, we were leasing approximately 40,000 square feet of office
space for our headquarters in Los Angeles, California under a lease that expires
in January 2010 which was extended through January 31, 2020. We lease
this space from an entity indirectly controlled by our Chairman of the Board.
Additionally, we have smaller leased office facilities in British Columbia;
California; Hong Kong; Illinois; and Ireland.
All of
our network equipment is housed either at our leased properties or at one of our
multiple co-location facilities around the world.
- 16
-
Overview
of Legal Proceedings Against Us
From time
to time, we are involved in litigation and other disputes or regulatory
inquiries that arise in the ordinary course of our business. Many of these
actions involve or are filed in response to patent actions filed by us against
others. The number and significance of these disputes and inquiries has
increased as our business has expanded and j2 Global has grown. Any claims or
regulatory actions against us, whether meritorious or not, could be
time-consuming, result in costly litigation, require significant management time
and result in diversion of significant operational resources.
As part
of our continuing effort to prevent the unauthorized use of our intellectual
property, we have initiated litigation against the following companies, among
others, for infringing our patents relating to Internet fax and other messaging
technologies: Open Text Corporation and its Captaris business (“Open Text”),
Integrated Global Concepts, Inc. (“IGC”), Venali, Inc. (“Venali”), Protus IP
Solutions, Inc. (“Protus”), EasyLink Services International Corp. (“EasyLink”)
and Packetel, Inc. (“Packetel”). In January 2010 we settled our
patent infringement suit against Comodo Group, Ltd. Three of the
patents at issue in some of these lawsuits have been reaffirmed through
reexamination proceedings with the United States Patent and Trademark
Office.
Open
Text, Venali, Protus, EasyLink and Packetel have each filed counterclaims
against us, including seeking declaratory judgments of non-infringement,
invalidity and unenforceability of our patents. Open Text and Protus have also
asserted counterclaims purporting to allege antitrust violations of Section 2 of
the Sherman Act and California’s Business and Professions Code §§ 16720 and
17200. Open Text and Protus are seeking dismissal of our patent
infringement claims, damages, including treble and punitive damages, injunctions
against further violations, and attorneys’ fees and costs. All of
these cases are being litigated in the United States District Court for the
Central District of California before the same judge, who has indicated that the
cases will be handled in a coordinated fashion. Discovery in all of
these cases is underway. Trial is currently scheduled to begin March
1, 2011. We are also pursuing claims against Protus in Canada based
on Canadian patents and Protus has asserted similar anti-competition claims
against us in response.
In July
2005, one of our affiliates filed a separate case against Venali in the United
States District Court for the Central District of California, asserting
infringement of several other U.S. patents. Venali filed various counterclaims
against us and our affiliate on December 27, 2006, which included antitrust
counterclaims related in substantial part to the patent infringement claims by
our affiliate against Venali. On May 11, 2007, the court entered a claim
construction order regarding the disputed terms of the patents-in-suit. On
August 12, 2008, the court granted Venali’s motion for summary judgment of
non-infringement. On November 3, 2008, the court granted our summary
judgment motion on Venali’s remaining counterclaims, which alleged antitrust
violations based on our enforcement of our patents. We appealed the
non-infringement ruling in the case to the United States Court of
Appeals for the Federal Circuit. On January 22, 2010, the Federal Circuit
issued a decision affirming the District Court’s grant of summary judgment of
non-infringement. Venali did not appeal the dismissal of its
antitrust counterclaims.
On May
12, 2003, we filed an application to register the eFax mark on the United States
Patent and Trademark Office (“USPTO”) Principal Register, which the USPTO
approved and published for opposition. In July 2005, Protus filed an
opposition proceeding before the USPTO Trademark Trial and Appeal Board seeking
to prevent such registration. In the opposition proceeding, Protus
claims that the mark is generic or merely descriptive and not entitled to
registration. On September 1, 2005, we responded to Protus’ Notice of
Opposition. The parties are engaged in discovery. Trial
before the Trademark Trial and Appeal Board is set to conclude on September 15,
2010.
In
January 2006, we filed a complaint in the United States District Court for the
Central District of California against Protus asserting causes of action for
violation of the Federal Telephone Consumer Protection Act, trespass to
chattels, and unfair business practices as a result of Protus sending “junk
faxes” to us and our customers. We are seeking statutory and treble damages,
attorneys’ fees, interest and costs, as well as a permanent injunction against
Protus continuing its junk fax sending practices. In September 2007, Protus
filed a counterclaim against us asserting the same causes of action as those
asserted against it, as well as claims for false advertising, trade libel,
tortious interference with prospective economic advantage and defamation. Protus
is seeking, among other things, general and special damages, treble damages,
punitive damages, attorneys’ fees, interest and costs, as well as a permanent
injunction against us sending any more junk faxes. The parties are engaged in
discovery. Trial is currently set for January 18, 2011.
On
September 15, 2006, one of our affiliates filed a patent infringement suit
against IGC in the United States District Court for the Northern District
of Georgia. On May 13, 2008, IGC filed counterclaims alleging
violations of Section 2 of the Sherman Act and breach of contract. IGC is
seeking damages, including treble and punitive damages, an injunction against
further violations, divestiture of certain assets, attorneys’ fees and costs. On
June 13, 2008, we moved to dismiss the amended counterclaims, and on August 28,
2008, we moved to stay the action pending the appeal in the 2005 case against
Venali, described above, which involves the same patents and claims at issue in
the IGC action. On February 18, 2009, the Court granted our motion to stay the
case pending the conclusion of the Venali appeal. On January 29,
2010, we gave the Court notice of the Federal Circuit’s decision in the Venali
appeal, thereby lifting the stay. No further proceedings have
occurred thus far.
- 17
-
On
December 12, 2006, Venali filed suit against us in the United States District
Court for the Southern District of Florida, alleging infringement of U.S. Patent
Number 7,114,004 (the “ ’004 Patent”). Venali is seeking damages in the
amount of lost profits or a reasonable royalty, a permanent injunction against
continued infringement, treble damages, attorneys’ fees, interest and costs. On
March 6, 2007, we filed an answer to the complaint denying liability. On May 17,
2007, we filed a request with the USPTO for reexamination of the ’004 Patent,
which request was granted on July 27, 2007. On August 20, 2007, the court
granted our motion to stay the action pending the reexamination. On
October 1, 2009, the USPTO issued a Notice of Intent to Issue a Reexamination
Certificate confirming the claims of the ’004 Patent. On December 1,
2009, the Court lifted the stay. Discovery is ongoing in this
case. Trial is currently scheduled to begin March 14,
2011.
On May 9,
2007, Bear Creek Technologies, Inc. (“Bear Creek”) filed suit against us in the
United States District Court for the Eastern District of Texas, alleging
infringement of U.S. Patent Number 6,985,494 (the “ ‘494 patent”). Bear
Creek is seeking damages in at least the amount of a reasonable royalty, a
permanent injunction against continued infringement, treble damages, attorneys’
fees, interest and costs. On June 29, 2007, we filed an answer to the complaint
denying liability, asserting affirmative defenses and asserting counterclaims of
non-infringement and invalidity. On September 21, 2007, Bear Creek filed its
reply to our counterclaims, denying each one. On February 11, 2008 we filed a
request for reexamination of the ‘494 patent with the USPTO. On February 28,
2008, the Court stayed the case during the pendency of the reexamination
proceedings. On April 18, 2008, the USPTO granted the reexamination
request. On February 12, 2009, the USPTO finally rejected the reexamined
claims, and Bear Creek failed to file a response within the prescribed
timeframe. On June 16, 2009, the USPTO issued a right to appeal the
examiner’s rejection. Bear Creek filed its appeal on September 16,
2009. We filed our response to Bear Creek’s appeal on October 14,
2009 and are awaiting an answer from the USPTO examiner. On
September 10, 2009, the Court “Administratively Closed” the case pending
resolution of the reexamination proceeding.
In
November 2008, we and one of our affiliates filed a lawsuit against Zilker
Ventures, LLC and Choosewhat.com, LLC (collectively, “Zilker”) in the United
States District Court for the Central District of California alleging
infringement of our eFax trademark and for false advertising in violation of §
43(a) of the Lanham Act and California’s Business and Professions Code §17200 et
seq. The lawsuit sought an accounting for Zilker’s profits, our lost profits,
attorney fees, interest and costs, as well as a permanent injunction against
Zilker’s trademark infringement and false advertising activities. On
December 23, 2008, Zilker filed a counterclaim seeking a declaration that our
eFax trademark is generic or merely descriptive and not entitled to trademark
protection or registration and that Zilker’s use of the eFax mark was a fair
use. Zilker sought to recover attorney fees and costs in addition to declaratory
relief. On September 14, 2009, Zilker filed a motion for summary
judgment that it did not infringe our eFax mark, did not engage in false
advertising, and on its claim for a declaration that our eFax mark is generic or
merely descriptive. On November 4, 2009, the Court denied the
motion. On November 13, 2009, the case was dismissed pursuant to a
settlement agreement.
We do not
believe, based on current knowledge, that any of the foregoing legal proceedings
or claims is likely to have a material adverse effect on our consolidated
financial position, results of operations or cash flows. However, depending on
the amount and the timing, an unfavorable resolution of some or all of these
matters could materially affect our consolidated financial position, results of
operations or cash flows in a particular period. We have not accrued for a loss
contingency relating to these legal proceedings because unfavorable outcomes are
not considered by management to be probable or reasonably
estimable.
No
matters were submitted to a vote of security holders during the fourth quarter
of 2009.
- 18
-
Market
Information
Our
common stock is traded on the NASDAQ Global Select Market under the symbol
“JCOM”. The following table sets forth the high and low closing sale prices for
our common stock for the periods indicated, as reported by the NASDAQ Global
Select Market.
|
High
|
Low
|
|||||||
|
Year
ended December 31, 2009
|
||||||||
|
First
Quarter
|
$ | 21.89 | $ | 16.26 | ||||
|
Second
Quarter
|
24.80 | 20.18 | ||||||
|
Third
Quarter
|
24.53 | 20.35 | ||||||
|
Fourth
Quarter
|
22.29 | 19.28 | ||||||
|
Year
ended December 31, 2008
|
||||||||
|
First
Quarter
|
24.00 | 18.59 | ||||||
|
Second
Quarter
|
26.80 | 20.91 | ||||||
|
Third
Quarter
|
26.97 | 21.30 | ||||||
|
Fourth
Quarter
|
22.96 | 13.74 | ||||||
Holders
We had
302 registered stockholders as of February 16, 2010. That number excludes the
beneficial owners of shares held in “street” names or held through participants
in depositories.
Dividends
We have
never paid cash dividends on our stock and currently anticipate that we will
continue to retain any future earnings to finance the growth of our
business.
Recent
Sales of Unregistered Securities
We did
not issue any unregistered securities during the fourth quarter of
2009.
Issuer
Purchases of Equity Securities
We did
not repurchase any of our equity securities during the fourth quarter of
2009.
Equity
Compensation Plan Information
The
following table provides information as of December 31, 2009 regarding shares
outstanding and available for issuance under j2 Global’s existing equity
compensation plans:
| Plan Category |
Number
of Securities
to
be Issued Upon
Exercise
of
Outstanding
Options,
Warrants
and
Rights
(a)
|
Weighted-Average
Exercise
Price of
Outstanding
Options,
Warrants
and
Rights
(b)
|
Number
of Securities
Remaining
Available
for
Future Issuance
Under
Equity
Compensation
Plans
(Excluding
Securities
Reflected in
Column
(a))
(c)
|
|||||||||
|
Equity compensation plans
approved by security holders
|
4,480,591 | $ | 13.17 | 4,203,637 | ||||||||
|
Equity compensation plans not
approved by security holders
|
— | — | — | |||||||||
|
Total
|
4,480,591 | $ | 13.17 | 4,203,637 | ||||||||
The
number of securities remaining available for future issuance includes 2,542,110
and 1,661,527 under our 2007 Stock Plan and 2001 Employee Stock Purchase Plan,
respectively. Please refer to Note 11 to the accompanying consolidated financial
statements for a description of these Plans as well as our Second Amended and
Restated 1997 Stock Option Plan, which terminated in 2007.
- 19
-
Performance
Graph
This
performance graph shall not be deemed “filed” for purposes of Section 18 of the
Securities Exchange Act of 1934, as amended (the “Exchange Act”), or otherwise
subject to the liabilities under that Section and shall not be deemed to be
incorporated by reference into any filing of j2 Global under the Securities Act
of 1933, as amended, or the Exchange Act.
The
following graph compares the cumulative total stockholder return for j2 Global,
the NASDAQ Telecommunications Index and an index of companies that j2 Global has
selected as its peer group. The peer group index included in the performance
graph consists of: deltathree, Inc., Easylink Services International Corporation
(formerly Easylink Services Corporation), C2 Global Technologies, Inc. (formerly
I-Link Corporation), iBasis, Inc. and Premiere Global Services, Inc. (formerly
PTEK Holdings, Inc.). We believe that the peer group index provides a
representative group of companies in the outsourced messaging and communications
industry. Measurement points are December 31, 2004 and the last trading day in
each of j2 Global’s fiscal quarters through the end of fiscal 2009. The graph
assumes that $100 was invested on December 31, 2004 in j2 Global’s common stock
and in each of the indices, and assumes reinvestment of any dividends. No
dividends have been declared or paid on j2 Global’s common stock. The stock
price performance on the following graph is not necessarily indicative of future
stock price performance.
[PERFORMANCE
GRAPH IS SET FORTH ON THE FOLLOWING PAGE]
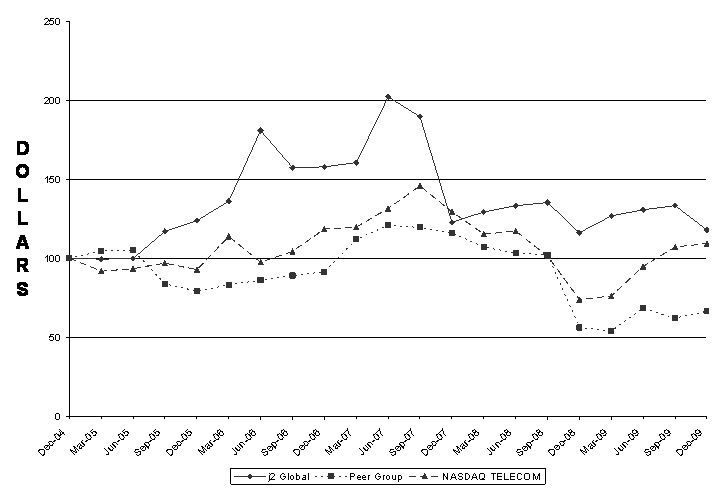
- 20
-
|
Peer
Group
|
NASDAQ
|
|||||||||||
|
Measurement
Date
|
j2
Global
|
Composite
Index
|
Telecom
Index
|
|||||||||
|
Dec-04
|
$ | 100.00 | $ | 100.00 | $ | 100.00 | ||||||
|
Mar-05
|
$ | 99.48 | $ | 104.66 | $ | 91.77 | ||||||
|
Jun-05
|
$ | 99.83 | $ | 105.06 | $ | 93.40 | ||||||
|
Sep-05
|
$ | 117.16 | $ | 83.82 | $ | 96.90 | ||||||
|
Dec-05
|
$ | 123.88 | $ | 79.16 | $ | 92.79 | ||||||
|
Mar-06
|
$ | 136.23 | $ | 83.20 | $ | 113.90 | ||||||
|
Jun-06
|
$ | 180.99 | $ | 86.16 | $ | 97.47 | ||||||
|
Sep-06
|
$ | 157.51 | $ | 89.12 | $ | 104.34 | ||||||
|
Dec-06
|
$ | 157.97 | $ | 91.47 | $ | 118.55 | ||||||
|
Mar-07
|
$ | 160.70 | $ | 112.07 | $ | 119.78 | ||||||
|
Jun-07
|
$ | 202.32 | $ | 120.87 | $ | 131.54 | ||||||
|
Sep-07
|
$ | 189.74 | $ | 119.56 | $ | 145.89 | ||||||
|
Dec-07
|
$ | 122.72 | $ | 116.04 | $ | 129.42 | ||||||
|
Mar-08
|
$ | 129.39 | $ | 107.06 | $ | 115.28 | ||||||
|
Jun-08
|
$ | 133.33 | $ | 103.44 | $ | 117.22 | ||||||
|
Sep-08
|
$ | 135.36 | $ | 102.13 | $ | 101.30 | ||||||
|
Dec-08
|
$ | 116.17 | $ | 56.09 | $ | 73.79 | ||||||
|
Mar-09
|
$ | 126.90 | $ | 53.96 | $ | 76.11 | ||||||
|
Jun-09
|
$ | 130.78 | $ | 68.34 | $ | 94.87 | ||||||
|
Sep-09
|
$ | 133.39 | $ | 62.04 | $ | 107.18 | ||||||
|
Dec-09
|
$ | 117.97 | $ | 66.42 | $ | 109.39 | ||||||
- 21
-
The
following selected consolidated financial data should be read in conjunction
with our consolidated financial statements, the related Notes contained in this
Annual Report on Form 10-K and the information contained herein in Item 7,
Management’s Discussion and Analysis of Financial Condition and Results of
Operations. Historical results are not necessarily indicative of future results.
All share numbers and per share amounts have been retroactively restated to
reflect our May 2006 two-for-one stock split effected in the form of a stock
dividend.
|
Year Ended December 31
,
|
||||||||||||||||||||
|
2009
|
2008
|
2007
|
2006
|
2005
|
||||||||||||||||
|
(In
thousands except share and per share amounts)
|
||||||||||||||||||||
|
Statement
of Operations Data:
|
||||||||||||||||||||
|
Revenues
|
$ | 245,571 | $ | 241,513 | $ | 220,697 | $ | 181,079 | $ | 143,941 | ||||||||||
|
Cost
of revenues
|
44,730 | 46,250 | 43,987 | 36,723 | 29,844 | |||||||||||||||
|
Gross
profit
|
200,841 | 195,263 | 176,710 | 144,356 | 114,097 | |||||||||||||||
|
Operating
expenses:
|
||||||||||||||||||||
|
Sales
and marketing
|
37,006 | 41,270 | 38,768 | 30,792 | 23,025 | |||||||||||||||
|
Research,
development and engineering
|
11,657 | 12,031 | 11,833 | 8,773 | 7,134 | |||||||||||||||
|
General
and administrative
|
45,275 | 44,028 | 39,683 | 38,754 | 23,464 | |||||||||||||||
|
Loss
on disposal of long-lived asset
|
2,442 | — | — | — | — | |||||||||||||||
|
Total
operating expenses
|
96,380 | 97,329 | 90,284 | 78,319 | 53,623 | |||||||||||||||
|
Operating
earnings
|
104,461 | 97,934 | 86,426 | 66,037 | 60,474 | |||||||||||||||
|
Other
income and expenses:
|
||||||||||||||||||||
|
Gain
on sale of investment
|
— | — | — | — | 9,808 | |||||||||||||||
|
Other-than-temporary
impairment losses
|
(9,343 | ) | ||||||||||||||||||
|
Interest
and other income
|
3,100 | 4,778 | 9,272 | 7,269 | 3,416 | |||||||||||||||
|
Interest
and other expense
|
(439 | ) | (559 | ) | (237 | ) | (74 | ) | (76 | ) | ||||||||||
|
Total
other income and expenses
|
(6,682 | ) | 4,219 | 9,035 | 7,195 | 13,148 | ||||||||||||||
|
Earnings
before income taxes
|
97,779 | 102,153 | 95,461 | 73,232 | 73,622 | |||||||||||||||
|
Income
tax expense
|
30,952 | 29,591 | 27,000 | 20,101 | 23,004 | |||||||||||||||
|
Net
earnings
|
$ | 66,827 | $ | 72,562 | $ | 68,461 | $ | 53,131 | $ | 50,618 | ||||||||||
|
Net
earnings per common share:
|
||||||||||||||||||||
|
Basic
|
$ | 1.52 | $ | 1.63 | $ | 1.40 | $ | 1.08 | $ | 1.05 | ||||||||||
|
Diluted
|
$ | 1.48 | $ | 1.58 | $ | 1.35 | $ | 1.04 | $ | 0.99 | ||||||||||
|
Weighted
average shares outstanding:
|
||||||||||||||||||||
|
Basic
|
43,936,194 | 44,609,174 | 48,953,483 | 49,209,129 | 48,224,818 | |||||||||||||||
|
Diluted
|
45,138,001 | 45,937,506 | 50,762,007 | 51,048,995 | 51,171,794 | |||||||||||||||
|
December 31
,
|
||||||||||||||||||||
|
2009
|
2008
|
2007
|
2006
|
2005
|
||||||||||||||||
|
(In
thousands)
|
||||||||||||||||||||
|
Balance
Sheet Data:
|
||||||||||||||||||||
|
Cash
and cash equivalents
|
$ | 197,411 | $ | 150,780 | $ | 154,220 | $ | 95,605 | $ | 36,301 | ||||||||||
|
Working
capital
|
227,538 | 142,123 | 193,794 | 165,207 | 107,938 | |||||||||||||||
|
Total
assets
|
414,001 | 322,040 | 350,409 | 288,160 | 221,944 | |||||||||||||||
|
Other
long-term liabilities
|
2,094 | 1,022 | 59 | — | 149 | |||||||||||||||
|
Total
stockholders’ equity
|
336,172 | 249,980 | 282,614 | 254,741 | 202,255 | |||||||||||||||
_______________
Cash
Dividends
No cash
dividends were paid for the years presented.
- 22
-
In
addition to historical information, the following discussion and analysis of
management contains forward-looking statements. These forward-looking statements
involve risks, uncertainties and assumptions. The actual results may differ
materially from those anticipated in these forward-looking statements as a
result of many factors, including but not limited to those discussed below, the
results of any acquisition we may complete and the factors discussed in Item 1A
in this Annual Report on Form 10-K entitled Risk Factors. Readers are cautioned
not to place undue reliance on these forward-looking statements, which reflect
management’s opinions only as of the date hereof. j2 Global undertakes no
obligation to revise or publicly release the results of any revision to these
forward-looking statements. Readers should carefully review the risk factors
described in this document as well as in other documents we file from time to
time with the SEC, including the Quarterly Reports on Form 10-Q and any Current
Reports on Form 8-K filed or to be filed by us in 2010.
Overview
j2 Global
Communications, Inc. (“j2 Global”, “our”, “us” or “we”) is a Delaware
corporation founded in 1995. By leveraging the power of the Internet, we provide
outsourced, value-added messaging and communications services to individuals and
businesses throughout the world. We offer fax, voicemail, email and call
handling services and bundled suites of certain of these services. We market our
services principally under the brand names
eFax
®
,
eFax Corporate
®
,
Onebox
®
,
eVoice
®
and
Electric Mail
®
.
We
deliver many of our services through our global telephony/Internet Protocol
(“IP”) network, which spans more than 3,500 cities in 46 countries across six
continents. We have created this network, and continuously seek to expand it,
through negotiation with U.S. and foreign telecommunications and co-location
providers for telephone numbers (also referred to as Direct Inward Dial numbers
or “DIDs”), Internet bandwidth and co-location space for our equipment. We
maintain and seek to grow an inventory of telephone numbers to be assigned to
new customers. Most of these numbers are “local” (as opposed to toll-free),
which enables us to provide our paying subscribers telephone numbers with a
geographic identity. In addition to growing our business internally, we have
used acquisitions to grow our customer base, enhance our technology and acquire
skilled personnel.
Our core
services include fax, voicemail, email and call handling, as well as bundled
suites of certain of these services. These are business services that make our
customers more efficient, more mobile, more cost-effective and more secure than
traditional alternatives. We generate substantially all of our revenue from
subscribers that pay subscription and usage fees. Subscription fees are referred
to as “fixed” revenues, while usage fees are referred to as “variable” revenues.
We also generate revenues from patent licensing and sales, advertising and
revenue share from our customers’ use of premium rate telephone numbers. Of the
11.2 million telephone numbers deployed as of December 31, 2009, approximately
1.3 million were serving paying subscribers, with the balance deployed to free
subscribers, including those with premium rate telephone numbers. We operate in
one reportable segment: value-added messaging and communications services, which
provides for the delivery of fax, voice and email messages and communications
via the telephone and/or Internet networks.
During
the past three years, we have derived a substantial portion of our revenues from
our DID-based services, including
eFax, Onebox
and
eVoice
. As a result, we
believe that paying DIDs and the revenues associated therewith are an important
metric for understanding our business. It has been and continues to be our
objective to increase the number of paying DIDs through a variety of
distribution channels and marketing arrangements and by enhancing our brand
awareness. In addition, we seek to increase revenues through a combination of
stimulating use by our customers of usage-based services, introducing new
services and instituting appropriate price increases to our fixed monthly
subscription and other fees.
For the
past three years, 90% or more of our total revenues have been produced by our
DID-based services. DID-based revenues have increased to $233.4 million from
$205.3 million for the three-year period ending December 31, 2009. The primary
reason for this increase was a 20% increase in the number of paid DIDs over this
period. We expect that DID-based revenues will continue to be a dominant driver
of total revenues.
The
following table sets forth our key operating metrics for the years ended
December 31, 2009, 2008 and 2007 (in thousands except for percentages and
average revenue per paying telephone number):
|
December 31,
|
||||||||||||
|
2009
|
2008
|
2007
|
||||||||||
|
Free
service telephone numbers
|
9,910 | 10,363 | 10,874 | |||||||||
|
Paying
telephone numbers
|
1,275 | 1,236 | 1,064 | |||||||||
|
Total
active telephone numbers
|
11,185 | 11,599 | 11,938 | |||||||||
- 23
-
|
Year Ended December 31,
|
||||||||||||
|
2009
|
2008
|
2007
|
||||||||||
|
Subscriber
revenues:
|
||||||||||||
|
Fixed
|
$ | 197,918 | $ | 186,459 | $ | 162,099 | ||||||
|
Variable
|
44,004 | 50,382 | 50,230 | |||||||||
|
Total
subscriber revenues
|
$ | 241,922 | $ | 236,841 | $ | 212,329 | ||||||
|
Percentage
of total subscriber revenues:
|
||||||||||||
|
Fixed
|
81.8% | 78.7% | 76.3% | |||||||||
|
Variable
|
18.2% | 21.3% | 23.7% | |||||||||
|
Revenues:
|
||||||||||||
|
DID-based
|
$ | 233,443 | $ | 228,984 | $ | 205,290 | ||||||
|
Non-DID-based
|
12,128 | 12,529 | 15,407 | |||||||||
|
Total
revenues
|
$ | 245,571 | $ | 241,513 | $ | 220,697 | ||||||
|
Average
monthly revenue per paying telephone number (1)
|
$ | 15.09 | $ | 15.96 | $ | 16.75 | ||||||
|
(1)
See calculation of average revenue per paying telephone number at the end
of this section, Item 7, Management’s Discussion and Analysis of Financial
Condition and Results of Operations.
|
||||||||||||
Critical
Accounting Policies and Estimates
In the
ordinary course of business, we have made a number of estimates and assumptions
relating to the reporting of results of operations and financial condition in
the preparation of our financial statements in conformity with U.S. generally
accepted accounting principles (“GAAP”). Actual results could differ
significantly from those estimates under different assumptions and conditions.
We believe that the following discussion addresses our most critical accounting
policies, which are those that are most important to the portrayal of our
financial condition and results and require management’s most difficult,
subjective and complex judgments, often as a result of the need to make
estimates about the effect of matters that are inherently
uncertain.
Revenue
. Our
revenue consists substantially of monthly recurring and usage-based subscription
fees. In accordance with GAAP, we defer the portions of monthly recurring and
usage-based subscription fees collected in advance and recognize them in the
period earned. Additionally, we defer and recognize subscriber activation fees
and related direct incremental costs over a subscriber’s estimated useful
life.
Investments.
We
account for our investments in debt securities in accordance with FASB ASC Topic
No. 320, Investments – Debt and Equity Securities (“ASC 320”). ASC 320 requires
that certain debt and equity securities be classified into one of three
categories; trading, available-for-sale or held-to-maturity securities. These j2
Global investments are typically comprised primarily of readily marketable
corporate debt securities, auction rate debt, preferred securities and
certificates of deposits. We determine the appropriate classification of our
investments at the time of acquisition and reevaluate such determination at each
balance sheet date. Held-to-maturity securities are those investments that we
have the ability and intent to hold until maturity. Held-to-maturity securities
are recorded at amortized cost. Available-for-sale securities are recorded at
fair value, with unrealized gains or losses recorded as a separate component of
accumulated other comprehensive income (loss) in stockholders’ equity until
realized. Trading securities are carried at fair value, with unrealized gains
and losses included in interest and other income on our consolidated statement
of operations. All securities are accounted for on a specific identification
basis. We assess whether an other-than-temporary impairment loss on an
investment has occurred due to declines in fair value or other market conditions
(see Note 4 of the Notes to Consolidated Financial Statements included elsewhere
in this Annual Report on Form 10-K).
j2 Global
complies with the provisions of FASB ASC Topic No. 820, Fair Value Measurements
and Disclosures (“ASC 820”), which defines fair value, provides a framework for
measuring fair value and expands the disclosures required for fair value
measurements. ASC 820 clarifies that fair value is an exit price, representing
the amount that would be received to sell an asset or paid to transfer a
liability in an orderly transaction between market participants. As such, fair
value is a market-based measurement that is determined based on assumptions that
market participants would use in pricing an asset or a liability. As a basis for
considering such assumptions, ASC 820 establishes a three-tier value hierarchy,
which prioritizes the inputs used in the valuation methodologies in measuring
fair value:
- 24
-
|
§
|
Level
1 – Observable inputs that reflect quoted prices (unadjusted) for
identical assets or liabilities in active
markets.
|
|
§
|
Level
2 – Include other inputs that are directly or indirectly observable in the
marketplace.
|
|
§
|
Level
3 – Unobservable inputs which are supported by little or no market
activity.
|
The fair
value hierarchy also requires an entity to maximize the use of observable inputs
and minimize the use of unobservable inputs when measuring fair
value.
We
measure our cash equivalents and investments at fair value. Our cash equivalents
and short-term investments and other debt securities are primarily classified
within Level 1. Investments in auction rate securities are classified
within Level 3. The valuation technique used under Level 3 consists of a
discounted cash flow analysis which included numerous assumptions, some of which
include prevailing implied credit risk premiums, incremental credit spreads,
illiquidity risk premium, among others and a market comparables model where the
security is valued based upon indicators from the secondary market of what
discounts buyers demand when purchasing similar auction rate securities. There
was no change in the technique during the period. Cash equivalents
and marketable securities are valued primarily using quoted market prices
utilizing market observable inputs. Our investments in auction rate securities
are classified within Level 3 because there are no active markets for the
auction rate securities and therefore we are unable to obtain independent
valuations from market sources. Some of the inputs to the cash flow model are
unobservable in the market. The total amount of assets measured using Level 3
valuation methodologies represented less than 1% of total assets as of December
31, 2009.
Share-Based Compensation
Expense.
j2 Global complies with the provisions of FASB ASC
Topic No. 718, Compensation – Stock Compensation (“ASC 718”). Accordingly, we
measure share-based compensation expense at the grant date, based on the fair
value of the award, and recognize the expense over the employee’s requisite
service period using the straight-line method. The measurement of share-based
compensation expense is based on several criteria including, but not limited to,
the valuation model used and associated input factors, such as expected term of
the award, stock price volatility, risk free interest rate and award
cancellation rate. These inputs are subjective and are determined using
management’s judgment. If differences arise between the assumptions used in
determining share-based compensation expense and the actual factors, which
become known over time, we may change the input factors used in determining
future share-based compensation expense. Any such changes could materially
impact our results of operations in the period in which the changes are made and
in periods thereafter. We elected to adopt the alternative transition
method for calculating the tax effects of share-based compensation and continue
to use the simplified method in developing the expected term used for our
valuation of share-based compensation in accordance with ASC 718.
Long-lived and Intangible
Assets
. We account for long-lived assets in accordance with
the provisions of FASB ASC Topic No. 360, Property, Plant, and Equipment (“ASC
360”), which addresses financial accounting and reporting for the impairment or
disposal of long-lived assets.
We assess
the impairment of identifiable intangibles and long-lived assets whenever events
or changes in circumstances indicate that the carrying value may not be
recoverable. Factors we consider important which could individually or in
combination trigger an impairment review include the following:
|
|
•
|
significant
underperformance relative to expected historical or projected future
operating results;
|
|
|
•
|
significant
changes in the manner of our use of the acquired assets or the strategy
for our overall business;
|
|
|
•
|
significant
negative industry or economic
trends;
|
|
|
•
|
significant
decline in our stock price for a sustained period;
and
|
|
|
•
|
our
market capitalization relative to net book
value.
|
If we
determined that the carrying value of intangibles and long-lived assets may not
be recoverable based upon the existence of one or more of the above indicators
of impairment, we would record an impairment equal to the excess of the carrying
amount of the asset over its estimated fair value.
We have
assessed whether events or changes in circumstances have occurred that
potentially indicate the carrying value of long-lived assets may not be
recoverable. During the fourth quarter of 2009, we determined based upon our
current and future business needs that the rights to certain external
administrative software will not provide any future
benefit. Accordingly, we recorded a disposal in the amount of $2.4
million to the consolidated statement of operations representing the capitalized
cost as of December 31, 2009. Total disposals of long-lived assets
for the year ended December 31, 2009, 2008 and 2007 was approximately $2.5
million, zero and $0.2 million, respectively.
- 25
-
Goodwill and Purchased Intangible
Assets
. We evaluate our goodwill and intangible assets
for impairment pursuant to FASB ASC Topic No. 350, Intangibles – Goodwill and
Other (“ASC 350”), which provides that goodwill and other intangible assets with
indefinite lives are not amortized but tested for impairment annually or more
frequently if circumstances indicate potential impairment. The impairment test
is comprised of two steps: (1) a reporting unit’s fair value is compared to its
carrying value; if the fair value is less than its carrying value, impairment is
indicated; and (2) if impairment is indicated in the first step, it is measured
by comparing the implied fair value of goodwill and intangible assets to their
carrying value at the reporting unit level. We completed the required impairment
review at the end of 2009, 2008 and 2007 and noted no impairment. Consequently,
no impairment charges were recorded.
Income
Taxes
. We account for income taxes in accordance with
FASB ASC Topic No. 740, Income Taxes (“ASC 740”), which requires that deferred
tax assets and liabilities be recognized using enacted tax rates for the effect
of temporary differences between the book and tax basis of recorded assets and
liabilities. ASC 740 also requires that deferred tax assets be reduced by a
valuation allowance if it is more likely than not that some or all of the net
deferred tax assets will not be realized. Our valuation allowance is reviewed
quarterly based upon the facts and circumstances known at the time. In assessing
this valuation allowance, we review historical and future expected operating
results and other factors to determine whether it is more likely than not that
deferred tax assets are realizable.
Income Tax
Contingencies
. We calculate current and deferred tax provisions
based on estimates and assumptions that could differ from the actual results
reflected in income tax returns filed during the following year. Adjustments
based on filed returns are recorded when identified in the subsequent
year.
Effective
January 1, 2007, the FASB issued new accounting guidance regarding uncertain
income tax positions. This guidance found under FASB ASC Topic 740, Income
Taxes, provides guidance on the minimum threshold that an uncertain income tax
position is required to meet before it can be recognized in the financial
statements and applies to all tax positions taken by a company. ASC 740 contains
a two-step approach to recognizing and measuring uncertain income tax positions.
The first step is to evaluate the income tax position for recognition by
determining if the weight of available evidence indicates that it is more likely
than not that the position will be sustained on audit, including resolution of
related appeals or litigation processes, if any. The second step is to measure
the tax benefit as the largest amount that is more than 50% likely of being
realized upon settlement. If it is not more likely than not that the benefit
will be sustained on its technical merits, no benefit will be recorded.
Uncertain income tax positions that relate only to timing of when an item is
included on a tax return are considered to have met the recognition threshold.
We recognize accrued interest and penalties related to uncertain income tax
positions in income tax expense on our consolidated statement of operations. At
January 1, 2007, we had $25.0 million in liabilities for uncertain income tax
positions, including $6.1 million recognized under FASB ASC Topic No. 450,
Contingencies (“ASC 450”) and carried forward from prior years and an additional
charge of $18.9 million to retained earnings. On a quarterly basis, we evaluate
uncertain income tax positions and establish or release reserves as appropriate
under GAAP.
As a
multinational corporation, we are subject to taxation in many jurisdictions, and
the calculation of our tax liabilities involves dealing with uncertainties in
the application of complex tax laws and regulations in various taxing
jurisdictions. Our estimate of the potential outcome of any uncertain tax issue
is subject to management’s assessment of relevant risks, facts and circumstances
existing at that time. Therefore, the actual liability for U.S. or foreign taxes
may be materially different from our estimates, which could result in the need
to record additional tax liabilities or potentially to reverse previously
recorded tax liabilities. In addition, we may be subject to examination of our
tax returns by the U.S. Internal Revenue Service and other domestic and foreign
tax authorities. We are currently under audit by the Internal Revenue Service
for tax years 2004 through 2008. In addition, we are under audit by the
California Franchise Tax Board for tax years 2005 through 2007 and by the
Illinois Department of Revenue for 2005 and 2006. We are also under audit by
various other states for non-income related taxes. It is
possible that these audits may conclude in the next 12 months and that the
unrecognized tax benefits we have recorded in relation to these tax years may
change compared to the liabilities recorded for the periods. However, it is not
possible to estimate the amount, if any, of such change. We adequately establish
reserves for these tax contingencies when we believe that certain tax positions
might be challenged despite our belief that our tax positions are fully
supportable. We adjust these reserves when changing events and circumstances
arise.
Non-Income Tax
Contingencies
. In accordance with the provisions of ASC 450,
we make judgments regarding the future outcome of contingent events and record
loss contingency amounts that are probable and reasonably estimable based upon
available information. The amounts recorded may differ from the actual income or
expense that occurs when the uncertainty is resolved. The estimates that we make
in accounting for contingencies and the gains and losses that we record upon the
ultimate resolution of these uncertainties could have a significant effect on
the liabilities and expenses in our financial statements. As of December 31,
2009, we had $0.8 million of non-income tax related contingent
liabilities.
- 26
-
Recent
Accounting Pronouncements
See Note
2
–
Basis of
Presentation and Summary of Significant Accounting Policies, Recent Accounting
Policies
of our
accompanying consolidated financial statements for a full description of recent
accounting pronouncements and our expectations of their impact on our
consolidated financial position and results of operations.
Results
of Operations
Years
Ended December 31, 2009, 2008 and 2007
The
following table sets forth, for the years ended December 31, 2009, 2008 and
2007, information derived from our statements of operations as a percentage of
revenues. This information should be read in conjunction with the accompanying
financial statements and the Notes to Consolidated Financial Statements included
elsewhere in this Annual Report on Form 10-K.
|
Year Ended December 31,
|
|||||
|
2009
|
2008
|
2007
|
|||
|
Revenues
|
100%
|
100%
|
100%
|
||
|
Cost
of revenues
|
18
|
19
|
20
|
||
|
Gross
profit
|
82
|
81
|
80
|
||
|
Operating
expenses:
|
|||||
|
Sales
and marketing
|
15
|
17
|
18
|
||
|
Research,
development and engineering
|
5
|
5
|
5
|
||
|
General
and administrative
|
18
|
18
|
18
|
||
|
Loss
on disposal of long-lived asset
|
1
|
—
|
—
|
||
|
Total
operating expenses
|
39
|
40
|
41
|
||
|
Operating
earnings
|
43
|
41
|
39
|
||
|
Other-than-temporary
impairment losses
|
4
|
—
|
—
|
||
|
Interest
and other income
|
1
|
2
|
4
|
||
|
Interest
and other expense
|
—
|
1
|
—
|
||
|
Earnings
before income taxes
|
40
|
42
|
43
|
||
|
Income
tax expense
|
13
|
12
|
12
|
||
|
Net
earnings
|
27
%
|
30
%
|
31
%
|
||
Revenues
Subscriber
Revenues
. Subscriber revenues consist of both a fixed monthly
recurring subscription component and a variable component that is driven by the
actual usage of our service offerings. Over the past three years the fixed
portion of our subscriber revenues has contributed an increasing percentage to
our subscriber revenues of 82%, 79% and 76% for 2009, 2008 and 2007,
respectively. Subscriber revenues were $241.9 million, $236.8 million and $212.3
million for the years ended December 31, 2009, 2008 and 2007, respectively. The
increase in subscriber revenues over this three-year period was due primarily to
an increase in the number of our paying subscribers. The increase in our base of
paying subscribers was primarily the result of new sign-ups derived from
subscribers coming directly to our Websites, free-to-paid subscriber upgrades,
small to mid-sized corporate and enterprise sales, direct large enterprise and
government sales, direct marketing spend for acquisition of paying subscribers,
international sales and business acquisitions, in each case net of
cancellations.
Other Revenues.
Other
revenues were $3.6 million, $4.7 million and $8.4 million for the years ended
December 31, 2009, 2008 and 2007, respectively. Other revenues consist
primarily of patent licensing revenues, patent sale-related revenues and
advertising revenues generated by delivering email messages to our customers on
behalf of advertisers. The decrease in other revenues from 2008 to 2009 resulted
primarily from lower licensing revenues due to the Company acquiring licensees
and reduced advertising revenues as customers have lowered spending in 2009. The
decrease in other revenues from 2007 to 2008 resulted primarily from a $2.0
million paid up patent license fee relating to past periods, earned during 2007,
as well as lower advertising revenues in 2008.
Cost
of Revenues
Cost of
revenues is primarily comprised of costs associated with data and voice
transmission, telephone numbers, network operations, customer service, online
processing fees and equipment depreciation. Cost of revenues was $44.7 million,
or 18% of revenues, $46.3 million, or 19% of revenues, and $44.0 million, or 20%
of revenues, for the years ended December 31, 2009, 2008 and 2007, respectively.
Cost of revenues as a percentage of revenues decreased from 2007 to 2008 to 2009
primarily due to increased efficiency of network operations and customer
service.
- 27
-
Operating
Expenses
Sales and
Marketing
. Our sales and marketing costs consist primarily of
Internet-based advertising, sales and marketing, personnel costs and other
business development-related expenses. Our Internet-based advertising
relationships consist primarily of fixed cost and performance-based
(cost-per-impression, cost-per-click and cost-per-acquisition) advertising
relationships with an array of online service providers. We have a disciplined
return-on-investment approach to our Internet-based advertising and marketing
spend, which causes sales and marketing costs as a percentage of total revenues
to vary from period to period based upon available opportunities. Advertising
cost for the year ended December 31, 2009, 2008 and 2007 was $28.3 million,
$30.3 million and $28.0 million, respectively. Total sales and marketing expense
was $37.0 million, or 15% of revenues, $41.3 million, or 17% of revenues, and
$38.8 million, or 18% of revenues, for the years ended December 31, 2009, 2008,
and 2007, respectively. The decrease in sales and marketing expenses as a
percentage of revenues from 2008 to 2009 was primarily due to more efficient and
cost effective marketing opportunities both in the United States and around the
world. While sales and marketing expense as a percentage of revenues
decreased from 2007 to 2008, the increase in absolute dollars over this period
was due primarily to increased international marketing and additional marketing
in new brands and in our voice services.
Research, Development and
Engineering
. Our research, development and engineering costs
consist primarily of personnel-related expense. Research, development and
engineering expense was $11.7 million, or 5% of revenues, $12.0 million, or 5%
of revenues, and $11.8 million, or 5% of revenues, for the years ended December
31, 2009, 2008 and 2007, respectively. The decrease in research,
development and engineering costs from 2008 to 2009 was primarily due to
increased efficiency and synergies from the integration of acquisitions. The
increase in research, development and engineering costs from 2007 to 2008 was
primarily due to an increase in personnel costs associated with new personnel
from businesses acquired in fiscal 2007 and 2008, and increased costs to
maintain our existing services, accommodate our service enhancements, develop
and implement additional service features and functionality and continue to
bolster our infrastructure security.
General and
Administrative
. Our general and administrative costs consist
primarily of personnel-related expenses, depreciation and amortization,
share-based compensation expense, bad debt expense and insurance costs. General
and administrative expense was $45.3 million, or 18% of revenues, $44.0 million,
or 18% of revenues, and $39.7 million, or 18% of revenues, for the years ended
December 31, 2009, 2008 and 2007, respectively. The increase in general and
administrative expense from 2008 to 2009 was primarily due to increased
amortization resulting from acquisitions and compensation costs offset by
decreased bad debt and professional fee expenses. The increase in
general and administrative expense from 2007 to 2008 was primarily attributable
to bad debt expense, legal expense, share-based compensation expense and related
payroll tax expense and depreciation and amortization.
Loss on disposal of long-lived
asset
. During the fourth quarter of 2009, we determined based
upon our current and future business needs that the rights to certain external
administrative software will not provide any future benefit. Accordingly, we
recorded a disposal in the amount of $2.4 million to the consolidated statement
of operations representing the capitalized cost as of December 31,
2009. Total disposals of long-lived assets for the year ended
December 31, 2009, 2008 and 2007 was approximately $2.5 million, zero
and $0.2 million, respectively.
Share-Based
Compensation
The
following table represents the share-based compensation expense included in cost
of revenues and operating expenses in the accompanying consolidated statements
of operations for the years ended December 31, 2009, 2008 and 2007 (in
thousands):
|
Year
Ended December 31,
|
||||||||||||
|
2009
|
2008
|
2007
|
||||||||||
|
Cost
of revenues
|
$ | 1,263 | $ | 901 | $ | 668 | ||||||
|
Operating
expenses:
|
||||||||||||
|
Sales
and marketing
|
1,818 | 1,268 | 1,187 | |||||||||
|
Research,
development and engineering
|
853 | 803 | 771 | |||||||||
|
General
and administrative
|
7,084 | 5,014 | 4,788 | |||||||||
| $ | 11,018 | $ | 7,986 | $ | 7,414 | |||||||
- 28
-
Non-Operating
Income and Expenses
Interest and Other
Income.
Our interest and other income is generated primarily
from interest earned on cash, cash equivalents and short and long-term
investments. Interest and other income amounted to $3.1 million, $4.8 million
and $9.3 million for the years ended December 31, 2009, 2008 and 2007,
respectively. The decrease in interest and other income from 2008 to 2009 was
primarily due to falling interest rates offset by the gain on sale of an auction
rate security in the amount of $1.8 million. The decrease in interest and other
income from 2007 to 2008 was due to falling interest rates and a decrease in
investment balances as a result of repurchases of j2 Global shares and business
acquisitions.
Interest and Other
Expense
. Our interest and other expense amounted to $0.4
million, $0.6 million and $0.2 million for the years ended December 31, 2009,
2008 and 2007, respectively. Interest and other expense was primarily related to
realized losses from foreign currency transactions from 2007 through
2009.
Other-than-temporary impairment
losses.
An other-than-temporary impairment occurred in
connection with our securities for the year ended December 31, 2009. During
the second quarter of 2009, we recorded an impairment of $9.2 million within the
consolidated statement of operations. During the fourth quarter of 2009, we
determined that one auction rate security was other-than-temporarily impaired
and recorded an impairment loss of $0.2 million to the consolidated statement of
operations.
Income Taxes
. Our effective
income tax rate is based on pre-tax income, statutory tax rates, tax regulations
(including those related to transfer pricing) and different tax rates in the
various jurisdictions in which we operate. The tax bases of our assets and
liabilities reflect our best estimate of the tax benefits and costs we expect to
realize. When necessary, we establish valuation allowances to reduce our
deferred tax assets to an amount that will more likely than not be
realized.
As of
December 31, 2009, we had utilizable federal and state (California) net
operating loss carryforwards (“NOLs”) of $5.3 million and $6.7 million,
respectively, after considering substantial restrictions on the utilization of
these NOLs due to “ownership changes”, as defined in the Internal Revenue Code
of 1986, as amended. We currently estimate that all of the above-mentioned
federal and state NOLs will be available for use before their expiration. These
NOLs expire through the year 2021 for the federal and 2014 for the state. In
addition, as of December 31, 2009 and 2008, we had available unrecognized state
research and development tax credits of $0.8 million, which last
indefinitely.
In 2008,
the Governor of California signed into law new tax legislation that suspended
the use of NOLs for tax years beginning on or after January 1, 2008 and 2009.
Despite the Company having taxable income in 2008 and 2009, the Company was not
permitted to utilize its California NOLs generated in prior years to offset this
taxable income for purposes of determining the applicable California income tax
due. Current law reinstates use of NOLs in tax years beginning on or
after January 1, 2010.
Income
tax expense amounted to $31.0 million, $29.6 million and $27.0 million for the
years ended December 31, 2009, 2008 and 2007, respectively. Our effective
tax rates for 2009, 2008 and 2007 were 32%, 29% and 28%, respectively. The
increase in our annual effective income tax rate from 2008 to 2009 was primarily
attributable to the capital loss for book purposes due to the impairment of
certain debt securities and related valuation allowance. The increase
in our annual effective income tax rate from 2007 to 2008 was primarily
attributable to an increase in the proportion of our taxable income being
sourced in the U.S. and subject to higher tax rates than in foreign
jurisdictions, and decreases in tax-exempt interest income.
Significant
judgment is required in determining our provision for income taxes and in
evaluating our tax positions on a worldwide basis. We believe our tax positions,
including intercompany transfer pricing policies, are consistent with the tax
laws in the jurisdictions in which we conduct our business. It is possible that
these positions may be challenged, which may have a significant impact on our
effective tax rate.
The
amount of income taxes we pay is subject to audit by federal, state and foreign
tax authorities. Our estimate of the potential outcome of any uncertain tax
issue is subject to management’s assessment of relevant risks, facts and
circumstances existing at that time. We believe that we have adequately provided
for reasonably foreseeable outcomes related to these matters in accordance with
FASB ASC Topic 740, Income Taxes, (“ASC 740”). We recorded an additional
liability for unrecognized tax benefits of $8.2 million in accordance with ASC
740 for the year ended December 31, 2009. We are currently under audit by the
Internal Revenue Service for tax years 2004 through 2008. In addition, we are
under audit by the California Franchise Tax Board for tax years 2005 through
2007 and by the Illinois Department of Revenue for 2005 and 2006. We are also
under audit by various other states for non-income related taxes. Our
future results may include material favorable or unfavorable adjustments to the
estimated tax liabilities in the period the assessments are made or resolved,
which may impact our effective tax rate.
- 29
-
Liquidity
and Capital Resources
Cash
and Cash Equivalents and Investments
At
December 31, 2009, we had total cash and investments of $243.7 million compared
to total cash and investments of $161.9 million at December 31, 2008. The
increase in cash and investments resulted primarily from cash provided by
operations offset by purchases of available-for-sale investments, certificates
of deposit and cash acquisitions of businesses. Total cash and investments
consists of cash and cash equivalents of $197.4 million, short-term investments
of $31.4 million and long-term investments of $14.9 million. Our investments are
comprised primarily of readily marketable corporate debt securities, auction
rate debt preferred securities and certificates of deposits. For financial
statement presentation, we classify our investments primarily as
held-to-maturity and available-for-sale, thus, they are reported as short-term
and long-term based upon their maturity dates. Short-term investments mature
within one year of the date of the financial statements and long-term
investments mature one year or more from the date of the financial statements.
We retain a substantial portion of our cash in foreign jurisdictions for future
reinvestment. If we were to repatriate funds held overseas, we would incur U.S.
income tax on the repatriated amount at an approximate blended federal and state
rate of 40%.
Our
long-term investments consists of corporate and auction rate debt and preferred
securities. The auction rate debt and preferred securities are
illiquid due to failed auctions or following failed auctions were converted into
other illiquid securities. During the fourth quarter of 2007, as a result of
such failed auctions, we reclassified certain short-term available-for-sale
investments of $11.4 million to long-term held-to-maturity investments and had
an unrealized loss of $0.3 million in accumulated other comprehensive
income/(loss) in our consolidated financial statements. During the second
quarter of 2009, we determined that as a result of continued deterioration of
the creditworthiness of the issuers of these securities that we intended to sell
these securities. Accordingly, we reclassified these securities to
available-for-sale. In addition, we determined that these securities were
other-than-temporarily impaired and recorded an impairment of $9.2 million to
the consolidated statement of operations. During the fourth quarter of 2009, we
determined that one auction rate security was other-than-temporarily impaired
and recorded an impairment loss of $0.2 million to the consolidated statement of
operations. During the fourth quarter of 2009, we sold an auction rate security
which was previously determined to be other than temporarily impaired and
recognized a gain on the sale in the amount of $1.8 million which was recorded
within interest and other income in the consolidated statement of operations.
Based on our ability to access our cash and other short-term investments, our
expected operating cash flows and our other sources of cash, we do not
anticipate the lack of liquidity on these investments to affect our ability to
operate our business as usual. There have been no significant changes in the
maturity dates and average interest rates for our investment portfolio and debt
obligations subsequent to December 31, 2009.
We
currently anticipate that our existing cash and cash equivalents and short-term
investment balances and cash generated from operations will be sufficient to
meet our anticipated needs for working capital and capital expenditures, and
investment requirements for at least the next 12 months.
Cash
Flows
Our
primary sources of liquidity are cash flows generated from operations, together
with cash and cash equivalents and short-term investments. Net cash provided by
operating activities was $101.8 million, $90.7 million and $94.2 million for the
years ended December 31, 2009, 2008 and 2007, respectively. Our operating cash
flows result primarily from cash received from our subscribers, offset by cash
payments we make to third parties for their services, employee compensation and
tax payments. Certain tax payments are prepaid during the year and included
within Prepaid expenses and other current assets on the consolidated balance
sheet. Our prepaid tax payments were $7.2 million and $3.1 million at December
31, 2009 and 2008, respectively. More than two-thirds of our subscribers pay us
via credit cards and therefore our receivables from subscribers generally settle
quickly. Our cash and cash equivalents and short-term investments were $228.8
million, $150.8 million and $208.5 million at December 31, 2009, 2008 and 2007,
respectively.
We
currently anticipate that our existing cash, cash equivalents, short-term
investments and cash generated from operations will be sufficient to meet our
anticipated needs for working capital, capital expenditures, investment
requirements and commitments.
Net cash
(used in) provided by investing activities was $(61.4) million, $14.9 million
and $(7.0) million for the years ended December 31, 2009, 2008 and 2007,
respectively. Net cash used in investing activities in 2009 was primarily
attributable to the purchase of available-for-sale investments, certificates of
deposit and cash acquisitions of businesses. Net cash provided by investing
activities in 2008 was primarily attributable to the proceeds of sales of
available-for-sale and held to maturity investments, offset by cash acquisitions
of businesses. Net cash used in investing activities in 2007 was primarily
attributable to purchases of investments, acquisitions of businesses, purchases
of property and equipment and purchases of intangible assets, offset by proceeds
from sales and maturities of investments.
Net cash
provided by (used in) financing activities was $5.4 million, $(104.9) million
and $(29.9) million for the years ended 2009, 2008 and 2007, respectively. Net
cash provided by financing activities in 2009 was primarily attributable to
proceeds from the exercise of stock options and excess tax benefit from
share-based compensation. Net cash used by financing activities in
2008 was
- 30
-
primarily
attributable to the repurchase of our common stock, partially offset by proceeds
from the exercise of stock options and excess tax benefit from share-based
compensation. For 2007, net cash used by financing activities was primarily
comprised of repurchases of our common stock offset by proceeds from the
exercise of stock options and common shares issued under our employee stock
purchase plan.
Stock
Repurchase Program
In
February 2008, j2 Global’s Board of Directors approved a common stock repurchase
program (the “Repurchase Program”) authorizing the repurchase of up to five
million shares of our common stock through the end of December 2010. On July 9,
2008, the Program was completed; five million shares at an aggregated cost of
$108.0 million (including commission fees of $0.1 million) were
repurchased.
Contractual
Obligations and Commitments
The
following table summarizes our contractual obligations and commitments as of
December 31, 2009:
|
Payments Due by Period
|
|||||||||||||||||||||
|
(In
thousands)
|
|||||||||||||||||||||
|
Contractual Obligations
|
1 Year
|
2-3
Years
|
4-5
Years
|
More
than 5
Years
|
Total
|
||||||||||||||||
|
Operating
leases (a)
|
$ | 1,596 | $ | 3,305 | $ | 3,416 | $ | 8,722 | $ | 17,039 | |||||||||||
|
Telecom
services and co-location facilities (b)
|
8,134 | 2,142 | 271 | — | 10,547 | ||||||||||||||||
|
Computer
software and related services (c)
|
195 | 407 | 8 | — | 610 | ||||||||||||||||
|
Holdback
payment (d)
|
1,169 | — | — | — | 1,169 | ||||||||||||||||
|
Other
(e)
|
421 | 1 | — | — | 422 | ||||||||||||||||
|
|
$ | 11,515 | $ | 5,855 | $ | 3,695 | $ | 8,722 | $ | 29,787 | |||||||||||
(b) These
amounts represent service commitments to various telecommunication
providers.
(c) These
amounts represent software license commitments.
(d) These
amounts represent the holdback amounts in connection with certain business
acquisitions (see Note 3 – Business Acquisitions for further
details.)
(e) These
amounts primarily represent certain marketing and consulting
arrangements.
As of
December 31, 2009, our noncurrent liability for uncertain tax positions was
$46.8 million. The future payments related to uncertain tax positions have not
been presented in the table above due to the uncertainty of the amounts and
timing of cash settlement with the taxing authorities.
Credit
Agreement
On
January 5, 2009, we entered into a Credit Agreement (the “Credit Agreement”)
with Union Bank, N.A. (“Lender”) in order to further enhance our liquidity in
the event of potential acquisitions or other corporate purposes. We have not
drawn down any amounts under the Credit Agreement. See Note 8 -
Commitments and Contingencies for further details regarding the Credit
Agreement.
- 31
-
Calculation
of Average Revenue per Paying Telephone Number
|
December 31,
|
||||||||||||
|
2009
|
2008
|
2007
|
||||||||||
|
(In
thousands except average monthly revenue per paying telephone
number)
|
||||||||||||
|
DID-based
revenues
|
$ | 233,443 | $ | 228,984 | $ | 205,290 | ||||||
|
Less
other revenues
|
(6,096 | ) | (8,797 | ) | (7,232 | ) | ||||||
|
Total
paying telephone number revenues
|
$ | 227,347 | $ | 220,187 | $ | 198,058 | ||||||
|
Average
paying telephone number monthly revenue (total divided by number of
months)
|
$ | 18,946 | $ | 18,349 | $ | 16,505 | ||||||
|
Number
of paying telephone numbers
|
||||||||||||
|
Beginning
of period
|
1,236 | 1,064 | 907 | |||||||||
|
End
of period
|
1,275 | 1,236 | 1,064 | |||||||||
|
Average
of period
|
1,256 | 1,150 | 985 | |||||||||
|
Average
monthly revenue per paying telephone number (1)
|
$ | 15.09 | $ | 15.96 | $ | 16.75 | ||||||
|
(1) Due
to rounding, individual numbers may not recalculate.
|
||||||||||||
The
following discussion of the market risks we face contains forward-looking
statements. Forward-looking statements are subject to risks and uncertainties.
Actual results could differ materially from those discussed in the
forward-looking statements. Readers are cautioned not to place undue reliance on
these forward-looking statements, which reflect management’s opinions only as of
the date hereof. j2 Global undertakes no obligation to revise or publicly
release the results of any revision to these forward-looking statements. Readers
should carefully review the risk factors described in this document as well as
in other documents we file from time to time with the SEC, including the
Quarterly Reports on Form 10-Q and any Current Reports on Form 8-K filed or to
be filed by us in 2010.
Interest
Rate Risk
Our
exposure to market risk for changes in interest rates relates primarily to our
investment portfolio. We maintain an investment portfolio typically comprised of
various holdings, types and maturities. The primary objectives of our investment
activities are to preserve our principal while at the same time maximizing
yields without significantly increasing risk. To achieve these objectives, we
maintain our portfolio of cash equivalents and investments in a mix of
instruments that meet high credit quality standards, as specified in our
investment policy. Our cash and cash equivalents are not subject to significant
interest rate risk due to the short maturities of these instruments. As of
December 31, 2009, the carrying value of our cash and cash equivalents
approximated fair value. Our return on these investments is subject to interest
rate fluctuations.
Our short
and long-term investments are typically comprised primarily of readily
marketable corporate debt securities, auction rate debt, preferred securities
and certificates of deposit. Investments in fixed rate interest earning
instruments carry a degree of interest rate risk. Fixed rate securities may have
their fair market value adversely impacted due to a rise in interest rates. Our
interest income is sensitive to changes in the general level of U.S. and foreign
countries’ interest rates. Due in part to these factors, our future investment
income may fall short of expectations due to changes in interest
rates.
As of
December 31, 2009 and 2008, we had investments in debt securities with effective
maturities greater than one year of approximately $14.9 million and $11.1
million, respectively. Such investments had a weighted-average yield
of 2.1% and 3.8% as of December 31, 2009 and 2008, respectively.
As of
December 31, 2009 and 2008 we had cash and short term cash equivalent
investments in time deposits and money market funds with maturities of 90 days
or less of $197.4 million and $150.8 million respectively. Based on our cash and
cash equivalents and short-term and long-term investment holdings as of December
31, 2009, an immediate 100 basis point decline in interest rates would decrease
our annual interest income by $2.0 million.
- 32
-
As of
January 5, 2009, we entered into the Credit Agreement with Lender to be used for
working capital and general corporate purposes (see Note 8 of the Notes to
Consolidated Financial Statements included elsewhere in this Annual Report on
Form 10-K). If we were to borrow from the Credit Agreement we would be subject
to the prevailing interest rates and could be exposed to interest rate
fluctuations.
We cannot
ensure that future interest rate movements will not have a material adverse
effect on our future business, prospects, financial condition, operating results
and cash flows. To date, we have not entered into interest rate hedging
transactions to control or minimize these risks.
Foreign
Currency Risk
We
conduct business in certain foreign markets, primarily in Canada and the
European Union. Our primary exposure to foreign currency risk relates to
investment in foreign subsidiaries that transact business in functional
currencies other than the U.S. Dollar, primarily the Canadian Dollar, Euro and
British Pound Sterling. However, the exposure is mitigated by our practice of
generally reinvesting profits from international operations in order to grow
that business.
As we
increase our operations in international markets we become increasingly exposed
to changes in currency exchange rates. The economic impact of currency exchange
rate movements is often linked to variability in real growth, inflation,
interest rates, governmental actions and other factors. These changes, if
material, could cause us to adjust our financing and operating
strategies.
As
currency exchange rates change, translation of the income statements of the
international businesses into U.S. Dollars affects year-over-year comparability
of operating results. Historically, we have not hedged translation risks because
cash flows from international operations were generally reinvested locally;
however, we may do so in the future. Our objective in managing foreign exchange
risk is to minimize the potential exposure to changes that exchange rates might
have on earnings, cash flows and financial position.
Foreign
exchange gains and losses were not material to our earnings in 2009, 2008 or
2007. For the years ended December 31, 2009, 2008 and 2007, translation
adjustments amounted to $1.7 million, $(6.8) million and $2.1 million,
respectively. As of December 31, 2009, cumulative translation adjustments
included in other comprehensive income amounted to $(1.8) million.
We
currently do not have derivative financial instruments for hedging, speculative
or trading purposes and therefore are not subject to such hedging risk. However,
we may in the future engage in hedging transactions to manage our exposure to
fluctuations in foreign currency exchange rates.
[REMAINDER
OF THIS PAGE INTENTIONALLY LEFT BLANK]
- 33
-
REPORT
OF INDEPENDENT REGISTERED PUBLIC ACCOUNTING FIRM
To the
Board of Directors and Stockholders
j2 Global
Communications, Inc.
Los Angeles, CA
We have
audited the accompanying consolidated balance sheets of j2 Global
Communications, Inc. and subsidiaries (collectively, the “Company”) as of
December 31, 2009 and 2008, and the related consolidated statements of
operations, stockholders' equity, and cash flows for each of the three years in
the period ended December 31, 2009. Our audits also included the financial
statement schedule of j2 Global Communications, Inc. listed in Item 15(a). These
financial statements and financial statement schedule are the responsibility of
the Company's management. Our responsibility is to express an opinion on these
financial statements based on our audits.
We
conducted our audits in accordance with the standards of the Public Company
Accounting Oversight Board (United States). Those standards require that we plan
and perform the audit to obtain reasonable assurance about whether the financial
statements are free of material misstatement. An audit includes examining, on a
test basis, evidence supporting the amounts and disclosures in the financial
statements. An audit also includes assessing the accounting principles used and
significant estimates made by management, as well as evaluating the overall
financial statement presentation. We believe that our audits provide a
reasonable basis for our opinion.
In our
opinion, the consolidated financial statements referred to above present fairly,
in all material respects, the financial position of j2 Global Communications,
Inc. and subsidiaries as of December 31, 2009 and 2008, and the results of their
operations and their cash flows for each of the three years in the period ended
December 31, 2009, in conformity with U.S. generally accepted accounting
principles. Also, in our opinion, the related financial statement schedule, when
considered in relation to the basic consolidated financial statements taken as a
whole, presents fairly in all material respects the information set forth
therein.
As
discussed in Note 2 to the consolidated financial statements, the Company has
adopted the provisions of Accounting Standards Codification (ASC) Topic No. 805,
“
Business
Combinations,
”
and ASC Topic No.
820,
“
Fair
Value Measurements and Disclosures,
”
on January 1,
2009, and ASC Topic No. 320,
“
Investments – Debt
and Equity Securities,
”
on June 30,
2009.
We have
also audited, in accordance with the standards of the Public Company Accounting
Oversight Board (United States), j2 Global Communications, Inc. and
subsidiaries’ internal control over financial reporting as of December 31, 2009,
based on criteria established in
Internal
Control — Integrated Framework
issued by the Committee of Sponsoring
Organizations of the Treadway Commission, and our report dated February 23,
2010, expressed an unqualified opinion on the effectiveness of j2 Global
Communications, Inc. and subsidiaries’ internal control over financial
reporting.
/s/
SINGER LEWAK LLP
Los
Angeles, California
February
23, 2010
- 34
-
j2
GLOBAL COMMUNICATIONS, INC. AND SUBSIDIARIES
December
31, 2009 and 2008
(In
thousands, except share amounts)
|
2009
|
2008
|
|||||||
|
ASSETS
|
||||||||
|
Cash
and cash equivalents
|
$ | 197,411 | $ | 150,780 | ||||
|
Short-term
investments
|
31,381 | 14 | ||||||
|
Accounts
receivable, net of allowances of $3,077 and $2,896,
respectively
|
11,928 | 14,083 | ||||||
|
Prepaid
expenses and other current assets
|
13,076 | 6,683 | ||||||
|
Deferred
income taxes
|
2,657 | 2,958 | ||||||
|
Total
current assets
|
256,453 | 174,518 | ||||||
|
Long-term
investments
|
14,887 | 11,081 | ||||||
|
Property
and equipment, net
|
13,366 | 18,938 | ||||||
|
Goodwill
|
81,258 | 72,783 | ||||||
|
Other
purchased intangibles, net
|
39,091 | 36,791 | ||||||
|
Deferred
income taxes
|
8,717 | 7,787 | ||||||
|
Other
assets
|
229 | 142 | ||||||
|
Total
assets
|
$ | 414,001 | $ | 322,040 | ||||
|
LIABILITIES
AND STOCKHOLDERS’ EQUITY
|
||||||||
|
Accounts
payable and accrued expenses
|
$ | 15,941 | $ | 16,915 | ||||
|
Income
taxes payable
|
1,563 | 1,800 | ||||||
|
Deferred
revenue
|
11,411 | 13,680 | ||||||
|
Total
current liabilities
|
28,915 | 32,395 | ||||||
|
Accrued
income tax liability
|
46,820 | 38,643 | ||||||
|
Other
long-term liabilities
|
2,094 | 1,022 | ||||||
|
Total
liabilities
|
77,829 | 72,060 | ||||||
|
Commitments
and contingencies
|
— | — | ||||||
|
Stockholders’
Equity:
|
||||||||
|
Preferred
stock, $0.01 par value. Authorized 1,000,000 and none
issued
|
— | — | ||||||
|
Common
stock, $0.01 par value. Authorized 95,000,000 at December 31, 2009 and
2008; total issued 52,907,691 and 52,305,293 shares at December
31, 2009 and 2008, respectively, and total outstanding 44,227,123 and
43,624,725 shares at December 31, 2009 and 2008,
respectively
|
529 | 523 | ||||||
|
Additional
paid-in capital
|
147,619 | 131,185 | ||||||
|
Treasury
stock, at cost (8,680,568 shares at December 31, 2009 and 2008,
respectively)
|
(112,671 | ) | (112,671 | ) | ||||
|
Retained
earnings
|
301,670 | 234,843 | ||||||
|
Accumulated
other comprehensive loss
|
(975 | ) | (3,900 | ) | ||||
|
Total
stockholders’ equity
|
336,172 | 249,980 | ||||||
|
Total
liabilities and stockholders’ equity
|
$ | 414,001 | $ | 322,040 | ||||
- 35
-
j2 GLOBAL COMMUNICATIONS, INC. AND
SUBSIDIARIES
Years
Ended December 31, 2009, 2008 and 2007
(In
thousands, except share and per share data)
|
2009
|
2008
|
2007
|
||||||||||
|
Revenues:
|
||||||||||||
|
Subscriber
|
$ | 241,922 | $ | 236,841 | $ | 212,329 | ||||||
|
Other
|
3,649 | 4,672 | 8,368 | |||||||||
| 245,571 | 241,513 | 220,697 | ||||||||||
|
Cost
of revenues (including share-based compensation of $1,263, $901 and $668
in
2009, 2008 and 2007, respectively)
|
44,730 | 46,250 | 43,987 | |||||||||
|
|
||||||||||||
|
Gross
profit
|
200,841 | 195,263 | 176,710 | |||||||||
|
Operating
expenses:
|
||||||||||||
|
Sales
and marketing (including share-based compensation of $1,818, $1,268 and
$1,187 in 2009, 2008 and 2007, respectively)
|
37,006 | 41,270 | 38,768 | |||||||||
|
Research,
development and engineering (including share-based compensation of $853,
$803, and $771 in 2009, 2008 and 2007, respectively)
|
11,657 | 12,031 | 11,833 | |||||||||
|
General
and administrative (including share-based compensation of $7,084, $5,014
and $4,788 in 2009, 2008 and 2007, respectively)
|
45,275 | 44,028 | 39,683 | |||||||||
|
Loss
on disposal of long-lived asset
|
2,442 | — | — | |||||||||
|
Total
operating expenses
|
96,380 | 97,329 | 90,284 | |||||||||
|
Operating
earnings
|
104,461 | 97,934 | 86,426 | |||||||||
|
Other
income (expenses):
|
||||||||||||
|
Other-than-temporary
impairment losses
|
(9,343 | ) | — | — | ||||||||
|
Interest
and other income
|
3,100 | 4,778 | 9,272 | |||||||||
|
Interest
and other expense
|
(439 | ) | (559 | ) | (237 | ) | ||||||
|
Total
other income (expenses)
|
(6,682 | ) | 4,219 | 9,035 | ||||||||
|
Earnings
before income taxes
|
97,779 | 102,153 | 95,461 | |||||||||
|
Income
tax expense
|
30,952 | 29,591 | 27,000 | |||||||||
|
Net
earnings
|
$ | 66,827 | $ | 72,562 | $ | 68,461 | ||||||
|
Net
earnings per common share:
|
||||||||||||
|
Basic
|
$ | 1.52 | $ | 1.63 | $ | 1.40 | ||||||
|
Diluted
|
$ | 1.48 | $ | 1.58 | $ | 1.35 | ||||||
|
Weighted
average shares outstanding:
|
||||||||||||
|
Basic
|
43,936,194 | 44,609,174 | 48,953,483 | |||||||||
|
Diluted
|
45,138,001 | 45,937,506 | 50,762,007 | |||||||||
- 36
-
j2 GLOBAL COMMUNICATIONS, INC. AND
SUBSIDIARIES
CONSOLIDATED
STATEMENTS OF STOCKHOLDERS’ EQUITY
Years
Ended December 31, 2009, 2008 and 2007
(In
thousands, except share amounts)
|
Accumulated
|
||||||||||||||||||||||||||||||||
|
other
|
||||||||||||||||||||||||||||||||
|
Common stock
|
Additional
|
Treasury stock
|
Retained |
comprehensive
|
Stockholders’
|
|||||||||||||||||||||||||||
|
Shares
|
Amount
|
paid-in capital
|
Shares
|
Amount
|
earnings
|
income/(loss)
|
equity
|
|||||||||||||||||||||||||
|
Balance,
December 31, 2006
|
53,449,368 | $ | 535 | $ | 144,935 | (4,131,224 | ) | $ | (4,647 | ) | $ | 112,735 | $ | 1,183 | $ | 254,741 | ||||||||||||||||
|
Comprehensive
income:
|
||||||||||||||||||||||||||||||||
|
Adoption
of FIN 48
|
— | — | — | — | — | (18,915 | ) | — | (18,915 | ) | ||||||||||||||||||||||
|
Net
earnings
|
— | — | — | — | — | 68,461 | — | 68,461 | ||||||||||||||||||||||||
|
Foreign
currency translation
|
— | — | — | — | — | — | 2,111 | 2,111 | ||||||||||||||||||||||||
|
Unrealized
loss on available-for-sale investments
|
— | — | — | — | — | — | (345 | ) | (345 | ) | ||||||||||||||||||||||
|
Comprehensive
income
|
— | — | — | — | — | 49,546 | 1,766 | 51,312 | ||||||||||||||||||||||||
|
Exercise
of stock options
|
776,273 | 7 | 7,693 | — | — | — | — | 7,700 | ||||||||||||||||||||||||
|
Issuance
of common stock under employee stock purchase plan
|
9,282 | — | 266 | — | — | — | — | 266 | ||||||||||||||||||||||||
|
Tax
benefit of stock option exercises and restricted stock
|
— | — | 3,608 | — | — | — | — | 3,608 | ||||||||||||||||||||||||
|
Repurchase
of common stock
|
— | — | (42,349 | ) | (1,529,100 | ) | (15 | ) | — | — | (42,364 | ) | ||||||||||||||||||||
|
Repurchase
of restricted stock
|
(9,784 | ) | — | (63 | ) | — | — | — | — | (63 | ) | |||||||||||||||||||||
|
Issuance
of restricted stock, net
|
100,794 | 1 | (1 | ) | — | — | — | — | — | |||||||||||||||||||||||
|
Share-based
compensation
|
— | — | 7,414 | — | — | — | — | 7,414 | ||||||||||||||||||||||||
|
Balance,
December 31, 2007
|
54,325,933 | 543 | 121,503 | (5,660,324 | ) | (4,662 | ) | 162,281 | 2,949 | 282,614 | ||||||||||||||||||||||
|
Comprehensive
income:
|
||||||||||||||||||||||||||||||||
|
Net
earnings
|
— | — | — | — | — | 72,562 | — | 72,562 | ||||||||||||||||||||||||
|
Foreign
currency translation
|
— | — | — | — | — | — | (6,751 | ) | (6,751 | ) | ||||||||||||||||||||||
|
Unrealized
loss on available-for-sale investments
|
— | — | — | — | — | — | (98 | ) | (98 | ) | ||||||||||||||||||||||
|
Comprehensive
income
|
— | — | — | — | — | 72,562 | (6,849 | ) | 65,713 | |||||||||||||||||||||||
|
Exercise
of stock options
|
226,760 | 2 | 1,827 | — | — | — | — | 1,829 | ||||||||||||||||||||||||
|
Issuance
of common stock under employee stock purchase plan
|
9,632 | — | 182 | — | — | — | — | 182 | ||||||||||||||||||||||||
|
Tax
benefit of stock option exercises and restricted stock
|
(313,288 | ) | (3 | ) | 150 | — | — | — | — | 147 | ||||||||||||||||||||||
|
Repurchase
of common stock
|
— | — | — | (5,000,000 | ) | (108,009 | ) | — | — | (108,009 | ) | |||||||||||||||||||||
|
Repurchase
of restricted stock
|
(19,024 | ) | — | (462 | ) | — | — | — | — | (462 | ) | |||||||||||||||||||||
|
Retirement
of treasury stock
|
(2,000,000 | ) | (20 | ) | — | 1,979,756 | — | — | — | (20 | ) | |||||||||||||||||||||
|
Issuance
of restricted stock, net
|
75,280 | 1 | (1 | ) | — | — | — | — | — | |||||||||||||||||||||||
|
Share-based
compensation
|
— | — | 7,986 | — | — | — | — | 7,986 | ||||||||||||||||||||||||
|
Balance,
December 31, 2008
|
52,305,293 | 523 | 131,185 | (8,680,568 | ) | (112,671 | ) | 234,843 | (3,900 | ) | 249,980 | |||||||||||||||||||||
|
Comprehensive
income:
|
||||||||||||||||||||||||||||||||
|
Net
earnings
|
— | — | — | — | — | 66,827 | — | 66,827 | ||||||||||||||||||||||||
|
Foreign
currency translation
|
— | — | — | — | — | — | 1,746 | 1,746 | ||||||||||||||||||||||||
|
Unrealized
gain on available-for-sale investments
|
— | — | — | — | — | — | 1,179 | 1,179 | ||||||||||||||||||||||||
|
Comprehensive
income
|
— | — | — | — | — | 301,670 | 2,925 | 69,752 | ||||||||||||||||||||||||
|
Exercise
of stock options
|
523,290 | 5 | 2,703 | — | — | — | 2,708 | |||||||||||||||||||||||||
|
Issuance
of shares under Employee stock purchase plan
|
5,808 | — | 120 | — | — | — | — | 120 | ||||||||||||||||||||||||
|
Vested
restricted stock
|
95,266 | 1 | (1 | ) | — | — | — | — | — | |||||||||||||||||||||||
|
Repurchase
of restricted stock
|
(21,966 | ) | — | (469 | ) | — | — | — | — | (469 | ) | |||||||||||||||||||||
|
Share
based compensation
|
— | — | 11,018 | — | — | — | — | 11,018 | ||||||||||||||||||||||||
|
Excess
tax benefit on share based compensation
|
— | — | 3,063 | — | — | — | — | 3,063 | ||||||||||||||||||||||||
|
Balance,
December 31, 2009
|
52,907,691 | 529 | 147,619 | (8,680,568 | ) | (112,671 | ) | 301,670 | (975 | ) | 336,172 | |||||||||||||||||||||
- 37
-
j2 GLOBAL COMMUNICATIONS, INC. AND
SUBSIDIARIES
Years
Ended December 31, 2009, 2008 and 2007
(In
thousands)
|
2009
|
2008
|
2007
|
||||||||||
|
Cash
flows from operating activities:
|
||||||||||||
|
Net
earnings
|
$ | 66,827 | $ | 72,562 | $ | 68,461 | ||||||
|
Adjustments
to reconcile net earnings to net cash provided by operating
activities:
|
||||||||||||
|
Depreciation
and amortization
|
14,707 | 13,177 | 10,134 | |||||||||
|
Share-based
compensation
|
11,018 | 7,986 | 7,414 | |||||||||
|
Excess
tax benefit from share-based compensation
|
(3,063 | ) | (1,565 | ) | (4,731 | ) | ||||||
|
Provision
for doubtful accounts
|
2,378 | 2,815 | 780 | |||||||||
|
Deferred
income taxes
|
(629 | ) | (2,908 | ) | 212 | |||||||
|
Loss/(Gain)
on disposal of fixed assets
|
2,529 | (6 | ) | 229 | ||||||||
|
Loss
on trading securities
|
4 | 418 | — | |||||||||
|
Gain
on available-for-sale investment
|
(1,812 | ) | — | — | ||||||||
|
Other-than-temporary
impairment losses
|
9,343 | — | — | |||||||||
|
Changes
in assets and liabilities, net of effects of business
combinations:
|
||||||||||||
|
Decrease
(increase) in:
|
||||||||||||
|
Accounts
receivable
|
(6 | ) | (1,809 | ) | (3,886 | ) | ||||||
|
Prepaid
expenses and other current assets
|
(2,253 | ) | 1,403 | (133 | ) | |||||||
|
Other
assets
|
(35 | ) | 46 | (201 | ) | |||||||
|
Increase
(decrease) in:
|
||||||||||||
|
Accounts
payable and accrued expenses
|
(3,677 | ) | (994 | ) | (2,580 | ) | ||||||
|
Income
taxes payable
|
(1,161 | ) | (5,633 | ) | 9,672 | |||||||
|
Deferred
revenue
|
(537 | ) | (2,118 | ) | 2,991 | |||||||
|
Accrued
income tax liability
|
8,178 | 7,399 | 5,898 | |||||||||
|
Other
|
22 | (57 | ) | (53 | ) | |||||||
|
Net
cash provided by operating activities
|
101,833 | 90,716 | 94,207 | |||||||||
|
Cash
flows from investing activities:
|
||||||||||||
|
Purchases
of available-for-sale investments
|
(12,900 | ) | — | (311,003 | ) | |||||||
|
Sales
of available-for-sale investments
|
2,706 | 36,170 | 279,088 | |||||||||
|
Purchases
of held-to-maturity investments
|
— | — | (26,498 | ) | ||||||||
|
Redemptions/Sales
of held-to-maturity investments
|
— | 27,881 | 78,954 | |||||||||
|
Purchase
of certificates of deposit
|
(31,372 | ) | — | — | ||||||||
|
Purchases
of property and equipment
|
(3,251 | ) | (2,507 | ) | (10,315 | ) | ||||||
|
Proceeds
from the sale of property and equipment
|
— | 25 | — | |||||||||
|
Acquisition
of businesses, net of cash received
|
(12,500 | ) | (42,825 | ) | (11,165 | ) | ||||||
|
Purchases
of intangible assets
|
(5,472 | ) | (3,818 | ) | (6,038 | ) | ||||||
|
Proceeds
from sale of intangible assets
|
1,340 | — | — | |||||||||
|
Net
cash provided by (used in) investing activities
|
(61,449 | ) | 14,926 | (6,977 | ) | |||||||
|
Cash
flows from financing activities:
|
||||||||||||
|
Repurchases
of common stock and restricted stock
|
(470 | ) | (108,492 | ) | (42,427 | ) | ||||||
|
Issuance
of common stock under employee stock purchase plan
|
120 | 183 | 266 | |||||||||
|
Exercise
of stock options
|
2,708 | 1,829 | 7,700 | |||||||||
|
Excess
tax benefits on from share-based compensation
|
3,063 | 1,565 | 4,731 | |||||||||
|
Repayment
of other long-term liabilities
|
— | — | (153 | ) | ||||||||
|
Net
cash provided by (used in) financing activities
|
5,421 | (104,915 | ) | (29,883 | ) | |||||||
|
Effect
of exchange rate changes on cash and cash equivalents
|
826 | (4,167 | ) | 1,268 | ||||||||
|
Net
(decrease) increase in cash and cash equivalents
|
46,631 | (3,440 | ) | 58,615 | ||||||||
|
Cash
and cash equivalents at beginning of year
|
150,780 | 154,220 | 95,605 | |||||||||
|
Cash
and cash equivalents at end of year
|
$ | 197,411 | $ | 150,780 | $ | 154,220 | ||||||
- 38
-
j2
GLOBAL COMMUNICATIONS, INC. AND SUBSIDIARIES
NOTES
TO CONSOLIDATED FINANCIAL STATEMENTS
December
31, 2009, 2008 and 2007
1.
The Company
j2 Global
Communications, Inc. (“j2 Global”, “our”, “us” or “we”) is a Delaware
corporation founded in 1995. By leveraging the power of the Internet, we provide
outsourced, value-added messaging and communications services to individuals and
businesses throughout the world. We offer fax, voicemail, email and call
handling services and bundled suites of certain of these services. We market our
services principally under the brand names
eFax
®
,
eFax Corporate
®
,
Onebox
®
,
eVoice
®
and
Electric Mail
®
.
We
deliver many of our services through our global telephony/Internet Protocol
(“IP”) network, which spans more than 3,500 cities in 46 countries across six
continents. We have created this network, and continuously seek to expand it,
through negotiation with U.S. and foreign telecommunications and co-location
providers for telephone numbers (also referred to as Direct Inward Dial numbers
or “DIDs”), Internet bandwidth and co-location space for our equipment. We
maintain and seek to grow an inventory of telephone numbers to be assigned to
new customers. Most of these numbers are “local” (as opposed to toll-free),
which enables us to provide our paying subscribers telephone numbers with a
geographic identity. In addition to growing our business internally, we have
used acquisitions to grow our customer base, enhance our technology and acquire
skilled personnel.
2.
Basis of Presentation and Summary of Significant Accounting
Policies
(a) Principles
of Consolidation
The
accompanying consolidated financial statements include the accounts of j2 Global
and its direct and indirect wholly-owned subsidiaries. All intercompany accounts
and transactions have been eliminated in consolidation.
(b) Use
of Estimates
The
preparation of financial statements in accordance with accounting principles
generally accepted in the United States (“GAAP”) requires management to make
estimates and assumptions that affect the reported amounts of assets and
liabilities at the date of the financial statements, including judgments about
investment classifications, and the reported amounts of net revenue and expenses
during the reporting period. On an ongoing basis, management evaluates its
estimates based on historical experience and on various other factors that we
believe to be reasonable under the circumstances. Actual results could differ
from those estimates.
(c) Allowances
for Doubtful Accounts
We
reserve for receivables we may not be able to collect. These reserves are
typically driven by the volume of credit card declines and past due invoices and
are based on historical experience as well as an evaluation of current market
conditions. On an ongoing basis, management evaluates the adequacy of these
reserves.
(d) Revenue
Recognition
Our
subscriber revenues substantially consist of monthly recurring subscription and
usage-based fees, which are primarily paid in advance by credit card. In
accordance with GAAP, we defer the portions of monthly recurring subscription
and usage-based fees collected in advance and recognize them in the period
earned. Additionally, we defer and recognize subscriber activation fees and
related direct incremental costs over a subscriber’s estimated useful
life.
Our
advertising revenues (included in “other revenues”) primarily consist of
revenues derived by delivering email messages to our customers on behalf of
advertisers. Revenues are recognized in the period in which the advertising
services are performed, provided that no significant j2 Global obligations
remain and the collection of the resulting receivable is reasonably
assured.
Our
patent revenues (included in “other revenues”) consist of revenues generated
under license agreements that provide for the payment of contractually
determined fully paid-up or royalty-bearing license fees to us in exchange for
the grant of a non-exclusive, retroactive and future license to our patented
technology. Patent revenues also consist of the sale of
patents. Patent revenues are recognized when earned over the term of
the license agreement. With regard to fully-paid up license arrangements, we
generally recognize as revenue in the period the agreement is executed the
portion of the payment attributable to past use of the patented technology and
amortize the remaining portion of such payments on a straight line basis over
the life of the licensed patent(s). With regard to royalty-bearing license
arrangements, we recognize revenue of license fees earned during the applicable
period.
- 39
-
(e) Fair
Value Measurements
j2 Global
complies with the provisions of FASB ASC Topic No. 820, Fair Value Measurements
and Disclosures, (“ASC 820”) in measuring fair value and in disclosing fair
value measurements. ASC 820 provides a framework for measuring fair value and
expands the disclosures required for fair value measurements of financial assets
and liabilities and non-financial assets and liabilities.
As of
December 31, 2009 and 2008, the carrying value of cash and cash equivalents,
short-term investments, accounts receivable, interest receivable, accounts
payable, accrued expenses, interest payable and customer deposits approximates
fair value due to the short-term nature of such instruments. The carrying value
of other long-term liabilities approximates fair value as the related interest
rates approximate rates currently available to j2 Global.
(f) Cash
and Cash Equivalents
We
consider cash equivalents to be only those investments that are highly liquid,
readily convertible to cash and with maturities of 90 days or less at the
purchase date.
(g) Investments
We
account for our investments in debt securities in accordance with FASB ASC Topic
No. 320, Investments – Debt and Equity Securities, (“ASC 320”). These
investments are typically comprised of readily marketable corporate debt
securities and auction rate debt and preferred securities. We determine the
appropriate classification of our investments at the time of acquisition and
evaluate such determination at each balance sheet date. Held-to-maturity
securities are those investments which we have the ability and intent to hold
until maturity and are recorded at amortized cost. Available-for-sale securities
are those investments we do not intend to hold to maturity and can be sold.
Available-for-sale securities are carried at fair value. Trading securities are
carried at fair value, with unrealized gains and losses included in investment
income. All securities are accounted for on a specific identification
basis.
(h) Concentration
of Credit Risk
All of
our cash, cash equivalents and marketable securities are invested at major
financial institutions primarily within the United States, United Kingdom and
Ireland. These institutions are required to invest our cash in accordance with
our investment policy with the principal objectives being preservation of
capital, fulfillment of liquidity needs and above market returns commensurate
with preservation of capital. Our investment policy also requires that
investments in marketable securities be in only highly rated instruments, with
limitations on investing in securities of any single issuer. However, these
investments are not insured against the possibility of a complete loss of
earnings or principal and are inherently subject to the credit risk related to
the continued credit worthiness of the underlying issuer and general credit
market risks. At December 31, 2009 and December 31, 2008, our cash and cash
equivalents, were maintained in accounts that are insured up to the limit
determined by the appropriate governmental agency. The amount insured, however,
is immaterial in comparison to the total amount of our cash and cash equivalents
held by these institutions, which is not insured.
(i) Foreign
Currency
Some of
our foreign subsidiaries use the local currency of their respective countries as
their functional currency. Assets and liabilities are translated at exchange
rates prevailing at the balance sheet dates. Revenues, costs and expenses are
translated into U.S. Dollars at average exchange rates for the period. Gains and
losses resulting from translation are recorded as a component of accumulated
other comprehensive income/(loss). Realized gains and losses from foreign
currency transactions are recognized as interest and other
income/expense.
(j) Property
and Equipment
Property
and equipment are stated at cost. Equipment under capital leases is stated at
the present value of the minimum lease payments. Depreciation is calculated
using the straight-line method over the estimated useful lives of the assets.
The estimated useful lives of property and equipment range from one to 10 years.
Fixtures, which are comprised primarily of leasehold improvements and equipment
under capital leases, are amortized on a straight-line basis over their
estimated useful lives or for leasehold improvements, the related lease term, if
less. We have capitalized certain internal use software and Website development
costs which are included in property and equipment. The estimated useful life of
costs capitalized is evaluated for each specific project and ranges from one to
seven years
.
- 40
-
(k) Goodwill
and Intangible Assets
Goodwill
represents the excess of the purchase price over the fair value of the net
tangible and identifiable intangible assets acquired in a business combination.
Intangible assets resulting from the acquisitions of entities accounted for
using the purchase method of accounting are recorded at the estimated fair value
of the assets acquired. Identifiable intangible assets are comprised of
purchased customer relationships, trademarks and trade names, developed
technologies and other intangible assets. Intangible assets subject to
amortization are amortized using the straight-line method over estimated useful
lives ranging from two to 20 years. In accordance with FASB ASC Topic No. 350,
Intangibles – Goodwill and Other (“ASC 350”), goodwill and other intangible
assets with indefinite lives are not amortized but tested annually for
impairment or more frequently if we believe indicators of impairment exist. The
performance of the impairment test involves a two-step process. The first step
involves comparing the fair values of the applicable reporting units with their
aggregate carrying values, including goodwill. We generally determine the fair
value of our reporting units using the income approach methodology of valuation.
If the carrying value of a reporting unit exceeds the reporting unit’s fair
value, we perform the second step of the test to determine the amount of
impairment loss. The second step involves measuring the impairment by comparing
the implied fair values of the affected reporting unit’s goodwill and intangible
assets with the respective carrying values. We completed the required impairment
review at the end of 2009, 2008 and 2007 and concluded that there were no
impairments. Consequently, no impairment charges were recorded.
(l
)
Long-Lived
Assets
We
account for long-lived assets, which include property and equipment and
identifiable intangible assets with finite useful lives (subject to
amortization), in accordance with the provisions of FASB ASC Topic No. 360,
Property, Plant, and Equipment (“ASC 360”) which requires that long-lived assets
be reviewed for impairment whenever events or changes in circumstances indicate
that the carrying amount of an asset may not be recoverable. Recoverability is
measured by comparing the carrying amount of an asset to the expected future net
cash flows generated by the asset. If it is determined that the asset may not be
recoverable, and if the carrying amount of an asset exceeds its estimated fair
value, an impairment charge is recognized to the extent of the
difference.
We
assessed whether events or changes in circumstances have occurred that
potentially indicate the carrying amount of long-lived assets may not be
recoverable. During the fourth quarter of 2009, we determined based upon our
current and future business needs that the rights to certain external
administrative software will not provide any future
benefit. Accordingly, we recorded a disposal in the amount of $2.4
million to the consolidated statement of operations representing the capitalized
cost as of December 31, 2009. Total disposals of long-lived assets
for the year ended December 31, 2009, 2008 and 2007 was approximately $2.5
million, zero and $0.2 million, respectively.
(m) Income
Taxes
Our
income is subject to taxation in both the U.S. and numerous foreign
jurisdictions. Significant judgment is required in evaluating our tax positions
and determining our provision for income taxes. During the ordinary course of
business, there are many transactions and calculations for which the ultimate
tax determination is uncertain. We establish reserves for tax-related
uncertainties based on estimates of whether, and the extent to which, additional
taxes will be due. These reserves for tax contingencies are established when we
believe that certain positions might be challenged despite our belief that our
tax return positions are fully supportable. We adjust these reserves in light of
changing facts and circumstances, such as the outcome of a tax audit or lapse of
a statute of limitations. The provision for income taxes includes the impact of
reserve provisions and changes to reserves that are considered
appropriate.
We
account for income taxes in accordance with FASB ASC Topic No. 740, Income Taxes
(“ASC 740”), which requires that deferred tax assets and liabilities be
recognized using enacted tax rates for the effect of temporary differences
between the book and tax basis of recorded assets and liabilities. ASC 740 also
requires that deferred tax assets be reduced by a valuation allowance if it is
more likely than not that some or all of the net deferred tax assets will not be
realized. Our valuation allowance is reviewed quarterly based upon the facts and
circumstances known at the time. In assessing this valuation allowance, we
review historical and future expected operating results and other factors,
including our recent cumulative earnings experience and expectations of future
taxable income by taxing jurisdiction and the carryforward periods available to
us for tax reporting purposes, to determine whether it is more likely than not
that deferred tax assets are realizable.
ASC 740
provides guidance on the minimum threshold that an uncertain income tax benefit
is required to meet before it can be recognized in the financial statements and
applies to all income tax positions taken by a company. ASC 740 contains a
two-step approach to recognizing and measuring uncertain income tax positions.
The first step is to evaluate the tax position for recognition by determining if
the weight of available evidence indicates that it is more likely than not that
the position will be sustained on audit, including resolution of related appeals
or litigation processes, if any. The second step is to measure the tax benefit
as the largest amount that is more than 50% likely of being realized upon
settlement. If it is not more likely than not that the benefit will be sustained
on its technical merits, no benefit will be recorded. Uncertain income tax
positions that relate only to timing of when an item is included on a tax return
are considered to have met the recognition threshold. We recognized accrued
interest and penalties related to uncertain income tax positions in income tax
expense on our consolidated statement of operations.
- 41
-
(n) Share-Based
Compensation
We
account for share-based awards in accordance with the provisions of FASB ASC
Topic No. 718, Compensation – Stock Compensation (“ASC 718”). Accordingly, we
measure share-based compensation expense at the grant date, based on the fair
value of the award, and recognize the expense over the employee’s requisite
service period using the straight-line method. The measurement of share-based
compensation expense is based on several criteria including but not limited to
the valuation model used and associated input factors, such as expected term of
the award, stock price volatility, risk free interest rate and award
cancellation rate. These inputs are subjective and are determined using
management’s judgment. If differences arise between the assumptions used in
determining share-based compensation expense and the actual factors, which
become known over time, we may change the input factors used in determining
future share-based compensation expense. Any such changes could materially
impact our results of operations in the period in which the changes are made and
in periods thereafter. We elected to adopt the alternative transition
method for calculating the tax effects of share-based compensation and continue
to use the simplified method in developing the expected term used for our
valuation of share-based compensation in accordance with ASC 718.
We
account for option grants to non-employees in accordance with FASB ASC Topic No.
505, Equity, whereby the fair value of such options is determined using the
Black-Scholes option pricing model at the earlier of the date at which the
non-employee’s performance is complete or a performance commitment is
reached.
(o) Earnings
Per Common Share
Basic
earnings per common share is computed by dividing net earnings by the weighted
average number of common shares outstanding during the period. Diluted earnings
per common share is computed by adjusting outstanding shares assuming any
dilutive effects of options and restricted stock calculated using the treasury
stock method. Under the treasury stock method, an increase in the fair market
value of our common stock results in a greater dilutive effect from outstanding
options and restricted stock. Additionally, the exercise of employee stock
options and the vesting of restricted stock results in a greater dilutive effect
on net earnings per share. Incremental shares of 1,201,807, 1,328,332 and
1,808,524 in 2009, 2008 and 2007, respectively, were used in the calculation of
diluted earnings per common share.
(p) Research,
Development and Engineering
Research,
development and engineering costs are expensed as incurred. Costs for software
development incurred subsequent to establishing technological feasibility, in
the form of a working model, are capitalized and amortized over their estimated
useful lives. To date, software development costs incurred after technological
feasibility has been established have not been material.
(q) Segment
Reporting
FASB ASC
Topic No. 280, Segment Reporting (“ASC 280”), establishes standards for the way
that public business enterprises report information about operating segments in
annual consolidated financial statements and requires that those enterprises
report selected information about operating segments in interim financial
reports. ASC 280 also establishes standards for related disclosures about
products and services, geographic areas and major customers.
We
operate in one reportable segment: value-added messaging and communications
services, which provides for the delivery and handling of fax, voice and email
messages and communications via the telephone and/or Internet
networks.
(r) Comprehensive
Income
Comprehensive
income is calculated in accordance with FASB ASC Topic No. 220, Comprehensive
Income, which requires the disclosure of all components of comprehensive income,
including net income and changes in equity during a period from transactions and
other events and circumstances generated from non-owner sources. Our accumulated
other comprehensive income/(loss) at December 31, 2009 and 2008 consisted
primarily of foreign currency translation adjustments of $(1.8) million and
$(3.6) million, respectively and unrealized gain/(loss) on available-for-sale
investments of $0.9 million and ($0.3) million, respectively.
(s) Advertising
Costs
Advertising
costs are expensed as incurred. Advertising costs for the year ended December
31, 2009, 2008 and 2007 was $28.3 million, $30.3 million and $28.0 million,
respectively.
(t) Recent
Accounting Pronouncements
In
December 2007, the FASB issued new accounting guidance regarding business
combinations. This guidance, found under FASB ASC Topic 805, Business
Combinations, establishes principles and requirements for how the acquirer of a
business (i) recognizes and measures in its financial statements the
identifiable assets acquired, the liabilities assumed and any noncontrolling
- 42
-
interest
in the acquiree; (ii) recognizes and measures in its financial statements the
goodwill acquired in the business combination or a gain from a bargain purchase;
and (iii) determines what information to disclose to enable users of the
financial statements to evaluate the nature and financial effects of the
business combination. Accordingly, we applied such guidance for acquisitions
effected subsequent to January 1, 2009.
In
December 2007, the FASB issued new accounting guidance regarding noncontrolling
interest. This guidance, found under FASB ASC Topic 810, Consolidation, requires
that the ownership interests in subsidiaries held by parties other than the
parent be clearly identified, labeled and presented in the consolidated balance
sheets within equity, but separate from the parent’s equity. In addition, the
amount of consolidated net income attributable to the parent and to the
noncontrolling interest must be clearly identified and presented on the face of
the consolidated statement of operations. This guidance also requires that
changes in the parent’s ownership interest be accounted for as equity
transactions if a subsidiary is deconsolidated and that any retained
noncontrolling equity investment be measured at fair value. Furthermore, this
guidance requires that sufficient disclosures be provided that clearly identify
and distinguish between the interests of the parent and noncontrolling owners.
The provisions of this guidance are effective for fiscal years, and interim
periods within those fiscal years, beginning on or after December 15, 2008. The
impact of the adoption of this guidance was not significant to our consolidated
financial statements.
In March
2008, the FASB issued new accounting guidance regarding derivative instruments
and hedging activities. This guidance, found under FASB ASC Topic 815,
Derivatives and Hedging, requires enhanced disclosures about a company’s
derivative and hedging activities. These enhanced disclosures will discuss
(i) how and why a company uses derivative instruments; (ii) how
derivative instruments and related hedged items are accounted for; and
(iii) how derivative instruments and related hedged items affect a
company’s financial position, results of operations and cash flows. This
guidance is effective for fiscal years beginning on or after November 15,
2008, with earlier adoption allowed. The impact of the adoption of this guidance
was not significant to our consolidated financial statements.
In April
2008, the FASB issued new accounting guidance regarding intangible assets. This
guidance, found under FASB ASC Topic 350, Intangibles – Goodwill and Other,
amends the factors that should be considered in developing renewal or extension
assumptions used to determine the useful life of a recognized intangible asset.
This guidance is effective for financial statements issued for fiscal years, and
interim periods within those fiscal years, beginning after December 15, 2008.
The impact of the adoption of this guidance was not significant to our
consolidated financial statements.
- 43
-
In
September 2008, the FASB issued new accounting guidance regarding credit
derivatives and certain guarantees. This guidance, found under FASB ASC
Topic 815, Derivatives and Hedging, applies to credit derivatives within the
scope of the guidance, hybrid instruments that have embedded credit derivatives,
and guarantees within the scope of the guidance. This guidance is effective for
reporting periods (annual or interim) ending after November 15, 2008. The impact
of the adoption of this guidance was not significant to our consolidated
financial statements.
In
November 2008, the FASB ratified new accounting guidance regarding equity method
investments. This guidance, found under FASB ASC Topic 323, Investments – Equity
Method and Joint Ventures, clarifies the accounting for certain transactions and
impairment considerations involving equity method investments. This guidance is
effective for fiscal years beginning after December 15, 2008, with early
adoption prohibited. We do not currently have any investments that are accounted
for under the equity method. The impact of the adoption of this guidance was not
significant to our consolidated financial statements.
In
November 2008, the FASB ratified new accounting guidance regarding defensive
intangible assets. This guidance, found under FASB ASC Topic 350, Intangibles –
Goodwill and Other, clarifies the accounting for certain separately identifiable
intangible assets which an acquirer does not intend to actively use but intends
to hold to prevent its competitors from obtaining access to them. This guidance
requires an acquirer in a business combination to account for a defensive
intangible asset as a separate unit of accounting which should be amortized to
expense over the period the asset diminishes in value. This guidance is
effective for fiscal years beginning after December 15, 2008, with early
adoption prohibited. The impact of the adoption of this guidance was not
significant to our consolidated financial statements.
In April
2009, the FASB issued three related new accounting statements regarding
other-than-temporary impairments, a change in interim disclosures and additional
guidance related to the determination of fair value in connection with financial
instruments. This guidance found under FASB ASC Topic 320, Investments – Debt
and Equity Securities, FASB ASC Topic 825, Financial Instruments and FASB ASC
Topic 820, Fair Value Measurements and Disclosures, are effective for interim
and annual reporting periods ending after June 15, 2009. This guidance amends
the other-than-temporary impairment guidance in GAAP for debt securities to
modify the requirement for recognizing other-than-temporary impairments, changes
the existing impairment model and modifies the presentation and frequency of
related disclosures. This guidance requires disclosures about fair value of
financial instruments for interim reporting periods as well as in annual
financial statements. These accounting statements provide additional guidance
for estimating fair value in the current economic environment and reemphasizes
that the objective of a fair value measurement remains an exit price. If we were
to conclude that there has been a significant decrease in the volume and level
of activity of the asset or liability in relation to
normal
market
activities, quoted market values may not be representative of fair value and we
may conclude that a change in valuation technique or the use of multiple
valuation techniques may be appropriate. See Note 4 – Investments and Note 5 –
Fair Value Measurements.
In
April 2009, the FASB issued new accounting guidance regarding business
combinations. This guidance, found under FASB ASC Topic 805, Business
Combinations, amends the guidance relating to the initial recognition and
measurement, subsequent measurement and accounting and disclosures of assets and
liabilities arising from contingencies in a business combination. This guidance
is effective for fiscal years beginning after December 15, 2008. We adopted
this guidance as of the beginning of fiscal 2009. We will apply the requirements
of this guidance prospectively to any future acquisitions.
In May
2009, the FASB issued new accounting guidance regarding subsequent events. This
guidance found under FASB ASC Topic 855, Subsequent Events, establishes general
standards of accounting for and disclosure of events that occur after the
balance sheet date but before financial statements are issued or are available
to be issued. The provisions of this guidance are effective for interim and
annual reporting periods ending after June 15, 2009. The impact of the adoption
of this guidance was not significant to our consolidated financial
statements.
In June
2009, the FASB approved the
FASB Accounting Standards Codification
(“Codification”), which
launched on July 1, 2009, and will be effective for financial statements
for interim or annual reporting periods ending after September 15,
2009. The Codification is not expected to change GAAP, but will
combine all authoritative standards into a comprehensive, topically organized
online database. After the Codification launch on July 1, 2009, only
one level of authoritative GAAP exists other than guidance issued by the
SEC. All other accounting literature excluded from the Codification
will be considered non-authoritative. The impact of the adoption of
this guidance was not significant to our consolidated financial
statements.
In August
2009, the FASB issued Accounting Standards Update 2009-05, Fair Value
Measurements and Disclosures (Topic 820) Measuring Liabilities at Fair Value.
This guidance clarifies that in circumstances in which a quoted price in an
active market for an identical liability is not available, a reporting entity is
required to measure fair value of such liability using one or more of the of the
techniques prescribed by the update. This guidance is effective for the first
reporting period beginning after issuance, which is the period ending December
31, 2009. The impact of the adoption of this guidance was not
significant to our consolidated financial statements.
- 44
-
In
January 2010, the FASB issued Accounting Standards Update 2010-06, Fair Value
Measurements and Disclosures (Topic 820): Improving Disclosures about Fair Value
Measurements. This guidance amends the disclosure requirements
related to recurring and nonrecurring fair value measurements and requires new
disclosures on the transfers of assets and liabilities between Level 1 (quoted
prices in active market for identical assets or liabilities) and Level 2
(significant other observable inputs) of the fair value measurement hierarchy,
including the reasons and the timing of the transfers. Additionally, the
guidance requires a roll forward of activities on purchases, sales, issuance and
settlements of the assets and liabilities measured using significant
unobservable inputs (Level 3 fair value measurements). The guidance will become
effective for the reporting period beginning January 1, 2010, except for the
disclosure on the roll forward activities for Level 3 fair value measurements,
which will become effective for the reporting period beginning January 1, 2011.
Other than requiring additional disclosures, adoption of this new guidance will
not have a material impact on our financial statements.
Reclassifications
Certain
prior year reported amounts have been reclassified to conform with the 2009
presentation. We reclassified certain cash flows within operating activities in
the consolidated statements of cash flows.
3.
Business Acquisitions
During
2009, we completed two acquisitions, each of which were individually and
collectively immaterial to our financial position at the dates of acquisition:
(1) the digital faxing business and certain intellectual property of CallWave,
Inc., a provider of Internet unified communications solutions and (2) the email
business of Quexion, LLC.
These
acquisitions are designed to be accretive and to provide us additional customers
in the digital fax and email markets. The consolidated statement of operations
and balance sheet as of December 31, 2009 reflects the results of operations of
these acquired entities. Total consideration for these transactions was $12.8
million in cash, including acquisition costs, plus $0.1 million in assumed
liabilities consisting strictly of deferred revenue. The operations of these
acquired businesses were individually immaterial to our financial position as of
the dates of the asquisitions.
The
following table summarizes the allocation of the aggregate purchase price of
both 2009 acquisitions as follows (in thousands):
|
Asset
|
Valuation
|
|||
|
Customer
Relationships
|
$ | 2,524 | ||
|
Deferred
Revenue
|
(106 | ) | ||
|
Goodwill
|
8,046 | |||
|
Other
Intangible Assets
|
367 | |||
|
Other
Assets
|
95 | |||
|
Patents
and Patent Licenses
|
1,824 | |||
|
Total
|
$ | 12,750 | ||
Patents
and Patent License have weighted-average useful lives
between
twelve and seventeen years
from the date of acquisition and no
residual. Customer relationships have weighted-average useful lives
of
ten
years
from the date of acquisition and no residual. Other
intangible assets have weighted-average useful lives between
two and
three
years from the date of acquisition and no residual
value. Other assets have weighted-average useful lives
between
zero and two ye
ars and no residual value.
Goodwill
represents the excess of the purchase price over the fair value of the net
tangible and identifiable intangible assets acquired. We expect to deduct 100%
of goodwill for income tax purposes over the next 15 years. No purchased
research and development assets were acquired or written off in regard to these
transactions. Transaction costs from these acquisitions consist of
approximately $15,000 for third party valuation fees expensed in the year ended
December 31, 2009 to General and Administrative expense.
During
2008, we completed four acquisitions, each of which were individually immaterial
to our financial position at the dates of acquisition: (1) certain assets of
Mediaburst Limited (“Mediaburst”), a UK-based provider of messaging services,
(2) all outstanding shares of Phone People Holdings Corporation, a U.S.-based
provider of voice messaging services, (3) certain assets of Mailwise, LLP, a
U.S.-based provider of email services, and (4) assets of Mijanda, Inc., a
U.S.-based provider of fax and voice services. Total consideration
for these transactions was $45.6 million in cash, including acquisition costs,
plus $0.9 million in assumed liabilities. In connection with certain
of these 2008 acquisitions, we are obligated to make additional cash payments if
certain contractual obligations are met consisting primarily of a holdback
amount of $1.8 million and customer conversion payments, in an immaterial amount
in all circumstances, to be paid upon the successful conversion of customers to
our product platforms. The excess of the purchase price over the fair value of
identifiable net tangible assets acquired amounted to $44.2 million, of which
$8.7 million was allocated to identifiable intangible assets and $35.5 million
was allocated to goodwill.
- 45
-
During
2007, we completed two acquisitions, neither of which was material to our
financial position at the dates of acquisition. In July 2007, we acquired YAC
Limited (“YAC”), a provider of messaging services with customers predominantly
located in the United Kingdom. In connection with the acquisition, we paid cash
in exchange for all outstanding shares of capital stock. The purchase price,
including acquisition costs, was $8.5 million of which $1.6 million was a
contingent holdback on the date of acquisition. The purchase price included $0.1
million of property and equipment and $0.3 million of other assets acquired and
liabilities assumed at acquisition. The excess of the purchase price over the
fair value of identifiable net tangible assets acquired amounted to $7.9
million, of which $3.9 million was allocated to identifiable intangible assets
and $4.0 million was allocated to goodwill. In August 2007, we incurred
approximately $1.0 million of capital gain tax largely offset by a holdback and
purchase price adjustment from the seller.
In
December 2007, we purchased for cash substantially all of the operations of
RapidFAX, a division of EasyLink Services International Corporation, a Georgia
provider of digital fax, electronic data interchange and other services. The
purchase price, including acquisition costs, was $5.3 million, of which $0.8
million was a contingent holdback on the date of acquisition. Of the $5.3
million purchase price, $1.6 million of the purchase price was allocated to
identifiable intangible assets and $3.7 million to goodwill.
We
accounted for all of the above transactions using the “purchase method” and,
accordingly, the results of operations related to these acquisitions have been
included in the consolidated results of j2 Global since the date of each
respective acquisition. For 2009 acquisitions, the results of operations
for these entities during periods prior to our acquisition were not material to
our consolidated results of operations and, accordingly, pro forma results of
operations have not been presented.
4.
Investments
The
following table summarizes our debt securities designated as available-for-sale
classified by the contractual maturity date of the security (in
thousands):
|
December
31,
2009
|
December
31,
2008
|
|||||||
|
Due
within 1 year
|
$
|
—
|
$
|
—
|
||||
|
Due
within more than 1 year but less than 5 years
|
12,833
|
—
|
||||||
|
Due
within more than 5 years but less than 10 years
|
—
|
—
|
||||||
|
Due
10 years or after
|
2,054
|
—
|
||||||
|
Total
|
$
|
14,887
|
$
|
—
|
||||
The
following table summarizes our debt securities designated as held-to-maturity
classified by the contractual maturity date of the security (in
thousands):
|
December
31,
2009
|
December
31,
2008
|
|||||||
|
Due
within 1 year
|
$
|
—
|
$
|
—
|
||||
|
Due
within more than 1 year but less than 5 years
|
—
|
—
|
||||||
|
Due
within more than 5 years but less than 10 years
|
—
|
4,669
|
||||||
|
Due
10 years or after
|
—
|
6,412
|
||||||
|
Total
|
$
|
—
|
$
|
11,081
|
||||
- 46
-
The
following table summarizes our investments designated as trading,
available-for-sale and held-to-maturity (in thousands):
|
December
31,
2009
|
December
31,
2008
|
|||||||
|
Trading
|
$
|
9
|
$
|
14
|
||||
|
Available-for-sale
|
14,887
|
—
|
||||||
|
Held-to-maturity
|
—
|
11,081
|
||||||
|
Total
|
$
|
14,896
|
$
|
11,095
|
||||
The
following table summarizes the gross unrealized gains and losses and fair values
for investments as of December 31, 2009 and December 31, 2008 aggregated by
major security type (in thousands):
|
Gross
|
Gross
|
|||||||||||||||
|
Amortized
|
Unrealized
|
Unrealized
|
Fair
|
|||||||||||||
|
Cost
|
Gains
|
Losses
|
Value
|
|||||||||||||
|
December
31, 2009
|
||||||||||||||||
|
Auction
Rate and other Debt Securities
|
$
|
13,996
|
$
|
891
|
$
|
—
|
$
|
14,887
|
||||||||
|
December
31, 2008
|
||||||||||||||||
|
Auction
Rate and other Debt Securities
|
$
|
11,081
|
$
|
—
|
$
|
9,224
|
$
|
1,857
|
||||||||
At
December 31, 2008, corporate and auction rate debt and preferred securities were
recorded as held-to-maturity. The debt securities have stated maturities through
2037. The preferred securities have no stated maturity dates. The
auction rate securities have interest rates that reset periodically at
established intervals of 90 days or less. The corporate debt securities have a
fixed interest rate. Certain of these securities are illiquid due to
failed auctions or conversion following failed auctions into other illiquid
instruments. As of June 30, 2009, we determined that as a result of
continued deterioration in the creditworthiness of the issuers of these
securities, we intend to sell these securities. Accordingly, we
reclassified these securities to available-for-sale. There have been
no significant changes in the maturity dates and average interest rates for our
investment portfolio and debt obligations subsequent to June 30, 2009. At
December 31, 2009, our long-term available-for-sale securities are carried at
fair value, with the unrealized gains and losses reported as a component of
stockholders’ equity.
The table
below shows the fair value of investments in held-to-maturity and
available-for-sale that have been in an unrealized loss position for less than
12 months or longer as of December 31, 2008 (in thousands):
|
Less
than 12 months
|
12
months or longer
|
Total
|
||||||||||||||||||||||
|
Gross
|
Gross
|
Gross
|
||||||||||||||||||||||
|
Fair
|
unrealized
|
Fair
|
unrealized
|
Fair
|
unrealized
|
|||||||||||||||||||
|
Value
|
losses
|
Value
|
losses
|
Value
|
losses
|
|||||||||||||||||||
|
December
31, 2008
|
||||||||||||||||||||||||
|
Debt
securities held-to-maturity
|
||||||||||||||||||||||||
|
Auction
rate and other Debt securities
|
$
|
—
|
$
|
—
|
$
|
1,857
|
$
|
9,224
|
$
|
1,857
|
$
|
9,224
|
||||||||||||
|
Total
debt securities held-to-maturity
|
$
|
—
|
$
|
—
|
$
|
1,857
|
$
|
9,224
|
$
|
1,857
|
$
|
9,224
|
||||||||||||
There were no investments that have been in an unrealized loss
position for less than 12 months or longer as of December 31, 2009.
- 47
-
Recognition
and Measurement of Other-Than-Temporary Impairment
We
regularly review and evaluate each investment that has an unrealized loss. An
unrealized loss exists when the current fair value of an individual security is
less than its amortized cost basis. Unrealized losses that are determined to be
temporary in nature are recorded, net of tax, in accumulated other comprehensive
income for available-for-sale securities, while such losses related to
held-to-maturity securities are not recorded, as these investments are carried
at their amortized cost.
Regardless
of the classification of the securities as available-for-sale or
held-to-maturity, we have assessed each position for impairment.
Factors
considered in determining whether a loss is temporary include:
|
·
|
the
length of time and the extent to which fair value has been below
cost;
|
|
·
|
the
severity of the impairment;
|
|
·
|
the
cause of the impairment and the financial condition and near-term
prospects of the issuer;
|
|
·
|
activity
in the market of the issuer which may indicate adverse credit conditions;
and
|
|
·
|
our
ability and intent to hold the investment for a period of time sufficient
to allow for any anticipated
recovery.
|
Our
review for impairment generally entails:
|
·
|
identification
and evaluation of investments that have indications of possible
impairment;
|
|
·
|
analysis
of individual investments that have fair values less than amortized cost,
including consideration of the length of time the investment has been in
an unrealized loss position and the expected recovery
period;
|
|
·
|
discussion
of evidential matter, including an evaluation of factors or triggers that
could cause individual investments to qualify as having
other-than-temporary impairment and those that would not support
other-than-temporary impairment;
|
|
·
|
documentation
of the results of these analyses, as required under business policies;
And
|
|
·
|
information
provided by third party valuation
experts.
|
For these
securities, a critical component of the evaluation for other-than-temporary
impairments is the identification of credit impairment, where management does
not expect to receive cash flows sufficient to recover the entire amortized cost
basis of the security.
For these
securities, credit impairment is assessed using a combination of a discounted
cash flow model that estimates the cash flows on the underlying securities and a
market comparables method where the security is valued based upon indications
from the secondary market of what discounts buyers demand when purchasing
similar auction rate securities. The cash flow model incorporates actual cash
flows on the auction rate securities through the current period and then
projects the remaining cash flows using relevant interest rate curves over the
remaining term. These cash flows are discounted using a number of
assumptions, some of which include prevailing implied credit risk premiums,
incremental credit spreads and illiquidity risk premium, among
others.
Securities
that have been identified as other-than-temporarily impaired are written down to
their current fair value. For debt securities that are intended to be
sold, or that management believes it is more-likely-than-not will be required to
be sold prior to recovery; the full impairment is recognized immediately in
earnings.
- 48
-
For
available-for-sale and held-to-maturity securities that management has no intent
to sell and believes that it is more-likely-than not that it will not be
required to sell prior to recovery, only the credit loss component of the
impairment is recognized in earnings, while the rest of the fair value
impairment is recognized in other comprehensive income. The credit loss
component recognized in earnings is identified as the amount of principal cash
flows not expected to be received over the remaining term of the
security.
During
the second quarter of 2009, we reclassified certain investments from
held-to-maturity to available-for-sale as we intend to sell our corporate and
auction rate debt and preferred securities. We arrived at this
conclusion based on the significant erosion in the credit worthiness of the
issuers. Accordingly, we determined that these securities were
other-than-temporarily impaired resulting in an impairment loss recognized in
earnings of $9.2 million for the year ended December 31, 2009.
During
the fourth quarter of 2009, we determined that one auction rate security was
other-than-temporarily impaired and recorded an impairment loss of $0.2 million
for the year ended December 31, 2009. During the fourth quarter of
2009, we sold an auction rate security which was previously determined to be
other than temporarily impaired and recognized a gain on the sale in the amount
of $1.8 million which was recorded within interest and other income within the
consolidated statement of operations for the year ended December 31,
2009.
5.
Fair Value Measurements
j2 Global
complies with the provisions of FASB ASC Topic No. 820, Fair Value Measurements
and Disclosures (“ASC 820”), which defines fair value, provides a framework for
measuring fair value and expands the disclosures required for fair value
measurements of financial assets and liabilities and non-financial assets and
liabilities. ASC 820 clarifies that fair value is an exit price, representing
the amount that would be received to sell an asset or paid to transfer a
liability in an orderly transaction between market participants. As such, fair
value is a market-based measurement that is determined based on assumptions that
market participants would use in pricing an asset or a liability. As a basis for
considering such assumptions, ASC 820 establishes a three-tier value hierarchy,
which prioritizes the inputs used in the valuation methodologies in measuring
fair value:
|
§
|
Level
1 – Observable inputs that reflect quoted prices (unadjusted) for
identical assets or liabilities in active
markets.
|
|
§
|
Level
2 – Include other inputs that are directly or indirectly observable in the
marketplace.
|
|
§
|
Level
3 – Unobservable inputs which are supported by little or no market
activity.
|
The fair
value hierarchy also requires an entity to maximize the use of observable inputs
and minimize the use of unobservable inputs when measuring fair
value.
We
measure our cash equivalents and investments at fair value. Our cash
equivalents short-term investments and other debt securities are primarily
classified within Level 1. Investments in auction rate securities are
classified within Level 3. The valuation technique used under Level 3 consists
of a discounted cash flow analysis which included numerous assumptions, some of
which include prevailing implied credit risk premiums, incremental credit
spreads, illiquidity risk premium, among others and a market comparables model
where the security is valued based upon indicators from the secondary market of
what discounts buyers demand when purchasing similar auction rate securities.
There was no change in the technique during the period. Cash
equivalents and marketable securities are valued primarily using quoted market
prices utilizing market observable inputs. Our investments in auction rate
securities are classified within Level 3 because there are no active markets for
the auction rate securities and therefore we are unable to obtain independent
valuations from market sources. Some of the inputs to the cash flow
model are unobservable in the market. The total amount of assets measured using
Level 3 valuation methodologies represented less than 1% of total assets as
of December 31, 2009.
- 49
-
The
following tables present the fair values of our financial instruments that are
measured at fair value on a recurring basis (in thousands):
|
December
31, 2009
|
Level
1
|
Level
2
|
Level
3
|
Fair
Value
|
||||||||||||
|
Cash
equivalents, short-term investments and other debt
securities
|
$
|
241,898
|
$
|
—
|
$
|
—
|
$
|
241,898
|
||||||||
|
Auction
rate securities
|
—
|
—
|
1,781
|
1,781
|
||||||||||||
|
Total
|
$
|
241,898
|
$
|
—
|
$
|
1,781
|
$
|
243,679
|
||||||||
|
December
31, 2008
|
Level
1
|
Level
2
|
Level
3
|
Fair
Value
|
||||||||||||
|
Cash
equivalents, short-term investments and other debt
securities
|
$
|
150,974
|
$
|
—
|
$
|
—
|
$
|
150,974
|
||||||||
|
Total
|
$
|
150,974
|
$
|
—
|
$
|
—
|
$
|
150,974
|
||||||||
The
following table provides a summary of changes in fair value of our Level 3
financial assets as of December 31, 2009 (in thousands):
|
Level
3 Financial Assets
|
||||
|
Year
Ended
December
31, 2009
|
||||
|
Beginning
Balance
|
$
|
—
|
||
|
Total
gains (losses) - realized/unrealized
|
||||
|
Included
in earnings (other than temporary impairment)
|
(9,343)
|
|
||
|
Not
included in earnings
|
1,053
|
|||
|
Purchases,
issuances and settlements
|
—
|
|||
|
Sales
|
(1,117)
|
|||
|
Transfers
in and/or out of Level 3
|
11,188
|
|||
|
Balance,
December 31, 2009
|
$
|
1,781
|
||
|
Total
losses for the period included in earnings relating to assets
still
held at December 31, 2009
|
$
|
(5,419)
|
|
|
Losses
associated with other-than-temporary impairments are recorded as a component of
other income. Gains and losses not associated with
other-than-temporary impairments are recorded as a component of other
comprehensive income.
6.
Property and Equipment
Property
and equipment, stated at cost, at December 31, 2009 and 2008 consisted of the
following (in thousands):
|
2009
|
2008
|
|||||||
|
Computers
and related equipment
|
$ | 38,980 | $ | 51,465 | ||||
|
Furniture
and equipment
|
714 | 1,221 | ||||||
|
Capital
leases
|
— | 569 | ||||||
|
Leasehold
improvements
|
2,964 | 2,962 | ||||||
| 42,658 | 56,217 | |||||||
|
Less:
Accumulated depreciation and amortization
|
(29,292 | ) | (37,279 | ) | ||||
|
Total
property and equipment, net
|
$ | 13,366 | $ | 18,938 | ||||
- 50
-
Depreciation
and amortization expense was $6.7 million, $6.6 million and $6.2 million for the
years ended December 31, 2009, 2008 and 2007, respectively. Included in
accumulated amortization for each of the years ended December 31, 2008 is $0.6
million related to capital leases.
During
the fourth quarter of 2009, we determined based upon our current and future
business needs that the rights to certain external administrative software will
not provide any future benefit. Accordingly, we recorded a disposal
in the amount of $2.4 million to the consolidated statement of operations
representing the capitalized cost as of December 31, 2009. Total
disposals of long-lived assets for the year ended December 31, 2009, 2008
and 2007 was approximately $2.5 million, zero and $0.2 million,
respectively.
7.
Goodwill and Intangible Assets
Pursuant
to SFAS 142, we completed the annual impairment review of our goodwill and
indefinite-lived intangible assets for the years 2009, 2008 and 2007. We
concluded that the fair values of our goodwill and indefinite-life intangible
assets were in excess of their carrying values as of December 31, 2009, 2008 and
2007. Consequently, no impairment charges were recorded.
The
changes in carrying amount of goodwill and other intangible assets for the year
ended December 31, 2009 were as follows (in thousands):
|
Balance
as of
January 1,
2009
|
Additions
|
Amortization
|
Deductions
|
Foreign
Exchange
Translation
|
Balance
as of
December 31,
2009
|
|||||||||||||||||||
|
Goodwill
|
$ | 72,783 | $ | 7,952 | $ | — | $ | — | $ | 523 | $ | 81,258 | ||||||||||||
|
Intangible
assets with indefinite lives
|
4,081 | 2,994 | — | (6 | ) | — | 7,069 | |||||||||||||||||
|
Intangible
assets subject to amortization
|
32,710 | 8,586 | (8,034 | ) | (1,349 | ) | 109 | 32,022 | ||||||||||||||||
|
Total
|
$ | 109,574 | $ | 19,532 | $ | (8,034 | ) | $ | (1,355 | ) | $ | 632 | $ | 120,349 | ||||||||||
The
changes in carrying amounts of goodwill and other intangible assets for the year
ended December 31, 2008 were as follows (in thousands):
|
Balance
as of
January 1,
2008
|
Additions
|
Amortization
|
Deductions
|
Foreign
Exchange
Translation
|
Balance
as of
December 31,
2008
|
|||||||||||||||||||
|
Goodwill
|
$ | 39,452 | $ | 34,958 | $ | — | $ | — | $ | (1,627 | ) | $ | 72,783 | |||||||||||
|
Intangible
assets with indefinite lives
|
2,384 | 1,697 | — | — | — | 4,081 | ||||||||||||||||||
|
Intangible
assets subject to amortization
|
26,836 | 12,447 | (6,094 | ) | — | (479 | ) | 32,710 | ||||||||||||||||
|
Total
|
$ | 68,672 | $ | 49,102 | $ | (6,094 | ) | $ | - | $ | (2,106 | ) | $ | 109,574 | ||||||||||
As of
December 31, 2009, intangible assets subject to amortization relate primarily to
the following (in thousands):
|
Weighted-Average
Amortization
Period
|
Historical
Cost
|
Accumulated
Amortization
|
Net
|
||||||||||
|
Patents
|
8.9
years
|
$ | 27,675 | $ | 12,720 | $ | 14,955 | ||||||
|
Technology
|
4.8
years
|
3,007 | 1,550 | 1,457 | |||||||||
|
Customer
relationships
|
7.9
years
|
15,024 | 6,064 | 8,960 | |||||||||
|
Trade
name
|
14.2
years
|
9,079 | 2,429 | 6,650 | |||||||||
|
Total
|
$ | 54,785 | $ | 22,763 | $ | 32,022 | |||||||
As of
December 31, 2008, intangible assets subject to amortization relate primarily to
the following (in thousands):
|
Weighted-Average
Amortization
Period
|
Historical
Cost
|
Accumulated
Amortization
|
Net
|
||||||||||
|
Patents
|
8.5
years
|
24,282 | $ | 8,942 | $ | 15,340 | |||||||
|
Technology
|
5.0
years
|
2,986 | 974 | 2,012 | |||||||||
|
Customer
relationships
|
8.5
years
|
12,468 | 3,840 | 8,628 | |||||||||
|
Trade
name
|
16.0
years
|
8,276 | 1,546 | 6,730 | |||||||||
|
Total
|
$ | 48,012 | $ | 15,302 | $ | 32,710 | |||||||
- 51
-
Expected
amortization expense for intangible assets subject to amortization at December
31, 2009, are as follows (in thousands):
|
Fiscal
Year:
|
||||
|
2010
|
$ | 6,451 | ||
|
2011
|
4,355 | |||
|
2012
|
3,820 | |||
|
2013
|
3,353 | |||
|
2014
|
3,076 | |||
|
Thereafter
|
10,967 | |||
|
Total
expected amortization expense
|
$ | 32,022 | ||
In June 2009, j2 Global sold certain
non-core intellectual property to a third party for approximately $1.5 million
(net
of selling and earn-out costs
of approximately $0.5 million). Accordingly, the net proceeds in
excess of net book value of the patent assets sold were recorded as other
revenue in the amount of approximately $0.7 million within the consolidated
statement of operations for the year ended December 31, 2009. As part of
this transaction, we also obtained a fully paid up, perpetual license for
use of the related patents through their remaining life.
Amortization
expense was $8.0 million, $6.1 million and $3.9 million for the years ended
December 31, 2009, 2008 and 2007, respectively.
8.
Commitments and Contingencies
Litigation
We are
involved with various legal matters arising from the ordinary course of
business. Although the ultimate resolution of these various matters cannot be
determined at this time, we do not believe that such matters, individually or in
the aggregate, will have a material adverse effect on our future consolidated
results of operations, cash flows or financial condition. For additional
information on litigation matters, see Part I, Item 3.
Legal
Proceedings
.
Credit
Agreement
On
January 5, 2009, we entered into a Credit Agreement (the “Credit Agreement”)
with Union Bank, N.A. (“Lender”) in order to further enhance our liquidity in
the event of potential acquisitions or other corporate purposes. The Credit
Agreement provides for a $25.0 million revolving line of credit with a $2.5
million letter of credit sublimit. The facility is unsecured (except to the
limited extent described below) and has never been drawn upon. Revolving loans
may be borrowed, repaid and re-borrowed until January 5, 2011, on which date all
outstanding principal of, together with accrued interest on, any revolving loans
will be due. We may prepay the loans and terminate the commitments at any time,
with generally no premium or penalty.
Loans
will bear interest at the election of j2 Global at either:
• LIBOR
plus a margin equal to 1.50% for interest periods of 1, 2, 3 or 6 months (the
“Fixed Interest Rate”); or
• the
“Base Rate”, defined as the highest of (i) the reference rate in effect as
determined per the agreement, (ii) the federal funds rate in effect as
determined per the agreement plus a margin equal to 0.5% and (iii) the 1 month
LIBOR rate.
We are
also obligated to pay closing fees, letter of credit fees and commitment fees
customary for a credit facility of this size and type.
Interest
on the loans is payable quarterly or, if accruing at a Fixed Interest Rate, on
the last day of the applicable LIBOR interest
rate
period, or for LIBOR interest rate periods longer than 3 months, at the end of
each 3-month period in the applicable LIBOR interest rate period.
Pursuant
to the Credit Agreement, Phone People Holdings Corporation, a wholly-owned U.S.
subsidiary of j2 Global, entered into a Continuing Guaranty (the “Guaranty”) in
favor of Lender, pursuant to which it guaranteed all of the obligations of j2
Global under the Credit Agreement and is payable upon demand of the Lender.
Future significant subsidiaries based in the U.S. will also be required to
guaranty j2 Global’s obligations under the Credit Agreement. “Significant
subsidiary” is defined as subsidiaries that had net income for the fiscal
quarter then most recently ended in excess of ten percent (10%) of EBITDA (as
defined in the Credit Agreement) for such fiscal quarter or had assets in excess
of ten percent (10%) of the total assets of the j2 Global and its subsidiaries
on a consolidated basis as at the end of the fiscal quarter then most recently
ended. Also pursuant to the Credit Agreement, we entered into a Security Pledge
Agreement whereby j2 Global granted to Lender a security interest in 65% of the
issued stock of j2 Global Holdings Limited, a wholly owned Irish subsidiary of
j2 Global. We will also be required to grant a security interest to Lender in
65% of the issued stock of any future non-U.S. based significant
subsidiary.
- 52
-
The
Credit Agreement contains customary affirmative and negative covenants,
including covenants that limit or restrict our ability to, among other things,
grant liens, dispose of assets, incur indebtedness, guaranty obligations, merge
or consolidate, acquire another company, make loans or investments or repurchase
stock, in each case subject to exceptions customary for a credit facility of
this size and type.
The
Credit Agreement also contains financial covenants that establish minimum
EBITDA, net worth and liquid asset levels and limit the amount of operating
lease obligations that may be assumed.
The
Credit Agreement includes customary events of default that include, among other
things, payment defaults, inaccuracy of representations and warranties, covenant
defaults, material bankruptcy and insolvency events, judgments and failure to
comply with judgments, tax defaults, change of control and cross defaults, in
each case subject to exceptions and/or thresholds customary for a credit
facility of this size and type. The occurrence of an event of default could
result in the acceleration of our repayment obligations under the Credit
Agreement.
Leases
We lease
certain facilities and equipment under non-cancelable operating leases, which
expire at various dates through 2021. Future minimum lease payments at December
31, 2009, under non-cancelable operating leases (with initial or remaining lease
terms in excess of one year) are as follows (in thousands):
|
Operating
Leases
|
||||
|
Fiscal
Year:
|
||||
|
2010
|
$ | 1,596 | ||
|
2011
|
1,579 | |||
|
2012
|
1,726 | |||
|
2013
|
1,697 | |||
|
2014
|
1,719 | |||
|
Thereafter
|
8,722 | |||
|
Total
minimum lease payments
|
$ | 17,039 | ||
Rental
expense for the years ended December 31, 2009, 2008 and 2007 was $1.8 million,
$2.1 million and $1.6 million, respectively.
9.
Income Taxes
The
provision for income tax consisted of the following (in thousands):
|
Years Ended December 31,
|
||||||||||||
|
2009
|
2008
|
2007
|
||||||||||
|
Current:
|
||||||||||||
|
Federal
|
$ | 29,614 | $ | 27,716 | $ | 21,764 | ||||||
|
State
|
1,618 | 3,389 | 3,557 | |||||||||
|
Foreign
|
348 | 1,394 | 1,467 | |||||||||
|
Total
current
|
31,580 | 32,499 | 26,788 | |||||||||
|
Deferred:
|
||||||||||||
|
Federal
|
(766 | ) | (2,255 | ) | 136 | |||||||
|
State
|
84 | (751 | ) | 141 | ||||||||
|
Foreign
|
53 | 98 | (65 | ) | ||||||||
|
Total deferred
|
(629 | ) | (2,908 | ) | 212 | |||||||
|
Total
provision
|
$ | 30,951 | $ | 29,591 | $ | 27,000 | ||||||
- 53
-
A
reconciliation of the statutory federal income tax rate with j2 Global’s
effective income tax rate is as follows:
|
Years Ended December 31,
|
|||||||||||||||
|
2009
|
2008
|
2007
|
|||||||||||||
|
Statutory
tax rate
|
35.0 | % | 35.0 | % | 35.0 | % | |||||||||
|
State
income taxes, net
|
1.1 | 1.7 | 2.5 | ||||||||||||
|
Foreign
rate differential
|
(15.7 | ) | (15.0 | ) | (15.1 | ) | |||||||||
|
Tax
contingency reserve
|
8.4 | 7.2 | 6.3 | ||||||||||||
|
Valuation
Allowance
|
2.0 | — | — | ||||||||||||
|
Other
|
0.9 | 0.1 | (0.4 | ) | |||||||||||
|
Effective
tax rates
|
31.7 | % | 29.0 | % | 28.3 | % | |||||||||
Our
effective rate for each year is normally lower than the 35% U.S. federal
statutory income tax rate primarily due to earnings of our subsidiaries outside
of the U.S. in jurisdictions where the effective tax rate is lower than in the
U.S.
Deferred
tax assets and liabilities result from differences between the financial
statement carrying amounts and the tax bases of existing assets and liabilities.
Temporary differences and carryforwards which give rise to deferred tax assets
and liabilities are as follows (in thousands):
|
Years Ended December 31,
|
||||||||
|
2009
|
2008
|
|||||||
|
Deferred
tax assets:
|
||||||||
|
Net
operating loss carryforwards
|
$ | 2,497 | $ | 2,705 | ||||
|
Tax
credit carryforwards
|
779 | 808 | ||||||
|
Accrued
expenses
|
432 | 618 | ||||||
|
Allowance
for bad debt
|
1,097 | 1,070 | ||||||
|
Share-based
compensation expense
|
4,158 | 3,506 | ||||||
|
Basis
difference in intangible assets
|
2,964 | 2,695 | ||||||
|
Impairment
of investments
|
2,430 | 176 | ||||||
|
Gain
on sale of intangible assets
|
447 | 766 | ||||||
|
Deferred
revenue
|
1,224 | 821 | ||||||
|
Other
|
1,272 | 1,519 | ||||||
| 17,300 | 14,684 | |||||||
|
Less: Valuation
Allowance
|
(2,255 | ) | — | |||||
|
Total
deferred tax assets
|
$ | 15,045 | $ | 14,684 | ||||
|
Deferred
tax liabilities:
|
||||||||
|
State
taxes
|
$ | (878 | ) | $ | (907 | ) | ||
|
Basis
difference in fixed assets
|
(2,008 | ) | (2,212 | ) | ||||
|
Prepaid
insurance
|
(259 | ) | (281 | ) | ||||
|
Intangible
amortization
|
(525 | ) | (539 | ) | ||||
|
Total
deferred tax liabilities
|
$ | (3,670 | ) | $ | (3,939 | ) | ||
|
Net
deferred tax assets
|
$ | 11,375 | $ | 10,745 | ||||
We had
approximately $15.0 million and $14.7 million in deferred tax assets as of
December 31, 2009 and 2008, respectively, related primarily to net operating
loss carryforwards, capital losses and as a result of differences in share-based
compensation between our financial statements and our tax returns. Based on the
weight of available evidence, we assess whether it is more likely than not that
some portion or all of a deferred tax asset will not be realized. If necessary,
we record a valuation allowance sufficient to reduce the deferred tax asset to
the amount that is more likely that not to be realized. The
deferred tax assets should be realized through future operating results and the
reversal of temporary differences.
During
2009, we incurred a capital loss for book purposes due to the impairment of
certain debt securities. This impairment resulted in a deferred tax
asset of $2.4 million. Due to the fact that a capital loss can only
be offset against capital gains for tax purposes, it is more likely than not
that some portion or all of the asset will not be realized. We
recorded a valuation allowance of $2.3 million for this asset.
- 54
-
As of
December 31, 2009, we had utilizable federal and state (California) net
operating loss carryforwards (“NOLs”) of $5.3 million and $6.7 million,
respectively, after considering substantial restrictions on the utilization of
these NOLs due to “ownership changes” as defined in the Internal Revenue Code of
1986, as amended (the “Internal Revenue Code”). We currently estimate
that all of the above-mentioned federal and state NOLs will be available for use
before their expiration. These NOLs expire through the year 2021 for the federal
and 2014 for the state. In addition, as of December 31, 2009 and 2008, we had
state research and development tax credits of $0.8 million, which last
indefinitely.
In 2008,
the Governor of California signed into law new tax legislation that suspended
the use of NOLs for tax years beginning on or after January 1, 2008 and 2009.
Despite the Company having taxable income in 2008 and 2009, the Company was not
permitted to utilize its California NOLs generated in prior years to offset this
taxable income for purposes of determining the applicable California income tax
due. Current law reinstates use of NOLs in tax years beginning on or after
January 1, 2010.
Certain tax payments are prepaid during the year and included
within Prepaid expenses and other current assets on the consolidated balance
sheet. Our prepaid tax payments were $7.2 million and $3.1 million at December
31, 2009 and 2008, respectively.
Uncertain
Income Tax Positions
We
accrued liabilities for uncertain income tax positions in accordance with the
requirements As of January 1, 2007, we had $25.0 million in
liabilities for uncertain income tax positions, including $6.1 million other tax
contingencies carried forward from prior years and an additional charge of $18.9
million recognized to retained earnings. During 2009, we recognized a net
increase of $8.2 million in liabilities and at December 31, 2009 had $46.8
million in liabilities for uncertain income tax positions. Included in this
liability amount were $3.4 million accrued for related interest, net of federal
income tax benefits and $65,000 for related penalties recorded in income tax
expense on our consolidated statement of operations.
The
reconciliation of our unrecognized tax benefits, excluding interest and
penalties, is as follows (in thousands):
|
Balance
at January 1, 2009
|
$ | 36,225 | ||
|
Increases
related to positions taken in 2009
|
7,122 | |||
|
Balance
at December 31, 2009
|
$ | 43,347 |
Uncertain
income tax positions are reasonably possible to significantly change during
the next 12 months as a result of completion of income tax audits and expiration
of statutes of limitations. At this point it is not possible to provide an
estimate of the amount, if any, of significant changes in reserves for uncertain
income tax positions that are reasonably possible to occur in the next
12 months.
As of
December 31, 2009, 2008 and 2007, U.S. income taxes have not been assessed on
$83.8 million, $85.5 million and $82.8 million, respectively, of undistributed
earnings of foreign subsidiaries because management considers these earnings to
be invested indefinitely.
During
2009, 2008 and 2007, we recorded tax benefits of $4.0 million, $2.0 million and
$3.6 million from the exercise of non-qualifying stock options, restricted stock
and disqualifying dispositions of incentive stock options as a reduction of our
income tax liability and an increase in equity, respectively.
We are
currently under audit by the Internal Revenue Service for tax years 2004 through
2008. In addition, we are under audit by the California Franchise Tax Board for
tax years 2005 through 2007 and by the Illinois Department of Revenue for 2005
and 2006. We are also under audit by various other states for non-income related
taxes. It is possible that these audits may conclude in the next 12
months and that the unrecognized tax benefits we have recorded in relation to
these tax years may change compared to the liabilities recorded for these
periods. However, it is not now possible to estimate the amount, if any, of such
change.
10.
Stockholders’ Equity
Share
Repurchase Program
In
February 2008, j2 Global’s Board of Directors approved a common stock repurchase
program (the “Repurchase Program”) authorizing the repurchase of up to five
million shares of our common stock through the end of December 2010. The
Repurchase Program was completed on July 9, 2008; five million shares at an
aggregated cost of $108.0 million (including commission fees of $0.1 million)
were repurchased. We have accounted for these repurchases using the cost method.
At December 31, 2008 and December 31, 2007, 8,680,568 common shares at a cost of
$112.7 million and 5,660,324 common shares at a cost of $4.7 million,
respectively, were held as treasury stock. During 2008, we retired two million
shares of our treasury stock.
- 55
-
11.
Stock Options and Employee Stock Purchase Plan
Our
share-based compensation plans include the Second Amended and Restated 1997
Stock Option Plan, 2007 Stock Plan and 2001 Employee Stock Purchase
Plan (each is described below).
|
(a)
|
Second
Amended and Restated 1997 Stock Option Plan and 2007
Stock Plan
|
In
November 1997, j2 Global’s Board of Directors adopted the j2 Global
Communications, Inc. 1997 Stock Option Plan (the “1997 Plan”), which was twice
amended and restated. The 1997 Plan terminated in 2007, although stock options
and restricted stock issued under the 1997 Plan continue to be governed by it. A
total of 12,000,000 shares of common stock were authorized to be used for 1997
Plan purposes. An additional 840,000 shares were authorized for issuance upon
exercise of options granted outside the 1997 Plan.
In
October 2007, j2 Global’s Board of Directors adopted the j2 Global
Communications, Inc. 2007 Stock Plan (the “2007 Plan”). The 2007 Plan provides
for the granting of incentive stock options, nonqualified stock options, stock
appreciation rights, restricted stock, restricted stock units and other
share-based awards. The number of authorized shares of common stock that may be
used for 2007 Plan purposes is 4,500,000. Options under the 2007 Plan may
be granted at exercise prices determined by the Board of Directors, provided
that the exercise prices shall not be less than the fair market value of j2
Global’s common stock on the date of grant for incentive stock options and not
less than 85% of the fair market value of j2 Global’s common stock on the date
of grant for non-statutory stock options.
At
December 31, 2009, 2008 and 2007, options to purchase 2,939,410, 3,107,845, and
2,827,439 shares of common stock were exercisable under and outside of the 2007
Plan and the 1997 Plan combined, at weighted average exercise prices of $8.96,
$6.83 and $4.77, respectively. Stock options generally expire after 10 years and
vest over a four- to five-year period.
All stock
option grants are approved by “outside directors” within the meaning of Internal
Revenue Code Section 162(m).
Stock
Options
Stock
option activity for the years ended December 31, 2009, 2008 and 2007 is
summarized as follows:
|
Number
of
Shares
|
Weighted-Average
Exercise Price
|
Weighted-Average
Remaining Contractual Life
(In
Years)
|
Aggregate
Intrinsic Value
|
|||||||
|
Options
outstanding at December 31, 2006
|
4,639,614
|
$8.58
|
||||||||
|
Granted
|
682,100
|
$30.44
|
||||||||
|
Exercised
|
(776,273
|
) |
$9.92
|
|||||||
|
Canceled
|
(162,267
|
) |
$24.26
|
|||||||
|
Options
outstanding at December 31, 2007
|
4,383,174
|
$11.19
|
||||||||
|
Granted
|
344,453
|
$22.42
|
||||||||
|
Exercised
|
(226,760
|
) |
$8.05
|
|||||||
|
Canceled
|
(177,937
|
) |
$23.74
|
|||||||
|
Options
outstanding at December 31, 2008
|
4,322,930
|
$11.73
|
||||||||
|
Granted
|
808,760
|
$18.05
|
||||||||
|
Exercised
|
(523,290
|
) |
$5.18
|
|||||||
|
Canceled
|
(127,809
|
) |
$28.00
|
|||||||
|
Options
outstanding at December 31, 2009
|
4,480,591
|
$13.17
|
5.1
|
$38,210,492
|
||||||
|
Exercisable
at December 31, 2009
|
2,939,410
|
$8.96
|
3.4
|
$35,747,850
|
||||||
|
Vested
and expected to vest at December 31, 2009
|
4,174,144
|
$12.65
|
4.8
|
$37,628,033
|
||||||
For the
year ended December 31, 2009, we granted 808,760 options to purchase shares of
common stock pursuant to the 2007 Plan to newly hired and existing members of
management and board members. These stock options vest 20% per year and expire
10 years from the date of grant.
- 56
-
The per
share weighted–average grant-date fair value of options granted during the years
2009, 2008 and 2007 was $9.89, $13.89 and $20.53, respectively.
The total
intrinsic value of options exercised during the years ended December 31, 2009,
2008 and 2007 was $9.4 million, $3.4 million and $14.8 million,
respectively.
The total
fair value of options vested during the years ended December 31, 2009, 2008 and
2007 was $7.4 million, $13.5 million and $4.6 million,
respectively.
Cash
received from options exercised under all share-based payment arrangements for
the years ended December 31, 2009, 2008 and 2007 was $2.7 million, $1.8 million
and $7.7 million, respectively. The actual tax benefit realized for the tax
deductions from option exercises under the share-based payment arrangements
totaled $3.0 million, $3.3 million and $3.6 million, respectively, for the years
ended December 31, 2009, 2008 and 2007.
At
December 31, 2009, the exercise prices of options granted under and outside the
2007 Plan and the 1997 Plan ranged from $0.55 to $34.73, with a weighted-average
remaining contractual life of 3.17 years. The following table summarizes
information concerning outstanding and exercisable options as of December 31,
2009:
|
Options
Outstanding
|
Exercisable
Options
|
|||||||||||||||||||||
|
Range
of
Exercise Prices
|
Number
Outstanding
December
31,
2009
|
Weighted
Average
Remaining
Contractual
Life
|
Weighted
Average
Exercise
Price
|
Number
Exercisable
December
31,
2009
|
Weighted
Average
Exercise
Price
|
|||||||||||||||||
| $0.55 | 3,500 | 1.01 | $ | 0.55 | 3,500 | $ | 0.55 | |||||||||||||||
| 0.94 | 930,798 | 1.99 | 0.94 | 930,798 | 0.94 | |||||||||||||||||
| 1.03 – 3.53 | 521,438 | 1.15 | 2.09 | 521,438 | 2.09 | |||||||||||||||||
| 4.47 – 9.55 | 585,516 | 3.67 | 8.43 | 585,516 | 8.43 | |||||||||||||||||
| 11.43 – 16.90 | 47,494 | 5.85 | 14.26 | 31,494 | 14.53 | |||||||||||||||||
| 17.19 | 641,000 | 9.18 | 17.19 | — | — | |||||||||||||||||
| 18.77 | 788,600 | 5.67 | 18.77 | 583,400 | 18.77 | |||||||||||||||||
| 20.15 – 26.39 | 520,145 | 8.33 | 22.37 | 106,424 | 22.72 | |||||||||||||||||
| 28.50 – 33.54 | 412,100 | 7.43 | 31.43 | 164,840 | 31.43 | |||||||||||||||||
| 34.73 | 30,000 | 7.56 | 34.73 | 12,000 | 34.73 | |||||||||||||||||
| $0.55 – $34.73 | 4,480,591 | 5.10 | $ | 13.17 | 2,939,410 | $ | 8.96 | |||||||||||||||
At
December 31, 2009, there were 3,513,034 additional shares underlying options,
shares of restricted stock and other share-based awards available for grant
under the 2007 Plan, and no additional shares available for grant under or
outside of the 1997 Plan.
The
following table summarizes j2 Global’s nonvested options as of December 31, 2009
and changes during the year ended December 31, 2009:
|
Nonvested Options
|
Shares
|
Weighted
Average
Grant-Date
Fair
Value
|
||||||
|
Nonvested
at January 1, 2009
|
1,215,085 | $ | 11.09 | |||||
|
Granted
|
808,760 | 9.89 | ||||||
|
Vested
|
(379,102 | ) | 19.51 | |||||
|
Canceled
|
(103,562 | ) | 19.45 | |||||
|
Nonvested
at December 31, 2009
|
1,541,181 | $ | 14.08 | |||||
As of
December 31, 2009, there was $18.9 million of total unrecognized compensation
expense related to nonvested share-based compensation awards granted under the
2007 Plan and the 1997 Plan. That expense is expected to be recognized ratably
over a weighted average period of 3.17 years (i.e., the remaining requisite
service period).
- 57
-
Fair Value
Disclosure
We use
the Black-Scholes option pricing model to calculate the fair-value of each
option grant. The expected volatility is based on historical volatility of j2
Global’s common stock. We elected to use the simplified method for estimating
the expected term. Under the simplified method, the expected term is equal to
the midpoint between the vesting period and the contractual term of the stock
option. The risk-free interest rate is based on U.S. Treasury zero-coupon issues
with a term equal to the expected term of the option assumed at the date of
grant. Estimated forfeiture rates were 14.5% and 16.8% as of December 31, 2009
and 2008, respectively.
The
weighted-average fair values of stock options granted have been estimated
utilizing the following assumptions:
|
Years
Ended December 31,
|
|||||
|
2009
|
2008
|
2007
|
|||
|
Risk
free interest rate
|
2.4%
|
3.4%
|
4.5%
|
||
|
Expected
term (in years)
|
6.5
|
6.5
|
6.5
|
||
|
Dividend
yield
|
0.0%
|
0.0%
|
0.0%
|
||
|
Expected
volatility
|
54.9%
|
62.3%
|
72.7%
|
||
Share-Based Compensation
Expense
The
following table represents the share-based compensation expense that was
included in cost of revenues and operating expenses in the consolidated
statement of operations for the years ended December 31, 2009, 2008 and 2007 (in
thousands):
|
Year
Ended December 31,
|
||||||||||||
|
2009
|
2008
|
2007
|
||||||||||
|
Cost
of revenues
|
$ | 1,263 | $ | 901 | $ | 668 | ||||||
|
Operting
expenses:
|
||||||||||||
|
Sales
and marketing
|
1,818 | 1,268 | 1,187 | |||||||||
|
Research,
development and engineering
|
853 | 803 | 771 | |||||||||
|
General
and administrative
|
7,084 | 5,014 | 4,788 | |||||||||
| $ | 11,018 | $ | 7,986 | $ | 7,414 | |||||||
Restricted
Stock
j2 Global
has awarded restricted shares of common stock to our board of directors and
senior staff pursuant to the 1997 Plan and 2007 Plan. Compensation expense
resulting from restricted stock grants is measured at fair value on the date of
grant and is recognized as share-based compensation expense over a five-year
vesting period. We granted 730,603 shares, 58,474 shares and 112,800 shares
of restricted stock during the years ended December 31, 2009, 2008 and
2007, respectively, and recognized $3.7 million, $1.8 million and $1.3 million,
respectively, of related compensation expense. As of December 31, 2009, we have
unrecognized share-based compensation cost of $14.4 million associated with
these awards. This cost is expected to be recognized over a weighted-average
period of 3.67 years. The actual tax benefit realized for the tax deductions
from the vesting of restricted stock totaled $1.5 million, $1.8 million and $0.2
million, respectively, for the years ended December 31, 2009, 2008 and
2007.
Restricted
stock activity for the year ended December 31, 2009 is set forth
below:
|
Weighted-Average
|
||||||||
|
Grant-Date
|
||||||||
|
Shares
|
Fair
Value
|
|||||||
|
Nonvested
at January 1, 2009
|
319,494 | $ | 23.75 | |||||
|
Granted
|
730,603 | 17.70 | ||||||
|
Vested
|
(95,266 | ) | 21.46 | |||||
|
Canceled
|
(7,000 | ) | 17.19 | |||||
|
Nonvested
at December 31, 2009
|
947,831 | 19.36 | ||||||
- 58
-
(b) Employee
Stock Purchase
Plan
In May of
2001, j2 Global established the j2 Global Communications, Inc. 2001 Employee
Stock Purchase Plan (the “Purchase Plan”), which provides for the issuance of a
maximum of 2,000,000 shares of common stock. Under the Purchase Plan, eligible
employees can have up to 15% of their earnings withheld, up to certain maximums,
to be used to purchase shares of j2 Global’s common stock at certain
plan-defined dates. The price of the common stock purchased under the Purchase
Plan for the offering periods is equal to 95% of the fair market value of the
common stock at the end of the offering period. During 2009, 2008 and 2007,
5,808, 9,632 and 9,282 shares, respectively, were purchased under the Purchase
Plan at prices ranging from $18.60 to $22.79 per share. As of December 31, 2009,
1,661,527 shares were available under the Purchase Plan for future
issuance.
12.
Defined Contribution 401(k) Savings Plan
We have a
401(k) Savings Plan covering substantially all of our employees. Eligible
employees may contribute through payroll deductions. We may make annual
contributions to the 401(k) Savings Plan at the discretion of our Board of
Directors. For the years ended December 31, 2009 and 2008, we accrued zero and
$0.1 million, respectively, for contributions to the 401(k) Savings Plan,
respectively.
13.
Earnings Per Share
Basic
earnings per share is computed on the basis of the weighted average number of
common shares outstanding. Diluted earnings per share is computed on the basis
of the weighted average number of common shares outstanding plus the effect of
outstanding stock options, warrants and restricted stock using the “treasury
stock” method. The components of basic and diluted earnings per share are as
follows (in thousands, except share and per share data):
|
Years Ended December 31,
|
||||||||||||
|
2009
|
2008
|
2007
|
||||||||||
|
Numerator
for basic and diluted income per common share:
|
||||||||||||
|
Net
earnings
|
$ | 66,827 | $ | 72,562 | $ | 68,461 | ||||||
|
Denominator:
|
||||||||||||
|
Weighted
average outstanding shares of common stock
|
43,936,194 | 44,609,174 | 48,953,483 | |||||||||
|
Dilutive
effect of:
|
||||||||||||
|
Employee
stock options
|
1,094,740 | 1,281,497 | 1,689,691 | |||||||||
|
Restricted
stock
|
107,067 | 46,836 | 118,833 | |||||||||
|
Common
stock and common stock equivalents
|
45,138,001 | 45,937,506 | 50,762,007 | |||||||||
|
Net
earnings per share:
|
||||||||||||
|
Basic
|
$ | 1.52 | $ | 1.63 | $ | 1.40 | ||||||
|
Diluted
|
$ | 1.48 | $ | 1.58 | $ | 1.35 | ||||||
For the
years ended December 31, 2009, 2008 and 2007, there were 815,409, 1,768,181 and
3,818,414 warrants and options outstanding, respectively, which were excluded
from the computation of diluted earnings per share because the exercise prices
were greater than the average market price of the common shares.
- 59
-
14.
Geographic Information
We
maintain operations in the U.S., Canada, Ireland, the United Kingdom and other
international territories. Geographic information about the U.S. and
international territories for the reporting period is presented below. Such
information attributes revenues based on the location of a customer’s Direct
Inward Dial number for services using such a number or a customer’s residence
for other services (in thousands).
|
Year Ended December 31,
|
||||||||||||
|
2009
|
2008
|
2007
|
||||||||||
|
Revenue:
|
||||||||||||
|
United
States
|
$ | 209,547 | $ | 204,444 | $ | 192,445 | ||||||
|
All
other countries
|
36,024 | 37,069 | 28,252 | |||||||||
|
Total
|
$ | 245,571 | $ | 241,513 | $ | 220,697 | ||||||
|
As of December 31,
|
||||||||
|
2009
|
2008
|
|||||||
|
Long-lived
assets:
|
||||||||
|
United States
|
$ | 36,488 | $ | 43,163 | ||||
|
All other
countries
|
8,900 | 9,885 | ||||||
|
Total
|
$ | 45,388 | $ | 53,048 | ||||
15.
Related Party Transactions
|
(a)
|
Lease
and Expense
Reimbursement
|
We lease
our headquarters office from a company that is affiliated with the Chairman of
the Board. For fiscal 2009, 2008 and 2007, we paid $1.1 million, $1.3 million
and $1.1 million, respectively, in rent expense to this company. We also
incurred approximately $5,000, $37,000 and $15,000 for expenses for services
rendered by firms affiliated with our Chairman of the Board during 2009, 2008
and 2007, respectively. We believe this lease was entered into at prevailing
market rates, and that all expense reimbursements were based on actual amounts
paid to third parties without markup or markdown.
|
(b)
|
Consulting
Services
|
j2 Global
engages the consulting services of its Chairman of the Board through an
agreement with Orchard Capital Corporation, a company controlled by its Chairman
of the Board. For each of the years ended December 31, 2009, 2008 and 2007, j2
Global paid Orchard Capital $0.3 million for these services.
On
October 1, 2008, j2 Global entered into a Consultancy Agreement with John F.
Rieley, a member of j2 Global’s Board of Directors. The Consultancy Agreement
has a one year term and automatically renews for successive one year terms
unless terminated by either party at any time and for any reason. The
Consultancy Agreement autorenewed in 2009 for an additional one year period
through September 30, 2010. Pursuant to the Consultancy Agreement,
Mr. Rieley assists j2 Global in developing and implementing a voice
services public relations program. In exchange for these services, Mr.
Rieley receives annual compensation of $0.1 million payable monthly in
advance. In addition, in the event that j2 Global requests that Mr. Rieley work
more than 20 hours in any calendar month, j2 Global will pay Mr. Rieley an
additional $500 per hour for each additional hour worked. Total
compensation paid to Mr. Rieley for the years ended December 31, 2009 and 2008
was approximately $0.1 million.
16.
Supplemental Cash Flows Information
Interest
income received during the years ended December 31, 2009, 2008 and 2007 was $1.2
million, $4.8 million and $9.3 million, respectively, substantially all of which
related to interest earned on cash, cash equivalents and short and long-term
investments.
Cash paid
for interest during the years ended December 31, 2009, 2008 and 2007
approximated $0.1 million, $0.1 million and $2,000, respectively, substantially
all of which related to interest on foreign taxes and interest on settled
acquisition holdback.
We paid
cash of $24.8 million, $29.9 million and $12.3 million for taxes during the
years ended December 31, 2009, 2008 and 2007, respectively.
We
acquired property and equipment for $0.2 million, $0.1 million and $0.8 million
during 2009, 2008 and 2007, respectively, which had not been yet paid at the end
of each such year.
- 60
-
During
2009, 2008 and 2007, we recorded the tax benefit from the exercise of
non-qualified stock options and restricted stock as a reduction of our income
tax liability of $4.0 million, $2.0 million and $3.6 million,
respectively.
Included
in the purchase prices of the acquisitions during 2009, 2008 and 2007 were
contingent holdbacks of $1.1 million, $1.8 million and $1.1 million,
respectively. These are recorded as current accrued expenses or other long-term
liabilities with a maturity equal to the expected holdback release date (see
Note 3. Business Acquisitions).
17.
Quarterly Results (unaudited)
The
following tables contain selected unaudited statement of operations information
for each quarter of 2009 and 2008 (in thousands, except share and per share
data). We believe that the following information reflects all normal recurring
adjustments necessary for a fair presentation of the information for the periods
presented. The operating results for any quarter are not necessarily indicative
of results for any future period.
|
Year Ended December 31,
2009
|
||||||||||||||||
|
Fourth
Quarter
|
Third
Quarter
|
Second
Quarter
|
First
Quarter
|
|||||||||||||
|
Revenues
|
$ | 60,915 | $ | 61,801 | $ | 62,464 | $ | 60,391 | ||||||||
|
Gross
profit
|
50,434 | 50,543 | 50,864 | 48,999 | ||||||||||||
|
Net
earnings
|
17,704 | 19,334 | 11,137 | 18,652 | ||||||||||||
|
Net
earnings per common share:
|
||||||||||||||||
|
Basic
|
$ | 0.40 | $ | 0.44 | $ | 0.25 | $ | 0.43 | ||||||||
|
Diluted
|
$ | 0.39 | $ | 0.43 | $ | 0.25 | $ | 0.42 | ||||||||
|
Weighted
average shares outstanding
|
||||||||||||||||
|
Basic
|
44,220,725 | 44,126,078 | 43,762,333 | 43,627,071 | ||||||||||||
|
Diluted
|
45,244,333 | 45,296,147 | 45,044,005 | 44,728,911 | ||||||||||||
|
|
||||||||||||||||
|
Year Ended December 31,
2008
|
||||||||||||||||
|
Fourth
Quarter
|
Third
Quarter
|
Second
Quarter
|
First
Quarter
|
|||||||||||||
|
Revenues
|
$ | 60,636 | $ | 61,552 | $ | 60,677 | $ | 58,648 | ||||||||
|
Gross
profit
|
49,412 | 49,882 | 48,952 | 47,017 | ||||||||||||
|
Net
earnings
|
20,276 | 18,762 | 16,730 | 16,794 | ||||||||||||
|
Net
earnings per common share:
|
||||||||||||||||
|
Basic
|
$ | 0.47 | $ | 0.43 | $ | 0.38 | $ | 0.36 | ||||||||
|
Diluted
|
$ | 0.45 | $ | 0.42 | $ | 0.37 | $ | 0.35 | ||||||||
|
Weighted
average shares outstanding
|
||||||||||||||||
|
Basic
|
43,578,619 | 43,479,943 | 44,142,748 | 47,259,118 | ||||||||||||
|
Diluted
|
44,717,716 | 45,077,671 | 45,688,869 | 48,330,042 | ||||||||||||
18.
Subsequent Events
In
January 2010, we purchased for cash the assets associated with the digital
faxing business of Comodo Communications, Inc., for $5.9 million and certain
voice assets of Reality Telecom, Ltd. for $0.9 million. These
acquisitions are designed to be accretive and to provide us additional customers
in the voice and digital fax market. The financial impact to j2 Global for
these transactions individually and combined is immaterial as of the date
of the acquisition.
Management
has evaluated subsequent events through February 23, 2010, which represents the
date that the financial statements were issued.
- 61
-
None.
(a)
Evaluation of Disclosure Controls and Procedures
As of the
end of the period covered by this report, j2 Global’s management, with the
participation of Nehemia Zucker, our principal executive officer, and Kathleen
Griggs, our principal financial officer, carried out an evaluation of the
effectiveness of the design and operation of our disclosure controls and
procedures (as defined in Rule 13a-15(e) under the Exchange Act). Based upon
that evaluation, Mr. Zucker and Ms. Griggs concluded that these disclosure
controls and procedures were effective as of the end of the period covered in
this Annual Report on Form 10-K.
(b)
Management’s Report on Internal Control Over Financial Reporting
j2
Global’s management is responsible for establishing and maintaining adequate
internal control over financial reporting for j2 Global. In order to evaluate
the effectiveness of internal control over financial reporting, as required by
Section 404 of the Sarbanes-Oxley Act, management has conducted an assessment,
including testing, using the criteria in
Internal Control – Integrated
Framework
, issued by the Committee of Sponsoring Organizations of the
Treadway Commission (COSO). Our system of internal control over financial
reporting is designed to provide reasonable assurance regarding the reliability
of financial reporting and the preparation of financial statements for external
purposes in accordance with generally accepted accounting principles. Because of
its inherent limitations, internal control over financial reporting may not
prevent or detect misstatements. Also, projections of any evaluation of
effectiveness to future periods are subject to the risk that controls may become
inadequate because of changes in conditions, or that the degree of compliance
with the policies or procedures may deteriorate. Based on its assessment,
management has concluded that j2 Global’s internal control over financial
reporting was effective as of December 31, 2009. Management’s report on internal
control over financial reporting was not subject to attestation by the Company’s
registered public accounting firm pursuant to rules of the Securities and
Exchange Commission.
(c)
Changes in Internal Control Over Financial Reporting
No change
in our internal control over financial reporting (as defined in Rule 13a-15(f)
under the Securities Exchange Act of 1934) occurred during the fourth quarter of
our fiscal year ended December 31, 2009 that has materially affected, or is
reasonably likely to materially affect, our internal control over financial
reporting.
- 62
-
(d)
Report of Independent Registered Public Accounting Firm
REPORT
OF INDEPENDENT REGISTERED PUBLIC ACCOUNTING FIRM
To the
Board of Directors and Stockholders
j2 Global
Communications, Inc.
Los Angeles, CA
We have
audited j2 Global Communications, Inc. and its subsidiaries’ (collectively, the
“Company”) internal control over financial reporting as of December 31, 2009,
based on criteria established in
Internal
Control — Integrated Framework
issued by the Committee of Sponsoring
Organizations of the Treadway Commission. j2 Global Communication, Inc.’s
management is responsible for maintaining effective internal control over
financial reporting and for its assessment of the effectiveness of internal
control over financial reporting included in the accompanying Management’s
Report on Internal Control over Financial Reporting. Our responsibility is to
express an opinion on the Company's internal control over financial reporting
based on our audit.
We
conducted our audit in accordance with the standards of the Public Company
Accounting Oversight Board (United States). Those standards require that we plan
and perform the audit to obtain reasonable assurance about whether effective
internal control over financial reporting was maintained in all material
respects. Our audit included obtaining an understanding of internal control over
financial reporting, assessing the risk that a material weakness exists, and
testing and evaluating the design and operating effectiveness of internal
control based on the assessed risk. Our audit also included performing such
other procedures as we considered necessary in the circumstances. We believe
that our audit provides a reasonable basis for our opinion.
A
company's internal control over financial reporting is a process designed to
provide reasonable assurance regarding the reliability of financial reporting
and the preparation of financial statements for external purposes in accordance
with generally accepted accounting principles. A company's internal control over
financial reporting includes those policies and procedures that (a) pertain to
the maintenance of records that, in reasonable detail, accurately and fairly
reflect the transactions and dispositions of the assets of the company; (b)
provide reasonable assurance that transactions are recorded as necessary to
permit preparation of financial statements in accordance with generally accepted
accounting principles, and that receipts and expenditures of the company are
being made only in accordance with authorizations of management and directors of
the company; and (c) provide reasonable assurance regarding prevention or timely
detection of unauthorized acquisition, use, or disposition of the company's
assets that could have a material effect on the financial
statements.
Because
of its inherent limitations, internal control over financial reporting may not
prevent or detect misstatements. Also, projections of any evaluation of
effectiveness to future periods are subject to the risk that controls may become
inadequate because of changes in conditions, or that the degree of compliance
with the policies or procedures may deteriorate.
In our
opinion, j2 Global Communications, Inc. maintained, in all material respects,
effective internal control over financial reporting as of December 31, 2009,
based on criteria established in
Internal
Control — Integrated Framework
issued by the Committee of Sponsoring
Organizations of the Treadway Commission.
We have
also audited, in accordance with the standards of the Public Company Accounting
Oversight Board (United States), the consolidated financial statements and
financial statement schedule of j2 Global Communications, Inc. and its
subsidiaries and our report dated February 23, 2010 expressed an unqualified
opinion.
/s/ SINGER
LEWAK LLP
Los
Angeles, California
February
23, 2010
None.
- 63
-
The
information required by this item concerning our directors and executive
officers is incorporated by reference to the information to be set forth in our
proxy statement (“2009 Proxy Statement”) for the 2010 annual meeting of
stockholders to be filed with the SEC within 120 days after the end of our
fiscal year ended December 31, 2009.
The
information required by this item regarding executive compensation is
incorporated by reference to the information to be set forth in our 2009 Proxy
Statement.
The
information required by this item regarding security ownership and related
stockholder matters is incorporated by reference to the information to be set
forth in our 2009 Proxy Statement.
The
information required by this item regarding certain relationships and related
transactions is incorporated by reference to the information to be set forth in
our 2009 Proxy Statement.
The
information required by this item regarding principal accountant fees and
services is incorporated by reference to the information to be set forth in our
2009 Proxy Statement.
- 64
-
(a)
1. Financial Statements.
The
following financial statements are filed as a part of this Annual Report on Form
10-K:
Report of
Independent Registered Public Accounting Firm
Consolidated
Balance Sheets
Consolidated
Statements of Operations
Consolidated
Statements of Stockholders’ Equity
Consolidated
Statements of Cash Flows
Notes to
Consolidated Financial Statements
2.
Financial
Statement Schedule
The
following financial statement schedule is filed as part of this Annual Report on
Form 10-K:
Schedule
II—Valuation and Qualifying Accounts
All other
schedules are omitted because they are not required or the required information
is shown in the financial statements or notes thereto.
3. Exhibits
The
following exhibits are filed with this Annual Report on Form 10-K or are
incorporated herein by reference as indicated below (numbered in accordance with
Item 601 of Regulation S-K). We shall furnish copies of exhibits for a
reasonable fee (covering the expense of furnishing copies) upon
request.
|
Exhibit No.
|
Exhibit Title
|
|
|
3.1
|
Certificate
of Incorporation, as amended and restated (1)
|
|
|
3.1.1
|
Certificate
of Designation of Series B Convertible Preferred Stock
(2)
|
|
|
3.1.2
|
Certificate
of Amendment to Amended and Restated Certificate of Incorporation
(3)
|
|
|
3.1.3
|
Certificate
of Amendment to Amended and Restated Certificate of Incorporation
(7)
|
|
|
3.1.4
|
Certificate
of Amendment to Amended and Restated Certificate of Incorporation
(7)
|
|
|
3.1.5
|
Certificate
of Amendment to Amended and Restated Certificate of
Incorporation (9)
|
|
|
3.2
|
By-laws,
as amended and restated (1)
|
|
|
4.1
|
Specimen
of Common Stock certificate (5)
|
|
|
10.1
|
j2
Global Communications, Inc. Second Amended and Restated 1997 Stock Option
Plan (6)
|
|
|
10.1.1
|
Amendment
No. 1 to j2 Global Communications, Inc. Second Amended and Restated 1997
Stock Option Plan (9)
|
|
|
10.2
|
j2
Global Communications, Inc. 2007 Stock Plan (10)
|
|
|
10.3
|
Amended
and Restated j2 Global Communications, Inc. 2001 Employee Stock Purchase
Plan (8)
|
|
|
10.4
|
Letter
Agreement dated April 1, 2001 between j2 Global and Orchard Capital
Corporation (4)
|
|
|
10.4.1
|
Amendment
dated December 31, 2001 to Letter Agreement dated April 1, 2001 between j2
Global and Orchard Capital Corporation (7)
|
|
|
10.5
|
Employment
Agreement for Nehemia Zucker, dated March 21, 1997 (1)
|
|
|
10.7
|
Registration
Rights Agreement dated as of June 30, 1998 with the investors in the June
and July 1998 private placements (1)
|
|
|
10.8
|
Registration
Rights Agreement dated as of March 17, 1997 with Orchard/JFAX Investors,
LLC, Boardrush LLC (Boardrush Media LLC), Jaye Muller, John F. Rieley,
Nehemia Zucker and Anand Narasimhan (1)
|
|
|
10.9
|
Consultancy
Agreement between j2 Global and John F. Rieley, dated as of October 1,
2008
|
|
|
10.10
|
Credit
Agreement dated as of January 5, 2009 between j2 Global Communications,
Inc. and Union Bank N.A (11)
|
|
|
21
|
List
of subsidiaries of j2 Global
|
- 65
-
|
Exhibit No.
|
Exhibit Title
|
|
|
23.1
|
Consent
of Independent Registered Public Accounting Firm – Singer Lewak,
LLP
|
|
|
31.1
|
Certification
by Principal Executive Officer pursuant to Section 302 of the
Sarbanes-Oxley Act of 2002
|
|
|
31.2
|
Certification
by Principal Financial Officer pursuant to Section 302 of the
Sarbanes-Oxley Act of 2002
|
|
|
32
|
Certification
of Principal Executive Officer and Principal Financial Officer pursuant to
18 U.S.C. section 1350
|
_______________________
|
(1)
|
Incorporated
by reference to j2 Global’s Registration Statement on Form S-1 filed with
the Commission on April 16, 1999, Registration No.
333-76477.
|
|
(2)
|
Incorporated
by reference to j2 Global’s Annual Report on Form 10-K filed with the
Commission on March 30, 2000.
|
|
(3)
|
Incorporated
by reference to j2 Global’s Registration Statement on Form S-3 with the
Commission on December 29, 2000, Registration No.
333-52918.
|
|
(4)
|
Incorporated
by reference to j2 Global’s Annual Report on Form 10-K/A filed with the
Commission on April 30, 2001.
|
|
(5)
|
Incorporated
by reference to j2 Global’s Quarterly Report on Form 10-Q filed with the
Commission on May 15, 2001.
|
|
(6)
|
Incorporated
by reference to j2 Global’s Amended Registration Statement on Form S-8
filed with the Commission on July 17, 2001, Registration No.
333-55402.
|
|
(7)
|
Incorporated
by reference to j2 Global’s Annual Report on Form 10-K filed with the
Commission on April 1, 2002.
|
|
(8)
|
Incorporated
by reference to j2 Global’s Current Report on Form 8-K filed with the
Commission on May 3, 2006.
|
|
(9)
|
Incorporated
by reference to j2 Global’s Quarterly Report on Form 10-Q filed with the
Commission on March 12, 2007.
|
|
(10)
|
Incorporated
by reference to j2 Global’s proxy statement on Schedule 14A filed with the
Commission on September 18,
2007.
|
|
(11)
|
Incorporated
by reference to j2 Global’s Current Report on Form 8-K filed with the
Commission on January 9, 2009.
|
- 66
-
Pursuant
to the requirements of Section 13 or 15(d) of the Securities Exchange Act of
1934, the Registrant has duly caused this report to be signed on its behalf by
the undersigned, thereunto duly authorized, on February 23, 2010.
|
|
||
|
j2
Global Communications, Inc.
|
||
|
By:
|
/s/ NEHEMIA
ZUCKER
|
|
|
Nehemia
Zucker
Chief
Executive Officer
(Principal
Executive
Officer)
|
||
Pursuant
to the requirements of the Securities Exchange Act of 1934, this report has been
signed below by the following persons on behalf of the Registrant and in the
capacities and on the dates indicated, in each case on February 23,
2010.
|
Signature
|
Title
|
|
/s/ NEHEMIA ZUCKER
Nehemia
Zucker
|
Chief
Executive Officer (Principal Executive Officer)
|
|
|
|
|
/s/ KATHLEEN M. GRIGGS
Kathleen
M. Griggs
|
Chief
Financial Officer (Principal Financial Officer)
|
|
|
|
|
/s/ RICHARD S. RESSLER
Richard
S. Ressler
|
Chairman
of the Board and a Director
|
|
|
|
|
/s/ DOUGLAS Y. BECH
Douglas
Y. Bech
|
Director
|
|
|
|
|
/s/ ROBERT J. CRESCI
Robert
J. Cresci
|
Director
|
|
|
|
|
/s/ WILLIAM B. KRETZMER
William
B. Kretzmer
|
Director
|
|
|
|
|
/s/ JOHN F. RIELEY
John
F. Rieley
|
Director
|
|
|
|
|
/s/ STEPHEN ROSS
Stephen
Ross
|
Director
|
|
|
|
|
/s/ MICHAEL P. SCHULHOF
Michael
P. Schulhof
|
Director
|
- 67
-
SCHEDULE
II – VALUATION AND QUALIFYING ACCOUNTS
(In
thousands)
|
Description
|
Balance
at
Beginning
of Period
|
Additions:
Charged
to
Costs
and
Expenses
|
Deductions:
Write-offs
(1)
and recoveries
|
Balance
at
End
of Period
|
||||||||||||
|
Year
Ended December 31, 2009:
|
||||||||||||||||
|
Allowance
for doubtful accounts
|
$ | 2,896 | $ | 799 | $ | (618 | ) | $ | 3,077 | |||||||
|
Deferred
tax asset valuation allowance
|
— | (2,255 | ) | — | (2,255 | ) | ||||||||||
|
Year
Ended December 31, 2008:
|
||||||||||||||||
|
Allowance
for doubtful accounts
|
$ | 1,378 | $ | 2,815 | $ | (1,297 | ) | $ | 2,896 | |||||||
|
Year
Ended December 31, 2007:
|
||||||||||||||||
|
Allowance
for doubtful accounts
|
$ | 1,105 | $ | 780 | $ | (507 | ) | $ | 1,378 | |||||||
_______________________
(1) Represents
specific amounts written off that were considered to be
uncollectible.
- 68
-
TABLE OF CONTENTS
Part IItem 1. BusinessItem 1A. Risk FactorsItem 1B. Unresolved Staff CommentsItem 2. PropertiesItem 3. Legal ProceedingsItem 4. Submission Of Matters To A Vote Of Security HoldersPart IIItem 5. Market For Registrant S Common Equity, Related Stockholder Matters and Issuer Purchases Of Equity SecuritiesItem 6. Selected Financial DataItem 7. Management S Discussion and Analysis Of Financial Condition and Results Of OperationsItem 7A. Quantitative and Qualitative Disclosures About Market RiskItem 8. Financial Statements and Supplementary DataItem 9. Changes in and Disagreements with Accountants on Accounting and Financial DisclosureItem 9A. Controls and ProceduresItem 9B. Other InformationPart IIIItem 10. Directors, Executive Officers and Corporate GovernanceItem 11. Executive CompensationItem 12. Security Ownership Of Certain Beneficial Owners and Management and Related Stockholder MattersItem 13. Certain Relationships and Related Transactions, and Director IndependenceItem 14. Principal Accounting Fees and ServicesPart IVItem 15. Exhibits and Financial Statement Schedules