|
|
|
|
|
|
|
|
|
|
|
|
|
|
|
|
|
|
|
|
|
|
|
|
|
|
|
|
|
|
|
|
|
|
|
|
|
|
|
|
|
|
|
|
|
|
|
Table of Contents
UNITED STATES
SECURITIES AND EXCHANGE COMMISSION
Washington, D.C. 20549
FORM 10-K
| x | ANNUAL REPORT PURSUANT TO SECTION 13 OR 15(d) OF THE SECURITIES EXCHANGE ACT OF 1934 |
For the fiscal year ended December 31, 2010
OR
| ¨ | TRANSITION REPORT PURSUANT TO SECTION 13 OR 15(d) OF THE SECURITIES EXCHANGE ACT OF 1934 |
For the transition period from to
COMMISSION FILE NUMBER 001-12307
ZIONS BANCORPORATION
(Exact name of Registrant as specified in its charter)
| UTAH | 87-0227400 | |
|
(State or other jurisdiction of
incorporation or organization) |
(Internal Revenue Service Employer Identification Number) |
|
|
One South Main, 15 th Floor Salt Lake City, Utah |
84133 | |
| (Address of principal executive offices) | (Zip Code) |
Registrant’s telephone number, including area code: (801) 524-4787
Securities registered pursuant to Section 12(b) of the Act:
|
Title of Each Class |
Name of Each Exchange on Which
Registered |
|
|
Guarantee related to 8.00% Capital Securities of Zions Capital Trust B |
New York Stock Exchange | |
|
Convertible 6% Subordinated Notes due September 15, 2015 |
New York Stock Exchange | |
|
Depositary Shares each representing a 1/40 th ownership interest in a share of Series A Floating-Rate Non-Cumulative Perpetual Preferred Stock |
New York Stock Exchange | |
|
Depositary Shares each representing a 1/40 th ownership interest in a share of Series C 9.5% Non-Cumulative Perpetual Preferred Stock |
New York Stock Exchange | |
|
Depositary Shares each representing a 1/40 th ownership interest in a share of Series E Fixed-Rate Resettable Non-Cumulative Perpetual Preferred Stock |
New York Stock Exchange | |
|
Common Stock, without par value |
The NASDAQ Stock Market LLC |
Securities registered pursuant to Section 12(g) of the Act: None.
Indicate by check mark if the registrant is a well-known seasoned issuer, as defined in Rule 405 of the Securities Act. Yes x No ¨
Indicate by check mark if the registrant is not required to file reports pursuant to Section 13 or Section 15(d) of the Act. Yes ¨ No x
Indicate by check mark whether the registrant (1) has filed all reports required to be filed by Section 13 or 15(d) of the Securities Exchange Act of 1934 during the preceding 12 months (or for such shorter period that the registrant was required to file such reports), and (2) has been subject to such filing requirements for the past 90 days. Yes x No ¨
Indicate by check mark whether the registrant has submitted electronically and posted on its corporate Web site, if any, every Interactive Data File required to be submitted and posted pursuant to Rule 405 of Regulation S-T (§232.405 of this chapter) during the preceding 12 months (or for such shorter period that the registrant was required to submit and post such files). Yes x No ¨
Indicate by check mark if disclosure of delinquent filers pursuant to Item 405 of Regulation S-K (Section 229.405 of this chapter) is not contained herein, and will not be contained, to the best of registrant’s knowledge, in definitive proxy or information statements incorporated by reference in Part III of this Form 10-K or any amendment to this Form 10-K. ¨
Indicate by check mark whether the registrant is a large accelerated filer, an accelerated filer, a non-accelerated filer, or a smaller reporting company. See the definitions of “large accelerated filer,” “accelerated filer,” and “smaller reporting company” in Rule 12b-2 of the Exchange Act.
Large accelerated filer x Accelerated filer ¨ Non-accelerated filer ¨ Smaller reporting company ¨
Indicate by check mark whether the registrant is a shell company (as defined in Rule 12b-2 of the Exchange Act). Yes ¨ No x
|
Aggregate Market Value of Common Stock Held by Non-affiliates at June 30, 2010 |
$ | 3,595,533,800 | ||
|
Number of Common Shares Outstanding at February 16, 2011 |
183,017,092 shares |
Documents Incorporated by Reference:
Portions of the Company’s Proxy Statement – Incorporated into Part III
Table of Contents
| Page | ||||||
| PART I | ||||||
| Item 1. | 6 | |||||
| Item 1A. | 13 | |||||
| Item 1B. | 18 | |||||
| Item 2. | 18 | |||||
| Item 3. | 18 | |||||
| Item 4. | ||||||
| PART II | ||||||
| Item 5. | 19 | |||||
| Item 6. | 22 | |||||
| Item 7. |
Management’s Discussion and Analysis of Financial Condition and Results of Operations. |
23 | ||||
| Item 7A. | 90 | |||||
| Item 8. | 91 | |||||
| Item 9. |
Changes in and Disagreements with Accountants on Accounting and Financial Disclosure. |
171 | ||||
| Item 9A. | 171 | |||||
| Item 9B. | 171 | |||||
| PART III | ||||||
| Item 10. | 172 | |||||
| Item 11. | 172 | |||||
| Item 12. |
Security Ownership of Certain Beneficial Owners and Management and Related Stockholder Matters. |
172 | ||||
| Item 13. |
Certain Relationships and Related Transactions, and Director Independence. |
172 | ||||
| Item 14. | 172 | |||||
| PART IV | ||||||
| Item 15. | 173 | |||||
| 178 | ||||||
2
Table of Contents
FORWARD-LOOKING INFORMATION
Statements in this Annual Report on Form 10-K that are based on other than historical data are forward-looking within the meaning of the Private Securities Litigation Reform Act of 1995. Forward-looking statements provide current expectations or forecasts of future events and include, among others:
| • |
statements with respect to the beliefs, plans, objectives, goals, guidelines, expectations, anticipations, and future financial condition, results of operations and performance of Zions Bancorporation (“the parent”) and its subsidiaries (collectively “the Company,” “Zions,” “we,” “our,” “us”); |
| • |
statements preceded by, followed by or that include the words “may,” “could,” “should,” “would,” “believe,” “anticipate,” “estimate,” “expect,” “intend,” “plan,” “projects,” or similar expressions. |
These forward-looking statements are not guarantees of future performance, nor should they be relied upon as representing management’s views as of any subsequent date. Forward-looking statements involve significant risks and uncertainties and actual results may differ materially from those presented, either expressed or implied, including, but not limited to, those presented in the Management’s Discussion and Analysis. Factors that might cause such differences include, but are not limited to:
| • |
the Company’s ability to successfully execute its business plans, manage its risks, and achieve its objectives; |
| • |
changes in political and economic conditions, including without limitation the political and economic effects of the current economic crisis, delay of recovery from the current economic crisis, and other major developments, including wars, military actions, and terrorist attacks; |
| • |
changes in financial market conditions, either internationally, nationally or locally in areas in which the Company conducts its operations, including without limitation reduced rates of business formation and growth, commercial and residential real estate development and real estate prices; |
| • |
fluctuations in markets for equity, fixed-income, commercial paper and other securities, including availability, market liquidity levels, and pricing; |
| • |
changes in interest rates, the quality and composition of the loan and securities portfolios, demand for loan products, deposit flows and competition; |
| • |
acquisitions and integration of acquired businesses; |
| • |
increases in the levels of losses, customer bankruptcies, bank failures, claims, and assessments; |
| • |
changes in fiscal, monetary, regulatory, trade and tax policies and laws, and regulatory assessments and fees, including policies of the U.S. Department of Treasury, the Board of Governors of the Federal Reserve Board System, and the FDIC; |
| • |
the Company’s participation or lack of participation in, or exit from, governmental programs implemented under the EESA and the ARRA, including without limitation the TARP and the CPP and the impact of such programs and related regulations on the Company and on international, national, and local economic and financial markets and conditions; |
| • |
the impact of the EESA and the ARRA and related rules and regulations, and changes in those rules and regulations, on the business operations and competitiveness of the Company and other participating American financial institutions, including the impact of the executive compensation limits of these acts, which may impact the ability of the Company and other American financial institutions to retain and recruit executives and other personnel necessary for their businesses and competitiveness; |
| • |
the impact of the financial reform bill, known as the Dodd-Frank Wall Street Reform and Consumer Protection Act, and rules and regulations thereunder, most of which have not yet been promulgated; |
3
Table of Contents
| • |
new capital and liquidity requirements, which U.S. regulatory agencies are expected to establish in response to new international standards known as Basel III; |
| • |
continuing consolidation in the financial services industry; |
| • |
new litigation or changes in existing litigation; |
| • |
success in gaining regulatory approvals, when required; |
| • |
changes in consumer spending and savings habits; |
| • |
increased competitive challenges and expanding product and pricing pressures among financial institutions; |
| • |
demand for financial services in the Company’s market areas; |
| • |
inflation and deflation; |
| • |
technological changes and the Company’s implementation of new technologies; |
| • |
the Company’s ability to develop and maintain secure and reliable information technology systems; |
| • |
legislation or regulatory changes which adversely affect the Company’s operations or business; |
| • |
the Company’s ability to comply with applicable laws and regulations; |
| • |
changes in accounting policies or procedures as may be required by the Financial Accounting Standards Board or regulatory agencies; and |
| • |
increased costs of deposit insurance and changes with respect to FDIC insurance coverage levels. |
Except to the extent required by law, the Company specifically disclaims any obligation to update any factors or to publicly announce the result of revisions to any of the forward-looking statements included herein to reflect future events or developments.
AVAILABILITY OF INFORMATION
We also make available free of charge on our website, www.zionsbancorporation.com , annual reports on Form 10-K, quarterly reports on Form 10-Q, and current reports on Form 8-K and amendments to those reports filed or furnished pursuant to Section 13(a) or 15(d) of the Securities Exchange Act of 1934, as well as proxy statements, as soon as reasonably practicable after we electronically file such material with, or furnish it to, the U.S. Securities and Exchange Commission.
GLOSSARY OF ACRONYMS
4
Table of Contents
5
Table of Contents
| ITEM 1. | BUSINESS |
DESCRIPTION OF BUSINESS
Zions Bancorporation (“the Parent”) is a financial holding company organized under the laws of the State of Utah in 1955, and registered under the Bank Holding Company Act of 1956, as amended (the “BHC Act”). The Parent and its subsidiaries (collectively “the Company”) own and operate eight commercial banks with a total of 495 domestic branches at year-end 2010. The Company provides a full range of banking and related services through its banking and other subsidiaries, primarily in Utah, California, Texas, Arizona, Nevada, Colorado, Idaho, Washington, and Oregon. Full-time equivalent employees totaled 10,524 at year-end 2010. For further information about the Company’s industry segments, see “Business Segment Results” on page 46 in MD&A and Note 22 of the Notes to Consolidated Financial Statements. For information about the Company’s foreign operations, see “Foreign Operations” on page 46 in MD&A. The “Executive Summary” on page 23 in MD&A provides further information about the Company.
PRODUCTS AND SERVICES
The Company focuses on providing community banking services by continuously strengthening its core business lines of 1) small and medium-sized business and corporate banking; 2) commercial and residential development, construction and term lending; 3) retail banking; 4) treasury cash management and related products and services; 5) residential mortgage; 6) trust and wealth management; and 7) investment activities. It operates eight different banks in ten Western and Southwestern states with each bank operating under a different name and each having its own board of directors, chief executive officer, and management team. The banks provide a wide variety of commercial and retail banking and mortgage lending products and services. They also provide a wide range of personal banking services to individuals, including home mortgages, bankcard, other installment loans, home equity lines of credit, checking accounts, savings accounts, time certificates of deposits of various types and maturities, trust services, safe deposit facilities, direct deposit, and 24-hour ATM access. In addition, certain banking subsidiaries provide services to key market segments through their Women’s Financial, Private Client Services, and Executive Banking Groups. We also offer wealth management services through a subsidiary, Contango, and online brokerage services through Zions Direct.
In addition to these core businesses, the Company has built specialized lines of business in capital markets and public finance, and is a leader in SBA lending. Through its eight banking subsidiaries, the Company provides SBA 7(a) loans to small businesses throughout the United States and is also one of the largest providers of SBA 504 financing in the nation. The Company owns an equity interest in the Farmer Mac and is one of the nation’s top originators of secondary market agricultural real estate mortgage loans through Farmer Mac. The Company is a leader in municipal finance advisory and underwriting services.
COMPETITION
The Company operates in a highly competitive environment. The Company’s most direct competition for loans and deposits comes from other commercial banks, thrifts, and credit unions, including institutions that do not have a physical presence in our market footprint but solicit via the Internet and other means. In addition, the Company competes with finance companies, mutual funds, brokerage firms, securities dealers, investment banking companies, and a variety of other types of companies. Many of these companies have fewer regulatory constraints and some have lower cost structures or tax burdens.
The primary factors in competing for business include pricing, convenience of office locations and other delivery methods, range of products offered, and the level of service delivered. The Company must compete effectively along all of these parameters to remain successful.
6
Table of Contents
SUPERVISION AND REGULATION
The banking and financial services business in which we engage is highly regulated. Such regulation is intended, among other things, to improve the stability of banking and financial companies and to protect the interests of customers, including depositors. These regulations are not, however, generally charged with protecting the interests of our shareholders or creditors. Described below are the material elements of selected laws and regulations applicable to the Company. The descriptions are not intended to be complete and are qualified in their entirety by reference to the full text of the statutes and regulations described. Changes in applicable law or regulations, and in their application by regulatory agencies, cannot be predicted, but they may have a material effect on the business and results of the Company.
The Parent is a bank holding company and a financial holding company as provided by the GLB. The BHC Act, and other federal statutes as modified by the GLB Act and the Dodd-Frank Act, provide the regulatory framework for bank holding companies and financial holding companies which have as their umbrella regulator the Federal Reserve Board. The functional regulation of the separately regulated subsidiaries of a bank holding company is conducted by each subsidiary’s primary functional regulator. To qualify for and maintain status as a financial holding company, the Parent and its subsidiary banks must satisfy certain ongoing criteria. The Company currently engages in only limited activities for which financial holding company status is required.
The Parent’s subsidiary banks are subject to the provisions of the National Bank Act or other statutes governing national banks and the banking laws of their various states, as well as the rules and regulations of the OCC, the FRB, and the FDIC. They are also under the supervision of, and are continually subject to periodic examination by, the OCC or their respective state banking departments, the FRB, and the FDIC. Many of our nonbank subsidiaries are also subject to regulation by the FRB and other applicable federal and state agencies. Our brokerage and investment advisory subsidiaries are regulated by the SEC, FINRA and/or state securities regulators.
The Dodd-Frank Act
The events of the past few years have led to numerous new laws in the United States and internationally for financial institutions. The Dodd-Frank Wall Street Reform and Consumer Protection Act (the “Dodd-Frank Act” or “Dodd-Frank”), which was enacted in July 2010, is one of the most far reaching legislative actions affecting the financial services industry in decades and significantly restructures the financial regulatory regime in the United States. Among other major things, it creates a new systemic risk oversight body, the FSOC. The FSOC will oversee and coordinate the efforts of the primary U.S. financial regulatory agencies (including the FRB, the SEC, the Commodity Futures Trading Commission and the FDIC) in establishing regulations to address financial stability concerns. The Dodd-Frank Act directs the FSOC to make recommendations to the FRB as to supervisory requirements and heightened prudential standards applicable to large bank holding companies, such as Zions, including capital, leverage, liquidity and risk-management requirements.
In addition, the Dodd-Frank Act broadly affects the financial services industry by creating a resolution authority, mandating higher capital and liquidity requirements and requiring banks to pay increased fees to regulatory agencies, and through numerous other provisions aimed at strengthening the sound operation of the financial services sector. Among other things affecting capital standards, the Dodd-Frank Act provides that:
| • |
the requirements applicable to large bank holding companies be more stringent than those applicable to other financial companies; |
| • |
standards applicable to bank holding companies be no less stringent than those applied to insured depository institutions; and |
| • |
bank regulatory agencies implement countercyclical elements in their capital requirements. |
These provisions will require us to maintain greater levels of capital and will limit the forms of capital that we will be able to rely upon for regulatory purposes. For example, provisions of the Dodd-Frank Act require us
7
Table of Contents
to deduct, over three years beginning July 21, 2011, all trust preferred securities from our Tier 1 capital. Some of the Act’s provisions affecting the fees we must pay to regulatory agencies and pricing of our products and services include:
| • |
changes in the assessment base for federal deposit insurance from the amount of insured deposits to consolidated assets less tangible capital, the elimination of the ceiling on the size of the DIF and an increase in the floor of the size of the DIF, which will generally increase the amount of assessments for depository institutions; |
| • |
a repeal of federal prohibitions on the payment of interest on business transaction accounts; and |
| • |
amendments to the EFTA, giving the FRB the authority to establish rules regarding interchange fees charged for electronic debit transactions by payment card issuers having assets over $10 billion and to enforce a new statutory standard that such fees be reasonable and proportional to the actual cost of a transaction to the issuer. |
The Dodd-Frank Act also creates a new CFPB, which will be responsible for promulgating regulations designed to protect consumers’ financial interests and examining financial institutions for compliance with, and enforcing, those regulations. The Dodd-Frank Act will subject national banks to further regulation by restricting the preemption of state laws by federal laws, which currently enables national banks and their subsidiaries to comply with federal regulatory requirements without complying with various state laws. In addition, the Act gives greater power to state attorneys general to pursue legal actions against banking organizations for violations of federal law.
As discussed further throughout this section, many aspects of Dodd-Frank are subject to further rulemaking and will take effect over several years, making it difficult to anticipate the overall financial impact on the Company or across the industry.
Capital Standards – Basel Framework
The FRB has established capital guidelines for financial holding companies. The OCC, the FDIC, and the FRB have also issued regulations establishing capital requirements for banks. These bank regulatory agencies’ risk-based capital guidelines are based upon the 1988 capital accord (“Basel I”) of the Basel Committee on Banking Supervision (the “BCBS”). The BCBS is a committee of central banks and bank supervisors/regulators from the major industrialized countries that develops broad policy guidelines that each country’s supervisors can use to determine the supervisory policies they apply.
In 2004, the BCBS proposed a new capital accord (“Basel II”) to replace Basel I. Basel II provides two approaches for setting capital standards for credit risk – an advanced internal ratings-based approach tailored to individual institutions’ circumstances and a standardized approach that bases risk weightings on external credit assessments to a much greater extent than permitted in existing guidelines. Basel II also sets capital requirements for operational risk and refines the existing capital requirements for market risk exposures.
In December 2007, U.S. banking regulators published the final rule for Basel II implementation, requiring banks with over $250 billion in consolidated total assets or on-balance sheet foreign exposure of $10 billion (core banks) to adopt the advanced approaches of Basel II while allowing other banks to elect to “opt in.” The Parent is not required to comply with the Basel II. In July 2008, the agencies issued a proposed rule that would give banking organizations that do not use the advanced approaches the option to implement a new risk-based capital framework which would adopt the standardized approach of Basel II for credit risk, the basic indicator approach of Basel II for operational risk and related disclosure requirements. A definitive rule has not been issued.
In December 2010, the BCBS released its final framework for strengthening international capital and liquidity regulation, now officially identified by the BCBS as “Basel III”. Basel III, when implemented by the
8
Table of Contents
U.S. banking agencies and fully phased-in, will require bank holding companies and their bank subsidiaries to maintain substantially more capital, with a greater emphasis on common equity. The Basel III final capital framework, among other things:
| • |
introduces as a new capital measure “Common Equity Tier 1” , or “CET1”, which specifies that Tier 1 capital consists of CET1 and “Additional Tier 1 capital” instruments meeting specified requirements, defines CET1 narrowly by requiring that most adjustments to regulatory capital measures be made to CET1 and not to the other components of capital, and expands the scope of the adjustments as compared to existing regulations; |
| • |
when fully phased in on January 1, 2019, requires banks to maintain: |
| • |
as a newly adopted international standard, a minimum ratio of CET1 to risk-weighted assets of at least 4.5%, plus a 2.5% “capital conservation buffer” (which is added to the 4.5% CET1 ratio as that buffer is phased in, effectively resulting in a minimum ratio of CET1 to risk-weighted assets of at least 7%); |
| • |
a minimum ratio of Tier 1 capital to risk-weighted assets of at least 6.0%, plus the capital conservation buffer (which is added to the 6.0% Tier 1 capital ratio as that buffer is phased in, effectively resulting in a minimum Tier 1 capital ratio of 8.5% upon full implementation); |
| • |
a minimum ratio of Total (that is, Tier 1 plus Tier 2) capital to risk-weighted assets of at least 8.0%, plus the capital conservation buffer (which is added to the 8.0% total capital ratio as that buffer is phased in, effectively resulting in a minimum total capital ratio of 10.5% upon full implementation); and |
| • |
as a newly adopted international standard, a minimum leverage ratio of 3%, calculated as the ratio of Tier 1 capital to balance sheet exposures plus certain off-balance sheet exposures (as the average for each quarter of the month-end ratios for the quarter); and |
| • |
provides for a “countercyclical capital buffer”, generally to be imposed when national regulators determine that excess aggregate credit growth becomes associated with a buildup of systemic risk, that would be a CET1 add-on to the capital conservation buffer in the range of 0% to 2.5% when fully implemented (potentially resulting in total buffers of between 2.5% and 5%). |
The capital conservation buffer is designed to absorb losses during periods of economic stress. Banking institutions with a ratio of CET1 to risk-weighted assets above the minimum but below the conservation buffer (or below the combined capital conservation buffer and countercyclical capital buffer, when the latter is applied) will face constraints on dividends, equity repurchases and compensation based on the amount of the short fall.
The implementation of the Basel III final framework is expected to commence January 1, 2013. On that date, banking institutions will be required to meet the following minimum capital ratios:
| • |
3.5% CET1 to risk-weighted assets; |
| • |
4.5% Tier 1 capital to risk-weighted assets; and |
| • |
8.0% Total capital to risk-weighted assets. |
The Basel III final framework provides for a number of new deductions from and adjustments to CET1. These include, for example, the requirement that mortgage servicing rights, deferred tax assets dependent upon future taxable income and significant investments in non-consolidated financial entities be deducted from CET1 to the extent that any one such category exceeds 10% of CET1 or all such categories in the aggregate exceed 15% of CET1. Implementation of the deductions and other adjustments to CET1 will begin on January 1, 2014 and will be phased-in over a five-year period (20% per year). The implementation of the capital conservation buffer will begin on January 1, 2016 at 0.625% and will be phased in over a four-year period (increasing by that amount on each subsequent January 1, until it reaches 2.5% on January 1, 2019).
9
Table of Contents
The U.S. banking agencies have indicated informally that they expect to propose regulations implementing Basel III in mid-2011 with final adoption of implementing regulations in mid-2012. Given that the Basel III rules are subject to change, and the scope and content of capital regulations that the U.S. banking agencies may adopt under Dodd-Frank is uncertain, we cannot be certain of the impact new capital regulations will have on our capital ratios.
Historically, regulation and monitoring of bank and bank holding company liquidity has been addressed as a supervisory matter, both in the U.S. and internationally, without required formulaic measures. The Basel III framework proposes that banks and bank holding companies measure their liquidity against specific liquidity tests that, although similar in some respects to liquidity measures historically applied by banks and regulators for management and supervisory purposes, going forward will be required by regulation. One proposed test, referred to as the LCR, would be designed to ensure that the banking entity maintains an adequate level of unencumbered high-quality liquid assets equal to the entity’s expected net cash outflow for a 30-day time horizon (or, if greater, 25% of its expected total cash outflow) under an acute liquidity stress scenario. The other measure, referred to as the NSFR, would be designed to promote more medium- and long-term funding of the assets and activities of banking entities over a one-year time horizon. These requirements will incent banking entities to increase their holdings of U.S. Treasury securities and other sovereign debt as a component of assets and increase the use of long-term debt as a funding source. The LCR would be implemented subject to an observation period beginning in 2011, but would not be introduced as a requirement until January 1, 2015, and the NSFR would not be introduced as a requirement until January 1, 2018. These new standards are subject to further rulemaking and their terms may well change before implementation.
Other Regulation
The Company is subject to a wide range of other requirements and restrictions contained in both the laws of the United States and the states in which its banks and other subsidiaries operate. These regulations include but are not limited to the following:
| • |
Laws and regulations regarding the availability, requirements and restrictions of a number of recently enacted governmental programs in which the Company participates. These programs include, without limitation, the TARP and its associated CPP, as well as certain requirements and limitations imposed by the EESA and ARRA and programs and regulations thereunder, including without limitation, limitations on dividends on common stock in the CPP, and on executive compensation contained in the EESA, ARRA, and the Dodd-Frank Act. One of these programs, the CPP, contains provisions that allow the U.S. Government to unilaterally modify any term or provision of contracts executed under the program. |
| • |
Requirements for approval of acquisitions and activities. Prior approval is required, in accordance with the BHC Act of the FRB, for a financial holding company to acquire or hold more than a 5% voting interest in any bank. The BHC Act also requires approval for certain nonbanking acquisitions and restricts the Company’s nonbanking activities to those that are permitted for financial holding companies or that have been determined by the FRB to be financial in nature, incidental to financial activities, or complementary to a financial activity. |
| • |
Requirements that the Parent serve as a source of strength for its banking subsidiaries. The FRB has a policy that a bank holding company is expected to act as a source of financial and managerial strength to each of its bank subsidiaries and, under appropriate circumstances, to commit resources to support each subsidiary bank. The Dodd-Frank Act codifies this policy as a statutory requirement. In addition, the OCC may order an assessment of the Parent if the capital of one of its national bank subsidiaries were to fall below capital levels required by the regulators. |
| • |
Limitations on dividends payable by subsidiaries. A substantial portion of the Parent’s cash, which is used to pay dividends on our common and preferred stock and to pay principal and interest on our debt obligations, is derived from dividends paid by the Parent’s subsidiary banks. These dividends are subject to various legal and regulatory restrictions. See Note 19 of the Notes to Consolidated Financial Statements. |
10
Table of Contents
| • |
Limitations on dividends payable to shareholders. The Parent’s ability to pay dividends on both its common and preferred stock may be subject to regulatory restrictions. See discussion under “Liquidity Management Actions” on page 80. |
| • |
Cross-guarantee requirements. All of the Parent’s subsidiary banks are insured by the FDIC. Each commonly controlled FDIC-insured bank can be held liable for any losses incurred, or reasonably expected to be incurred, by the FDIC due to another commonly controlled FDIC-insured bank being placed into receivership, and for any assistance provided by the FDIC to another commonly controlled FDIC-insured bank that is subject to certain conditions indicating that receivership is likely to occur in the absence of regulatory assistance. |
| • |
Safety and soundness requirements. Federal and state laws require that our banks be operated in a safe and sound manner. We are subject to additional safety and soundness standards prescribed in the Federal Deposit Insurance Corporate Improvement Act of 1991, including standards related to internal controls, information systems, internal audit, loan documentation, credit underwriting, interest rate exposure, asset growth and compensation, as well as other operational and management standards deemed appropriate by the federal banking agencies. |
| • |
Limitations on the amount of loans to a borrower and its affiliates. |
| • |
Limitations on transactions with affiliates. The Dodd-Frank Act significantly expands the coverage and scope of the limitations on affiliate transactions within a banking organization. |
| • |
Restrictions on the nature and amount of any investments and ability to underwrite certain securities. |
| • |
Requirements for opening of branches and the acquisition of other financial entities. |
| • |
Fair lending and truth in lending requirements to provide equal access to credit and to protect consumers in credit transactions. |
| • |
Broker-dealer regulations. Certain of our subsidiaries are broker-dealers that engage in securities underwriting and other broker-dealer activities. These companies are registered with the SEC and are members of FINRA. |
| • |
Investment advisory regulations. Certain of our subsidiaries are registered investment advisers under the Investment Advisers Act of 1940, as amended, and as such are supervised by the SEC. They are also subject to various U.S. Federal and state laws and regulations. These laws and regulations generally grant supervisory agencies broad administrative powers, including the power to limit or restrict the carrying on of business for failure to comply with such laws. |
| • |
Provisions of the GLB Act and other federal and state laws dealing with privacy for nonpublic personal information of individual customers. |
| • |
CRA requirements. The CRA requires banks to help serve the credit needs in their communities, including credit to low and moderate income individuals. If the Company or its subsidiaries fail to adequately serve their communities, penalties may be imposed including denials of applications to add branches, relocate, add subsidiaries and affiliates, and merge with or purchase other financial institutions. |
| • |
Anti-money laundering regulations. BSA and other federal laws require financial institutions to assist U.S. Government agencies to detect and prevent money laundering. Specifically, the BSA requires financial institutions to keep records of cash purchases of negotiable instruments, file reports of cash transactions exceeding $10,000 (daily aggregate amount), and to report suspicious activity that might signify money laundering, tax evasion, or other criminal activities. Title III of the Uniting and Strengthening of America by Providing Appropriate Tools Required to Intercept and Obstruct Terrorism Act of 2001 (“USA Patriot Act”) substantially broadens the scope of U.S. anti-money laundering laws and regulations by imposing significant new compliance and due diligence obligations, defining new crimes and related penalties, and expanding the extra-territorial jurisdiction of the United |
11
Table of Contents
|
States. The U.S. Treasury Department has issued a number of implementing regulations, which apply various requirements of the USA Patriot Act to financial institutions. The Company’s bank and broker-dealer subsidiaries and private investment companies advised or sponsored by the Company’s subsidiaries must comply with these regulations. These regulations also impose obligations on financial institutions to maintain appropriate policies, procedures and controls designed to detect, prevent and report money laundering and terrorist financing. |
The Parent is subject to the disclosure and regulatory requirements of the Securities Act of 1933, as amended, and the Securities Exchange Act of 1934, as amended, both as administered by the SEC. As a company listed on the NASDAQ Global Select Market, the Parent is subject to NASDAQ listing standards for quoted companies.
The Company is subject to the Sarbanes-Oxley Act of 2002, which addresses, among other issues, corporate governance, auditing and accounting, executive compensation, and enhanced and timely disclosure of corporate information. Nasdaq has also adopted corporate governance rules, which are intended to allow shareholders and investors to more easily and efficiently monitor the performance of companies and their directors.
The Board of Directors of the Parent has implemented a comprehensive system of corporate governance practices. This system includes Corporate Governance Guidelines, a Code of Business Conduct and Ethics for Employees, a Directors Code of Conduct, and charters for the Audit, Credit Review, Compensation, and Nominating and Corporate Governance Committees. More information on the Company’s corporate governance practices is available on the Company’s website at www.zionsbancorporation.com . (The Company’s website is not part of this Annual Report on Form 10-K.)
The Company has adopted policies, procedures and controls to address compliance with the requirements of the banking, securities and other laws and regulations described above or otherwise applicable to the Company. The Company intends to make appropriate revisions to reflect any changes required.
Regulators, Congress, state legislatures and international consultative bodies continue to enact rules, laws, and policies to regulate the financial services industry and public companies and to protect consumers and investors. The nature of these laws and regulations and the effect of such policies on future business and earnings of the Company cannot be predicted.
GOVERNMENT MONETARY POLICIES
The earnings and business of the Company are affected not only by general economic conditions, but also by policies adopted by various governmental authorities. The Company is particularly affected by the monetary policies of the FRB, which affect both short-term and long-term interest rates and the national supply of bank credit. The tools available to the FRB which may be used to implement monetary policy include:
| • |
open-market operations in U.S. Government and other securities; |
| • |
adjustment of the discount rates or cost of bank borrowings from the FRB; |
| • |
imposing or changing reserve requirements against bank deposits; |
| • |
term auction facilities collateralized by bank loans; and |
| • |
other programs to purchase assets and inject liquidity directly in various segments of the economy. |
These methods are used in varying combinations to influence the overall growth or contraction of bank loans, investments and deposits, and the interest rates charged on loans or paid for deposits.
In view of the changing conditions in the economy and the effect of the FRB’s monetary policies, it is difficult to predict future changes in loan demand, deposit levels and interest rates, or their effect on the business and earnings of the Company. FRB monetary policies have had a significant effect on the operating results of commercial banks in the past and are expected to continue to do so in the future.
12
Table of Contents
| ITEM 1A. | RISK FACTORS |
The following list describes several risk factors which are significant to the Company including but not limited to:
The Company has been and could continue to be negatively affected by adverse economic conditions.
The United States and many other countries recently faced a severe economic crisis, including a major recession. These adverse economic conditions have negatively affected, and are likely to continue for some time to adversely affect, the Company’s assets, including its loans and securities portfolios, capital levels, results of operations, and financial condition. In response to the economic crisis, the United States and other governments established a variety of programs and policies designed to mitigate the effects of the crisis. These programs and policies appear to have stabilized the severe financial crisis that occurred in the second half of 2008, but the extent to which these programs and policies will assist in an economic recovery or may lead to adverse consequences, whether anticipated or unanticipated, is still unclear. If these programs and policies are ineffective in bringing about an economic recovery or result in substantial adverse developments, the economic conditions may again become more severe, or adverse economic conditions may continue for a substantial period of time. Any increase in the severity or duration of adverse economic conditions, including a double dip recession or delay in the recovery, would adversely affect the Company.
The limitations on incentive compensation contained in the ARRA, the implementing of its regulations, and other bank regulations may adversely affect our ability to retain our highest performing employees.
Because we have not yet repurchased the U.S. Treasury’s CPP investment, we remain subject to the restrictions on incentive compensation contained in the ARRA. On June 10, 2009, the U.S. Treasury released its interim final rules implementing the provisions of the ARRA and limiting the compensation practices at institutions in which the U.S. Treasury is invested. The U.S. Treasury has since revised such rules and released written guidance interpreting and expanding on ARRA and the interim final rules. Financial institutions which have repurchased the U.S. Treasury’s CPP investment are relieved of the restrictions imposed by the ARRA and its implementing regulations and related guidance. Due to these restrictions, we may not be able to successfully compete with financial institutions that have repurchased the U.S. Treasury’s investment to attract, retain and appropriately incentivize high performing employees. In addition, bank regulatory agencies have published guidance and proposed regulations which limit the manner and amount of compensation that banking organizations provide to employees. These regulations and guidance may adversely affect our ability to retain key personnel. If we were to suffer such adverse effects with respect to our employees, our business, financial condition and results of operations could be adversely affected, perhaps materially.
Our participation in the CPP and other government programs imposes restrictions and obligations on us that limit our ability to increase dividends, repurchase shares of our stock, and access the equity capital markets.
The Company has chosen to participate in a number of new programs sponsored by the U.S. Government during the current financial and economic crisis. These programs, including without limitation, the TARP and its associated CPP, as well as the ARRA and EESA and regulations thereunder, contain important limitations on the Company’s conduct of its business, including limitations on dividends, repurchases of common stock, acquisitions, and executive compensation. These limitations may adversely impact the Company’s ability to attract nongovernmental capital and to recruit and retain executive management and other personnel and its ability to compete with other American and foreign financial institutions. One of these programs, the CPP, contains provisions that allow the U.S. Government to unilaterally modify any term or provision of contracts executed under the program.
13
Table of Contents
Recently adopted financial reform legislation will impose significant new limitations on our business activities and subject us to increased regulation and additional costs.
The Dodd-Frank Wall Street Reform and Consumer Protection Act enacted on July 21, 2010 will have material implications for the Company and the entire financial services industry. The Act results in the Company being defined as “systemically important,” which brings significant additional regulatory oversight and requirements. In addition, among other things, the Act will or potentially could:
| • |
Affect the levels of capital and liquidity with which the Company must operate and how it plans capital and liquidity levels (including a phased-in elimination of the Company’s existing trust preferred securities as Tier 1 capital); |
| • |
Subject the Company to new and/or higher fees paid to various regulatory entities, including but not limited to deposit insurance fees to the FDIC; |
| • |
Impact the Company’s ability to invest in certain types of entities or engage in certain activities; |
| • |
Impact a number of the Company’s business and risk management strategies; |
| • |
Regulate the pricing of certain of our products and services and restrict the revenue that the Company generates from certain businesses; |
| • |
Subject the Company to new capital planning actions, including stress testing or similar actions and timing expectations for capital-raising; |
| • |
Subject the Company to a new Consumer Financial Protection Bureau, with very broad rule-making and enforcement authorities; |
| • |
Grant authority to state agencies to enforce state and federal laws against national banks; |
| • |
Subject the Company to new and different litigation and regulatory enforcement risks; and |
| • |
Limit the amount and manner of compensation paid to executive officers and employees generally. |
As the Act requires that many studies be conducted and that hundreds of regulations be written in order to fully implement it, the full impact of this legislation on the Company, its business strategies, and financial performance cannot be known at this time, and may not be known for a number of years. In addition, the current political environment may lead, in the near future, to the adoption of new laws and regulations affecting financial institutions.
U.S. regulatory agencies, in response to the adoption of Basel III, may require us to raise our capital and liquidity to levels that may exceed those that the market may otherwise consider to be optimal.
Basel III was adopted in December 2010 by the BCBS. New capital and liquidity requirements are expected to be established by U.S. regulatory agencies in response to Basel III which are higher than previous levels. Maintaining higher capital and liquidity levels may reduce our profitability and performance measures.
Economic and other circumstances, including pressure to repay CPP preferred stock, may require us to raise capital at times or in amounts that are unfavorable to the Company.
The Company’s subsidiary banks must maintain certain risk-based and leverage capital ratios as required by their banking regulators which can change depending upon general economic conditions and their particular condition, risk profile and growth plans. Compliance with capital requirements may limit the Company’s ability to expand and has required, and may require, capital investment from the Parent. In 2008, we issued shares of preferred stock and a warrant to purchase shares of the Company’s common stock to the U.S. Treasury for $1.4 billion under TARP. There may be increasing market, regulatory or political pressure on the
14
Table of Contents
Company to raise capital to enable it to repay the preferred stock issued to the U.S. Treasury under TARP at a time or in amounts that may be unfavorable to the Company’s shareholders. These uncertainties and risks created by the legislative and regulatory uncertainties discussed above may themselves increase the Company’s cost of capital and other financing costs.
Negative perceptions associated with our continued participation in the U.S. Treasury’s CPP may adversely affect our ability to retain customers, attract investors, and compete for new business opportunities.
Several financial institutions which also participated in the CPP have repurchased their TARP preferred stock. There can be no assurance as to the timing or manner in which the Company may repurchase its Series D Preferred Stock from the U.S. Treasury. Our customers, employees and counterparties in our current and future business relationships could draw negative implications regarding the strength of the Company as a financial institution based on our continued participation in the CPP following the exit of one or more of our competitors or other financial institutions. Any such negative perceptions could impair our ability to effectively compete with other financial institutions for business or to retain high performing employees. If this were to occur, our business, financial condition, and results of operations may be adversely affected.
Credit quality has adversely affected us and may continue to adversely affect us.
Credit risk is one of our most significant risks. The Company’s credit quality continued at a weakened level during 2010 in most loan types and markets in which the Company operates. Although most credit quality indicators improved during latter half of 2010, we expect continued credit quality weakness over the next few quarters.
Weakness in the economy and in the real estate market, including specific weakness within the markets where our subsidiary banks do business and within certain of our loan products, has adversely affected us and may continue to adversely affect us.
Our credit exposure is one of our most significant risks. The company’s level of problem credits remained high as of December 31, 2010. The deterioration in credit quality that started in the latter half of 2007 has most significantly affected the construction and land development segment of our portfolio. Although virtually all of our markets and lending segments have been adversely affected by the economic recession, the distress has been mostly concentrated in construction and land development loans in the Southwest states (generally, Arizona, California, and Nevada), which markets have been particularly adversely affected by job losses, declines in residential and commercial sale volumes and real estate values, and declines in new construction activity.
Subsequent to the initial deterioration in construction and land development loans, credit quality deterioration occurred in most loan types and geographies in which the Company operated through the first half of 2010 as general economic conditions weakened throughout the country.
If the strength of the U.S. economy in general and the strength of the local economies in which we and our subsidiary banks conduct operations decline further, this could result in, among other things, further deterioration in credit quality and/or continued reduced demand for credit, including a resultant adverse effect on the income from our loan portfolio, an increase in charge-offs and an increase in the allowance for loan and lease losses; if such developments occur, we may be required to raise additional capital.
Failure to effectively manage our interest rate risk could adversely affect us.
Net interest income is the largest component of the Company’s revenue. The management of interest rate risk for the Company and all bank subsidiaries is centralized and overseen by an Asset Liability Management Committee appointed by the Company’s Board of Directors. We have been successful in our interest rate risk
15
Table of Contents
management as evidenced by achieving a relatively stable net interest margin over the last several years when interest rates have been volatile and the rate environment challenging; however, a failure to effectively manage our interest rate risk could adversely affect us. Factors beyond the Company’s control can significantly influence the interest rate environment and increase the Company’s risk. These factors include competitive pricing pressures for our loans and deposits, adverse shifts in the mix of deposits and other funding sources, and volatile market interest rates subject to general economic conditions and the policies of governmental and regulatory agencies, in particular the FRB.
Our ability to maintain required capital levels and adequate sources of funding and liquidity has been and may continue to be adversely affected by market conditions.
We are required to maintain certain capital levels in accordance with banking regulations and any capital requirements imposed by our regulators. We must also maintain adequate funding sources in the normal course of business to support our operations and fund outstanding liabilities. Our ability to maintain capital levels, sources of funding, and liquidity has been and could continue to be impacted by changes in the capital markets in which we operate and deteriorating economic and market conditions.
Each of our subsidiary banks must remain well-capitalized and meet certain other requirements for us to retain our status as a financial holding company. Failure to comply with those requirements could result in a loss of our financial holding company status if such conditions are not corrected within 180 days or such longer period as may be permitted by the Federal Reserve, although we do not believe that the loss of such status would have an appreciable effect on our operations or financial results. In addition, failure by our bank subsidiaries to meet applicable capital guidelines or to satisfy certain other regulatory requirements can result in certain activity restrictions or a variety of enforcement remedies available to the federal regulatory authorities that include limitations on the ability to pay dividends, the issuance by the regulatory authority of a capital directive to increase capital and the termination of deposit insurance by the FDIC.
Funding availability improved during 2010 as compared to 2009, as the Company took a number of actions during the year to augment its capital and liquidity. More emphasis was placed upon low-cost funding during 2010 than merely funding availability (See “Capital Management” on page 84 in MD&A and Notes 12 and 13 of the Notes to Consolidated Financial Statements for further information on funding availability). However, because liquidity stresses are often a consequence of the materialization of other risks, they will continue to be a risk factor in 2011 and beyond for the Company, the Parent and its affiliate banks.
The quality and liquidity of our asset-backed investment securities portfolio has adversely affected us and may continue to adversely affect us.
The Company’s asset-backed investment securities portfolio includes CDOs collateralized by trust preferred securities issued by banks, insurance companies, and REITs that may have some exposure to construction loan, commercial real estate, and the subprime markets and/or to other categories of distressed assets. In addition, asset-backed securities also include structured asset-backed CDOs (also known as diversified structured finance CDOs) which have exposure to subprime and home equity mortgage securitizations. Factors beyond the Company’s control can significantly influence the fair value and impairment status of these securities. These factors include, but are not limited to, defaults, deferrals, and restructurings by debt issuers, rating agency downgrades of securities, lack of market pricing of securities, or the return of market pricing that varies from the Company’s current model valuations, and changes in prepayment rates and future interest rates. See “Investment Securities Portfolio” on page 52 for further details.
We have been unprofitable and may continue to be unprofitable, and such lack of profitability could have particular adverse effects on us, such as restricting our ability to pay dividends or requiring a valuation allowance against our deferred tax asset.
We are a holding company that conducts substantially all of its operations through its banking and other subsidiaries. As a result, our ability to make dividend payments on our common stock will depend primarily
16
Table of Contents
upon the receipt of dividends and other distributions from our subsidiaries. We and certain of our subsidiaries have been unprofitable during the last three annual reporting periods. During 2009 and 2010, the noncash accelerated amortization expense caused by subordinated debt holders converting their debt to preferred stock has contributed to our unprofitability. Future conversions of subordinated debt into preferred stock may continue to contribute to unprofitability. The ability of the Company and our subsidiary banks to pay dividends is restricted by regulatory requirements, including profitability and the need to maintain required levels of capital. Continuing lack of profitability exposes us to the risk that regulators could restrict the ability of our subsidiary banks to pay dividends and our ability to declare and pay dividends on our common stock, preferred stock or trust preferred securities. It also increases the risk that the Company may have to establish a “valuation allowance” against its net DTA. The Parent and some of its subsidiary banks already have some disallowed DTA for regulatory capital purposes.
We and/or the holders of our securities could be adversely affected by unfavorable rating actions from rating agencies.
Our ability to access the capital markets is important to our overall funding profile. This access is affected by the ratings assigned by rating agencies to us, certain of our affiliates, and particular classes of securities that we and our affiliates issue. The interest rates that we pay on our securities are also influenced by, among other things, the credit ratings that we, our affiliates, and/or our securities receive from recognized rating agencies. In the past, rating agencies have downgraded our credit ratings. Further downgrades to us, our affiliates, or our securities could increase our costs or otherwise have a negative effect on our results of operations or financial condition or the market prices of our securities.
We could be adversely affected by accounting, financial reporting, and regulatory and compliance risk.
The Company is exposed to accounting, financial reporting, and regulatory/compliance risk. The Company provides to its customers, and uses for its own capital, funding and risk management needs, a number of complex financial products and services. Estimates, judgments and interpretations of complex and changing accounting and regulatory policies are required in order to provide and account for these products and services. Identification, interpretation and implementation of complex and changing accounting standards as well as compliance with regulatory requirements, therefore pose an ongoing risk.
We could be adversely affected by legal and governmental proceedings.
The Company is subject to risks associated with legal claims, fines, litigation, and regulatory proceedings. The Company’s exposure to these proceedings has increased and may further increase as a result of stresses on customers, counterparties and others arising from the current economic environment; new regulations promulgated under recently adopted statutes; and the creation of new examination and enforcement bodies.
We could be adversely affected by failure in our internal controls.
A failure in our internal controls could have a significant negative impact not only on our earnings, but also on the perception that customers, regulators and investors may have of the Company. We continue to devote a significant amount of effort, time and resources to improving our controls and ensuring compliance with complex accounting standards and regulations.
We could be adversely affected as a result of acquisitions.
From time to time the Company makes acquisitions including the acquisition of assets and liabilities of failed banks from the FDIC acting as a receiver. The FDIC-supported transactions are subject to loan loss sharing agreements. Failure to comply with the terms of the agreements could result in the loss of indemnification from the FDIC. The success of any acquisition depends, in part, on our ability to realize the projected cost
17
Table of Contents
savings from the acquisition and on the continued growth and profitability of the acquisition target. We have been successful with most prior acquisitions, but it is possible that the merger integration process with an acquired company could result in the loss of key employees, disruptions in controls, procedures and policies, or other factors that could affect our ability to realize the projected savings and successfully retain and grow the target’s customer base.
The Company’s Board of Directors has established an Enterprise Risk Management policy and has appointed an Enterprise Risk Management Committee to oversee and implement the policy. In addition to credit and interest rate risk, the Committee also monitors the following risk areas: market risk, liquidity risk, operational risk, compliance risk, information technology risk, strategic risk, compensation-related risk, and reputation risk.
| ITEM 1B. | UNRESOLVED STAFF COMMENTS |
There are no unresolved written comments that were received from the SEC’s staff 180 days or more before the end of the Company’s fiscal year relating to our periodic or current reports filed under the Securities Exchange Act of 1934.
| ITEM 2. | PROPERTIES |
At December 31, 2010, the Company operated 495 domestic branches, of which 287 are owned and 208 are leased. The Company also leases its headquarters offices in Salt Lake City, Utah. Other operations facilities are either owned or leased. The annual rentals under long-term leases for leased premises are determined under various formulas and factors, including operating costs, maintenance, and taxes. For additional information regarding leases and rental payments, see Note 18 of the Notes to Consolidated Financial Statements.
| ITEM 3. | LEGAL PROCEEDINGS |
The information contained in Note 18 of the Notes to Consolidated Financial Statements is incorporated by reference herein.
18
Table of Contents
| ITEM 5. | MARKET FOR REGISTRANT’S COMMON EQUITY, RELATED STOCKHOLDER MATTERS AND ISSUER PURCHASES OF EQUITY SECURITIES |
MARKET INFORMATION
The Company’s common stock is traded on the Nasdaq Global Select Market under the symbol “ZION.” The last reported sale price of the common stock on Nasdaq on February 16, 2011 was $24.63 per share.
The following table sets forth, for the periods indicated, the high and low sale prices of the Company’s common stock, as quoted on Nasdaq:
| 2010 | 2009 | |||||||||||||||
| High | Low | High | Low | |||||||||||||
|
1st Quarter |
$ | 23.85 | $ | 12.88 | $ | 25.52 | $ | 5.90 | ||||||||
|
2nd Quarter |
30.29 | 21.22 | 20.97 | 8.88 | ||||||||||||
|
3rd Quarter |
24.39 | 17.91 | 20.36 | 10.25 | ||||||||||||
|
4th Quarter |
24.58 | 18.84 | 19.03 | 12.50 | ||||||||||||
During 2010 the Company issued $633.3 million of new common stock consisting of 29.6 million shares at an average price of $21.43 per share. Net of commissions and fees, the issuances added $623.5 million to common stock. We also issued 29.3 million common stock warrants during 2010 adding $214.6 million to common stock. Each and all of the warrants can be exercised for a share of common stock at an initial price of $36.63 through May 22, 2020. See Note 14 of the Notes to Consolidated Financial Statements for further information regarding equity transactions during 2010.
As of February 16, 2011, there were 6,068 holders of record of the Company’s common stock.
EQUITY CAPITAL AND DIVIDENDS
We have 4,400,000 authorized shares of preferred stock without par value and with a liquidation preference of $1,000 per share. As of December 31, 2010, 59,440, 453,237, 1,400,000, and 142,500 of preferred shares series A, C, D and E, respectively, have been issued and are outstanding. In addition, holders of $0.8 billion of the Company’s subordinated debt have the right to convert that debt into either Series A or C preferred stock. In general, preferred shareholders may receive asset distributions before common shareholders; however, preferred shareholders have only limited voting rights generally with respect to certain provisions of the preferred stock, the issuance of senior preferred stock, and the election of directors. Preferred stock dividends reduce earnings available to common shareholders and are paid quarterly in arrears. The redemption amount is computed at the per share liquidation preference plus any declared but unpaid dividends. The series A, C, and E shares are registered with the SEC. The Series D Fixed-Rate Cumulative Perpetual Preferred Stock was issued on November 14, 2008 to the U.S. Department of the Treasury for $1.4 billion in a private placement exempt from registration. See Note 14 of the Notes to Consolidated Financial Statements for further information regarding the Company’s preferred stock.
The frequency and amount of common stock dividends paid during the last two years are as follows:
| 1 st Quarter | 2 nd Quarter | 3 rd Quarter | 4 th Quarter | |||||||||||||
|
2010 |
$ | 0.01 | $ | 0.01 | $ | 0.01 | $ | 0.01 | ||||||||
|
2009 |
0.04 | 0.04 | 0.01 | 0.01 | ||||||||||||
19
Table of Contents
The Company’s Board of Directors approved a dividend of $0.01 per common share payable on February 28, 2011 to shareholders of record on February 22, 2011. The Company expects to continue its policy of paying regular cash dividends on a quarterly basis, although there is no assurance as to future dividends because they depend on future earnings, capital requirements, and financial condition.
The Company cannot increase the common stock dividend above $0.32 per share without the consent of the U.S. Treasury until the third anniversary of the date of the investment, or November 14, 2011, unless prior to such third anniversary the senior preferred stock series D is redeemed in whole or the U.S. Treasury has transferred all of the senior preferred stock series D to third parties.
SECURITIES AUTHORIZED FOR ISSUANCE UNDER EQUITY COMPENSATION PLANS
The information contained in Item 12 of this Form 10-K is incorporated by reference herein.
SHARE REPURCHASES
The following table summarizes the Company’s share repurchases for the fourth quarter of 2010:
|
Period |
Total number
of shares repurchased 1 |
Average
price paid per share |
Total number of shares
purchased as part of publicly announced plans or programs |
Approximate dollar
value of shares that may yet be purchased under the plan |
||||||||||||
|
October |
242 | $ | 21.25 | – | $ | – | ||||||||||
|
November |
404 | 19.99 | – | – | ||||||||||||
|
December |
12,188 | 23.04 | – | – | ||||||||||||
|
Fourth quarter |
12,834 | 22.91 | – | |||||||||||||
| 1 |
Represents common shares acquired from employees in connection with the Company’s stock compensation plan. Shares were acquired from employees to pay for their payroll taxes upon the vesting of restricted stock under the “withholding shares” provision of an employee share-based compensation plan. |
The Company has not repurchased any shares under the Common Stock Repurchase Plan since August 16, 2007. It is prohibited from repurchasing any common shares through an authorized share repurchase program by terms of the CPP until the Company’s Series D preferred stock has been fully repaid or the U.S. Treasury otherwise ceases to own any such preferred stock.
20
Table of Contents
PERFORMANCE GRAPH
The following stock performance graph compares the five-year cumulative total return of Zions Bancorporation’s common stock with the Standard & Poor’s 500 Index and the KBW Bank Index which include Zions Bancorporation. The KBW Bank Index is a market capitalization-weighted bank stock index developed and published by Keefe, Bruyette & Woods, Inc., a nationally recognized brokerage and investment banking firm specializing in bank stocks. The index is composed of 24 geographically diverse stocks representing national money center banks and leading regional financial institutions. The stock performance graph is based upon an initial investment of $100 on December 31, 2005 and assumes reinvestment of dividends.
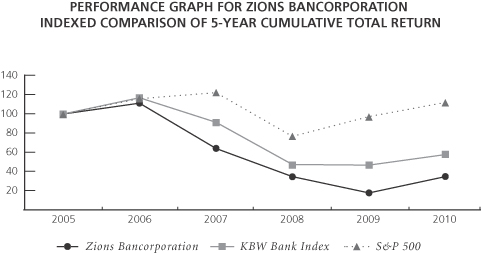
| 2005 | 2006 | 2007 | 2008 | 2009 | 2010 | |||||||||||||||||||
|
Zions Bancorporation |
100.0 | 111.1 | 64.4 | 35.4 | 18.7 | 35.3 | ||||||||||||||||||
|
KBW Bank Index |
100.0 | 117.0 | 91.5 | 48.0 | 47.2 | 58.3 | ||||||||||||||||||
|
S&P 500 |
100.0 | 115.8 | 122.1 | 77.0 | 97.3 | 112.0 | ||||||||||||||||||
21
Table of Contents
| ITEM 6. | SELECTED FINANCIAL DATA |
FINANCIAL HIGHLIGHTS
| (In millions, except per share amounts) |
2010/2009
Change |
2010 | 2009 | 2008 | 2007 | 2006 | ||||||||||||||||||
|
For the Year |
||||||||||||||||||||||||
|
Net interest income |
-9 | % | $ | 1,727.4 | $ | 1,897.5 | $ | 1,971.6 | $ | 1,882.0 | $ | 1,764.7 | ||||||||||||
|
Noninterest income |
-45 | % | 440.5 | 804.1 | 190.7 | 412.3 | 551.2 | |||||||||||||||||
|
Total revenue |
-20 | % | 2,167.9 | 2,701.6 | 2,162.3 | 2,294.3 | 2,315.9 | |||||||||||||||||
|
Provision for loan losses |
-58 | % | 852.1 | 2,016.9 | 648.3 | 152.2 | 72.6 | |||||||||||||||||
|
Noninterest expense |
+3 | % | 1,718.9 | 1,671.5 | 1,475.0 | 1,404.6 | 1,330.4 | |||||||||||||||||
|
Impairment loss on goodwill |
-100 | % | – | 636.2 | 353.8 | – | – | |||||||||||||||||
|
Income (loss) before income taxes |
+75 | % | (403.1 | ) | (1,623.0 | ) | (314.8 | ) | 737.5 | 912.9 | ||||||||||||||
|
Income taxes (benefit) |
+73 | % | (106.8 | ) | (401.3 | ) | (43.4 | ) | 235.8 | 318.0 | ||||||||||||||
|
Net income (loss) |
+76 | % | (296.3 | ) | (1,221.7 | ) | (271.4 | ) | 501.7 | 594.9 | ||||||||||||||
|
Net income (loss) applicable to noncontrolling interests |
+36 | % | (3.6 | ) | (5.6 | ) | (5.1 | ) | 8.0 | 11.8 | ||||||||||||||
|
Net income (loss) applicable to controlling interest |
+76 | % | (292.7 | ) | (1,216.1 | ) | (266.3 | ) | 493.7 | 583.1 | ||||||||||||||
|
Net earnings (loss) applicable to common shareholders |
+67 | % | (412.5 | ) | (1,234.4 | ) | (290.7 | ) | 479.4 | 579.3 | ||||||||||||||
|
Per Common Share |
||||||||||||||||||||||||
|
Net earnings (loss) – diluted |
+75 | % | (2.48 | ) | (9.92 | ) | (2.68 | ) | 4.40 | 5.35 | ||||||||||||||
|
Net earnings (loss) – basic |
+75 | % | (2.48 | ) | (9.92 | ) | (2.68 | ) | 4.45 | 5.45 | ||||||||||||||
|
Dividends declared |
-60 | % | 0.04 | 0.10 | 1.61 | 1.68 | 1.47 | |||||||||||||||||
|
Book value 1 |
-10 | % | 25.12 | 27.85 | 42.65 | 47.17 | 44.48 | |||||||||||||||||
|
Market price – end |
24.23 | 12.83 | 24.51 | 46.69 | 82.44 | |||||||||||||||||||
|
Market price – high 2 |
30.29 | 25.52 | 57.05 | 88.56 | 85.25 | |||||||||||||||||||
|
Market price – low |
12.88 | 5.90 | 17.53 | 45.70 | 75.13 | |||||||||||||||||||
|
At Year-End |
||||||||||||||||||||||||
|
Assets |
– | 51,035 | 51,123 | 55,093 | 52,947 | 46,970 | ||||||||||||||||||
|
Net loans and leases |
-9 | % | 36,747 | 40,189 | 41,659 | 38,880 | 34,415 | |||||||||||||||||
|
Deposits |
-2 | % | 40,935 | 41,841 | 41,316 | 36,923 | 34,982 | |||||||||||||||||
|
Long-term debt |
-4 | % | 1,943 | 2,033 | 2,622 | 2,591 | 2,495 | |||||||||||||||||
|
Shareholders’ equity: |
||||||||||||||||||||||||
|
Preferred equity |
+37 | % | 2,057 | 1,503 | 1,582 | 240 | 240 | |||||||||||||||||
|
Common equity |
+10 | % | 4,591 | 4,190 | 4,920 | 5,053 | 4,747 | |||||||||||||||||
|
Noncontrolling interests |
-106 | % | (1 | ) | 17 | 27 | 31 | 43 | ||||||||||||||||
|
Performance Ratios |
||||||||||||||||||||||||
|
Return on average assets |
(0.57 | )% | (2.25 | )% | (0.50 | )% | 1.01 | % | 1.32 | % | ||||||||||||||
|
Return on average common equity |
(9.26 | )% | (28.35 | )% | (5.69 | )% | 9.57 | % | 12.89 | % | ||||||||||||||
|
Net interest margin |
3.73 | % | 3.94 | % | 4.18 | % | 4.43 | % | 4.63 | % | ||||||||||||||
|
Capital Ratios 1 |
||||||||||||||||||||||||
|
Equity to assets |
13.02 | % | 11.17 | % | 11.85 | % | 10.06 | % | 10.71 | % | ||||||||||||||
|
Tier 1 leverage |
12.56 | % | 10.38 | % | 9.99 | % | 7.37 | % | 7.86 | % | ||||||||||||||
|
Tier 1 risk-based capital |
14.78 | % | 10.53 | % | 10.22 | % | 7.57 | % | 7.98 | % | ||||||||||||||
|
Total risk-based capital |
17.15 | % | 13.28 | % | 14.32 | % | 11.68 | % | 12.29 | % | ||||||||||||||
|
Tangible common equity |
6.99 | % | 6.12 | % | 5.89 | % | 5.70 | % | 5.98 | % | ||||||||||||||
|
Tangible equity |
11.10 | % | 9.16 | % | 8.91 | % | 6.23 | % | 6.61 | % | ||||||||||||||
|
Selected Information |
||||||||||||||||||||||||
|
Average common and common-equivalent shares
|
166,054 | 124,443 | 108,908 | 108,408 | 107,957 | |||||||||||||||||||
|
Common dividend payout ratio |
na | na | na | 37.82 | % | 27.10 | % | |||||||||||||||||
|
Full-time equivalent employees |
10,524 | 10,529 | 11,011 | 10,933 | 10,618 | |||||||||||||||||||
|
Commercial banking offices |
495 | 491 | 513 | 508 | 470 | |||||||||||||||||||
|
ATMs |
601 | 602 | 625 | 627 | 578 | |||||||||||||||||||
| 1 |
At year-end. |
| 2 |
The actual high price for 2008 was $107.21. However, this trading price was an anomaly resulting from electronic orders at the opening of the market on September 19, 2008 in response to the SEC’s announcement (prior to the market opening that day) of its temporary emergency action suspending short selling in financial companies. The closing price on September 19, 2008 was $52.83. |
22
Table of Contents
| ITEM 7. | MANAGEMENT’S DISCUSSION AND ANALYSIS OF FINANCIAL CONDITION AND RESULTS OF OPERATIONS |
MANAGEMENT’S DISCUSSION AND ANALYSIS
EXECUTIVE SUMMARY
Company Overview
Zions Bancorporation (“the Parent”) and subsidiaries (collectively “the Company,” “Zions,” “we,” “our,” “us”) together comprise a $51 billion financial holding company headquartered in Salt Lake City, Utah. The Company is a “systemically important” financial institution, under the Dodd-Frank Act.
| • |
As of December 31, 2010, the Company was the 18 th largest domestic bank holding company in terms of deposits and is included in the Standard and Poor’s 500 (“S&P 500”) and NASDAQ Financial 100 indices. It is the largest independent regional bank in the Western U.S. |
| • |
At December 31, 2010, the Company operated banking businesses through 495 domestic branches in ten Western and Southwestern states. |
| • |
The Company is a national leader in Small Business Administration (“SBA”) lending, public finance advisory services, and treasury management services. |
| • |
The Company provides wealth management and brokerage services. |
| • |
Revenues and profits are primarily driven by commercial customers. |
Core Long-Term Strategy
We strive to maintain a local community bank approach for customer-facing elements of our business. We believe that our target customers, consisting largely of small and mid-sized businesses, appreciate local branding, product customization, and speedy decision-making by local management. By retaining a significant degree of autonomy in product offerings and pricing, we believe our banks have a sustainable competitive advantage over larger national banks where loan and deposit products are often homogeneous. However, we strive to centralize non-customer facing operations, such as risk and capital management, technology and operations. By centralizing many of these functions, we believe we can generally achieve greater economies of scale and stronger risk management, and that our portfolio of community banks has superior access to the capital markets, investment portfolio, treasury management, and liquidity resources, and technological advances than do smaller independent community banks.
Our growth strategy is driven by four key factors:
| • |
focus on growth markets; |
| • |
maintain a sustainable competitive advantage over large national and global banks by keeping decisions that affect customers local; |
| • |
maintain a sustainable competitive advantage over community banks through superior products, productivity, efficiency and a lower cost of capital; and |
| • |
centralize and standardize policies and management controlling key risks. |
Focus on Growth Markets
The Company seeks to grow both organically and through acquisitions in growth markets. The states in our geographic footprint have experienced higher rates of economic growth than other states. Our footprint is well diversified by industry, strong business formation rates, real estate development and general economic expansion. While some states in our footprint have experienced a significant slowing in economic activity during the recent recession, others have experienced above-average growth and stronger resistance to the economic
23
Table of Contents
downturn. We believe that the Company can continue to experience above-average revenue growth in the long term, in part because the majority of our footprint is concentrated in states that have above average GDP, population, and job growth, and where the economies are well diversified.
| • |
GDP growth in our footprint has exceeded nominal U.S. GDP by an average of 1.0% per year (compounded) over the last ten years; i.e. from 2000-2009, nominal US GDP grew by 4.1%, while nominal GDP in Zions’ footprint (weighted by assets) grew by 5.1%. |
| • |
Population growth rates have exceeded U.S. population growth rates by 1.1% per year (compounded) over the last ten years; i.e. nationally, the U.S. population increased by 10.6% during the last decade, while Zions’ footprint (weighted average) grew by 23.2% during the same period. |
| • |
Job creation within the Zions footprint greatly exceeded the national rate during the past 10 years. U.S. non-farm payroll jobs declined by 1.7% during the last decade; however, job creation in Zions’ footprint increased by 5.1%. |
Keep Decisions That Affect Customers Local
We believe that over the long term, ensuring that local management teams retain the authority over decisions that affect their customers is a strategy that ultimately generates superior growth in our banking businesses, as supported by stronger organic loan and deposit growth relative to other banks.
| • |
We operate eight different community/regional banks, each under a different name, and each with its own charter, chief executive officer and management team. |
| • |
We believe that this approach allows us to attract and retain exceptional management, and provides service of the highest quality to our targeted customers. The results of this service are evident in the results of the Greenwich Associates annual survey, wherein the Company consistently ranks “Excellent” for overall satisfaction among small and middle-market businesses. |
| • |
This structure helps to ensure that decisions related to customers are made at a local level: |
| • |
branding and marketing strategies; |
| • |
product offerings and pricing; and |
| • |
credit decisions (within the limits of established corporate policy). |
Maintain a Sustainable Competitive Advantage Over Community Banks
To create a sustainable competitive advantage over other smaller community banks, we focus on achieving superior product selection, productivity, economies of scale, availability of liquidity, and a lower cost of capital. Compared to community banks:
| • |
We use the combined scale of all of our banking operations to create a broad product offering at a lower marginal cost. |
| • |
Our larger capital base allows us to lend to business customers of all sizes, from start-up companies to large Fortune 100 companies. |
| • |
For certain products for which economies of scale are believed to be important, the Company “manufactures” the product centrally or is able to obtain services from third-party vendors at lower costs due to volume-driven pricing power. |
| • |
Our combined size and diversification affords us superior access to the capital markets for debt and equity financing; over the long term, this advantage has historically, and should in the future, result in a lower cost of capital. |
24
Table of Contents
Centralize and Standardize Policies and Management Controlling Key Risks
We seek to standardize policies and practices related to the management of key risks in order to assure a consistent risk profile in an otherwise decentralized management model. Among these key risks and functions are credit, interest rate, liquidity, and market risks.
| • |
The Company conducts regular stress testing of the loan portfolio using multiple economic scenarios. Such tests help to identify pockets of risk and enable management to reduce risk. |
| • |
The Company oversees credit risk using specialists in business, commercial real estate, and consumer lending. |
| • |
The Company regularly measures interest rate and liquidity risk and uses capital markets instruments to adjust risks to within Board-approved targets. |
| • |
The Company centrally monitors and oversees operational risk. |
MANAGEMENT’S OVERVIEW OF 2010 PERFORMANCE
The Company worked aggressively in 2010 to reduce the risk within the loan portfolio, reduce problem credits, and meaningfully improve various capital ratios. The Company reported a net loss applicable to common shareholders for 2010 of $412.5 million or $2.48 per diluted common share compared to a net loss of $1,234.4 million or $9.92 per diluted common share for 2009.
Although we reported a net loss for 2010, we note that the trends that drive profitability have shown considerable signs of improvement, as detailed below.
Significant 2010 Accomplishments
| • |
While net interest income fluctuated during the year, “core net interest income” remained at a relatively stable level. (See chart 1.) Additionally, key noninterest expense items such as salaries and employee benefits, occupancy, and furniture and equipment remained relatively stable. |
| • |
Criticized loans, the broadest category of loans having an elevated probability of default, declined 35.3% from one year ago, a significant reversal compared to the prior year’s increase of 67.4%. |
| • |
Nonperforming lending-related assets declined 34.0% compared to December 31, 2009. (See chart 2.) |
| • |
Net impairment losses on investment securities declined 69.6% compared to 2009. |
| • |
Capital levels increased significantly. (See chart 3.) The Tier 1 common capital ratio increased approximately 33.0% from the prior year to a record high level of 8.95%. Based upon information currently available, management believes the Company already exceeds the new Basel III guidelines published in 2010; such guidelines are not scheduled to be fully phased in until January 2019. |
| • |
Significantly enhanced risk management, including additional oversight on credit risk and sophistication of stress testing. |
| • |
Rebalanced and reduced the risk of the loan portfolio. During 2010, construction and land development loans declined 35.8% and now account for less than 10% of the loan portfolio, down from 21.8% at its peak. |
| • |
These loans have been the primary source of loan losses during this credit cycle, and the concentration reduction represents reduced risk for the total portfolio. |
| • |
A significant percentage of the remaining construction and land development portfolio consists of loans against recently-completed projects where leases fully cover the debt service burden. |
25
Table of Contents
| • |
Improved on-balance sheet liquidity. Cash, money market investments, and certain securities (U.S. Treasury securities, U.S. Government agencies and corporations, and mutual funds) increased to 16.5% of tangible assets compared to 7.8% at December 31, 2009. |
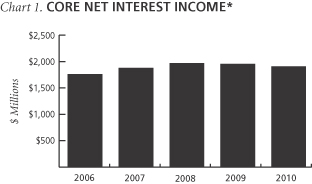
| * | The reconciliation of net interest income to core net interest income is found in the GAAP to non-GAAP reconciliation on page 88. |
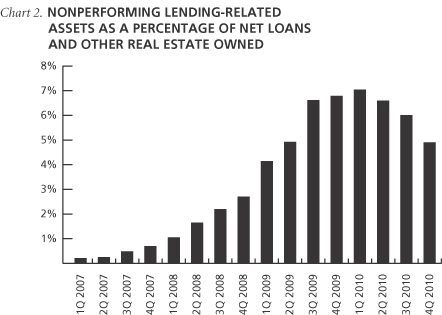
26
Table of Contents
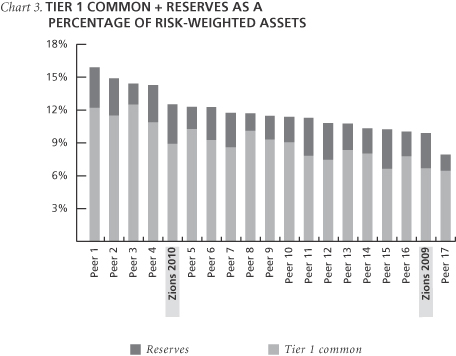
The reconciliation of controlling interest shareholders’ equity to Tier 1 common equity is found in the GAAP to non-GAAP reconciliation on page 88. Reserves consist of the allowance for loan losses and the reserve for unfunded lending commitments.
Areas experiencing weakness in 2010
| • |
Loan balances, the Company’s primary source of revenue, declined 8.6%, compared to a 4.1% decline for the commercial banking industry which was adjusted for changes to off-balance sheet loan accounting. However, approximately 57.4% of the Company’s loan portfolio decline is attributable to construction and land development, therefore representing a significant reduction in risk. Additionally, approximately 13.7% of the Company’s decline in total loans is attributable to FDIC-supported loans. |
| • |
Net loan charge-offs of 2.53% of average loans remained significantly above long-term averages. |
| • |
Revenues from nonsufficient funds and overdrafts were adversely impacted by changes to Regulation E. |
| • |
FDIC premiums, other real estate expense, and credit-related expenses had a significantly adverse effect on total noninterest expense. |
Areas of focus for 2011
| • |
Further reduce nonaccrual and classified loans. |
| • |
Deploy excess liquidity into loans. |
| • |
Increase penetration within consumer lending, including residential mortgage. Residential mortgage loans (including 1-4 family residential loans and home equity credit lines) account for 15.3% of our loan portfolio, approximately half the concentration of the commercial banking industry. |
| • |
Leverage the Small Business Jobs Act of 2010, which significantly expanded the SBA lending program limits. |
| • |
Continue to control noninterest expense and to enhance risk management capabilities through the deployment of new technology systems. |
27
Table of Contents
The key drivers of the Company’s performance during 2010 were as follows:
Schedule 1
KEY DRIVERS OF PERFORMANCE
2010 COMPARED TO 2009
|
Driver |
2010 | 2009 |
Change
better/(worse) |
|||||||||
| (In billions) | ||||||||||||
|
Average net loans and leases |
$ | 38.3 | $ | 41.5 | (8 | )% | ||||||
|
Average noninterest-bearing deposits |
13.3 | 11.1 | 20 | % | ||||||||
|
Average total deposits |
41.7 | 42.8 | (3 | )% | ||||||||
| (In millions) | ||||||||||||
|
Net interest income |
$ | 1,727.4 | $ | 1,897.5 | (9 | )% | ||||||
|
Provision for loan losses |
(852.1 | ) | (2,016.9 | ) | 58 | % | ||||||
|
Net impairment and valuation losses on securities |
(85.4 | ) | (492.6 | ) | 83 | % | ||||||
|
Impairment loss on goodwill |
– | (636.2 | ) | 100 | % | |||||||
|
Nonaccrual loans |
1,528.7 | 2,379.4 | 36 | % | ||||||||
|
Net interest margin |
3.73 | % | 3.94 | % | (21 | )bp | ||||||
|
Core net interest margin |
4.12 | % | 4.07 | % | 5 | bp | ||||||
|
Ratio of nonperforming assets to net loans and leases and other
|
4.91 | % | 6.79 | % | 188 | bp | ||||||
|
Ratio of total allowance for credit losses to net loans and
|
4.22 | % | 4.10 | % | 12 | bp | ||||||
|
Tier 1 common to risk-weighted assets |
8.95 | % | 6.73 | % | 222 | bp | ||||||
| (In millions of shares) | ||||||||||||
|
Net common shares issued |
32.4 | 35.1 | (8 | )% | ||||||||
bp – basis point
CRITICAL ACCOUNTING POLICIES AND SIGNIFICANT ESTIMATES
Note 1 of the Notes to Consolidated Financial Statements contains a summary of the Company’s significant accounting policies. Further explanations of significant accounting policies are included where applicable in the remaining Notes to Consolidated Financial Statements. Discussed below are certain significant accounting policies that we consider critical to the Company’s financial statements. These critical accounting policies were selected because the amounts affected by them are significant to the financial statements. Any changes to these amounts, including changes in estimates, may also be significant to the financial statements. We believe that an understanding of certain of these policies, along with the related estimates we are required to make in recording the financial transactions of the Company, is important to have a complete picture of the Company’s financial condition. In addition, in arriving at these estimates, we are required to make complex and subjective judgments, many of which include a high degree of uncertainty. The following discussion of these critical accounting policies includes the significant estimates related to these policies. We have discussed each of these accounting policies and the related estimates with the Audit Committee of the Board of Directors.
We have included where applicable in this document sensitivity schedules and other examples to demonstrate the impact of the changes in estimates made for various financial transactions. The sensitivities in these schedules and examples are hypothetical and should be viewed with caution. Changes in estimates are based on variations in assumptions and are not subject to simple extrapolation, as the relationship of the change in the assumption to the change in the amount of the estimate may not be linear. In addition, the effect of a variation in one assumption is in reality likely to cause changes in other assumptions, which could potentially magnify or counteract the sensitivities.
28
Table of Contents
Fair Value Estimates
The Company measures or monitors many of its assets and liabilities on a fair value basis. Fair value is the price that could be received to sell an asset or paid to transfer a liability in an orderly transaction between market participants. To increase consistency and comparability in fair value measures, ASC 820 establishes a three-level hierarchy to prioritize the valuation inputs among (1) observable inputs that reflect quoted prices in active markets, (2) inputs other than quoted prices with observable market data, and (3) unobservable data such as the Company’s own data or single dealer nonbinding pricing quotes.
When observable market prices are not available, fair value is estimated using modeling techniques such as discounted cash flow analyses. These modeling techniques utilize assumptions that market participants would use in pricing the asset or the liability, including assumptions about the risk inherent in a particular valuation technique, the effect of a restriction on the sale or use of an asset, the related life of the asset and applicable growth rate, the risk of nonperformance, and other related assumptions.
The selection and weighting of the various fair value techniques may result in a fair value higher or lower than carrying value. Considerable judgment may be involved in determining the amount that is most representative of fair value.
Fair value is used on a recurring basis for certain assets and liabilities in which fair value is the primary measure of accounting. Fair value is used on a nonrecurring basis to measure certain assets or liabilities for impairment or for disclosure purposes in accordance with ASC 825, Financial Instruments .
Impairment analysis generally relates to long-lived assets, goodwill, and core deposit and other intangible assets. An impairment loss is recognized if the carrying amount of the asset is not likely to be recoverable and exceeds its fair value. In determining the fair value, management uses models and applies the techniques and assumptions previously discussed.
Investment securities are valued using several methodologies which depend on the nature of the security, availability of current market information, and other factors. Certain CDOs are valued using an internal model and the assumptions are analyzed for sensitivity. “Investment Securities Portfolio” on page 52 provides more information regarding this analysis.
Investment securities are reviewed formally on a quarterly basis for the presence of OTTI. The evaluation process takes into account current market conditions, fair value of the security, and many other factors. The decision to deem these securities OTTI is based on a specific analysis of the structure of each security and an evaluation of the underlying collateral. Future reviews for OTTI consider the particular facts and circumstances during the reporting period in review.
Notes 1, 5, 8, 10 and 21 of the Notes to Consolidated Financial Statements and “Investment Securities Portfolio” on page 52 contain further information regarding the use of fair value estimates.
Allowance for Credit Losses
The allowance for credit losses includes the allowance for loan losses and the reserve for unfunded lending commitments. The allowance for loan losses provides for probable losses that have been identified with specific customer relationships and for probable losses believed to be inherent in the loan portfolio, but which have not been specifically identified. The determination of the appropriate level of the allowance is based on periodic evaluations of the portfolios along with other relevant factors. This process includes a quantitative analysis, as well as a qualitative review of its results. The qualitative review requires a significant amount of judgement, and is described in more detail in Note 6 of the Notes to Consolidated Financial Statements.
The reserve for unfunded lending commitments provides for potential losses associated with off-balance sheet lending commitments and standby letters of credit. The reserve is estimated using the same procedures and methodologies as for the allowance for loan losses.
29
Table of Contents
There are numerous components that enter into the evaluation of the allowance for loan losses, which includes a quantitative and a qualitative process. Although we believe that our processes for determining an appropriate level for the allowance adequately address the various components that could potentially result in credit losses, the processes and their elements include features that may be susceptible to significant change. Any unfavorable differences between the actual outcome of credit-related events and our estimates and projections could require an additional provision for credit losses. As an example, if a total of $1.5 billion of Pass grade loans were to be immediately classified as Special Mention, Substandard or Doubtful (as defined in Note 6 of the Notes to Consolidated Financial Statements) in the same proportion as the existing criticized and classified loans to the whole portfolio, the quantitatively determined amount of the allowance for loan losses at December 31, 2010 would increase by approximately $78 million. This sensitivity analysis is hypothetical and has been provided only to indicate the potential impact that changes in the level of the criticized and classified loans may have on the allowance estimation process.
Although the qualitative process is subjective, it represents the Company’s best estimate of qualitative factors impacting the determination of the allowance for loan losses. Such factors include but are not limited to national and regional economic trends and indicators. We believe that given the procedures we follow in determining the allowance for loan losses for the loan portfolio, the various components used in the current estimation processes are appropriate.
Note 6 of the Notes to Consolidated Financial Statements and “Credit Risk Management” on page 62 contain further information and more specific descriptions of the processes and methodologies used to estimate the allowance for credit losses.
Accounting for Goodwill
Goodwill is initially recorded at fair value and is subsequently evaluated at least annually for impairment in accordance with ASC 350, Intangibles – Goodwill and Other . We perform this annual test as of October 1 of each year, or more often if events or circumstances indicate that carrying value may not be recoverable. The goodwill impairment test for a given reporting unit compares its fair value with its carrying value. If the carrying amount exceeds fair value, an additional analysis must be performed to determine the amount, if any, by which goodwill is impaired.
To determine the fair value, we generally calculate value using a combination of up to three separate methods: comparable publicly traded financial service companies in the western and southwestern states (“Market Value”); comparable acquisitions of financial services companies in the western and southwestern states (“Transaction Value”); and the discounted present value of management’s estimates of future cash or income flows. Critical assumptions that are used as part of these calculations include:
| • |
selection of comparable publicly traded companies, based on location, size, and business composition; |
| • |
selection of market comparable acquisition transactions, based on location, size, business composition, and date of the transaction; |
| • |
the discount rate applied to future earnings, based on an estimate of the cost of capital; |
| • |
the potential future earnings of the reporting unit; |
| • |
the relative weight given to the valuations derived by the three methods described; and |
| • |
the control premium associated with reporting units. |
We apply a control premium in the Market Value approach to determine the reporting units’ equity values. Control premiums represent the ability of a controlling shareholder to benefit from synergies and other intangible assets that arise from control that might cause the fair value of a reporting unit as a whole to exceed its market capitalization. Based on a review of historical recent bank transactions within the Company’s geographic footprint, comparing market values 30 days prior to the announced transaction to the deal value, we have determined that a control premium of 25% was appropriate.
30
Table of Contents
Since estimates are an integral part of the impairment computations, changes in these estimates could have a significant impact on any calculated impairment amount. Factors that may significantly affect the estimates include, among others, competitive forces, customer behaviors and attrition, loan losses, changes in revenue growth trends, cost structures and technology, changes in discount rates, changes in equity market values and merger and acquisition valuations, and changes in industry conditions. As an example, if the discount rate applied to future earnings were increased by 100 basis points, then the fair values of Amegy, CB&T, and Zions Bank would only exceed their carrying values by 4%, 8%, and 5%, respectively. This sensitivity analysis is hypothetical and has been provided only to indicate the potential impact of a discount rate assumption change.
During the fourth quarter of 2010, we performed our annual goodwill impairment evaluation of the entire organization, effective October 1, 2010. Upon completion of the evaluation process, we concluded that none of our subsidiary banks was impaired. Additionally, we determined that the fair values of Amegy, CB&T, and Zions Bank exceeded their carrying values by 12%, 14% and 17%, respectively.
Notes 1, 2 and 10 of the Notes to Consolidated Financial Statements contain additional information, including recently issued accounting guidance that affects the calculation process.
Accounting for Derivatives
Our interest rate risk management strategy involves the use of hedging to mitigate our exposure to potential adverse effects from changes in interest rates.
The derivative contracts used by the Company are exchange-traded or over-the-counter (“OTC”). Exchange-traded derivatives consist of forward currency exchange contracts, which are part of the Company’s services provided to commercial customers. OTC derivatives consist of interest rate swaps, options and futures contracts, and, through the third quarter of 2010, commodity derivatives for customers.
We record all derivatives at fair value on the balance sheet in accordance with ASC 815, Derivative and Hedging . When quoted market prices are not available, the valuation of derivative instruments is determined using widely accepted valuation techniques including discounted cash flow analysis on the expected cash flows of each derivative. These future net cash flows, however, are susceptible to change due primarily to fluctuations in interest rates (most significantly), foreign exchange rates, and commodity prices. As a result, the estimated values of these derivatives will change over time as cash is received and paid and as market conditions change. As these changes take place, they may have a positive or negative impact on our estimated valuations.
We incorporate credit valuation adjustments to appropriately reflect both the Company’s own nonperformance risk and the respective counterparty’s nonperformance risk in the fair value measurements of its OTC derivatives. In adjusting the fair value of its derivative contracts for the effect of nonperformance risk, we have considered the impact of netting and any applicable credit enhancements, such as collateral postings, current threshold amounts, mutual puts, and guarantees. Additionally, we actively monitor counterparty credit ratings for significant changes.
Notes 1, 8 and 21 of the Notes to Consolidated Financial Statements and “Interest Rate and Market Risk Management” on page 74 contain further information on our use of derivatives and the methodologies used to estimate fair value.
Income Taxes
The Company is subject to the income tax laws of the United States, its states and other jurisdictions where the Company conducts business. These laws are complex and subject to different interpretations by the taxpayer and the various taxing authorities. In determining the provision for income taxes, management must make judgments and estimates about the application of these laws and related regulations. In the process of preparing the Company’s tax returns, management attempts to make reasonable interpretations of the tax laws. These interpretations are subject to challenge by the tax authorities upon audit or to re-interpretation based on management’s ongoing assessment of facts and evolving case law.
31
Table of Contents
The Company had net deferred tax assets (“DTAs”) of $540 million at December 31, 2010, compared to $498 million at December 31, 2009. The most significant portions of the deductible temporary differences relate to (1) the allowance for loan losses and (2) fair value adjustments or impairment write-downs related to securities. No valuation allowance has been recorded as of December 31, 2010 related to DTAs except for a full valuation reserve related to certain acquired net operating losses from an immaterial nonbank subsidiary. In assessing the need for a valuation allowance, both the positive and negative evidence about the realization of DTAs were evaluated. Despite the negative evidence of the past three years of losses, the ultimate realization of DTAs is based on the Company’s ability to (1) carry back net operating losses to prior tax periods, (2) implement tax planning strategies that are prudent and feasible, (3) utilize the reversal of deductible temporary differences that can be offset by taxable temporary differences, and (4) generate future taxable income.
The Company has available carryback potential to offset federal tax of approximately $100 million in the 2008 tax year. During 2010, the Company does anticipate a net operating loss for tax purposes that will largely offset the taxable income for the 2008 tax year.
Tax planning strategies represent a source of positive evidence that must be considered when assessing the need for a valuation allowance. Tax planning strategies must be prudent and feasible (and within the control of a company), something that a company might not ordinarily implement, but would implement to prevent an operating loss or tax credit carryforward from expiring unused, and would result in the realization of DTAs. The Company has evaluated a number of tax planning strategies that, if implemented, could result in the realization of a majority of the net DTA balance that exists at December 31, 2010. These strategies mainly involve the sale of highly appreciated assets (e.g., certain fixed assets, publicly-traded securities and insurance policies). Management would not expect that the execution of any of the actions would involve a significant amount of expense.
The Company has taxable temporary differences, or deferred tax liabilities (“DTLs”) that will reverse and offset DTAs in the periods prior to the expiration of any benefits. Based on our analysis and experience, the general reversal pattern of DTLs against DTAs would be somewhat similar in character and timing. Because of this generally consistent reversal pattern, we believe it is appropriate to reduce our gross DTAs by our DTLs.
The Company has a strong history of positive earnings and has generated significant levels of net income in 42 out of the previous 46 years. While the recent economic downturn has been severe, the Company has consistently maintained strong levels of “core net interest income”. The Company is well positioned in the highest growth areas in the country and is fundamentally strong in its capital, liquidity, business practices, and has actually grown its customer base during the current economic downturn. The Company has a long history of profitability and is expected to be profitable again in the near future. The Company is relying on future taxable income to realize some of its DTA and expects to generate this income beginning in 2011.
After evaluating all of the factors previously summarized and considering the weight of the positive evidence compared to the negative evidence, management has concluded it is more likely than not that the Company will realize the existing DTAs and that an additional valuation allowance is not needed.
On a quarterly basis, management assesses the reasonableness of its effective tax rate based upon its current best estimate of net income and the applicable taxes expected for the full year. Deferred tax assets and liabilities are also reassessed on a regular basis. Reserves for contingent tax liabilities are reviewed quarterly for adequacy based upon developments in tax law and the status of examinations or audits. The Company has tax reserves at December 31, 2010 of approximately $5.3 million, net of federal and/or state benefits, for uncertain tax positions primarily for various state tax contingencies in several jurisdictions.
32
Table of Contents
RECENT ACCOUNTING PRONOUNCEMENTS AND DEVELOPMENTS
Note 2 of the Notes to Consolidated Financial Statements discusses the expected impact of accounting pronouncement(s) recently issued but not yet required to be adopted. Where applicable, the other Notes to Consolidated Financial Statements and MD&A discuss new accounting pronouncements adopted during 2010 to the extent they materially affect the Company’s financial condition, results of operations, or liquidity.
RESULTS OF OPERATIONS
The Company reported a net loss applicable to common shareholders for 2010 of $412.5 million, or $2.48 per diluted share, compared to a net loss applicable to common shareholders of $1,234.4 million, or $9.92 per diluted share for 2009. The significant reduction in net loss was mainly caused by the following favorable changes:
| • |
$1,164.8 million decline in the provision for loan losses; |
| • |
$636.2 million decrease in impairment loss on goodwill; |
| • |
$212.1 million decrease in valuation losses on securities purchased; |
| • |
$195.1 million reduction in net impairment losses on investment securities; |
| • |
$70.2 million decline in the provision for unfunded lending commitments; |
| • |
$14.5 million gain on subordinated debt exchange; and |
| • |
$6.4 million improvement in dividends and other investment income. |
The impact of these items was partially offset by the following:
| • |
$508.9 million reduction in gain on subordinated debt modification; |
| • |
$294.5 million decrease in income tax benefit; |
| • |
$169.2 million decline in acquisition related gains; |
| • |
$136.7 million increase in accelerated convertible subordinated debt discount amortization recognized in interest expense; |
| • |
$129.6 million reduction in fair value and nonhedge derivative income; |
| • |
$48.8 million growth in other noninterest expense; |
| • |
$34.0 million increase in other real estate expense; and |
| • |
$26.2 million rise in credit related expense. |
The Company reported a net loss applicable to common shareholders for 2009 of $1,234.4 million, or $9.92 per diluted share, compared to a net loss applicable to common shareholders of $290.7 million, or $2.68 per diluted share for 2008. The significant increase in net loss was mainly caused by:
| • |
$1,368.7 million increase in the provision for loan losses; |
| • |
$282.4 million increase in impairment loss on goodwill; |
| • |
$199.0 million increase in valuation losses on securities purchased; |
| • |
$80.7 million increase in FDIC premiums; |
| • |
$64.0 million increase in the provision for unfunded lending commitments; |
| • |
$60.4 million increase in other real estate expense; |
| • |
$35.7 million increase in accelerated convertible subordinated debt discount amortization; and |
| • |
$20.9 million rise in credit related expense. |
33
Table of Contents
The impact of these unfavorable changes was partially offset by the following:
| • |
$508.9 million gain on subordinated debt modification; |
| • |
$358.0 million increase in income tax benefit; |
| • |
$169.2 million in acquisition related gains; |
| • |
$161.8 million increase in fair value and nonhedge derivative income; and |
| • |
$23.6 million reduction in net impairment losses on investment securities. |
During 2009, the Company executed a subordinated debt modification and exchange transaction. The original discount on the convertible subordinated debt was $679 million and the remaining discount at December 31, 2010 was $386 million. It included the following components:
| • |
The fair value discount on the debt; and |
| • |
The value of the beneficial conversion feature added the right of the debt holder to convert the debt into preferred stock. |
The discount associated with the convertible subordinated debt is amortized to interest expense, a noncash expense, using the interest method over the remaining terms of the subordinated debt. When holders of the convertible subordinated notes convert to preferred stock, the rate of amortization is accelerated by immediately expensing any unamortized discount associated with the converted debt.
Excluding the impact of these noncash expenses and the 2009 gain on subordinated debt modification, the loss before income taxes decreased to $172.8 million in 2010 from $2,069.3 million in 2009, and has improved each quarter since the fourth quarter of 2009.
Schedule 2
IMPACT OF CONVERTIBLE SUBORDINATED DEBT
| Year Ended | Three Months Ended | |||||||||||||||||||
| (In millions) |
December 31,
2010 |
December 31,
2010 |
September 30,
2010 |
June 30,
2010 |
March 31,
2010 |
|||||||||||||||
|
Income (loss) before income taxes (GAAP) |
$ | (403.2 | ) | $ | (96.5 | ) | $ | (78.6 | ) | $ | (136.3 | ) | $ | (91.8 | ) | |||||
|
Convertible subordinated debt discount amortization |
58.0 | 13.8 | 14.7 | 14.7 | 14.8 | |||||||||||||||
|
Accelerated convertible subordinated debt discount amortization |
172.4 | 73.3 | 27.4 | 60.5 | 11.2 | |||||||||||||||
|
Income (loss) before income taxes and subordinated debt modification and conversions (non-GAAP) |
$ | (172.8 | ) | $ | (9.4 | ) | $ | (36.5 | ) | $ | (61.1 | ) | $ | (65.8 | ) | |||||
34
Table of Contents
| Year Ended | Three Months Ended | |||||||||||||||||||
| (In millions) |
December 31,
2009 |
December 31,
2009 |
September 30,
2009 |
June 30,
2009 |
March 31,
2009 |
|||||||||||||||
|
Income (loss) before income taxes (GAAP) |
$ | (1,623.0 | ) | $ | (311.3 | ) | $ | (257.7 | ) | $ | (75.7 | ) | $ | (978.3 | ) | |||||
|
Gain on subordinated debt modification |
(508.9 | ) | (15.2 | ) | (493.7 | ) | ||||||||||||||
|
Convertible subordinated debt discount amortization |
26.9 | 13.7 | 13.2 | – | – | |||||||||||||||
|
Accelerated convertible subordinated debt discount amortization |
35.7 | 20.0 | 15.7 | – | – | |||||||||||||||
|
Income (loss) before income taxes and subordinated debt modification and conversions (non-GAAP) |
$ | (2,069.3 | ) | $ | (292.8 | ) | $ | (228.8 | ) | $ | (569.4 | ) | $ | (978.3 | ) | |||||
The impact of the conversion of subordinated debt into preferred stock is further detailed in “Capital Management” on page 84.
Net Interest Income, Margin and Interest Rate Spreads
Net interest income is the difference between interest earned on interest-bearing assets and interest incurred on interest-bearing liabilities. Taxable-equivalent net interest income is the largest component of Zions’ revenue. For the year 2010, it was 79.9% of our taxable-equivalent revenues, compared to 70.5% in 2009 and 91.3% in 2008. The change in the percentage from the prior year for 2010 and 2009 was primarily due to the 2009 gain on subordinated debt modification of $508.9 million and acquisition related gains of $169.2 million which increased total taxable-equivalent revenues in 2009. For the year 2010, taxable-equivalent net interest income was $1,749.1 million, compared to $1,920.8 million in 2009 and $1,995.4 million in 2008. The fluctuation between 2010 and 2009 reflects the effect of many factors, including a decrease in loans and leases, lower balances of and lower rates earned on securities, and higher noncash periodic and accelerated discount amortization (totaling $230.4 million in 2010) on convertible subordinated debt, partially offset by lower balances of and lower interest rates paid on interest bearing deposits, increased money market investments, as well as better-than-expected performance of loans acquired from the FDIC. Even though nonaccrual loans decreased by 35.8 % between 2009 and 2010, their positive impact only partially offset the adverse impact of continued pay-downs and charge-offs on earning assets. The decrease between 2008 and 2009 was largely the result of increased nonaccrual loans, securities on nonaccrual status, and higher average money market balances that were earning lower interest rates. The incremental tax rate used for calculating all taxable-equivalent adjustments was 35% for all years discussed and presented.
By its nature, net interest income is especially vulnerable to changes in the mix and amounts of interest-earning assets and interest-bearing liabilities. In addition, changes in the interest rates and yields associated with these assets and liabilities can significantly impact net interest income. During 2010, customer deposits declined by a smaller amount than did loan balances. The Company has undertaken efforts to actively reduce the excess liquidity while preserving key customer relationships. See “Interest Rate and Market Risk Management” on page 74 for further discussion of how we manage the portfolios of interest-earning assets, interest-bearing liabilities, and associated risk.
A gauge that we use to measure the Company’s success in managing its net interest income is the level and stability of the net interest margin. The Company also considers the “core net interest margin” to be relevant to ongoing operating results. The net interest margin was 3.73% for 2010, compared to 3.94% in 2009 and 4.18% in 2008. During 2010, the net interest margin was negatively impacted by 37 basis points by the accelerated discount amortization resulting from the conversion of convertible subordinated debt to preferred stock, and by 12 basis points for the discount amortization related to the convertible subordinated debt. This unfavorable
35
Table of Contents
impact was partially mitigated by increased interest income resulting from the accretion on acquired loans based on increased projected cash flows, and by the low cost of noninterest-bearing deposit funding.
The decreased net interest margin for 2010 compared to 2009 resulted from the impact of the discount amortization on the modified subordinated debt, including the effect of the conversion of subordinated debt into preferred stock; increased nonaccrual loans and securities; and higher money market investment balances earning lower rates. This was offset in part by a lower cost mix of deposit funding, lower rates paid on interest-bearing deposits, and larger incremental spreads on new loan generation. Average loans and leases decreased $3.3 billion due to loan payoffs and charge-offs, and average money market investments increased $1.7 billion as the Company chose not to invest excess liquidity in longer-duration securities. Average interest-bearing deposits decreased $3.4 billion from 2009, with the decrease being driven primarily by time and money market deposits. Average borrowed funds decreased $1.6 billion compared to 2009, primarily due to reduced amounts of federal funds purchased and security repurchase agreements along with conversions of subordinated debt into preferred stock. Average noninterest-bearing deposits increased $2.3 billion compared to 2009 and were 31.9% of total average deposits for 2010, compared to 25.8% for 2009.
The decreased net interest margin for 2009 compared to 2008 resulted from increased nonaccrual loans and securities; the impact of the discount amortization on the modified subordinated debt, including the effect of the conversion of subordinated debt into Series C preferred stock; and higher money market investment balances earning lower rates. This was offset in part by a lower cost mix of deposit funding, lower rates paid on interest-bearing deposits, and larger incremental spreads on new loan generation. Average loans and leases increased $0.7 billion due to the acquisition of FDIC-supported loans, and average money market investments increased $0.5 billion due to strong growth in certain deposit categories, which the Company chose not to invest in longer-duration securities. Average interest-bearing deposits increased $3.4 billion from 2008, with the increase being driven primarily by money market and savings deposits. Average borrowed funds decreased $5.3 billion compared to 2008, primarily due to decreased borrowing from the FHLB and the Federal Reserve. Average noninterest-bearing deposits increased $1.9 billion compared to 2008 and were 25.8% of total average deposits for 2009, compared to 24.3% for 2008. The net interest margin for 2009 was unfavorably impacted by 6 basis points for the discount amortization on the modified subordinated debt and an additional 7 basis points from the impact of accelerated debt discount amortization resulting from the conversion of subordinated debt into Series C preferred stock.
The Company believes that its “core net interest margin” is more reflective of its operating performance than the reported net interest margin. The “core net interest margin” is calculated by excluding the impact of discount amortization on convertible subordinated debt, accelerated discount amortization on convertible subordinated debt, and additional accretion of interest income on loans acquired in FDIC-assisted transactions from the net interest margin. The “core net interest margin” was 4.12%, 4.07%, and 4.18% for 2010, 2009, and 2008 respectively. See “GAAP to non-GAAP Reconciliation” on page 88 for a reconciliation between the GAAP net interest margin and the non-GAAP “core net interest margin”.
36
Table of Contents
Chart 4 illustrates recent trends of the net interest margin, “core net interest margin”, and the average federal funds rate.
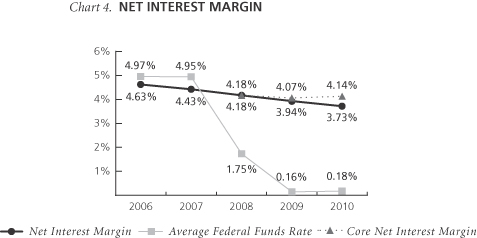
The spread on average interest-bearing funds for 2010 was 3.12%, compared to 3.52% for 2009 and 3.68% for 2008. The spread on average interest-bearing funds for 2010 was affected by the same factors that had an impact on the net interest margin.
The net interest margin may continue to be adversely affected in future quarters due to the level of nonperforming assets and the periodic amortization of debt discount related to the debt modification transactions. The discount on the convertible subordinated debt was $386 million as of December 31, 2010, or 48.1% of the total $803 million of remaining outstanding convertible subordinated notes and will be amortized as interest expense over the remaining life of the debt using the interest method. The net interest margin may also be negatively impacted in future periods if debt holders exercise their option to convert debt securities into preferred stock. The Company will be required to amortize the remaining discount related to the converted debt at the time of conversion.
The Company expects to continue its efforts over the long run to maintain a slightly “asset-sensitive” position with regard to interest rate risk. However, because of the current low interest rate environment, the Company has allowed its balance sheet to become more asset-sensitive than has historically been the case. With interest rates at historically low levels, there is also a reduced need to protect against falling interest rates. Our estimates of the Company’s actual rate risk position are highly dependent upon a number of assumptions regarding the re-pricing behavior of various deposit and loan types in response to changes in both short-term and long-term interest rates, balance sheet composition, and other modeling assumptions, as well as the actions of competitors and customers in response to those changes. Further detail on interest rate risk is discussed in “Interest Rate Risk” on page 75.
Schedule 3 summarizes the average balances, the amount of interest earned or incurred and the applicable yields for interest-earning assets and the costs of interest-bearing liabilities that generate taxable-equivalent net interest income. Note that the “amount of interest” and the “average rate” paid on long-term debt in 2009 and 2010 reflect the impacts of the amortization and accelerated amortization of the discount on the modified subordinated debt.
37
Table of Contents
Schedule 3
DISTRIBUTION OF ASSETS, LIABILITIES, AND SHAREHOLDERS’ EQUITY
AVERAGE BALANCE SHEETS, YIELDS AND RATES
| 2010 | 2009 | |||||||||||||||||||||||
| (Amounts in millions) |
Average
balance |
Amount
of
interest 1 |
Average
rate |
Average
balance |
Amount
of
interest 1 |
Average
rate |
||||||||||||||||||
|
ASSETS: |
||||||||||||||||||||||||
|
Money market investments |
$ | 4,085 | $ | 11.0 | 0.27 | % | $ | 2,380 | $ | 7.9 | 0.33 | % | ||||||||||||
|
Securities: |
||||||||||||||||||||||||
|
Held-to-maturity |
866 | 44.3 | 5.12 | 1,263 | 66.9 | 5.29 | ||||||||||||||||||
|
Available-for-sale |
3,416 | 91.5 | 2.68 | 3,313 | 104.1 | 3.14 | ||||||||||||||||||
|
Trading account |
61 | 2.2 | 3.64 | 75 | 2.7 | 3.65 | ||||||||||||||||||
|
Total securities |
4,343 | 138.0 | 3.18 | 4,651 | 173.7 | 3.73 | ||||||||||||||||||
|
Loans held for sale |
187 | 8.9 | 4.78 | 226 | 11.0 | 4.88 | ||||||||||||||||||
|
Loans: |
||||||||||||||||||||||||
|
Net loans and leases excluding FDIC-supported loans 2 |
37,040 | 2,069.3 | 5.59 | 40,455 | 2,281.6 | 5.64 | ||||||||||||||||||
|
FDIC-supported loans |
1,210 | 114.4 | 9.46 | 1,058 | 64.4 | 6.09 | ||||||||||||||||||
|
Total loans and leases |
38,250 | 2,183.7 | 5.71 | 41,513 | 2,346.0 | 5.65 | ||||||||||||||||||
|
Total interest-earning assets |
46,865 | 2,341.6 | 5.00 | 48,770 | 2,538.6 | 5.21 | ||||||||||||||||||
|
Cash and due from banks |
1,214 | 1,245 | ||||||||||||||||||||||
|
Allowance for loan losses |
(1,555 | ) | (1,104 | ) | ||||||||||||||||||||
|
Goodwill |
1,015 | 1,174 | ||||||||||||||||||||||
|
Core deposit and other intangibles |
101 | 125 | ||||||||||||||||||||||
|
Other assets |
3,987 | 3,838 | ||||||||||||||||||||||
|
Total assets |
$ | 51,627 | $ | 54,048 | ||||||||||||||||||||
|
LIABILITIES: |
||||||||||||||||||||||||
|
Interest-bearing deposits: |
||||||||||||||||||||||||
|
Savings and NOW |
$ | 6,138 | 20.5 | 0.33 | $ | 5,035 | 21.6 | 0.43 | ||||||||||||||||
|
Money market |
15,901 | 106.0 | 0.67 | 17,513 | 216.4 | 1.24 | ||||||||||||||||||
|
Time under $100,000 |
2,178 | 28.4 | 1.30 | 2,908 | 69.5 | 2.39 | ||||||||||||||||||
|
Time $100,000 and over |
2,568 | 31.4 | 1.22 | 4,327 | 98.5 | 2.28 | ||||||||||||||||||
|
Foreign |
1,627 | 9.8 | 0.60 | 2,011 | 18.7 | 0.93 | ||||||||||||||||||
|
Total interest-bearing deposits |
28,412 | 196.1 | 0.69 | 31,794 | 424.7 | 1.34 | ||||||||||||||||||
|
Borrowed funds: |
||||||||||||||||||||||||
|
Securities sold, not yet purchased |
40 | 1.8 | 4.50 | 41 | 2.2 | 5.22 | ||||||||||||||||||
|
Federal funds purchased and security repurchase agreements |
920 | 1.5 | 0.16 | 1,923 | 5.7 | 0.30 | ||||||||||||||||||
|
Other short-term borrowings |
189 | 9.3 | 4.93 | 305 | 6.8 | 2.24 | ||||||||||||||||||
|
Long-term debt |
1,980 | 383.8 | 19.38 | 2,438 | 178.4 | 7.32 | ||||||||||||||||||
|
Total borrowed funds |
3,129 | 396.4 | 12.67 | 4,707 | 193.1 | 4.10 | ||||||||||||||||||
|
Total interest-bearing liabilities |
31,541 | 592.5 | 1.88 | 36,501 | 617.8 | 1.69 | ||||||||||||||||||
|
Noninterest-bearing deposits |
13,318 | 11,053 | ||||||||||||||||||||||
|
Other liabilities |
576 | 558 | ||||||||||||||||||||||
|
Total liabilities |
45,435 | 48,112 | ||||||||||||||||||||||
|
Shareholders’ equity: |
||||||||||||||||||||||||
|
Preferred equity |
1,732 | 1,558 | ||||||||||||||||||||||
|
Common equity |
4,452 | 4,354 | ||||||||||||||||||||||
|
Controlling interest shareholders’ equity |
6,184 | 5,912 | ||||||||||||||||||||||
|
Noncontrolling interests |
8 | 24 | ||||||||||||||||||||||
|
Total shareholders’ equity |
6,192 | 5,936 | ||||||||||||||||||||||
|
Total liabilities and shareholders’ equity |
$ | 51,627 | $ | 54,048 | ||||||||||||||||||||
|
Spread on average interest-bearing funds |
3.12 | % | 3.52 | % | ||||||||||||||||||||
|
Taxable-equivalent net interest income and net yield
|
$ | 1,749.1 | 3.73 | % | $ | 1,920.8 | 3.94 | % | ||||||||||||||||
| 1 |
Taxable-equivalent rates used where applicable. |
| 2 |
Net of unearned income and fees, net of related costs. Loans include nonaccrual and restructured loans. |
38
Table of Contents
| 2008 | 2007 | 2006 | ||||||||||||||||||||||||||||||||
|
Average
balance |
Amount
of
interest 1 |
Average
rate |
Average
balance |
Amount
of
interest 1 |
Average
rate |
Average
balance |
Amount
of
interest 1 |
Average
rate |
||||||||||||||||||||||||||
| $ | 1,889 | $ | 47.8 | 2.53 | % | $ | 834 | $ | 43.7 | 5.24 | % | $ | 479 | $ | 24.7 | 5.16 | % | |||||||||||||||||
| 1,516 | 101.3 | 6.68 | 684 | 47.7 | 6.97 | 645 | 44.1 | 6.83 | ||||||||||||||||||||||||||
| 3,266 | 162.1 | 4.97 | 4,661 | 269.2 | 5.78 | 4,992 | 285.5 | 5.72 | ||||||||||||||||||||||||||
| 43 | 1.9 | 4.41 | 61 | 3.3 | 5.40 | 157 | 7.7 | 4.91 | ||||||||||||||||||||||||||
| 4,825 | 265.3 | 5.50 | 5,406 | 320.2 | 5.92 | 5,794 | 337.3 | 5.82 | ||||||||||||||||||||||||||
| 182 | 10.1 | 5.52 | 233 | 14.9 | 6.37 | 261 | 16.5 | 6.30 | ||||||||||||||||||||||||||
| 40,795 | 2,674.4 | 6.56 | 36,575 | 2,852.7 | 7.80 | 32,134 | 2,463.9 | 7.67 | ||||||||||||||||||||||||||
| – | – | – | – | – | – | – | – | – | ||||||||||||||||||||||||||
| 40,795 | 2,674.4 | 6.56 | 36,575 | 2,852.7 | 7.80 | 32,134 | 2,463.9 | 7.67 | ||||||||||||||||||||||||||
| 47,691 | 2,997.6 | 6.29 | 43,048 | 3,231.5 | 7.51 | 38,668 | 2,842.4 | 7.35 | ||||||||||||||||||||||||||
| 1,380 | 1,477 | 1,476 | ||||||||||||||||||||||||||||||||
| (546 | ) | (391 | ) | (349 | ) | |||||||||||||||||||||||||||||
| 1,937 | 2,005 | 1,887 | ||||||||||||||||||||||||||||||||
| 137 | 181 | 181 | ||||||||||||||||||||||||||||||||
| 3,163 | 2,527 | 2,379 | ||||||||||||||||||||||||||||||||
| $ | 53,762 | $ | 48,847 | $ | 44,242 | |||||||||||||||||||||||||||||
| $ | 4,446 | 35.6 | 0.80 | $ | 4,443 | 41.4 | 0.93 | $ | 4,180 | 30.8 | 0.74 | |||||||||||||||||||||||
| 13,739 | 335.0 | 2.44 | 11,962 | 437.9 | 3.66 | 11,670 | 374.5 | 3.21 | ||||||||||||||||||||||||||
| 2,695 | 96.2 | 3.57 | 2,529 | 110.7 | 4.38 | 2,065 | 77.4 | 3.75 | ||||||||||||||||||||||||||
| 4,382 | 161.9 | 3.69 | 4,779 | 231.2 | 4.84 | 3,272 | 142.6 | 4.36 | ||||||||||||||||||||||||||
| 3,166 | 84.2 | 2.66 | 2,710 | 130.5 | 4.81 | 2,065 | 95.5 | 4.62 | ||||||||||||||||||||||||||
| 28,428 | 712.9 | 2.51 | 26,423 | 951.7 | 3.60 | 23,252 | 720.8 | 3.10 | ||||||||||||||||||||||||||
| 33 | 1.5 | 4.82 | 30 | 1.4 | 4.56 | 66 | 3.0 | 4.57 | ||||||||||||||||||||||||||
|
|
2,733 |
|
53.3 | 1.95 | 3,211 | 148.5 | 4.62 | 2,838 | 124.7 | 4.39 | ||||||||||||||||||||||||
| 4,699 | 124.0 | 2.64 | 1,355 | 68.8 | 5.08 | 699 | 36.7 | 5.25 | ||||||||||||||||||||||||||
| 2,577 | 110.5 | 4.29 | 2,496 | 153.0 | 6.13 | 2,639 | 168.2 | 6.37 | ||||||||||||||||||||||||||
| 10,042 | 289.3 | 2.88 | 7,092 | 371.7 | 5.24 | 6,242 | 332.6 | 5.33 | ||||||||||||||||||||||||||
| 38,470 | 1,002.2 | 2.61 | 33,515 | 1,323.4 | 3.95 | 29,494 | 1,053.4 | 3.57 | ||||||||||||||||||||||||||
| 9,145 | 9,401 | 9,508 | ||||||||||||||||||||||||||||||||
| 578 | 647 | 697 | ||||||||||||||||||||||||||||||||
| 48,193 | 43,563 | 39,699 | ||||||||||||||||||||||||||||||||
| 432 | 240 | 16 | ||||||||||||||||||||||||||||||||
| 5,108 | 5,008 | 4,493 | ||||||||||||||||||||||||||||||||
| 5,540 | 5,248 | 4,509 | ||||||||||||||||||||||||||||||||
| 29 | 36 | 34 | ||||||||||||||||||||||||||||||||
| 5,569 | 5,284 | 4,543 | ||||||||||||||||||||||||||||||||
| $ | 53,762 | $ | 48,847 | $ | 44,242 | |||||||||||||||||||||||||||||
| 3.68 | % | 3.56 | % | 3.78 | % | |||||||||||||||||||||||||||||
| $ | 1,995.4 | 4.18 | % | $ | 1,908.1 | 4.43 | % | $ | 1,789.0 | 4.63 | % | |||||||||||||||||||||||
39
Table of Contents
Schedule 4 analyzes the year-to-year changes in net interest income on a fully taxable-equivalent basis for the years indicated. For purposes of calculating the yields in these schedules, the average loan balances also include the principal amounts of nonaccrual and restructured loans. However, interest received on nonaccrual loans is included in income only to the extent that cash payments have been received and not applied to principal reductions. In addition, interest on restructured loans is generally accrued at reduced rates.
Schedule 4
ANALYSIS OF INTEREST CHANGES DUE TO VOLUME AND RATE
| 2010 over 2009 | 2009 over 2008 | |||||||||||||||||||||||
| Changes due to |
Total
changes |
Changes due to |
Total
changes |
|||||||||||||||||||||
| (Amounts in millions) | Volume | Rate 1 | Volume | Rate 1 | ||||||||||||||||||||
|
INTEREST-EARNING ASSETS |
||||||||||||||||||||||||
|
Money market investments |
$ | 4.5 | $ | (1.4 | ) | $ | 3.1 | $ | 1.6 | $ | (41.5 | ) | $ | (39.9 | ) | |||||||||
|
Securities: |
||||||||||||||||||||||||
|
Held-to-maturity |
(20.4 | ) | (2.2 | ) | (22.6 | ) | (13.3 | ) | (21.1 | ) | (34.4 | ) | ||||||||||||
|
Available-for-sale |
2.7 | (15.3 | ) | (12.6 | ) | 1.6 | (59.6 | ) | (58.0 | ) | ||||||||||||||
|
Trading account |
(0.5 | ) | – | (0.5 | ) | 1.1 | (0.3 | ) | 0.8 | |||||||||||||||
|
Total securities |
(18.2 | ) | (17.5 | ) | (35.7 | ) | (10.6 | ) | (81.0 | ) | (91.6 | ) | ||||||||||||
|
Loans held for sale |
(1.9 | ) | (0.2 | ) | (2.1 | ) | 2.1 | (1.2 | ) | 0.9 | ||||||||||||||
|
Loans: |
||||||||||||||||||||||||
|
Net loans and leases excluding
|
(192.1 | ) | (20.2 | ) | (212.3 | ) | (19.2 | ) | (373.6 | ) | (392.8 | ) | ||||||||||||
|
FDIC-supported loans |
10.3 | 39.7 | 50.0 | 64.4 | – | 64.4 | ||||||||||||||||||
|
Total loans and leases |
(181.8 | ) | 19.5 | (162.3 | ) | 45.2 | (373.6 | ) | (328.4 | ) | ||||||||||||||
|
Total interest-earning assets |
(197.4 | ) | 0.4 | (197.0 | ) | 38.3 | (497.3 | ) | (459.0 | ) | ||||||||||||||
|
INTEREST-BEARING LIABILITIES |
||||||||||||||||||||||||
|
Interest-bearing deposits: |
||||||||||||||||||||||||
|
Savings and NOW |
3.9 | (5.0 | ) | (1.1 | ) | 2.4 | (16.4 | ) | (14.0 | ) | ||||||||||||||
|
Money market |
(11.4 | ) | (99.0 | ) | (110.4 | ) | 46.0 | (164.6 | ) | (118.6 | ) | |||||||||||||
|
Time under $100,000 |
(9.4 | ) | (31.7 | ) | (41.1 | ) | 5.1 | (31.8 | ) | (26.7 | ) | |||||||||||||
|
Time $100,000 and over |
(21.4 | ) | (45.7 | ) | (67.1 | ) | (1.4 | ) | (62.0 | ) | (63.4 | ) | ||||||||||||
|
Foreign |
(2.3 | ) | (6.6 | ) | (8.9 | ) | (10.7 | ) | (54.8 | ) | (65.5 | ) | ||||||||||||
|
Total interest-bearing deposits |
(40.6 | ) | (188.0 | ) | (228.6 | ) | 41.4 | (329.6 | ) | (288.2 | ) | |||||||||||||
|
Borrowed funds: |
||||||||||||||||||||||||
|
Securities sold, not yet purchased |
(0.1 | ) | (0.3 | ) | (0.4 | ) | 0.5 | 0.2 | 0.7 | |||||||||||||||
|
Federal funds purchased and security
|
(1.6 | ) | (2.6 | ) | (4.2 | ) | (2.5 | ) | (45.1 | ) | (47.6 | ) | ||||||||||||
|
Other short-term borrowings |
(2.6 | ) | 5.1 | 2.5 | (98.0 | ) | (19.2 | ) | (117.2 | ) | ||||||||||||||
|
Long-term debt |
(33.4 | ) | 238.8 | 205.4 | (6.8 | ) | 74.7 | 67.9 | ||||||||||||||||
|
Total borrowed funds |
(37.7 | ) | 241.0 | 203.3 | (106.8 | ) | 10.6 | (96.2 | ) | |||||||||||||||
|
Total interest-bearing liabilities |
(78.3 | ) | 53.0 | (25.3 | ) | (65.4 | ) | (319.0 | ) | (384.4 | ) | |||||||||||||
|
Change in taxable-equivalent net
|
$ | (119.1 | ) | $ | (52.6 | ) | $ | (171.7 | ) | $ | 103.7 | $ | (178.3 | ) | $ | (74.6 | ) | |||||||
| 1 |
Taxable-equivalent income used where applicable. |
| 2 |
Net of unearned income and fees. Loans include nonaccrual and restructured loans. |
In the analysis of interest changes due to volume and rate, changes due to the volume/rate variance are allocated to volume with the following exceptions: when volume and rate both increase, the variance is allocated proportionately to both volume and rate; when the rate increases and volume decreases, the variance is allocated to the rate.
40
Table of Contents
Provisions for Credit Losses
The provision for loan losses is the amount of expense that, in our judgment, is required to maintain the allowance for loan losses at an adequate level based upon our estimate of losses inherent in the loan portfolio. The provision for unfunded lending commitments is used to maintain the reserve for unfunded lending commitments at an adequate level based upon the inherent risks associated with such commitments. In determining adequate levels of the allowance and reserve, we perform periodic evaluations of the Company’s various portfolios, the levels of actual charge-offs, and statistical trends and other economic factors. See Note 6 of the Notes to the Consolidated Financial Statements and “Credit Risk Management” on page 62 for more information on how we determine the appropriate level for the allowance for loan and lease losses and the reserve for unfunded lending commitments.
The provision for loan losses for the year ended December 31, 2010 was $852.1 million compared to $2,016.9 million in 2009, and $648.3 million in 2008. The decrease in the provision for 2010 reflected an improvement in the credit quality metrics of the loan portfolio, including lower levels of criticized and classified loans, lower realized loss content in the loan segments and lower balances in construction and land development loans, which declined by 35.8% from 2009. The increased provision for 2009 was attributable to a higher level of criticized and classified loans, higher realized loss content in these loan segments, and continued deterioration in collateral values primarily in construction and land development loans.
Net loan and lease charge-offs fell to $968.9 million in 2010, compared to $1,172.6 million in 2009, and $393.7 million in 2008. See Note 6 of the Notes to the Consolidated Financial Statements, “Nonperforming Assets” on page 69, and “Allowance and Reserve for Credit Losses” on page 73 for further details.
The provision for unfunded lending commitments was $(4.7) million for 2010, as a result of improving credit quality of such commitments. The provision was $65.5 million in 2009 and $1.4 million in 2008. From period to period, the amounts of unfunded lending commitments may be subject to sizeable fluctuations due to changes in the timing and volume of loan commitments, originations, and funding, as well as historical loss experience.
Although the quality of the loan portfolio continues to be a concern, most measures of credit quality showed significant improvement in the second half of 2010, but with variations among geographies and loan types. In 2010, the Company also experienced a decrease in special mention, classified, nonaccrual, and past due loans, as well as improvements in other credit metrics. The Company’s expectation is that credit costs will improve in 2011 due to significant reductions in loan balances in loan categories that have exhibited higher loss rates, such as construction and land development loans. We also anticipate reductions in criticized and classified loans of most types, and expect stabilization of economic conditions. As a result, we expect continued reduction in the levels of provisioning and net charge-offs for at least the next several quarters, compared to the recent elevated levels.
Noninterest Income
Noninterest income represents revenues the Company earns for products and services that have no interest rate or yield associated with them. Noninterest income for 2010 was $440.5 million, compared to $804.1 million and $190.7 million for 2009 and 2008, respectively. Schedule 5 presents a comparison of the major components of noninterest income for the past three years.
41
Table of Contents
Schedule 5
NONINTEREST INCOME
| (Amounts in millions) | 2010 |
Percent
change |
2009 |
Percent
change |
2008 | |||||||||||||||
|
Service charges and fees on deposit accounts |
$ | 199.7 | (6.1 | )% | $ | 212.6 | 2.7 | % | $ | 207.0 | ||||||||||
|
Other service charges, commissions and fees |
165.3 | 5.6 | 156.5 | (6.7 | ) | 167.7 | ||||||||||||||
|
Trust and wealth management income |
27.5 | (8.3 | ) | 30.0 | (20.4 | ) | 37.7 | |||||||||||||
|
Capital markets and foreign exchange |
37.6 | (25.2 | ) | 50.3 | 0.8 | 49.9 | ||||||||||||||
|
Dividends and other investment income |
33.1 | 24.4 | 26.6 | (42.7 | ) | 46.4 | ||||||||||||||
|
Loan sales and servicing income |
29.4 | 31.8 | 22.3 | (8.6 | ) | 24.4 | ||||||||||||||
|
Fair value and nonhedge derivative income (loss) |
(15.8 | ) | (113.9 | ) | 113.8 | 337.1 | (48.0 | ) | ||||||||||||
|
Equity securities gains (losses), net |
(6.0 | ) | (233.3 | ) | (1.8 | ) | (325.0 | ) | 0.8 | |||||||||||
|
Fixed income securities gains (losses), net |
11.1 | 392.1 | (3.8 | ) | (575.0 | ) | 0.8 | |||||||||||||
|
Impairment losses on investment securities: |
||||||||||||||||||||
|
Impairment losses on investment securities |
(156.5 | ) | 72.5 | (569.9 | ) | (87.5 | ) | (304.0 | ) | |||||||||||
|
Noncredit-related losses on securities not expected to be sold (recognized in other comprehensive income) |
71.1 | (75.4 | ) | 289.4 | 100.0 | – | ||||||||||||||
|
Net impairment losses on investment securities |
(85.4 | ) | 69.6 | (280.5 | ) | 7.7 | (304.0 | ) | ||||||||||||
|
Valuation losses on securities purchased |
– | 100.0 | (212.1 | ) | (1,519.1 | ) | (13.1 | ) | ||||||||||||
|
Gain on subordinated debt modification |
– | (100.0 | ) | 508.9 | 100.0 | – | ||||||||||||||
|
Gain on subordinated debt exchange |
14.5 | 100.0 | – | – | – | |||||||||||||||
|
Acquisition related gains |
– | (100.0 | ) | 169.2 | 100.0 | – | ||||||||||||||
|
Other |
29.5 | 143.8 | 12.1 | (42.7 | ) | 21.1 | ||||||||||||||
|
Total |
$ | 440.5 | (45.2 | ) | $ | 804.1 | 321.7 | $ | 190.7 | |||||||||||
Service charges and fees on deposit accounts decreased by $12.9 million, or 6.1% from 2009. This decline is a reflection of the decrease in deposits, as well as a decrease in nonsufficient-funds and overdraft fees due to changes in Regulation E. Service charges and fees on deposit accounts increased by $5.6 million between 2008 and 2009, largely due to the additional accounts obtained through the acquisition of three failed banks from the FDIC, as well as reduced business deposit account earnings credits caused by lower interest rates.
Other service charges, commissions, and fees, which are comprised of ATM fees, insurance commissions, bankcard merchant fees, debit card interchange fees, cash management fees, lending commitment fees, syndication and servicing fees and other miscellaneous fees increased by $8.8 million, or 5.6% from 2009. The increase was mostly due to increased loan, ATM, debit card, and bankcard fees, partially offset by decreased licensing fees and mutual fund commissions. The decrease in licensing fees is primarily attributable to the sale of NetDeposit’s assets.
Other service charges, commissions, and fees decreased $11.2 million, or 6.7% during 2009 compared to 2008. This was mostly due to lower lending related fees, official check fees, mutual fund commission fees and cash management related fees, offset by increased accounts receivable factoring fees.
Capital markets and foreign exchange includes trading income, public finance fees, foreign exchange income, and other capital market related fees. In 2010 this income decreased to $37.6 million from $50.3 million and $49.9 million earned in 2009 and 2008, respectively. Most of the decline from 2009 to 2010 was caused by decreases in commissions and trading income. The fluctuation from 2008 to 2009 was primarily driven by increased trading income, partially offset by lower public finance fees.
Dividends and other investment income consist of revenue from the Company’s bank-owned life insurance program and revenues from other investments. Revenues from other investments include dividends on FHLB
42
Table of Contents
stock, Federal Reserve Bank stock, and earnings from unconsolidated affiliates including certain alternative venture investments. Dividends and other investment income increased by $6.5 million in 2010 compared to 2009. For the most part, the increase was caused by increased income from investments in several unconsolidated affiliates, and an increase in dividends on Federal Reserve stock, partially offset by decreased income from bank-owned life insurance contracts. Income from bank-owned life insurance decreased due to the Company surrendering certain life insurance contracts during 2010.
Dividends and other investment income was $26.6 million in 2009 and $46.4 million in 2008. The decline in 2009 was primarily due to a $14.7 million decrease in earnings from Amegy’s alternative investments program, a $14.4 million decrease in earnings from two investment funds, and a $5.7 million decrease in dividends on FHLB stock. Additionally, revenue from bank-owned life insurance programs decreased to $25.1 million during 2009 from $30.7 million in 2008. These decreases were somewhat offset by a $13.6 million increase in equity in earnings of Farmer Mac and a $7.1 million increase in dividends and equity in earnings on other investments.
Fair value and nonhedge derivative income (loss) consists of the following:
Schedule 6
FAIR VALUE AND NONHEDGE DERIVATIVE INCOME (LOSS)
| (Amounts in millions) | 2010 |
Percent
change |
2009 |
Percent
change |
2008 | |||||||||||||||
|
Nonhedge derivative income (loss) |
$ | 10.5 | (90.6 | )% | $ | 111.9 | 409.1 | % | $ | (36.2 | ) | |||||||||
|
Total return swap |
(22.8 | ) | (100.0 | ) | – | – | – | |||||||||||||
|
Fair value decreases on instruments elected under fair value option |
– | 100.0 | (0.9 | ) | 90.2 | (9.2 | ) | |||||||||||||
|
Derivative fair value credit adjustments |
(3.5 | ) | (216.7 | ) | 3.0 | 196.8 | (3.1 | ) | ||||||||||||
|
Other |
– | 100.0 | (0.2 | ) | (140.0 | ) | 0.5 | |||||||||||||
|
Total |
$ | (15.8 | ) | 113.9 | $ | 113.8 | 337.1 | $ | (48.0 | ) | ||||||||||
During 2010, the Company terminated fewer cash flow hedges than in 2009. Nonhedge derivative income included $9.0 million in 2010 and $104.7 million in 2009 due to the acceleration of income from OCI to earnings for certain terminated cash flow hedges. The amount accelerated in 2009 was due to declining loan balances, which caused the reclassification to earnings of 100% of the OCI balances for many of the terminated hedges. There were fewer reclassifications in 2010. In 2010 the Company also recorded $22.8 million of negative fair value on the TRS agreement entered into during the third quarter.
Net gains from fixed income securities were $11.1 million in 2010, compared to a net loss of $3.8 million in 2009. Most of the gains realized in 2010 are attributable to the sale of certain auction rate securities, which were redeemed from customers in 2009. These securities were previously written down, but sold at par.
The Company recognized net impairment losses on investment securities of $85.4 million during 2010 compared to $280.5 million and $304.0 million in 2009 and 2008, respectively. The total impairment loss for 2010 was $156.5 million and included $71.1 million of noncredit-related OTTI which was charged against OCI. These OTTI losses were primarily from certain CDOs, including bank and insurance CDOs. See “Investment Securities Portfolio” on page 52 for additional information, including certain changes in modeling assumptions.
Valuation losses on securities purchased in 2009 consisted of $187.9 million from purchases of securities from Lockhart, prior to fully consolidating Lockhart in June 2009, and $24.2 million for valuation adjustments to auction rate securities which were purchased from customers during the first quarter of 2009.
In 2009, the Company recorded a gain on subordinated debt modification of $508.9 million. The Company exchanged approximately $200 million of subordinated notes for new notes with the same terms. The remaining $1.2 billion of subordinated notes were modified to permit conversion on a par for par basis into either the Company’s Series A or Series C preferred stock.
43
Table of Contents
Acquisition related gains of $169.2 million in 2009 resulted from the Company’s acquisition of failed banks from the FDIC with loss sharing agreements. The Company recognized $146.5 million of gains resulting from the acquisition of Vineyard Bank, acquired from the FDIC on July 17, 2009. The remaining $22.7 million of acquisition related gains were from the acquisitions of the failed Alliance Bank on February 6, 2009 by CB&T and Great Basin Bank on April 17, 2009 by NSB. The gains resulted from the acquisition of assets that had fair values in excess of the fair value of liabilities assumed.
During 2010, the Company exchanged $55.6 million of nonconvertible subordinated debt for 2,165,391 shares of common stock, resulting in a $14.5 million gain.
Other noninterest income in 2010 reached $29.5 million, compared to $12.1 million in 2009 and $21.1 million in 2008. The increase in 2010 included a $13.7 million pre-tax gain from the sale of substantially all of the assets of a wholly-owned subsidiary, NetDeposit, LLC to BServ, Inc.
Noninterest Expense
Noninterest expense grew by only 2.8% from 2009, which was 13.3% higher than in 2008. The Company was successful in controlling many operational expense categories, which helped in offsetting the impact of increased costs incurred in credit management and resolution of problem loans. Schedule 7 presents a comparison of the major components of noninterest expense for the past three years.
Schedule 7
NONINTEREST EXPENSE
| (Amounts in millions) | 2010 |
Percent
change |
2009 |
Percent
change |
2008 | |||||||||||||||
|
Salaries and employee benefits |
$ | 825.3 | 0.8 | % | $ | 818.8 | 1.0 | % | $ | 810.5 | ||||||||||
|
Occupancy, net |
113.6 | 1.2 | 112.2 | (1.8 | ) | 114.2 | ||||||||||||||
|
Furniture and equipment |
101.1 | 1.2 | 99.9 | (0.2 | ) | 100.1 | ||||||||||||||
|
Other real estate expense |
144.8 | 30.7 | 110.8 | 119.8 | 50.4 | |||||||||||||||
|
Credit related expense |
71.2 | 58.2 | 45.0 | 86.7 | 24.1 | |||||||||||||||
|
Provision for unfunded lending commitments |
(4.7 | ) | (107.2 | ) | 65.5 | 4,578.6 | 1.4 | |||||||||||||
|
Legal and professional services |
39.5 | 6.2 | 37.2 | (18.2 | ) | 45.5 | ||||||||||||||
|
Advertising |
24.8 | 7.8 | 23.0 | (25.1 | ) | 30.7 | ||||||||||||||
|
FDIC premiums |
102.0 | 1.5 | 100.5 | 405.0 | 19.9 | |||||||||||||||
|
Amortization of core deposit and other intangibles |
25.5 | (19.6 | ) | 31.7 | (4.5 | ) | 33.2 | |||||||||||||
|
Other |
275.8 | 21.6 | 226.9 | (7.4 | ) | 245.0 | ||||||||||||||
|
Total |
$ | 1,718.9 | 2.8 | $ | 1,671.5 | 13.3 | $ | 1,475.0 | ||||||||||||
During 2010 salary costs increased by only 2.5% from 2009. Base salaries remained constant but the Company’s employees earned higher bonuses and incentives. In 2009 salary costs were 2.0% lower than in 2008, mainly from reduced variable pay and staff reductions. The salary costs for 2009 also included share-based compensation expense of approximately $29.8 million, down from $31.8 million for 2008. Employee health and insurance benefits declined by 17.1% during 2010, mostly caused by a reduction in the accrual for incurred-but-not-yet-reported health care claims. The 2009 expense increased by 37.9% from 2008 mainly due to higher health care costs from catastrophic claims.
Salaries and employee benefits are shown in greater detail in Schedule 8.
44
Table of Contents
Schedule 8
SALARIES AND EMPLOYEE BENEFITS
| (Dollar amounts in millions) | 2010 |
Percent
change |
2009 |
Percent
change |
2008 | |||||||||||||||
|
Salaries and bonuses |
$ | 709.5 | 2.5 | % | $ | 692.3 | (2.0 | )% | $ | 706.5 | ||||||||||
|
Employee benefits: |
||||||||||||||||||||
|
Employee health and insurance |
43.1 | (17.1 | ) | 52.0 | 37.9 | 37.7 | ||||||||||||||
|
Retirement |
26.9 | (10.3 | ) | 30.0 | 45.6 | 20.6 | ||||||||||||||
|
Payroll taxes and other |
45.8 | 2.9 | 44.5 | (2.6 | ) | 45.7 | ||||||||||||||
|
Total benefits |
115.8 | (8.5 | ) | 126.5 | 21.6 | 104.0 | ||||||||||||||
|
Total salaries and employee benefits |
$ | 825.3 | 0.8 | $ | 818.8 | 1.0 | $ | 810.5 | ||||||||||||
|
Full-time equivalent (“FTE”) employees at December 31, |
10,524 | – | 10,529 | (4.4 | ) | 11,011 | ||||||||||||||
Other real estate expense increased to $144.8 million in 2010 compared to $110.8 million in 2009 and $50.4 million in 2008. The increase is primarily due to higher volumes of foreclosed properties added to OREO, and continued declines in real estate values, which resulted in increased write-downs of OREO during work-out, partially offset by an increase in net gains from some property sales. OREO expenses increased at Zions Bank, Amegy, NBA, and Vectra, and decreased at NSB and CB&T.
Credit related expense includes costs incurred during the foreclosure process prior to the Company obtaining title to collateral and recording an asset in OREO, as well as other out-of-pocket costs related to the management of problem loans and other assets. These costs were $71.2 million in 2010, compared to $45.0 million and $24.1 million in 2009 and 2008, respectively. The increased costs during these three years are a reflection of the Company’s higher levels of problem loans and its efforts to resolve them.
FDIC premiums were essentially unchanged between 2009 and 2010. During 2009 these premiums increased $80.6 million or 405.0% compared to 2008, due to increased premium rates and a “one-time” special assessment charged by the FDIC.
Other noninterest expense for 2010 amounted to $275.8 million compared to $226.9 million and $245.0 million during 2009 and 2008, respectively. The increase was mostly caused by a one-time structuring fee related to the TRS transaction, and write-downs of the FDIC indemnification asset attributable to loans purchased from the FDIC during 2009. FDIC-supported loans have performed better than expected, and therefore the indemnification asset has declined in value. Also, during 2010 we accrued $8.0 million for an expected non-tax deductible civil money penalty related to alleged violations of the Bank Secrecy Act expected to be assessed by the OCC and the U.S. Treasury Department’s FinCEN bureau. A penalty of this amount was consented to by the Company and announced by the OCC and FinCEN on February 11, 2011.
Impairment Losses on Goodwill
The Company performed a goodwill impairment analysis in the fourth quarter of 2010, and concluded that no impairment losses existed. In 2009 the Company recorded $636.2 million of impairment losses, almost entirely at Amegy. During 2008, impairment losses totaled $353.8 million and occurred at NBA, Vectra, NSB, and other reporting units.
The primary causes of the impairment losses on goodwill in 2009 and 2008 at the Company’s banking reporting units were declines in market values of comparable companies and reduced earnings at the reporting units, which resulted primarily from deterioration in credit quality of the loan portfolios. See Note 10 of the Notes to Consolidated Financial Statements and “Accounting for Goodwill” on page 30 for additional information.
45
Table of Contents
Foreign Operations
Zions Bank, CB&T, Amegy, Vectra, and CBW operate foreign branches in Grand Cayman, Grand Cayman Islands, B.W.I. The branches only accept deposits from qualified domestic customers. While deposits in these branches are not subject to FRB reserve requirements or FDIC insurance premiums, there are no federal or state income tax benefits to the Company or any customers as a result of these operations.
Foreign deposits at December 31, 2010, 2009, and 2008 totaled $1.7 billion, $1.7 billion, and $2.6 billion, respectively, and averaged $1.6 billion for 2010, $2.0 billion for 2009, and $3.2 billion for 2008. All of these foreign deposits were related to domestic customers of the banks. In addition the Company had foreign loan balances totaling $110 million, $65 million, and $43 million at December 31, 2010, 2009, and 2008, respectively.
Income Taxes
The Company’s income tax benefit for 2010 was $106.8 million compared to an income tax benefit of $401.3 million and $43.4 million for 2009 and 2008, respectively. The Company’s effective income tax rates, including the effects of noncontrolling interests, were 26.7% in 2010, 24.8% in 2009 and 14.0% in 2008. The tax benefit rate for 2010 was reduced by the taxable surrender of certain bank-owned life insurance policies and the nondeductibility of a portion of the accelerated discount amortization from the conversion of subordinated debt to preferred stock during the year. The lower tax rates for both 2009 and 2008 are mainly due to nondeductible goodwill impairment charges incurred during the year. The 2009 effective tax rate was higher than in 2008 primarily due to the smaller impact of nondeductible goodwill impairment charges in proportion to overall loss before income taxes. During 2008, the Company reduced its liability for unrecognized tax benefits by approximately $9.6 million, net of any federal and/or state tax benefits. Of this reduction, $5.2 million decreased the Company’s tax expense for 2008 and $4.4 million reduced tax-related balance sheet accounts.
As discussed in previous filings, the Company has received federal income tax credits under the U.S. Government’s Community Development Financial Institutions Fund that are recognized over a seven-year period from the year of investment. The effect of these tax credits was to increase income tax benefit by $6.0 million in 2010, $5.9 million in 2009, and $5.8 million in 2008.
The Company had a DTA balance of approximately $540 million at December 31, 2010, compared to $498 million at December 31, 2009. The increase in the net DTA resulted primarily from items related to nonaccruing loans, OREO, and the decrease in deferred tax liabilities related to FDIC-supported transaction items and the nondeductibility of a portion of the accelerated discount amortization from the conversion of subordinated debt to preferred stock. The Company did not record a valuation allowance for GAAP purposes as of December 31, 2010. See Note 15 of the Notes to Consolidated Financial Statements and “Critical Accounting Policies and Significant Estimates” on page 28 for more information.
BUSINESS SEGMENT RESULTS
The Company manages its banking operations and prepares management reports with a primary focus on its subsidiary banks and the geographies in which they operate. As discussed in the Executive Summary, most of the lending and other decisions affecting customers are made at the local level. Each subsidiary bank holds its own banking charter. Those with national bank charters are subject to regulatory oversight by the OCC. Those with state charters are overseen by the FDIC and applicable state authorities. In addition to its banking businesses, the Company has an Other segment, which includes the Parent, ZMSC, TCBO, and nonbank financial service subsidiaries. These entities are not considered significant to the Company as a whole.
The accounting policies of the individual segments are the same as those of the Company. The Company allocates the cost of centrally provided services to the business segments based upon estimated or actual usage of those services. Note 22 of the Notes to Consolidated Financial Statements contains selected information from the respective balance sheets and statements of income for all segments.
46
Table of Contents
Schedule 9
SELECTED SEGMENT INFORMATION
| (Dollar amounts in millions) | Zions Bank | CB&T | Amegy | NBA | ||||||||||||||||||||||||||||||||||||||||||||
| 2010 | 2009 | 2008 | 2010 | 2009 | 2008 | 2010 | 2009 | 2008 | 2010 | 2009 | 2008 | |||||||||||||||||||||||||||||||||||||
|
KEY FINANCIAL INFORMATION |
||||||||||||||||||||||||||||||||||||||||||||||||
|
Total assets |
$ | 16,157 | $ | 17,652 | $ | 20,778 | $ | 10,766 | $ | 11,097 | $ | 10,137 | $ | 11,406 | $ | 11,145 | $ | 12,406 | $ | 4,397 | $ | 4,524 | $ | 4,864 | ||||||||||||||||||||||||
|
Total deposits |
13,631 | 13,823 | 16,118 | 9,219 | 9,760 | 7,964 | 8,906 | 8,880 | 8,625 | 3,696 | 3,784 | 3,923 | ||||||||||||||||||||||||||||||||||||
|
Net income (loss) applicable to controlling interest |
(48.4 | ) | (202.9 | ) | 106.7 | 58.8 | (50.2 | ) | 38.6 | 58.6 | (780.4 | ) | 125.1 | (7.9 | ) | (144.2 | ) | (218.6 | ) | |||||||||||||||||||||||||||||
|
Net interest margin |
4.39 | % | 3.68 | % | 3.77 | % | 5.04 | % | 4.88 | % | 4.51 | % | 3.98 | % | 3.90 | % | 3.92 | % | 4.30 | % | 3.95 | % | 4.64 | % | ||||||||||||||||||||||||
|
RISK-BASED CAPITAL RATIOS |
||||||||||||||||||||||||||||||||||||||||||||||||
|
Tier 1 leverage |
10.43 | % | 8.84 | % | 6.91 | % | 9.94 | % | 8.81 | % | 8.77 | % | 13.84 | % | 11.79 | % | 8.67 | % | 12.71 | % | 11.59 | % | 15.19 | % | ||||||||||||||||||||||||
|
Tier 1 risk-based capital |
11.66 | % | 10.29 | % | 8.32 | % | 12.40 | % | 10.25 | % | 8.33 | % | 15.60 | % | 12.29 | % | 8.10 | % | 16.90 | % | 14.46 | % | 17.49 | % | ||||||||||||||||||||||||
|
Total risk-based capital |
12.88 | % | 11.52 | % | 11.33 | % | 13.68 | % | 11.51 | % | 11.05 | % | 16.89 | % | 13.57 | % | 11.13 | % | 18.19 | % | 15.76 | % | 18.76 | % | ||||||||||||||||||||||||
|
CREDIT QUALITY |
||||||||||||||||||||||||||||||||||||||||||||||||
|
Provision for loan losses |
$ | 350.6 | $ | 400.4 | $ | 163.1 | $ | 149.9 | $ | 251.5 | $ | 82.9 | $ | 118.7 | $ | 406.1 | $ | 71.9 | $ | 53.4 | $ | 291.7 | $ | 211.8 | ||||||||||||||||||||||||
|
Net loan and lease charge-offs |
321.8 | 255.1 | 75.4 | 140.7 | 144.4 | 61.8 | 157.9 | 143.2 | 24.1 | 111.8 | 214.2 | 147.2 | ||||||||||||||||||||||||||||||||||||
|
Ratio of net loan and lease charge-offs to average loans |
2.39 | % | 1.77 | % | 0.53 | % | 1.64 | % | 1.65 | % | 0.78 | % | 2.02 | % | 1.65 | % | 0.28 | % | 3.33 | % | 5.54 | % | 3.35 | % | ||||||||||||||||||||||||
|
Allowance for loan losses |
$ | 388 | $ | 359 | $ | 214 | $ | 258 | $ | 223 | $ | 116 | $ | 340 | $ | 379 | $ | 116 | $ | 143 | $ | 201 | $ | 124 | ||||||||||||||||||||||||
|
Ratio of allowance for loan losses to net loans and leases, at year-end |
3.01 | % | 2.57 | % | 1.45 | % | 3.05 | % | 2.50 | % | 1.48 | % | 4.55 | % | 4.58 | % | 1.28 | % | 4.36 | % | 5.57 | % | 3.01 | % | ||||||||||||||||||||||||
|
Nonperforming lending-related assets |
$ | 563.0 | $ | 772.7 | $ | 412.4 | $ | 273.6 | $ | 657.7 | $ | 147.0 | $ | 409.2 | $ | 549.5 | $ | 56.7 | $ | 209.9 | $ | 320.2 | $ | 273.0 | ||||||||||||||||||||||||
|
Ratio of nonperforming lending-related assets to net loans and leases and other
|
4.31 | % | 5.45 | % | 2.79 | % | 3.22 | % | 7.28 | % | 1.87 | % | 5.40 | % | 6.52 | % | 0.62 | % | 6.22 | % | 8.66 | % | 6.49 | % | ||||||||||||||||||||||||
|
Accruing loans past due 90 days or more |
$ | 8.9 | $ | 53.0 | $ | 83.5 | $ | 123.4 | $ | 67.8 | $ | 7.4 | $ | 7.8 | $ | 14.4 | $ | 5.5 | $ | 1.6 | $ | 14.2 | $ | 17.0 | ||||||||||||||||||||||||
|
Ratio of accruing loans past due 90 days or more to net loans and leases |
0.07 | % | 0.38 | % | 0.57 | % | 1.46 | % | 0.76 | % | 0.09 | % | 0.10 | % | 0.17 | % | 0.06 | % | 0.05 | % | 0.39 | % | 0.41 | % | ||||||||||||||||||||||||
47
Table of Contents
| NSB | Vectra | TCBW | ||||||||||||||||||||||||||||||||||
| 2010 | 2009 | 2008 | 2010 | 2009 | 2008 | 2010 | 2009 | 2008 | ||||||||||||||||||||||||||||
|
KEY FINANCIAL INFORMATION |
||||||||||||||||||||||||||||||||||||
|
Total assets |
$ | 4,017 | $ | 4,187 | $ | 4,063 | $ | 2,299 | $ | 2,440 | $ | 2,722 | $ | 850 | $ | 835 | $ | 880 | ||||||||||||||||||
|
Total deposits |
3,424 | 3,526 | 3,514 | 1,923 | 2,005 | 2,127 | 662 | 632 | 603 | |||||||||||||||||||||||||||
|
Net income (loss) applicable to controlling interest |
(70.3 | ) | (352.0 | ) | (45.8 | ) | 6.6 | (25.6 | ) | (135.0 | ) | (0.5 | ) | 1.6 | 14.0 | |||||||||||||||||||||
|
Net interest margin |
3.60 | % | 3.50 | % | 4.43 | % | 5.02 | % | 4.52 | % | 4.31 | % | 3.84 | % | 4.06 | % | 4.05 | % | ||||||||||||||||||
|
RISK-BASED CAPITAL RATIOS |
||||||||||||||||||||||||||||||||||||
|
Tier 1 leverage |
12.66 | % | 13.10 | % | 12.75 | % | 12.05 | % | 10.91 | % | 7.16 | % | 10.62 | % | 10.57 | % | 8.66 | % | ||||||||||||||||||
|
Tier 1 risk-based capital |
21.12 | % | 18.71 | % | 14.31 | % | 12.55 | % | 10.93 | % | 7.82 | % | 12.90 | % | 12.60 | % | 10.33 | % | ||||||||||||||||||
|
Total risk-based capital |
22.48 | % | 20.07 | % | 15.58 | % | 13.83 | % | 12.21 | % | 11.23 | % | 14.16 | % | 13.86 | % | 13.32 | % | ||||||||||||||||||
|
CREDIT QUALITY |
||||||||||||||||||||||||||||||||||||
|
Provision for loan losses |
$ | 133.3 | $ | 563.7 | $ | 100.3 | $ | 28.2 | $ | 78.5 | $ | 15.9 | $ | 17.4 | $ | 22.5 | $ | 1.1 | ||||||||||||||||||
|
Net loan and lease charge-offs |
187.7 | 366.4 | 71.6 | 32.3 | 31.8 | 13.6 | 15.7 | 15.3 | (0.1 | ) | ||||||||||||||||||||||||||
|
Ratio of net loan and lease charge-offs to average loans |
7.37 | % | 11.87 | % | 2.23 | % | 1.72 | % | 1.57 | % | 0.66 | % | 2.72 | % | 2.59 | % | (0.03 | )% | ||||||||||||||||||
|
Allowance for loan losses |
$ | 226 | $ | 280 | $ | 82 | $ | 70 | $ | 74 | $ | 27 | $ | 15 | $ | 13 | $ | 6 | ||||||||||||||||||
|
Ratio of allowance for loan losses to net loans
|
9.42 | % | 10.17 | % | 2.58 | % | 3.84 | % | 3.72 | % | 1.32 | % | 2.65 | % | 2.32 | % | 1.05 | % | ||||||||||||||||||
|
Nonperforming lending-related assets |
$ | 250.6 | $ | 333.4 | $ | 222.0 | $ | 100.3 | $ | 105.9 | $ | 25.0 | $ | 20.9 | $ | 29.5 | $ | – | ||||||||||||||||||
|
Ratio of nonperforming lending-related assets to net loans
|
10.31 | % | 11.88 | % | 6.85 | % | 5.44 | % | 5.29 | % | 1.21 | % | 3.64 | % | 5.09 | % | – | |||||||||||||||||||
|
Accruing loans past due 90 days or more |
$ | 0.2 | $ | 12.5 | $ | 14.4 | $ | 0.2 | $ | 1.4 | $ | 1.7 | $ | – | $ | – | $ | – | ||||||||||||||||||
|
Ratio of accruing loans past due 90 days or more
|
0.01 | % | 0.45 | % | 0.45 | % | 0.01 | % | 0.07 | % | 0.08 | % | – | – | – | |||||||||||||||||||||
The above amounts do not include intercompany eliminations.
Zions Bank
Zions Bank is headquartered in Salt Lake City, Utah and is primarily responsible for conducting the Company’s operations in Utah and Idaho. Zions Bank is the 2 nd largest full-service commercial bank in Utah and the 3 rd largest in Idaho, as measured by domestic deposits in the state. Zions Bank includes most of the Company’s Capital Markets operations, which include Zions Direct, Inc., fixed income securities trading, correspondent banking, public finance, trust and investment advisory services, and Western National Trust Company.
The net interest margin increased substantially to 4.39% in 2010 from 3.68% in 2009. Nonperforming lending-related assets decreased by 27.1% from the prior year due to extensive efforts to work out problem loans and to sell OREO properties. The loan portfolio decreased by $1.1 billion during 2010, which included a $0.6 billion decrease in commercial lending and a $0.3 billion decrease in commercial construction and land development loans. Accruing loans past due 90 days or more decreased to $8.9 million at December 31, 2010 compared to $53.0 million at December 31, 2009. Total deposits at December 31, 2010 were lower than at December 31, 2009.
48
Table of Contents
California Bank & Trust
California Bank & Trust is the 13 th largest full-service commercial bank in California as measured by domestic deposits in the state.
CB&T’s core business is built on relationship banking by providing commercial, real estate and consumer lending, depository services, international banking, cash management, and community development services. In 2009, CB&T acquired certain assets and liabilities of Alliance Bank and Vineyard Bank from the FDIC as receiver of these failed banks. The loans and other real estate acquired are covered by loss sharing agreements with the FDIC.
During 2010, CB&T’s net interest margin and net operating results exceeded our other subsidiary banks. Most notable in 2010 was the better-than-expected performance of the acquired loans from the failed banks. CB&T was also able to significantly reduce its nonperforming lending-related assets, which declined by 58.4% from the prior year. Total deposits at December 31, 2010 were 5.5% lower than at December 31, 2009. The provision for loan losses decreased by 40.4% during 2010 and the ratio of nonperforming lending-related assets to net loans and leases and OREO decreased to 3.22% from 7.28%. In 2010, the composition of CB&T’s loan portfolio experienced a $0.3 billion decrease in commercial construction and land development loans and a $0.2 billion increase in commercial real estate term loans, as well as a $0.4 billion decrease in the balances of the loans acquired from the failed banks.
Amegy Corporation
Amegy is headquartered in Houston, Texas and operates Amegy Bank, Amegy Mortgage Company, Amegy Investments, and Amegy Insurance Agency. Amegy Bank is the 6 th largest full-service commercial bank in Texas as measured by domestic deposits in the state.
Over the past three years, Amegy has been able to maintain a relatively constant net interest margin and achieved profitability in 2010 after experiencing a loss in 2009. Nonperforming lending-related assets decreased by 25.5% from the prior year. Total deposits increased from 2009 by 0.3%. During 2010, Amegy’s portfolio of commercial construction and land development loans decreased by $0.8 billion from 2009, while commercial real estate term loans grew by $0.1 billion.
National Bank of Arizona
National Bank of Arizona is the 4 th largest full-service commercial bank in Arizona as measured by domestic deposits in the state.
NBA’s 2010 net loss of $7.9 million was a significant improvement from substantial losses incurred in the previous two years. Nonperforming lending-related assets decreased by 34.4% from the prior year. Accruing loans past due 90 days or more decreased to $1.6 million at December 31, 2010 from $14.2 million at December 31, 2009. During 2010, NBA was able to grow its commercial lending and commercial real estate term loans by $39 million and $23 million, respectively. Its portfolio of construction and land development loans decreased by $273 million and consumer lending decreased by $123 million. Total deposits at December 31, 2010 were 2.3% lower than in the prior year, as NBA decreased interest rates paid on CDs and certain other accounts in an effort to decrease excess customer deposits.
Nevada State Bank
Nevada State Bank is the 4 th largest full-service commercial bank in Nevada as measured by domestic deposits in the state. NSB focuses on serving small and mid-sized businesses as well as retail consumers, with an emphasis in relationship banking.
49
Table of Contents
During 2009, NSB acquired the banking operations of the former Great Basin Bank of Elko, Nevada, in an FDIC-assisted transaction. The acquisition consisted of approximately $212 million of assets, including the entire loan portfolio. The loan portfolio is covered by a loss sharing agreement with the FDIC.
The markets in which NSB operates are dependent on tourism and construction, and were severely impacted by the recent recession. At December 31, 2010, Nevada’s unemployment rate was one of the highest in the nation, and its housing market continued to suffer from a high rate of foreclosures. The contraction of NSB’s loan portfolio by $353 million was primarily due to decreased commercial real estate lending.
Despite the economic challenges in the local market, some of NSB’s 2010 results improved over the previous year. The net loss of $70.3 million in 2010 was substantially down from $352.0 million in 2009. The net interest margin increased slightly during 2010 after declining during 2009. Nonperforming lending-related assets decreased by 24.8% from the prior year. Net loan and lease charge-offs declined by 48.8% and at December 31, 2010, accruing loans past due 90 days or more were $0.2 million compared to $12.5 million at December 31, 2009. NSB’s total deposits at December 31, 2010 were 2.9% lower than at December 31, 2009.
Vectra Bank Colorado
Vectra Bank Colorado, N.A. is the 10 th largest full-service commercial bank in Colorado as measured by domestic deposits in the state.
Vectra returned to profitability in 2010 with net income of $6.6 million, even though it continued to struggle with the effects of the recent recession on its loan portfolio. Nonperforming lending-related assets decreased slightly to $100.3 million at December 31, 2010 from $105.9 million at December 31, 2009. Vectra’s loan portfolio declined by $169 million from 2009 including a $92 million decrease in commercial lending and an $84 million decrease in commercial construction and land development loans. Total deposits at December 31, 2010 were 4.1% lower than at December 31, 2009.
The Commerce Bank of Washington
The Commerce Bank of Washington is headquartered in Seattle, Washington, and operates out of a single office located in the Seattle central business district. Its business strategy focuses on serving the financial needs of commercial businesses, including professional services firms. TCBW has been successful in serving the greater Seattle/Puget Sound region without requiring extensive investments into a traditional branch network. It has been innovative in effectively utilizing couriers, bank by mail, remote deposit image capture, and other technologies.
TCBW had a net loss of $0.5 million in 2010, following net income of $1.6 million in 2009 and $14.0 million in 2008. Nonperforming lending-related assets decreased by 29.2% in 2010 from the prior year. The commercial lending portfolio decreased by $13 million, but commercial real estate term loans increased by $14 million. Total deposits were 4.7% higher at December 31, 2010 than at December 31, 2009.
50
Table of Contents
Interest-Earning Assets
Interest-earning assets are those assets that have interest rates or yields associated with them. One of our goals is to maintain a high level of interest-earning assets relative to total assets, while keeping nonearning assets at a minimum. Interest-earning assets consist of money market investments, securities, loans, and leases. Schedule 3, which we referred to in our discussion of net interest income, includes the average balances of the Company’s interest earning assets, the amount of revenue generated by them, and their respective yields. Another one of our goals is to maintain a higher-yielding mix of interest earning assets, such as loans, relative to lower-yielding assets, such as money market investments and securities. The current period of slow economic growth, accompanied by low demand throughout 2009 and much of 2010, has made it difficult to consistently achieve these goals.
Average interest-earning assets declined by 3.9% to $46.9 billion in 2010 compared to $48.8 billion in 2009, mainly driven by decreases in the average loan and securities portfolios. However, average interest-earning assets as a percentage of total average assets increased slightly during 2010 to 90.8% compared to 90.2% in 2009.
Average money market investments, consisting of interest-bearing deposits and federal funds sold and security resell agreements, increased by 71.6% to $4.1 billion in 2010 compared to $2.4 billion in 2009. The increase in average money market investments reflects the increase in the Company’s liquidity during 2010. Average securities decreased by 6.6%, and average net loans and leases decreased by 7.9% for 2010 when compared to 2009. These changes are primarily the result of weak customer demand for new and refinanced loans.
Chart 5 illustrates recent trends in loan and deposit balances.
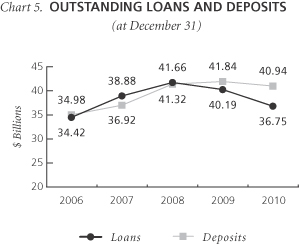
51
Table of Contents
Investment Securities Portfolio
We invest in securities both to generate revenues for the Company and to manage liquidity. The following schedules present a profile of the Company’s investment portfolios with asset-backed securities classified by credit ratings. The amortized cost amounts represent the Company’s original cost for the investments, adjusted for accumulated amortization or accretion of any yield adjustments related to the security and credit impairment losses. The estimated fair value measurement levels and methodology are discussed in detail in Note 21 of the Notes to Consolidated Financial Statements.
Schedules 10 and 11 present the Company’s asset-backed securities, classified by the highest of the ratings and the lowest of the ratings from any of Moody’s Investors Service, Fitch Ratings or Standard & Poors.
In the discussion of our investment portfolio below, we have included certain credit rating information because the information is one indication of the degree of credit risk to which we are exposed, and significant changes in ratings classifications for our investment portfolio could indicate an increased level of risk for the Company.
52
Table of Contents
Schedule 10
INVESTMENT SECURITIES PORTFOLIO
ASSET-BACKED SECURITIES CLASSIFIED AT HIGHEST CREDIT RATING*
AT DECEMBER 31, 2010
| (In millions) |
Par
value |
Amortized
cost |
Net unrealized
gains (losses) recognized in OCI 1 |
Carrying
value |
Net unrealized
gains (losses) not recognized in OCI 1 |
Estimated
fair value |
||||||||||||||||||
|
Held-to-maturity: |
||||||||||||||||||||||||
|
Municipal securities |
$ | 580 | $ | 578 | $ | – | $ | 578 | $ | 4 | $ | 582 | ||||||||||||
|
Asset-backed securities: |
||||||||||||||||||||||||
|
Trust preferred securities – predominantly bank |
||||||||||||||||||||||||
|
Noninvestment grade |
88 | 88 | (10 | ) | 78 | (24 | ) | 54 | ||||||||||||||||
|
Noninvestment grade – OTTI/PIK’d 2 |
1 | – | (1 | ) | (1 | ) | 1 | – | ||||||||||||||||
| 89 | 88 | (11 | ) | 77 | (23 | ) | 54 | |||||||||||||||||
|
Trust preferred securities – predominantly insurance |
||||||||||||||||||||||||
|
Noninvestment grade |
175 | 175 | (13 | ) | 162 | (27 | ) | 135 | ||||||||||||||||
| 175 | 175 | (13 | ) | 162 | (27 | ) | 135 | |||||||||||||||||
|
Other |
||||||||||||||||||||||||
|
AAA rated |
2 | 2 | – | 2 | – | 2 | ||||||||||||||||||
|
Noninvestment grade |
20 | 19 | (1 | ) | 18 | (7 | ) | 11 | ||||||||||||||||
|
Noninvestment grade – OTTI/PIK’d 2 |
12 | 7 | (3 | ) | 4 | – | 4 | |||||||||||||||||
| 34 | 28 | (4 | ) | 24 | (7 | ) | 17 | |||||||||||||||||
| 878 | 869 | (28 | ) | 841 | (53 | ) | 788 | |||||||||||||||||
|
Available-for-sale: |
||||||||||||||||||||||||
|
U.S. Treasury securities |
706 | 705 | 1 | 706 | 706 | |||||||||||||||||||
|
U.S. Government agencies and corporations: |
||||||||||||||||||||||||
|
Agency securities |
201 | 201 | 7 | 208 | 208 | |||||||||||||||||||
|
Agency guaranteed mortgage-backed securities |
548 | 566 | 10 | 576 | 576 | |||||||||||||||||||
|
Small Business Administration loan-backed securities |
813 | 867 | 1 | 868 | 868 | |||||||||||||||||||
|
Municipal securities |
158 | 156 | 2 | 158 | 158 | |||||||||||||||||||
|
Asset-backed securities: |
||||||||||||||||||||||||
|
Trust preferred securities – predominantly bank |
||||||||||||||||||||||||
|
AAA rated |
8 | 8 | (1 | ) | 7 | 7 | ||||||||||||||||||
|
AA rated |
114 | 78 | 15 | 93 | 93 | |||||||||||||||||||
|
A rated |
309 | 245 | (11 | ) | 234 | 234 | ||||||||||||||||||
|
BBB rated |
309 | 261 | (52 | ) | 209 | 209 | ||||||||||||||||||
|
Noninvestment grade |
351 | 317 | (105 | ) | 212 | 212 | ||||||||||||||||||
|
Noninvestment grade – OTTI/PIK’d 2 |
966 | 718 | (483 | ) | 235 | 235 | ||||||||||||||||||
| 2,057 | 1,627 | (637 | ) | 990 | 990 | |||||||||||||||||||
|
Trust preferred securities – predominantly insurance |
||||||||||||||||||||||||
|
AA rated |
76 | 69 | – | 69 | 69 | |||||||||||||||||||
|
A rated |
32 | 31 | (4 | ) | 27 | 27 | ||||||||||||||||||
|
Not rated |
1 | – | 2 | 2 | 2 | |||||||||||||||||||
|
Noninvestment grade |
194 | 194 | (62 | ) | 132 | 132 | ||||||||||||||||||
| 303 | 294 | (64 | ) | 230 | 230 | |||||||||||||||||||
|
Trust preferred securities – single banks |
||||||||||||||||||||||||
|
A rated |
1 | 1 | – | 1 | 1 | |||||||||||||||||||
|
Not rated |
25 | 25 | (3 | ) | 22 | 22 | ||||||||||||||||||
| 26 | 26 | (3 | ) | 23 | 23 | |||||||||||||||||||
|
Trust preferred securities – real estate investment trusts |
||||||||||||||||||||||||
|
Noninvestment grade |
25 | 16 | (2 | ) | 14 | 14 | ||||||||||||||||||
|
Noninvestment grade – OTTI/PIK’d 2 |
70 | 30 | (25 | ) | 5 | 5 | ||||||||||||||||||
| 95 | 46 | (27 | ) | 19 | 19 | |||||||||||||||||||
|
Auction rate securities |
||||||||||||||||||||||||
|
AAA rated |
117 | 111 | (1 | ) | 110 | 110 | ||||||||||||||||||
| 117 | 111 | (1 | ) | 110 | 110 | |||||||||||||||||||
|
Other |
||||||||||||||||||||||||
|
AAA rated |
26 | 24 | 1 | 25 | 25 | |||||||||||||||||||
|
AA rated |
14 | 14 | (5 | ) | 9 | 9 | ||||||||||||||||||
|
A rated |
27 | 27 | – | 27 | 27 | |||||||||||||||||||
|
Noninvestment grade |
6 | 5 | (2 | ) | 3 | 3 | ||||||||||||||||||
|
Noninvestment grade – OTTI/PIK’d 2 |
97 | 33 | (16 | ) | 17 | 17 | ||||||||||||||||||
| 170 | 103 | (22 | ) | 81 | 81 | |||||||||||||||||||
| 5,194 | 4,702 | (733 | ) | 3,969 | 3,969 | |||||||||||||||||||
|
Mutual funds and stock |
237 | 237 | – | 237 | 237 | |||||||||||||||||||
| 5,431 | 4,939 | (733 | ) | 4,206 | 4,206 | |||||||||||||||||||
|
Total |
$ | 6,309 | $ | 5,808 | $ | (761 | ) | $ | 5,047 | $ | (53 | ) | $ | 4,994 | ||||||||||
| * | Ratings categories include entire range. For example, “A rated” includes A+, A and A-. Split rated securities with more than one rating are categorized at the highest rating level. |
| 1 |
Other comprehensive income. All amounts reported are pretax. |
| 2 |
Consists of securities determined to have OTTI and/or securities whose most recent interest payment was capitalized as opposed to being paid in cash, as permitted under the terms of the security. This capitalization feature is known as “PIK” and where exercised the security is called PIK’d. |
53
Table of Contents
Schedule 11
INVESTMENT SECURITIES PORTFOLIO
ASSET-BACKED SECURITIES CLASSIFIED AT LOWEST CREDIT RATING*
AT DECEMBER 31, 2010
| (In millions) |
Par
value |
Amortized
cost |
Net unrealized
gains (losses) recognized in OCI 1 |
Carrying
value |
Net unrealized
gains (losses) not recognized in OCI 1 |
Estimated
fair value |
||||||||||||||||||
|
Held-to-maturity: |
||||||||||||||||||||||||
|
Municipal securities |
$ | 580 | $ | 578 | $ | – | $ | 578 | $ | 4 | $ | 582 | ||||||||||||
|
Asset-backed securities: |
||||||||||||||||||||||||
|
Trust preferred securities – predominantly bank |
||||||||||||||||||||||||
|
Noninvestment grade |
88 | 88 | (10 | ) | 78 | (24 | ) | 54 | ||||||||||||||||
|
Noninvestment grade – OTTI/PIK’d 2 |
1 | – | (1 | ) | (1 | ) | 1 | – | ||||||||||||||||
| 89 | 88 | (11 | ) | 77 | (23 | ) | 54 | |||||||||||||||||
|
Trust preferred securities – predominantly insurance |
||||||||||||||||||||||||
|
Noninvestment grade |
175 | 175 | (13 | ) | 162 | (27 | ) | 135 | ||||||||||||||||
| 175 | 175 | (13 | ) | 162 | (27 | ) | 135 | |||||||||||||||||
|
Other |
||||||||||||||||||||||||
|
A rated |
2 | 2 | – | 2 | – | 2 | ||||||||||||||||||
|
Noninvestment grade |
20 | 19 | (1 | ) | 18 | (7 | ) | 11 | ||||||||||||||||
|
Noninvestment grade – OTTI/PIK’d 2 |
12 | 7 | (3 | ) | 4 | – | 4 | |||||||||||||||||
| 34 | 28 | (4 | ) | 24 | (7 | ) | 17 | |||||||||||||||||
| 878 | 869 | (28 | ) | 841 | (53 | ) | 788 | |||||||||||||||||
|
Available-for-sale: |
||||||||||||||||||||||||
|
U.S. Treasury securities |
706 | 705 | 1 | 706 | 706 | |||||||||||||||||||
|
U.S. Government agencies and corporations: |
||||||||||||||||||||||||
|
Agency securities |
201 | 201 | 7 | 208 | 208 | |||||||||||||||||||
|
Agency guaranteed mortgage-backed securities |
548 | 566 | 10 | 576 | 576 | |||||||||||||||||||
|
Small Business Administration loan-backed securities |
813 | 867 | 1 | 868 | 868 | |||||||||||||||||||
|
Municipal securities |
158 | 156 | 2 | 158 | 158 | |||||||||||||||||||
|
Asset-backed securities: |
||||||||||||||||||||||||
|
Trust preferred securities – predominantly bank |
||||||||||||||||||||||||
|
A rated |
1 | 1 | – | 1 | 1 | |||||||||||||||||||
|
BBB rated |
114 | 78 | 15 | 93 | 93 | |||||||||||||||||||
|
Noninvestment grade |
976 | 830 | (169 | ) | 661 | 661 | ||||||||||||||||||
|
Noninvestment grade – OTTI/PIK’d 2 |
966 | 718 | (483 | ) | 235 | 235 | ||||||||||||||||||
| 2,057 | 1,627 | (637 | ) | 990 | 990 | |||||||||||||||||||
|
Trust preferred securities – predominantly insurance |
||||||||||||||||||||||||
|
AA rated |
71 | 64 | 1 | 65 | 65 | |||||||||||||||||||
|
A rated |
4 | 5 | (1 | ) | 4 | 4 | ||||||||||||||||||
|
Not rated |
1 | – | 2 | 2 | 2 | |||||||||||||||||||
|
Noninvestment grade |
227 | 225 | (66 | ) | 159 | 159 | ||||||||||||||||||
| 303 | 294 | (64 | ) | 230 | 230 | |||||||||||||||||||
|
Trust preferred securities – single banks |
||||||||||||||||||||||||
|
BBB rated |
1 | 1 | – | 1 | 1 | |||||||||||||||||||
|
Not rated |
25 | 25 | (3 | ) | 22 | 22 | ||||||||||||||||||
| 26 | 26 | (3 | ) | 23 | 23 | |||||||||||||||||||
|
Trust preferred securities – real estate investment trusts |
||||||||||||||||||||||||
|
Noninvestment grade |
25 | 16 | (2 | ) | 14 | 14 | ||||||||||||||||||
|
Noninvestment grade – OTTI/PIK’d 2 |
70 | 30 | (25 | ) | 5 | 5 | ||||||||||||||||||
| 95 | 46 | (27 | ) | 19 | 19 | |||||||||||||||||||
|
Auction rate securities |
||||||||||||||||||||||||
|
AAA rated |
117 | 111 | (1 | ) | 110 | 110 | ||||||||||||||||||
| 117 | 111 | (1 | ) | 110 | 110 | |||||||||||||||||||
|
Other |
||||||||||||||||||||||||
|
AAA rated |
8 | 7 | 2 | 9 | 9 | |||||||||||||||||||
|
AA rated |
31 | 30 | (6 | ) | 24 | 24 | ||||||||||||||||||
|
A rated |
27 | 27 | – | 27 | 27 | |||||||||||||||||||
|
BBB rated |
1 | 1 | – | 1 | 1 | |||||||||||||||||||
|
Noninvestment grade |
6 | 5 | (2 | ) | 3 | 3 | ||||||||||||||||||
|
Noninvestment grade – OTTI/PIK’d 2 |
97 | 33 | (16 | ) | 17 | 17 | ||||||||||||||||||
| 170 | 103 | (22 | ) | 81 | 81 | |||||||||||||||||||
| 5,194 | 4,702 | (733 | ) | 3,969 | 3,969 | |||||||||||||||||||
|
Mutual funds and stock |
237 | 237 | – | 237 | 237 | |||||||||||||||||||
| 5,431 | 4,939 | (733 | ) | 4,206 | 4,206 | |||||||||||||||||||
|
Total |
$ | 6,309 | $ | 5,808 | $ | (761 | ) | $ | 5,047 | $ | (53 | ) | $ | 4,994 | ||||||||||
| * | Ratings categories include entire range. For example, “A rated” includes A+, A and A-. Split rated securities with more than one rating are categorized at the lowest rating level. |
| 1 |
Other comprehensive income. All amounts reported are pretax. |
| 2 |
Consists of securities determined to have OTTI and/or securities whose most recent interest payment was capitalized as opposed to being paid in cash, as permitted under the terms of the security. This capitalization feature is known as PIK and where exercised the security is called PIK’d. |
54
Table of Contents
Schedule 12
INVESTMENT SECURITIES PORTFOLIO
| December 31, 2010 | December 31, 2009 | December 31, 2008 | ||||||||||||||||||||||||||||||||||
| (In millions) |
Amortized
cost |
Carrying
value |
Estimated
fair value |
Amortized
cost |
Carrying
value |
Estimated
fair value |
Amortized
cost |
Carrying
value |
Estimated
fair value |
|||||||||||||||||||||||||||
|
HELD-TO-MATURITY |
||||||||||||||||||||||||||||||||||||
|
Municipal securities |
$ | 578 | $ | 578 | $ | 582 | $ | 606 | $ | 606 | $ | 609 | $ | 697 | $ | 697 | $ | 695 | ||||||||||||||||||
|
Asset-backed securities: |
||||||||||||||||||||||||||||||||||||
|
Trust preferred securities – banks and insurance |
263 | 239 | 189 | 265 | 239 | 208 | 1,188 | 1,004 | 677 | |||||||||||||||||||||||||||
|
Trust preferred securities – real estate investment trusts |
– | – | – | – | – | – | 36 | 27 | 21 | |||||||||||||||||||||||||||
|
Other |
28 | 24 | 17 | 30 | 25 | 16 | 76 | 63 | 51 | |||||||||||||||||||||||||||
| 869 | 841 | 788 | 901 | 870 | 833 | 1,997 | 1,791 | 1,444 | ||||||||||||||||||||||||||||
|
AVAILABLE-FOR-SALE |
||||||||||||||||||||||||||||||||||||
|
U.S. Treasury securities |
705 | 706 | 706 | 26 | 26 | 26 | 28 | 29 | 29 | |||||||||||||||||||||||||||
|
U.S. Government agencies and corporations: |
||||||||||||||||||||||||||||||||||||
|
Agency securities |
201 | 208 | 208 | 243 | 249 | 249 | 323 | 325 | 325 | |||||||||||||||||||||||||||
|
Agency guaranteed mortgage-backed securities |
566 | 576 | 576 | 374 | 385 | 385 | 406 | 410 | 410 | |||||||||||||||||||||||||||
|
Small Business Administration loan-backed securities |
867 | 868 | 868 | 782 | 768 | 768 | 693 | 667 | 667 | |||||||||||||||||||||||||||
|
Municipal securities |
156 | 158 | 158 | 237 | 242 | 242 | 178 | 180 | 180 | |||||||||||||||||||||||||||
|
Asset-backed securities: |
||||||||||||||||||||||||||||||||||||
|
Trust preferred securities – banks and insurance |
1,947 | 1,243 | 1,243 | 2,023 | 1,361 | 1,361 | 807 | 661 | 661 | |||||||||||||||||||||||||||
|
Trust preferred securities – real estate investment trusts |
46 | 19 | 19 | 56 | 24 | 24 | 27 | 24 | 24 | |||||||||||||||||||||||||||
|
Auction rate securities |
111 | 110 | 110 | 160 | 160 | 160 | – | – | – | |||||||||||||||||||||||||||
|
Other |
103 | 81 | 81 | 127 | 77 | 77 | 102 | 72 | 72 | |||||||||||||||||||||||||||
| 4,702 | 3,969 | 3,969 | 4,028 | 3,292 | 3,292 | 2,564 | 2,368 | 2,368 | ||||||||||||||||||||||||||||
|
Mutual funds and stock |
237 | 237 | 237 | 364 | 364 | 364 | 308 | 308 | 308 | |||||||||||||||||||||||||||
| 4,939 | 4,206 | 4,206 | 4,392 | 3,656 | 3,656 | 2,872 | 2,676 | 2,676 | ||||||||||||||||||||||||||||
|
Total |
$ | 5,808 | $ | 5,047 | $ | 4,994 | $ | 5,293 | $ | 4,526 | $ | 4,489 | $ | 4,869 | $ | 4,467 | $ | 4,120 | ||||||||||||||||||
The amortized cost of investment securities at December 31, 2010 increased by 9.7% from the previous year. This was primarily due to increased investments in short term U.S. Treasury Securities, agency guaranteed mortgage-backed securities, and Small Business Administration loan-backed securities, partially offset by decreased investments in auction rate securities, mutual funds and stocks, as well as municipal securities.
The amortized cost of investment securities increased by 8.7% during 2009. This change was largely due to Zions Bank purchasing securities from Lockhart ($678 million), the Company purchasing auction rate securities from customers ($237 million), securities acquired in the FDIC-assisted acquisitions of the failed Alliance, Great Basin, and Vineyard banks ($182 million), and the impact of the 2009 provisions of ACS 320 ($230 million) offset by OTTI credit impairment, valuation losses on security purchases, and security maturity paydowns.
At December 31, 2010, 22.2% of the $4.2 billion of fair value of available-for-sale securities portfolio was valued at Level 1, 43.0% was valued at Level 2, and 34.8% was valued at Level 3 under the GAAP fair value accounting valuation hierarchy. A year earlier the fair value of available-for-sale securities totaled $3.7 billion, of which 10.4% was valued at Level 1, 43.9% at Level 2, and 45.7% at Level 3. See Note 21 of the Notes to Consolidated Financial Statements for further discussion of fair value accounting.
55
Table of Contents
The amortized cost of available-for-sale investment securities valued at Level 3 was $2,217 million at December 31, 2010, and the fair value of these securities was $1,462 million. The securities valued at Level 3 were comprised of ABS CDOs and auction rate securities. For these Level 3 securities, net pretax unrealized loss recognized in OCI at the end of 2010 was $755 million. As of December 31, 2010, we believe that we will receive on settlement or maturity the amortized cost amounts of the Level 3 available-for-sale securities for which no OTTI was recognized.
At the end of 2009 the securities valued at Level 3 also included ABS CDOs and auction rate securities. The amortized cost of these investments was $2,413 million, their fair value was $1,670 million, and the related net pretax unrealized loss which was recognized in OCI at December 31, 2009 amounted to $743 million.
Valuation and Sensitivity Analysis of Level 3 Bank and Insurance CDOs
The following schedule sets forth the sensitivity of the current CDO fair values, using an internal model, to changes in the most significant assumptions utilized in the model:
Schedule 13
SENSITIVITY OF INTERNAL MODEL
| Bank and Insurance CDOs at Level 3 | ||||||||||||||||||||
| (Amounts in millions) | Held-to-maturity | Available-for-sale | ||||||||||||||||||
|
Fair value balance at December 31, 2010 |
$ | 189 | $ | 1,212 | ||||||||||||||||
| Currently Modeled Assumptions | Incremental | Cumulative | Incremental | Cumulative | ||||||||||||||||
|
Expected collateral credit losses 1 |
||||||||||||||||||||
|
Loss percentage from currently defaulted or deferring collateral 2 |
4.2 | % | 20.2 | % | ||||||||||||||||
|
Projected loss percentage from currently performing collateral |
||||||||||||||||||||
|
1-year |
0.1 | % | 4.4 | % | 0.5 | % | 20.7 | % | ||||||||||||
|
years 2-5 |
0.7 | % | 5.1 | % | 0.8 | % | 21.6 | % | ||||||||||||
|
years 6-30 |
6.5 | % | 11.6 | % | 4.8 | % | 26.3 | % | ||||||||||||
|
Discount rate 3 |
||||||||||||||||||||
|
Weighted average spread over LIBOR |
515 b | p | 867 bp | |||||||||||||||||
|
Sensitivity of Modeled Assumptions |
||||||||||||||||||||
|
Decrease in fair value |
||||||||||||||||||||
|
due to increase in projected loss percentage |
25 | % | $ (0.1 | ) | $ | (6.6 | ) | |||||||||||||
|
from currently performing collateral 4 |
50 | % | (0.3 | ) | (10.9 | ) | ||||||||||||||
| 100 | % | (0.7 | ) | (20.7 | ) | |||||||||||||||
|
Decrease in fair value |
||||||||||||||||||||
|
due to increase in projected loss percentage |
25 | % | $ (3.3 | ) | $ | (148.6 | ) | |||||||||||||
|
from currently performing collateral 4 and the |
50 | % | (3.7 | ) | (154.1 | ) | ||||||||||||||
|
immediate default of all deferring collateral
|
100 | % | (4.7 | ) | (164.6 | ) | ||||||||||||||
|
Decrease in fair value due to increase
|
+ 100 bp | $ (17.0 | ) | $ | (88.0 | ) | ||||||||||||||
| + 200 bp | (32.0 | ) | (164.4 | ) | ||||||||||||||||
| 1 |
The Company uses an expected credit loss model which specifies cumulative losses at the 1-year, 5-year, and 30-year points from the date of valuation. These current and projected losses are reflected in the CDO’s fair value. |
| 2 |
Weighted average percentage of collateral that is defaulted due to bank failures or deferring payment as allowed under the terms of the security, including a 0% recovery rate on defaulted collateral and a credit specific probability of default on deferring collateral which ranges from 4.84% to 100%. |
| 3 |
The discount rate is a spread over the LIBOR swap yield curve at the date of valuation. |
| 4 |
Percentage increase is applied to incremental projected loss percentages from currently performing collateral. For example, the 50% and 100% stress scenarios for AFS securities would result in cumulative 30 year losses of 29.4% =26.3% + 50% (0.5%+0.8%+4.8%) and 32.4% = 26.3% + 100% (0.5%+0.8%+4.8%) respectively. |
56
Table of Contents
The 2010 sensitivity analysis of valuation assumptions, when compared to the same projection for 2009, was consistent with changes the Company experienced in the loss percentage from currently defaulted or deferring collateral. The changes were driven by loss experience due to default as well as generally lower future loss projections from deferring institutions. This was offset by an assumption change which raised annual default rates to a minimum of 0.30% per year for years 6 to maturity to be consistent with the long term historical bank failure rate.
During 2010, the Company recognized credit-related net impairment losses on CDOs of $85.4 million, compared to losses of $280.5 million and $304.0 million for 2009 and 2008, respectively. The Dodd-Frank Act became effective during the third quarter of 2010, and it disallows the inclusion of trust preferred securities in Tier 1 capital. We believe that this may prompt certain issuing banks to redeem their trust preferred securities early, and have therefore changed some of our assumptions used in estimating the fair values of CDO securities. Of the $85.4 million net impairment losses recognized in 2010, $11.6 million were the result of this change in modeling assumptions.
Schedules 14 and 15 provide additional information on the below-investment-grade rated bank and insurance trust preferred CDOs’ portion of the AFS and HTM portfolios. The schedules include aggregate data on those securities which have been determined to not have OTTI at December 31, 2010 and those which have been determined to be other-than-temporarily impaired at or prior to December 31, 2010. The schedules utilize the lowest rating to identify those securities below investment grade. The schedules segment the securities by original ratings level to provide granularity on the seniority level of the securities and the distribution of unrealized losses, and on pool-level performance and projections. The best and worst pool-level statistic for each original ratings subgroup is presented, not the best and worst single security within the original ratings grouping. The number of issuers and number of currently performing issuers noted in Schedule 15 are from the same security. The remaining statistics may not be from the same security.
Schedule 14
BELOW-INVESTMENT-GRADE RATED BANK AND INSURANCE TRUST PREFERRED CDOS BY ORIGINAL RATINGS LEVEL
AT DECEMBER 31, 2010
| Total | Average holding 1 | |||||||||||||||||||||||||||||||||||||||
| (Dollar amounts in millions) |
Number
of securities |
% of
portfolio |
Par
value |
Amortized
cost |
Estimated
fair value |
Unrealized
gain (loss) |
Par
value |
Amortized
cost |
Estimated
fair value |
Unrealized
gain (loss) |
||||||||||||||||||||||||||||||
|
Original ratings of securities, non-OTTI: |
||||||||||||||||||||||||||||||||||||||||
|
Original AAA |
28 | 40.7 | % | $ | 991 | $ | 844 | $ | 678 | $ (166) | $ | 34 | $ | 29 | $ | 23 | $ (6) | |||||||||||||||||||||||
|
Original A |
22 | 19.8 | 482 | 482 | 329 | (153) | 16 | 16 | 11 | (5) | ||||||||||||||||||||||||||||||
|
Original BBB |
6 | 2.4 | 59 | 58 | 33 | (25) | 10 | 10 | 6 | (4) | ||||||||||||||||||||||||||||||
|
Total non-OTTI |
62.9 | 1,532 | 1,384 | 1,040 | (344) | |||||||||||||||||||||||||||||||||||
|
Original ratings of securities, OTTI: |
||||||||||||||||||||||||||||||||||||||||
|
Original AAA |
1 | 2.1 | 50 | 43 | 20 | (23) | 50 | 43 | 20 | (23) | ||||||||||||||||||||||||||||||
|
Original A |
40 | 32.4 | 789 | 586 | 180 | (406) | 16 | 12 | 4 | (8) | ||||||||||||||||||||||||||||||
|
Original BBB |
6 | 2.6 | 62 | 23 | 4 | (19) | 10 | 4 | 1 | (3) | ||||||||||||||||||||||||||||||
|
Total OTTI |
37.1 | 901 | 652 | 204 | (448) | |||||||||||||||||||||||||||||||||||
|
Total noninvestment grade bank and insurance CDOs |
100.0 | % | $ | 2,433 | $ | 2,036 | $ | 1,244 | $ (792) | |||||||||||||||||||||||||||||||
| 1 |
The Company may have more than one holding of the same security. |
57
Table of Contents
Schedule 15
POOL LEVEL PERFORMANCE AND PROJECTIONS FOR BELOW-INVESTMENT-GRADE RATED
BANK AND INSURANCE TRUST PREFERRED CDOs
AT DECEMBER 31, 2010
|
Current
lowest rating |
# of
issuers in collateral pool |
# of
issuers currently performing 1 |
% of
original collateral defaulted 2 |
% of
original collateral deferring 3 |
Subordination
as a % of performing collateral 4 |
Collateralization
% 5 |
Present
value of expected cash flows discounted at coupon rate as a % of par 6 |
Lifetime
additional projected loss from performing collateral 7 |
||||||||||||||||||||||||||||
|
Original ratings of securities, non-OTTI: |
||||||||||||||||||||||||||||||||||||
|
Original AAA |
||||||||||||||||||||||||||||||||||||
|
Best |
BB | 25 | 24 | – | 2.62 | % | 87.21 | % | 781.64 | % | 100 | % | – | |||||||||||||||||||||||
|
Weighted average |
55 | 37 | 14.69 | % | 14.27 | 41.50 | 255.92 | 100 | 8 | 5.92 | % | |||||||||||||||||||||||||
|
Worst |
CC | 19 | 6 | 28.71 | 28.10 | 13.97 | 151.99 | 96 | 8.47 | |||||||||||||||||||||||||||
|
Original A |
||||||||||||||||||||||||||||||||||||
|
Best |
B | 36 | 36 | – | – | 27.26 | 306.75 | 100 | 5.45 | |||||||||||||||||||||||||||
|
Weighted average |
32 | 29 | 2.77 | 6.29 | 10.63 | 136.78 | 100 | 7.35 | ||||||||||||||||||||||||||||
|
Worst |
C | 6 | 4 | 11.96 | 26.74 | -5.93 | 9 | 82.13 | 10 | 100 | 7.96 | |||||||||||||||||||||||||
|
Original BBB |
||||||||||||||||||||||||||||||||||||
|
Best |
CCC | 36 | 36 | – | – | 15.93 | 396.66 | 100 | 7.43 | |||||||||||||||||||||||||||
|
Weighted average |
17 | 16 | 1.24 | 3.33 | 7.82 | 202.39 | 100 | 7.72 | ||||||||||||||||||||||||||||
|
Worst |
C | 43 | 39 | 6.03 | 5.33 | -3.08 | 9 | 47.52 | 100 | 7.96 | ||||||||||||||||||||||||||
|
Original ratings of securities, OTTI: |
||||||||||||||||||||||||||||||||||||
|
Original AAA |
||||||||||||||||||||||||||||||||||||
|
Single security |
CCC | 43 | 29 | 15.37 | 17.46 | 31.35 | 252.88 | 89 | 7.30 | |||||||||||||||||||||||||||
|
Original A |
||||||||||||||||||||||||||||||||||||
|
Best |
CCC | 42 | 34 | – | 1.89 | 58.17 | 239.07 | 100 | – | |||||||||||||||||||||||||||
|
Weighted average |
39 | 23 | 14.71 | 17.78 | -12.07 | 67.89 | 81 | 5.76 | ||||||||||||||||||||||||||||
|
Worst |
C | 3 | 20.57 | 29.85 | -59.36 | 16.25 | 52 | 8.47 | ||||||||||||||||||||||||||||
|
Original BBB |
||||||||||||||||||||||||||||||||||||
|
Best |
C | 74 | 52 | 9.25 | 11.69 | -8.54 | 77.44 | 100 | 5.29 | |||||||||||||||||||||||||||
|
Weighted average |
35 | 23 | 13.28 | 21.79 | -19.35 | -113.93 | 47 | 6.34 | ||||||||||||||||||||||||||||
|
Worst |
C | 37 | 19 | 16.76 | 29.85 | -26.92 | -193.17 | 1 | 7.30 | |||||||||||||||||||||||||||
| 1 |
Excludes both defaulted issuers and issuers that have elected to defer payment of current interest. |
| 2 |
Collateral is identified as defaulted when a regulator closes an issuing bank. |
| 3 |
Collateral is identified as deferring when the Company becomes aware that an issuer has announced or elected to defer interest payment on trust preferred debt. |
| 4 |
Utilizes the Company’s loss assumption of 100% on defaulted collateral and the Company’s issuer specific loss assumption of from 4.84% to 100% dependent on credit for each deferring piece of collateral. “Subordination” in the schedule includes the effects of seniority level within the CDOs’ liability structure, the Company’s loss and recovery rate assumption for deferring but not defaulted collateral and a 0% recovery rate for defaulted collateral. The numerator is all collateral less the sum of (i) 100% of the defaulted collateral, (ii) the sum of the projected net loss amounts for each piece of deferring but not defaulted collateral and (iii) the amount of each CDO’s debt which is either senior to or pari passu with our security’s priority level. The denominator is all collateral less the sum of (i) 100% of the defaulted collateral and (ii) the sum of the projected net loss amounts for each piece of deferring but not defaulted collateral. |
| 5 |
Utilizes the Company’s loss assumption of 100% on defaulted collateral and the Company’s issuer specific loss assumption of from 4.84% to 100% dependent on credit for each deferring piece of collateral. “Collateralization” in the schedule identifies the portion of a CDO tranche that is backed by nondefaulted collateral. The numerator is all collateral less the sum of (i) 100% of the defaulted collateral, (ii) the sum of the projected net loss amounts for each piece of deferring but not defaulted collateral and (iii) the amount of each CDO’s debt which is senior to our security’s priority level. The denominator is the par amount of the tranche. Par is defined as the original par less any principal paydowns. |
| 6 |
For OTTI securities, this statistic approximates the extent of OTTI credit losses taken. |
| 7 |
This is the same statistic presented in the preceding sensitivity schedule and incorporated in the fair value and OTTI calculations. The statistic is the sum of incremental projected loss percentages from currently paying collateral for year one, years two through five and years six through thirty. |
| 8 |
Although cash flows project a return of less than par, they project full recovery of amortized cost and therefore no OTTI exists. |
| 9 |
Negative subordination is projected to be remedied by excess spread prior to maturity. |
| 10 |
Collateralization shortfall is projected to be remedied by excess spread prior to maturity. |
58
Table of Contents
The Company’s loss and recovery experience as of December 31, 2010 (and our Level 3 modeling assumption) is essentially a 100% loss on defaults, although we have, to date, received several, generally small, recoveries on defaults. Our experience with deferring bank collateral has been that of all collateral that has elected to defer beginning in 2007 or thereafter, 45.3% has defaulted and approximately 52.1% remains within the allowable deferrable period. Older deferrals are more likely to have defaulted. Approximately 86% of the bank collateral which first deferred prior to January 1, 2009 had defaulted by December 31, 2010. For bank collateral which first deferred on or after January 1, 2009, 29% had defaulted by December 31, 2010. Seven issuing banks, with collateral aggregating to 2.6% of all deferrals, have come current and resumed interest payments on their trust preferred securities after previously deferring some payments. New deferrals peaked in 2009. In 2008, 9.2% of collateral performing at the start of the year elected to defer by year end. This contrasts with 19.1% in 2009, and 10.0% in 2010.
Schedule 16 also presents information regarding the investment securities portfolio. This schedule presents the maturities of the different types of investments that the Company owned as of December 31, 2010, and the corresponding average interest rates that the investments will yield if they are held to maturity. It should be noted that most of the SBA loan-backed securities and asset-backed securities are variable rate and their repricing periods are significantly less than their contractual maturities. Also see “Liquidity Risk” on page 79 and Notes 1, 5 and 8 of the Notes to Consolidated Financial Statements for additional information about the Company’s investment securities and their management.
Schedule 16
MATURITIES AND AVERAGE YIELDS ON SECURITIES
AT DECEMBER 31, 2010
| Total securities | Within one year |
After one
but
within five years |
After five
but
within ten years |
After ten years | ||||||||||||||||||||||||||||||||||||
| (Amounts in millions) | Amount | Yield* | Amount | Yield* | Amount | Yield* | Amount | Yield* | Amount | Yield* | ||||||||||||||||||||||||||||||
|
HELD-TO-MATURITY: |
||||||||||||||||||||||||||||||||||||||||
|
Municipal securities |
$ | 578 | 6.6 | % | $ | 60 | 5.8 | % | $ | 229 | 6.6 | % | $ | 136 | 6.6 | % | $ | 153 | 6.9 | % | ||||||||||||||||||||
|
Asset-backed securities: |
||||||||||||||||||||||||||||||||||||||||
|
Trust preferred securities – banks and insurance |
263 | 2.6 | – | – | 0.0 | 45 | 2.3 | 218 | 2.6 | |||||||||||||||||||||||||||||||
|
Other |
28 | 1.1 | – | 7 | 1.3 | 10 | 1.3 | 11 | 0.8 | |||||||||||||||||||||||||||||||
| 869 | 5.2 | 60 | 5.8 | 236 | 6.5 | 191 | 5.3 | 382 | 4.3 | |||||||||||||||||||||||||||||||
|
AVAILABLE-FOR-SALE: |
||||||||||||||||||||||||||||||||||||||||
|
U.S. Treasury securities |
705 | 0.2 | 704 | 0.2 | 1 | 8.5 | – | – | ||||||||||||||||||||||||||||||||
|
U.S. Government agencies and corporations: |
||||||||||||||||||||||||||||||||||||||||
|
Agency securities |
201 | 5.1 | 25 | 5.1 | 73 | 5.1 | 68 | 5.0 | 35 | 5.4 | ||||||||||||||||||||||||||||||
|
Agency guaranteed mortgage-backed securities |
566 | 3.1 | 83 | 3.1 | 233 | 3.1 | 136 | 3.1 | 114 | 3.1 | ||||||||||||||||||||||||||||||
|
Small Business Administration loan-backed securities |
867 | 2.2 | 173 | 2.2 | 412 | 2.2 | 204 | 2.2 | 78 | 2.2 | ||||||||||||||||||||||||||||||
|
Municipal securities |
156 | 6.9 | 6 | 5.2 | 36 | 6.9 | 77 | 7.8 | 37 | 5.1 | ||||||||||||||||||||||||||||||
|
Asset-backed securities: |
||||||||||||||||||||||||||||||||||||||||
|
Trust preferred securities – banks and insurance |
1,947 | 2.1 | 29 | 2.6 | 109 | 2.9 | 348 | 2.5 | 1,461 | 1.9 | ||||||||||||||||||||||||||||||
|
Trust preferred securities – real estate investment trusts |
46 | 0.7 | – | – | 17 | 0.8 | 29 | 0.7 | ||||||||||||||||||||||||||||||||
|
Auction rate securities |
111 | 0.9 | – | – | – | 111 | 0.9 | |||||||||||||||||||||||||||||||||
|
Other |
103 | 1.5 | 20 | 1.9 | 30 | 1.8 | – | 53 | 1.2 | |||||||||||||||||||||||||||||||
| 4,702 | 2.2 | 1,040 | 1.0 | 894 | 2.9 | 850 | 3.2 | 1,918 | 2.0 | |||||||||||||||||||||||||||||||
|
Other securities: |
||||||||||||||||||||||||||||||||||||||||
|
Mutual funds and stock |
237 | 0.1 | 237 | 0.1 | – | – | – | |||||||||||||||||||||||||||||||||
| 4,939 | 2.1 | 1,277 | 0.8 | 894 | 2.9 | 850 | 3.2 | 1,918 | 2.0 | |||||||||||||||||||||||||||||||
|
Total |
$ | 5,808 | 2.5 | $ | 1,337 | 1.0 | $ | 1,130 | 3.7 | $ | 1,041 | 3.6 | $ | 2,300 | 2.4 | |||||||||||||||||||||||||
| * | Taxable-equivalent rates used where applicable. |
59
Table of Contents
As shown in Schedule 17 below, the investment securities portfolio at December 31, 2010 includes $612 million of nonrated, fixed-income securities compared to $654 million at December 31, 2009. Nonrated municipal securities held in the portfolio were underwritten by Zions Bank’s Municipal Credit Department in accordance with its established municipal credit standards.
Schedule 17
NONRATED SECURITIES
| December 31, | ||||||||
| (In millions) | 2010 | 2009 | ||||||
|
Municipal securities |
$ | 566 | $ | 594 | ||||
|
Other nonrated debt securities |
46 | 60 | ||||||
| $ | 612 | $ | 654 | |||||
Loans Held for Sale
Loans held for sale, consisting primarily of consumer mortgage and small business loans to be sold in the secondary market, were $206 million at December 31, 2010, compared with $209 million at December 31, 2009. The consumer loans are primarily fixed rate mortgages that are originated and sold to third parties.
Loan Portfolio
As of December 31, 2010, net loans and leases accounted for 72.0% of total assets compared to 78.6% at the end of 2009. Schedule 18 presents the Company’s loans outstanding by type of loan as of the five most recent year-ends. The schedule also includes a maturity profile for the loans that were outstanding as of December 31, 2010. However, while this schedule reflects the contractual maturity and repricing characteristics of these loans, in certain cases the Company has hedged the repricing characteristics of its variable-rate loans as more fully described in “Interest Rate Risk” on page 75.
60
Table of Contents
Schedule 18
LOAN PORTFOLIO BY TYPE AND MATURITY
| December 31, 2010 | December 31, | |||||||||||||||||||||||||||||||
| (Amounts in millions) |
One year
or less |
One year
through five years |
Over five
years |
Total | ||||||||||||||||||||||||||||
| 2009 | 2008 | 2007 | 2006 | |||||||||||||||||||||||||||||
|
Commercial lending: |
||||||||||||||||||||||||||||||||
|
Commercial and industrial |
$ | 5,005 | $ | 3,244 | $ | 918 | $ | 9,167 | $ | 9,631 | $ | 11,202 | $ | 10,182 | $ | 8,071 | ||||||||||||||||
|
Leasing |
40 | 297 | 73 | 410 | 466 | 431 | 503 | 443 | ||||||||||||||||||||||||
|
Owner occupied |
381 | 1,391 | 6,446 | 8,218 | 8,752 | 8,743 | 7,545 | 6,260 | ||||||||||||||||||||||||
|
Municipal |
31 | 104 | 304 | 439 | 356 | 288 | 274 | 352 | ||||||||||||||||||||||||
|
Total commercial lending |
5,457 | 5,036 | 7,741 | 18,234 | 19,205 | 20,664 | 18,504 | 15,126 | ||||||||||||||||||||||||
|
Commercial real estate: |
||||||||||||||||||||||||||||||||
|
Construction and land development |
2,127 | 1,128 | 312 | 3,567 | 5,552 | 7,516 | 7,869 | 7,483 | ||||||||||||||||||||||||
|
Term |
1,045 | 2,716 | 3,821 | 7,582 | 7,255 | 6,196 | 5,336 | 4,954 | ||||||||||||||||||||||||
|
Total commercial real estate |
3,172 | 3,844 | 4,133 | 11,149 | 12,807 | 13,712 | 13,205 | 12,437 | ||||||||||||||||||||||||
|
Consumer: |
||||||||||||||||||||||||||||||||
|
Home equity credit line |
22 | 151 | 1,969 | 2,142 | 2,135 | 2,005 | 1,608 | 1,850 | ||||||||||||||||||||||||
|
1-4 family residential |
72 | 246 | 3,181 | 3,499 | 3,642 | 3,877 | 3,975 | 4,192 | ||||||||||||||||||||||||
|
Construction and other consumer real estate |
124 | 54 | 165 | 343 | 459 | 774 | 945 | – | ||||||||||||||||||||||||
|
Bankcard and other revolving plans |
169 | 115 | 13 | 297 | 341 | 374 | 347 | 295 | ||||||||||||||||||||||||
|
Other |
47 | 151 | 35 | 233 | 293 | 385 | 460 | 457 | ||||||||||||||||||||||||
|
Total consumer |
434 | 717 | 5,363 | 6,514 | 6,870 | 7,415 | 7,335 | 6,794 | ||||||||||||||||||||||||
|
FDIC-supported loans |
204 | 313 | 454 | 971 | 1,445 | – | – | – | ||||||||||||||||||||||||
|
Other receivables |
– | – | – | – | – | – | – | 209 | ||||||||||||||||||||||||
|
Total loans |
$ | 9,267 | $ | 9,910 | $ | 17,691 | $ | 36,868 | $ | 40,327 | $ | 41,791 | $ | 39,044 | $ | 34,566 | ||||||||||||||||
|
Loans maturing in more than one year: |
||||||||||||||||||||||||||||||||
|
With fixed interest rates |
$ | 4,085 | $ | 3,163 | $ | 7,248 | ||||||||||||||||||||||||||
|
With variable interest rates |
5,825 | 14,528 | 20,353 | |||||||||||||||||||||||||||||
|
Total |
$ | 9,910 | $ | 17,691 | $ | 27,601 | ||||||||||||||||||||||||||
During 2008 the Company completed a loan classification project. Information to reclassify loans for periods prior to 2007 is not available.
As of December 31, 2010, net loans and leases were $36.7 billion, reflecting an 8.6% decline from 2009. The decrease is primarily due to pay-downs and charge-offs, which continue to more than offset new loan originations.
Most of the loan portfolio contraction during 2010 occurred in commercial real estate construction and land development loans, owner occupied, and FDIC-supported loans. The Company focused its efforts to reduce exposure to high risk construction and land development loans, and the demand for such loans has decreased due to the current economic conditions. The largest reductions occurred principally at Amegy, Zions Bank, NBA, and CB&T. The Company also experienced significant decreases in commercial lending balances, principally at Zions Bank, Vectra and CB&T.
We expect that construction and land development loans will continue to decline, as the Company has intentionally reduced lending for these types of projects and demand remains weak.
Other Noninterest-Bearing Investments
As of December 31, 2010, the Company had $858 million of other noninterest-bearing investments compared with $1,100 million in 2009. The decrease resulted mainly from decreased investments in bank-owned life insurance contracts and in SBIC investments. The life insurance contracts were surrendered as a part of the Company’s strategy to become more asset sensitive, and to reduce its investment in very long-term illiquid assets at affiliate banks.
61
Table of Contents
Schedule 19
OTHER NONINTEREST-BEARING INVESTMENTS
| December 31, | ||||||||
| (In millions) | 2010 | 2009 | ||||||
|
Bank-owned life insurance |
$ | 428 | $ | 620 | ||||
|
Federal Home Loan Bank stock |
125 | 136 | ||||||
|
Federal Reserve stock |
128 | 122 | ||||||
|
SBIC investments 1 |
38 | 65 | ||||||
|
Non-SBIC investment funds and other |
96 | 102 | ||||||
|
Investments in ADC arrangements 2 |
17 | 19 | ||||||
|
Other public companies |
12 | 22 | ||||||
|
Trust preferred securities |
14 | 14 | ||||||
| $ | 858 | $ | 1,100 | |||||
| 1 |
Amounts include noncontrolling investors’ interests in Zions’ managed SBIC investments of approximately $18 million at December 31, 2009. As of December 31, 2010, such investments have been either liquidated or deconsolidated. |
| 2 |
Investments in ADC arrangements are loans that do not qualify for loan accounting under GAAP; therefore these loans are accounted for as noninterest-bearing investments. |
Deposits
Deposits, both interest-bearing and noninterest-bearing, are a primary source of funding for the Company. Average total deposits decreased by 2.6% during 2010, with average interest-bearing deposits decreasing by 10.6% and average noninterest-bearing deposits increasing by 20.5%. The decline in deposits resulted from actions by the Company to reduce higher cost deposits, including time deposits and brokered deposits, as well as to reduce excess noninterest-bearing deposits held by some large customers through the use of off-balance sheet sweep products. Core deposits at December 31, 2010, which exclude time deposits larger than $100,000 and brokered deposits, increased by 2.5%, or $915 million, from December 31, 2009. The fluctuation was due to increases in noninterest-bearing deposits, and savings and NOW deposits, partially offset by decreases in money market, and time deposits under $100,000.
Demand, savings and money market deposits comprised 85.8% of total deposits at the end of 2010, compared with 82.6% at December 31, 2009.
During 2010, the Company reduced brokered deposits due to excess liquidity and weak loan demand. At December 31, 2010, total deposits included $435 million of brokered deposits compared to $1,608 million at December 31, 2009.
See Notes 11 and 12 of the Notes to Consolidated Financial Statements and “Liquidity Risk” on page 79 for additional information on funding and borrowed funds.
RISK ELEMENTS
Since risk is inherent in substantially all of the Company’s operations, management of risk is an integral part of its operations and is also a key determinant of its overall performance. We apply various strategies to reduce the risks to which the Company’s operations are exposed, including credit, interest rate and market, liquidity and operational risks.
Credit Risk Management
Credit risk is the possibility of loss from the failure of a borrower, guarantor, or another obligor to fully perform under the terms of a credit-related contract. Credit risk arises primarily from the Company’s lending activities, as well as from off-balance sheet credit instruments.
62
Table of Contents
Centralized oversight of credit risk is provided through a uniform credit policy, credit administration, and credit exam functions at the Parent. Effective management of credit risk is essential in maintaining a safe, sound and profitable financial institution. We have structured the organization to separate the lending function from the credit administration function, which has added strength to the control over, and the independent evaluation of, credit activities. Formal loan policies and procedures provide the Company with a framework for consistent underwriting and a basis for sound credit decisions. In addition, the Company has a well-defined set of standards for evaluating its loan portfolio and management utilizes a comprehensive loan grading system to determine the risk potential in the portfolio. Further, an independent internal credit examination department periodically conducts examinations of the Company’s lending departments. These examinations are designed to review credit quality, adequacy of documentation, appropriate loan grading administration and compliance with lending policies, and reports thereon are submitted to management and to the Credit Review Committee of the Board of Directors. New, expanded, or modified products and services, as well as new lines of business, are approved by a New Product Review Committee at the bank level or Parent level, depending on the inherent risk of the new activity.
Both the credit policy and the credit examination functions are managed centrally. Each affiliate bank is able to modify corporate credit policy to be more conservative; however, corporate approval must be obtained if a bank wishes to create a more liberal policy. Historically, only a limited number of such modifications have been approved. This entire process has been designed to place an emphasis on strong underwriting standards and early detection of potential problem credits so that action plans can be developed and implemented on a timely basis to mitigate any potential losses.
With regard to credit risk associated with counterparties to off-balance sheet credit instruments, Zions Bank and Amegy have ISDA agreements in place under which derivative transactions are entered into with major derivative dealers. Each ISDA agreement details the cash collateral arrangements between Zions Bank and Amegy and their counterparties. In every case, the amount of the cash collateral required to secure the exposed party in the derivative transaction is determined by the fair value of the derivative and the credit rating of the party with the obligation. The credit rating used in these situations is provided by either Moody’s or Standard & Poor’s. This means that, in like transactions, a counterparty with a “AAA” rating would be obligated to provide less collateral to secure a major credit exposure than one with an “A” rating. All derivative gains and losses between Zions Bank or Amegy and a single counterparty are netted to determine the net credit exposure and therefore the collateral required. Any derivative transactions for affiliate banks other than Zions Bank or Amegy, as well as certain derivatives transactions entered into by Amegy after its acquisition by the Company, are handled through intercompany ISDA agreements such that the relevant affiliate faces Zions Bank and in turn Zions Bank faces the derivatives dealer.
The Company’s credit risk management strategy includes diversification of its loan portfolio. The Company maintains a diversified loan portfolio, which includes commercial real estate loans. The Company attempts to avoid the risk of an undue concentration of credits in a particular collateral type or with an individual customer or counterparty. During 2009, the Company adopted new concentration limits on various types of commercial real estate lending, particularly construction and land development lending, which have contributed to further reducing the Company’s exposure to this type of lending. The majority of the Company’s business activity is with customers located within the geographical footprint of its banking subsidiaries.
As displayed in Schedule 20, at the end of 2010, no single loan type exceeded 24.9% of the Company’s total loan portfolio. During 2010, construction and land development decreased to 9.7% of total loans, compared to 13.8% at the end of 2009.
63
Table of Contents
Schedule 20
LOAN PORTFOLIO DIVERSIFICATION
| December 31, 2010 | December 31, 2009 | |||||||||||||||
| (Amounts in millions) | Amount |
%
of
total loans |
Amount |
%
of
total loans |
||||||||||||
|
Commercial lending: |
||||||||||||||||
|
Commercial and industrial |
$ | 9,167 | 24.9 | % | $ | 9,631 | 23.9 | % | ||||||||
|
Leasing |
410 | 1.1 | 466 | 1.2 | ||||||||||||
|
Owner occupied |
8,218 | 22.3 | 8,752 | 21.7 | ||||||||||||
|
Municipal |
439 | 1.2 | 356 | 0.9 | ||||||||||||
|
Total commercial lending |
18,234 | 19,205 | ||||||||||||||
|
Commercial real estate: |
||||||||||||||||
|
Construction and land development |
3,567 | 9.7 | 5,552 | 13.8 | ||||||||||||
|
Term |
7,582 | 20.6 | 7,255 | 18.0 | ||||||||||||
|
Total commercial real estate |
11,149 | 12,807 | ||||||||||||||
|
Consumer: |
||||||||||||||||
|
Home equity credit line |
2,142 | 5.8 | 2,135 | 5.3 | ||||||||||||
|
1-4 family residential |
3,499 | 9.5 | 3,642 | 9.0 | ||||||||||||
|
Construction and other consumer real estate |
343 | 0.9 | 459 | 1.1 | ||||||||||||
|
Bankcard and other revolving plans |
297 | 0.8 | 341 | 0.8 | ||||||||||||
|
Other |
233 | 0.6 | 293 | 0.7 | ||||||||||||
|
Total consumer |
6,514 | 6,870 | ||||||||||||||
|
FDIC-supported loans |
971 | 2.6 | 1,445 | 3.6 | ||||||||||||
|
Total loans |
$ | 36,868 | 100.0 | % | $ | 40,327 | 100.0 | % | ||||||||
The Company’s loan portfolio includes loans that were acquired from failed banks: Alliance Bank, Great Basin Bank, and Vineyard Bank. These loans include nonperforming loans and other loans with characteristics indicative of a high credit risk profile, including substantial concentrations in California and Nevada, loans with homebuilders, and other construction finance loans. Most of these loans are covered under loss sharing agreements with the FDIC for which the FDIC generally will assume 80% of the first $275 million of credit losses for the Alliance Bank assets, $40 million of credit losses for the Great Basin Bank assets, and $465 million of credit losses for the Vineyard Bank assets and 95% of any credit losses in excess of those amounts. Therefore, the Company’s financial exposure to losses from these assets is substantially limited, and during 2010 the acquired loans performed better than expected. FDIC-supported loans represented approximately 2.6% and 3.6% of the Company’s total loan portfolio at the end of 2010 and 2009, respectively.
The credit quality of the Company’s loan portfolio began to show signs of stabilization and improvement during the latter half of 2010. Nonperforming lending related assets decreased by 34.0% from December 31, 2009. Gross charge-offs dropped to $1,074 million, compared to $1,256 million in 2009. Net charge-offs, in turn, decreased to $969 million in 2010 from $1,173 million in 2009.
Lending to finance residential land acquisition, development and construction has historically been an important business for the Company. However, during 2010, the Company intentionally reduced its portfolio of these types of loans. Stricter mortgage qualification standards, high unemployment, declining home values, and general uncertainty in the residential real estate market continues to have an adverse impact on the operations of many of the Company’s developer and builder customers.
64
Table of Contents
Commercial Lending
Schedule 21 provides selected information regarding our commercial lending portfolio regarding lending concentrations to certain industries.
Schedule 21
COMMERCIAL LENDING BY INDUSTRY GROUP
| December 31, 2010 | ||||||||
| (Amounts in millions) | Amount | Percent | ||||||
|
Real estate and rental and leasing |
$ | 2,488 | 13.6 | % | ||||
|
Manufacturing |
1,984 | 10.9 | ||||||
|
Retail trade |
1,585 | 8.7 | ||||||
|
Wholesale trade |
1,500 | 8.2 | ||||||
|
Mining, quarrying, and oil and gas extraction |
1,346 | 7.4 | ||||||
|
Healthcare and social assistance |
1,264 | 6.9 | ||||||
|
Construction |
1,110 | 6.1 | ||||||
|
Professional, scientific, and technical services |
966 | 5.3 | ||||||
|
Finance and insurance |
963 | 5.3 | ||||||
|
Transportation and warehousing |
866 | 4.8 | ||||||
|
Accommodation and food services |
809 | 4.4 | ||||||
|
Other 1 |
3,353 | 18.4 | ||||||
|
Total |
$ | 18,234 | 100.0 | % | ||||
| 1 |
No other industry group exceeded 5%. |
Commercial Real Estate Loans
As reflected in Schedule 22 the commercial real estate loan portfolio is also well diversified by property type, purpose and collateral location.
65
Table of Contents
Schedule 22
COMMERCIAL REAL ESTATE PORTFOLIO BY PROPERTY TYPE AND COLLATERAL LOCATION
(REPRESENTS PERCENTAGES BASED UPON OUTSTANDING COMMERCIAL REAL ESTATE LOANS)
AT DECEMBER 31, 2010
| (Amounts in millions) | Collateral Location |
Product
as a % of total CRE |
Product
as a % of loan type |
|||||||||||||||||||||||||||||||||||||||||||||
|
Loan Type |
Balance 1 | Arizona |
Northern
California |
Southern
California |
Nevada | Colorado | Texas |
Utah /
Idaho |
Wash-
ington |
Other | ||||||||||||||||||||||||||||||||||||||
|
Commercial term: |
||||||||||||||||||||||||||||||||||||||||||||||||
|
Industrial |
0.60 | % | 0.29 | % | 1.80 | % | 0.18 | % | 0.21 | % | 0.40 | % | 0.28 | % | 0.10 | % | 0.18 | % | 4.04 | % | 5.85 | % | ||||||||||||||||||||||||||
|
Office |
2.29 | 0.75 | 3.88 | 1.50 | 1.74 | 1.95 | 1.67 | 0.52 | 1.29 | 15.59 | 22.56 | |||||||||||||||||||||||||||||||||||||
|
Retail |
1.35 | 0.90 | 3.41 | 1.80 | 1.05 | 3.49 | 0.98 | 0.40 | 1.48 | 14.86 | 21.49 | |||||||||||||||||||||||||||||||||||||
|
Hotel/motel |
2.06 | 0.73 | 1.70 | 0.62 | 0.73 | 1.28 | 1.64 | 0.27 | 3.65 | 12.68 | 18.34 | |||||||||||||||||||||||||||||||||||||
|
Acquisition and development |
0.06 | – | – | – | – | – | 0.11 | 0.01 | – | 0.18 | 0.26 | |||||||||||||||||||||||||||||||||||||
|
Medical |
0.77 | 0.05 | 0.38 | 0.92 | 0.12 | 0.30 | 0.11 | 0.09 | 0.35 | 3.09 | 4.46 | |||||||||||||||||||||||||||||||||||||
|
Recreation/ restaurant |
0.59 | 0.08 | 0.56 | 0.33 | 0.18 | 0.28 | 0.20 | 0.02 | 0.54 | 2.78 | 4.04 | |||||||||||||||||||||||||||||||||||||
|
Multifamily |
0.80 | 0.38 | 3.24 | 0.80 | 0.43 | 1.77 | 0.76 | 0.12 | 0.96 | 9.26 | 13.40 | |||||||||||||||||||||||||||||||||||||
|
Other |
0.91 | 0.41 | 2.06 | 0.54 | 0.15 | 0.55 | 1.09 | 0.21 | 0.72 | 6.64 | 9.60 | |||||||||||||||||||||||||||||||||||||
|
Total commercial term |
$ | 7,509.2 | 9.43 | 3.59 | 17.03 | 6.69 | 4.61 | 10.02 | 6.84 | 1.74 | 9.17 | 69.12 | 100.00 | |||||||||||||||||||||||||||||||||||
|
Residential construction and land development |
||||||||||||||||||||||||||||||||||||||||||||||||
|
Single family housing |
0.07 | 0.09 | 0.30 | 0.06 | 0.24 | 0.68 | 0.28 | 0.04 | 0.05 | 1.81 | 18.01 | |||||||||||||||||||||||||||||||||||||
|
Acquisition and development |
0.43 | 0.10 | 0.42 | 0.32 | 0.49 | 1.99 | 1.34 | 0.02 | 0.49 | 5.60 | 55.63 | |||||||||||||||||||||||||||||||||||||
|
Loan lot investor |
0.59 | 0.09 | 0.12 | 0.06 | 0.08 | 0.30 | 0.29 | – | 0.04 | 1.57 | 15.59 | |||||||||||||||||||||||||||||||||||||
|
Condo |
0.01 | – | 0.07 | – | 0.42 | 0.35 | 0.04 | – | 0.19 | 1.08 | 10.77 | |||||||||||||||||||||||||||||||||||||
|
Total residential construction
|
1,093.2 | 1.10 | 0.28 | 0.91 | 0.44 | 1.23 | 3.32 | 1.95 | 0.06 | 0.77 | 10.06 | 100.00 | ||||||||||||||||||||||||||||||||||||
|
Commercial construction and land development |
||||||||||||||||||||||||||||||||||||||||||||||||
|
Industrial |
0.02 | – | 0.05 | – | – | 0.23 | 0.03 | – | 0.03 | 0.36 | 1.75 | |||||||||||||||||||||||||||||||||||||
|
Office |
0.36 | 0.01 | 0.53 | 0.24 | 0.34 | 1.00 | 0.98 | 0.07 | – | 3.53 | 16.94 | |||||||||||||||||||||||||||||||||||||
|
Retail |
1.02 | 0.02 | 0.13 | 0.57 | 0.30 | 1.17 | 0.24 | – | 0.06 | 3.51 | 16.85 | |||||||||||||||||||||||||||||||||||||
|
Hotel/motel |
– | 0.19 | 0.10 | – | 0.10 | 0.49 | 0.10 | – | 0.14 | 1.12 | 5.37 | |||||||||||||||||||||||||||||||||||||
|
Acquisition and development |
0.69 | 0.11 | 0.38 | 0.91 | 0.76 | 2.17 | 1.02 | 0.03 | 0.10 | 6.17 | 29.66 | |||||||||||||||||||||||||||||||||||||
|
Medical |
0.05 | – | – | – | – | 0.10 | 0.01 | 0.02 | – | 0.18 | 0.85 | |||||||||||||||||||||||||||||||||||||
|
Multi family |
0.37 | 0.01 | 0.98 | – | 0.23 | 2.22 | 0.21 | 0.37 | 0.39 | 4.78 | 22.98 | |||||||||||||||||||||||||||||||||||||
|
Other |
0.05 | – | 0.19 | 0.29 | 0.06 | 0.41 | 0.08 | 0.01 | 0.08 | 1.17 | 5.60 | |||||||||||||||||||||||||||||||||||||
|
Total commercial construction
|
2,262.1 | 2.56 | 0.34 | 2.36 | 2.01 | 1.79 | 7.79 | 2.67 | 0.50 | 0.80 | 20.82 | 100.00 | ||||||||||||||||||||||||||||||||||||
|
Total construction and land development |
3,355.3 | 3.66 | 0.62 | 3.27 | 2.45 | 3.02 | 11.11 | 4.62 | 0.56 | 1.57 | 30.88 | 100.00 | ||||||||||||||||||||||||||||||||||||
|
Total commercial real estate |
$ | 10,864.5 | 13.09 | 4.21 | 20.30 | 9.14 | 7.63 | 21.13 | 11.46 | 2.30 | 10.74 | 100.00 | ||||||||||||||||||||||||||||||||||||
| 1 |
Excludes approximately $284 million of unsecured loans outstanding, but related to the real estate industry. |
66
Table of Contents
Selected information regarding our CRE loan portfolio is presented in Schedule 23.
Schedule 23
COMMERCIAL REAL ESTATE PORTFOLIO BY LOAN TYPE AND COLLATERAL LOCATION
AT DECEMBER 31, 2010
| (Amounts in millions) | Collateral Location | Total |
% of
total CRE |
|||||||||||||||||||||||||||||||||||||||||||||
|
Loan Type |
As of
Date |
Arizona |
Northern
California |
Southern
California |
Nevada | Colorado | Texas |
Utah /
Idaho |
Wash-
ington |
Other 1 | ||||||||||||||||||||||||||||||||||||||
|
Commercial term |
||||||||||||||||||||||||||||||||||||||||||||||||
|
Balance outstanding |
12/31/10 | $ | 1,041.6 | $ | 387.9 | $ | 1,880.7 | $ | 749.6 | $ | 501.4 | $ | 1,099.5 | $ | 782.9 | $ | 224.7 | $ | 913.1 | $ | 7,581.4 | 68.0 | % | |||||||||||||||||||||||||
|
% of loan type |
13.8 | % | 5.1 | % | 24.8 | % | 9.9 | % | 6.6 | % | 14.5 | % | 10.3 | % | 3.0 | % | 12.0 | % | 100.0 | % | ||||||||||||||||||||||||||||
|
Delinquency rates 2 : |
||||||||||||||||||||||||||||||||||||||||||||||||
|
30-89 days |
12/31/10 | 1.6 | % | 1.5 | % | 1.7 | % | 3.7 | % | 8.2 | % | 2.7 | % | 2.1 | % | 0.3 | % | 7.3 | % | 3.1 | % | |||||||||||||||||||||||||||
| 12/31/09 | 1.8 | % | 2.4 | % | 2.4 | % | 7.6 | % | 1.4 | % | 4.3 | % | 2.4 | % | 0.3 | % | 9.2 | % | 4.0 | % | ||||||||||||||||||||||||||||
|
³ 90 days |
12/31/10 | 1.1 | % | 1.5 | % | 0.9 | % | 2.8 | % | 1.4 | % | 1.6 | % | 1.8 | % | – | 3.9 | % | 1.7 | % | ||||||||||||||||||||||||||||
| 12/31/09 | 1.4 | % | 1.6 | % | 1.6 | % | 3.9 | % | 0.8 | % | 3.3 | % | 1.1 | % | – | 5.6 | % | 2.5 | % | |||||||||||||||||||||||||||||
|
Accruing loans past due
|
12/31/10 | – | – | 0.2 | – | – | 4.0 | – | – | 0.3 | 4.5 | |||||||||||||||||||||||||||||||||||||
| 12/31/09 | 1.2 | – | 0.6 | 0.5 | – | 1.2 | 0.6 | – | 2.6 | 6.7 | ||||||||||||||||||||||||||||||||||||||
|
Nonaccrual loans |
12/31/10 | 23.4 | 6.2 | 36.3 | 70.5 | 19.4 | 32.8 | 20.1 | 1.0 | 53.9 | 263.6 | |||||||||||||||||||||||||||||||||||||
| 12/31/09 | 14.5 | 6.5 | 30.3 | 60.9 | 6.5 | 36.3 | 10.0 | 1.4 | 62.1 | 228.5 | ||||||||||||||||||||||||||||||||||||||
|
Residential construction and land development |
||||||||||||||||||||||||||||||||||||||||||||||||
|
Balance outstanding |
12/31/10 | 165.4 | 30.0 | 105.6 | 50.3 | 134.3 | 380.6 | 213.0 | 2.6 | 85.3 | 1,167.1 | 10.5 | % | |||||||||||||||||||||||||||||||||||
|
% of loan type |
14.1 | % | 2.6 | % | 9.1 | % | 4.3 | % | 11.5 | % | 32.6 | % | 18.3 | % | 0.2 | % | 7.3 | % | 100.0 | % | ||||||||||||||||||||||||||||
|
Delinquency rates 2 : |
||||||||||||||||||||||||||||||||||||||||||||||||
|
30-89 days |
12/31/10 | 9.8 | % | 6.0 | % | 5.3 | % | 55.6 | % | 1.4 | % | 19.9 | % | 13.6 | % | – | 9.6 | % | 14.3 | % | ||||||||||||||||||||||||||||
| 12/31/09 | 20.9 | % | 8.3 | % | 6.2 | % | 18.0 | % | 12.7 | % | 14.2 | % | 20.1 | % | 0.2 | % | 15.8 | % | 15.5 | % | ||||||||||||||||||||||||||||
|
³ 90 days |
12/31/10 | 8.6 | % | 6.0 | % | 3.4 | % | 55.6 | % | 0.4 | % | 19.2 | % | 10.0 | % | – | 5.0 | % | 12.6 | % | ||||||||||||||||||||||||||||
| 12/31/09 | 17.9 | % | 8.3 | % | 4.6 | % | 5.6 | % | 11.1 | % | 7.3 | % | 19.7 | % | – | 6.9 | % | 11.3 | % | |||||||||||||||||||||||||||||
|
Accruing loans past due
|
12/31/10 | 0.8 | – | – | – | – | 0.1 | 0.6 | – | 0.1 | 1.6 | |||||||||||||||||||||||||||||||||||||
| 12/31/09 | 6.2 | – | – | – | – | 0.1 | 1.9 | – | 0.1 | 8.3 | ||||||||||||||||||||||||||||||||||||||
|
Nonaccrual loans |
12/31/10 | 29.9 | 1.8 | 8.1 | 30.3 | 41.4 | 81.2 | 39.1 | – | 8.3 | 240.1 | |||||||||||||||||||||||||||||||||||||
| 12/31/09 | 66.2 | 4.8 | 33.7 | 44.5 | 23.0 | 103.4 | 100.1 | – | 19.8 | 395.5 | ||||||||||||||||||||||||||||||||||||||
|
Commercial construction and land development |
||||||||||||||||||||||||||||||||||||||||||||||||
|
Balance outstanding |
12/31/10 | 285.9 | 37.5 | 257.6 | 223.1 | 199.0 | 898.9 | 325.5 | 78.7 | 93.9 | 2,400.1 | 21.5 | % | |||||||||||||||||||||||||||||||||||
|
% of loan type |
11.9 | % | 1.6 | % | 10.7 | % | 9.3 | % | 8.2 | % | 37.5 | % | 13.6 | % | 3.3 | % | 3.9 | % | 100.0 | % | ||||||||||||||||||||||||||||
|
Delinquency rates 2 : |
||||||||||||||||||||||||||||||||||||||||||||||||
|
30-89 days |
12/31/10 | 5.0 | % | – | 0.5 | % | 23.7 | % | 8.1 | % | 5.7 | % | 6.4 | % | 2.7 | % | 12.4 | % | 7.1 | % | ||||||||||||||||||||||||||||
| 12/31/09 | 12.9 | % | – | 3.9 | % | 23.4 | % | 7.9 | % | 9.4 | % | 14.5 | % | 24.6 | % | 4.1 | % | 11.3 | % | |||||||||||||||||||||||||||||
|
³ 90 days |
12/31/10 | 4.2 | % | – | 0.5 | % | 16.4 | % | 8.1 | % | 4.3 | % | 4.2 | % | – | 12.4 | % | 5.5 | % | |||||||||||||||||||||||||||||
| 12/31/09 | 7.3 | % | – | 3.0 | % | 19.1 | % | 1.6 | % | 5.5 | % | 7.7 | % | – | 4.1 | % | 6.9 | % | ||||||||||||||||||||||||||||||
|
Accruing loans past due
|
12/31/10 | – | – | – | – | – | – | 0.2 | – | 0.1 | 0.3 | |||||||||||||||||||||||||||||||||||||
| 12/31/09 | 4.1 | – | – | 9.1 | 0.8 | 0.9 | 3.0 | – | 0.1 | 18.0 | ||||||||||||||||||||||||||||||||||||||
|
Nonaccrual loans |
12/31/10 | 18.9 | – | 2.2 | 73.9 | 19.8 | 91.9 | 35.7 | – | 11.6 | 254.0 | |||||||||||||||||||||||||||||||||||||
| 12/31/09 | 57.1 | – | 12.8 | 107.2 | 4.7 | 198.8 | 37.0 | – | 11.8 | 429.4 | ||||||||||||||||||||||||||||||||||||||
|
Total construction and land development |
12/31/10 | 451.3 | 67.5 | 363.2 | 273.4 | 333.3 | 1,279.5 | 538.5 | 81.3 | 179.2 | 3,567.2 | |||||||||||||||||||||||||||||||||||||
|
Total commercial real estate |
12/31/10 | $ | 1,492.9 | $ | 455.4 | $ | 2,243.9 | $ | 1,023.0 | $ | 834.7 | $ | 2,379.0 | $ | 1,321.4 | $ | 306.0 | $ | 1,092.3 | $ | 11,148.6 | 100.0 | % | |||||||||||||||||||||||||
| 1 |
No other geography exceeded $148 million for all three loan types. |
| 2 |
Delinquency rates include nonaccrual loans. |
67
Table of Contents
Approximately 33% of the commercial real estate term loans consist of mini-perm loans. For such loans, construction has been completed and the project has stabilized to a level that supports the granting of a mini-perm loan in accordance with our underwriting standards. Mini-perm loans generally have initial maturities of 3 to 7 years. The remaining 67% of commercial real estate loans are term loans with initial maturities generally of 15 to 20 years. The stabilization criteria for a project to qualify for a term loan differ by product type and includes, for example, criteria related to the cash flow created by the project and occupancy rates.
Approximately 29.7% of the commercial construction and land development portfolio’s balance consists of acquisition and development loans. Most of these acquisition and development properties are tied to specific retail, apartment, office, or other projects. Underwriting on commercial properties is primarily based on the economic viability of the project with heavy consideration given to the creditworthiness of the sponsor. We generally require that the owner’s equity be injected prior to bank advances. Re-margining requirements are often included in the loan agreement along with guarantees of the sponsor. Recognizing that debt is paid via cash flow, the projected economics of the project are primary in the underwriting because these determine the ultimate value of the property and its ability to service debt. Therefore, in most projects (with the exception of multi-family projects) we look for substantial pre-leasing in our underwriting and we generally require a minimum projected stabilized debt service coverage ratio of 1.20.
Although lending for residential construction and development deals with a different product type, many of the requirements previously mentioned, such as credit worthiness of the developer, up-front injection of the developer’s equity, re-margining requirements, and the viability of the project are also important in underwriting a residential development loan. Heavy consideration is given to market acceptance of the product, location, strength of the developer, and the ability of the developer to stay within budget. Progress inspections by qualified independent inspectors are routinely performed before disbursements are made. Loan agreements generally include limitations on the number of model homes and homes built on a spec basis, with preference given to pre-sold homes.
Real estate appraisals are ordered independently of the credit officer and the borrower, generally by each bank’s appraisal review function, which is staffed by certified appraisers. In some cases, reports from automated valuation services are used. Appraisals are ordered from outside appraisers at the inception, renewal or, for CRE loans, upon the occurrence of any event causing a “criticized” or “classified” grade to be assigned to the credit. The frequency for obtaining updated appraisals for these adversely graded credits is increased when declining market conditions exist. Advance rates, on an “as completed basis,” will vary based on the viability of the project and the creditworthiness of the sponsor, but corporate guidelines generally limit advances to 50% for raw land, 65% for land development, 65% for finished commercial lots, 75% for finished residential lots, 80% for pre-sold homes, 75% for models and spec homes, and 75% for commercial properties. Exceptions may be granted on a case-by-case basis.
Loan agreements require regular financial information on the project and the sponsor in addition to lease schedules, rent rolls, and on construction projects, independent progress inspection reports. The receipt of these schedules is closely monitored and calculations are made to determine adherence to the covenants set forth in the loan agreement. Additionally, the frequency of loan-by-loan reviews of pass grade loans has been increased to quarterly for all commercial and residential construction and land development loans at Zions Bank, CB&T, Amegy, NBA, NSB, and Vectra.
Interest reserves generally are established as an expense item in the budget for real estate construction or development loans. We generally require the borrower to put their equity into the project at the inception of the construction. This enables the bank to ensure the availability of equity in the project. The Company’s practice is to monitor the construction, sales and/or leasing progress to determine whether or not the project remains viable. If at any time during the life of the credit the project is determined not to be viable, the bank takes appropriate action to protect its collateral position via negotiation and/or legal action as deemed necessary. The bank then usually evaluates the proper use of interest reserves. At December 31, 2010, Zions’ affiliates had 341 loans with
68
Table of Contents
outstanding balances of $423 million where available interest reserves amounted to $42 million. At the end of 2009, they had had 416 loans with outstanding balances of $1.0 billion and related available interest reserves of $106 million. In instances where projects have been determined not to be viable, the interest reserves and other appropriate disbursements have been frozen.
We have not been involved to any meaningful extent with insurance arrangements, credit derivatives, or any other default agreements as a mitigation strategy for commercial real estate loans. However, we do make use of personal or other guarantees as risk mitigation strategies.
The Company periodically stress tests its CRE loan portfolio using a loan-by-loan Monte Carlo simulation that stresses the probability of default and loss given default for CRE loans based on a variety of factors including regional economic factors, loan grade, loan-to-value, collateral type, and geography. This testing is back tested and the results are reviewed regularly with management, rating agencies and various banking regulators.
Consumer Loans
The Company did not pursue subprime residential mortgage lending, including option ARM and negative amortization loans. It does have approximately $383 million of stated income loans with generally high FICO scores at origination, including “one-time close” loans to finance the construction of a home, which convert into permanent jumbo mortgages. As of December 31, 2010, approximately $56 million of the $383 million of stated income loans had FICO scores of less than 620. These totals exclude held-for-sale loans. Stated income loans account for approximately $19 million, or 35%, of our credit losses in 1-4 family residential first mortgage loans during 2010, and were primarily in Utah and Arizona.
The Company has mainly been an originator of first and second mortgages, generally considered to be of prime quality. Its practice historically has been to sell “conforming” fixed rate loans to third parties, including Fannie Mae and Freddie Mac, for which it makes representations and warranties as to meeting certain underwriting and collateral documentation standards. It has also been the Company’s practice historically to hold variable rate loans in its portfolio. In the past two years, Fannie Mae and Freddie Mac have successfully “put back” to the Company’s subsidiary banks fewer than ten loans due to deficiencies in underwriting or loan documentation. In addition, the Company has not made use of so-called “robo-signers” in foreclosing on residential real estate, and it has not been subject to any foreclosure moratorium – whether self-imposed or imposed by others. The Company does not estimate that it has any material financial risk as a result of loan put-backs or its foreclosure practices, and has not established any reserves related to these items.
The Company is engaged in home equity credit line lending. Approximately $931 million of the Company’s $2.1 billion portfolio is secured by first deeds of trust, while the remaining balance is secured by junior liens. As of December 31, 2010, loans representing approximately 14.8% of the outstanding balance in this portfolio were estimated to have loan-to-value ratios above 100%. Of the total home equity credit line portfolio 0.41% was 90 or more days past due at December 31, 2010 as compared to 0.42% as of December 31, 2009. During 2010, the Company modified a nominal number of home equity loans. The credit losses for this portfolio were 129 basis points for the year ended December 31, 2010.
Nonperforming Assets
Total nonperforming lending related assets were $1,828 million at December 31, 2010 compared to $2,769 million at December 31, 2009 and $1,138 million at December 31, 2008.
As reflected in Schedule 24, the Company’s nonperforming assets as a percentage of net loans and leases and OREO decreased substantially during 2010. The percentage was 4.91% at December 31, 2010, compared with 6.79% on December 31, 2009 and 2.71% on December 31, 2008.
69
Table of Contents
Total nonaccrual loans, excluding FDIC-supported loans, at December 31, 2010 decreased by $530 million from December 31, 2009. The decrease included $331 million for construction and land development loans, $132 million for owner occupied loans, and $95 million for commercial and industrial loans. This positive impact was partially offset by a $36 million increase in commercial real estate term loans. The decrease in nonaccrual loans occurred primarily at Zions Bank, Amegy, and NBA.
Schedule 24
NONPERFORMING LENDING-RELATED ASSETS
| December 31, | ||||||||||||||||||||
| (Amounts in millions) | 2010 | 2009 | 2008 | 2007 | 2006 | |||||||||||||||
|
Nonaccrual loans: |
||||||||||||||||||||
|
Loans held for sale |
$ | – | $ | – | $ | 30 | $ | – | $ | – | ||||||||||
|
Commercial lending: |
||||||||||||||||||||
|
Commercial and industrial |
224 | 319 | 148 | 58 | 25 | |||||||||||||||
|
Leasing |
1 | 11 | 8 | – | – | |||||||||||||||
|
Municipal |
2 | – | – | – | – | |||||||||||||||
|
Owner occupied |
342 | 474 | 158 | 21 | 13 | |||||||||||||||
|
Commercial real estate: |
||||||||||||||||||||
|
Construction and land development |
494 | 825 | 457 | 161 | 14 | |||||||||||||||
|
Term |
264 | 228 | 44 | 4 | 8 | |||||||||||||||
|
Consumer: |
||||||||||||||||||||
|
Real estate |
163 | 162 | 97 | 13 | 5 | |||||||||||||||
|
Other |
3 | 4 | 4 | 2 | 2 | |||||||||||||||
|
Nonaccrual loans, excluding FDIC-supported loans |
1,493 | 2,023 | 946 | 259 | 67 | |||||||||||||||
|
Other real estate owned: |
||||||||||||||||||||
|
Commercial: |
||||||||||||||||||||
|
Commercial properties |
99 | 85 | 36 | 8 | 5 | |||||||||||||||
|
Developed land |
6 | 14 | 7 | – | – | |||||||||||||||
|
Land |
33 | 35 | 2 | 2 | 2 | |||||||||||||||
|
Residential: |
||||||||||||||||||||
|
1-4 family |
53 | 50 | 40 | 4 | 2 | |||||||||||||||
|
Developed land |
50 | 119 | 71 | 1 | – | |||||||||||||||
|
Land |
18 | 33 | 36 | – | – | |||||||||||||||
|
Other real estate owned, excluding FDIC-supported assets |
259 | 336 | 192 | 15 | 9 | |||||||||||||||
|
Other assets |
– | – | – | – | 6 | |||||||||||||||
|
Total nonperforming lending-related assets, excluding FDIC-supported assets |
1,752 | 2,359 | 1,138 | 274 | 82 | |||||||||||||||
|
FDIC-supported nonaccrual loans |
36 | 356 | – | – | – | |||||||||||||||
|
FDIC-supported other real estate owned |
40 | 54 | – | – | – | |||||||||||||||
|
FDIC-supported nonperforming lending-related assets |
76 | 410 | – | – | – | |||||||||||||||
|
Total nonperforming lending-related assets |
$ | 1,828 | $ | 2,769 | $ | 1,138 | $ | 274 | $ | 82 | ||||||||||
|
Ratio of nonperforming assets to net loans and leases* and other real estate owned |
4.91 | % | 6.79 | % | 2.71 | % | 0.70 | % | 0.24 | % | ||||||||||
|
Accruing loans past due 90 days or more: |
||||||||||||||||||||
|
Commercial lending |
$ | 11 | $ | 53 | $ | 50 | $ | 38 | $ | 17 | ||||||||||
|
Commercial real estate |
7 | 33 | 48 | 28 | 22 | |||||||||||||||
|
Consumer |
5 | 21 | 32 | 11 | 5 | |||||||||||||||
|
Total excluding FDIC-supported loans |
23 | 107 | 130 | 77 | 44 | |||||||||||||||
|
FDIC-supported loans |
119 | 56 | – | – | – | |||||||||||||||
|
Total |
$ | 142 | $ | 163 | $ | 130 | $ | 77 | $ | 44 | ||||||||||
|
Ratio of accruing loans past due 90 days or more
|
0.38 | % | 0.40 | % | 0.31 | % | 0.20 | % | 0.13 | % | ||||||||||
| * | Includes loans held for sale. |
70
Table of Contents
TDR Loans
Nonaccrual loans also include nonperforming loans which have been restructured and classified as troubled debt restructured loans.
TDRs are loans which have been modified to accommodate a borrower who is experiencing financial difficulties, and for which the Company has granted a concession that it would not otherwise consider. These modifications are structured on a loan-by-loan basis, and depending on the circumstances, may include extended payment terms, a modified interest rate, forgiveness of principal (on occasion), or other concessions. However, not all modifications are TDRs; modifications are also performed in the normal course of business for borrowers that are not experiencing financial difficulty, wherein we meet the customer’s specific needs, comply with contractual commitments, as well as for competitive reasons.
We consider many factors in determining whether to agree to a loan modification involving concessions, and seek a solution that will both minimize potential loss to the Company and attempt to help the borrower. We evaluate the borrower’s current and forecasted future cash flows, their ability and willingness to make current contractual or proposed modified payments, the value of the underlying collateral (if applicable), the possibility of obtaining additional security, and the potential costs related to a repossession or foreclosure and the subsequent sale of the collateral.
TDRs are classified as either accrual or nonaccrual loans. If a nonaccrual loan is restructured as a TDR, it will remain on nonaccrual status until the borrower has proven the ability to perform under the modified structure for a minimum of six months, and there is evidence that such payments can and are likely to continue as agreed. Most often, loans are classified as nonaccrual according to our nonaccrual policy when restructured as a TDR.
Schedule 25 provides the outstanding balances of our TDR loans.
Schedule 25
ACCRUING AND NONACCRUING TROUBLED DEBT RESTRUCTURED LOANS
| December 31, | ||||||||
| (In millions) | 2010 | 2009 | ||||||
|
Restructured loans – accruing |
$ | 388 | $ | 204 | ||||
|
Restructured loans – nonaccruing |
367 | 299 | ||||||
|
Total |
$ | 755 | $ | 503 | ||||
Commercial loan TDRs
Commercial loans (commercial lending (“C&I”) and commercial real estate (“CRE”)) may be modified to provide the borrower more time to complete the project, to achieve a higher lease-up percentage, to sell the property, or for other reasons. When it is in the best interest of the Company and the borrower to agree to a concession, we modify the loan rather than to try to pursue collection through foreclosure or other means.
For certain troubled debt restructurings, we split the loan into two new notes – A and B notes. The A note is structured to comply with our current lending standards at current market rates, and is tailored to suit the customer’s ability to make timely interest and principal payments. The B note represents the concession granted to the borrower and varies by situation, but usually we defer principal and interest payments until the A note has been paid in full. The B note is often charged-off soon after the restructuring has been completed, and any payments collected are accounted for as recoveries.
At December 31, 2010, the Company had classified $159 million and $532 million of C&I and CRE loans as TDRs, respectively.
71
Table of Contents
Consumer loan TDRs
Consumer loan TDRs represent loan modifications in which a concession has been granted to the borrower who is unable to refinance the loan with a new loan from another lender, or who is experiencing economic hardship. Such TDRs may include first-lien residential mortgage loans and home equity loans. At December 31, 2010, the Company had classified $64 million of consumer loans as TDRs.
72
Table of Contents
Other
In addition to the lending related nonperforming assets, the Company had $195 million in carrying value of investments in debt securities that were on nonaccrual status at December 31, 2010, which compared to $171 million at December 31, 2009.
Allowance and Reserve for Credit Losses
In analyzing the adequacy of the allowance for loan losses, we utilize a comprehensive loan grading system to determine the risk potential in the portfolio and also consider the results of independent internal credit reviews. To determine the adequacy of the allowance, the Company’s loan and lease portfolio is broken into segments based on loan type.
Schedule 26 summarizes the Company’s loan loss experience by major portfolio segment.
Schedule 26
SUMMARY OF LOAN LOSS EXPERIENCE
| (Amounts in millions) | 2010 | 2009 | 2008 | 2007 | 2006 | |||||||||||||||
|
Loans and leases outstanding on December 31,
|
$ | 36,747 | $ | 40,189 | $ | 41,659 | $ | 38,880 | $ | 34,415 | ||||||||||
|
Average loans and leases outstanding, (net of
|
$ | 38,250 | $ | 41,513 | $ | 40,795 | $ | 36,575 | $ | 32,134 | ||||||||||
|
Allowance for loan losses: |
||||||||||||||||||||
|
Balance at beginning of year |
$ | 1,531 | $ | 687 | $ | 459 | $ | 365 | $ | 338 | ||||||||||
|
Allowance of companies acquired |
– | – | – | 8 | – | |||||||||||||||
|
Allowance associated with purchased securitized loans |
– | – | 2 | – | – | |||||||||||||||
|
Allowance of loans and leases sold |
– | – | (1 | ) | (2 | ) | – | |||||||||||||
|
Provision charged against earnings |
852 | 2,017 | 648 | 152 | 73 | |||||||||||||||
|
Change in allowance covered by FDIC indemnification |
26 | – | – | – | – | |||||||||||||||
|
Charge-offs: |
||||||||||||||||||||
|
Commercial lending |
(417 | ) | (373 | ) | (100 | ) | (39 | ) | (47 | ) | ||||||||||
|
Commercial real estate |
(517 | ) | (713 | ) | (269 | ) | (24 | ) | (5 | ) | ||||||||||
|
Consumer |
(140 | ) | (170 | ) | (45 | ) | (16 | ) | (14 | ) | ||||||||||
|
Total |
(1,074 | ) | (1,256 | ) | (414 | ) | (79 | ) | (66 | ) | ||||||||||
|
Recoveries: |
||||||||||||||||||||
|
Commercial lending |
35 | 51 | 9 | 9 | 12 | |||||||||||||||
|
Commercial real estate |
44 | 21 | 7 | 1 | 1 | |||||||||||||||
|
Consumer |
12 | 9 | 5 | 5 | 7 | |||||||||||||||
|
Total |
91 | 81 | 21 | 15 | 20 | |||||||||||||||
|
Charge-offs recoverable from FDIC |
14 | 2 | – | – | – | |||||||||||||||
|
Net loan and lease charge-offs |
(969 | ) | (1,173 | ) | (393 | ) | (64 | ) | (46 | ) | ||||||||||
|
Reclassification to reserve for unfunded lending commitments |
– | (28 | ) | – | – | |||||||||||||||
|
Balance at end of year |
$ | 1,440 | $ | 1,531 | $ | 687 | $ | 459 | $ | 365 | ||||||||||
|
Ratio of net charge-offs to average loans and leases |
2.53 | % | 2.82 | % | 0.96 | % | 0.17 | % | 0.14 | % | ||||||||||
|
Ratio of allowance for loan losses to net loans and leases,
|
3.92 | % | 3.81 | % | 1.65 | % | 1.18 | % | 1.06 | % | ||||||||||
|
Ratio of allowance for loan losses to nonperforming loans,
|
94.22 | % | 64.36 | % | 72.58 | % | 177.70 | % | 549.88 | % | ||||||||||
|
Ratio of allowance for loan losses to nonaccrual loans and accruing loans past due 90 days or more, on December 31, |
86.21 | % | 60.22 | % | 63.84 | % | 136.75 | % | 331.56 | % | ||||||||||
73
Table of Contents
Schedule 27 provides a breakdown of the allowance for loan losses and the allocation among the portfolio segments.
Schedule 27
ALLOCATION OF THE ALLOWANCE FOR LOAN LOSSES
AT DECEMBER 31,
| 2010 | 2009 | 2008 | 2007 | 2006 | ||||||||||||||||||||||||||||||||||||
| (Amounts in millions) |
% of
total loans |
Allocation
of allowance |
% of
total loans |
Allocation
of allowance |
% of
total loans |
Allocation
of allowance |
% of
total loans |
Allocation
of allowance |
% of
total loans |
Allocation
of allowance |
||||||||||||||||||||||||||||||
|
Type of Loan |
||||||||||||||||||||||||||||||||||||||||
|
Commercial lending |
49.5 | % | $ | 761 | 47.6 | % | $ | 613 | 49.5 | % | $ | 319 | 47.4 | % | $ | 190 | 44.1 | % | $ | 182 | ||||||||||||||||||||
|
Commercial real estate |
30.2 | 487 | 31.8 | 753 | 32.8 | 291 | 33.8 | 215 | 35.8 | 143 | ||||||||||||||||||||||||||||||
|
Consumer |
17.7 | 154 | 17.0 | 165 | 17.7 | 77 | 18.8 | 54 | 20.1 | 40 | ||||||||||||||||||||||||||||||
|
FDIC-supported loans |
2.6 | 38 | 3.6 | – | ||||||||||||||||||||||||||||||||||||
|
Total |
100.0 | % | $ | 1,440 | 100.0 | % | $ | 1,531 | 100.0 | % | $ | 687 | 100.0 | % | $ | 459 | 100.0 | % | $ | 365 | ||||||||||||||||||||
The total allowance for loan losses at December 31, 2010 decreased by $91 million from the level at year-end 2009. For 2010, the $148 million increase in the allowance for loan losses for commercial lending reflects deterioration of borrower credit quality due to difficult economic conditions, reductions in collateral values, and increases in realized loss rates that increased our quantitative loss factors for commercial real estate and consumer portfolios as well. The $266 million decrease in the allowance for commercial real estate loans largely reflects the decrease in loans outstanding for the construction and land development portfolio and improving credit quality measures across the Company.
The reserve for unfunded lending commitments represents a reserve for potential losses associated with off-balance sheet commitments and standby letters of credit. The December 31, 2010 balance decreased by $5 million from December 31, 2009. This decrease is primarily due to an improvement in credit quality measures including a reduction of criticized and classified commitments. See Note 6 of the Notes to Consolidated Financial Statements for additional information related to the allowance for credit losses.
Interest Rate and Market Risk Management
Interest rate and market risk are managed centrally. Interest rate risk is the potential for reduced income resulting from adverse changes in the level of interest rates on the Company’s net interest income. Market risk is the potential for loss arising from adverse changes in the fair value of fixed income securities, equity securities, other earning assets and derivative financial instruments as a result of changes in interest rates or other factors. As a financial institution that engages in transactions involving an array of financial products, the Company is exposed to both interest rate risk and market risk.
The Company’s Board of Directors is responsible for approving the overall policies relating to the management of the financial risk of the Company. The Boards of Directors of the Company’s subsidiary banks are also required to review and approve these policies. In addition, the Board establishes and periodically revises policy limits, and reviews limit exceptions reported by management. The Board has established the management ALCO to which it has delegated the functional management of interest rate and market risk for the Company. ALCO’s primary responsibilities include:
| • |
recommending policies to the Board and administering Board-approved policies that govern and limit the Company’s exposure to all interest rate and market risk, including policies that are designed to limit the Company’s exposure to changes in interest rates; |
| • |
approving the procedures that support the Board-approved policies; |
74
Table of Contents
| • |
maintaining management’s policies dealing with interest rate and market risk; |
| • |
approving all material interest rate risk management strategies, including all hedging strategies and actions taken pursuant to managing interest rate risk and monitoring risk positions against approved limits; |
| • |
approving limits and all financial derivative positions taken at both the Parent and subsidiaries for the purpose of hedging the Company’s interest rate and market risks; |
| • |
providing the basis for integrated balance sheet, net interest income, and liquidity management; |
| • |
calculating the duration and dollar duration of each class of assets, liabilities, and net equity, given defined interest rate scenarios; |
| • |
managing the Company’s exposure to changes in net interest income and duration of equity due to interest rate fluctuations; and |
| • |
quantifying the effects of hedging instruments on the duration of equity and net interest income under defined interest rate scenarios. |
Interest Rate Risk
Interest rate risk is one of the most significant risks to which the Company is regularly exposed. In general, our goal in managing interest rate risk is to have the net interest margin increase slightly in a rising interest rate environment. We refer to this goal as being slightly “asset-sensitive.” This approach is based on our belief that in a rising interest rate environment, the market cost of equity, or implied rate at which future earnings are discounted, would also tend to rise. The Company has positioned its December 31, 2010 balance sheet to be more asset sensitive than it was at December 31, 2009.
We attempt to minimize the impact of changing interest rates on net interest income primarily through the use of interest rate floors on variable rate loans, interest rate swaps, use of interest rate futures, and by avoiding large exposures to long-term fixed rate interest-earning assets that have significant negative convexity. The prime lending rate and the LIBOR curves are the primary indices used for pricing the Company’s loans. The interest rates paid on deposit accounts are set by individual banks so as to be competitive in each local market.
We monitor interest rate risk through the use of two complementary measurement methods: duration of equity and income simulation. In the duration of equity method we measure the expected changes in the fair values of equity in response to changes in interest rates. In the income simulation method we analyze the expected changes in income in response to changes in interest rates.
Duration of equity is derived by first calculating the dollar duration of all assets, liabilities and derivative instruments. Dollar duration is determined by calculating the fair value of each instrument assuming interest rates sustain immediate and parallel movements up 1% and down 1%. The average of these two changes in fair value is the dollar duration. Subtracting the dollar duration of liabilities from the dollar duration of assets and adding the net dollar duration of derivative instruments results in the dollar duration of equity. Duration of equity is computed by dividing the dollar duration of equity by the fair value of equity. The Company’s policy is generally to maintain duration of equity between -3 years to +7 years. However, in the current low interest rate environment, the Company is operating with a duration of equity of slightly less than -3 years in some scenarios.
Income simulation is an estimate of the net interest income and total rate sensitive income that would be recognized under different rate environments. Net interest income and total rate sensitive income are measured under several parallel and nonparallel interest rate environments and deposit repricing assumptions, taking into account an estimate of the possible exercise of options within the portfolio. For income simulation, Company policy requires that interest sensitive income from a static balance sheet be limited to a decline of no more than 10% during one year if rates were to immediately rise or fall in parallel by 200 basis points.
75
Table of Contents
Both of these measurement methods require that we assess a number of variables and make various assumptions in managing the Company’s exposure to changes in interest rates. The assessments address loan and security prepayments, early deposit withdrawals, and other embedded options and noncontrollable events. As a result of uncertainty about the maturity and repricing characteristics of both deposits and loans, the Company estimates ranges of duration and income simulation under a variety of assumptions and scenarios. The Company’s interest rate risk position changes as the interest rate environment changes and is managed actively to try to maintain a slightly asset-sensitive position. However, positions at the end of any period may not be reflective of the Company’s position in any subsequent period.
We should note that estimated duration of equity and the income simulation results are highly sensitive to the assumptions used for deposits that do not have specific maturities, such as checking, savings, and money market accounts, and also to prepayment assumptions used for loans with prepayment options. Given the uncertainty of these estimates, we view both the duration of equity and the income simulation results as falling within a wide range of possibilities.
As of the dates indicated, Schedule 28 shows the Company’s estimated range of duration of equity and percentage change in interest sensitive income, based on a static balance sheet, in the first year after the rate change if interest rates were to sustain an immediate parallel change of 200 basis points; the “fast” and “slow” results differ based on the assumed speed of repricing of administered-rate deposits (money market, interest-on-checking, and savings).
Schedule 28
DURATION OF EQUITY AND INTEREST SENSITIVE INCOME
|
December 31,
2010 |
December 31,
2009 |
|||||||||||||||
| Low | High | Low | High | |||||||||||||
|
Duration of equity: |
||||||||||||||||
|
Range (in years) |
||||||||||||||||
|
Base case |
-3.1 | -1.2 | -2.9 | -0.8 | ||||||||||||
|
Increase interest rates by 200 bp |
-3.0 | -1.4 | -2.7 | -0.8 | ||||||||||||
| Deposit repricing response | ||||||||||||||||
| Fast | Slow | Fast | Slow | |||||||||||||
|
Income simulation – change in interest sensitive income: |
||||||||||||||||
|
Increase interest rates by 200 bp |
3.1 | % | 6.0 | % | 2.2 | % | 5.0 | % | ||||||||
|
Decrease interest rates by 200 bp 1 |
-2.5 | % | -2.7 | % | -4.1 | % | -4.3 | % | ||||||||
| 1 |
In the event that a 200 basis point rate parallel decrease cannot be achieved, the applicable rate changes are limited to lesser amounts such that interest rates cannot be less than zero. |
During 2010, the duration of equity became shorter as compared to December 31, 2009, primarily driven by an increase in noninterest-bearing demand deposits, a decline in loans, and an increase in money market instruments. Noninterest-bearing demand deposits increased to 30.8% of total liabilities at December 31, 2010, compared to 27.1% at the end of 2009.
Our focus on business banking also plays a significant role in determining the nature of the Company’s asset-liability management posture. At the end of 2010 and 2009, approximately 77% and 78%, respectively, of the Company’s commercial lending and commercial real estate portfolios were variable rate and primarily tied to either the prime rate or LIBOR. In addition, certain of our consumer loans also have variable interest rates.
76
Table of Contents
The Company had historically used interest rate swaps to convert most of its long-term fixed-rate debt into floating-rate debt. In 2009, these swaps were terminated when management decided to position the Company to be more asset sensitive in light of historically low short-term interest rates and unprecedented “quantitative easing” monetary policy actions by the Federal Reserve. We have also traditionally engaged in an ongoing program of swapping prime-based and LIBOR-based loans for “receive-fixed” contracts. However, during 2010 we terminated and did not replace a number of such swaps with the objective of positioning the Company’s balance sheet to be more asset sensitive. At year-end 2010 and 2009, the Company held a notional amount of approximately $0.5 billion and $0.9 billion, respectively, of such cash flow hedge contracts. These swaps also expose the Company to counterparty risk, which is a type of credit risk. The Company’s approach to managing this risk is discussed in “Credit Risk Management” on page 62. The Company retains basis risk due to changes between the prime rate and LIBOR on nonhedge derivative basis swaps. See “Accounting for Derivatives” on page 31 for further details about our derivative instruments. Finally, the Company’s subsidiary banks made increasing use of interest rate floors on new loans. As of December 31, 2010, approximately 48.4% of all of the Company’s variable rate loan balances contain floors. Of the loans with floors, approximately 75.5% of the balances are priced at the floor rates, which were above the “index plus spread” rate by an average of 1.22% on that date. At the end of the previous year, 26.3% of the Company’s variable rate loans were priced at floors that were above the “index plus spread” rate by an average of 1.55% on that date.
In the latter half of 2010, the Company began to mitigate the asset sensitivity of its balance sheet by purchasing a combination of Eurodollar futures contracts and put options for some of these same contracts. The Eurodollar futures are intended to mitigate the potential impact that declining interest rates could have on the Company’s future earnings, while the purpose of the put options is to limit the exposure in an environment of rising interest rates. Also in the latter half of 2010, the Company deployed some of its excess liquidity by purchasing floating rate Agency mortgage-backed securities, with the same objective of mitigating asset sensitivity.
Schedule 29 presents a profile of the current interest rate derivatives portfolio. For additional information regarding derivative instruments, including fair values at December 31, 2010, refer to Notes 1 and 8 of the Notes to Consolidated Financial Statements.
77
Table of Contents
Schedule 29
INTEREST RATE SWAPS – YEAR-END BALANCES AND AVERAGE RATES*
| (Amounts in millions) | 2011 | 2012 | Thereafter | |||||||||
|
Cash flow hedges 1 : |
||||||||||||
|
Notional amount |
$ | 335 | $ | 150 | – | |||||||
|
Weighted average expected receive rate |
5.24 | % | 4.14 | % | – | |||||||
|
Weighted average expected pay rate |
1.90 | 3.45 | – | |||||||||
|
Nonhedges: |
||||||||||||
|
Receive fixed rate/pay variable rate: |
||||||||||||
|
Notional amount |
$ | 46 | $ | 46 | – | |||||||
|
Weighted average expected receive rate |
4.01 | % | 4.01 | % | – | |||||||
|
Weighted average expected pay rate |
1.09 | 2.08 | – | |||||||||
|
Receive variable rate/pay fixed rate: |
||||||||||||
|
Notional amount |
$ | 46 | $ | 46 | – | |||||||
|
Weighted average expected receive rate |
1.09 | % | 2.08 | % | – | |||||||
|
Weighted average expected pay rate |
4.01 | 4.01 | – | |||||||||
|
Basis swaps: |
||||||||||||
|
Notional amount |
$ | 85 | – | – | ||||||||
|
Weighted average expected receive rate |
3.37 | % | – | – | ||||||||
|
Weighted average expected pay rate |
3.58 | – | – | |||||||||
|
Net notional |
$ | 420 | $ | 150 | – | |||||||
| 1 |
Receive fixed rate/pay variable rate |
| * | Balances are based upon the portfolio at December 31, 2010. Excludes interest rate swap products that we provide as a service to our customers. |
Market Risk – Fixed Income
The Company engages in the underwriting and trading of municipal and corporate securities. This trading activity exposes the Company to a risk of loss arising from adverse changes in the prices of these fixed income securities.
At December 31, 2010, the Company had $49 million of trading assets and $43 million of securities sold, not yet purchased, compared with $24 million and $43 million on December 31, 2009, respectively.
The Company is exposed to market risk through changes in fair value and OTTI of HTM and AFS securities. The Company also is exposed to market risk for interest rate swaps and Eurodollar and Federal Funds futures contracts used to hedge interest rate risk. Changes in fair value of AFS securities and in interest rate swaps that qualify as cash flow hedges are included in OCI each quarter. During 2010, the after-tax change in OCI attributable to HTM and AFS securities was $4.1 million, and the change attributable to interest rate swaps was $(37.4) million. If any of the AFS or HTM securities transferred from AFS become other than temporarily impaired, any credit loss in OCI is reversed and the impairment is charged to operations. See “Investment Securities Portfolio” on page 52 for additional information on OTTI.
Market Risk – Equity Investments
Through its equity investment activities, the Company owns equity securities that are publicly traded and subject to fluctuations in their market prices or values. In addition, the Company owns equity securities in
78
Table of Contents
companies that are not publicly traded, that are accounted for under cost, fair value, equity, or full consolidation methods of accounting, depending upon the Company’s ownership position and degree of involvement in influencing the investees’ affairs. In either case, the value of the Company’s investment is subject to fluctuation. Since the fair value of these securities may fall below the Company’s investment costs, the Company is exposed to the possibility of loss. These equity investments are approved, monitored and evaluated by the Company’s Equity Investment Committee.
The Company also invests in pre-public venture capital companies through various venture funds. The Company’s remaining equity exposure to these investments, net of related noncontrolling interests at December 31, 2010 was approximately $48 million, compared to approximately $56 million at December 31, 2009.
In addition to the program described above, Amegy has in place an alternative investments program. These investments are primarily directed towards equity buyout and mezzanine funds with a key strategy of deriving ancillary commercial banking business from the portfolio companies. Early stage venture capital funds generally are not part of the strategy since the underlying companies are typically not creditworthy. The carrying value of the investments was $68 million and $63 million at December 31, 2010 and 2009, respectively. At December 31, 2010, and 2009 the Company has a total remaining funding commitment of $56 million and $78 million, respectively, to SBIC, non-SBIC funds, and private equity investments. Of these commitments, approximately $41 million and $53 million, respectively, were at Amegy.
Under the provisions of the Dodd-Frank Act, the Company is allowed to fund remaining unfunded portions of existing private equity fund commitments, but is not allowed to make any additional commitments to invest in private equity funds.
Liquidity Risk
Overview
Liquidity risk is the possibility that the Company’s cash flows may not be adequate to fund its ongoing operations and meet its commitments in a timely and cost-effective manner. Since liquidity risk is closely linked to both credit risk and market risk, many of the previously discussed risk control mechanisms also apply to the monitoring and management of liquidity risk. We manage the Company’s liquidity to provide adequate funds to meet its anticipated financial and contractual obligations, including withdrawals by depositors, debt service requirements and lease obligations, as well as to fund customers’ needs for credit.
Overseeing liquidity management is the responsibility of ALCO, which implements a Board-adopted corporate Liquidity and Funding Policy. This Policy addresses maintaining adequate liquidity, diversifying funding positions, monitoring liquidity at consolidated as well as subsidiary bank levels, and anticipating future funding needs. The policy also includes liquidity ratio guidelines, for example, the ‘time to required funding’ and fixed charges coverage ratios, that are used to monitor the liquidity positions of the Parent and bank subsidiaries, as well as various stress test and liquid asset measurements for Parent and bank liquidity.
The management of liquidity and funding is performed centrally by Zions Bank’s Capital Markets/Investment Division under the direction of the Company’s Chief Investment Officer, with oversight by ALCO. The Chief Investment Officer is responsible for recommending changes to existing funding plans, as well as to the policy guidelines. These recommendations must be submitted for approval to ALCO and potentially to the Company’s Board of Directors. The subsidiary banks have authority to price deposits, borrow from their FHLB and the Federal Reserve, and sell/purchase Federal Funds to/from Zions Bank and/or correspondent banks. The banks may also make liquidity and funding recommendations to the Chief Investment Officer, but are not involved in any other funding decision making processes.
79
Table of Contents
Contractual Obligations
Schedule 30 summarizes the Company’s contractual obligations at December 31, 2010.
Schedule 30
CONTRACTUAL OBLIGATIONS
| (In millions) |
One year
or less |
Over
one year through three years |
Over
three years through five years |
Over
five years |
Indeterminable
maturity 1 |
Total | ||||||||||||||||||
|
Deposits |
$ | 3,655 | $ | 560 | $ | 254 | $ | 2 | $ | 36,464 | $ | 40,935 | ||||||||||||
|
Commitments to extend credit |
4,582 | 3,555 | 1,176 | 2,196 | 11,509 | |||||||||||||||||||
|
Standby letters of credit: |
||||||||||||||||||||||||
|
Financial |
624 | 165 | 49 | 83 | 921 | |||||||||||||||||||
|
Performance |
149 | 35 | 2 | – | 186 | |||||||||||||||||||
|
Commercial letters of credit |
38 | 9 | 47 | |||||||||||||||||||||
|
Commitments to make venture and other noninterest-bearing investments 2 |
56 | 56 | ||||||||||||||||||||||
|
Securities sold, not yet purchased |
43 | 43 | ||||||||||||||||||||||
|
Federal funds purchased and security repurchase agreements |
722 | 722 | ||||||||||||||||||||||
|
Other short-term borrowings |
166 | 166 | ||||||||||||||||||||||
|
Long-term debt 3 |
8 | 360 | 1,078 | 483 | 1,929 | |||||||||||||||||||
|
Operating leases, net of subleases |
47 | 88 | 69 | 145 | 349 | |||||||||||||||||||
|
Unrecognized tax benefits, ASC 740 |
2 | 2 | 1 | 2 | 7 | |||||||||||||||||||
| $ | 10,092 | $ | 4,774 | $ | 2,629 | $ | 2,909 | $ | 36,466 | $ | 56,870 | |||||||||||||
| 1 |
Indeterminable maturity deposits include noninterest-bearing demand, savings and money market deposits, and non-time foreign deposits. |
| 2 |
Commitments to make venture and other noninterest-bearing investments do not have defined maturity dates. They have therefore been considered due on demand, maturing in one year or less. |
| 3 |
The maturities on long-term borrowings do not include the associated hedges. |
In addition to the commitments specifically noted in the previous schedule, the Company enters into a number of contractual commitments in the ordinary course of business. These include software licensing and maintenance, telecommunications services, facilities maintenance and equipment servicing, supplies purchasing, and other goods and services used in the operation of our business. Generally, these contracts are renewable or cancelable at least annually, although in some cases to secure favorable pricing concessions, the Company has committed to contracts that may extend to several years.
The Company also enters into derivative contracts under which it is required either to receive cash or pay cash, depending on changes in interest rates. These contracts are carried at fair value on the balance sheet with the fair value representing the net present value of the expected future cash receipts and payments based on market rates of interest as of the balance sheet date. The fair value of the contracts changes daily as interest rates change. For further information on derivative contracts, see Note 8 of the Notes to Consolidated Financial Statements.
Liquidity Management Actions
Consolidated cash and interest-bearing deposits at the Parent and its subsidiaries increased to $5.5 billion at December 31, 2010 from $2.0 billion at December 31, 2009. During 2010 we had a significant increase in cash mainly due to our capital raising transactions and a net decrease in loans, partially offset by a decrease in total deposits.
Parent Company Liquidity: The Parent’s cash requirements consist primarily of debt service, investments in and advances to subsidiaries, operating expenses, income taxes, and dividends to preferred and common
80
Table of Contents
shareholders, including the CPP preferred equity issued to the U.S. Department of the Treasury. The Parent’s cash needs are usually met through dividends from its subsidiaries, interest and investment income, subsidiaries’ proportionate share of current income taxes, equity contributed through the exercise of stock options, and long-term debt and equity issuances.
During 2010, the Parent did not receive dividends on common or preferred stock from its banking subsidiaries. The amount of dividends the banking subsidiaries can pay to the Parent are restricted by current and historical earnings levels, retained earnings, risk-based capital requirements, and other regulatory capital requirements. Several of the Company’s subsidiary banks returned to profitability over the course of 2010, and most are expected to be profitable in 2011. This may permit the payment of some dividends by the banks to the Parent, or a return of some capital to the Parent in 2011. However, if the operating performance of the subsidiary banks deteriorates under renewed weak economic conditions or changes in regulation or law in 2011, the banks may not be able to pay dividends to the Parent. See Note 19 of the Notes to Consolidated Financial Statements for details of dividend capacities and limitations.
Also, earnings on the Parent’s investment securities portfolio have been reduced. Therefore, cash receipts from subsidiaries and investments currently do not cover the Parent’s interest and dividend payments and may not cover these payments in 2011. In addition, the Parent had to increase its investment in several of its bank subsidiaries in 2009 and in the first quarter of 2010 in order to maintain capital levels appropriate to current weak economic and credit quality conditions. The Company does not anticipate any need to make further capital investments in its bank subsidiaries in 2011. The Company has reduced the dividend on its common stock to $0.01 per share per quarter, due to lack of earnings and in order to conserve both capital and cash.
Federal Reserve Board Supervisory Letter SR 09-4, dated February 24, 2009 (as revised March 27, 2009), reiterates and expands previous guidance to bank holding companies regarding the payment of common dividends, preferred dividends, and dividends on more senior capital instruments in times of stress on earnings and capital ratios. On November 17, 2010 the Federal Reserve Board issued a revised temporary addendum to this letter stating that bank holding companies should consult with the Federal Reserve staff before taking any capital actions, including actions that could result in a diminished capital base, such as increasing dividends, implementing common stock repurchase programs, or redeeming or repurchasing capital instruments.
General financial market and economic conditions, both of which have been highly stressed since mid-2008 or earlier, as well as the Company’s debt ratings, have adversely impacted the Company’s access to external financing. Access to funding markets for the Parent and subsidiary banks is directly impacted by the credit ratings they receive from various rating agencies. The ratings not only influence the costs associated with the borrowings but can also influence the sources of the borrowings. One rating agency, Moody’s, rates the Company’s senior debt as B2 or noninvestment grade, while Standard & Poor’s, Fitch and DBRS all rate the Company’s senior debt at a low investment grade level. In addition, all four rating agencies rate the Company’s subordinated debt as noninvestment grade. In August 2010, Moody’s changed its outlook for the Company to positive from negative, while in December 2010, Fitch downgraded the Company’s senior debt rating one “notch” to BBB-, but changed its outlook from negative to stable. The other two agencies have a negative outlook for the Company.
81
Table of Contents
The Parent had the following ratings as of December 31, 2010:
Schedule 31
CREDIT RATINGS
|
Rating agency |
Outlook |
Long-term issuer/
rating |
Subordinated debt
|
Short-term/ commercial
|
||||
|
S&P |
Negative | BBB- | BB+ | A-3 | ||||
|
Moody’s |
Positive | B2 | B3 | NP | ||||
|
Fitch |
Stable | BBB- | BB+ | F3 | ||||
|
DBRS |
Negative | BBB (low) | BB (high) | R-2 (low) |
During 2010, the primary sources of additional cash to the Parent in the capital markets were (1) $623 million from the issuance of new shares of common stock, (2) $139 million from the issuance of new shares of Series E preferred stock, (3) $215 million from the issuance of common stock warrants, (4) $267 million from the issuance of unsecured 1.0-2.5 year senior notes, and (5) $40 million from the issuance of five-year 7.75% unsecured senior notes. In total these sources added approximately $1,284 million to the Parent’s liquid assets. The Parent had a cash balance of $500 million and $700 million of U.S. Treasury Bills at December 31, 2010 compared to a cash balance of $542 million and no highly liquid securities at December 31, 2009.
During 2010 and 2009, the Parent’s operating expenses included cash payments for interest of approximately $147 million and $123 million, respectively. Additionally, the Parent paid $109.3 million and $96.3 million of dividends on preferred and common stock, respectively, for the same applicable periods. Note 24 of the Notes to Consolidated Financial Statements contains the Parent’s statements of income and statements of cash flows for the years ended December 31, 2010, 2009, and 2008 as well as its balance sheets at December 31, 2010 and December 31, 2009.
During 2010, issuances by the Parent of long-term debt exceeded repayments. Cash received from the issuance of long-term debt during 2010 included $40 million from the issuance of additional 7.75% unsecured notes due September 23, 2014 and $106 million from the issuance of senior medium-term notes due between October 2012 and February 2013.
Short-term borrowings by the Parent exceeded repayments, which resulted in $113 million of cash inflows during 2010. During 2010 the Company issued $161 million of one-year senior medium-term notes.
At December 31, 2010, maturities of the Company’s senior and subordinated debt ranged from August 2011 to November 2015 with effective interest rates from 0.66% to 7.75%.
See Note 13 of the Notes to Consolidated Financial Statements for a complete summary of the Company’s long-term debt.
Subsidiary Bank Liquidity: The subsidiaries’ primary source of funding is their core deposits, consisting of demand, savings and money market deposits, time deposits under $100,000, and foreign deposits. At December 31, 2010, these core deposits, excluding brokered deposits, in aggregate, constituted 93.5% of consolidated deposits, compared with 89.3% of consolidated deposits at December 31, 2009. On a consolidated basis, the Company’s net loan to total deposit ratio is historically low at 89.8%, another measure of strong bank liquidity.
Historically, the Company’s subsidiary banks have also obtained brokered deposits to serve as an additional source of liquidity, which is currently not needed. Given the strong levels of affiliate liquidity, the Company has
82
Table of Contents
aggressively lowered its brokered deposit usage. During 2010, total brokered deposits declined $1.2 billion to only $0.4 billion at year-end 2010, down from $1.6 billion at December 31, 2009. Brokered deposits are currently 1.1% of total deposits.
Total deposits decreased by $906 million during 2010 due to our efforts to reduce excess liquidity, which primarily resulted in decreases in time and money market deposits, partially offset by increases in noninterest-bearing demand and savings and NOW deposits. We also worked with a number of business and governmental customers to help them move excess cash balances into sweep accounts at third-party money market funds, which prevented the growth in demand balances from being even larger. We will continue to reduce non-core and non-relationship deposits to improve profitability and return on capital as loans continue to run-off, but as loan demand improves we anticipate bringing these deposits back onto the balance sheet.
On July 21, 2010, the Dodd-Frank Wall Street Reform and Consumer Protection Act made permanent the maximum deposit insurance amount of $250,000. On November 9, 2010 the FDIC issued a final rule providing temporary unlimited insurance coverage for noninterest-bearing transaction accounts at all FDIC-insured depository institutions, effective December 31, 2010 through December 31, 2012.
The FHLB system, has, from time to time, been a significant source of liquidity for each of the Company’s subsidiary banks. Zions Bank and TCBW are members of the FHLB of Seattle. CB&T, NSB, and NBA are members of the FHLB of San Francisco. Vectra is a member of the FHLB of Topeka and Amegy Bank is a member of the FHLB of Dallas. The FHLB allows member banks to borrow against their eligible loans to satisfy liquidity requirements. Borrowings from the FHLB may increase in the future, depending on availability of funding from other sources such as deposits. The subsidiary banks are required to invest in FHLB stock to maintain their borrowing capacity. At December 31, 2010 and December 31, 2009 the Company had $20 million and $16 million, respectively, of long-term borrowings outstanding from the FHLB, but did not have any short-term borrowings outstanding from the FHLB for the same applicable periods. At December 31, 2010 and December 31, 2009 the subsidiary banks’ total investment in FHLB stock was approximately $125 million and $136 million, respectively.
At December 31, 2010, the amount available for additional FHLB and Federal Reserve borrowings was approximately $12.5 billion. As of year-end 2010, these sources of liquidity would be able to fund all unfunded commercial and consumer loan commitments.
Zions Bank has in prior years used asset securitizations to sell loans and to provide a flexible alternative source of funding. As a QSPE securities conduit sponsored by Zions Bank, Lockhart Funding purchased and held credit-enhanced securitized assets resulting from certain small business loan securitizations. During 2009, Zions Bank purchased $678 million of securities from Lockhart at book value under the terms of a liquidity facility Zions Bank provided to Lockhart. During the second quarter of 2009, Lockhart was consolidated onto the books of Zions Bank as a result of Zions Bank holding over 90% of Lockhart’s asset backed commercial paper, and in September 2009 Lockhart was terminated. See Note 7 of the Notes to Consolidated Financial Statements for information about Lockhart and the Liquidity Agreement.
While not considered a primary source of funding, the Company’s investment activities can provide or use cash, depending on the asset-liability management posture that is being taken. For 2010, investment securities activities resulted in an increase in investment securities holdings and a net decrease of cash in the amount of $565 million, primarily due to the purchase of approximately $700 million of 3-9 month U.S. Treasury Bills with excess cash in the fourth quarter of 2010.
During 2010, several of the Company’s subsidiary banks surrendered certain bank-owned life insurance contracts and received cash of $211 million for the settlement of the cash surrender values of the policies.
Maturing balances in our subsidiary banks’ loan portfolios also provide additional flexibility in managing cash flows. During 2010 and 2009, organic loan activity resulted in a net cash inflow of $1.8 billion and $1.4 billion, respectively, as a result of pay-downs and decreased loan demand.
83
Table of Contents
During 2010, the Company received net cash income tax refunds of $325 million, the majority of which was for the benefit of our subsidiary banks and the remainder for the benefit of the Parent.
Operational Risk Management
Operational risk is the potential for unexpected losses attributable to human error, systems failures, fraud, or inadequate internal controls and procedures. In its ongoing efforts to identify and manage operational risk, the Company has created a Corporate Risk Management Department whose responsibility is to help Company management identify and assess key risks and monitor the key internal controls and processes that the Company has in place to mitigate operational risk. We have documented controls and the Control Self Assessment related to financial reporting under Section 404 of the Sarbanes-Oxley Act of 2002 and the Federal Deposit Insurance Corporation Improvement Act of 1991.
To manage and minimize its operating risk, the Company has in place transactional documentation requirements, systems and procedures to monitor transactions and positions, regulatory compliance reviews, and periodic reviews by the Company’s internal audit and credit examination departments. In addition, reconciliation procedures have been established to ensure that data processing systems consistently and accurately capture critical data. Further, we maintain contingency plans and systems for operations support in the event of natural or other disasters. Efforts are continually underway to improve the Company’s oversight of operational risk, including enhancement of risk-control self assessment and antifraud measures reporting to the Enterprise Risk Management Committee and the Board. We also mitigate operational risks through the purchase of insurance, including errors and omissions and professional liability insurance.
CAPITAL MANAGEMENT
The Board of Directors is responsible for approving the policies associated with capital management. The Board has established the CMC whose primary responsibility is to recommend and administer the approved capital policies that govern the capital management of the Company and its subsidiary banks. Other major CMC responsibilities include:
| • |
Setting overall capital targets within the Board-approved policy, monitoring performance and recommending changes to capital including dividends, common stock repurchases, subordinated debt, or to major strategies to maintain the Company and its bank subsidiaries at well capitalized levels; and |
| • |
Reviewing agency ratings of the Parent and its bank subsidiaries and establishing target ratings. |
The CMC, in managing the capital of the Company, may set capital standards that are higher than those approved by the Board, but may not set lower limits.
The Company has a fundamental financial objective to consistently produce superior risk-adjusted returns on its shareholders’ capital. We believe that a strong capital position is vital to continued profitability and to promoting depositor and investor confidence. Specifically, it is the policy of the Parent and each of the subsidiary banks to:
| • |
Maintain sufficient capital as defined by federal banking regulators to support current needs (see Note 19 of the Notes to Consolidated Financial Statements) and to ensure that capital is available to support anticipated growth; |
| • |
Take into account the desirability of receiving an “investment grade” rating from major debt rating agencies on senior and subordinated unsecured debt when setting capital levels; |
| • |
Develop capabilities to measure and manage capital on a risk-adjusted basis and to maintain economic capital consistent with an “investment grade” risk level; and |
| • |
Return excess capital to shareholders through dividends and repurchases of common stock. |
84
Table of Contents
In addition, the CMC oversees the Company’s capital “stress testing” under a variety of adverse economic and market scenarios.
The Company’s debt and equity issuances during 2010, along with the TRS originated in 2010 with regard to certain of the Company’s CDO investments, have significantly bolstered the Company’s capital position and ratios. However, the Company anticipates that it may continue to raise additional common equity in amounts sufficient to cover losses and dividends until it returns to profitability in order to preserve this capital position.
Total controlling interest shareholders’ equity at December 31, 2010 was $6,648 million compared to $5,693 million at December 31, 2009, an increase of 16.8%. The increase in total controlling interest shareholders’ equity from December 31, 2009 is primarily due to the previously discussed capital actions partially offset by a net loss for 2010 and dividends paid on common and preferred stock for the same applicable period.
Note 19 of the Notes to Consolidated Financial Statements provides additional information on risk-based capital. In addition, “Liquidity Risk” on page 79 and Notes 13 and 14 of the Notes to Consolidated Financial Statements discuss the Company’s debt and equity transactions during 2010.
Conversions of convertible subordinated debt into preferred stock have augmented the Company’s capital position and reduced future refinancing needs. From the original modification in June 2009 through December 2010, $406 million of debt has been extinguished and $474 million of preferred capital has been added. Schedule 32 shows the effect the conversions had on Tier 1 capital and outstanding convertible subordinated debt.
85
Table of Contents
Schedule 32
IMPACT OF CONVERTIBLE SUBORDINATED DEBT
| Year Ended | Three Months Ended | |||||||||||||||||||
| (In millions) |
December
31,
2010 |
December 31,
2010 |
September 30,
2010 |
June 30,
2010 |
March 31,
2010 |
|||||||||||||||
|
Preferred equity |
||||||||||||||||||||
|
Convertible subordinated debt converted to preferred stock |
$ | 343 | $ | 151 | $ | 54 | $ | 117 | $ | 21 | ||||||||||
|
Beneficial conversion feature reclassified from common to preferred stock |
|
57 |
|
|
25 |
|
|
9 |
|
|
19 |
|
|
4 |
|
|||||
|
Change in preferred equity |
400 | 176 | 63 | 136 | 25 | |||||||||||||||
|
Common equity |
||||||||||||||||||||
|
Accelerated convertible subordinated debt amortization, net of tax |
(148 | ) | (60 | ) | (22 | ) | (59 | ) | (7 | ) | ||||||||||
|
Beneficial conversion feature reclassified from common to preferred stock |
|
(57 |
) |
|
(25 |
) |
|
(9 |
) |
|
(19 |
) |
|
(4 |
) |
|||||
|
Change in common equity |
(205 | ) | (85 | ) | (31 | ) | (78 | ) | (11 | ) | ||||||||||
|
Net impact on Tier 1 capital |
$ | 195 | $ | 91 | $ | 32 | $ | 58 | $ | 14 | ||||||||||
|
Convertible subordinated debt outstanding |
$ | 803 | $ | 803 | $ | 955 | $ | 1,009 | $ | 1,125 | ||||||||||
| Year Ended | Three Months Ended | |||||||||||||||||||
| (In millions) |
December
31,
2009 |
December 31,
2009 |
September 30,
2009 |
June 30,
2009 |
||||||||||||||||
|
Preferred equity |
||||||||||||||||||||
|
Convertible subordinated debt converted to preferred stock |
$ | 63 | $ | 35 | $ | 28 | $ | – | ||||||||||||
|
Beneficial conversion feature reclassified from common to preferred stock |
|
11 |
|
|
6 |
|
|
5 |
|
|
– |
|
||||||||
|
Change in preferred equity |
74 | 41 | 33 | – | ||||||||||||||||
|
Common equity |
||||||||||||||||||||
|
Gain on subordinated debt modification, net of tax |
314 | 9 | 305 | |||||||||||||||||
|
Accelerated convertible subordinated debt amortization, net of tax |
(22 | ) | (12 | ) | (10 | ) | – | |||||||||||||
|
Beneficial conversion feature added to common stock |
203 | 2 | 201 | |||||||||||||||||
|
Beneficial conversion feature reclassified from common to preferred stock |
|
(11 |
) |
|
(6 |
) |
|
(5 |
) |
|
– |
|
||||||||
|
Change in common equity |
484 | (7 | ) | (15 | ) | 506 | ||||||||||||||
|
Net impact on Tier 1 capital |
$ | 558 | $ | 34 | $ | 18 | $ | 506 | ||||||||||||
|
Convertible subordinated debt outstanding |
$ | 1,146 | $ | 1,146 | $ | 1,142 | $ | 1,170 | ||||||||||||
The Company’s various issuances of new common stock and warrants to purchase common stock added $838 million of common equity in 2010, which far more than offset the $205 million decrease in common equity resulting from subordinated debt conversions.
On February 15, 2011, the Company filed a Form 8-K disclosing that holders of subordinated notes elected to convert a combined $85.8 million principal amount of these notes into the Company’s preferred stock. The Company expects that an additional 85,829 shares of Series C and 20 shares of Series A preferred stock will be
86
Table of Contents
issued on March 15, 2011 unless the elections are revoked prior to that date. Also $14.6 million of the original beneficial conversion feature will be reclassified into preferred stock from common stock as a result of this conversion. The expected accelerated discount amortization attributable to the conversions was approximately $41.0 million in the first quarter of 2011 and $73.3 million in the fourth quarter of 2010.
The Company paid $6.7 million in dividends on common stock in 2010. The Board of Directors declared a dividend of $0.01 per common share payable on February 28, 2011 to shareholders of record on February 22, 2011. This is unchanged from the rate paid since the third quarter of 2009. Under the terms of the CPP, the Company may not increase the dividend on its common stock above $0.32 per share per quarter during the period the senior preferred shares are outstanding without adversely impacting the Company’s interest in the program or without permission from the U.S. Department of the Treasury.
The Company recorded preferred stock dividends of $122.9 million and $103.0 million during 2010 and 2009, respectively. Preferred dividends for 2010 and 2009 include $90.2 million and $88.6 million, respectively, related to the TARP preferred stock issued to the U.S. Department of the Treasury, consisting of cash payments of $70.0 million in both 2010 and 2009 and accretion of $20.2 million and $18.6 million in 2010 and 2009, respectively, for the difference between the fair value and par amount of the TARP preferred stock when issued.
Banking organizations are required under published regulations to maintain adequate levels of capital as measured by several regulatory capital ratios. The Company’s capital ratios were as follows:
Schedule 33
CAPITAL RATIOS
| December 31, | ||||||||||||
| 2010 | 2009 | 2008 | ||||||||||
|
Tangible common equity ratio |
6.99 | % | 6.12 | % | 5.89 | % | ||||||
|
Tangible equity ratio |
11.10 | 9.16 | 8.91 | |||||||||
|
Average equity to average assets |
11.99 | 10.98 | 10.36 | |||||||||
|
Risk-based capital ratios: |
||||||||||||
|
Tier 1 common to risk-weighted assets |
8.95 | 6.73 | 6.28 | |||||||||
|
Tier 1 leverage |
12.56 | 10.38 | 9.99 | |||||||||
|
Tier 1 risk-based capital |
14.78 | 10.53 | 10.22 | |||||||||
|
Total risk-based capital |
17.15 | 13.28 | 14.32 | |||||||||
The Company expects that it (and the banking industry as a whole) will be required by market forces and/or regulation, including new standards promulgated in December 2010 by the Basel Committee on Banking Supervision, to operate with higher capital ratios than in the recent past. In addition, the CPP capital preferred dividend is scheduled to increase from 5% to 9% in 2013, making it more expensive as a source of capital if not redeemed at or prior to that time. Thus, in addition to maintaining higher levels of capital, the Company’s capital structure may continue to be subject to greater variation over the next few years than has been true historically, due to the still highly uncertain economic and regulatory environments. Therefore, in 2011, continuing to preserve and augment capital in response to these uncertainties and in preparation for the eventual repayment of TARP CPP preferred stock are likely to take precedence over making capital investments to expand the business, or returning capital to shareholders in the form of higher dividends or share repurchases.
At December 31, 2010, regulatory Tier 1 risk-based capital and total risk-based capital were $6,350 million and $7,364 million compared to $5,407 million and $6,823 million at December 31, 2009.
87
Table of Contents
GAAP to NON-GAAP RECONCILIATION
1. Tier 1 common equity
Traditionally, the Federal Reserve and other banking regulators have assessed a bank’s capital adequacy based on Tier 1 capital, the calculation of which is codified in federal banking regulations. Regulators have begun supplementing their assessment of the capital adequacy of a bank based on a variation of Tier 1 capital, known as Tier 1 common equity. The Tier 1 common equity ratio is the core capital component of the Basel III standards, and we believe that it increasingly is becoming a key ratio considered by both regulators and investors. Because Tier 1 common equity is not formally defined by GAAP or codified in the federal banking regulations, this measure is considered to be a non-GAAP financial measure and other entities may calculate them differently than Zions’ disclosed calculations. Since investors and banking regulators may assess Zions’ capital adequacy using Tier 1 common equity, Zions believes that it is useful to provide investors the ability to assess Zions’ capital adequacy on this same basis.
Tier 1 common equity is often expressed as a percentage of risk-weighted assets. Under the risk-based capital framework, a bank’s balance sheet assets and credit equivalent amounts of off-balance sheet items are assigned to one of four broad “Basel I” risk categories for banks, like our banking subsidiaries, that have not adopted the Basel II “Advanced Measurement Approach.” The aggregated dollar amount in each category is then multiplied by the risk weighting assigned to that category. The resulting weighted values from each of the four categories are added together and this sum is the risk-weighted assets total that, as adjusted, comprises the denominator of certain risk-based capital ratios. Tier 1 capital is then divided by this denominator (risk-weighted assets) to determine the Tier 1 capital ratio. Adjustments are made to Tier 1 capital to arrive at Tier 1 common equity. Tier 1 common equity is also divided by the risk-weighted assets to determine the Tier 1 common equity ratio. The amounts disclosed as risk-weighted assets are calculated consistent with banking regulatory requirements.
The Schedule below provides a reconciliation of controlling interest shareholders’ equity (GAAP) to Tier 1 capital (regulatory) and to Tier 1 common equity (non-GAAP) using current U.S. regulatory treatment, not proposed Basel III calculations.
Schedule 34
TIER 1 COMMON EQUITY (NON-GAAP)
| December 31, | ||||||||||||
| (Amounts in millions) | 2010 | 2009 | 2008 | |||||||||
|
Controlling interest shareholders’ equity (GAAP) |
$ | 6,648 | $ | 5,693 | $ | 6,501 | ||||||
|
Accumulated other comprehensive (income) loss |
461 | 437 | 99 | |||||||||
|
Non-qualifying goodwill and intangibles |
(1,103 | ) | (1,129 | ) | (1,777 | ) | ||||||
|
Disallowed deferred tax assets |
(106 | ) | (43 | ) | – | |||||||
|
Other regulatory adjustments |
2 | 1 | (2 | ) | ||||||||
|
Qualifying trust preferred securities |
448 | 448 | 448 | |||||||||
|
Tier 1 capital (regulatory) |
6,350 | 5,407 | 5,269 | |||||||||
|
Qualifying trust preferred securities |
(448 | ) | (448 | ) | (448 | ) | ||||||
|
Preferred stock |
(2,057 | ) | (1,503 | ) | (1,582 | ) | ||||||
|
Tier 1 common equity (non-GAAP) |
$ | 3,845 | $ | 3,456 | $ | 3,239 | ||||||
|
Risk-weighted assets (regulatory) |
$ | 42,950 | $ | 51,360 | $ | 51,565 | ||||||
|
Tier 1 common to risk-weighted assets (non-GAAP) |
8.95 | % | 6.73 | % | 6.28 | % | ||||||
88
Table of Contents
2. Core net interest margin and core net interest income
This Annual Report on Form 10-K presents a “core net interest margin” and a “core net interest income” which excludes the effects of the (1) periodic discount amortization on convertible subordinated debt; (2) accelerated discount amortization on convertible subordinated debt which has been converted; and (3) additional accretion of interest income on acquired loans based on increased projected cash flows (hereinafter collectively referred to as the “net interest margin/income adjustments”). The net interest margin/income adjustments are included in financial results presented in accordance with GAAP. Management considers the net interest margin/income adjustments to be relevant to ongoing operating results.
The Company believes the exclusion of these net interest margin/income adjustments to present a core net interest margin/income provides a meaningful base for period-to-period and company-to-company comparisons, which management believes will assist investors in analyzing the operating results of the Company and predicting future performance. As non-GAAP financial measures, core net interest margin/income are used by management and the Board of Directors to assess the performance of the Company’s business for the following purposes:
| • |
evaluation of bank reporting segment performance; and |
| • |
presentations of Company performance to investors. |
The Company believes that presenting the core net interest margin/income will permit investors to assess the performance of the Company on the same basis as that applied by management and the Board of Directors.
Schedules 35 and 36 provide a reconciliation of net interest margin/income (GAAP) to core net interest margin/income (non-GAAP).
Schedule 35
NET INTEREST MARGIN TO CORE NET INTEREST MARGIN
| December 31, | ||||||||||||
| 2010 | 2009 | 2008 | ||||||||||
|
Net interest margin as reported (GAAP) |
3.73 | % | 3.94 | % | 4.18 | % | ||||||
|
Discount amortization on convertible subordinated debt |
0.12 | 0.06 | – | |||||||||
|
Accelerated discount amortization on convertible subordinated debt |
0.37 | 0.07 | – | |||||||||
|
Additional accretion of interest income on acquired loans |
-0.10 | – | – | |||||||||
|
Core net interest margin (non-GAAP) |
4.12 | % | 4.07 | % | 4.18 | % | ||||||
Schedule 36
NET INTEREST INCOME TO CORE NET INTEREST INCOME
| December 31, | ||||||||||||
| (In millions) | 2010 | 2009 | 2008 | |||||||||
|
Net interest income (GAAP) |
$ | 1,727.4 | $ | 1,897.6 | $ | 1,971.6 | ||||||
|
Discount amortization on convertible subordinated debt |
58.0 | 26.9 | – | |||||||||
|
Accelerated discount amortization on convertible subordinated debt |
172.4 | 35.7 | – | |||||||||
|
Additional accretion of interest income on acquired loans |
(46.8 | ) | – | – | ||||||||
|
Core net interest income (non-GAAP) |
$ | 1,911.0 | $ | 1,960.2 | $ | 1,971.6 | ||||||
89
Table of Contents
3. Income (loss) before income taxes and subordinated debt modification and conversions
This Annual Report on Form 10-K also presents “Income (loss) before income taxes and subordinated debt modification and conversions” which excludes the effects of the (1) discount amortization on convertible subordinated debt, (2) accelerated discount amortization on convertible subordinated debt, and (3) gain on subordinated debt modification. The adjustments are included in financial results presented in accordance with GAAP. Management considers the income (loss) adjustments to be relevant to ongoing operating results.
The Company believes the exclusion of these adjustments to present income (loss) before income taxes and subordinated debt modification and conversions provides a meaningful base for period-to-period and company-to-company comparisons, which management believes will assist investors in analyzing the operating results of the Company and predicting future performance. As a non-GAAP financial measure, income (loss) before income taxes and subordinated debt modification and conversions is used by management and the Board of Directors to assess the performance of the Company’s business for the following purposes:
| • |
evaluation of bank reporting segment performance; and |
| • |
presentations of Company performance to investors. |
The Company believes that presenting the income (loss) before income taxes and subordinated debt modification and conversions will permit investors to assess the performance of the Company on the same basis as that applied by management and the Board of Directors. Schedule 2 on page 34 provides a reconciliation of income (loss) before income taxes (GAAP) to Income (loss) before income taxes and subordinated debt modification and conversions (non-GAAP).
Non-GAAP financial measures have inherent limitations, are not required to be uniformly applied, and are not audited. Although these non-GAAP financial measures are frequently used by stakeholders in the evaluation of a company, they have limitations as an analytical tool, and should not be considered in isolation or as a substitute for analyses of results as reported under GAAP.
| ITEM 7A. | QUANTITATIVE AND QUALITATIVE DISCLOSURES ABOUT MARKET RISK |
Information required by this Item is included in “Interest Rate and Market Risk Management” in MD&A beginning on page 74 and is hereby incorporated by reference.
90
Table of Contents
| ITEM 8. | FINANCIAL STATEMENTS AND SUPPLEMENTARY DATA |
REPORT ON MANAGEMENT’S ASSESSMENT OF INTERNAL CONTROL OVER FINANCIAL REPORTING
The management of Zions Bancorporation and subsidiaries (“the Company”) is responsible for establishing and maintaining adequate internal control over financial reporting for the Company as defined by Exchange Act Rules 13a-15 and 15d-15.
The Company’s management has used the criteria established in Internal Control – Integrated Framework issued by the Committee of Sponsoring Organizations of the Treadway Commission (“COSO”) to evaluate the effectiveness of the Company’s internal control over financial reporting.
The Company’s management has assessed the effectiveness of the Company’s internal control over financial reporting as of December 31, 2010 and has concluded that such internal control over financial reporting is effective. There are no material weaknesses in the Company’s internal control over financial reporting that have been identified by the Company’s management.
Ernst & Young LLP, an independent registered public accounting firm, has audited the consolidated financial statements of the Company for the year ended December 31, 2010, and has also issued an attestation report, which is included herein, on internal control over financial reporting under Auditing Standard No. 5 of the Public Company Accounting Oversight Board (“PCAOB”).
91
Table of Contents
REPORTS OF INDEPENDENT REGISTERED PUBLIC ACCOUNTING FIRM
REPORT ON INTERNAL CONTROL OVER FINANCIAL REPORTING
Audit Committee of the Board of Directors and Shareholders of Zions Bancorporation and Subsidiaries
We have audited Zions Bancorporation and subsidiaries’ internal control over financial reporting as of December 31, 2010, based on criteria established in Internal Control – Integrated Framework issued by the Committee of Sponsoring Organizations of the Treadway Commission (the COSO criteria). Zions Bancorporation and subsidiaries’ management is responsible for maintaining effective internal control over financial reporting, and for its assessment of the effectiveness of internal control over financial reporting included in the accompanying Report on Management’s Assessment of Internal Control over Financial Reporting. Our responsibility is to express an opinion on the company’s internal control over financial reporting based on our audit.
We conducted our audit in accordance with the standards of the Public Company Accounting Oversight Board (United States). Those standards require that we plan and perform the audit to obtain reasonable assurance about whether effective internal control over financial reporting was maintained in all material respects. Our audit included obtaining an understanding of internal control over financial reporting, assessing the risk that a material weakness exists, testing and evaluating the design and operating effectiveness of internal control based on the assessed risk, and performing such other procedures as we considered necessary in the circumstances. We believe that our audit provides a reasonable basis for our opinion.
A company’s internal control over financial reporting is a process designed to provide reasonable assurance regarding the reliability of financial reporting and the preparation of financial statements for external purposes in accordance with generally accepted accounting principles. A company’s internal control over financial reporting includes those policies and procedures that (1) pertain to the maintenance of records that, in reasonable detail, accurately and fairly reflect the transactions and dispositions of the assets of the company; (2) provide reasonable assurance that transactions are recorded as necessary to permit preparation of financial statements in accordance with generally accepted accounting principles, and that receipts and expenditures of the company are being made only in accordance with authorizations of management and directors of the company; and (3) provide reasonable assurance regarding prevention or timely detection of unauthorized acquisition, use or disposition of the company’s assets that could have a material effect on the financial statements.
Because of its inherent limitations, internal control over financial reporting may not prevent or detect misstatements. Also, projections of any evaluation of effectiveness to future periods are subject to the risk that controls may become inadequate because of changes in conditions, or that the degree of compliance with the policies or procedures may deteriorate.
In our opinion, Zions Bancorporation and subsidiaries maintained, in all material respects, effective internal control over financial reporting as of December 31, 2010, based on the COSO criteria.
We also have audited, in accordance with the standards of the Public Company Accounting Oversight Board (United States), the consolidated balance sheets of Zions Bancorporation and subsidiaries as of December 31, 2010 and 2009 and the related consolidated statements of income, changes in shareholders’ equity and comprehensive income, and cash flows for each of the three years in the period ended December 31, 2010 of Zions Bancorporation and subsidiaries and our report dated March 1, 2011 expressed an unqualified opinion thereon.
/s/ E RNST & Y OUNG LLP
Salt Lake City, Utah
March 1, 2011
92
Table of Contents
REPORT ON CONSOLIDATED FINANCIAL STATEMENTS
Audit Committee of the Board of Directors and Shareholders of Zions Bancorporation and Subsidiaries
We have audited the accompanying consolidated balance sheets of Zions Bancorporation and subsidiaries as of December 31, 2010 and 2009, and the related consolidated statements of income, changes in shareholders’ equity and comprehensive income, and cash flows for each of the three years in the period ended December 31, 2010. These financial statements are the responsibility of the Company’s management. Our responsibility is to express an opinion on these financial statements based on our audits.
We conducted our audits in accordance with the standards of the Public Company Accounting Oversight Board (United States). Those standards require that we plan and perform the audit to obtain reasonable assurance about whether the financial statements are free of material misstatement. An audit includes examining, on a test basis, evidence supporting the amounts and disclosures in the financial statements. An audit also includes assessing the accounting principles used and significant estimates made by management, as well as evaluating the overall financial statement presentation. We believe that our audits provide a reasonable basis for our opinion.
In our opinion, the financial statements referred to above present fairly, in all material respects, the consolidated financial position of Zions Bancorporation and subsidiaries at December 31, 2010 and 2009, and the consolidated results of their operations and their cash flows for each of the three years in the period ended December 31, 2010, in conformity with U.S. generally accepted accounting principles.
During 2009, the Company changed its method of accounting for impairment losses on investment securities (see Note 5 to the financial statements).
We also have audited, in accordance with the standards of the Public Company Accounting Oversight Board (United States), Zions Bancorporation and subsidiaries’ internal control over financial reporting as of December 31, 2010, based on criteria established in Internal Control-Integrated Framework issued by the Committee of Sponsoring Organizations of the Treadway Commission and our report dated March 1, 2011 expressed an unqualified opinion thereon.
/s/ E RNST & Y OUNG LLP
Salt Lake City, Utah
March 1, 2011
93
Table of Contents
CONSOLIDATED BALANCE SHEETS
ZIONS BANCORPORATION AND SUBSIDIARIES
| December 31, | ||||||||
| (In thousands, except share amounts) | 2010 | 2009 | ||||||
|
ASSETS |
||||||||
|
Cash and due from banks |
$ | 924,126 | $ | 1,370,189 | ||||
|
Money market investments: |
||||||||
|
Interest-bearing deposits |
4,576,008 | 652,964 | ||||||
|
Federal funds sold and security resell agreements |
130,305 | 78,541 | ||||||
|
Investment securities: |
||||||||
|
Held-to-maturity, at adjusted cost (approximate fair value $788,354 and $833,455) |
840,642 | 869,595 | ||||||
|
Available-for-sale, at fair value |
4,205,742 | 3,655,619 | ||||||
|
Trading account, at fair value |
48,667 | 23,543 | ||||||
| 5,095,051 | 4,548,757 | |||||||
|
Loans held for sale |
206,286 | 208,567 | ||||||
|
Loans: |
||||||||
|
Loans and leases excluding FDIC-supported loans |
35,896,395 | 38,882,083 | ||||||
|
FDIC-supported loans |
971,377 | 1,444,594 | ||||||
| 36,867,772 | 40,326,677 | |||||||
|
Less: |
||||||||
|
Unearned income and fees, net of related costs |
120,341 | 137,697 | ||||||
|
Allowance for loan losses |
1,440,341 | 1,531,332 | ||||||
|
Loans and leases, net of allowance |
35,307,090 | 38,657,648 | ||||||
|
Other noninterest-bearing investments |
858,367 | 1,099,961 | ||||||
|
Premises and equipment, net |
720,985 | 710,534 | ||||||
|
Goodwill |
1,015,161 | 1,015,161 | ||||||
|
Core deposit and other intangibles |
87,898 | 113,416 | ||||||
|
Other real estate owned |
299,577 | 389,782 | ||||||
|
Other assets |
1,814,032 | 2,277,487 | ||||||
| $ | 51,034,886 | $ | 51,123,007 | |||||
|
LIABILITIES AND SHAREHOLDERS’ EQUITY |
||||||||
|
Deposits: |
||||||||
|
Noninterest-bearing demand |
$ | 13,653,929 | $ | 12,324,247 | ||||
|
Interest-bearing: |
||||||||
|
Savings and NOW |
6,362,138 | 5,843,573 | ||||||
|
Money market |
15,090,833 | 16,378,874 | ||||||
|
Time under $100,000 |
1,941,211 | 2,497,395 | ||||||
|
Time $100,000 and over |
2,232,238 | 3,117,472 | ||||||
|
Foreign |
1,654,651 | 1,679,028 | ||||||
| 40,935,000 | 41,840,589 | |||||||
|
Securities sold, not yet purchased |
42,548 | 43,404 | ||||||
|
Federal funds purchased and security repurchase agreements |
722,258 | 786,015 | ||||||
|
Other short-term borrowings |
166,394 | 121,273 | ||||||
|
Long-term debt |
1,942,622 | 2,032,942 | ||||||
|
Reserve for unfunded lending commitments |
111,708 | 116,445 | ||||||
|
Other liabilities |
467,142 | 472,082 | ||||||
|
Total liabilities |
44,387,672 | 45,412,750 | ||||||
|
Shareholders’ equity: |
||||||||
|
Preferred stock, without par value, authorized 4,400,000 shares |
2,056,672 | 1,502,784 | ||||||
|
Common stock, without par value; authorized 350,000,000 shares; issued and
|
4,163,619 | 3,318,417 | ||||||
|
Retained earnings |
889,284 | 1,308,356 | ||||||
|
Accumulated other comprehensive income (loss) |
(461,296 | ) | (436,899 | ) | ||||
|
Controlling interest shareholders’ equity |
6,648,279 | 5,692,658 | ||||||
|
Noncontrolling interests |
(1,065 | ) | 17,599 | |||||
|
Total shareholders’ equity |
6,647,214 | 5,710,257 | ||||||
| $ | 51,034,886 | $ | 51,123,007 | |||||
See accompanying notes to consolidated financial statements.
94
Table of Contents
ZIONS BANCORPORATION AND SUBSIDIARIES
| Year Ended December 31, | ||||||||||||
| (In thousands, except per share amounts) | 2010 | 2009 | 2008 | |||||||||
|
Interest income: |
||||||||||||
|
Interest and fees on loans |
$ | 2,185,239 | $ | 2,350,050 | $ | 2,678,285 | ||||||
|
Interest on money market investments |
10,946 | 7,914 | 47,780 | |||||||||
|
Interest on securities: |
||||||||||||
|
Held-to-maturity |
33,405 | 54,327 | 87,650 | |||||||||
|
Available-for-sale |
88,035 | 100,307 | 158,309 | |||||||||
|
Trading account |
2,220 | 2,728 | 1,875 | |||||||||
|
Total interest income |
2,319,845 | 2,515,326 | 2,973,899 | |||||||||
|
Interest expense: |
||||||||||||
|
Interest on deposits |
196,112 | 424,684 | 712,893 | |||||||||
|
Interest on short-term borrowings |
12,561 | 14,720 | 178,875 | |||||||||
|
Interest on long-term debt |
383,783 | 178,390 | 110,485 | |||||||||
|
Total interest expense |
592,456 | 617,794 | 1,002,253 | |||||||||
|
Net interest income |
1,727,389 | 1,897,532 | 1,971,646 | |||||||||
|
Provision for loan losses |
852,138 | 2,016,927 | 648,269 | |||||||||
|
Net interest income after provision for loan losses |
875,251 | (119,395 | ) | 1,323,377 | ||||||||
|
Noninterest income: |
||||||||||||
|
Service charges and fees on deposit accounts |
199,748 | 212,562 | 206,988 | |||||||||
|
Other service charges, commissions and fees |
165,341 | 156,539 | 167,669 | |||||||||
|
Trust and wealth management income |
27,452 | 29,949 | 37,752 | |||||||||
|
Capital markets and foreign exchange |
37,636 | 50,313 | 49,898 | |||||||||
|
Dividends and other investment income |
33,074 | 26,631 | 46,362 | |||||||||
|
Loan sales and servicing income |
29,382 | 22,261 | 24,379 | |||||||||
|
Fair value and nonhedge derivative income (loss) |
(15,827 | ) | 113,779 | (47,976 | ) | |||||||
|
Equity securities gains (losses), net |
(5,993 | ) | (1,825 | ) | 793 | |||||||
|
Fixed income securities gains (losses), net |
11,055 | (3,846 | ) | 849 | ||||||||
|
Impairment losses on investment securities: |
||||||||||||
|
Impairment losses on investment securities |
(156,452 | ) | (569,866 | ) | (304,040 | ) | ||||||
|
Noncredit-related losses on securities not expected to be sold (recognized in other comprehensive income) |
71,097 | 289,403 | – | |||||||||
|
Net impairment losses on investment securities |
(85,355 | ) | (280,463 | ) | (304,040 | ) | ||||||
|
Valuation losses on securities purchased |
– | (212,092 | ) | (13,072 | ) | |||||||
|
Gain on subordinated debt modification |
– | 508,945 | – | |||||||||
|
Gain on subordinated debt exchange |
14,471 | – | – | |||||||||
|
Acquisition related gains |
– | 169,186 | – | |||||||||
|
Other |
29,478 | 12,162 | 21,090 | |||||||||
|
Total noninterest income |
440,462 | 804,101 | 190,692 | |||||||||
|
Noninterest expense: |
||||||||||||
|
Salaries and employee benefits |
825,344 | 818,837 | 810,501 | |||||||||
|
Occupancy, net |
113,559 | 112,201 | 114,175 | |||||||||
|
Furniture and equipment |
101,061 | 99,878 | 100,136 | |||||||||
|
Other real estate expense |
144,815 | 110,800 | 50,378 | |||||||||
|
Credit related expense |
71,205 | 44,979 | 24,092 | |||||||||
|
Provision for unfunded lending commitments |
(4,737 | ) | 65,511 | 1,467 | ||||||||
|
Legal and professional services |
39,540 | 37,197 | 45,517 | |||||||||
|
Advertising |
24,820 | 22,982 | 30,731 | |||||||||
|
FDIC premiums |
101,990 | 100,517 | 19,858 | |||||||||
|
Amortization of core deposit and other intangibles |
25,517 | 31,674 | 33,162 | |||||||||
|
Other |
275,767 | 226,934 | 244,946 | |||||||||
|
Total noninterest expense |
1,718,881 | 1,671,510 | 1,474,963 | |||||||||
|
Impairment loss on goodwill |
– | 636,216 | 353,804 | |||||||||
|
Income (loss) before income taxes |
(403,168 | ) | (1,623,020 | ) | (314,698 | ) | ||||||
|
Income taxes (benefit) |
(106,819 | ) | (401,343 | ) | (43,365 | ) | ||||||
|
Net income (loss) |
(296,349 | ) | (1,221,677 | ) | (271,333 | ) | ||||||
|
Net income (loss) applicable to noncontrolling interests |
(3,621 | ) | (5,566 | ) | (5,064 | ) | ||||||
|
Net income (loss) applicable to controlling interest |
(292,728 | ) | (1,216,111 | ) | (266,269 | ) | ||||||
|
Preferred stock dividends |
(122,884 | ) | (102,969 | ) | (24,424 | ) | ||||||
|
Preferred stock redemption |
3,107 | 84,633 | – | |||||||||
|
Net earnings (loss) applicable to common shareholders |
$ | (412,505 | ) | $ | (1,234,447 | ) | $ | (290,693 | ) | |||
|
Weighted average common shares outstanding during the year: |
||||||||||||
|
Basic shares |
166,054 | 124,443 | 108,908 | |||||||||
|
Diluted shares |
166,054 | 124,443 | 108,908 | |||||||||
|
Net earnings (loss) per common share: |
||||||||||||
|
Basic |
$ | (2.48 | ) | $ | (9.92 | ) | $ | (2.68 | ) | |||
|
Diluted |
(2.48 | ) | (9.92 | ) | (2.68 | ) | ||||||
See accompanying notes to consolidated financial statements.
95
Table of Contents
CONSOLIDATED STATEMENTS OF CHANGES IN SHAREHOLDERS’ EQUITY AND COMPREHENSIVE INCOME
ZIONS BANCORPORATION AND SUBSIDIARIES
|
Preferred
stock |
Common stock |
Retained
earnings |
Accumulated
other comprehensive income (loss) |
Noncontrolling
interests |
Total
shareholders’ equity |
|||||||||||||||||||||||
| (In thousands, except share and per share amounts) | Shares | Amount | ||||||||||||||||||||||||||
|
Balance at December 31, 2007 |
$ | 240,000 | 107,116,505 | $ | 2,212,237 | $ | 2,899,398 | $ | (58,835 | ) | $ | 30,939 | $ | 5,323,739 | ||||||||||||||
|
Cumulative effect of change in accounting principle, adoption of
|
(11,471 | ) | 11,471 | – | ||||||||||||||||||||||||
|
Comprehensive loss: |
||||||||||||||||||||||||||||
|
Net loss |
(266,269 | ) | (5,064 | ) | (271,333 | ) | ||||||||||||||||||||||
|
Other comprehensive income (loss), net of tax: |
||||||||||||||||||||||||||||
|
Net realized and unrealized holding losses on investments and retained interests |
(333,095 | ) | ||||||||||||||||||||||||||
|
Foreign currency translation |
(5 | ) | ||||||||||||||||||||||||||
|
Reclassification for net losses on investments included in earnings |
181,524 | |||||||||||||||||||||||||||
|
Net unrealized gains on derivative instruments |
131,443 | |||||||||||||||||||||||||||
|
Pension and postretirement |
(31,461 | ) | ||||||||||||||||||||||||||
|
Other comprehensive loss |
(51,594 | ) | (51,594 | ) | ||||||||||||||||||||||||
|
Total comprehensive loss |
(322,927 | ) | ||||||||||||||||||||||||||
|
Issuance of preferred stock |
1,339,185 | (580 | ) | 1,338,605 | ||||||||||||||||||||||||
|
Issuance of common stock and warrant |
7,194,079 | 352,653 | 352,653 | |||||||||||||||||||||||||
|
Stock issued under dividend reinvestment plan |
39,857 | 1,261 | 1,261 | |||||||||||||||||||||||||
|
Net activity under employee plans and related tax benefits |
994,372 | 34,345 | 34,345 | |||||||||||||||||||||||||
|
Dividends on preferred stock |
2,649 | (24,424 | ) | (21,775 | ) | |||||||||||||||||||||||
|
Dividends on common stock, $1.61 per share |
(175,165 | ) | (175,165 | ) | ||||||||||||||||||||||||
|
Change in deferred compensation |
(3,165 | ) | (3,165 | ) | ||||||||||||||||||||||||
|
Other changes in noncontrolling interests |
1,445 | 1,445 | ||||||||||||||||||||||||||
|
Balance at December 31, 2008 |
1,581,834 | 115,344,813 | 2,599,916 | 2,418,904 | (98,958 | ) | 27,320 | 6,529,016 | ||||||||||||||||||||
|
Cumulative effect of change in accounting principle, adoption of
|
137,462 | (137,462 | ) | – | ||||||||||||||||||||||||
|
Comprehensive loss: |
||||||||||||||||||||||||||||
|
Net loss |
(1,216,111 | ) | (5,566 | ) | (1,221,677 | ) | ||||||||||||||||||||||
|
Other comprehensive income (loss), net of tax: |
||||||||||||||||||||||||||||
|
Net realized and unrealized holding losses on investments and retained interests |
(65,037 | ) | ||||||||||||||||||||||||||
|
Reclassification for net losses on investments included in earnings |
162,206 | |||||||||||||||||||||||||||
|
Noncredit-related impairment losses on securities not expected to be sold |
(174,244 | ) | ||||||||||||||||||||||||||
|
Accretion of securities with noncredit-related impairment losses not expected to be sold |
996 | |||||||||||||||||||||||||||
|
Net unrealized losses on derivative instruments |
(128,597 | ) | ||||||||||||||||||||||||||
|
Pension and postretirement |
4,197 | |||||||||||||||||||||||||||
|
Other comprehensive loss |
(200,479 | ) | (200,479 | ) | ||||||||||||||||||||||||
|
Total comprehensive loss |
(1,422,156 | ) | ||||||||||||||||||||||||||
|
Preferred stock redemption |
(100,511 | ) | 1,763 | 52,266 | (46,482 | ) | ||||||||||||||||||||||
|
Preferred stock exchanged for common stock |
(71,537 | ) | 2,816,834 | 38,486 | 32,367 | (684 | ) | |||||||||||||||||||||
|
Subordinated debt converted to preferred stock |
74,438 | (10,998 | ) | 63,440 | ||||||||||||||||||||||||
|
Issuance of common stock |
31,741,425 | 464,110 | 464,110 | |||||||||||||||||||||||||
|
Subordinated debt modification |
202,814 | 202,814 | ||||||||||||||||||||||||||
|
Net activity under employee plans and related tax benefits |
521,998 | 22,326 | 22,326 | |||||||||||||||||||||||||
|
Dividends on preferred stock |
18,560 | (102,969 | ) | (84,409 | ) | |||||||||||||||||||||||
|
Dividends on common stock, $0.10 per share |
(11,862 | ) | (11,862 | ) | ||||||||||||||||||||||||
|
Change in deferred compensation |
(1,701 | ) | (1,701 | ) | ||||||||||||||||||||||||
|
Other changes in noncontrolling interests |
(4,155 | ) | (4,155 | ) | ||||||||||||||||||||||||
96
Table of Contents
CONSOLIDATED STATEMENTS OF CHANGES IN SHAREHOLDERS’ EQUITY AND COMPREHENSIVE INCOME— (Continued)
ZIONS BANCORPORATION AND SUBSIDIARIES
|
(In thousands, except share and per share amounts) |
Preferred
stock |
Common stock |
Retained
earnings |
Accumulated
other comprehensive income (loss) |
Noncontrolling
interests |
Total
shareholders’ equity |
||||||||||||||||||||||
| Shares | Amount | |||||||||||||||||||||||||||
|
Balance at December 31, 2009 |
1,502,784 | 150,425,070 | 3,318,417 | 1,308,356 | (436,899 | ) | 17,599 | 5,710,257 | ||||||||||||||||||||
|
Comprehensive loss: |
||||||||||||||||||||||||||||
|
Net loss |
(292,728 | ) | (3,621 | ) | (296,349 | ) | ||||||||||||||||||||||
|
Other comprehensive income (loss), net of tax: |
||||||||||||||||||||||||||||
|
Net realized and unrealized holding gains on investments |
4,248 | |||||||||||||||||||||||||||
|
Reclassification for net losses on investments included in earnings |
45,689 | |||||||||||||||||||||||||||
|
Noncredit-related impairment losses on securities not expected to be sold |
(43,920 | ) | ||||||||||||||||||||||||||
|
Accretion of securities with noncredit-related impairment losses not expected to be sold |
131 | |||||||||||||||||||||||||||
|
Net unrealized losses on derivative instruments |
(37,357 | ) | ||||||||||||||||||||||||||
|
Pension and postretirement |
6,812 | |||||||||||||||||||||||||||
|
Other comprehensive loss |
(24,397 | ) | (24,397 | ) | ||||||||||||||||||||||||
|
Total comprehensive loss |
(320,746 | ) | ||||||||||||||||||||||||||
|
Subordinated debt converted to preferred stock |
399,785 | (56,834 | ) | 342,951 | ||||||||||||||||||||||||
|
Issuance of preferred stock |
142,500 | (3,843 | ) | 138,657 | ||||||||||||||||||||||||
|
Preferred stock exchanged for common stock |
(8,615 | ) | 224,903 | 5,508 | 3,107 | – | ||||||||||||||||||||||
|
Issuance of common stock warrants |
214,563 | 214,563 | ||||||||||||||||||||||||||
|
Subordinated debt exchanged for common stock |
2,165,391 | 46,902 | 46,902 | |||||||||||||||||||||||||
|
Issuance of common stock |
29,553,957 | 623,469 | 623,469 | |||||||||||||||||||||||||
|
Net activity under employee plans and related tax benefits |
414,765 | 15,437 | 15,437 | |||||||||||||||||||||||||
|
Dividends on preferred stock |
20,218 | (122,884 | ) | (102,666 | ) | |||||||||||||||||||||||
|
Dividends on common stock, $0.04 per share |
(6,650 | ) | (6,650 | ) | ||||||||||||||||||||||||
|
Change in deferred compensation |
83 | 83 | ||||||||||||||||||||||||||
|
Other changes in noncontrolling interests |
(15,043 | ) | (15,043 | ) | ||||||||||||||||||||||||
|
Balance at December 31, 2010 |
$ | 2,056,672 | 182,784,086 | $ | 4,163,619 | $ | 889,284 | $ | (461,296 | ) | $ | (1,065 | ) | $ | 6,647,214 | |||||||||||||
See accompanying notes to consolidated financial statements.
97
Table of Contents
ZIONS BANCORPORATION AND SUBSIDIARIES
| Year Ended December 31, | ||||||||||||
| (In thousands) | 2010 | 2009 | 2008 | |||||||||
|
CASH FLOWS FROM OPERATING ACTIVITIES |
||||||||||||
|
Net loss |
$ | (296,349 | ) | $ | (1,221,677 | ) | $ | (271,333 | ) | |||
|
Adjustments to reconcile net loss to net cash provided by operating activities: |
||||||||||||
|
Impairment and valuation losses on investment securities, goodwill, and
|
87,105 | 1,128,771 | 674,050 | |||||||||
|
Gains on subordinated debt modification and exchange |
(14,471 | ) | (508,945 | ) | – | |||||||
|
Gains from acquisitions and divestitures |
(13,703 | ) | (169,186 | ) | – | |||||||
|
Provision for credit losses |
847,401 | 2,082,438 | 649,736 | |||||||||
|
Depreciation and amortization |
372,754 | 213,040 | 140,201 | |||||||||
|
Deferred income tax benefit |
(28,665 | ) | (15,071 | ) | (231,241 | ) | ||||||
|
Net decrease (increase) in trading securities |
(25,124 | ) | 18,521 | (12,114 | ) | |||||||
|
Net increase in loans held for sale |
(32,953 | ) | (396 | ) | (9,291 | ) | ||||||
|
Net write-down of and losses from sales of other real estate owned |
136,232 | 92,920 | 45,858 | |||||||||
|
Change in other liabilities |
241,936 | (423,154 | ) | (132,110 | ) | |||||||
|
Change in other assets |
220,441 | (146,722 | ) | 342,071 | ||||||||
|
Other, net |
(33,610 | ) | 7,925 | (11,285 | ) | |||||||
|
Net cash provided by operating activities |
1,460,994 | 1,058,464 | 1,184,542 | |||||||||
|
CASH FLOWS FROM INVESTING ACTIVITIES |
||||||||||||
|
Net decrease (increase) in short term investments |
(3,974,808 | ) | 1,975,107 | (1,202,709 | ) | |||||||
|
Proceeds from maturities and paydowns of investment securities held-to-maturity |
154,906 | 166,808 | 98,924 | |||||||||
|
Purchases of investment securities held-to-maturity |
(86,568 | ) | (76,322 | ) | (128,570 | ) | ||||||
|
Proceeds from sales, maturities, and paydowns of investment securities available-for-sale |
1,084,074 | 1,261,655 | 3,881,596 | |||||||||
|
Purchases of investment securities available-for-sale |
(1,717,518 | ) | (1,852,711 | ) | (3,009,274 | ) | ||||||
|
Proceeds from sales of loans and leases |
154,428 | 104,304 | 294,480 | |||||||||
|
Securitized loans purchased |
– | – | (1,186,188 | ) | ||||||||
|
Net loan and lease collections (originations) |
1,753,525 | 1,412,754 | (2,482,320 | ) | ||||||||
|
Proceeds from surrender of bank-owned life insurance contracts |
210,726 | – | – | |||||||||
|
Net decrease (increase) in other noninterest-bearing investments |
29,493 | (19,580 | ) | (8,349 | ) | |||||||
|
Net purchases of premises and equipment |
(79,071 | ) | (97,135 | ) | (102,016 | ) | ||||||
|
Proceeds from sales of other real estate owned |
523,967 | 315,229 | 72,629 | |||||||||
|
Net cash from acquisitions and divestitures |
21,149 | 452,192 | 688,940 | |||||||||
|
Net cash provided by (used in) investing activities |
(1,925,697 | ) | 3,642,301 | (3,082,857 | ) | |||||||
|
CASH FLOWS FROM FINANCING ACTIVITIES |
||||||||||||
|
Net increase (decrease) in deposits |
(903,224 | ) | (2,154,495 | ) | 3,661,680 | |||||||
|
Net change in short-term funds borrowed |
(19,541 | ) | (3,007,062 | ) | (3,509,300 | ) | ||||||
|
Repayments of debt over 90 days and up to one year |
– | (236,811 | ) | – | ||||||||
|
Proceeds from issuance of long-term debt |
150,413 | 704,022 | 31,995 | |||||||||
|
Repayments of long-term debt |
(73,558 | ) | (408,531 | ) | (159,970 | ) | ||||||
|
Cash paid for preferred stock redemption |
– | (47,166 | ) | – | ||||||||
|
Proceeds from the issuance of preferred stock, common stock, and common stock warrants |
977,145 | 464,110 | 1,692,907 | |||||||||
|
Dividends paid on common and preferred stock |
(109,316 | ) | (96,271 | ) | (195,679 | ) | ||||||
|
Other, net |
(3,279 | ) | (24,348 | ) | (2,497 | ) | ||||||
|
Net cash provided by (used in) financing activities |
18,640 | (4,806,552 | ) | 1,519,136 | ||||||||
|
Net decrease in cash and due from banks |
(446,063 | ) | (105,787 | ) | (379,179 | ) | ||||||
|
Cash and due from banks at beginning of year |
1,370,189 | 1,475,976 | 1,855,155 | |||||||||
|
Cash and due from banks at end of year |
$ | 924,126 | $ | 1,370,189 | $ | 1,475,976 | ||||||
|
Cash paid for interest |
$ | 358,156 | $ | 577,799 | $ | 1,011,719 | ||||||
|
Net cash paid (refund received) for income taxes |
(324,804 | ) | (131,187 | ) | 303,180 | |||||||
See accompanying notes to consolidated financial statements.
98
Table of Contents
NOTES TO CONSOLIDATED FINANCIAL STATEMENTS
ZIONS BANCORPORATION AND SUBSIDIARIES
1. SUMMARY OF SIGNIFICANT ACCOUNTING POLICIES
Business
Zions Bancorporation (“the Parent”) is a financial holding company headquartered in Salt Lake City, Utah, which provides a full range of banking and related services through its banking subsidiaries in ten Western and Southwestern states as follows: Zions First National Bank (“Zions Bank”), in Utah and Idaho; California Bank & Trust (“CB&T”); Amegy Corporation (“Amegy”) and its subsidiary, Amegy Bank, in Texas; National Bank of Arizona (“NBA”); Nevada State Bank (“NSB”); Vectra Bank Colorado (“Vectra”), in Colorado and New Mexico; The Commerce Bank of Washington (“TCBW”); and The Commerce Bank of Oregon (“TCBO”). The Parent also owns and operates certain nonbank subsidiaries that engage in financial related services. One of these subsidiaries, Welman Holdings, Inc. (“Welman”), provides wealth management services.
Basis of Financial Statement Presentation
The consolidated financial statements include the accounts of the Parent and its majority-owned subsidiaries (“the Company,” “we,” “our,” “us”). Unconsolidated investments in which there is a greater than 20% ownership are accounted for by the equity method of accounting; those in which there is less than 20% ownership are accounted for under cost, fair value, or equity methods of accounting. All significant intercompany accounts and transactions have been eliminated in consolidation. Certain amounts in prior years have been reclassified to conform to the current year presentation.
The consolidated financial statements have been prepared in conformity with accounting principles generally accepted in the United States and prevailing practices within the financial services industry. This includes the guidance under Accounting Standards Codification (“ASC”) 810, Consolidation , which requires consolidation of a variable interest entity (“VIE”) when a company is the primary beneficiary of the VIE. Effective January 1, 2010, we adopted Accounting Standards Update (“ASU”) No. 2009-17, Amendments to FASB Interpretation No. 46(R) , (formerly Statement of Financial Accounting Standards (“SFAS”) No. 167). This new accounting guidance under ASC 810 requires that a continuous analysis be performed on a qualitative rather than a quantitative basis to determine the primary beneficiary of a VIE. The new rules amend previous guidance to determine whether an entity is a VIE. Upon adoption, we reconsidered our consolidation conclusions for all entities with which we are involved and concluded that there was not a significant impact on the Company’s financial statements.
In preparing the consolidated financial statements, we are required to make estimates and assumptions that affect the amounts reported in the financial statements and accompanying notes. Actual results could differ from those estimates.
Statement of Cash Flows
For purposes of presentation in the consolidated statements of cash flows, “cash and cash equivalents” are defined as those amounts included in cash and due from banks in the consolidated balance sheets.
Security Resell Agreements
Security resell agreements represent overnight and term agreements with the majority maturing within 30 days. These agreements are generally treated as collateralized financing transactions and are carried at amounts at which the securities were acquired plus accrued interest. Either the Company or, in some instances, third parties on its behalf take possession of the underlying securities. The fair value of such securities is monitored throughout the contract term to ensure that asset values remain sufficient to protect against counterparty default.
99
Table of Contents
We are permitted by contract to sell or repledge certain securities that we accept as collateral for security resell agreements. If sold, our obligation to return the collateral is recorded as a liability and included in the balance sheet as securities sold, not yet purchased. At December 31, 2010, we held approximately $55 million of securities for which we were permitted by contract to sell or repledge. The majority of these securities have been either pledged or otherwise transferred to others in connection with our financing activities, or to satisfy our commitments under short sales. Security resell agreements averaged approximately $166 million during 2010, and the maximum amount outstanding at any month-end during 2010 was $318 million.
Investment Securities
We classify our investment securities according to their purpose and holding period. Gains or losses on the sale of securities are recognized using the specific identification method and recorded in noninterest income.
Held-to-maturity (“HTM”) debt securities are stated at adjusted cost, net of unamortized premiums and unaccreted discounts. The Company has the intent and ability to hold such securities until recovery of their amortized cost basis.
Available-for-sale (“AFS”) securities are stated at fair value and generally consist of debt securities held for investment and marketable equity securities not accounted for under the equity method. Unrealized gains and losses of AFS securities, after applicable taxes, are recorded as a component of other comprehensive income (“OCI”).
We review quarterly our investment securities portfolio for any declines in value that are considered to be other-than-temporary impairment (“OTTI”). The process, methodology and factors considered to evaluate securities for OTTI is discussed further in Note 5. Credit-related OTTI is recognized in earnings while noncredit-related OTTI on securities not expected to be sold is recognized in OCI. OTTI is recognized as a realized loss through earnings when there has been an adverse change in the holder’s best estimate of cash flows expected to be collected such that the entire amortized cost basis will not be received.
Trading securities are stated at fair value and consist of securities acquired for short-term appreciation or other trading purposes. Realized and unrealized gains and losses are recorded in trading income, which is included in capital markets and foreign exchange.
The fair values of investment securities are estimated according to ASC 820, Fair Value Measurements and Disclosures , as discussed in Notes 8 and 21.
Loans and Allowance for Credit Losses
Loans are reported at the principal amount outstanding, net of unearned income. Unearned income, which includes deferred fees net of deferred direct loan origination costs, is amortized to interest income over the life of the loan using the interest method. Interest income is recognized on an accrual basis.
Loans held for sale are carried at the lower of aggregate cost or fair value. Gains and losses are recorded in noninterest income based on the difference between sales proceeds and carrying value.
Loans that become other than current with respect to contractual payments due may be accounted for separately depending on the status of the loan, which is determined from certain credit quality indicators applied under the circumstances. The loan status includes past due, nonaccrual, impaired, modified, and restructured (including troubled debt restructurings). Our accounting policies for these loan types are discussed further in Note 6.
100
Table of Contents
Certain purchased loans require separate accounting procedures that are also discussed in Note 6.
The allowance for credit losses includes the allowance for loan losses and the reserve for unfunded lending commitments, and represents our estimate of losses inherent in the loan portfolio that may be recognized from loans and lending commitments that are not recoverable. Further discussion of our estimation process for the allowance for credit losses is included in Note 6.
Other Real Estate Owned
Other real estate owned consists principally of commercial and residential real estate obtained in partial or total satisfaction of loan obligations. Amounts are recorded at the lower of cost or fair value (less any selling costs) based on property appraisals at the time of transfer and periodically thereafter.
Nonmarketable Securities
Nonmarketable securities are included in other noninterest-bearing investments on the balance sheet. These securities include certain venture capital securities and securities acquired for various debt and regulatory requirements. Nonmarketable venture capital securities are reported at estimated fair values, in the absence of readily ascertainable fair values. Changes in fair value and gains and losses from sales are recognized in noninterest income. The values assigned to the securities where no market quotations exist are based upon available information and may not necessarily represent amounts that will ultimately be realized. Such estimated amounts depend on future circumstances and will not be realized until the individual securities are liquidated. The valuation procedures applied include consideration of economic and market conditions, current and projected financial performance of the investee company, and the investee company’s management team. We believe that the cost of an investment is initially the best indication of estimated fair value unless there have been material subsequent positive or negative developments that justify an adjustment in the fair value estimate. Other nonmarketable securities acquired for various debt and regulatory requirements are accounted for at cost.
Premises and Equipment
Premises and equipment are stated at cost, net of accumulated depreciation and amortization. Depreciation, computed primarily on the straight-line method, is charged to operations over the estimated useful lives of the properties, generally from 25 to 40 years for buildings and from 3 to 10 years for furniture and equipment. Leasehold improvements are amortized over the terms of the respective leases or the estimated useful lives of the improvements, whichever is shorter.
Business Combinations
Business combinations are accounted for under the purchase method of accounting in accordance with ASC 805, Business Combinations , which was modified effective January 1, 2009. Upon initially obtaining control, we recognize 100% of all acquired assets and all assumed liabilities regardless of the percentage owned. The assets and liabilities are recorded at their estimated fair values, with goodwill being recorded when such fair values are less than the cost of acquisition. Certain transaction and restructuring costs are expensed as incurred. Changes to our tax valuation allowances and uncertainty accruals from a business combination must be recognized as an adjustment to current income tax expense and not to goodwill over the subsequent annual period. Results of operations of the acquired business are included in our statement of income from the date of acquisition.
Goodwill and Identifiable Intangible Assets
Goodwill and intangible assets deemed to have indefinite lives are not amortized. As required under ASC 350, Intangibles – Goodwill and Other , we subject these assets to annual specified impairment tests as of the
101
Table of Contents
beginning of the fourth quarter and more frequently if changing conditions warrant. Core deposit assets and other intangibles with finite useful lives are generally amortized on an accelerated basis using an estimated useful life of up to 12 years.
Derivative Instruments
We use derivative instruments including interest rate swaps and floors and basis swaps as part of our overall asset and liability duration and interest rate risk management strategy. These instruments enable us to manage to desired asset and liability duration and to reduce interest rate exposure by matching estimated repricing periods of interest-sensitive assets and liabilities. We also execute derivative instruments with commercial banking customers to facilitate their risk management strategies. These derivatives are immediately hedged by offsetting derivatives such that we minimize our net risk exposure as a result of such transactions. We record all derivatives at fair value in the balance sheet as either other assets or other liabilities. See further discussion in Note 8.
Commitments and Letters of Credit
In the ordinary course of business, we enter into commitments to extend credit, commercial letters of credit, and standby letters of credit. Such financial instruments are recorded in the financial statements when they become payable. The credit risk associated with these commitments is evaluated in a manner similar to the allowance for loan losses. The reserve for unfunded lending commitments is presented separately in the balance sheet.
Share-Based Compensation
Share-based compensation generally includes grants of stock options, restricted stock, and other awards to employees and nonemployee directors. We account for share-based awards in accordance with ASC 718, Compensation – Stock Compensation , and recognize them in the statement of income based on their fair values. See further discussion in Note 17.
Income Taxes
Deferred tax assets and liabilities are determined based on temporary differences between financial statement asset and liability amounts and their respective tax bases and are measured using enacted tax laws and rates. The effect on deferred tax assets and liabilities of a change in tax rates is recognized in income in the period that includes the enactment date. Deferred tax assets are recognized subject to management’s judgment that realization is more-likely-than-not. Unrecognized tax benefits for uncertain tax positions relate primarily to state tax contingencies. See further discussion in Note 15.
Net Earnings Per Common Share
Net earnings per common share is based on net earnings applicable to common shareholders which is net of preferred stock dividends. Unvested share-based awards with rights to receive nonforfeitable dividends are considered participating securities and included in the computation of diluted earnings per share. Basic net earnings per common share is based on the weighted average outstanding common shares during each year. Diluted net earnings per common share is based on the weighted average outstanding common shares during each year, including common stock equivalents (such as warrants, stock options and restricted stock). Diluted net earnings per common share excludes common stock equivalents whose effect is antidilutive.
102
Table of Contents
2. OTHER RECENT ACCOUNTING PRONOUNCEMENT
On December 17, 2010, the Financial Accounting Standards Board (“FASB”) issued ASU No. 2010-28, When to Perform Step 2 of the Goodwill Impairment Test for Reporting Units with Zero or Negative Carrying Amounts , which amends certain key provisions of ASC 350 . This ASU modifies Step 1 of the goodwill impairment test for reporting units with zero or negative carrying amounts. In these situations, an entity is required to perform Step 2 of the goodwill impairment test if it is “more likely than not” that a goodwill impairment exists. The ASU eliminates an entity’s ability to assert that a reporting unit is not required to perform Step 2 because the carrying amount of the reporting unit is zero or negative despite the existence of qualitative factors indicating that goodwill is more likely than not impaired. The ASU is effective for fiscal years and interim periods beginning after December 15, 2010. We do not expect that our adoption of this new guidance on January 1, 2011 will have a significant impact on the Company’s financial statements.
Additional recent accounting pronouncements are discussed where applicable throughout the Notes to Consolidated Financial Statements.
3. MERGER AND ACQUISITION ACTIVITY
On September 3, 2010, we sold substantially all of the assets of our wholly-owned subsidiary, NetDeposit, to BServ, Inc. (dba BankServ), a privately-owned company. Both companies specialize in remote deposit capture and electronic payment technologies. We recognized a pretax gain on the sale of approximately $13.7 million, which was included in other noninterest income.
In July 2009, CB&T acquired the banking operations of the failed Vineyard Bank from the Federal Deposit Insurance Corporation (“FDIC”) as receiver. The acquisition consisted of approximately $1.6 billion of assets, including $1.4 billion of loans, $1.5 billion of deposits, and 16 branches mostly located in the Inland Empire area of Southern California. CB&T assumed Vineyard’s deposit obligations other than brokered deposits, and purchased most of Vineyard’s assets, including all loans. CB&T received approximately $87.5 million in cash from the FDIC.
In April 2009, NSB acquired the banking operations of the failed Great Basin Bank of Nevada headquartered in Elko, Nevada, from the FDIC as receiver. The acquisition consisted of approximately $212 million of assets, including the entire loan portfolio, $209 million of deposits, and five branches in Northern Nevada. NSB received approximately $17.8 million in cash from the FDIC.
In February 2009, CB&T acquired the banking operations of the failed Alliance Bank headquartered in Culver City, California from the FDIC as receiver. The acquisition consisted of approximately $1.1 billion of assets, including the entire loan portfolio, $1.0 billion of deposits, and five branches. CB&T received approximately $10 million in cash from the FDIC.
In connection with the 2009 acquisitions, CB&T and NSB entered into loss sharing agreements for the purchased loans, as discussed further in Note 6. Because the fair value of net assets acquired exceeded cost, and taking into consideration the amounts of cash received from the FDIC, we recognized acquisition related gains of $169.2 million.
In September 2008, our NSB and NBA subsidiaries acquired from the FDIC the insured deposits and certain assets of the failed Silver State Bank, headquartered in Henderson, Nevada. The acquisition included approximately $737 million of deposits and $66 million of assets. The assets consisted primarily of deposit-secured loans, furniture, fixtures and equipment, and certain branch assets.
103
Table of Contents
4. SUPPLEMENTAL CASH FLOW INFORMATION
Noncash activities are summarized as follows:
| (In thousands) | Year Ended December 31, | |||||||||||
| 2010 | 2009 | 2008 | ||||||||||
|
Amortized cost of investment securities held-to-maturity transferred to investment securities available-for-sale |
$ | – | $ | 1,058,159 | $ | – | ||||||
|
Fair value of investment securities available-for-sale transferred to investment securities held-to-maturity |
– | – | 1,231,979 | |||||||||
|
Loans transferred to other real estate owned |
607,886 | 553,415 | 297,228 | |||||||||
|
Beneficial conversion feature of modified subordinated debt recorded in common stock |
– | 202,814 | – | |||||||||
|
Beneficial conversion feature transferred from common stock to preferred stock as a result of subordinated debt conversions |
56,834 | 10,998 | – | |||||||||
|
Subordinated debt exchanged for common stock |
46,902 | – | – | |||||||||
|
Subordinated debt converted to preferred stock |
342,951 | 63,439 | – | |||||||||
|
Preferred stock exchanged for common stock |
5,508 | 38,486 | – | |||||||||
|
Acquisitions: |
||||||||||||
|
Assets acquired |
– | 2,981,335 | 66,192 | |||||||||
|
Liabilities assumed |
– | 2,929,448 | 737,116 | |||||||||
104
Table of Contents
5. INVESTMENT SECURITIES
Investment securities are summarized as follows:
| December 31, 2010 | ||||||||||||||||||||||||||||
|
Amortized
cost |
Recognized in OCI 1 |
Carrying
value |
Not recognized in OCI |
Estimated
fair value |
||||||||||||||||||||||||
| (In thousands) |
Gross
unrealized gains |
Gross
unrealized losses |
Gross
unrealized gains |
Gross
unrealized losses |
||||||||||||||||||||||||
|
Held-to-maturity: |
||||||||||||||||||||||||||||
|
Municipal securities |
$ | 577,527 | $ | – | $ | – | $ | 577,527 | $ | 8,715 | $ | 3,606 | $ | 582,636 | ||||||||||||||
|
Asset-backed securities: |
||||||||||||||||||||||||||||
|
Trust preferred securities – banks and insurance |
263,621 | – | 24,243 | 239,378 | – | 50,434 | 188,944 | |||||||||||||||||||||
|
Other |
27,671 | – | 4,034 | 23,637 | 897 | 7,860 | 16,674 | |||||||||||||||||||||
|
Other debt securities |
100 | – | – | 100 | – | – | 100 | |||||||||||||||||||||
| $ | 868,919 | $ | – | $ | 28,277 | $ | 840,642 | $ | 9,612 | $ | 61,900 | $ | 788,354 | |||||||||||||||
|
Available-for-sale: |
||||||||||||||||||||||||||||
|
U.S. Treasury securities |
$ | 705,321 | $ | 329 | $ | 24 | $ | 705,626 | $ | 705,626 | ||||||||||||||||||
|
U.S. Government agencies and corporations: |
||||||||||||||||||||||||||||
|
Agency securities |
201,356 | 7,179 | 137 | 208,398 | 208,398 | |||||||||||||||||||||||
|
Agency guaranteed mortgage-backed securities |
565,963 | 12,289 | 1,864 | 576,388 | 576,388 | |||||||||||||||||||||||
|
Small Business Administration loan-backed securities |
867,506 | 6,703 | 6,324 | 867,885 | 867,885 | |||||||||||||||||||||||
|
Municipal securities |
155,583 | 2,534 | 409 | 157,708 | 157,708 | |||||||||||||||||||||||
|
Asset-backed securities: |
||||||||||||||||||||||||||||
|
Trust preferred securities – banks and insurance |
1,947,129 | 46,821 | 750,553 | 1,243,397 | 1,243,397 | |||||||||||||||||||||||
|
Trust preferred securities – real estate investment trusts |
45,687 | – | 26,522 | 19,165 | 19,165 | |||||||||||||||||||||||
|
Auction rate securities |
110,548 | 649 | 1,588 | 109,609 | 109,609 | |||||||||||||||||||||||
|
Other |
103,047 | 1,784 | 24,125 | 80,706 | 80,706 | |||||||||||||||||||||||
| 4,702,140 | 78,288 | 811,546 | 3,968,882 | 3,968,882 | ||||||||||||||||||||||||
|
Mutual funds and stock |
236,779 | 81 | – | 236,860 | 236,860 | |||||||||||||||||||||||
| $ | 4,938,919 | $ | 78,369 | $ | 811,546 | $ | 4,205,742 | $ | 4,205,742 | |||||||||||||||||||
105
Table of Contents
| December 31, 2009 | ||||||||||||||||||||||||||||
|
Amortized
cost |
Recognized in OCI 1 |
Carrying
value |
Not recognized in OCI |
Estimated
fair value |
||||||||||||||||||||||||
| (In thousands) |
Gross
unrealized gains |
Gross
unrealized losses |
Gross
unrealized gains |
Gross
unrealized losses |
||||||||||||||||||||||||
|
Held-to-maturity: |
||||||||||||||||||||||||||||
|
Municipal securities |
$ | 606,074 | $ | – | $ | – | $ | 606,074 | $ | 8,724 | $ | 5,451 | $ | 609,347 | ||||||||||||||
|
Asset-backed securities: |
||||||||||||||||||||||||||||
|
Trust preferred securities – banks and insurance |
264,712 | – | 25,920 | 238,792 | – | 31,115 | 207,677 | |||||||||||||||||||||
|
Other |
30,482 | – | 5,853 | 24,629 | 551 | 8,848 | 16,332 | |||||||||||||||||||||
|
Other debt securities |
100 | – | – | 100 | – | 1 | 99 | |||||||||||||||||||||
| $ | 901,368 | $ | – | $ | 31,773 | $ | 869,595 | $ | 9,275 | $ | 45,415 | $ | 833,455 | |||||||||||||||
|
Available-for-sale: |
||||||||||||||||||||||||||||
|
U.S. Treasury securities |
$ | 25,651 | $ | 493 | $ | – | $ | 26,144 | $ | 26,144 | ||||||||||||||||||
|
U.S. Government agencies and corporations: |
||||||||||||||||||||||||||||
|
Agency securities |
242,609 | 6,904 | 114 | 249,399 | 249,399 | |||||||||||||||||||||||
|
Agency guaranteed mortgage-backed securities |
374,118 | 11,849 | 692 | 385,275 | 385,275 | |||||||||||||||||||||||
|
Small Business Administration loan-backed securities |
782,385 | 3,050 | 17,796 | 767,639 | 767,639 | |||||||||||||||||||||||
|
Municipal securities |
237,057 | 4,823 | 386 | 241,494 | 241,494 | |||||||||||||||||||||||
|
Asset-backed securities: |
||||||||||||||||||||||||||||
|
Trust preferred securities – banks and insurance |
2,022,998 | 54,449 | 716,347 | 1,361,100 | 1,361,100 | |||||||||||||||||||||||
|
Trust preferred securities – real estate investment trusts |
56,265 | – | 32,247 | 24,018 | 24,018 | |||||||||||||||||||||||
|
Auction rate securities |
159,649 | 321 | 530 | 159,440 | 159,440 | |||||||||||||||||||||||
|
Other |
127,210 | 1,355 | 51,413 | 77,152 | 77,152 | |||||||||||||||||||||||
| 4,027,942 | 83,244 | 819,525 | 3,291,661 | 3,291,661 | ||||||||||||||||||||||||
|
Mutual funds and stock |
363,958 | – | – | 363,958 | 363,958 | |||||||||||||||||||||||
| $ | 4,391,900 | $ | 83,244 | $ | 819,525 | $ | 3,655,619 | $ | 3,655,619 | |||||||||||||||||||
| 1 |
The gross unrealized losses recognized in OCI resulted from the transfer of AFS securities to HTM in 2008. |
During the first half of 2009, we reassessed the classification of certain asset-backed and trust preferred collateralized debt obligation (“CDO”) securities as part of our ongoing review of the investment securities portfolio. We reclassified approximately $596 million at fair value of HTM securities to AFS. Unrealized losses added to OCI at the time of these transfers were $128.9 million. The reclassifications were made subsequent to ratings downgrades, as permitted under ASC 320, Investments – Debt and Equity Securities . No gain or loss was recognized in the statement of income at the time of reclassification.
106
Table of Contents
The amortized cost and estimated fair value of investment debt securities are shown subsequently as of December 31, 2010 by expected maturity distribution for structured asset-backed CDOs (“ABS CDOs”) and by contractual maturity distribution for other debt securities. Actual maturities may differ from expected or contractual maturities because borrowers may have the right to call or prepay obligations with or without call or prepayment penalties:
| Held-to-maturity | Available-for-sale | |||||||||||||||
| (In thousands) |
Amortized
cost |
Estimated
fair value |
Amortized
cost |
Estimated
fair value |
||||||||||||
|
Due in one year or less |
$ | 60,284 | $ | 60,604 | $ | 1,039,623 | $ | 1,030,609 | ||||||||
|
Due after one year through five years |
235,089 | 234,275 | 894,319 | 864,186 | ||||||||||||
|
Due after five years through ten years |
191,040 | 175,071 | 849,722 | 728,223 | ||||||||||||
|
Due after ten years |
382,506 | 318,404 | 1,918,476 | 1,345,864 | ||||||||||||
| $ | 868,919 | $ | 788,354 | $ | 4,702,140 | $ | 3,968,882 | |||||||||
The following is a summary of the amount of gross unrealized losses for debt securities and the estimated fair value by length of time the securities have been in an unrealized loss position:
| December 31, 2010 | ||||||||||||||||||||||||
| Less than 12 months | 12 months or more | Total | ||||||||||||||||||||||
| (In thousands) |
Gross
unrealized losses |
Estimated
fair value |
Gross
unrealized losses |
Estimated
fair value |
Gross
unrealized losses |
Estimated
fair value |
||||||||||||||||||
|
Held-to-maturity: |
||||||||||||||||||||||||
|
Municipal securities |
$ | 574 | $ | 27,600 | $ | 3,032 | $ | 23,828 | $ | 3,606 | $ | 51,428 | ||||||||||||
|
Asset-backed securities: |
||||||||||||||||||||||||
|
Trust preferred securities – banks and insurance |
– | – | 74,677 | 188,944 | 74,677 | 188,944 | ||||||||||||||||||
|
Other |
– | – | 11,894 | 16,674 | 11,894 | 16,674 | ||||||||||||||||||
|
Other debt securities |
– | – | – | – | – | – | ||||||||||||||||||
| $ | 574 | $ | 27,600 | $ | 89,603 | $ | 229,446 | $ | 90,177 | $ | 257,046 | |||||||||||||
|
Available-for-sale: |
||||||||||||||||||||||||
|
U.S. Treasury securities |
$ | 24 | $ | 400,778 | $ | – | $ | – | $ | 24 | $ | 400,778 | ||||||||||||
|
U.S. Government agencies and corporations: |
||||||||||||||||||||||||
|
Agency securities |
111 | 11,317 | 26 | 970 | 137 | 12,287 | ||||||||||||||||||
|
Agency guaranteed mortgage-backed securities |
1,864 | 235,531 | – | – | 1,864 | 235,531 | ||||||||||||||||||
|
Small Business Administration loan-backed securities |
432 | 116,101 | 5,892 | 400,447 | 6,324 | 516,548 | ||||||||||||||||||
|
Municipal securities |
405 | 14,928 | 4 | 391 | 409 | 15,319 | ||||||||||||||||||
|
Asset-backed securities: |
||||||||||||||||||||||||
|
Trust preferred securities – banks and insurance |
1,969 | 87,973 | 748,584 | 850,437 | 750,553 | 938,410 | ||||||||||||||||||
|
Trust preferred securities – real estate investment trusts |
– | – | 26,522 | 19,165 | 26,522 | 19,165 | ||||||||||||||||||
|
Auction rate securities |
1,588 | 68,178 | – | – | 1,588 | 68,178 | ||||||||||||||||||
|
Other |
– | – | 24,125 | 44,628 | 24,125 | 44,628 | ||||||||||||||||||
| $ | 6,393 | $ | 934,806 | $ | 805,153 | $ | 1,316,038 | $ | 811,546 | $ | 2,250,844 | |||||||||||||
107
Table of Contents
| December 31, 2009 | ||||||||||||||||||||||||
| Less than 12 months | 12 months or more | Total | ||||||||||||||||||||||
| (In thousands) |
Gross
unrealized losses |
Estimated
fair value |
Gross
unrealized losses |
Estimated
fair value |
Gross
unrealized losses |
Estimated
fair value |
||||||||||||||||||
|
Held-to-maturity: |
||||||||||||||||||||||||
|
Municipal securities |
$ | 1,051 | $ | 40,006 | $ | 4,400 | $ | 28,152 | $ | 5,451 | $ | 68,158 | ||||||||||||
|
Asset-backed securities: |
||||||||||||||||||||||||
|
Trust preferred securities – banks and insurance |
– | – | 57,035 | 207,676 | 57,035 | 207,676 | ||||||||||||||||||
|
Other |
– | – | 14,701 | 16,332 | 14,701 | 16,332 | ||||||||||||||||||
|
Other debt securities |
1 | 99 | 1 | 99 | ||||||||||||||||||||
| $ | 1,051 | $ | 40,006 | $ | 76,137 | $ | 252,259 | $ | 77,188 | $ | 292,265 | |||||||||||||
|
Available-for-sale: |
||||||||||||||||||||||||
|
U.S. Government agencies and corporations: |
||||||||||||||||||||||||
|
Agency securities |
$ | 40 | $ | 5,300 | $ | 74 | $ | 2,231 | $ | 114 | $ | 7,531 | ||||||||||||
|
Agency guaranteed mortgage-backed securities |
690 | 44,259 | 2 | 163 | 692 | 44,422 | ||||||||||||||||||
|
Small Business Administration loan-backed securities |
2,345 | 60,624 | 15,451 | 506,866 | 17,796 | 567,490 | ||||||||||||||||||
|
Municipal securities |
383 | 15,342 | 3 | 676 | 386 | 16,018 | ||||||||||||||||||
|
Asset-backed securities: |
||||||||||||||||||||||||
|
Trust preferred securities – banks and insurance |
5,578 | 62,172 | 710,769 | 897,513 | 716,347 | 959,685 | ||||||||||||||||||
|
Trust preferred securities – real estate investment trusts |
20,808 | 2,253 | 11,439 | 21,766 | 32,247 | 24,019 | ||||||||||||||||||
|
Auction rate securities |
530 | 122,148 | – | – | 530 | 122,148 | ||||||||||||||||||
|
Other |
2,089 | 6,210 | 49,324 | 56,238 | 51,413 | 62,448 | ||||||||||||||||||
| $ | 32,463 | $ | 318,308 | $ | 787,062 | $ | 1,485,453 | $ | 819,525 | $ | 1,803,761 | |||||||||||||
At December 31, 2010 and 2009, respectively, 92 and 131 HTM and 628 and 717 AFS investment securities were in an unrealized loss position.
We conduct a formal review of investment securities on a quarterly basis for the presence of other-than-temporary impairment (“OTTI”). Our review was made under ASC 320, which includes new guidance that we adopted effective January 1, 2009. We assess whether OTTI is present when the fair value of a debt security is less than its amortized cost basis at the balance sheet date. Under these circumstances, OTTI is considered to have occurred if (1) we intend to sell the security; (2) it is more likely than not we will be required to sell the security before recovery of its amortized cost basis; or (3) the present value of expected cash flows is not sufficient to recover the entire amortized cost basis. The more likely than not criteria is a lower threshold than the “probable” criteria under the previous guidance.
The new guidance requires that credit-related OTTI is recognized in earnings while noncredit-related OTTI on securities not expected to be sold is recognized in OCI. Noncredit-related OTTI is based on other factors, including illiquidity. Presentation of OTTI is made in the statement of income on a gross basis with an offset for the amount of OTTI recognized in OCI. For securities classified as HTM, the amount of noncredit-related OTTI recognized in OCI is accreted to the credit-adjusted expected cash flow amounts of the securities over future periods. Noncredit-related OTTI recognized in earnings previous to January 1, 2009 was reclassified from retained earnings to accumulated OCI as a cumulative effect adjustment.
Our OTTI evaluation process takes into consideration current market conditions; fair value in relationship to cost; extent and nature of change in fair value; severity and duration of the impairment; recent events specific to
108
Table of Contents
the issuer or industry; creditworthiness of the issuer, including external credit ratings, changes, recent downgrades, and trends; volatility of earnings and trends; current analysts’ evaluations, all available information relevant to the collectibility of debt securities; and other key measures. In addition, we determine that we do not intend to sell the securities and it is not more likely than not that we will be required to sell the securities before recovery of their amortized cost basis. We consider any other relevant factors before concluding our evaluation for the existence of OTTI in our securities portfolio.
Additionally, under ASC 325-40, Beneficial Interests in Securitized Financial Assets , OTTI is recognized as a realized loss through earnings when there has been an adverse change in the holder’s best estimate of cash flows expected to be collected such that the entire amortized cost basis will not be received. This is a change from previous guidance that a holder’s best estimate of cash flows should be based upon those that “a market participant” would use.
For all security types discussed below where we believe that no OTTI should be recorded at December 31, 2010, we have applied the criteria discussed previously. Our conclusions from our OTTI evaluation are presented below:
Municipal securities
The HTM securities are purchased directly from the municipalities and are generally not rated by a credit rating agency. The AFS securities are rated as investment grade by various credit rating agencies. Both the HTM and AFS securities are at fixed and variable rates with maturities from one to 25 years. Fair values of these securities are largely driven by interest rates. We perform credit quality reviews on these securities at each reporting period. Because the decline in fair value is not attributable to credit quality, no OTTI was recorded for these securities at December 31, 2010.
Asset-backed securities
Trust preferred securities – banks and insurance : These CDO securities are variable rate pools of trust preferred securities related to banks and insurance companies. They are rated by one or more Nationally Recognized Statistical Rating Organizations (“NRSROs”), which are rating agencies registered with the Securities and Exchange Commission (“SEC”). They were purchased generally at par. Unrealized losses were caused mainly by the following factors: (1) collateral deterioration due to bank failures and credit concerns across the banking sector; (2) widening of credit spreads for asset-backed securities; and (3) general illiquidity in the market for CDOs. Our ongoing review of these securities in accordance with the previous discussion determined that OTTI should be recorded on certain of these securities.
Trust preferred securities – real estate investment trusts (“REITs”) : These CDO securities are variable rate pools of trust preferred securities primarily related to REITs, and are rated by one or more NRSROs. They were purchased generally at par. Unrealized losses were caused mainly by severe deterioration in mortgage REITs and homebuilder credit in addition to the same factors previously discussed for banks and insurance CDOs. Our ongoing review of these securities in accordance with the previous discussion determined that OTTI should be recorded on certain of these securities.
Auction rate securities : These debt instruments primarily relate to auction market preferred stock and certain corporate and municipal bonds for which the interest rate was determined through an auction process. They had previously been sold to customers by certain Company subsidiaries. Due to the failure of these auctions and attendant illiquidity of the securities, we voluntarily purchased these securities at par in 2009 and recorded them at fair value. Adjustments to fair value when purchased from customers were included in valuation losses on securities purchased in 2009. Because subsequent declines in fair value were not attributable to credit quality, no OTTI was recorded for these securities at December 31, 2010.
Other asset-backed securities : Most of these CDO securities were purchased in 2009 from Lockhart at their carrying values and were then adjusted to fair value. Certain of these CDOs consist of ABS CDOs (also
109
Table of Contents
known as diversified structured finance CDOs). Unrealized losses since acquisition were caused mainly by deterioration in collateral quality. Our ongoing review of these securities in accordance with the previous discussion determined that OTTI should be recorded on certain of these securities.
U.S. Government agencies and corporations
Agency securities : These securities consist of discount notes and medium term notes issued by the Federal Agricultural Mortgage Corporation (“FAMC”), Federal Home Loan Bank (“FHLB”), Federal Farm Credit Bank, Federal Home Loan Mortgage Corporation (“FHLMC”), and Federal National Mortgage Association (“FNMA”). These securities are fixed rate and were purchased at premiums or discounts. They have maturity dates from one to 30 years and have contractual cash flows guaranteed by agencies of the U.S. Government. The U.S. Government has provided substantial liquidity to FNMA and FHLMC to bolster their creditworthiness. Because the decline in fair value is not attributable to credit quality, no OTTI was recorded for these securities at December 31, 2010.
Agency guaranteed mortgage-backed securities : These securities are comprised largely of fixed and variable rate residential and agricultural mortgage-backed securities issued by the Government National Mortgage Association (“GNMA”), FNMA, FAMC, or FHLMC. They have maturity dates from one to 30 years and have contractual cash flows guaranteed by agencies of the U.S. Government. The U.S. Government has provided substantial liquidity to both FNMA and FHLMC to bolster their creditworthiness. Because the decline in fair value is not attributable to credit quality, no OTTI was recorded for these securities at December 31, 2010.
Small Business Administration (“SBA”) loan-backed securities : These securities were generally purchased at premiums with maturities from five to 25 years and have principal cash flows guaranteed by the SBA. Because the decline in fair value is not attributable to credit quality, no OTTI was recorded for these securities at December 31, 2010.
The following is a tabular rollforward of the total amount of credit-related OTTI, including amounts recognized in earnings:
| 2010 | 2009 | |||||||||||||||||||||||
| (In thousands) | HTM | AFS | Total | HTM | AFS | Total | ||||||||||||||||||
|
Balance of credit-related OTTI at beginning of year |
$ | (5,206 | ) | $ | (269,251 | ) | $ | (274,457 | ) | $ | (1,905 | ) | $ | (100,194 | ) | $ | (102,099 | ) | ||||||
|
Additions: |
||||||||||||||||||||||||
|
Credit-related OTTI not previously recognized 1 |
– | (3,899 | ) | (3,899 | ) | (682 | ) | (117,069 | ) | (117,751 | ) | |||||||||||||
|
Credit-related OTTI previously recognized when there is no intent to sell and no requirement to sell before recovery of amortized cost basis 2 |
(151 | ) | (81,305 | ) | (81,456 | ) | (2,619 | ) | (160,093 | ) | (162,712 | ) | ||||||||||||
|
Subtotal of amounts recognized in earnings |
(151 | ) | (85,204 | ) | (85,355 | ) | (3,301 | ) | (277,162 | ) | (280,463 | ) | ||||||||||||
|
Reductions for securities sold during the year |
– | 18,773 | 18,773 | – | 108,105 | 108,105 | ||||||||||||||||||
|
Balance of credit-related OTTI at end of year |
$ | (5,357 | ) | $ | (335,682 | ) | $ | (341,039 | ) | $ | (5,206 | ) | $ | (269,251 | ) | $ | (274,457 | ) | ||||||
| 1 |
Relates to securities not previously impaired. |
| 2 |
Relates to additional impairment on securities previously impaired. |
To determine the credit component of OTTI for all security types, we utilize projected cash flows as the best estimate of fair value. These cash flows are credit adjusted using, among other things, assumptions for default probability assigned to each portion of performing collateral. The credit adjusted cash flows are discounted at a security specific coupon rate to identify any OTTI, and then at a market rate for valuation purposes.
110
Table of Contents
Noncredit-related OTTI on securities not expected to be sold, and for which it is not more likely than not that we will be required to sell the securities before recovery of their amortized cost basis, was recognized in OCI as follows:
| (In thousands) | 2010 | 2009 | ||||||
|
Noncredit-related OTTI, pretax: |
||||||||
|
HTM |
$ | – | $ | 583 | ||||
|
AFS |
71,097 | 288,820 | ||||||
|
Total |
$ | 71,097 | $ | 289,403 | ||||
|
Total noncredit-related OTTI, after-tax |
$ | 43,920 | $ | 174,244 | ||||
As of January 1, 2009, we reclassified to OCI $137.5 million after-tax as a cumulative effect adjustment for the noncredit-related portion of OTTI losses previously recognized in earnings.
Nontaxable interest income on securities was $26.7 million in 2010, $30.4 million in 2009, and $32.5 million in 2008.
The following summarizes gains and losses, including OTTI, that were recognized in the statement of income:
| 2010 | 2009 | 2008 | ||||||||||||||||||||||
| (In thousands) |
Gross
gains |
Gross
losses |
Gross
gains |
Gross
losses |
Gross
gains |
Gross
losses |
||||||||||||||||||
|
Investment securities: |
||||||||||||||||||||||||
|
Held-to-maturity |
$ | – | $ | 151 | $ | – | $ | 3,301 | $ | – | $ | 208,515 | ||||||||||||
|
Available-for-sale |
11,153 | 85,302 | 9,976 | 499,970 | 4,565 | 110,244 | ||||||||||||||||||
|
Other noninterest-bearing investments: |
||||||||||||||||||||||||
|
Nonmarketable equity securities |
4,826 | 11,214 | 3,613 | 6,320 | 10,554 | 18,907 | ||||||||||||||||||
|
Other |
395 | – | 1,306 | 3,530 | 20,079 | 13,002 | ||||||||||||||||||
| 16,374 | 96,667 | 14,895 | 513,121 | 35,198 | 350,668 | |||||||||||||||||||
|
Net gains (losses) |
$ | (80,293 | ) | $ | (498,226 | ) | $ | (315,470 | ) | |||||||||||||||
|
Statement of income information: |
||||||||||||||||||||||||
|
Net impairment losses on investment securities |
$ | (85,355 | ) | $ | (280,463 | ) | $ | (304,040 | ) | |||||||||||||||
|
Valuation losses on securities purchased |
– | (212,092 | ) | (13,072 | ) | |||||||||||||||||||
| (85,355 | ) | (492,555 | ) | (317,112 | ) | |||||||||||||||||||
|
Equity securities gains (losses), net |
(5,993 | ) | (1,825 | ) | 793 | |||||||||||||||||||
|
Fixed income securities gains (losses), net |
11,055 | (3,846 | ) | 849 | ||||||||||||||||||||
|
Net gains (losses) |
$ | (80,293 | ) | $ | (498,226 | ) | $ | (315,470 | ) | |||||||||||||||
Valuation losses on securities purchased primarily relate to purchases by Zions Bank from Lockhart and are discussed further in Note 7. Included in the 2009 amount is $24.2 million when we voluntarily purchased all of the $255.3 million of auction rate securities previously sold to customers by certain Company subsidiaries.
Securities with a carrying value of $1.6 billion and $1.8 billion at December 31, 2010 and 2009, respectively, were pledged to secure public and trust deposits, advances, and for other purposes as required by law. Securities are also pledged as collateral for security repurchase agreements.
111
Table of Contents
6. LOANS AND ALLOWANCE FOR CREDIT LOSSES
On July 21, 2010, the FASB issued ASU No. 2010-20, Disclosures about the Credit Quality of Financing Receivables and the Allowance for Credit Losses . This new accounting guidance under ASC 310, Receivables , requires disclosure of additional information about the credit quality of an entity’s financing receivables and the allowance for credit losses.
The new guidance only relates to financial statement disclosures and does not affect the Company’s financial condition or results of operations. The following disclosures and the policy disclosures in Note 1 incorporate the new guidance.
Loans
Loans are summarized as follows according to major portfolio segment and specific loan class:
| December 31, | ||||||||
| (In thousands) | 2010 | 2009 | ||||||
|
Commercial lending: |
||||||||
|
Commercial and industrial |
$ | 9,167,001 | $ | 9,631,445 | ||||
|
Leasing |
410,174 | 466,492 | ||||||
|
Owner occupied |
8,217,363 | 8,751,983 | ||||||
|
Municipal |
438,985 | 355,579 | ||||||
|
Total commercial lending |
18,233,523 | 19,205,499 | ||||||
|
Commercial real estate: |
||||||||
|
Construction and land development |
3,567,220 | 5,551,963 | ||||||
|
Term |
7,581,377 | 7,255,124 | ||||||
|
Total commercial real estate |
11,148,597 | 12,807,087 | ||||||
|
Consumer: |
||||||||
|
Home equity credit line |
2,141,740 | 2,135,172 | ||||||
|
1-4 family residential |
3,499,149 | 3,642,403 | ||||||
|
Construction and other consumer real estate |
343,257 | 459,039 | ||||||
|
Bankcard and other revolving plans |
296,936 | 340,428 | ||||||
|
Other |
233,193 | 292,455 | ||||||
|
Total consumer |
6,514,275 | 6,869,497 | ||||||
|
FDIC-supported loans |
971,377 | 1,444,594 | ||||||
|
Total loans |
$ | 36,867,772 | $ | 40,326,677 | ||||
FDIC-supported loans were acquired during 2009 and are supported by the FDIC under loss sharing agreements, as discussed subsequently under purchased loans.
Owner occupied and commercial real estate loans include unamortized premiums of approximately $88.4 million and $117.6 million at December 31, 2010 and 2009, respectively.
Municipal loans generally include loans to municipalities with the debt service being repaid from general funds or pledged revenues of the municipal entity, or to private commercial entities or 501(c)(3) not-for-profit entities utilizing a pass-through municipal entity to achieve favorable tax treatment.
As of December 31, 2010 and 2009, loans with a carrying value of approximately $20.4 billion and $21.6 billion, respectively, were pledged as collateral for current and potential borrowings.
112
Table of Contents
We sold loans totaling $1,692 million in 2010, $1,934 million in 2009, and $950 million in 2008, that were previously classified as held for sale. The amount sold in 2010 approximately equaled the amount added to loans held for sale. Income from loans sold, excluding servicing, was $17.8 million in 2010, $11.2 million in 2009, and $9.7 million in 2008. The 2008 amount included income from loan securitizations.
Allowance for Credit Losses
The allowance for credit losses (“ACL”) consists of the allowance for loan and lease losses (“ALLL,” also referred to as the allowance for loan losses) and the reserve for unfunded lending commitments (“RULC”).
Allowance for Loan and Lease Losses – The ALLL represents our estimate of losses inherent in the loan and lease portfolio as of the balance sheet date. Losses are charged to the ALLL when recognized. Generally, commercial loans are charged-off or charged down at the point at which they are determined to be uncollectible in whole or in part, or when 180 days past due unless the loan is well secured and in the process of collection. Consumer loans are either charged off or charged down to net realizable value no later than the month in which they become 180 days past due. Closed-end loans, i.e., those with a maturity date, that are not secured by residential real estate are either charged off or charged down to net realizable value no later than the month in which they become 120 days past due.
We establish the amount of the ALLL by analyzing the portfolio at least quarterly using accounting standards in ASC 450, Contingencies, ASC 310, and SEC Staff Accounting Bulletin (“SAB”) No. 102. We also utilize regulatory guidance issued by U.S. financial institution regulatory agencies, including the guidance contained in Supervision and Regulation (“SR”) 01-17, Policy Statement on Allowance for Loan and Lease Losses Methodologies and Documentation for Banks and Savings Institutions , and SR 06-17, Interagency Policy Statement on the Allowance for Loan and Lease Losses . Upon establishing an appropriate ALLL, we adjust the provisions for loan losses so the ALLL is at an appropriate level at the balance sheet date.
The methodologies we use to estimate the ALLL depend upon the impairment status and portfolio segment of the loan. For the commercial lending and commercial real estate segments, we use a comprehensive loan grading system to assign probability of default and loss given default grades to each loan. The credit quality indicators discussed subsequently are based on this grading system. Probability of default and loss given default grades are based on both financial and statistical models and loan officers’ qualitative risk assessments. We create groupings of these grades for each subsidiary bank and loan class and calculate historic loss rates using a loss migration analysis that attributes historic realized losses to historic loan grades over the time period of the loss migration analysis. For each grade grouping, subsidiary bank, and loan class, we calculate three loss migration rates using loan loss information from the most recent 6, 12, and 18-month periods and utilize the highest of the three results as the estimated loss for each portfolio. As noted below, we adjusted this loss migration period in the fourth quarter of 2010 and may adjust it again in the future, based on management’s judgment of which historic periods are the most important indicators of the loss content in the loan portfolio on the balance sheet date. We currently use a loss emergence period of 18 months for the commercial lending and commercial real estate segments.
For the consumer loan segment, we use roll rate models to forecast probable inherent losses. Roll rate models measure the rate at which consumer loans migrate from one delinquency bucket to the next worse delinquency bucket, and eventually to loss. We estimate roll rates for consumer loans using the most recent six months of delinquency and loss histories. These roll rates are then applied to current delinquency levels to estimate losses over the following 12 months.
For FDIC-supported loans purchased with evidence of credit deterioration, we determine the ALLL according to ASC 310-30. The accounting for these loans, including the allowance calculation, is described in the purchased loans section following.
113
Table of Contents
After applying historic loss experience, as described above, we review the quantitatively derived level of ALLL for each segment using qualitative criteria according to the guidance provided in the regulatory documents SR 01-17, SR 06-17, and SAB 102. We track various risk factors that influence our judgment regarding the level of the ALLL across the portfolio segments. Primary qualitative factors that may not be reflected in our quantitative models include:
| • |
Asset quality trends |
| • |
Risk management and loan administration practices |
| • |
Risk identification practices |
| • |
Effect of changes in the nature and volume of the portfolio |
| • |
Existence and effect of any portfolio concentrations |
| • |
National economic and business conditions |
| • |
Regional and local economic and business conditions |
| • |
Data reliability |
We review changes in these factors to ensure that changes in the level of the ALLL are consistent with changes in these factors. The magnitude of the impact of each of these factors on our qualitative assessment of the ALLL changes from quarter to quarter according to the extent these factors are already reflected in historic loss rates and according to the extent these factors diverge from one another.
In addition to the qualitative factor review, we review trends in several credit ratios including the ratios of the ALLL to nonaccrual loans, to historic net charge-offs, and to classified loans. We compare these ratios to peer levels where available. While ratio analysis does not drive the level of the ALLL, we do use ratios to confirm that our overall level of ALLL is appropriate and adequate. We also consider the uncertainty inherent in the estimation process when evaluating the ALLL.
Reserve for Unfunded Lending Commitments – The Company also estimates a reserve for potential losses associated with off-balance sheet commitments and standby letters of credit. We determine the RULC using the same procedures and methodologies that we use for the ALLL. The loss factors used in the RULC are the same as the loss factors used in the ALLL, and the qualitative adjustments used in the RULC are the same as the qualitative adjustments used in the ALLL. We adjust the Company’s unfunded lending commitments that are not unconditionally cancelable to an outstanding amount equivalent using credit conversion factors and we apply the loss factors to the outstanding equivalents.
Changes in ACL Assumptions – During the fourth quarter of 2010, we changed certain assumptions in our loss migration model that we use to estimate the ALLL and RULC for the commercial and commercial real estate segments. Prior to the fourth quarter of 2010, we used loss migration models based on the most recent 6 or 12 months of loss data to estimate probable losses for the portions of the segments that were collectively evaluated for impairment. We added an 18 month loss look-back period during the fourth quarter of 2010, which increased the quantitative portion of the ACL by approximately $115 million as of December 31, 2010 over what it would have been had only 6 and 12 months been used. We considered these assumption changes in assessing our qualitative adjustments. We made the change in order to continue to capture losses during the worst part of this credit cycle, as we believe the high level of loss severity rates that occurred during that period are still relevant to estimating probable inherent losses in those segments. The above refinements in the ACL calculation did not have a material effect on the overall level of the ACL or the provision for loan losses.
114
Table of Contents
Changes in the allowance for credit losses are summarized as follows:
| (In thousands) | 2010 | 2009 | 2008 | |||||||||
|
Allowance for loan losses: |
||||||||||||
|
Balance at beginning of year |
$ | 1,531,332 | $ | 686,999 | $ | 459,376 | ||||||
|
Allowance associated with purchased securitized loans |
– | – | 1,756 | |||||||||
|
Allowance of loans and leases sold |
– | – | (804 | ) | ||||||||
|
Additions: |
||||||||||||
|
Provision for loan losses |
852,138 | 2,016,927 | 648,269 | |||||||||
|
Change in allowance as a result of FDIC indemnification |
25,778 | – | – | |||||||||
|
Deductions: |
||||||||||||
|
Gross loan and lease charge-offs |
(1,073,813 | ) | (1,255,652 | ) | (414,687 | ) | ||||||
|
Net charge-offs recoverable from FDIC |
14,046 | 2,303 | – | |||||||||
|
Recoveries |
90,860 | 80,755 | 21,026 | |||||||||
|
Net loan and lease charge-offs |
(968,907 | ) | (1,172,594 | ) | (393,661 | ) | ||||||
|
Reclassification to reserve for unfunded lending commitments |
– | – | (27,937 | ) | ||||||||
|
Balance at end of year |
$ | 1,440,341 | $ | 1,531,332 | $ | 686,999 | ||||||
|
Reserve for unfunded lending commitments: |
||||||||||||
|
Balance at beginning of year |
$ | 116,445 | $ | 50,934 | $ | 21,530 | ||||||
|
Provision (credited) charged to earnings |
(4,737 | ) | 65,511 | 1,467 | ||||||||
|
Reclassification from allowance for loan losses |
– | – | 27,937 | |||||||||
|
Balance at end of year |
$ | 111,708 | $ | 116,445 | $ | 50,934 | ||||||
|
Total allowance for credit losses: |
||||||||||||
|
Allowance for loan losses |
$ | 1,440,341 | $ | 1,531,332 | $ | 686,999 | ||||||
|
Reserve for unfunded lending commitments |
111,708 | 116,445 | 50,934 | |||||||||
|
Total allowance for credit losses |
$ | 1,552,049 | $ | 1,647,777 | $ | 737,933 | ||||||
The reclassification of $27.9 million in 2008 included in the RULC the reserves for the unfunded portions of partially funded credits previously reserved for as part of the ALLL.
115
Table of Contents
The ALLL and outstanding loan balances according to the Company’s impairment method are summarized as follows at December 31, 2010:
| (In thousands) |
Commercial
lending |
Commercial
real estate |
Consumer |
FDIC-
supported |
Total | |||||||||||||||
|
Allowance for loan losses: |
||||||||||||||||||||
|
Individually evaluated for impairment |
$ | 53,237 | $ | 37,545 | $ | 6,335 | $ | – | $ | 97,117 | ||||||||||
|
Collectively evaluated for impairment |
707,870 | 449,690 | 147,991 | 30,684 | 1,336,235 | |||||||||||||||
|
Purchased loans with evidence of credit deterioration |
– | – | – | 6,989 | 6,989 | |||||||||||||||
|
Total |
$ | 761,107 | $ | 487,235 | $ | 154,326 | $ | 37,673 | $ | 1,440,341 | ||||||||||
|
Outstanding loan balances: |
||||||||||||||||||||
|
Individually evaluated for impairment |
$ | 544,243 | $ | 1,003,402 | $ | 137,928 | $ | – | $ | 1,685,573 | ||||||||||
|
Collectively evaluated for impairment |
17,689,280 | 10,145,195 | 6,376,347 | 791,587 | 35,002,409 | |||||||||||||||
|
Purchased loans with evidence of credit deterioration |
– | – | – | 179,790 | 179,790 | |||||||||||||||
|
Total |
$ | 18,233,523 | $ | 11,148,597 | $ | 6,514,275 | $ | 971,377 | $ | 36,867,772 | ||||||||||
Nonaccrual and Past Due Loans
Loans are generally placed on nonaccrual status when payment in full of principal and interest is not expected, or the loan is 90 days or more past due as to principal or interest, unless the loan is both well secured and in the process of collection.
A nonaccrual loan may be returned to accrual status when all delinquent interest and principal become current in accordance with the terms of the loan agreement, the loan is well secured, the borrower has paid according to the contractual terms for a minimum of six months, and analysis of the borrower indicates a reasonable assurance of the ability to maintain payments. Payments received on nonaccrual loans are applied as a reduction to the principal outstanding.
Closed-end loans with payments scheduled monthly are reported as past due when the borrower is in arrears for two or more monthly payments. Similarly, open-end credit such as charge-card plans and other revolving credit plans are reported as past due when the minimum payment has not been made for two or more billing cycles. Other multipayment obligations (i.e., quarterly, semiannual, etc.), single payment, and demand notes are reported as past due when either principal or interest is due and unpaid for a period of 30 days or more.
116
Table of Contents
Accruing loans, including past due loans, and nonaccrual loans are as follows at December 31, 2010:
| Accruing loans | Nonaccrual | Total |
Nonaccrual
loans that are current 1 |
|||||||||||||||||||||||||
| (In thousands) | Current |
30-89 days
past due |
90+ days
past due |
Total
past due |
||||||||||||||||||||||||
|
Commercial lending: |
||||||||||||||||||||||||||||
|
Commercial and industrial |
$ | 8,860,714 | $ | 74,255 | $ | 7,533 | $ | 81,788 | $ | 224,499 | $ | 9,167,001 | $ | 77,406 | ||||||||||||||
|
Leasing |
407,992 | 1,315 | 66 | 1,381 | 801 | 410,174 | 23 | |||||||||||||||||||||
|
Owner occupied |
7,813,666 | 57,354 | 3,876 | 61,230 | 342,467 | 8,217,363 | 91,527 | |||||||||||||||||||||
|
Municipal |
436,983 | – | – | – | 2,002 | 438,985 | 2,002 | |||||||||||||||||||||
|
Total commercial lending |
17,519,355 | 132,924 | 11,475 | 144,399 | 569,769 | 18,233,523 | 170,958 | |||||||||||||||||||||
|
Commercial real estate: |
||||||||||||||||||||||||||||
|
Construction and land development |
3,039,790 | 32,069 | 1,916 | 33,985 | 493,445 | 3,567,220 | 200,864 | |||||||||||||||||||||
|
Term |
7,255,658 | 56,657 | 4,757 | 61,414 | 264,305 | 7,581,377 | 112,447 | |||||||||||||||||||||
|
Total commercial real estate |
10,295,448 | 88,726 | 6,673 | 95,399 | 757,750 | 11,148,597 | 313,311 | |||||||||||||||||||||
|
Consumer: |
||||||||||||||||||||||||||||
|
Home equity credit line |
2,124,281 | 3,412 | – | 3,412 | 14,047 | 2,141,740 | 2,224 | |||||||||||||||||||||
|
1-4 family residential |
3,348,995 | 22,718 | 2,966 | 25,684 | 124,470 | 3,499,149 | 34,425 | |||||||||||||||||||||
|
Construction and other consumer real estate |
312,252 | 6,754 | 532 | 7,286 | 23,719 | 343,257 | 10,089 | |||||||||||||||||||||
|
Bankcard and other revolving plans |
290,568 | 3,838 | 1,572 | 5,410 | 958 | 296,936 | 311 | |||||||||||||||||||||
|
Other |
226,695 | 4,342 | – | 4,342 | 2,156 | 233,193 | 959 | |||||||||||||||||||||
|
Total consumer loans |
6,302,791 | 41,064 | 5,070 | 46,134 | 165,350 | 6,514,275 | 48,008 | |||||||||||||||||||||
|
FDIC-supported loans |
789,959 | 27,156 | 118,425 | 145,581 | 35,837 | 971,377 | 15,136 | |||||||||||||||||||||
|
Total |
$ | 34,907,553 | $ | 289,870 | $ | 141,643 | $ | 431,513 | $ | 1,528,706 | $ | 36,867,772 | $ | 547,413 | ||||||||||||||
| 1 |
Represents nonaccrual loans that are not past due more than 30 days; however, full payment of principal and interest is still not expected. |
Credit Quality Indicators
In addition to the past due and nonaccrual criteria, we also analyze loans using a loan grading system. We generally assign internal loan grades to consumer, commercial lending, and commercial real estate loans with commitments less than $500,000 based on the performance of those loans. Performance-based grades follow our definitions of Pass, Special Mention, Substandard, and Doubtful.
We generally assign internal loan grades to commercial lending and commercial real estate loans with commitments equal to or greater than $500,000 based on financial/statistical models and loan officer judgment. For these larger loans, we assign one of fourteen probability of default grades and one of twelve loss given default grades. We use the ten Pass probability of default grades for loans that do not meet one of the grades listed subsequently. The other four grades follow our definitions of Special Mention, Substandard, Doubtful, and Loss. Loss indicates that the outstanding balance has been charged-off. The definitions of Pass, Special Mention, Substandard, and Doubtful are summarized as follows:
Pass : A Pass asset is higher quality and does not fit any of the other categories described below. The likelihood of loss is considered remote.
Special Mention : A Special Mention asset has potential weaknesses that may be temporary or, if left uncorrected, may result in a loss. While concerns exist, the bank is currently protected and loss is considered unlikely and not imminent.
Substandard : A Substandard asset is inadequately protected by the current sound worth and paying capacity of the obligor or of the collateral pledged, if any. Assets so classified have well defined weaknesses and are characterized by the distinct possibility that the bank may sustain some loss if deficiencies are not corrected.
Doubtful : A Doubtful asset has all the weaknesses inherent in a Substandard asset with the added characteristics that the weaknesses make collection or liquidation in full highly questionable.
117
Table of Contents
Outstanding loan balances categorized by these credit quality indicators are summarized as follows at December 31, 2010:
| Accruing loans | ||||||||||||||||||||||||
| (In thousands) | Pass |
Special
Mention |
Classified 1 | Nonaccrual | Total |
Total
allowance |
||||||||||||||||||
|
Commercial lending: |
||||||||||||||||||||||||
|
Commercial and industrial |
$ | 8,200,417 | $ | 254,202 | $ | 487,883 | $ | 224,499 | $ | 9,167,001 | ||||||||||||||
|
Leasing |
395,081 | 1,170 | 13,122 | 801 | 410,174 | |||||||||||||||||||
|
Owner occupied |
7,341,843 | 147,525 | 385,528 | 342,467 | 8,217,363 | |||||||||||||||||||
|
Municipal |
436,983 | – | – | 2,002 | 438,985 | |||||||||||||||||||
|
Total commercial lending |
16,374,324 | 402,897 | 886,533 | 569,769 | 18,233,523 | $ | 761,107 | |||||||||||||||||
|
Commercial real estate: |
||||||||||||||||||||||||
|
Construction and land development |
1,988,956 | 465,489 | 619,330 | 493,445 | 3,567,220 | |||||||||||||||||||
|
Term |
6,698,554 | 252,814 | 365,704 | 264,305 | 7,581,377 | |||||||||||||||||||
|
Total commercial real estate |
8,687,510 | 718,303 | 985,034 | 757,750 | 11,148,597 | 487,235 | ||||||||||||||||||
|
Consumer: |
||||||||||||||||||||||||
|
Home equity credit line |
2,098,366 | 855 | 28,472 | 14,047 | 2,141,740 | |||||||||||||||||||
|
1-4 family residential |
3,310,696 | 7,274 | 56,709 | 124,470 | 3,499,149 | |||||||||||||||||||
|
Construction and other consumer real estate |
310,172 | 3,424 | 5,942 | 23,719 | 343,257 | |||||||||||||||||||
|
Bankcard and other revolving plans |
282,206 | 4,535 | 9,237 | 958 | 296,936 | |||||||||||||||||||
|
Other |
226,828 | 111 | 4,098 | 2,156 | 233,193 | |||||||||||||||||||
|
Total consumer loans |
6,228,268 | 16,199 | 104,458 | 165,350 | 6,514,275 | 154,326 | ||||||||||||||||||
|
FDIC-supported loans |
644,192 | 45,338 | 246,010 | 35,837 | 971,377 | 37,673 | ||||||||||||||||||
|
Total |
$ | 31,934,294 | $ | 1,182,737 | $ | 2,222,035 | $ | 1,528,706 | $ | 36,867,772 | $ | 1,440,341 | ||||||||||||
| 1 |
Classified loans include those in the Substandard and Doubtful categories. |
Impaired Loans
Loans are considered impaired when, based on current information and events, it is probable that we will be unable to collect all amounts due in accordance with the contractual terms of the loan agreement, including scheduled interest payments. If a nonaccrual loan has a balance greater than $500,000 or if a loan is a troubled debt restructuring (“TDR”), we consider the loan to be impaired and estimate a specific reserve for the loan according to ASC 310. Smaller nonaccrual loans are pooled for ALLL estimation purposes. When loans are impaired, we estimate the amount of the balance that is impaired and assign a specific reserve to the loan based on the estimated present value of the loan’s future cash flows discounted at the loan’s effective interest rate, the observable market price of the loan, or the fair value of the loan’s underlying collateral less the cost to sell. When we base the impairment amount on the fair value of the loan’s underlying collateral, we generally charge-off the portion of the balance that is impaired, such that these loans do not have a specific reserve in the ALLL. Payments received on impaired loans that are accruing are recognized in interest income, according to the contractual loan agreement. Payments received on impaired loans that are on nonaccrual are not recognized in interest income, but are applied as a reduction to the principal outstanding.
118
Table of Contents
Information on impaired loans is summarized as follows at December 31, 2010:
|
Unpaid
principal balance |
Recorded investment |
Total
recorded investment |
Related
allowance |
|||||||||||||||||
| (In thousands) |
with no
allowance |
with
allowance |
||||||||||||||||||
|
Commercial lending: |
||||||||||||||||||||
|
Commercial and industrial |
$ | 293,699 | $ | 95,316 | $ | 114,959 | $ | 210,275 | $ | 38,021 | ||||||||||
|
Leasing |
– | – | – | – | – | |||||||||||||||
|
Owner occupied |
404,146 | 233,418 | 98,548 | 331,966 | 14,743 | |||||||||||||||
|
Municipal |
2,002 | – | 2,002 | 2,002 | 473 | |||||||||||||||
|
Total commercial lending |
699,847 | 328,734 | 215,509 | 544,243 | 53,237 | |||||||||||||||
|
Commercial real estate: |
||||||||||||||||||||
|
Construction and land development |
804,080 | 478,181 | 118,663 | 596,844 | 16,964 | |||||||||||||||
|
Term |
475,239 | 251,745 | 154,813 | 406,558 | 20,581 | |||||||||||||||
|
Total commercial real estate |
1,279,319 | 729,926 | 273,476 | 1,003,402 | 37,545 | |||||||||||||||
|
Consumer: |
||||||||||||||||||||
|
Home equity credit line |
4,135 | 3,152 | 630 | 3,782 | 180 | |||||||||||||||
|
1-4 family residential |
136,381 | 91,721 | 23,811 | 115,532 | 5,456 | |||||||||||||||
|
Construction and other consumer real estate |
24,931 | 16,682 | 1,369 | 18,051 | 465 | |||||||||||||||
|
Bankcard and other revolving plans |
30 | – | 30 | 30 | 30 | |||||||||||||||
|
Other |
628 | – | 533 | 533 | 204 | |||||||||||||||
|
Total consumer loans |
166,105 | 111,555 | 26,373 | 137,928 | 6,335 | |||||||||||||||
|
FDIC-supported |
547,566 | 131,680 | 48,110 | 179,790 | 6,989 | |||||||||||||||
|
Total |
$ | 2,692,837 | $ | 1,301,895 | $ | 563,468 | $ | 1,865,363 | $ | 104,106 | ||||||||||
Our recorded investment in impaired loans was $1,925 million at December 31, 2009. Impaired loans of $435 million at December 31, 2009 required an allowance of $105 million, which is included in the ALLL. Interest collected on impaired loans and included in interest income was $13.8 million in 2010, $4.0 million in 2009, and $4.7 million in 2008. The average recorded investment in impaired loans was $1,961 million in 2010, $1,374 million in 2009, and $499 million in 2008.
Modified and Restructured Loans
Loans may be modified in the normal course of business for competitive reasons or to strengthen the Company’s position. Loan modifications and restructurings may also occur when the borrower experiences financial difficulty and needs temporary or permanent relief from the original contractual terms of the loan. These modifications are structured on a loan-by-loan basis, and depending on the circumstances, may include extended payment terms, a modified interest rate, forgiveness of principal, or other concessions. When this occurs, the loan may be considered a TDR. Loans restructured at a rate equal to or greater than that of a new loan with comparable risk at the time the contract is modified may be excluded from the impairment assessment and may cease to be considered impaired loans in the calendar years subsequent to the restructuring if they are not impaired based on the modified terms. A loan on nonaccrual and restructured as a TDR will remain on nonaccrual status until the borrower has proven the ability to perform under the modified structure for a minimum of six months, and there is evidence that such payments can and are likely to continue as agreed. Performance prior to the restructuring, or significant events that coincide with the restructuring, are included in assessing whether the borrower can meet the new terms and may result in the loan being returned to accrual at the time of restructuring or after a shorter performance period. If the borrower’s ability to meet the revised payment schedule is uncertain, the loan remains classified as a nonaccrual loan.
119
Table of Contents
Concentrations of Credit Risk
We perform an ongoing analysis of our loan portfolio to evaluate whether there is any significant exposure to an individual borrower or group(s) of borrowers as a result of any concentrations of credit risk. Such credit risks (whether on- or off-balance sheet) may occur when groups of borrowers or counterparties have similar economic characteristics and are similarly affected by changes in economic or other conditions. Credit risk also includes the loss that would be recognized subsequent to the reporting date if counterparties failed to perform as contracted. Our analysis as of December 31, 2010 has concluded that no significant exposure exists from such credit risks. See Note 8 for a discussion of counterparty risk associated with the Company’s derivative transactions.
Most of our business activity is with customers located in the states of Utah, California, Texas, Arizona, Nevada, Colorado, Idaho, and Washington. The commercial loan portfolio is well diversified, consisting of nine major industry classification groupings based on codes under the North American Industry Classification System. As of December 31, 2010, the larger concentrations of risk were in the commercial, real estate, and construction portfolios. See discussion in Note 18 regarding commitments to extend additional credit.
Purchased Loans
We purchase loans in the ordinary course of business and account for them and the related interest income in accordance with ASC 310-20, Nonrefundable Fees and Other Costs , or ASC 310-30, Loans and Debt Securities Acquired with Deteriorated Credit Quality , as appropriate. Interest income is recognized based on contractual cash flows under ASC 310-20 and on expected cash flows under ASC 310-30.
On April 29, 2010, the FASB issued ASU No. 2010-18, Receivables, Effect of a Loan Modification When the Loan Is Part of a Pool That Is Accounted for as a Single Asset . This ASU clarifies that modifications of loans accounted for within a pool under ASC 310-30 would not result in the removal of those loans from the pool even if the modification of those loans would otherwise be considered a troubled debt restructuring. Loans may be removed from the pool as a result of sale, foreclosure, or other events. We adopted this new guidance beginning in the third quarter of 2010 as required. The adoption did not significantly impact our accounting for purchased loans.
During 2009, CB&T and NSB acquired failed banks from the FDIC as receiver and entered into loss sharing agreements with the FDIC for the acquired loans and foreclosed assets. The FDIC assumes 80% of credit losses up to a threshold specified for each acquisition and 95% above the threshold for a period of up to ten years. The loans acquired from the FDIC are presented separately in the Company’s balance sheet as “FDIC-supported loans.”
Upon acquisition, in accordance with applicable accounting guidance, the acquired loans were recorded at their fair value without a corresponding ALLL. The acquired foreclosed assets and subsequent real estate foreclosures were included with other real estate owned in the balance sheet and amounted to $40.0 million and $54.1 million at December 31, 2010 and 2009, respectively.
Acquired loans which have evidence of credit deterioration and for which it is probable that not all contractual payments will be collected are accounted for as loans under ASC 310-30. Certain acquired loans (including loans with revolving privileges) without evidence of credit deterioration are accounted for under ASC 310-20 and are excluded from the following tables.
120
Table of Contents
The outstanding balances of all contractually required payments and the related carrying amounts for loans under ASC 310-30 are as follows:
| December 31, | ||||||||
| (In thousands) | 2010 | 2009 | ||||||
|
Commercial lending |
$ | 413,783 | $ | 605,399 | ||||
|
Commercial real estate |
746,206 | 1,176,313 | ||||||
|
Consumer |
79,393 | 114,678 | ||||||
|
Outstanding balance |
$ | 1,239,382 | $ | 1,896,390 | ||||
|
Carrying amount |
$ | 877,857 | $ | 1,304,251 | ||||
|
ALLL 1 |
35,123 | – | ||||||
|
Carrying amount, net |
$ | 842,734 | $ | 1,304,251 | ||||
| 1 |
The ALLL was determined subsequent to acquisition and was considered for all of the periods presented. See discussion that follows regarding the “gross” presentation of this allowance amount, which is included in the overall ALLL on the balance sheet, and the amount recoverable under the FDIC loss sharing agreements, which is included in other assets. |
At the time of acquisition, we determine the loan’s contractually required payments in excess of all cash flows expected to be collected as an amount that should not be accreted (nonaccretable difference). With respect to the cash flows expected to be collected, the portion representing the excess of the loan’s expected cash flows over our initial investment (accretable yield) is accreted into interest income on a level yield basis over the remaining expected life of the loan or pool of loans. The effects of estimated prepayments are considered in estimating the expected cash flows.
Changes in the accretable yield are as follows:
| (In thousands) | 2010 | 2009 | ||||||
|
Balance at beginning of year |
$ | 161,977 | $ | – | ||||
|
Additions |
201,747 | |||||||
|
Accretion |
(99,225 | ) | (56,837 | ) | ||||
|
Reclassification from nonaccretable difference |
183,912 | |||||||
|
Disposals and other |
30,341 | 17,067 | ||||||
|
Balance at end of year |
$ | 277,005 | $ | 161,977 | ||||
Over the life of the loan or pool, we continue to estimate cash flows expected to be collected. We evaluate at the balance sheet date whether the estimated present value of these loans using the effective interest rates has decreased below their carrying value, and if so, we record a provision for loan losses. The present value of any subsequent increase in these loans’ actual or expected cash flows is used first to reverse any existing ALLL. Such reversal did not occur for the years presented herein. For any remaining increases in cash flows expected to be collected, we increase the amount of accretable yield on a prospective basis over the remaining life of the loan and recognize such increase in interest income. Additionally, with respect to FDIC-supported loans, when changes in expected cash flows occur, to the extent applicable, we adjust the amount recoverable from the FDIC (also referred to as the FDIC indemnification asset) through a charge or credit (depending on whether there was an increase or decrease in expected cash flows) to other noninterest expense.
The determination of the ALLL for FDIC-supported loans follows the same process described previously. However, this allowance is only established for credit deterioration subsequent to the date of acquisition and represents our estimate of the inherent losses in excess of the book value of FDIC-supported loans. The allowance for loan losses for loans acquired in FDIC-supported transactions is determined without giving
121
Table of Contents
consideration to the amounts recoverable through loss sharing agreements (since the loss sharing agreements are separately accounted for and thus presented “gross” on the balance sheet). The provision for loan losses is reported net of changes in the amounts recoverable under the loss sharing agreements.
Certain acquired loans within the scope of ASC 310-30 are not accounted for as previously described because the estimation of cash flows to be collected involves a high degree of uncertainty. As allowed under ASC 310-30 in these circumstances, interest income is recognized on a cash basis similar to the cost recovery methodology used for nonaccrual loans. The carrying amounts in the preceding table also include the amount for these loans. At December 31, 2010 and 2009, the net carrying amount of these loans was approximately $76.1 million and $198.4 million, respectively.
During 2010, we increased the ALLL for all FDIC-acquired loans by a charge to the provision for loan losses of $55.8 million. As described subsequently and in accordance with the loss sharing agreements, portions of these amounts are recoverable from the FDIC and comprise the FDIC indemnification asset. Charge-offs net of recoveries for 2010 were $18.1 million. No provision or charge-offs were applicable in 2009.
Changes in the FDIC indemnification asset are as follows:
| (In thousands) | 2010 | 2009 | ||||||
|
Balance at beginning of year |
$ | 293,308 | $ | – | ||||
|
Initial valuation |
– | 473,314 | ||||||
|
Amounts filed with the FDIC and collected or in process |
(95,664 | ) | (180,006 | ) | ||||
|
Net change in asset balance due to reestimation of
|
(439 | ) | – | |||||
|
Other |
(1,689 | ) | – | |||||
|
Balance at end of year |
$ | 195,516 | $ | 293,308 | ||||
The amount of the FDIC indemnification asset was initially recorded at fair value using projected cash flows based on credit adjustments for each loan class and the loss sharing reimbursement of 80% or 95%, as appropriate. The timing of the cash flows was adjusted to reflect our expectations to receive the FDIC reimbursements within the estimated loss period. Discount rates were based on U.S. Treasury rates or the AAA composite yield on investment grade bonds of similar maturity. The amount is adjusted as actual loss experience is developed and estimated losses covered under the loss sharing agreements are updated. Estimated loan losses, if any, in excess of the amounts recoverable are reflected as period expenses through the provision for loan losses.
7. ASSET SECURITIZATIONS AND OFF-BALANCE SHEET ARRANGEMENT
In June 2009, Zions Bank fully consolidated Lockhart, which previously functioned as an off-balance sheet qualifying special-purpose entity (“QSPE”) securities conduit. As of September 30, 2009, Lockhart was legally terminated. Prior to this consolidation, Zions Bank purchased securities at book value from Lockhart amounting to $678 million in 2009 and $1,145 million in 2008. Valuation losses resulting from these purchases were $187.9 million in 2009 and $13.1 million in 2008. The purchases of securities from Lockhart were made due to investment downgrades as required under a liquidity agreement between Zions Bank and Lockhart, and due to the inability of Lockhart to issue a sufficient amount of commercial paper.
The securities purchased in 2008 included $987 million which comprised the entire remaining small business loan securitizations created by Zions Bank and held by Lockhart. Upon dissolution of the securitization trusts (including a total of $170 million of related securities owned by the Parent), Zions Bank recorded $1,180 million of loans on its balance sheet including $23 million of premium.
122
Table of Contents
Certain cash flows between Zions Bank and the securitization structures were as follows in 2008:
| (In millions) | ||||
|
Purchases of loans previously securitized |
$ | (1,180 | ) | |
|
Servicing fees received |
6 | |||
|
Other cash flows received on retained interests 1 |
317 | |||
|
Total |
$ | (857 | ) | |
| 1 |
Represents total cash flows received from retained interests other than servicing fees. Other cash flows include cash from interest-only strips and cash above the minimum required level in cash collateral accounts. |
Interest income recognized on the retained interests up to the time of their purchase was $0.6 million in 2008. Servicing fee income on all securitizations was $6.1 million in 2008. These amounts are included in loan sales and servicing income in the statement of income.
Effective January 1, 2010, we adopted ASU No. 2009-16, Accounting for Transfers of Financial Assets, an amendment of FASB Statement No. 140 , (formerly SFAS No. 166). This new accounting guidance under ASC 860, Transfers and Servicing , modifies the accounting for transfers of financial assets and removes the concept of a QSPE. Because we dissolved Lockhart and our remaining activities related to transfers of financial assets are not material, adoption of this new guidance was not significant to the Company’s financial statements.
8. DERIVATIVE INSTRUMENTS AND HEDGING ACTIVITIES
We record all derivatives on the balance sheet at fair value in accordance with ASC 815, Derivatives and Hedging . Note 21 discusses the determination of fair value for derivatives, except for the Company’s total return swap which is discussed subsequently. The accounting for changes in the fair value of derivatives depends on the intended use of the derivative and the resulting designation. Derivatives used to hedge the exposure to changes in the fair value of an asset, liability, or firm commitment attributable to a particular risk, such as interest rate risk, are considered fair value hedges. Derivatives used to hedge the exposure to variability in expected future cash flows, or other types of forecasted transactions, are considered cash flow hedges. Derivatives used to manage the exposure to credit risk, which can include total return swaps, are considered credit derivatives. When put in place after purchase of the asset(s) to be protected, these derivatives generally may not be designated as accounting hedges. See discussion following regarding the total return swap.
For derivatives designated as fair value hedges, changes in the fair value of the derivative are recognized in earnings together with changes in the fair value of the related hedged item. The net amount, if any, representing hedge ineffectiveness, is reflected in earnings. In previous periods, we used fair value hedges to manage interest rate exposure to certain long-term debt. During the first quarter of 2009, we terminated all fair value hedges and are amortizing their remaining balances into earnings, as discussed subsequently.
For derivatives designated as cash flow hedges, the effective portion of changes in the fair value of the derivative are recorded in OCI and recognized in earnings when the hedged transaction affects earnings. The ineffective portion of changes in the fair value of cash flow hedges is recognized directly in earnings.
No derivatives have been designated for hedges of investments in foreign operations.
We assess the effectiveness of each hedging relationship by comparing the changes in fair value or cash flows on the derivative hedging instrument with the changes in fair value or cash flows on the designated hedged item or transaction. For derivatives not designated as accounting hedges, changes in fair value are recognized in earnings.
123
Table of Contents
Our objectives in using derivatives are to add stability to interest income or expense, to modify the duration of specific assets or liabilities as we consider advisable, to manage exposure to interest rate movements or other identified risks, and/or to directly offset derivatives sold to our customers. To accomplish these objectives, we use interest rate swaps and floors as part of our cash flow hedging strategy. These derivatives are used to hedge the variable cash flows associated with designated commercial loans.
Exposure to credit risk arises from the possibility of nonperformance by counterparties. These counterparties primarily consist of financial institutions that are well established and well capitalized. We control this credit risk through credit approvals, limits, pledges of collateral, and monitoring procedures. No losses on derivative instruments have occurred as a result of counterparty nonperformance. Nevertheless, the related credit risk is considered and measured when and where appropriate.
Interest rate swap agreements designated as cash flow hedges involve the receipt of fixed-rate amounts in exchange for variable-rate payments over the life of the agreements without exchange of the underlying principal amount. Derivatives not designated as accounting hedges, including basis swap agreements, are not speculative and are used to economically manage our exposure to interest rate movements and other identified risks, but do not meet the strict hedge accounting requirements.
124
Table of Contents
Selected information with respect to notional amounts and recorded gross fair values at December 31, 2010 and 2009, and the related gain (loss) of derivative instruments for 2010 and 2009 is summarized as follows:
| Year Ended December 31, 2010 | Year Ended December 31, 2009 | |||||||||||||||||||||||||||||||||||||||||||||||||||||||
|
Amount of derivative gain
(loss)
recognized/reclassified |
Amount of derivative gain
(loss)
recognized/reclassified |
|||||||||||||||||||||||||||||||||||||||||||||||||||||||
| December 31, 2010 | December 31, 2009 | |||||||||||||||||||||||||||||||||||||||||||||||||||||||
|
Notional
amount |
Fair value | OCI |
Reclassified
from AOCI to interest income |
Noninterest
income (expense) |
Offset
to interest expense |
Notional
amount |
Fair value | OCI |
Reclassified
from AOCI to interest income |
Noninterest
income (expense) |
Offset
to interest expense |
|||||||||||||||||||||||||||||||||||||||||||||
| (In thousands) |
Other
assets |
Other
liabilities |
Other
assets |
Other
liabilities |
||||||||||||||||||||||||||||||||||||||||||||||||||||
|
Derivatives designated as hedging instruments under ASC 815 |
||||||||||||||||||||||||||||||||||||||||||||||||||||||||
|
Asset derivatives |
||||||||||||||||||||||||||||||||||||||||||||||||||||||||
|
Cash flow hedges 1 : |
||||||||||||||||||||||||||||||||||||||||||||||||||||||||
|
Interest rate swaps |
$ | 520,000 | $ | 24,266 | $ | 310 | $ | 13,286 | $ | 63,030 | $ | 865,000 | $ | 52,539 | $ | – | $ | 11,457 | $ | 112,847 | ||||||||||||||||||||||||||||||||||||
|
Interest rate floors |
95,000 | 1,229 | – | 888 | 2,944 | 170,000 | 4,249 | – | 3,016 | 5,550 | ||||||||||||||||||||||||||||||||||||||||||||||
|
Terminated swaps and floors |
$ | 8,962 | $ | 104,706 | ||||||||||||||||||||||||||||||||||||||||||||||||||||
| 615,000 | 25,495 | 310 | 14,174 | 65,974 | 8,962 | 3 | 1,035,000 | 56,788 | – | 14,473 | 118,397 | 104,706 | 3 | |||||||||||||||||||||||||||||||||||||||||||
|
Liability derivatives |
||||||||||||||||||||||||||||||||||||||||||||||||||||||||
|
Fair value hedges: |
||||||||||||||||||||||||||||||||||||||||||||||||||||||||
|
Terminated swaps on long-term debt |
$ | 3,141 | $ | 26,170 | ||||||||||||||||||||||||||||||||||||||||||||||||||||
|
Total derivatives designated as hedging instruments |
615,000 | 25,495 | 310 | 14,174 | 65,974 | 8,962 | 3,141 | 1,035,000 | 56,788 | – | 14,473 | 118,397 | 104,706 | 26,170 | ||||||||||||||||||||||||||||||||||||||||||
|
Derivatives not designated as hedging instruments under ASC 815 |
||||||||||||||||||||||||||||||||||||||||||||||||||||||||
|
Interest rate swaps |
169,982 | 2,978 | 3,016 | (418 | ) | 210,354 | 3,966 | 4,011 | (983 | ) | ||||||||||||||||||||||||||||||||||||||||||||||
|
Interest rate swaps for customers 2 |
3,006,723 | 64,509 | 68,141 | 745 | 3,234,378 | 69,008 | 69,382 | 7,585 | ||||||||||||||||||||||||||||||||||||||||||||||||
|
Energy commodity swaps for customers 2 |
(289 | ) | 125,895 | 12,483 | 12,194 | 600 | ||||||||||||||||||||||||||||||||||||||||||||||||||
|
Basis swaps |
175,000 | 29 | – | 308 | 505,000 | 131 | 53 | 8,014 | ||||||||||||||||||||||||||||||||||||||||||||||||
|
Futures contracts |
9,529,000 | – | – | (219 | ) | 4,386,000 | – | – | 508 | |||||||||||||||||||||||||||||||||||||||||||||||
|
Options contracts |
3,015,000 | 3,576 | – | 1,934 | ||||||||||||||||||||||||||||||||||||||||||||||||||||
|
Total return swap |
1,159,686 | – | 15,925 | (22,795 | ) | |||||||||||||||||||||||||||||||||||||||||||||||||||
|
Total derivatives not designated as hedging instruments |
17,055,391 | 71,092 | 87,082 | (20,734 | ) | 8,461,627 | 85,588 | 85,640 | 15,724 | |||||||||||||||||||||||||||||||||||||||||||||||
|
Total derivatives |
$ | 17,670,391 | $ | 96,587 | $ | 87,392 | $ | 14,174 | $ | 65,974 | $ | (11,772 | ) | $ | 3,141 | $ | 9,496,627 | $ | 142,376 | $ | 85,640 | $ | 14,473 | $ | 118,397 | $ | 120,430 | $ | 26,170 | |||||||||||||||||||||||||||
Note: These tables are not intended to present at any given time the Company’s long/short position with respect to its derivative contracts.
| 1 |
Amounts recognized in OCI and reclassified from accumulated OCI (“AOCI”) represent the effective portion of the derivative gain (loss). |
| 2 |
Amounts include both the customer swaps and the offsetting derivative contracts. |
| 3 |
Amounts for 2010 and 2009 of $8,962 and $104,706, respectively, which reflect the acceleration of OCI amounts reclassified to income that related to previously terminated hedges, together with the reclassification amounts of $65,974 and $118,397, or a total of $74,936 and $223,103, respectively, are the amounts of reclassification included in the changes in OCI presented in Note 14. |
125
Table of Contents
At December 31, the fair values of derivative assets and liabilities were reduced (increased) by net credit valuation adjustments of $3.5 million and $(0.3) million in 2010, and $2.0 million and $1.6 million in 2009, respectively. These adjustments are required to reflect both our own nonperformance risk and the respective counterparty’s nonperformance risk.
Fair value amounts recognized for the right to reclaim cash collateral (a receivable) or the obligation to return cash collateral (a payable) have been offset against recognized fair value amounts of derivatives executed with the same counterparty under a master netting arrangement. In the balance sheet, cash collateral was used to reduce recorded amounts of derivative assets and liabilities by $0 and $0.8 million at December 31, 2010, and $8.0 million and $14.0 million at December 31, 2009, respectively.
We offer to our customers interest rate swaps and, through the third quarter of 2010, energy commodity swaps to assist them in managing their exposure to fluctuating interest rates and energy prices. Upon issuance, all of these customer swaps are immediately “hedged” by offsetting derivative contracts, such that the Company minimizes its net risk exposure resulting from such transactions. Fee income from customer swaps is included in other service charges, commissions and fees. As with other derivative instruments, we have credit risk for any nonperformance by counterparties.
Futures and options contracts primarily consist of: (1) Eurodollar futures contracts that allow us to extend the duration of certain Federal Reserve account balances. These contracts reference the 90-day LIBOR rate. Options contracts are used to economically hedge certain rate exposures of the underlying Eurodollar futures contracts. (2) Highly liquid federal funds futures contracts that are traded to manage interest rate risk on certain CDO securities. These identified mixed straddle contracts are executed to convert primarily three- and six-month fixed cash flows into cash flows that vary with daily fluctuations in interest rates. The accounts for both types of futures contracts are cash settled daily.
The remaining balances of any derivative instruments terminated prior to maturity, including amounts in AOCI for swap hedges, are accreted or amortized to interest income or expense over the period to their previously stated maturity dates.
Amounts in AOCI are reclassified to interest income as interest is earned on variable rate loans and as amounts for terminated hedges are accreted or amortized to earnings. For the 12 months following December 31, 2010, we estimate that additional projected gains of $22 million and accretion/amortization of $21 million, or a total of $43 million, will be reclassified.
Total Return Swap
On July 28, 2010, we entered into a total return swap and related interest rate swaps (“TRS”) with Deutsche Bank AG (“DB”) relating to a portfolio of $1.16 billion notional amount of our bank and insurance trust preferred CDOs. As a result of the TRS, DB assumed all of the credit risk of this CDO portfolio, providing timely payment of all scheduled payments of interest and principal when contractually due to the Company (without regard to acceleration or deferral events). Contractual due dates for principal are at each individual security’s maturity, which ranges from 2030 to 2042. We can cancel the TRS quarterly after the first year and remove individual securities on or after the end of the sixth year. Additionally, with the consent of DB, we can transfer the TRS to a third party in part or in whole. DB cannot cancel the TRS except in the event of nonperformance by the Company and under certain other circumstances customary to ISDA swap agreements.
This transfer of credit risk reduced the Company’s regulatory capital risk weighting for these investments. The underlying securities were originally rated primarily A and BBB but later downgraded, and carry some of the highest risk-weightings of the securities in the Company’s portfolio. As a result, the transaction reduced regulatory risk-weighted assets and improved the Company’s risk-based capital ratios.
126
Table of Contents
This transaction did not qualify for hedge accounting and did not change the accounting for the underlying securities, including the quarterly analysis of OTTI and OCI. As a result, future potential OTTI, if any, associated with the underlying securities may not be offset by any valuation adjustment on the swap in the quarter in which OTTI is recognized and OTTI changes could result in reductions in our regulatory capital ratios, which could be material.
During the third quarter of 2010, we recorded a negative initial value for the TRS of $22.8 million, which is included in fair value and nonhedge derivative income (loss), and structuring costs of $11.6 million, which are included in other noninterest expense. The negative initial value is approximately equal to the first-year fees we will incur for the TRS (that is, during the period we are unable to cancel the transaction). The fair value of the TRS derivative liability was $15.9 million at December 31, 2010.
Both the fair value of the securities and the fair value of the TRS are dependent upon the projected credit-adjusted cash flows of the securities. Absent major changes in these projected cash flows, we expect the value of the TRS to become less negative compared to the negative initial value as the period that we are unable to cancel the transaction shortens.
After the first year of the transaction, we expect to incur subsequent net quarterly costs of approximately $5.3 million under the TRS, including related interest rate swaps and scheduled payments of interest on the underlying CDOs, as long as the TRS remains in place for this CDO portfolio. The payments under the transaction generally include or arise from (1) payments by DB to the Company of all scheduled payments of interest and principal when contractually due to the Company, and payment by the Company to DB of a fixed quarterly or semiannual guarantee fee based on the notional amount of the CDO portfolio in the transaction; (2) an interest rate swap pursuant to which DB pays the Company a fixed interest rate and the Company pays to DB a floating interest rate (generally three-month LIBOR) on the notional amount of the CDO portfolio in the transaction; and (3) a third swap between the Company and DB included in the transaction in order to hedge each party’s exposure to change in interest rates over the life of the transaction. In addition, under the terms of the transaction, payments from the CDOs will continue to be made to the Company and retained by the Company; this recovery amount, plus assumed reinvestment earnings at an imputed interest rate, generally three-month LIBOR, will offset principal payments that DB would otherwise be required to make.
The net result of the payment streams described in the preceding paragraph is the approximate $5.3 million expense per quarter noted previously. Our estimated quarterly expense amount would be impacted by, among other things, changes in the composition of the CDO portfolio included in the transaction and changes over time in the forward LIBOR rate curve. Payments under the third swap began on the second payment date of each covered security. If the forward interest rates projected in mid-July 2010 occur, no net payment will be due by either party under this third swap. If rates increase more than projected, the payment will be to the Company from DB and if less than projected the payment will be the reverse. The Company’s costs are also subject to adjustment in the event of future changes in regulatory requirements applicable to DB, if we do not then elect to terminate the transaction. Should such cost increases occur in the first year, we may cancel the transaction with no payment due beyond the liability already incurred. Termination by the Company for such regulatory changes applicable to DB after year one will result in no payment by the Company .
127
Table of Contents
At December 31, 2010, we completed a valuation process which resulted in an estimated fair value for the TRS under Level 3. The process utilized valuation inputs from two sources:
| 1) | The Company built on its fair valuation process for the underlying CDO portfolio and utilized those same projected cash flows to quantify the extent and timing of payments to be received from the Trustee related to each CDO and in aggregate. These cash flows, plus assumed reinvestment earnings constitute an estimated recovery amount, the extent of which will offset DB’s required principal payments. The internal valuation utilized the Company’s estimate of each of the cash flows to/from each leg of the derivative and from each covered CDO through maturity and also through the first date on which we may terminate. For valuation purposes, we assumed that a market participant would cancel the TRS at the first opportunity if the TRS did not have a positive value based on the best estimates of cash flows through maturity. Consequently, the fair value approximated the amount of required payments up to the earliest termination date. |
| 2) | A valuation from a market participant in possession of all relevant terms and costs of the TRS structure. |
We considered the observable input or inputs from market participants as well as the results of our internal modeling to estimate the fair value of the TRS. We expect to continue the use of this methodology in subsequent periods.
9. PREMISES AND EQUIPMENT
Premises and equipment are summarized as follows:
| December 31, | ||||||||
| (In thousands) | 2010 | 2009 | ||||||
|
Land |
$ | 191,612 | $ | 185,806 | ||||
|
Buildings |
475,830 | 445,632 | ||||||
|
Furniture and equipment |
581,464 | 586,648 | ||||||
|
Leasehold improvements |
119,030 | 115,096 | ||||||
|
Total |
1,367,936 | 1,333,182 | ||||||
|
Less accumulated depreciation and amortization |
646,951 | 622,648 | ||||||
|
Net book value |
$ | 720,985 | $ | 710,534 | ||||
10. GOODWILL AND OTHER INTANGIBLE ASSETS
Core deposit and other intangible assets and related accumulated amortization are as follows at December 31:
|
Gross
carrying amount |
Accumulated
amortization |
Net carrying
amount |
||||||||||||||||||||||
| (In thousands) | 2010 | 2009 | 2010 | 2009 | 2010 | 2009 | ||||||||||||||||||
|
Core deposit intangibles |
$ | 215,138 | $ | 225,766 | $ | (135,632 | ) | $ | (123,618 | ) | $ | 79,506 | $ | 102,148 | ||||||||||
|
Customer relationships and other intangibles |
33,974 | 33,974 | (25,582 | ) | (22,706 | ) | 8,392 | 11,268 | ||||||||||||||||
| $ | 249,112 | $ | 259,740 | $ | (161,214 | ) | $ | (146,324 | ) | $ | 87,898 | $ | 113,416 | |||||||||||
The amount of amortization expense of core deposit and other intangible assets is separately reflected in the statement of income. In 2009, this amortization expense included approximately $2.6 million for the impairment of certain amounts for customer relationships and other intangibles.
128
Table of Contents
Estimated amortization expense for core deposit and other intangible assets is as follows for the five years succeeding December 31, 2010:
| (In thousands) | ||||
|
2011 |
$ | 20,014 | ||
|
2012 |
16,962 | |||
|
2013 |
14,553 | |||
|
2014 |
11,105 | |||
|
2015 |
9,380 | |||
Changes in the carrying amount of goodwill by operating segment are as follows:
| (In thousands) |
Zions
Bank |
CB&T | Amegy | NBA | NSB | Vectra | Other |
Consolidated
Company |
||||||||||||||||||||||||
|
Balance as of December 31, 2008 |
$ | 19,514 | $ | 379,024 | $ | 1,248,950 | $ | – | $ | – | $ | – | $ | 3,889 | $ | 1,651,377 | ||||||||||||||||
|
Impairment losses |
– | – | (633,327 | ) | – | – | – | (2,889 | ) | (636,216 | ) | |||||||||||||||||||||
|
Balance as of December 31, 2009 |
19,514 | 379,024 | 615,623 | – | – | – | 1,000 | 1,015,161 | ||||||||||||||||||||||||
|
Impairment losses |
– | – | – | – | – | – | – | – | ||||||||||||||||||||||||
|
Balance as of December 31, 2010 |
$ | 19,514 | $ | 379,024 | $ | 615,623 | $ | – | $ | – | $ | – | $ | 1,000 | $ | 1,015,161 | ||||||||||||||||
Amounts for impairment losses reflect our Company-wide annual impairment testing conducted as of October 1 of each year and updated on a more frequent basis when events or circumstances indicate that impairment could have taken place. In 2009, the Amegy goodwill impairment resulted from an evaluation performed for Amegy and CB&T that was completed in February 2009 as a result of the Company’s performance deterioration and declines in bank market values from December 31, 2008. Impairment losses in the other segment for 2009 related primarily to Welman.
The amounts of the impairment losses were determined based on the calculation process specified in ASC 350, which compares carrying value to the estimated fair values of assets and liabilities. These fair values were estimated with the assistance of independent valuation consultants utilizing the provisions of ASC 820. The estimation process took into account both market value and transaction value approaches including management estimates of projected discounted cash flows. Where applicable, we used recent market valuations and transactions from banks similar in size, operations and geography to our subsidiary banks. The analysis considered the continued market deterioration and weaker economic outlook for the applicable states.
11. DEPOSITS
At December 31, 2010, the scheduled maturities of all time deposits were as follows:
| (In thousands) | ||||
|
2011 |
$ | 3,655,080 | ||
|
2012 |
359,969 | |||
|
2013 |
199,690 | |||
|
2014 |
135,004 | |||
|
2015 |
118,523 | |||
|
Thereafter |
2,435 | |||
| $ | 4,470,701 | |||
129
Table of Contents
At December 31, 2010, the contractual maturities of domestic time deposits with a denomination of $100,000 and over were as follows: $626 million in 3 months or less, $497 million over 3 months through 6 months, $714 million over 6 months through 12 months, and $395 million over 12 months.
Domestic time deposits $100,000 and over were $2.2 billion and $3.1 billion at December 31, 2010 and 2009, respectively. Foreign time deposits $100,000 and over were $297 million and $276 million at December 31, 2010 and 2009, respectively.
Deposit overdrafts reclassified as loan balances were $39 million and $19 million at December 31, 2010 and 2009, respectively.
12. SHORT-TERM BORROWINGS
Selected information for certain short-term borrowings is as follows:
| (Dollars in thousands) | 2010 | 2009 | 2008 | |||||||||
|
Federal funds purchased: |
||||||||||||
|
Average amount outstanding |
$ | 465,661 | $ | 1,290,140 | $ | 1,768,782 | ||||||
|
Weighted average rate |
0.22 | % | 0.30 | % | 2.20 | % | ||||||
|
Highest month-end balance |
$ | 814,264 | $ | 1,659,303 | $ | 2,379,055 | ||||||
|
Year-end balance |
310,727 | 208,669 | 965,835 | |||||||||
|
Weighted average rate on outstandings at year-end |
0.15 | % | 0.21 | % | 0.33 | % | ||||||
|
Security repurchase agreements: |
||||||||||||
|
Average amount outstanding |
$ | 454,288 | $ | 632,756 | $ | 964,801 | ||||||
|
Weighted average rate |
0.08 | % | 0.30 | % | 1.50 | % | ||||||
|
Highest month-end balance |
$ | 615,170 | $ | 784,182 | $ | 1,218,507 | ||||||
|
Year-end balance |
411,531 | 577,346 | 899,751 | |||||||||
|
Weighted average rate on outstandings at year-end |
0.07 | % | 0.16 | % | 0.41 | % | ||||||
|
Federal funds purchased and security repurchase
|
$ | 722,258 | $ | 786,015 | $ | 1,865,586 | ||||||
These short-term borrowings generally mature in less than 30 days. Our participation in security repurchase agreements is on an overnight or term basis (i.e., 30 or 60 days). Certain overnight agreements are performed with sweep accounts in conjunction with a master repurchase agreement. In this case, securities under our control are pledged for and interest is paid on the collected balance of the customers’ accounts. For term repurchase agreements, securities are transferred to the applicable counterparty. The counterparty, in certain instances, is contractually entitled to sell or repledge securities accepted as collateral. As of December 31, 2010, overnight security repurchase agreements were $373 million and term security repurchase agreements were $39 million.
Other short-term borrowings are summarized as follows:
| December 31, | ||||||||
| (In thousands) | 2010 | 2009 | ||||||
|
Senior medium-term notes |
$ | 160,636 | $ | 117,134 | ||||
|
Commercial paper |
2,647 | 1,084 | ||||||
|
Other |
3,111 | 3,055 | ||||||
| $ | 166,394 | $ | 121,273 | |||||
130
Table of Contents
The unsecured senior medium-term notes mature at various dates through December 2011 at interest rates ranging from 3.00% to 5.75% at December 31, 2010. See also Note 13.
Our subsidiary banks may borrow from the FHLB under their lines of credit that are secured under blanket pledge arrangements. The subsidiary banks maintain unencumbered collateral with carrying amounts adjusted for the types of collateral pledged, equal to at least 100% of the outstanding advances. At December 31, 2010, the amount available for FHLB advances was approximately $8.8 billion. At December 31, 2010, no short-term FHLB advances were outstanding.
Our subsidiary banks also borrow from the Federal Reserve through the Term Auction Facility. Amounts that can be borrowed are based upon the amount of collateral pledged to a Federal Reserve Bank. At December 31, 2010, the amount available for additional Federal Reserve borrowings was approximately $3.7 billion.
Long-term debt is summarized as follows:
| December 31, | ||||||||
| (In thousands) | 2010 | 2009 | ||||||
|
Junior subordinated debentures related to trust preferred securities |
$ | 461,858 | $ | 461,858 | ||||
|
Convertible subordinated notes |
417,643 | 530,186 | ||||||
|
Subordinated notes |
223,057 | 288,394 | ||||||
|
Senior medium-term notes |
819,174 | 736,309 | ||||||
|
FHLB advances |
20,132 | 15,722 | ||||||
|
Capital lease obligations and other |
758 | 473 | ||||||
| $ | 1,942,622 | $ | 2,032,942 | |||||
The preceding amounts represent the par value of the debt adjusted for any unamortized premium or discount or other basis adjustments, including the value of associated hedges.
131
Table of Contents
Trust Preferred Securities
Junior subordinated debentures related to trust preferred securities primarily include debentures issued to Zions Capital Trust B (“ZCTB”), Amegy Statutory Trusts I, II and III (“Amegy Trust I, II or III”), and Stockmen’s Statutory Trusts II and III (“Stockmen’s Trust II or III”) as follows at December 31, 2010:
| (Dollars in thousands) | Balance |
Interest
rate |
Maturity | |||||||||
|
ZCTB |
$ | 293,815 | 8.00 | % | Sep 2032 | |||||||
|
Amegy Trust I |
51,547 | 3mL+2.85 | % 1 | Dec 2033 | ||||||||
| (3.15 | %) | |||||||||||
|
Amegy Trust II |
36,083 | 3mL+1.90 | % 1 | Oct 2034 | ||||||||
| (2.19 | %) | |||||||||||
|
Amegy Trust III |
61,856 | 3mL+1.78 | % 1 | Dec 2034 | ||||||||
| (2.08 | %) | |||||||||||
|
Stockmen’s Trust II |
7,732 | 3mL+3.15 | % 1 | Mar 2033 | ||||||||
| (3.45 | %) | |||||||||||
|
Stockmen’s Trust III |
7,732 | 3mL+2.89 | % 1 | Mar 2034 | ||||||||
| (3.19 | %) | |||||||||||
|
Intercontinental Statutory Trust I |
3,093 | 3mL+2.85 | % 1 | Mar 2034 | ||||||||
| (3.15 | %) | |||||||||||
| $ | 461,858 | |||||||||||
| 1 |
Designation of “3mL” is three-month LIBOR (London Interbank Offer Rate); effective interest rate at the beginning of the accrual period commencing on or before December 31, 2010 is shown in parenthesis. |
The junior subordinated debentures are issued or have been assumed by the Parent or Amegy. Each series of junior subordinated debentures was issued to and is held by a trust, which has issued a corresponding series of trust preferred security obligations. The trust obligations are in the form of capital securities subject to mandatory redemption upon repayment of the junior subordinated debentures by the Parent or Amegy, as the case may be. The sole assets of the trusts are the junior subordinated debentures.
Interest distributions are made quarterly at the same rates earned by the trusts on the junior subordinated debentures; however, we may defer the payment of interest on the junior subordinated debentures. Early redemption is currently possible on all of the debentures and requires the approval of banking regulators.
The debentures for ZCTB are direct and unsecured obligations of the Parent and are subordinate to other indebtedness and general creditors. The debentures for Amegy Trust I, II and III are direct and unsecured obligations of Amegy and are subordinate to other indebtedness and general creditors. The debentures for Stockmen’s Trust II and III are unsecured obligations of Stockmen’s assumed by the Parent in connection with the acquisition of Stockmen’s by NBA. The Parent has unconditionally guaranteed the obligations of ZCTB with respect to its trust preferred securities to the extent set forth in the applicable guarantee agreement. Amegy has unconditionally guaranteed the obligations of Amegy Trust I, II and III with respect to their respective series of trust preferred securities to the extent set forth in the applicable guarantee agreements. The Parent has assumed Stockmen’s unconditional guarantees of the obligations of Stockmen’s Trust II and III with respect to their respective series of trust preferred securities to the extent set forth in the applicable guarantee agreements.
132
Table of Contents
Subordinated Notes and Subordinated Debt Modification
Subordinated notes consist of the following at December 31, 2010:
| (Dollars in thousands) |
Convertible
subordinated notes |
Subordinated notes | ||||||||||||||||||
|
Interest rate |
Balance |
Par
amount |
Balance |
Par
amount |
Maturity | |||||||||||||||
|
5.65% |
$ | 115,679 | $ | 213,691 | $ | 32,985 | $ | 30,173 | May 2014 | |||||||||||
|
6.00% |
170,003 | 333,126 | 46,871 | 42,303 | Sep 2015 | |||||||||||||||
|
5.50% |
131,961 | 256,657 | 68,201 | 62,078 | Nov 2015 | |||||||||||||||
|
3mL+1.25% 1 (1.56%) |
75,000 | 75,000 | 2 | Sep 2014 | ||||||||||||||||
| $ | 417,643 | $ | 803,474 | $ | 223,057 | $ | 209,554 | |||||||||||||
| 1 |
Designation of “3mL” is three-month LIBOR; effective interest rate at the beginning of the accrual period commencing on or before December 31, 2010 is shown in parenthesis. |
| 2 |
Issued by Amegy. |
These notes are unsecured and are not redeemable prior to maturity. Interest is payable semiannually.
In June and December 2009, we exchanged a total of approximately $190.1 million par value of the subordinated notes for new notes with the same terms. The remaining $1,210.0 million par value of the subordinated notes was modified to permit conversion on a par-for-par basis into either the Company’s Series A or Series C preferred stock. The carrying value of the subordinated notes included associated terminated fair value hedges. Holders of the convertible subordinated debt are allowed to convert on the interest payment dates of the debt. Net of issuance costs and debt discount on the previous debt, the total pretax gain recognized in the statement of income from these subordinated debt modifications was $508.9 million. The gain was calculated as the difference between the fair value of the modified convertible subordinated notes and the carrying value of the extinguished debt on the transaction dates.
In connection with these subordinated debt modifications, we also recorded the intrinsic value of the beneficial conversion feature directly in common stock, as discussed in Note 14.
Subordinated notes converted to preferred stock amounted to $343.0 million in 2010 and $63.4 million in 2009.
The convertible debt discount recorded in connection with the subordinated debt modifications is amortized to interest expense using the interest method over the remaining terms of the convertible subordinated notes. When holders of the convertible subordinated notes convert to preferred stock, the rate of amortization is accelerated by immediately expensing any unamortized discount associated with the converted debt. Amortization of the convertible debt discount is summarized as follows:
| (In thousands) | 2010 | 2009 | ||||||
|
Balance at beginning of year |
$ | 616,240 | $ | – | ||||
|
Convertible debt discount from debt modifications |
678,924 | |||||||
|
Discount amortization on convertible subordinated debt |
(57,963 | ) | (26,955 | ) | ||||
|
Accelerated discount amortization on convertible subordinated debt |
(172,446 | ) | (35,729 | ) | ||||
|
Total amortization |
(230,409 | ) | (62,684 | ) | ||||
|
Balance at end of year |
$ | 385,831 | $ | 616,240 | ||||
133
Table of Contents
During the first quarter of 2009, as discussed in Note 8, we terminated all fair value hedges that had been used for the subordinated notes. The remaining value of $13.8 million and $23.7 million at December 31, 2010 and 2009, respectively, is amortized as a reduction of interest expense over the periods to the previously stated maturity dates of the notes.
In March 2010, we exchanged $55.6 million of nonconvertible subordinated debt into shares of the Company’s common stock, as discussed further in Note 14. The net pretax gain on subordinated debt exchange included in the statement of income was approximately $14.5 million, and represented the difference between the carrying value of the debt exchanged and the fair value of the common stock issued, net of commissions and fees.
Senior Medium-term Notes
Senior medium-term notes consist of the following at December 31, 2010:
| (Dollars in thousands) | ||||||||||||||
|
Interest rate |
Balance | Par amount |
Interest
payments |
Maturity | ||||||||||
|
3mL+0.37% (0.66%) |
$ | 254,553 | $ | 254,893 | Quarterly | Jun 2012 | ||||||||
|
7.75% |
450,685 | 499,655 | Semiannually | Sep 2014 | ||||||||||
|
4.00% - 6.00% |
113,936 | 114,013 | Semiannually | Aug 2011 - Feb 2013 | ||||||||||
| $ | 819,174 | |||||||||||||
| 1 |
Designation of “3mL” is three-month LIBOR; effective interest rate at the beginning of the accrual period commencing on or before December 31, 2010 is shown in parenthesis. |
These notes are unsecured and are not redeemable prior to maturity. The variable rate notes are guaranteed under the FDIC’s Temporary Liquidity Guarantee Program that became effective in November 2008. The remaining notes were issued under a shelf registration filed with the SEC. The $113.9 million of notes were sold via the Company’s online auction process and direct sales.
FHLB Advances
The FHLB advances were issued by Amegy with maturities from June 2014 to October 2030, at interest rates from 2.81% to 6.98%. The weighted average interest rate on advances outstanding was 4.6% and 5.0% at December 31, 2010 and 2009, respectively.
Interest Expense and Maturities
Interest expense on long-term debt included in the statement of income was reduced by $3.1 million in 2010, $26.2 million in 2009, and $35.1 million in 2008 as a result of the associated hedges.
Maturities on long-term debt are as follows for the years succeeding December 31, 2010:
| (In thousands) | Consolidated | Parent only | ||||||
|
2011 |
$ | 8,067 | $ | 8,030 | ||||
|
2012 |
342,070 | 342,030 | ||||||
|
2013 |
18,226 | 18,184 | ||||||
|
2014 |
671,878 | 596,770 | ||||||
|
2015 |
406,132 | 406,066 | ||||||
|
Thereafter |
482,454 | 309,278 | ||||||
| $ | 1,928,827 | $ | 1,680,358 | |||||
134
Table of Contents
These maturities do not include the associated hedges. The $309.3 million of Parent only maturities at December 31, 2010 are for the junior subordinated debentures payable to ZCTB and Stockmen’s Trust II and III after 2015.
Subsequent Event
As of February 14, 2011, holders of approximately $85.8 million of subordinated convertible notes elected to convert their debt into depositary shares of the Company’s preferred stock. This anticipated conversion will add 20 shares of Series A and 85,829 shares of Series C to the Company’s preferred stock.
14. SHAREHOLDERS’ EQUITY
Preferred Stock
Preferred stock is without par value and has a liquidation preference of $1,000 per share. In May 2010, Company shareholders approved an increase in the number of authorized preferred shares from 3,000,000 to 4,400,000.
In general, preferred shareholders may receive asset distributions before common shareholders; however, preferred shareholders have only limited voting rights generally with respect to certain provisions of the preferred stock, the issuance of senior preferred stock, and the election of directors. Preferred stock dividends reduce earnings available to common shareholders and are paid quarterly. Redemption of the preferred stock is at the Company’s option after the expiration of any applicable redemption restrictions. The redemption amount is computed at the per share liquidation preference plus any declared but unpaid dividends. Additional redemption provisions for the Series D preferred stock are discussed subsequently.
The Series A, C and E shares were issued in the form of depositary shares with each depositary share representing a 1/40 th ownership interest in a share of the preferred stock. Dividend payments are made on the 15 th day of March, June, September, and December. The shares are registered with the SEC.
Preferred stock is summarized as follows:
| Carrying value | ||||||||||||||||||||||
|
(Dollar amounts in thousands) |
Rate |
Earliest
redemption date |
Shares at
December 31, 2010 |
December 31, | ||||||||||||||||||
| Authorized | Outstanding | 2010 | 2009 | |||||||||||||||||||
|
Series A |
Floating | December 15, 2011 | 140,000 | 59,440 | $ | 59,457 | $ | 67,952 | ||||||||||||||
|
Series C |
9.5% | September 15, 2013 | 1,400,000 | 453,237 | 521,051 | 121,386 | ||||||||||||||||
|
Series D, TARP Capital |
||||||||||||||||||||||
|
Purchase Program |
5.0% | November 15, 2011 | 1,400,000 | 1,400,000 | 1,333,664 | 1,313,446 | ||||||||||||||||
|
Series E |
11.0% | June 15, 2012 | 250,000 | 142,500 | 142,500 | – | ||||||||||||||||
| $ | 2,056,672 | $ | 1,502,784 | |||||||||||||||||||
The Series A Floating-Rate Non-Cumulative Perpetual Preferred Stock was sold through underwriters. Dividends are computed at an annual rate equal to the greater of three-month LIBOR plus 0.52%, or 4.0%.
The Series C 9.50% Non-Cumulative Perpetual Preferred Stock offering was completed in July 2008. It was sold for $46.9 million primarily by Zions Direct, Inc., the Company’s broker/dealer subsidiary, via an online auction process and by direct sales.
The Series D Fixed-Rate Cumulative Perpetual Preferred Stock was issued in November 2008 to the U.S. Department of the Treasury for $1.4 billion. The Emergency Economic Stabilization Act of 2008 authorized the
135
Table of Contents
U.S. Treasury to appropriate funds to eligible financial institutions participating in the Troubled Asset Relief Program (“TARP”) Capital Purchase Program. The capital investment includes the issuance of preferred shares of the Company and a warrant to purchase common shares pursuant to a Letter Agreement and a Securities Purchase agreement (collectively “the Agreement”). The dividend rate of 5% increases to 9% after the first five years. Dividend payments are made on the 15 th day of February, May, August, and November. The warrant allows the U.S. Treasury to purchase up to 5,789,909 shares of the Company’s common stock exercisable over a 10-year period at a price per share of $36.27. The preferred shares and the warrant qualify for Tier 1 regulatory capital. The Agreement subjects the Company to certain restrictions and conditions including those related to common dividends, share repurchases, executive compensation, and corporate governance. In addition, the Series D TARP preferred stock must be redeemed in full before any other preferred stock may be redeemed. Further, redemption of the Series D TARP preferred stock is subject to regulatory approval.
We recorded the total $1.4 billion of the Series D preferred shares and the warrant at their relative fair values of $1,292.2 million and $107.8 million, respectively. The difference from the par amount of the preferred shares is accreted to preferred stock over five years using the interest method with a corresponding adjustment to preferred dividends. This accretion amounted to $20.2 million in 2010, $18.6 million in 2009, and $2.6 million in 2008.
The Series E Fixed-Rate Resettable Non-Cumulative Perpetual Preferred Stock offering was sold for $142.5 million in June 2010 through underwriters, including Zions Direct, Inc. Associated commissions and fees amounted to $3.8 million. The initial dividend rate of 11% is resettable beginning June 15, 2012 and every two years thereafter at the then current two-year U.S. Treasury rate, plus 10.22%.
In connection with the subordinated debt modifications discussed in Note 13, we recorded $202.8 million after-tax directly in common stock for the intrinsic value of the beneficial conversion feature of the modified subordinated debt. The Company has “no par” common stock and all additional paid-in capital transactions are recorded in common stock. The intrinsic value of the beneficial conversion feature was calculated as the difference between the fair value of the preferred stock into which the debt is convertible (multiplied by the number of related shares) and the fair value of the modified convertible debt on the commitment dates. The commitment date is defined as the date when both parties are bound to the terms of the transaction, which was the expiration of the exchange offer and corresponded with the transaction date. At the time of each conversion of the convertible debt to preferred stock, a proportional amount of the intrinsic value of the beneficial conversion feature is transferred from common stock to preferred stock.
As discussed in Note 13, approximately $343.0 million in 2010 and $63.4 million in 2009 of convertible subordinated notes were converted into preferred stock. As a result, approximately $56.8 million in 2010 and $11.0 million in 2009 of the intrinsic value of the beneficial conversion feature was transferred from common stock to preferred stock. The remaining balance included in common stock was approximately $135.0 million and $191.8 million at December 31, 2010 and 2009, respectively.
In June 2009, through a tender offer, we purchased 4,020,435 depositary shares of Series A preferred stock at a price of $11.50 per depositary share, or an aggregate amount of $46.4 million including accrued dividends. At a $25 per depositary share liquidation preference, the purchase reduced the $240 million carrying value of the Series A preferred stock by approximately $100.5 million. Net of related costs, the preferred stock redemption resulted in a $54.0 million increase to common shareholders’ equity. The purchase price of $11.50 per depositary share was determined based on a modified “Dutch auction” pricing mechanism.
Common Stock
We issued $633.3 million in 2010 and $472.7 million in 2009 of new common stock under common equity distribution agreements. The issuances consisted of approximately 29.6 million shares in 2010 at an average price of $21.43 and 31.7 million shares in 2009 at an average price of $14.89 per share. Net of commissions and fees, these issuances added $623.5 million in 2010 and $464.1 million in 2009 to common stock.
136
Table of Contents
During 2010, we sold a total of 29.3 million common stock warrants for $221.8 million. The sales consisted of 7.0 million warrants for $36.8 million, or $5.25 per warrant, in September 2010, and 22.3 million for $185.0 million, or $8.3028 per warrant, in June 2010. Each of the warrants can be exercised for a share of common stock at an initial price of $36.63 through May 22, 2020. Net of commissions and fees, the total issuance added $214.6 million to common stock.
In June 2010, $8.6 million of Series A preferred stock was exchanged for 224,903 shares of the Company’s common stock at the then fair value of $23.82 per share. The result of the $5.5 million of common stock issued in this preferred stock redemption increased retained earnings by approximately $3.1 million.
In March 2010, we issued approximately 2.2 million shares of common stock, or $46.9 million net of commissions and fees, in exchange for $55.6 million of nonconvertible subordinated debt. The number of shares issued was determined using an exchange ratio based on a common stock price of $22.5433 per share. This per share amount was calculated based on the defined weighted average price of our common stock for each of the five consecutive days ending on the March 24, 2010 expiration date of our exchange offer.
In December 2009, we completed the exchange of approximately $71.5 million of Series A preferred stock into approximately 2.8 million shares of common stock. The number of shares was determined based on an exchange ratio calculation specified in the exchange offer. Among other things, the calculation of the exchange ratio included a defined weighted average price of our common shares for each of the five consecutive days ending on the December 17, 2009 expiration date, or $13.2056 per share. Approximately $32.4 million, which is net of $0.7 million of issuance costs, was included in retained earnings as the difference between the $37.2 million fair value of the common shares on the date of exchange plus the $1.2 million original issuance costs of the preferred stock and the carrying value of the preferred stock exchanged.
In September 2008, we issued $250 million of new common stock consisting of approximately 7.2 million shares at an average price of $34.75 per share. Net of commissions and fees, this issuance added $244.9 million to common stock.
137
Table of Contents
Accumulated Other Comprehensive Income
Changes in accumulated other comprehensive income (loss) are summarized as follows:
| (In thousands) |
Net unrealized
gains (losses) on investments, retained interests and other |
Net
unrealized gains (losses) on derivative instruments |
Pension
and post- retirement |
Total | ||||||||||||
|
Balance at December 31, 2007 |
$ | (108,766 | ) | $ | 65,213 | $ | (15,282 | ) | $ | (58,835 | ) | |||||
|
Cumulative effect of change in accounting principle, adoption of ASC 825 for fair value option |
11,471 | 11,471 | ||||||||||||||
|
Other comprehensive income (loss), net of tax: |
||||||||||||||||
|
Net realized and unrealized holding losses,net of income tax benefit of $215,384 |
(333,095 | ) | (333,095 | ) | ||||||||||||
|
Foreign currency translation |
(5 | ) | (5 | ) | ||||||||||||
|
Reclassification for net losses included in earnings, net of income tax benefit of $119,597 |
181,524 | 181,524 | ||||||||||||||
|
Net unrealized gains, net of reclassification to earnings of $65,862 and income tax expense of $82,653 |
131,443 | 131,443 | ||||||||||||||
|
Pension and postretirement, net of income tax benefit of $20,401 |
(31,461 | ) | (31,461 | ) | ||||||||||||
|
Other comprehensive income (loss) |
(151,576 | ) | 131,443 | (31,461 | ) | (51,594 | ) | |||||||||
|
Balance at December 31, 2008 |
(248,871 | ) | 196,656 | (46,743 | ) | (98,958 | ) | |||||||||
|
Cumulative effect of change in accounting principle, adoption of new OTTI guidance in ASC 320 |
(137,462 | ) | (137,462 | ) | ||||||||||||
|
Other comprehensive income (loss), net of tax: |
||||||||||||||||
|
Net realized and unrealized holding losses net of income tax benefit of $40,454 |
(65,037 | ) | (65,037 | ) | ||||||||||||
|
Reclassification for net losses included in earnings, net of income tax benefit of $102,284 |
162,206 | 162,206 | ||||||||||||||
|
Noncredit-related impairment losses on securities not expected to be sold, net of income tax benefit of $115,159 |
(174,244 | ) | (174,244 | ) | ||||||||||||
|
Accretion of securities with noncredit-related impairment losses not expected to be sold, net of income tax expense of $673 |
996 | 996 | ||||||||||||||
|
Net unrealized losses, net of reclassification to earnings of $223,103 and income tax benefit of $80,033 |
(128,597 | ) | (128,597 | ) | ||||||||||||
|
Pension and postretirement, net of income tax expense of $2,694 |
4,197 | 4,197 | ||||||||||||||
|
Other comprehensive income (loss) |
(76,079 | ) | (128,597 | ) | 4,197 | (200,479 | ) | |||||||||
|
Balance at December 31, 2009 |
(462,412 | ) | 68,059 | (42,546 | ) | (436,899 | ) | |||||||||
|
Other comprehensive income (loss), net of tax: |
||||||||||||||||
|
Net realized and unrealized holding gains, net of income tax expense of $2,230 |
4,248 | 4,248 | ||||||||||||||
|
Reclassification for net losses included in earnings, net of income tax benefit of $28,611 |
45,689 | 45,689 | ||||||||||||||
|
Noncredit-related impairment losses on securities not expected to be sold, net of income tax benefit of $27,177 |
(43,920 | ) | (43,920 | ) | ||||||||||||
|
Accretion of securities with noncredit-related impairment losses not expected to be sold, net of income tax expense of $81 |
131 | 131 | ||||||||||||||
|
Net unrealized losses, net of reclassification to earnings of $74,936 and income tax benefit of $23,405 |
(37,357 | ) | (37,357 | ) | ||||||||||||
|
Pension and postretirement, net of income tax expense of $4,440 |
6,812 | 6,812 | ||||||||||||||
|
Other comprehensive income (loss) |
6,148 | (37,357 | ) | 6,812 | (24,397 | ) | ||||||||||
|
Balance at December 31, 2010 |
$ | (456,264 | ) | $ | 30,702 | $ | (35,734 | ) | $ | (461,296 | ) | |||||
As discussed in Note 5, we adopted new guidance under ASC 320 as of January 1, 2009 related to the accounting for noncredit-related impairment losses on investment securities not expected to be sold. In addition to the ongoing effect on AOCI, the cumulative effect of adopting this new guidance increased retained earnings and decreased AOCI by $137.5 million.
138
Table of Contents
Deferred Compensation
Deferred compensation at year-end consists of the cost of the Company’s common stock held in rabbi trusts established for certain employees and directors. At December 31, 2010 and 2009, the cost of the common stock was approximately $16.1 million and $16.2 million, respectively, and was included in retained earnings. We consolidate the fair value of invested assets of the trusts along with the total obligations and include them in other assets and other liabilities, respectively, in the balance sheet. At December 31, 2010 and 2009, total invested assets were approximately $70.5 million and $58.0 million and total obligations were approximately $86.6 million and $74.2 million, respectively.
Noncontrolling Interests
In June 2010, we liquidated our ownership of certain consolidated venture funds. We also changed the ownership structure of another venture fund such that we are no longer required to consolidate it under the accounting guidance in ASC 810. The effect of these transactions decreased the amount of noncontrolling interests by approximately $15 million. The consolidated financial statements were not otherwise significantly affected.
Subsequent Event
On February 10, 2011, we announced a new equity distribution agreement to sell $200 million of shares of the Company’s common stock. This agreement supersedes prior programs, including the latest program announced August 18, 2010 under which approximately $6.5 million could still be sold as of December 31, 2010.
15. INCOME TAXES
Income taxes (benefit) are summarized as follows:
| (In thousands) | 2010 | 2009 | 2008 | |||||||||
|
Federal: |
||||||||||||
|
Current |
$ | (80,914 | ) | $ | (375,610 | ) | $ | 170,268 | ||||
|
Deferred |
(15,210 | ) | 24,171 | (198,145 | ) | |||||||
| (96,124 | ) | (351,439 | ) | (27,877 | ) | |||||||
|
State: |
||||||||||||
|
Current |
2,760 | (10,662 | ) | 17,608 | ||||||||
|
Deferred |
(13,455 | ) | (39,242 | ) | (33,096 | ) | ||||||
| (10,695 | ) | (49,904 | ) | (15,488 | ) | |||||||
| $ | (106,819 | ) | $ | (401,343 | ) | $ | (43,365 | ) | ||||
139
Table of Contents
Income tax expense (benefit) computed at the statutory federal income tax rate of 35% reconciles to actual income tax expense (benefit) as follows:
| (In thousands) | 2010 | 2009 | 2008 | |||||||||
|
Income tax expense (benefit) at statutory federal rate |
$ | (141,109 | ) | $ | (568,057 | ) | $ | (110,144 | ) | |||
|
State income taxes, net |
(6,952 | ) | (32,437 | ) | (4,883 | ) | ||||||
|
Uncertain state tax positions, including interest and penalties |
– | – | (5,184 | ) | ||||||||
|
Nondeductible goodwill impairment |
– | 220,852 | 115,774 | |||||||||
|
Other nondeductible expenses |
52,004 | 4,380 | 3,461 | |||||||||
|
Nontaxable income |
(21,662 | ) | (24,863 | ) | (27,763 | ) | ||||||
|
Surrender of bank-owned life insurance |
28,923 | 2,772 | – | |||||||||
|
Tax credits and other taxes |
(9,007 | ) | (7,946 | ) | (7,766 | ) | ||||||
|
Valuation allowance for federal tax purposes on acquired
|
– | 3,899 | – | |||||||||
|
Other |
(9,016 | ) | 57 | (6,860 | ) | |||||||
| $ | (106,819 | ) | $ | (401,343 | ) | $ | (43,365 | ) | ||||
The tax effects of temporary differences that give rise to significant portions of the deferred tax assets and deferred tax liabilities are presented below:
| (In thousands) | 2010 | 2009 | ||||||
|
Gross deferred tax assets: |
||||||||
|
Book loan loss deduction in excess of tax |
$ | 563,880 | $ | 612,818 | ||||
|
Pension and postretirement |
25,426 | 31,009 | ||||||
|
Deferred compensation |
60,854 | 58,496 | ||||||
|
Other real estate owned |
35,237 | 18,497 | ||||||
|
Accrued severance costs |
2,617 | 2,985 | ||||||
|
Security investments and derivative fair value adjustments |
247,952 | 248,487 | ||||||
|
Equity investments |
12,821 | 15,610 | ||||||
|
Net operating losses and tax credits |
56,381 | 49,947 | ||||||
|
Other |
37,879 | 20,787 | ||||||
| 1,043,047 | 1,058,636 | |||||||
|
Valuation allowance |
(4,261 | ) | (4,261 | ) | ||||
|
Total deferred tax assets |
1,038,786 | 1,054,375 | ||||||
|
Gross deferred tax liabilities: |
||||||||
|
Core deposits and purchase accounting |
(33,139 | ) | (40,322 | ) | ||||
|
Premises and equipment, due to differences in depreciation |
(9,363 | ) | (5,913 | ) | ||||
|
FHLB stock dividends |
(17,746 | ) | (18,708 | ) | ||||
|
Leasing operations |
(110,054 | ) | (94,644 | ) | ||||
|
Prepaid expenses |
(6,462 | ) | (7,290 | ) | ||||
|
Prepaid pension reserves |
(20,869 | ) | (3,231 | ) | ||||
|
Subordinated debt modification |
(247,272 | ) | (296,366 | ) | ||||
|
Deferred loan fees |
(19,864 | ) | (17,770 | ) | ||||
|
FDIC-supported transactions |
(30,669 | ) | (58,408 | ) | ||||
|
Other |
(3,285 | ) | (13,474 | ) | ||||
|
Total deferred tax liabilities |
(498,723 | ) | (556,126 | ) | ||||
|
Net deferred tax assets |
$ | 540,063 | $ | 498,249 | ||||
140
Table of Contents
The amount of net deferred tax assets is included with other assets in the balance sheet. The $4.3 million valuation allowance at December 31, 2010 and 2009 was for certain acquired net operating loss carryforwards included in our acquisition of the remaining interests in a less significant subsidiary. At December 31, 2010, excluding the $4.3 million, the tax effect of remaining net operating loss and tax credit carryforwards was approximately $45.7 million expiring through 2030 and $6.4 million expiring through 2031.
We evaluate the net deferred tax assets on a regular basis to determine whether an additional valuation allowance is required. In conducting this evaluation, we have considered all available evidence, both positive and negative, based on the more-likely-than-not criteria that such assets will be realized. This evaluation includes, but is not limited to: (1) available carryback potential to offset federal tax of approximately $100 million in the 2008 tax year; during 2010, the Company had a net operating loss for tax purposes that will largely offset the taxable income for the 2008 tax year; (2) potential future reversals of existing deferred tax liabilities, which historically have a reversal pattern generally consistent with deferred tax assets; (3) potential tax planning strategies; and (4) future projected taxable income. Based on this evaluation, and considering the weight of the positive evidence compared to the negative evidence, we have concluded that an additional valuation allowance is not required as of December 31, 2010.
We have an agreement that awarded us a $100 million allocation of tax credit authority under the Community Development Financial Institutions Fund established by the U.S. Government. We have invested the $100 million in a wholly-owned subsidiary which makes qualifying loans and investments. In return, we receive federal income tax credits that are recognized over seven years, including the year in which the funds were invested in the subsidiary. We recognize these tax credits for financial reporting purposes in the same year the tax benefit is recognized in our tax return. The resulting tax credits which reduced income tax expense were approximately $6.0 million in 2010, $5.9 million in 2009, and $5.8 million in 2008.
We have a liability for unrecognized tax benefits relating to uncertain tax positions primarily for various state tax contingencies in several jurisdictions. A reconciliation of the beginning and ending amount of gross unrecognized tax benefits is as follows:
| (In thousands) | 2010 | 2009 | 2008 | |||||||||
|
Balance at beginning of year |
$ | 16,677 | $ | 17,077 | $ | 29,717 | ||||||
|
Tax positions related to current year: |
||||||||||||
|
Additions |
– | – | 676 | |||||||||
|
Reductions |
– | – | – | |||||||||
|
Tax positions related to prior years: |
||||||||||||
|
Additions |
– | – | – | |||||||||
|
Reductions |
– | – | (7,641 | ) | ||||||||
|
Settlements with taxing authorities |
– | – | (5,675 | ) | ||||||||
|
Lapses in statutes of limitations |
(1,311 | ) | (400 | ) | – | |||||||
|
Balance at end of year |
$ | 15,366 | $ | 16,677 | $ | 17,077 | ||||||
At December 31, 2010 and 2009, the liability for unrecognized tax benefits included approximately $10.0 million and $10.8 million, respectively, (net of the federal tax benefit on state issues) that, if recognized, would affect the effective tax rate. Gross unrecognized tax benefits that may decrease during the 12 months subsequent to December 31, 2010 could range up to approximately $1.6 million as a result of the resolution of various state tax positions.
We reduced this liability, net of any federal and/or state tax benefits, and reduced income tax expense by a net amount including interest of $949 thousand in 2010 and $366 thousand in 2009 due to lapses in statutes of limitations. We reduced this liability in 2008 by approximately $9.6 million due to a $5.2 million settlement with taxing authorities and to $4.4 million from the net effect of settlement payments.
141
Table of Contents
Interest and penalties related to unrecognized tax benefits are included in income tax expense in the statement of income. At December 31, 2010 and 2009, accrued interest and penalties recognized in the balance sheet, net of any federal and/or state tax benefits, were approximately $2.7 million and $2.8 million, respectively.
The Company and its subsidiaries file income tax returns in U.S. federal and various state jurisdictions. The Company is no longer subject to income tax examinations for years prior to 2007 for federal returns, and generally prior to 2006 for state returns.
16. NET EARNINGS PER COMMON SHARE
ASC 260, Earnings Per Share , includes new guidance adopted January 1, 2009 which clarifies that unvested share-based awards with rights to receive nonforfeitable dividends are considered participating securities and should be included in the computation of earnings per share. Adoption of this guidance required retrospective adjustment of earnings per share information, which was not significant to any prior year included in the accompanying financial statements.
Basic and diluted net earnings per common share based on the weighted average outstanding shares are summarized as follows:
| Year Ended December 31, | ||||||||||||
| (In thousands, except per share amounts) | 2010 | 2009 | 2008 | |||||||||
|
Basic: |
||||||||||||
|
Net income (loss) applicable to controlling interest |
$ | (292,728 | ) | $ | (1,216,111 | ) | $ | (266,269 | ) | |||
|
Common and preferred dividends |
(126,427 | ) | (30,198 | ) | (199,589 | ) | ||||||
|
Undistributed earnings (loss) |
(419,155 | ) | (1,246,309 | ) | (465,858 | ) | ||||||
|
Less undistributed earnings applicable to nonvested restricted shares |
– | – | – | |||||||||
|
Undistributed earnings (loss) applicable to common shares |
(419,155 | ) | (1,246,309 | ) | (465,858 | ) | ||||||
|
Distributed earnings applicable to common shares |
6,565 | 11,773 | 173,963 | |||||||||
|
Total earnings (loss) applicable to common shares |
$ | (412,590 | ) | $ | (1,234,536 | ) | $ | (291,895 | ) | |||
|
Weighted average common shares outstanding |
166,054 | 124,443 | 108,908 | |||||||||
|
Net earnings (loss) per common share |
$ | (2.48 | ) | $ | (9.92 | ) | $ | (2.68 | ) | |||
|
Diluted: |
||||||||||||
|
Total earnings (loss) applicable to common shares |
$ | (412,590 | ) | $ | (1,234,536 | ) | $ | (291,895 | ) | |||
|
Additional undistributed earnings allocated to incremental option shares |
– | – | – | |||||||||
|
Diluted earnings (loss) applicable to common shares |
$ | (412,590 | ) | $ | (1,234,536 | ) | $ | (291,895 | ) | |||
|
Weighted average common shares outstanding |
166,054 | 124,443 | 108,908 | |||||||||
|
Additional weighted average dilutive option shares |
– | – | – | |||||||||
|
Weighted average diluted common shares outstanding |
166,054 | 124,443 | 108,908 | |||||||||
|
Net earnings (loss) per common share |
$ | (2.48 | ) | $ | (9.92 | ) | $ | (2.68 | ) | |||
142
Table of Contents
17. SHARE-BASED COMPENSATION
We have a stock option and incentive plan which allows us to grant stock options, restricted stock, and other awards to employees and nonemployee directors. Total shares authorized under the plan were 13,200,000 at December 31, 2010, of which 3,069,113 were available for future grants of stock options or restricted stock. Our agreement with the U.S. Treasury under the TARP Capital Purchase Program includes conditions related to the issuance of share-based awards. See further discussion in Note 14.
All share-based payments to employees, including grants of employee stock options, are recognized in the statement of income based on their fair values. The fair value of an equity award is estimated on the grant date without regard to service or performance vesting conditions.
Compensation expense and the related tax benefit for all share-based awards were as follows:
| (In thousands) | 2010 | 2009 | 2008 | |||||||||
|
Compensation expense |
$ | 26,834 | $ | 29,789 | $ | 31,850 | ||||||
|
Reduction of income tax expense |
9,315 | 10,433 | 11,080 | |||||||||
Compensation expense is included in salaries and employee benefits in the statement of income with the corresponding increase included in common stock in shareholders’ equity.
We classify all share-based awards as equity instruments. Substantially all awards have graded vesting which is recognized on a straight-line basis over the vesting period. As of December 31, 2010, compensation expense not yet recognized for nonvested share-based awards was approximately $34.8 million, which is expected to be recognized over a weighted average period of 1.2 years.
The tax shortfall recognized from the exercise of stock options and the vesting of restricted stock was approximately $8.4 million in 2010, $6.1 million in 2009, and $2.2 million in 2008. These amounts are included in the statement of changes in shareholders’ equity under common stock and primarily relate to the net activity under employee plans and related tax benefits.
Stock Options
Stock options granted to employees generally vest at the rate of one third each year and expire seven years after the date of grant. Stock options granted to nonemployee directors vest in increments from six months to three and a half years and expire ten years after the date of grant.
We used the results of the April 2008 auction of our Employee Stock Option Appreciation Rights Securities (“ESOARS”) to value our employee stock options granted at that same time. We had previously received notification from the SEC that our ESOARS was sufficiently designed as a market-based method to value employee stock options under ASC 718. Information from the results of the April 2008 auction was as follows:
|
ESOARS per share auction fair value used for employee stock option grants |
$ | 5.73 | ||
|
Percentage that auction fair value is below comparable |
||||
|
Black-Scholes model valuation |
24 | % | ||
|
Number of stock options granted |
1,542,238 | |||
|
Percentage of stock options granted to total stock options granted during the year |
61 | % |
We used the ESOARS values for the remainder of 2008 to determine compensation expense for these stock options and we included the related estimated future ESOARS settlement obligations in other liabilities in the balance sheet.
143
Table of Contents
For all stock options granted in 2010 and 2009 and all other stock options granted in 2008, we used the Black-Scholes option pricing model to estimate the fair values of stock options in determining compensation expense. The following summarizes the weighted average of fair value and the significant assumptions used in applying the Black-Scholes model for options granted:
| 2010 | 2009 | 2008 | ||||||||||
|
Weighted average of fair value for options granted |
$ | 6.59 | $ | 4.09 | $ | 4.85 | ||||||
|
Weighted average assumptions used: |
||||||||||||
|
Expected dividend yield |
1.0 | % | 1.0 | % | 4.7 | % | ||||||
|
Expected volatility |
33.0 | % | 33.0 | % | 26.8 | % | ||||||
|
Risk-free interest rate |
1.89 | % | 2.24 | % | 2.99 | % | ||||||
|
Expected life (in years) |
4.5 | 4.5 | 4.7 | |||||||||
The assumptions for expected dividend yield, expected volatility, and expected life reflect management’s judgment and include consideration of historical experience. Expected volatility is based in part on historical volatility. The risk-free interest rate is based on the U.S. Treasury yield curve in effect at the time of grant for periods corresponding with the expected life of the option.
The following summarizes our stock option activity for the three years ended December 31, 2010:
|
Number of
shares |
Weighted
average exercise price |
|||||||
|
Balance at December 31, 2007 |
5,810,983 | $ | 64.82 | |||||
|
Granted |
2,537,438 | 40.43 | ||||||
|
Exercised |
(52,072 | ) | 30.58 | |||||
|
Expired |
(536,643 | ) | 56.72 | |||||
|
Forfeited |
(85,108 | ) | 66.18 | |||||
|
Balance at December 31, 2008 |
7,674,598 | 57.53 | ||||||
|
Granted |
714,085 | 14.64 | ||||||
|
Exercised |
(316 | ) | 5.82 | |||||
|
Expired |
(599,405 | ) | 56.35 | |||||
|
Forfeited |
(59,932 | ) | 62.99 | |||||
|
Balance at December 31, 2009 |
7,729,030 | 53.61 | ||||||
|
Granted |
846,013 | 23.90 | ||||||
|
Exercised |
(32,645 | ) | 13.18 | |||||
|
Voluntarily surrendered |
(1,051,174 | ) | 78.60 | |||||
|
Expired |
(841,529 | ) | 48.73 | |||||
|
Forfeited |
(280,456 | ) | 31.45 | |||||
|
Balance at December 31, 2010 |
6,369,239 | 47.37 | ||||||
|
Outstanding stock options exercisable as of: |
||||||||
|
December 31, 2010 |
4,230,690 | $ | 57.21 | |||||
|
December 31, 2009 |
4,911,239 | 62.72 | ||||||
|
December 31, 2008 |
4,221,713 | 62.15 | ||||||
During 2010, certain option holders voluntarily surrendered stock options that were fully vested. All of the associated compensation expense had been previously recognized. These options were granted between May 2005 and September 2007, with exercise prices between $70.79 and $83.25 and expiration dates between May 2012 and September 2014. No replacement options or other replacement equity-based compensation was granted to these option holders.
144
Table of Contents
We issue new authorized shares for the exercise of stock options. The total intrinsic value of stock options exercised was approximately $0.3 million in 2010, $3 thousand in 2009, and $0.9 million in 2008. Cash received from the exercise of stock options was $0.4 million in 2010, $2 thousand in 2009, and $1.6 million in 2008.
Additional selected information on stock options at December 31, 2010 follows:
| Outstanding stock options |
Exercisable stock
options |
|||||||||||||||||||
|
Exercise price range |
Number of
shares |
Weighted
average exercise price |
Weighted
average remaining contractual life (years) |
Number of
shares |
Weighted
average exercise price |
|||||||||||||||
|
$0.32 to $19.99 |
666,769 | $ | 14.18 | 5.4 | 1 | 212,804 | $ | 13.38 | ||||||||||||
|
$20.00 to $39.99 |
1,507,805 | 25.76 | 5.6 | 305,082 | 28.06 | |||||||||||||||
|
$40.00 to $49.99 |
1,661,468 | 47.24 | 4.1 | 1,182,160 | 47.24 | |||||||||||||||
|
$50.00 to $54.99 |
83,743 | 52.82 | 1.2 | 83,743 | 52.82 | |||||||||||||||
|
$55.00 to $59.99 |
969,980 | 56.85 | 1.0 | 969,980 | 56.85 | |||||||||||||||
|
$60.00 to $64.99 |
29,549 | 63.32 | 1.5 | 29,549 | 63.32 | |||||||||||||||
|
$65.00 to $69.99 |
104,963 | 67.08 | 3.1 | 104,963 | 67.08 | |||||||||||||||
|
$70.00 to $74.99 |
331,653 | 70.89 | 1.7 | 329,100 | 70.88 | |||||||||||||||
|
$75.00 to $79.99 |
58,700 | 75.98 | 2.0 | 58,700 | 75.98 | |||||||||||||||
|
$80.00 to $81.99 |
452,863 | 81.11 | 2.5 | 452,863 | 81.11 | |||||||||||||||
|
$82.00 to $83.38 |
501,746 | 83.24 | 3.5 | 501,746 | 83.24 | |||||||||||||||
| 6,369,239 | 47.37 | 3.7 | 1 | 4,230,690 | 57.21 | |||||||||||||||
| 1 |
The weighted average remaining contractual life excludes 26,429 stock options without a fixed expiration date that were acquired with the Amegy acquisition by the Company in 2005. They expire between the date of termination and one year from the date of termination, depending upon certain circumstances. |
The aggregate intrinsic value of outstanding stock options at December 31, 2010 and 2009 was $35.0 million and $265 thousand, respectively, while the aggregate intrinsic value of exercisable options was $8.5 million and $243 thousand. For exercisable options, the weighted average remaining contractual life was 2.9 years and 3.1 years at December 31, 2010 and 2009, respectively, excluding the stock options previously noted without a fixed expiration date.
The previous schedules do not include stock options for employees of our TCBO subsidiary to purchase common stock of TCBO. At December 31, 2010, there were options to purchase 60,000 TCBO shares at exercise prices from $17.85 to $20.58. At December 31, 2010, there were 1,038,000 issued and outstanding shares of TCBO common stock.
Restricted Stock
Restricted stock issued vests generally over four years. Nonemployee directors were granted restricted stock of 27,216 shares in 2010 and 43,002 shares in 2009, which vested over six months. During the vesting period, the holder has full voting rights and receives dividend equivalents. Compensation expense is determined based on the number of restricted shares issued and the market price of our common stock at the issue date.
145
Table of Contents
The following summarizes our restricted stock activity for the three years ended December 31, 2010:
|
Number of
shares |
Weighted
average issue price |
|||||||
|
Nonvested restricted shares at December 31, 2007 |
635,062 | $ | 74.54 | |||||
|
Issued |
849,156 | 37.64 | ||||||
|
Vested |
(191,605 | ) | 74.92 | |||||
|
Forfeited |
(43,332 | ) | 68.43 | |||||
|
Nonvested restricted shares at December 31, 2008 |
1,249,281 | 49.61 | ||||||
|
Issued |
698,311 | 14.64 | ||||||
|
Vested |
(349,186 | ) | 56.13 | |||||
|
Forfeited |
(73,756 | ) | 42.64 | |||||
|
Nonvested restricted shares at December 31, 2009 |
1,524,650 | 32.44 | ||||||
|
Issued |
644,504 | 23.85 | ||||||
|
Vested |
(428,593 | ) | 43.88 | |||||
|
Forfeited |
(128,918 | ) | 28.19 | |||||
|
Nonvested restricted shares at December 31, 2010 |
1,611,643 | 26.30 | ||||||
The total fair value of restricted stock vesting during the year was $10.4 million in 2010, $4.7 million in 2009, and $8.5 million in 2008.
18. COMMITMENTS, GUARANTEES, CONTINGENT LIABILITIES, AND RELATED PARTIES
We use certain derivative instruments and other financial instruments in the normal course of business to meet the financing needs of our customers, to reduce our own exposure to fluctuations in interest rates, and to make a market in U.S. Government, agency, corporate, and municipal securities. These financial instruments involve, to varying degrees, elements of credit, liquidity, and interest rate risk in excess of the amount recognized in the balance sheet. Derivative instruments are discussed in Notes 8 and 21.
Contractual amounts of the off-balance sheet financial instruments used to meet the financing needs of our customers are as follows:
| December 31, | ||||||||
| (In thousands) | 2010 | 2009 | ||||||
|
Commitments to extend credit |
$ | 11,509,212 | $ | 11,610,156 | ||||
|
Standby letters of credit: |
||||||||
|
Financial |
921,257 | 1,071,851 | ||||||
|
Performance |
185,854 | 182,423 | ||||||
|
Commercial letters of credit |
46,627 | 30,179 | ||||||
Commitments to extend credit are agreements to lend to a customer as long as there is no violation of any condition established in the contract. Commitments generally have fixed expiration dates or other termination clauses and may require the payment of a fee. The amount of collateral obtained, if deemed necessary by us upon extension of credit, is based on our credit evaluation of the counterparty. Types of collateral vary, but may include accounts receivable, inventory, property, plant and equipment, and income-producing properties.
While establishing commitments to extend credit creates credit risk, a significant portion of such commitments is expected to expire without being drawn upon. As of December 31, 2010, $4.6 billion of commitments expire in 2011. We use the same credit policies and procedures in making commitments to extend credit and conditional obligations as we do for on-balance sheet instruments. These policies and procedures include credit approvals, limits, and monitoring.
146
Table of Contents
We issue standby and commercial letters of credit as conditional commitments generally to guarantee the performance of a customer to a third party. The guarantees are primarily issued to support public and private borrowing arrangements, including commercial paper, bond financing, and similar transactions. Standby letters of credit include remaining commitments of $773 million expiring in 2011 and $334 million expiring thereafter through 2027. The credit risk involved in issuing letters of credit is essentially the same as that involved in extending loan facilities to customers. We generally hold marketable securities and cash equivalents as collateral supporting those commitments for which collateral is deemed necessary. At December 31, 2010, the Company had recorded approximately $14.9 million as a liability for these guarantees, which consisted of $8.8 million attributable to the reserve for unfunded lending commitments and $6.1 million of deferred commitment fees.
Certain mortgage loans sold have limited recourse provisions for periods ranging from three months to one year. The amount of losses resulting from the exercise of these provisions has not been significant.
At December 31, 2010, we had commitments to make venture and other noninterest-bearing investments of $55.6 million. These obligations have no stated maturity.
The contractual or notional amount of financial instruments indicates a level of activity associated with a particular class of financial instrument and is not a reflection of the actual level of risk. As of December 31, 2010 and 2009, the regulatory risk-weighted values assigned to all off-balance sheet financial instruments and derivative instruments described herein were $3.9 billion and $4.0 billion, respectively.
At December 31, 2010, we were required to maintain cash balances of $28.6 million with the Federal Reserve Banks to meet minimum balance requirements in accordance with Federal Reserve Board regulations.
As of December 31, 2010, the Parent has guaranteed approximately $300.0 million of debt issued by our subsidiaries, as discussed in Note 13.
We have commitments for leasing premises and equipment under the terms of noncancelable capital and operating leases expiring from 2011 to 2046. Premises leased under capital leases at December 31, 2010 were $1.7 million and accumulated amortization was $1.0 million. Amortization applicable to premises leased under capital leases is included in depreciation expense.
Future aggregate minimum rental payments under existing noncancelable operating leases at December 31, 2010 are as follows:
| (In thousands) | ||||
|
2011 |
$ | 47,389 | ||
|
2012 |
46,397 | |||
|
2013 |
41,317 | |||
|
2014 |
36,054 | |||
|
2015 |
32,470 | |||
|
Thereafter |
145,306 | |||
| $ | 348,933 | |||
Future aggregate minimum rental payments have been reduced by noncancelable subleases as follows: $1.8 million in 2011, 2012, and 2013, $1.1 million in 2014, $0.7 million in 2015, and $6.4 million thereafter. Aggregate rental expense on operating leases amounted to $59.7 million in 2010, $59.2 million in 2009, and $57.3 million in 2008.
We are subject to litigation in court and arbitral proceedings, as well as proceedings and other actions brought or considered by governmental and self-regulatory agencies. Based on our current knowledge and consultations with legal counsel, we believe that current reserves for these matters, determined in accordance
147
Table of Contents
with ASC 450-20, Loss Contingencies , are adequate and that the amount of any incremental liability arising from litigation and governmental and self-regulatory actions will not have a material adverse effect on our consolidated financial condition, cash flows, or results of operations. However, it is possible that the ultimate resolution of our litigation and governmental and self-regulatory actions may differ from our current assessments, based on facts and legal theories not currently known or fully appreciated, unpredicted decisions by courts, arbitrators or governmental or self-regulatory agencies, or other factors, and could have a material adverse effect on our results of operations for a particular reporting period depending, in part, on our results for that period.
We have no material related party transactions requiring disclosure. In the ordinary course of business, the Company and its subsidiary banks extend credit to related parties, including executive officers, directors, principal shareholders, and their associates and related interests. These related party loans are made in compliance with applicable banking regulations under substantially the same terms as comparable third-party lending arrangements.
19. REGULATORY MATTERS
We are subject to various regulatory capital requirements administered by federal banking agencies. Failure to meet minimum capital requirements can initiate certain mandatory – and possibly additional discretionary – actions by regulators that, if undertaken, could have a direct material effect on our financial statements. Under capital adequacy guidelines and the regulatory framework for prompt corrective action, we must meet specific capital guidelines that involve quantitative measures of our assets, liabilities, and certain off-balance sheet items as calculated under regulatory accounting practices. Our capital amounts and classification are also subject to qualitative judgments by regulators about components, risk weightings, and other factors.
Quantitative measures established by regulation to ensure capital adequacy require us to maintain minimum amounts and ratios (set forth in the following schedule) of Total and Tier 1 capital (as defined in the regulations) to risk-weighted assets (as defined), and of Tier 1 capital (as defined) to average assets (as defined). As of December 31, 2010, we exceeded all capital adequacy requirements to which we are subject.
As discussed further in Note 14, the preferred shares and warrant to purchase common stock issued to the U.S. Treasury under the TARP Capital Purchase Program qualify for Tier 1 capital.
As of December 31, 2010, all capital ratios of the Company and each of its subsidiary banks exceeded the “well capitalized” levels under the regulatory framework for prompt corrective action. However, in response to the recent severe economic crisis, the determination of appropriate capital levels, particularly for the Company and other “systemically important” financial institutions as determined pursuant to the Dodd-Frank Act, increasingly is being driven by the results of comprehensive “stress tests” performed by each financial institution and its regulators. Such tests seek to comprehensively measure all risks to which the institution is exposed, including credit, liquidity, market, operating and other risks, the losses that could result from those risk exposures under adverse scenarios, and the institution’s resulting capital levels. The results of these institution-specific tests as well as the Basel III capital framework being implemented are driving the Company and most other systemically important financial institutions to hold capital considerably in excess of “well capitalized” regulatory standards, and in excess of historical levels. Regulators have indicated that these stress test results will also be an important factor in determining whether an institution can pay or increase dividends.
148
Table of Contents
The actual capital amounts and ratios for the Company and its three largest subsidiary banks are as follows:
| Actual | To be well capitalized | |||||||||||||||
| (Dollar amounts in thousands) | Amount | Ratio | Amount | Ratio | ||||||||||||
|
As of December 31, 2010: |
||||||||||||||||
|
Total capital (to risk-weighted assets) |
||||||||||||||||
|
The Company |
$ | 7,363,984 | 17.15 | % | $ | 4,295,020 | 10.00 | % | ||||||||
|
Zions First National Bank |
1,962,050 | 12.88 | 1,523,237 | 10.00 | ||||||||||||
|
California Bank & Trust |
1,171,253 | 13.68 | 856,252 | 10.00 | ||||||||||||
|
Amegy Bank N.A. |
1,565,707 | 16.89 | 926,936 | 10.00 | ||||||||||||
|
Tier 1 capital (to risk-weighted assets) |
||||||||||||||||
|
The Company |
6,349,789 | 14.78 | 2,577,012 | 6.00 | ||||||||||||
|
Zions First National Bank |
1,775,857 | 11.66 | 913,942 | 6.00 | ||||||||||||
|
California Bank & Trust |
1,062,085 | 12.40 | 513,751 | 6.00 | ||||||||||||
|
Amegy Bank N.A. |
1,446,462 | 15.60 | 556,161 | 6.00 | ||||||||||||
|
Tier 1 capital (to average assets) |
||||||||||||||||
|
The Company |
6,349,789 | 12.56 | na | na | 1 | |||||||||||
|
Zions First National Bank |
1,775,857 | 10.43 | 851,233 | 5.00 | ||||||||||||
|
California Bank & Trust |
1,062,085 | 9.94 | 534,114 | 5.00 | ||||||||||||
|
Amegy Bank N.A. |
1,446,462 | 13.84 | 522,708 | 5.00 | ||||||||||||
|
As of December 31, 2009: |
||||||||||||||||
|
Total capital (to risk-weighted assets) |
||||||||||||||||
|
The Company |
$ | 6,822,713 | 13.28 | % | $ | 5,135,981 | 10.00 | % | ||||||||
|
Zions First National Bank |
2,017,910 | 11.52 | 1,751,736 | 10.00 | ||||||||||||
|
California Bank & Trust |
1,081,079 | 11.51 | 939,090 | 10.00 | ||||||||||||
|
Amegy Bank N.A. |
1,404,939 | 13.57 | 1,035,160 | 10.00 | ||||||||||||
|
Tier 1 capital (to risk-weighted assets) |
||||||||||||||||
|
The Company |
5,406,796 | 10.53 | 3,081,588 | 6.00 | ||||||||||||
|
Zions First National Bank |
1,803,166 | 10.29 | 1,051,041 | 6.00 | ||||||||||||
|
California Bank & Trust |
962,121 | 10.25 | 563,454 | 6.00 | ||||||||||||
|
Amegy Bank N.A. |
1,271,949 | 12.29 | 621,096 | 6.00 | ||||||||||||
|
Tier 1 capital (to average assets) |
||||||||||||||||
|
The Company |
5,406,796 | 10.38 | na | na | 1 | |||||||||||
|
Zions First National Bank |
1,803,166 | 8.84 | 1,020,234 | 5.00 | ||||||||||||
|
California Bank & Trust |
962,121 | 8.81 | 546,132 | 5.00 | ||||||||||||
|
Amegy Bank N.A. |
1,271,949 | 11.79 | 539,216 | 5.00 | ||||||||||||
| 1 |
There is no Tier 1 leverage ratio component in the definition of a well capitalized bank holding company. |
20. RETIREMENT PLANS
Defined Benefit Plans
Pension – This qualified noncontributory defined benefit plan has been frozen to new participation. No service-related benefits accrue for existing participants except for those with certain grandfathering provisions. Benefits vest under the plan upon completion of five years of vesting service. Plan assets consist principally of corporate equity securities, mutual fund investments, and cash investments. Plan benefits are paid as a lump-sum cash value or an annuity at retirement age. Contributions to the plan are based on actuarial recommendation and pension regulations. The funded status of the plan improved during 2010 due to contributions of $50.8 million and increases in the value of plan assets.
Supplement Retirement – These unfunded nonqualified plans are for certain current and former employees. Each year, Company contributions to these plans are made in amounts sufficient to meet benefit payments to plan participants.
149
Table of Contents
Postretirement – This unfunded defined benefit health care plan provides postretirement medical benefits to certain full-time employees who met minimum age and service requirements. The plan is contributory with retiree contributions adjusted annually, and contains other cost-sharing features such as deductibles and coinsurance. Plan coverage is provided by self-funding or health maintenance organizations (HMOs) options. Our contribution towards the retiree medical premium has been permanently frozen. Retirees pay the difference between the full premium rates and our capped contribution.
In June 2008, we amended the postretirement plan and curtailed coverage for certain participants, primarily those with post-65 coverage. The effect of this curtailment on the change in the plan’s benefit obligation and determination of net periodic benefit cost (credit) for 2008 was determined in accordance with applicable accounting standards.
Because our contribution rate is capped, there is no effect on the postretirement plan from assumed increases or decreases in health care cost trends. Each year, Company contributions to the plan are made in amounts sufficient to meet benefit payments to plan participants.
The following presents the change in benefit obligation, change in fair value of plan assets, and funded status, of the plans and amounts recognized in the balance sheet as of the measurement date of December 31:
| Pension |
Supplemental
Retirement |
Postretirement | ||||||||||||||||||||||
| (In thousands) | 2010 | 2009 | 2010 | 2009 | 2010 | 2009 | ||||||||||||||||||
|
Change in benefit obligation: |
||||||||||||||||||||||||
|
Benefit obligation at beginning of year |
$ | 160,039 | $ | 152,804 | $ | 11,453 | $ | 11,458 | $ | 1,140 | $ | 1,100 | ||||||||||||
|
Service cost |
180 | 229 | – | – | 35 | 34 | ||||||||||||||||||
|
Interest cost |
8,597 | 8,889 | 613 | 661 | 61 | 63 | ||||||||||||||||||
|
Actuarial (gain) loss |
5,470 | 6,618 | 648 | 233 | (31 | ) | 40 | |||||||||||||||||
|
Settlements |
– | – | (286 | ) | – | – | – | |||||||||||||||||
|
Benefits paid |
(8,550 | ) | (8,501 | ) | (1,198 | ) | (899 | ) | (110 | ) | (97 | ) | ||||||||||||
|
Benefit obligation at end of year |
$ | 165,736 | $ | 160,039 | $ | 11,230 | $ | 11,453 | $ | 1,095 | $ | 1,140 | ||||||||||||
|
Change in fair value of plan assets: |
||||||||||||||||||||||||
|
Fair value of plan assets at beginning of year |
$ | 98,739 | $ | 90,174 | $ | – | $ | – | $ | – | $ | – | ||||||||||||
|
Actual return on plan assets |
19,773 | 14,566 | – | – | – | – | ||||||||||||||||||
|
Employer contributions |
50,794 | 2,500 | 1,198 | 899 | 110 | 97 | ||||||||||||||||||
|
Benefits paid |
(8,550 | ) | (8,501 | ) | (1,198 | ) | (899 | ) | (110 | ) | (97 | ) | ||||||||||||
|
Fair value of plan assets at end of year |
160,756 | 98,739 | – | – | – | – | ||||||||||||||||||
|
Funded status |
$ | (4,980 | ) | $ | (61,300 | ) | $ | (11,230 | ) | $ | (11,453 | ) | $ | (1,095 | ) | $ | (1,140 | ) | ||||||
|
Amounts recognized in balance sheet: |
||||||||||||||||||||||||
|
Liability for pension/postretirement benefits |
$ | (4,980 | ) | $ | (61,300 | ) | $ | (11,230 | ) | $ | (11,453 | ) | $ | (1,095 | ) | $ | (1,140 | ) | ||||||
|
Accumulated other comprehensive income (loss) |
(58,344 | ) | (70,170 | ) | (1,641 | ) | (1,428 | ) | 1,264 | 1,625 | ||||||||||||||
|
Accumulated other comprehensive income (loss) consists of: |
||||||||||||||||||||||||
|
Net gain (loss) |
$ | (58,344 | ) | $ | (70,170 | ) | $ | (1,217 | ) | $ | (879 | ) | $ | 626 | $ | 744 | ||||||||
|
Prior service credit (cost) |
– | – | (424 | ) | (549 | ) | 638 | 881 | ||||||||||||||||
| $ | (58,344 | ) | $ | (70,170 | ) | $ | (1,641 | ) | $ | (1,428 | ) | $ | 1,264 | $ | 1,625 | |||||||||
150
Table of Contents
The liability for pension/postretirement benefits is included in other liabilities in the balance sheet. The accumulated benefit obligation for the pension plan was $165.7 million and $160.0 million at December 31, 2010 and 2009, respectively.
The amounts in accumulated other comprehensive income (loss) at December 31, 2010 expected to be recognized as an expense component of net periodic benefit cost in 2011 for the plans are estimated as follows:
| (In thousands) | Pension |
Supplemental
Retirement |
Postretirement | |||||||||
|
Net gain (loss) |
$ | (5,221 | ) | $ | 5 | $ | 125 | |||||
|
Prior service credit (cost) |
(124 | ) | 243 | |||||||||
| $ | (5,221 | ) | $ | (119 | ) | $ | 368 | |||||
The following presents the components of net periodic benefit cost (credit) for the plans:
| (In thousands) | Pension |
Supplemental
Retirement |
Postretirement | |||||||||||||||||||||||||||||||||
| 2010 | 2009 | 2008 | 2010 | 2009 | 2008 | 2010 | 2009 | 2008 | ||||||||||||||||||||||||||||
|
Service cost |
$ | 180 | $ | 229 | $ | 288 | $ | – | $ | – | $ | – | $ | 35 | $ | 34 | $ | 56 | ||||||||||||||||||
|
Interest cost |
8,597 | 8,889 | 8,849 | 613 | 661 | 680 | 61 | 63 | 181 | |||||||||||||||||||||||||||
|
Expected return on plan assets |
(8,211 | ) | (7,074 | ) | (11,235 | ) | ||||||||||||||||||||||||||||||
|
Amortization of net actuarial (gain) loss |
5,735 | 6,635 | 1,063 | (19 | ) | (29 | ) | (27 | ) | (149 | ) | (196 | ) | (206 | ) | |||||||||||||||||||||
|
Amortization of prior service (credit) cost |
124 | 124 | 124 | (243 | ) | (243 | ) | (142 | ) | |||||||||||||||||||||||||||
|
Settlement loss |
42 | – | – | |||||||||||||||||||||||||||||||||
|
Plan amendment/settlement gain |
– | – | (2,973 | ) | ||||||||||||||||||||||||||||||||
|
Net periodic benefit cost (credit) |
$ | 6,301 | $ | 8,679 | $ | (1,035 | ) | $ | 760 | $ | 756 | $ | 777 | $ | (296 | ) | $ | (342 | ) | $ | (3,084 | ) | ||||||||||||||
Weighted average assumptions based on the pension plan are the same where applicable for each of the plans and are as follows:
| 2010 | 2009 | 2008 | ||||||||||
|
Used to determine benefit obligation at year-end: |
||||||||||||
|
Discount rate |
5.20 | % | 5.60 | % | 6.00 | % | ||||||
|
Rate of compensation increase |
3.50 | 4.25 | 4.25 | |||||||||
|
Used to determine net periodic benefit cost for the years ended December 31: |
||||||||||||
|
Discount rate |
5.60 | 6.00 | 6.00 | |||||||||
|
Expected long-term return on plan assets |
8.00 | 8.30 | 8.30 | |||||||||
|
Rate of compensation increase |
3.50 | 4.25 | 4.25 | |||||||||
The discount rate reflects the yields available on long-term, high-quality fixed income debt instruments with cash flows similar to the obligations of the pension plan, reset annually on the measurement date. The expected long-term rate of return on plan assets is based on a review of the target asset allocation of the plan. This rate is intended to approximate the long-term rate of return that we anticipate receiving on the plan’s investments, considering the mix of the assets that the plan holds as investments, the expected return on these underlying investments, the diversification of these investments, and the rebalancing strategies employed. An expected long-term rate of return is assumed for each asset class and an underlying inflation rate assumption is determined. The projected rate of compensation increases is management’s estimate of future pay increases that the remaining eligible employees will receive until their retirement.
151
Table of Contents
Benefit payments to the plans’ participants, which reflect expected future service as appropriate, are estimated as follows for the years succeeding December 31, 2010:
| (In thousands) | Pension |
Supplemental
Retirement |
Postretirement | |||||||||
|
2011 |
$ | 9,642 | $ | 2,304 | $ | 97 | ||||||
|
2012 |
10,878 | 1,059 | 106 | |||||||||
|
2013 |
9,919 | 958 | 105 | |||||||||
|
2014 |
9,766 | 855 | 108 | |||||||||
|
2015 |
9,735 | 798 | 107 | |||||||||
|
Years 2016 - 2020 |
52,332 | 4,101 | 541 | |||||||||
We are also obligated under other supplemental retirement plans for certain current and former employees. Our liability for these plans was $5.4 million and $5.3 million at December 31, 2010 and 2009, respectively.
For the pension plan, the investment strategy is predicated on its investment objectives and the risk and return expectations of asset classes appropriate for the plan. Investment objectives have been established by considering the plan’s liquidity needs and time horizon and the fiduciary standards under ERISA. The asset allocation strategy is developed to meet the plan’s long-term needs in a manner designed to control volatility and to reflect risk tolerance. Target investment allocation percentages as of December 31, 2010 are 64.5% in equity, 30.5% in fixed income and cash, and 5.0% in real estate assets.
The following presents the fair values of pension plan investments according to the fair value hierarchy described in Note 21, and the weighted average allocations:
| December 31, 2010 | December 31, 2009 | |||||||||||||||||||||||||||||||||||||||
| (In thousands) | Level 1 | Level 2 | Level 3 | Total | % | Level 1 | Level 2 | Level 3 | Total | % | ||||||||||||||||||||||||||||||
|
Company common stock |
$ | 5,268 | $ | 5,268 | 3 | $ | 4,017 | $ | 4,017 | 4 | ||||||||||||||||||||||||||||||
|
Mutual funds: |
||||||||||||||||||||||||||||||||||||||||
|
Equity |
4,348 | 4,348 | 3 | 3,358 | 3,358 | 3 | ||||||||||||||||||||||||||||||||||
|
Debt |
3,716 | 3,716 | 2 | 3,481 | 3,481 | 4 | ||||||||||||||||||||||||||||||||||
|
Insurance company pooled
|
||||||||||||||||||||||||||||||||||||||||
|
Equity investments |
$ | 103,802 | 103,802 | 64 | $ | 55,462 | 55,462 | 56 | ||||||||||||||||||||||||||||||||
|
Debt investments |
24,931 | 24,931 | 16 | 18,899 | 18,899 | 19 | ||||||||||||||||||||||||||||||||||
|
Real estate |
5,138 | 5,138 | 3 | |||||||||||||||||||||||||||||||||||||
|
Short-term fund |
– | – | 4,428 | 4,428 | 4 | |||||||||||||||||||||||||||||||||||
|
Guaranteed deposit account |
$ | 10,918 | 10,918 | 7 | $ | 7,595 | 7,595 | 8 | ||||||||||||||||||||||||||||||||
|
Limited partnerships |
2,635 | 2,635 | 2 | 1,499 | 1,499 | 2 | ||||||||||||||||||||||||||||||||||
| $ | 13,332 | $ | 133,871 | $ | 13,553 | $ | 160,756 | 100 | $ | 10,856 | $ | 78,789 | $ | 9,094 | $ | 98,739 | 100 | |||||||||||||||||||||||
Valuation methodologies used to measure pension plan investments at fair value are as follows:
Company common stock – Shares of the Company’s common stock are valued at the last reported sales price on the last business day of the plan year.
Mutual funds – These funds are valued at quoted market prices which represent the net asset values of shares held by the plan at year-end.
Insurance company pooled separate accounts – Participation units in these accounts are valued at quoted redemption values on the last business day of the plan year.
Guaranteed deposit account – This account is stated at book value as determined by the trustee, which approximates fair value. The account is credited with earnings from the underlying investments and charged for participants’ withdrawals and administrative expenses.
152
Table of Contents
Limited partnerships – These partnerships are stated at book value, which approximates fair value and is determined from the partnership’s capital account balance for the plan’s proportional interest. The capital account is credited with realized and unrealized earnings from the underlying investments and charged for operating expenses and distributions.
Shares of Company common stock were 217,398 and 283,405 at December 31, 2010 and 2009, respectively. Dividends received by the plan were approximately $12 thousand in 2010 and $18 thousand in 2009.
The following reconciles the beginning and ending balances of assets measured at fair value on a recurring basis using Level 3 inputs:
| Level 3 Instruments | ||||||||||||||||
| Year Ended December 31, | ||||||||||||||||
| 2010 | 2009 | |||||||||||||||
| (In thousands) |
Guaranteed
deposit account |
Limited
partnerships |
Guaranteed
deposit account |
Limited
partnerships |
||||||||||||
|
Balance at beginning of year |
$ | 7,595 | $ | 1,499 | $ | 8,197 | $ | 818 | ||||||||
|
Net increases (decreases) included in plan statement of changes in net assets available for benefits: |
||||||||||||||||
|
Net appreciation (depreciation) in fair value of investments: |
||||||||||||||||
|
Realized |
– | – | – | – | ||||||||||||
|
Unrealized |
– | 311 | – | (82 | ) | |||||||||||
|
Interest and dividends |
463 | – | 325 | – | ||||||||||||
|
Purchases, sales, issuances, and settlements, net |
2,860 | 825 | (927 | ) | 763 | |||||||||||
|
Balance at end of year |
$ | 10,918 | $ | 2,635 | $ | 7,595 | $ | 1,499 | ||||||||
Defined Contribution Plan
Payshelter – This is a 401(k) and employee stock ownership plan under which employees select from several investment alternatives. Employees can contribute up to 80% of their earnings subject to the annual maximum allowed contribution. The Company matches 100% of the first 3% of employee contributions and 50% of the next 2% of employee contributions. Matching contributions are invested in the Company’s common stock and amounted to $19.3 million in 2010, $19.8 million in 2009, and $20.6 million in 2008.
The Payshelter plan also has a noncontributory profit sharing feature which is discretionary and may range from 0% to 6% of eligible compensation based upon the Company’s return on average common equity for the year. No profit sharing expense has been accrued since 2007. The profit sharing contribution is invested in the Company’s common stock.
21. FAIR VALUE
Fair Value Measurements
Effective January 1, 2010, we adopted ASU No. 2010-06, Improving Disclosures about Fair Value Measurements . This new accounting guidance under ASC 820 requires additional disclosures including, among other things, (1) the amounts and reasons for certain significant transfers among the three hierarchy levels of inputs, (2) the gross, rather than net, basis for certain Level 3 rollforward information, (3) use of a “class” basis rather than a “major category” basis for assets and liabilities, and (4) valuation techniques and inputs used to estimate Level 2 and Level 3 fair value measurements. The following information incorporates these new disclosure requirements except for the Level 3 rollforward information which is not required until the first quarter of 2011.
153
Table of Contents
Fair value is defined under ASC 820 as the exchange price that would be received for an asset or paid to transfer a liability (an exit price) in the principal or most advantageous market for the asset or liability in an orderly transaction between market participants on the measurement date. To measure fair value, a hierarchy has been established that requires an entity to maximize the use of observable inputs and minimize the use of unobservable inputs. This hierarchy uses three levels of inputs to measure the fair value of assets and liabilities as follows:
Level 1 – Quoted prices in active markets for identical assets or liabilities; includes U.S. Treasury and other U.S. Government and agency securities actively traded in over-the-counter markets; mutual funds and stock; securities sold, not yet purchased; and derivatives.
Level 2 – Observable inputs other than Level 1 including quoted prices for similar assets or liabilities, quoted prices in less active markets, or other observable inputs that can be corroborated by observable market data; also includes derivative contracts whose value is determined using a pricing model with observable market inputs or can be derived principally from or corroborated by observable market data. This category generally includes U.S. Government and agency securities; municipal securities; CDO securities; mutual funds and stock; private equity investments; securities sold, not yet purchased; and derivatives.
Level 3 – Unobservable inputs supported by little or no market activity for financial instruments whose value is determined using pricing models, discounted cash flow methodologies, or similar techniques, as well as instruments for which the determination of fair value requires significant management judgment or estimation; also includes observable inputs for nonbinding single dealer quotes not corroborated by observable market data. This category generally includes municipal securities; private equity investments, most CDO securities, and the total return swap.
We use fair value to measure certain assets and liabilities on a recurring basis when fair value is the primary measure for accounting. This is done primarily for AFS and trading investment securities; private equity investments; securities sold, not yet purchased; and derivatives. Fair value is used on a nonrecurring basis to measure certain assets when applying lower of cost or market accounting or when adjusting carrying values, such as for loans held for sale, impaired loans, and other real estate owned. Fair value is also used when evaluating impairment on certain assets, including HTM and AFS securities, goodwill, core deposit and other intangibles, long-lived assets, and for disclosures of certain financial instruments.
Available-for-sale and trading
AFS and trading investment securities are fair valued under Level 1 using quoted market prices when available for identical securities. When quoted prices are not available, fair values are determined under Level 2 using quoted prices for similar securities or independent pricing services that incorporate observable market data when possible. The largest portion of AFS securities include certain CDOs backed by trust preferred securities issued by banks and insurance companies and, to a lesser extent, by REITs. These securities are fair valued primarily under Level 3.
U.S. Treasury, agencies and corporations
Valuation inputs utilized by the independent pricing service for those U.S. Treasury, agency and corporation securities under Level 2 include benchmark yields, reported trades, broker/dealer quotes, issuer spreads, benchmark securities, bids, offers, and reference data including market research publications. Also included are data from the vendor trading platform.
Municipal securities
Valuation inputs utilized by the independent pricing services for those municipal securities under Level 2 include the same inputs used for U.S. Treasury, agency and corporation securities. Also included are reported trades and material event notices from the Municipal Securities Rulemaking Board, plus new issue data. Municipal securities under Level 3 are fair valued similar to the auction rate securities discussed subsequently.
154
Table of Contents
Trust preferred collateralized debt obligations
Substantially all the CDO portfolio is fair valued under Level 3 using an income-based cash flow modeling approach incorporating several methodologies that primarily include internal and third party models. In addition, each quarter we seek to obtain information for all actual trades of securities in this asset class. We consider this information to determine whether the comparability of the security and the orderliness of the trades make such reported prices suitable for inclusion as or consideration in our fair value estimates in accordance with ASU 2010-06.
Trust preferred CDO internal model – A licensed third party cash flow model, which requires the Company to input its own default assumptions, is used to estimate fair values of bank and insurance trust preferred CDOs. For privately owned banks, we utilize a statistical regression of quarterly regulatory ratios that we have identified as predictive of future bank failures to create a credit-specific probability of default (“PD”) for each issuer. The inputs are updated quarterly to include the most recent available financial ratios and the regression formula is updated periodically to utilize those financial ratios which have best predicted bank failures during this credit cycle (“ratio-based approach”).
For publicly traded banks, we first utilize a licensed third party proprietary reduced form model derived using logistic regression on a historical default database to produce PDs. This model requires equity valuation related inputs (along with other macro and issuer-specific inputs) to produce PDs, and therefore cannot be used for privately owned banks.
Nearly all of the failures within our predominantly bank CDO pools have come from those banks that have previously deferred the payment of interest on their trust preferred securities. The terms of the securities within the CDO pools generally allow for deferral of current interest for five years without causing default.
We have found that for publicly traded deferring banks, the ratio-based approach generally resulted in higher PDs than did the licensed third party proprietary reduced model for banks that subsequently failed. To better project publicly traded bank failures, we utilized the higher of the PDs from our ratio-based approach and those from the licensed third party model for publicly traded deferring banks. At December 31, 2010, we began utilizing the same approach for publicly traded performing banks. Our ratio-based approach, while generally referencing trailing quarter regulatory ratios, seeks to incorporate the most recent available information. In 2010, we utilized pro forma capital ratios for eight deferring publicly traded banks in order to reflect the significant capital raises completed by these banks in either the third or fourth quarter. These capital raises were or will be included in these banks’ normal regulatory filings in the subsequent quarter.
After identifying collateral level PDs, we modify the PDs of deferring collateral by a calibration adjustment. The calibration adjustment was calculated as the average difference between the actual 100% default probability for all banks failing in the previous three quarters (both CDO and non-CDO banks) and the PD generated for each deferring bank using the ratio-based approach. Ratio-based PDs for deferring banks were first used in the fourth quarter of 2009 when the adjustment upward was 7.8%. The calibration adjustments upward for 2010 were 6.6% for the first and second quarters, 5.1% for the third quarter, and 4.8% for the fourth quarter, from the level produced by the collateral level PD in the relevant quarter. The resulting effective PDs at December 31, 2010 ranged from 100% for the “worst” deferring banks to 4.8% for the “best” deferring banks. The weighted average assumed loss rate on deferring collateral was 30% and 44% at December 31, 2010 and 2009, respectively.
The licensed third party cash flow model projects the expected cash flows for CDO tranches. Estimates of expected loss for the individual pieces of underlying collateral are aggregated to arrive at a pool-level expected loss rate for each CDO. These loss assumptions are applied to the CDO’s structure to generate cash flow projections for each tranche of the CDO. The presence of OTTI is identified and the amount of the credit component of OTTI is calculated by discounting the resulting loss-adjusted cash flows at each tranche’s coupon rate and comparing that value to the Company’s amortized cost of the tranche. The fair value of each tranche is determined by discounting its resultant loss-adjusted cash flows with appropriate current market-based discount rates.
155
Table of Contents
The discount rate assumption used for valuation purposes for each CDO tranche is derived from trading yields on publicly traded trust preferred securities and projected PDs on the underlying issuers. The data set includes a publicly traded trust preferred security which is in deferral with regard to the payment of current interest. The effective yields on the traded securities, including the deferring security, are used to determine a relationship between the effective yield and expected losses, which relationship is then considered along with other third party or market data in order to identify appropriate discount rates to be applied to the CDOs.
Our December 31, 2010 valuations utilized a discount rate range of LIBOR+3.77% for the highest quality/most over-collateralized tranches and LIBOR+46.8% for the lowest credit quality tranche in order to reflect market level assumptions for structured finance securities. These discount rates are in addition to the credit-related discounts applied to the cash flows for each tranche. The range of the projected cumulative credit loss of the CDO pools varies extensively across pools and at December 31, 2010 ranged between 8.4% and 78.6%.
In the third quarter of 2010, we changed certain modeling assumptions which included increasing prepayment speeds due to the probable early redemption by larger investment grade rated issuing banks of their trust preferred securities. The Dodd-Frank Act includes a phased-in disallowance of certain trust preferred securities as Tier 1 capital. The effect of the assumption changes was not significant to the fair value of these securities, but did account for $11.6 million of the $85.4 million of OTTI discussed in Note 5.
CDO tranches with greater uncertainty in their cash flows are discounted at higher rates than those that market participants would use for tranches with more stable expected cash flows (e.g., as a result of more subordination and/or better credit quality in the underlying collateral). The high end of the discount rate spectrum was applied to tranches in which minor changes in future default assumptions produced substantial deterioration in tranche cash flows. These discount rates are applied to credit-stressed cash flows, which constitute each tranche’s expected cash flows; discount rates are not applied to a hypothetical contractual cash flow.
Certain REIT and ABS CDOs are fair valued by third party services using their proprietary models. These models utilize relevant data assumptions, which we evaluate for reasonableness. These assumptions include, but are not limited to, discount rates, PDs, loss-given-default rates, over-collateralization levels, and rating transition probability matrices from rating agencies. See subsequent discussion regarding key model inputs and assumptions. The model prices obtained from third party services were evaluated for reasonableness including quarter to quarter changes in assumptions and comparison to other available data, which included third party and internal model results and valuations.
Auction rate securities
Auction rate securities are fair valued under Level 3 using a market approach based on various market data inputs, including AAA municipal and corporate bond yield curves, credit ratings and leverage of each closed-end fund, and market yields for municipal bonds and commercial paper.
Private equity investments
Private equity investments valued under Level 2 on a recurring basis are investments in partnerships that invest in certain financial services and real estate companies, some of which are publicly traded. Fair values are determined from net asset values, or their equivalents, provided by the partnerships. These fair values are determined on the last business day of the month using values from the primary exchange. In the case of illiquid or nontraded assets, the partnerships obtain fair values from independent sources. We have no unfunded commitments to these partnerships and redemption is available annually.
Private equity investments valued under Level 3 on a recurring basis are recorded initially at acquisition cost, which is considered the best indication of fair value unless there have been material subsequent positive or negative developments that justify an adjustment in the fair value estimate. Subsequent adjustments to recorded fair values are based as necessary on current and projected financial performance, recent financing activities, economic and market conditions, market comparables, market liquidity, sales restrictions, and other factors.
156
Table of Contents
Derivatives
Derivatives are fair valued according to their classification as either exchange-traded or over-the-counter (“OTC”). Exchange-traded derivatives consist of forward currency exchange contracts that have been fair valued under Level 1 because they are traded in active markets. OTC derivatives, including those for customers, consist of interest rate swaps and options and, in 2009, energy commodity derivatives. These derivatives are fair valued under Level 2 using third party services. Observable market inputs include yield curves (the LIBOR swap curve and applicable basis swap curves), foreign exchange rates, commodity prices, option volatilities, counterparty credit risk, and other related data. Credit valuation adjustments are required to reflect both our own nonperformance risk and the respective counterparty’s nonperformance risk. These adjustments are determined generally by applying a credit spread for the counterparty or the Company as appropriate to the total expected exposure of the derivative. Amounts disclosed in the following schedules include the foreign currency exchange contracts that are not included in Note 8 in accordance with ASC 815. The amounts are also presented net of the cash collateral offsets discussed in Note 8. Also see the discussion in Note 8 for the determination of fair value of the total return swap.
Securities sold, not yet purchased
Securities sold, not yet purchased are fair valued under Level 1 when quoted prices are available for the securities involved. Those under Level 2 are fair valued similar to trading account investment securities.
157
Table of Contents
Assets and liabilities measured at fair value by class on a recurring basis are summarized as follows:
| December 31, 2010 | ||||||||||||||||
| (In thousands) | Level 1 | Level 2 | Level 3 | Total | ||||||||||||
|
ASSETS |
||||||||||||||||
|
Investment securities: |
||||||||||||||||
|
Available-for-sale: |
||||||||||||||||
|
U.S. Treasury, agencies and corporations |
$ | 704,170 | $ | 1,654,127 | $ | 2,358,297 | ||||||||||
|
Municipal securities |
135,419 | $ | 22,289 | 157,708 | ||||||||||||
|
Asset-backed securities: |
||||||||||||||||
|
Trust preferred – banks and insurance |
1,703 | 1,241,694 | 1,243,397 | |||||||||||||
|
Trust preferred – real estate investment trusts |
19,165 | 19,165 | ||||||||||||||
|
Auction rate |
109,609 | 109,609 | ||||||||||||||
|
Other (including ABS CDOs) |
11,076 | 69,630 | 80,706 | |||||||||||||
|
Mutual funds and stock |
230,264 | 6,596 | 236,860 | |||||||||||||
| 934,434 | 1,808,921 | 1,462,387 | 4,205,742 | |||||||||||||
|
Trading account |
48,667 | 48,667 | ||||||||||||||
|
Other noninterest-bearing investments: |
||||||||||||||||
|
Private equity |
4,916 | 141,690 | 146,606 | |||||||||||||
|
Other assets: |
||||||||||||||||
|
Derivatives: |
||||||||||||||||
|
Interest rate related and other |
32,087 | 32,087 | ||||||||||||||
|
Interest rate swaps for customers |
64,509 | 64,509 | ||||||||||||||
|
Foreign currency exchange contracts |
3,796 | 3,796 | ||||||||||||||
| 3,796 | 96,596 | 100,392 | ||||||||||||||
| $ | 938,230 | $ | 1,959,100 | $ | 1,604,077 | $ | 4,501,407 | |||||||||
|
LIABILITIES |
||||||||||||||||
|
Securities sold, not yet purchased |
$ | 9,719 | $ | 32,829 | $ | 42,548 | ||||||||||
|
Other liabilities: |
||||||||||||||||
|
Derivatives: |
||||||||||||||||
|
Interest rate related and other |
2,577 | 2,577 | ||||||||||||||
|
Interest rate swaps for customers |
68,141 | 68,141 | ||||||||||||||
|
Foreign currency exchange contracts |
3,385 | 3,385 | ||||||||||||||
|
Total return swap |
$ | 15,925 | 15,925 | |||||||||||||
| 3,385 | 70,718 | 15,925 | 90,028 | |||||||||||||
|
Other |
561 | 561 | ||||||||||||||
| $ | 13,104 | $ | 103,547 | $ | 16,486 | $ | 133,137 | |||||||||
158
Table of Contents
| December 31, 2009 | ||||||||||||||||
| (In thousands) | Level 1 | Level 2 | Level 3 | Total | ||||||||||||
|
ASSETS |
||||||||||||||||
|
Investment securities: |
||||||||||||||||
|
Available-for-sale: |
||||||||||||||||
|
U.S. Treasury and agencies |
$ | 24,777 | $ | 1,403,680 | $ | 1,428,457 | ||||||||||
|
Municipal securities |
177,180 | $ | 64,314 | 241,494 | ||||||||||||
|
Asset-backed securities: |
||||||||||||||||
|
Trust preferred – banks and insurance |
1,656 | 1,359,444 | 1,361,100 | |||||||||||||
|
Trust preferred – real estate investment trusts |
24,018 | 24,018 | ||||||||||||||
|
Auction rate |
159,440 | 159,440 | ||||||||||||||
|
Other |
14,722 | 62,430 | 77,152 | |||||||||||||
|
Mutual funds and stock |
357,175 | 6,783 | 363,958 | |||||||||||||
|
Trading account |
23,543 | 23,543 | ||||||||||||||
|
Other noninterest-bearing investments: |
||||||||||||||||
|
Private equity |
22,850 | 158,941 | 181,791 | |||||||||||||
|
Other assets: |
||||||||||||||||
|
Derivatives |
2,976 | 134,020 | 136,996 | |||||||||||||
| $ | 384,928 | $ | 1,784,434 | $ | 1,828,587 | $ | 3,997,949 | |||||||||
|
LIABILITIES |
||||||||||||||||
|
Securities sold, not yet purchased |
$ | 43,404 | $ | 43,404 | ||||||||||||
|
Other liabilities: |
||||||||||||||||
|
Derivatives |
$ | 2,833 | 71,842 | 74,675 | ||||||||||||
|
Other |
$ | 522 | 522 | |||||||||||||
| $ | 2,833 | $ | 115,246 | $ | 522 | $ | 118,601 | |||||||||
Selected additional information regarding key model inputs and assumptions used to fair value certain asset-backed securities by class under Level 3 include the following at December 31, 2010:
| (Dollars in thousands) |
Fair value at
December 31, 2010 |
Valuation
approach |
Constant default rate
(“CDR”) |
Loss
severity |
Prepayment rate | |||||||||||||||
|
Asset-backed securities: |
||||||||||||||||||||
|
Trust preferred – predominantly banks |
$ | 1,044,382 | Income | Pool specific 3 | 100 | % | Pool specific 7 | |||||||||||||
|
Trust preferred – predominantly insurance |
364,878 | Income | Pool specific 4 | 100 | % | 5.5% per year | ||||||||||||||
|
Trust preferred – individual banks |
23,082 | Market | ||||||||||||||||||
| 1,432,342 | 1 | |||||||||||||||||||
|
Trust preferred – real estate investment trusts |
19,165 | Income | Pool specific 5 | 10-100 | % | 0% per year | ||||||||||||||
|
Other (including ABS CDOs) |
97,388 | 2 | Income | Collateral specific 6 | 0-100 | % |
|
Collateral weighted
average life |
|
|||||||||||
| 1 |
Includes $1,243.4 million of AFS securities and $188.9 million of HTM securities. |
| 2 |
Includes $80.7 million of AFS securities and $16.7 million of HTM securities. |
| 3 |
CDR ranges: yr 1 – 0% to 27.4%; yrs 2-5 – 0% to 1.12%; yrs 6 to maturity – 0.30%. |
| 4 |
CDR ranges: yr 1 – 0.94% to 4.032%; yrs 2-5 – 0.14% to 0.21%; yrs 6 to maturity – 0.30%. |
| 5 |
CDR ranges: yr 1 – 4.6% to 8.7%; yrs 2-3 – 2.6% to 5.9%; yrs 4-6 – 1.0%; yrs 6 to maturity – 0.50%. |
| 6 |
These are predominantly ABS CDOs whose collateral is rated. CDR and loss severities are built up from the loan level and vary by collateral ratings, asset class, and vintage. |
| 7 |
CPR ranges: yrs 1-3 – 0% to 4.9%; yrs 4-5 – 0% to 14.97%; yrs 6 to maturity – 0.20%. |
159
Table of Contents
In the following discussion of our investment portfolio, we have included certain credit rating information because the information is one indication of the degree of credit risk to which we are exposed, and significant changes in ratings classifications for our investment portfolio could indicate an increased level of risk for us.
The following presents the percentage of total fair value of predominantly bank trust preferred CDOs by vintage year (origination date) according to original rating:
| (Dollars in thousands) |
Fair value at
December 31, 2010 |
Percentage of total fair
value |
Percentage of
total fair value by vintage |
|||||||||||||||||
|
Vintage year |
AAA | A | BBB | |||||||||||||||||
|
2001 |
$ | 118,160 | 10.4 | % | 0.9 | % | 0.0 | % | 11.3 | % | ||||||||||
|
2002 |
240,012 | 20.8 | 2.2 | 0.0 | 23.0 | |||||||||||||||
|
2003 |
386,763 | 27.8 | 9.1 | 0.2 | 37.1 | |||||||||||||||
|
2004 |
172,074 | 7.2 | 9.2 | 0.0 | 16.4 | |||||||||||||||
|
2005 |
17,188 | 1.0 | 0.5 | 0.1 | 1.6 | |||||||||||||||
|
2006 |
73,680 | 2.6 | 3.9 | 0.6 | 7.1 | |||||||||||||||
|
2007 |
36,505 | 3.5 | 0.0 | 0.0 | 3.5 | |||||||||||||||
| $ | 1,044,382 | 73.3 | % | 25.8 | % | 0.9 | % | 100.0 | % | |||||||||||
The following reconciles the beginning and ending balances of assets and liabilities that are measured at fair value by class on a recurring basis using Level 3 inputs:
| Level 3 Instruments | ||||||||||||||||||||||||||||||||
| Year Ended December 31, 2010 | ||||||||||||||||||||||||||||||||
| (In thousands) |
Municipal
securities |
Trust preferred –
banks and insurance |
Trust
preferred – REIT |
Auction
rate |
Other
asset- backed |
Private
equity investments |
Derivatives |
Other
liabilities |
||||||||||||||||||||||||
|
Balance at January 1, 2010 |
$ | 64,314 | $ | 1,359,444 | $ | 24,018 | $ | 159,440 | $ | 62,430 | $ | 158,941 | $ | – | $ | (522 | ) | |||||||||||||||
|
Total net gains (losses) included in: |
||||||||||||||||||||||||||||||||
|
Statement of income: |
||||||||||||||||||||||||||||||||
|
Dividends and other investment income |
6,856 | |||||||||||||||||||||||||||||||
|
Fair value and nonhedge derivative loss |
(22,795 | ) | ||||||||||||||||||||||||||||||
|
Equity securities losses, net |
(6,388 | ) | ||||||||||||||||||||||||||||||
|
Fixed income securities
|
4,157 | 2,369 | 3,815 | 358 | ||||||||||||||||||||||||||||
|
Net impairment losses on investment securities |
(68,002 | ) | (10,628 | ) | (6,773 | ) | ||||||||||||||||||||||||||
|
Other noninterest expense |
(39 | ) | ||||||||||||||||||||||||||||||
|
Other comprehensive
|
(1,157 | ) | (41,933 | ) | 5,725 | (603 | ) | 27,501 | ||||||||||||||||||||||||
|
Purchases, sales, issuances, and settlements, net |
(45,025 | ) | (10,184 | ) | 50 | (53,043 | ) | (13,886 | ) | (17,719 | ) | 6,870 | ||||||||||||||||||||
|
Balance at December 31, 2010 |
$ | 22,289 | $ | 1,241,694 | $ | 19,165 | $ | 109,609 | $ | 69,630 | $ | 141,690 | $ | (15,925 | ) | $ | (561 | ) | ||||||||||||||
160
Table of Contents
| Level 3 Instruments | ||||||||||||||||||||||||||||||||
| Year Ended December 31, 2009 | ||||||||||||||||||||||||||||||||
| (In thousands) |
Municipal
securities |
Trust preferred –
banks and insurance |
Trust
preferred – REIT |
Auction
rate |
Other
asset- backed |
Trading
account 1 |
Private
equity investments |
Other
liabilities |
||||||||||||||||||||||||
|
Balance at January 1, 2009 |
$ | – | $ | 659,253 | $ | 23,897 | $ | 1,710 | $ | 65,557 | $ | 956 | $ | 143,511 | $ | (527 | ) | |||||||||||||||
|
Total net gains (losses) included in: |
||||||||||||||||||||||||||||||||
|
Statement of income: |
||||||||||||||||||||||||||||||||
|
Dividends and other investment loss |
(10,626 | ) | ||||||||||||||||||||||||||||||
|
Fair value and nonhedge derivative loss |
(956 | ) | ||||||||||||||||||||||||||||||
|
Equity securities gains, net |
109 | |||||||||||||||||||||||||||||||
|
Fixed income securities gains (losses), net |
16 | (10,491 | ) | 2,126 | 95 | |||||||||||||||||||||||||||
|
Net impairment losses on investment securities |
(130,898 | ) | (87,867 | ) | (11,110 | ) | ||||||||||||||||||||||||||
|
Valuation losses on securities purchased |
(6,977 | ) | (172,729 | ) | (8,945 | ) | (17,265 | ) | (1,774 | ) | ||||||||||||||||||||||
|
Other noninterest expense |
5 | |||||||||||||||||||||||||||||||
|
Other comprehensive income (loss) |
1,376 | (41,582 | ) | 56,480 | (239 | ) | 7,537 | |||||||||||||||||||||||||
|
Fair value of HTM securities transferred to AFS |
565,282 | 15,280 | 15,674 | |||||||||||||||||||||||||||||
|
Purchases, sales, issuances, and settlements, net |
66,624 | 490,609 | 25,173 | 167,928 | (13,549 | ) | 25,947 | |||||||||||||||||||||||||
|
Net transfers in |
3,275 | 5,180 | ||||||||||||||||||||||||||||||
|
Balance at December 31, 2009 |
$ | 64,314 | $ | 1,359,444 | $ | 24,018 | $ | 159,440 | $ | 62,430 | $ | – | $ | 158,941 | $ | (522 | ) | |||||||||||||||
| 1 |
Elected under fair value option, as discussed subsequently. |
The preceding reconciling amounts using Level 3 inputs include the following realized gains (losses):
| (In thousands) |
Year Ended
December 31, |
|||||||
| 2010 | 2009 | |||||||
|
Dividends and other investment income |
$ | 8,215 | $ | 1,427 | ||||
|
Equity securities losses, net |
(1,366 | ) | – | |||||
|
Fixed income securities gains (losses), net |
10,699 | (8,254 | ) | |||||
|
Net impairment losses on investment securities sold |
– | (76,686 | ) | |||||
Assets with fair value changes that are measured at fair value by class on a nonrecurring basis are summarized as follows:
| Fair value at December 31, 2010 |
Gains (losses) from
fair value changes Year Ended December 31, 2010 |
|||||||||||||||||||
| Level 1 | Level 2 | Level 3 | Total | |||||||||||||||||
|
ASSETS |
||||||||||||||||||||
|
HTM securities adjusted for OTTI |
$ | – | $ | – | $ | 3,502 | $ | 3,502 | $ | (151 | ) | |||||||||
|
Impaired loans |
– | 97,352 | 97,352 | (128,072 | ) | |||||||||||||||
|
Other real estate owned |
132,350 | – | 132,350 | (148,595 | ) | |||||||||||||||
| $ | – | $ | 132,350 | $ | 100,854 | $ | 233,204 | $ | (276,818 | ) | ||||||||||
161
Table of Contents
| Fair value at December 31, 2009 |
Gains (losses) from
fair value changes Year Ended December 31, 2009 |
|||||||||||||||||||
| Level 1 | Level 2 | Level 3 | Total | |||||||||||||||||
|
ASSETS |
||||||||||||||||||||
|
HTM securities adjusted for OTTI |
$ | – | $ | – | $ | 3,100 | $ | 3,100 | $ | (3,301 | ) | |||||||||
|
Loans held for sale |
15,571 | – | 15,571 | 60 | ||||||||||||||||
|
Impaired loans |
– | 250,035 | 250,035 | (234,534 | ) | |||||||||||||||
|
Other real estate owned |
143,541 | – | 143,541 | (118,641 | ) | |||||||||||||||
| $ | – | $ | 159,112 | $ | 253,135 | $ | 412,247 | $ | (356,416 | ) | ||||||||||
Loans held for sale relate to loans purchased under the Small Business Administration 7(a) program. They are fair valued under Level 2 based on quotes of comparable instruments.
Impaired loans that are collateral-dependent are fair valued under Level 3 based on the fair value of the collateral. At December 31, 2010, approximately $26 million of impaired loans that began making payments during the year were reclassified from collateral-dependent to noncollateral-dependent. The loan valuations were therefore based on the present value of future cash flows discounted at the expected coupon rates over the lives of the loans. Because the loans were not discounted at market interest rates, the valuations do not represent fair value under ASC 820, and have been excluded from the nonrecurring fair value balance in the preceding table for 2010.
Other real estate owned is fair valued under Level 2 at the lower of cost or fair value based on property appraisals at the time the property is recorded in OREO and as appropriate thereafter.
Fair Value Option
ASC 825, Financial Instruments , allows for the option to report certain financial assets and liabilities at fair value initially and at subsequent measurement dates with changes in fair value included in earnings. The fair value option may be applied instrument by instrument, but is on an irrevocable basis. The one AFS REIT trust preferred CDO security indicated previously was sold in December 2009.
Fair Value of Certain Financial Instruments
Following is a summary of the carrying values and estimated fair values of certain financial instruments:
| December 31, 2010 | December 31, 2009 | |||||||||||||||
| (In thousands) |
Carrying
value |
Estimated
fair value |
Carrying
value |
Estimated
fair value |
||||||||||||
|
Financial assets: |
||||||||||||||||
|
HTM investment securities |
$ | 840,642 | $ | 788,354 | $ | 869,595 | $ | 833,455 | ||||||||
|
Loans and leases (including loans held for sale), net of allowance |
35,513,376 | 35,203,799 | 38,866,215 | 38,355,658 | ||||||||||||
|
Financial liabilities: |
||||||||||||||||
|
Time deposits |
$ | 4,173,449 | $ | 4,216,371 | $ | 5,614,867 | $ | 5,675,127 | ||||||||
|
Foreign deposits |
1,654,651 | 1,655,852 | 1,679,028 | 1,679,568 | ||||||||||||
|
Other short-term borrowings |
166,394 | 168,221 | 121,273 | 121,791 | ||||||||||||
|
Long-term debt (less fair value hedges) |
1,928,827 | 2,367,542 | 2,009,230 | 2,157,297 | ||||||||||||
This summary excludes financial assets and liabilities for which carrying value approximates fair value. For financial assets, these include cash and due from banks and money market investments. For financial liabilities, these include demand, savings and money market deposits, and federal funds purchased and security repurchase agreements. The estimated fair value of demand, savings and money market deposits is the amount payable on
162
Table of Contents
demand at the reporting date. Carrying value is used because the accounts have no stated maturity and the customer has the ability to withdraw funds immediately. Also excluded from the summary are financial instruments recorded at fair value on a recurring basis, as previously described.
The fair value of loans is estimated by discounting future cash flows on “pass” grade loans using the LIBOR yield curve adjusted by a factor which reflects the credit and interest rate risk inherent in the loan. These future cash flows are then reduced by the estimated “life-of-the-loan” aggregate credit losses in the loan portfolio. These adjustments for lifetime future credit losses are highly judgmental because the Company does not have a validated model to estimate lifetime credit losses on large portions of its loan portfolio. The estimate of lifetime credit losses is adjusted quarterly as necessary to reflect the most recent loss experience during the current prolonged cycle of economic weakness. Impaired loans are not included in this credit adjustment as they are already considered to be held at fair value. Loans, other than those held for sale, are not normally purchased and sold by the Company, and there are no active trading markets for most of this portfolio.
The fair value of time and foreign deposits, and other short-term borrowings, is estimated by discounting future cash flows using the LIBOR yield curve. The estimated fair value of long-term debt is based on actual market trades (i.e., an asset value) when available or discounting cash flows using the LIBOR yield curve adjusted for credit spreads.
These fair value disclosures represent our best estimates based on relevant market information and information about the financial instruments. Fair value estimates are based on judgments regarding future expected loss experience, current economic conditions, risk characteristics of the various instruments, and other factors. These estimates are subjective in nature and involve uncertainties and matters of significant judgment and therefore cannot be determined with precision. Changes in the above methodologies and assumptions could significantly affect the estimates.
Further, certain financial instruments and all nonfinancial instruments are excluded from the applicable disclosure requirements. Therefore, the fair value amounts shown in the schedule do not, by themselves, represent the underlying value of the Company as a whole.
22. OPERATING SEGMENT INFORMATION
We manage our operations and prepare management reports and other information with a primary focus on geographical area. As of December 31, 2010, we operate eight community/regional banks in distinct geographical areas. Performance assessment and resource allocation are based upon this geographical structure. The operating segment identified as “Other” includes the Parent, Zions Management Services Company (“ZMSC”), certain nonbank and financial service subsidiaries, TCBO, and eliminations of transactions between segments.
ZMSC provides internal technology and operational services to affiliated operating businesses of the Company. ZMSC charges most of its costs to the affiliates on an approximate break-even basis.
The accounting policies of the individual operating segments are the same as those of the Company as described in Note 1. Transactions between operating segments are primarily conducted at fair value, resulting in profits that are eliminated for reporting consolidated results of operations. Operating segments pay for centrally provided services based upon estimated or actual usage of those services.
During 2010 and 2009, certain subsidiary banks sold investment securities to the Parent at their current fair value, which was less than carrying value. The “Loss on sale of investment securities to Parent” is shown separately in the following schedules as a component of other noninterest income. The amounts are eliminated in consolidation in the Other segment.
163
Table of Contents
The following is a summary of selected operating segment information:
| (In millions) | Zions Bank | CB&T | Amegy | |||||||||||||||||||||||||||||||||
| 2010 | 2009 | 2008 | 2010 | 2009 | 2008 | 2010 | 2009 | 2008 | ||||||||||||||||||||||||||||
|
Net interest income |
$ | 724.7 | $ | 690.4 | $ | 662.5 | $ | 495.6 | $ | 465.3 | $ | 414.3 | $ | 392.3 | $ | 385.7 | $ | 370.1 | ||||||||||||||||||
|
Provision for loan losses |
350.6 | 400.4 | 163.1 | 149.9 | 251.5 | 82.9 | 118.7 | 406.1 | 71.9 | |||||||||||||||||||||||||||
|
Net interest income after provision for loan losses |
374.1 | 290.0 | 499.4 | 345.7 | 213.8 | 331.4 | 273.6 | (20.4 | ) | 298.2 | ||||||||||||||||||||||||||
|
Net impairment losses on investment securities |
– | (35.2 | ) | (79.4 | ) | – | (31.8 | ) | (118.0 | ) | – | – | – | |||||||||||||||||||||||
|
Loss on sale of investment securities to Parent |
(54.8 | ) | (75.8 | ) | – | – | (288.1 | ) | – | – | – | – | ||||||||||||||||||||||||
|
Valuation losses on securities purchased |
– | (203.0 | ) | (13.1 | ) | – | – | – | – | (7.5 | ) | – | ||||||||||||||||||||||||
|
Gain on subordinated debt modification |
– | – | – | – | – | – | – | – | – | |||||||||||||||||||||||||||
|
Acquisition related gains |
– | – | – | – | 152.7 | – | – | – | – | |||||||||||||||||||||||||||
|
Other noninterest income |
193.9 | 199.3 | 207.3 | 100.3 | 152.8 | 82.6 | 143.0 | 136.1 | 192.9 | |||||||||||||||||||||||||||
|
Total revenue |
513.2 | 175.3 | 614.2 | 446.0 | 199.4 | 296.0 | 416.6 | 108.2 | 491.1 | |||||||||||||||||||||||||||
|
Noninterest expense |
576.8 | 522.5 | 463.4 | 346.9 | 295.2 | 239.0 | 334.9 | 345.6 | 305.2 | |||||||||||||||||||||||||||
|
Impairment loss on goodwill |
– | – | – | – | – | – | – | 633.3 | – | |||||||||||||||||||||||||||
|
Income (loss) before income taxes |
(63.6 | ) | (347.2 | ) | 150.8 | 99.1 | (95.8 | ) | 57.0 | 81.7 | (870.7 | ) | 185.9 | |||||||||||||||||||||||
|
Income tax expense (benefit) |
(15.3 | ) | (144.4 | ) | 44.0 | 40.3 | (45.6 | ) | 18.4 | 23.1 | (90.3 | ) | 60.5 | |||||||||||||||||||||||
|
Net income (loss) |
(48.3 | ) | (202.8 | ) | 106.8 | 58.8 | (50.2 | ) | 38.6 | 58.6 | (780.4 | ) | 125.4 | |||||||||||||||||||||||
|
Net income (loss) applicable to noncontrolling interests |
0.1 | 0.1 | 0.1 | – | – | – | – | – | 0.3 | |||||||||||||||||||||||||||
|
Net income (loss) applicable to controlling interest |
(48.4 | ) | (202.9 | ) | 106.7 | 58.8 | (50.2 | ) | 38.6 | 58.6 | (780.4 | ) | 125.1 | |||||||||||||||||||||||
|
Preferred stock dividends |
– | – | – | – | (0.9 | ) | – | – | (1.5 | ) | – | |||||||||||||||||||||||||
|
Preferred stock redemption and conversion |
– | – | – | – | – | – | – | – | – | |||||||||||||||||||||||||||
|
Net earnings (loss) applicable to common shareholders |
$ | (48.4 | ) | $ | (202.9 | ) | $ | 106.7 | $ | 58.8 | $ | (51.1 | ) | $ | 38.6 | $ | 58.6 | $ | (781.9 | ) | $ | 125.1 | ||||||||||||||
|
Total assets |
$ | 16,157 | $ | 17,652 | $ | 20,778 | $ | 10,766 | $ | 11,097 | $ | 10,137 | $ | 11,406 | $ | 11,145 | $ | 12,406 | ||||||||||||||||||
|
Net loans and leases 1 |
12,898 | 13,990 | 14,684 | 8,444 | 8,951 | 7,861 | 7,466 | 8,262 | 9,027 | |||||||||||||||||||||||||||
|
Total deposits |
13,631 | 13,823 | 16,118 | 9,219 | 9,760 | 7,964 | 8,906 | 8,880 | 8,625 | |||||||||||||||||||||||||||
|
Shareholder’s equity: |
||||||||||||||||||||||||||||||||||||
|
Preferred equity |
480 | 460 | 250 | 262 | 262 | 158 | 488 | 376 | 80 | |||||||||||||||||||||||||||
|
Common equity |
1,269 | 1,282 | 1,044 | 1,174 | 1,120 | 1,097 | 1,493 | 1,435 | 2,049 | |||||||||||||||||||||||||||
|
Noncontrolling interests |
– | – | 1 | – | – | – | – | – | – | |||||||||||||||||||||||||||
|
Total shareholder’s equity |
1,749 | 1,742 | 1,295 | 1,436 | 1,382 | 1,255 | 1,981 | 1,811 | 2,129 | |||||||||||||||||||||||||||
164
Table of Contents
| NBA | NSB | Vectra | ||||||||||||||||||||||||||||||||||
| (In millions) | 2010 | 2009 | 2008 | 2010 | 2009 | 2008 | 2010 | 2009 | 2008 | |||||||||||||||||||||||||||
|
Net interest income |
$ | 177.4 | $ | 179.1 | $ | 219.5 | $ | 138.4 | $ | 140.0 | $ | 159.0 | $ | 108.5 | $ | 105.3 | $ | 103.6 | ||||||||||||||||||
|
Provision for loan losses |
53.4 | 291.7 | 211.8 | 133.3 | 563.7 | 100.3 | 28.2 | 78.5 | 15.9 | |||||||||||||||||||||||||||
|
Net interest income after provision for loan losses |
124.0 | (112.6 | ) | 7.7 | 5.1 | (423.7 | ) | 58.7 | 80.3 | 26.8 | 87.7 | |||||||||||||||||||||||||
|
Net impairment losses on investment securities |
– | – | – | – | (3.3 | ) | (2.0 | ) | (1.3 | ) | (5.3 | ) | (6.4 | ) | ||||||||||||||||||||||
|
Loss on sale of investment securities to Parent |
– | – | – | – | (11.8 | ) | – | – | – | – | ||||||||||||||||||||||||||
|
Valuation losses on securities purchased |
– | – | – | – | – | – | – | – | – | |||||||||||||||||||||||||||
|
Gain on subordinated debt modification |
– | – | – | – | – | – | – | – | – | |||||||||||||||||||||||||||
|
Acquisition related gains |
– | – | – | – | 16.5 | – | – | – | – | |||||||||||||||||||||||||||
|
Other noninterest income |
32.9 | 44.0 | 46.8 | 38.4 | 60.8 | 42.8 | 29.5 | 31.4 | 29.9 | |||||||||||||||||||||||||||
|
Total revenue |
156.9 | (68.6 | ) | 54.5 | 43.5 | (361.5 | ) | 99.5 | 108.5 | 52.9 | 111.2 | |||||||||||||||||||||||||
|
Noninterest expense |
169.9 | 170.0 | 161.2 | 152.0 | 180.6 | 137.9 | 92.5 | 96.4 | 85.9 | |||||||||||||||||||||||||||
|
Impairment loss on goodwill |
– | – | 168.6 | – | – | 21.0 | – | – | 151.5 | |||||||||||||||||||||||||||
|
Income (loss) before income taxes |
(13.0 | ) | (238.6 | ) | (275.3 | ) | (108.5 | ) | (542.1 | ) | (59.4 | ) | 16.0 | (43.5 | ) | (126.2 | ) | |||||||||||||||||||
|
Income tax expense (benefit) |
(5.1 | ) | (94.4 | ) | (56.7 | ) | (38.2 | ) | (190.1 | ) | (13.6 | ) | 9.4 | (17.9 | ) | 8.8 | ||||||||||||||||||||
|
Net income (loss) |
(7.9 | ) | (144.2 | ) | (218.6 | ) | (70.3 | ) | (352.0 | ) | (45.8 | ) | 6.6 | (25.6 | ) | (135.0 | ) | |||||||||||||||||||
|
Net income (loss) applicable to noncontrolling interests |
– | – | – | – | – | – | – | – | – | |||||||||||||||||||||||||||
|
Net income (loss) applicable to controlling interest |
(7.9 | ) | (144.2 | ) | (218.6 | ) | (70.3 | ) | (352.0 | ) | (45.8 | ) | 6.6 | (25.6 | ) | (135.0 | ) | |||||||||||||||||||
|
Preferred stock dividends |
– | – | – | – | – | – | – | (0.2 | ) | – | ||||||||||||||||||||||||||
|
Preferred stock redemption and conversion |
– | – | – | – | – | – | – | – | – | |||||||||||||||||||||||||||
|
Net earnings (loss) applicable to common shareholders |
$ | (7.9 | ) | $ | (144.2 | ) | $ | (218.6 | ) | $ | (70.3 | ) | $ | (352.0 | ) | $ | (45.8 | ) | $ | 6.6 | $ | (25.8 | ) | $ | (135.0 | ) | ||||||||||
|
Total assets |
$ | 4,397 | $ | 4,524 | $ | 4,864 | $ | 4,017 | $ | 4,187 | $ | 4,063 | $ | 2,299 | $ | 2,440 | $ | 2,722 | ||||||||||||||||||
|
Net loans and leases 1 |
3,277 | 3,609 | 4,108 | 2,399 | 2,752 | 3,200 | 1,812 | 1,981 | 2,059 | |||||||||||||||||||||||||||
|
Total deposits |
3,696 | 3,784 | 3,923 | 3,424 | 3,526 | 3,514 | 1,923 | 2,005 | 2,127 | |||||||||||||||||||||||||||
|
Shareholder’s equity: |
||||||||||||||||||||||||||||||||||||
|
Preferred equity |
305 | 405 | 430 | 360 | 360 | 260 | 70 | 65 | 10 | |||||||||||||||||||||||||||
|
Common equity |
322 | 228 | 355 | 225 | 296 | 259 | 200 | 199 | 191 | |||||||||||||||||||||||||||
|
Noncontrolling interests |
– | – | – | – | – | – | – | – | – | |||||||||||||||||||||||||||
|
Total shareholder’s equity |
627 | 633 | 785 | 585 | 656 | 519 | 270 | 264 | 201 | |||||||||||||||||||||||||||
165
Table of Contents
| TCBW | Other | Consolidated Company | ||||||||||||||||||||||||||||||||||
| (In millions) | 2010 | 2009 | 2008 | 2010 | 2009 | 2008 | 2010 | 2009 | 2008 | |||||||||||||||||||||||||||
|
Net interest income |
$ | 30.0 | $ | 32.1 | $ | 33.8 | $ | (339.5 | ) | $ | (100.4 | ) | $ | 8.8 | $ | 1,727.4 | $ | 1,897.5 | $ | 1,971.6 | ||||||||||||||||
|
Provision for loan losses |
17.4 | 22.5 | 1.1 | 0.6 | 2.5 | 1.3 | 852.1 | 2,016.9 | 648.3 | |||||||||||||||||||||||||||
|
Net interest income after provision for loan losses |
12.6 | 9.6 | 32.7 | (340.1 | ) | (102.9 | ) | 7.5 | 875.3 | (119.4 | ) | 1,323.3 | ||||||||||||||||||||||||
|
Net impairment losses on investment securities |
(0.7 | ) | (1.1 | ) | (1.3 | ) | (83.4 | ) | (203.8 | ) | (96.9 | ) | (85.4 | ) | (280.5 | ) | (304.0 | ) | ||||||||||||||||||
|
Loss on sale of investment securities to Parent |
– | – | – | 54.8 | 375.7 | – | – | – | – | |||||||||||||||||||||||||||
|
Valuation losses on securities purchased |
– | – | – | – | (1.6 | ) | – | – | (212.1 | ) | (13.1 | ) | ||||||||||||||||||||||||
|
Gain on subordinated debt modification |
– | – | – | – | 508.9 | – | – | 508.9 | – | |||||||||||||||||||||||||||
|
Acquisition related gains |
– | – | – | – | – | – | – | 169.2 | – | |||||||||||||||||||||||||||
|
Other noninterest income |
2.6 | 9.4 | 4.4 | (14.7 | ) | (15.2 | ) | (98.9 | ) | 525.9 | 618.6 | 507.8 | ||||||||||||||||||||||||
|
Total revenue |
14.5 | 17.9 | 35.8 | (383.4 | ) | 561.1 | (188.3 | ) | 1,315.8 | 684.7 | 1,514.0 | |||||||||||||||||||||||||
|
Noninterest expense |
15.6 | 15.9 | 14.8 | 30.3 | 45.3 | 67.6 | 1,718.9 | 1,671.5 | 1,475.0 | |||||||||||||||||||||||||||
|
Impairment loss on goodwill |
– | – | – | – | 2.9 | 12.7 | – | 636.2 | 353.8 | |||||||||||||||||||||||||||
|
Income (loss) before income taxes |
(1.1 | ) | 2.0 | 21.0 | (413.7 | ) | 512.9 | (268.6 | ) | (403.1 | ) | (1,623.0 | ) | (314.8 | ) | |||||||||||||||||||||
|
Income tax expense (benefit) |
(0.6 | ) | 0.4 | 7.0 | (120.4 | ) | 181.0 | (111.8 | ) | (106.8 | ) | (401.3 | ) | (43.4 | ) | |||||||||||||||||||||
|
Net income (loss) |
(0.5 | ) | 1.6 | 14.0 | (293.3 | ) | 331.9 | (156.8 | ) | (296.3 | ) | (1,221.7 | ) | (271.4 | ) | |||||||||||||||||||||
|
Net income (loss) applicable to noncontrolling interests |
– | – | – | (3.7 | ) | (5.7 | ) | (5.5 | ) | (3.6 | ) | (5.6 | ) | (5.1 | ) | |||||||||||||||||||||
|
Net income (loss) applicable to controlling interest |
(0.5 | ) | 1.6 | 14.0 | (289.6 | ) | 337.6 | (151.3 | ) | (292.7 | ) | (1,216.1 | ) | (266.3 | ) | |||||||||||||||||||||
|
Preferred stock dividends |
– | – | – | (122.9 | ) | (100.3 | ) | (24.4 | ) | (122.9 | ) | (102.9 | ) | (24.4 | ) | |||||||||||||||||||||
|
Preferred stock redemption and conversion |
– | – | – | 3.1 | 84.6 | – | 3.1 | 84.6 | – | |||||||||||||||||||||||||||
|
Net earnings (loss) applicable to common shareholders |
$ | (0.5 | ) | $ | 1.6 | $ | 14.0 | $ | (409.4 | ) | $ | 321.9 | $ | (175.7 | ) | $ | (412.5 | ) | $ | (1,234.4 | ) | $ | (290.7 | ) | ||||||||||||
|
Total assets |
$ | 850 | $ | 835 | $ | 880 | $ | 1,143 | $ | (757 | ) | $ | (757 | ) | $ | 51,035 | $ | 51,123 | $ | 55,093 | ||||||||||||||||
|
Net loans and leases 1 |
572 | 578 | 588 | (121 | ) | 66 | 132 | 36,747 | 40,189 | 41,659 | ||||||||||||||||||||||||||
|
Total deposits |
662 | 632 | 603 | (526 | ) | (569 | ) | (1,558 | ) | 40,935 | 41,841 | 41,316 | ||||||||||||||||||||||||
|
Shareholder’s equity: |
||||||||||||||||||||||||||||||||||||
|
Preferred equity |
15 | 15 | – | 77 | (440 | ) | 394 | 2,057 | 1,503 | 1,582 | ||||||||||||||||||||||||||
|
Common equity |
69 | 69 | 75 | (161 | ) | (439 | ) | (150 | ) | 4,591 | 4,190 | 4,920 | ||||||||||||||||||||||||
|
Noncontrolling interests |
– | – | – | (1 | ) | 17 | 26 | (1 | ) | 17 | 27 | |||||||||||||||||||||||||
|
Total shareholder’s equity |
84 | 84 | 75 | (85 | ) | (862 | ) | 270 | 6,647 | 5,710 | 6,529 | |||||||||||||||||||||||||
| 1 |
Net of unearned income and fees, net of related costs. |
166
Table of Contents
23. QUARTERLY FINANCIAL INFORMATION (UNAUDITED)
Financial information by quarter for 2010 and 2009 is as follows:
| (In thousands, except per share amounts) | Quarters | |||||||||||||||||||
| First | Second | Third | Fourth | Year | ||||||||||||||||
|
2010: |
||||||||||||||||||||
|
Gross interest income |
$ | 580,135 | $ | 583,738 | $ | 581,934 | $ | 574,038 | $ | 2,319,845 | ||||||||||
|
Net interest income |
455,300 | 413,346 | 451,875 | 406,868 | 1,727,389 | |||||||||||||||
|
Provision for loan losses |
265,565 | 228,663 | 184,668 | 173,242 | 852,138 | |||||||||||||||
|
Noninterest income: |
||||||||||||||||||||
|
Net impairment losses on investment securities |
(31,263 | ) | (18,060 | ) | (23,712 | ) | (12,320 | ) | (85,355 | ) | ||||||||||
|
Securities gains (losses), net |
(1,909 | ) | (970 | ) | 7,346 | 595 | 5,062 | |||||||||||||
|
Other noninterest income |
140,782 | 128,443 | 126,566 | 124,964 | 520,755 | |||||||||||||||
|
Noninterest expense |
389,126 | 430,355 | 456,044 | 443,356 | 1,718,881 | |||||||||||||||
|
Loss before income taxes |
(91,781 | ) | (136,259 | ) | (78,637 | ) | (96,491 | ) | (403,168 | ) | ||||||||||
|
Net loss |
(63,137 | ) | (113,361 | ) | (47,457 | ) | (72,394 | ) | (296,349 | ) | ||||||||||
|
Net loss applicable to controlling interest |
(60,210 | ) | (112,993 | ) | (47,325 | ) | (72,200 | ) | (292,728 | ) | ||||||||||
|
Preferred stock dividends |
(26,311 | ) | (25,342 | ) | (33,144 | ) | (38,087 | ) | (122,884 | ) | ||||||||||
|
Preferred stock redemption |
– | 3,107 | – | – | 3,107 | |||||||||||||||
|
Net loss applicable to common shareholders |
(86,521 | ) | (135,228 | ) | (80,469 | ) | (110,287 | ) | (412,505 | ) | ||||||||||
|
Net loss per common share: |
||||||||||||||||||||
|
Basic |
$ | (0.57 | ) | $ | (0.84 | ) | $ | (0.47 | ) | $ | (0.62 | ) | $ | (2.48 | ) | |||||
|
Diluted |
(0.57 | ) | (0.84 | ) | (0.47 | ) | (0.62 | ) | (2.48 | ) | ||||||||||
|
2009: |
||||||||||||||||||||
|
Gross interest income |
$ | 639,702 | $ | 637,696 | $ | 631,802 | $ | 606,126 | $ | 2,515,326 | ||||||||||
|
Net interest income |
474,775 | 493,688 | 472,180 | 456,889 | 1,897,532 | |||||||||||||||
|
Provision for loan losses |
297,624 | 762,654 | 565,930 | 390,719 | 2,016,927 | |||||||||||||||
|
Noninterest income: |
||||||||||||||||||||
|
Net impairment losses on investment securities and valuation losses on securities purchased |
(283,064 | ) | (53,670 | ) | (56,515 | ) | (99,306 | ) | (492,555 | ) | ||||||||||
|
Gain on subordinated debt modification |
– | 493,725 | – | 15,220 | 508,945 | |||||||||||||||
|
Acquisition related gains |
– | 22,977 | 146,153 | 56 | 169,186 | |||||||||||||||
|
Securities gains (losses), net |
2,958 | 825 | 95 | (9,549 | ) | (5,671 | ) | |||||||||||||
|
Other noninterest income |
134,844 | 148,879 | 181,007 | 159,466 | 624,196 | |||||||||||||||
|
Noninterest expense |
376,205 | 419,469 | 434,707 | 441,129 | 1,671,510 | |||||||||||||||
|
Impairment loss on goodwill |
633,992 | – | – | 2,224 | 636,216 | |||||||||||||||
|
Loss before income taxes |
(978,308 | ) | (75,699 | ) | (257,717 | ) | (311,296 | ) | (1,623,020 | ) | ||||||||||
|
Net loss |
(826,581 | ) | (51,938 | ) | (157,671 | ) | (185,487 | ) | (1,221,677 | ) | ||||||||||
|
Net loss applicable to controlling interest |
(826,041 | ) | (50,729 | ) | (155,277 | ) | (184,064 | ) | (1,216,111 | ) | ||||||||||
|
Preferred stock dividends |
(26,286 | ) | (25,447 | ) | (26,603 | ) | (24,633 | ) | (102,969 | ) | ||||||||||
|
Preferred stock redemption and conversion |
– | 52,418 | – | 32,215 | 84,633 | |||||||||||||||
|
Net loss applicable to common shareholders |
(852,327 | ) | (23,758 | ) | (181,880 | ) | (176,482 | ) | (1,234,447 | ) | ||||||||||
|
Net loss per common share: |
||||||||||||||||||||
|
Basic |
$ | (7.47 | ) | $ | (0.21 | ) | $ | (1.43 | ) | $ | (1.26 | ) | $ | (9.92 | ) | |||||
|
Diluted |
(7.47 | ) | (0.21 | ) | (1.43 | ) | (1.26 | ) | (9.92 | ) | ||||||||||
167
Table of Contents
24. PARENT COMPANY FINANCIAL INFORMATION
CONDENSED BALANCE SHEETS
| (In thousands) | December 31, | |||||||
| 2010 | 2009 | |||||||
|
ASSETS |
||||||||
|
Cash and due from banks |
$ | 1,848 | $ | 2,254 | ||||
|
Interest-bearing deposits |
547,665 | 539,874 | ||||||
|
Investment securities: |
||||||||
|
Held-to-maturity, at adjusted cost (approximate fair value $4,056 and $2,633) |
3,593 | 2,633 | ||||||
|
Available-for-sale, at fair value |
1,146,797 | 432,761 | ||||||
|
Loans, net of unearned fees of $0 and $45 and allowance
|
2,852 | 6,292 | ||||||
|
Other noninterest-bearing investments |
55,560 | 83,780 | ||||||
|
Investments in subsidiaries: |
||||||||
|
Commercial banks and bank holding company |
6,739,699 | 6,579,075 | ||||||
|
Other operating companies |
70,272 | 66,254 | ||||||
|
Nonoperating – ZMFU II, Inc. 1 |
93,003 | 92,184 | ||||||
|
Receivables from subsidiaries: |
||||||||
|
Other |
1,150 | 2,050 | ||||||
|
Other assets |
253,773 | 76,574 | ||||||
| $ | 8,916,212 | $ | 7,883,731 | |||||
|
LIABILITIES AND SHAREHOLDERS’ EQUITY |
||||||||
|
Other liabilities |
$ | 182,094 | $ | 233,550 | ||||
|
Commercial paper: |
||||||||
|
Due to affiliates |
45,991 | 49,991 | ||||||
|
Due to others |
2,647 | 1,084 | ||||||
|
Other short-term borrowings: |
||||||||
|
Due to affiliates |
72,204 | – | ||||||
|
Due to others |
160,604 | 117,263 | ||||||
|
Subordinated debt to affiliated trusts |
309,278 | 309,278 | ||||||
|
Long-term debt: |
||||||||
|
Due to affiliates |
110,208 | – | ||||||
|
Due to others |
1,384,907 | 1,479,907 | ||||||
|
Total liabilities |
2,267,933 | 2,191,073 | ||||||
|
Shareholders’ equity: |
||||||||
|
Preferred stock |
2,056,672 | 1,502,784 | ||||||
|
Common stock |
4,163,619 | 3,318,417 | ||||||
|
Retained earnings |
889,284 | 1,308,356 | ||||||
|
Accumulated other comprehensive loss |
(461,296 | ) | (436,899 | ) | ||||
|
Total shareholders’ equity |
6,648,279 | 5,692,658 | ||||||
| $ | 8,916,212 | $ | 7,883,731 | |||||
| 1 |
ZMFU II, Inc. is a wholly-owned nonoperating subsidiary whose sole purpose is to hold a portfolio of municipal bonds, loans and leases. |
168
Table of Contents
CONDENSED STATEMENTS OF INCOME
| (In thousands) | Year Ended December 31, | |||||||||||
| 2010 | 2009 | 2008 | ||||||||||
|
Interest income: |
||||||||||||
|
Commercial bank subsidiaries |
$ | 5,665 | $ | 18,939 | $ | 68,642 | ||||||
|
Other subsidiaries and affiliates |
69 | 326 | 781 | |||||||||
|
Other loans and securities |
14,450 | 15,735 | 20,585 | |||||||||
|
Total interest income |
20,184 | 35,000 | 90,008 | |||||||||
|
Interest expense: |
||||||||||||
|
Affiliated trusts |
24,032 | 24,094 | 24,391 | |||||||||
|
Other borrowed funds |
363,981 | 150,695 | 79,208 | |||||||||
|
Total interest expense |
388,013 | 174,789 | 103,599 | |||||||||
|
Net interest loss |
(367,829 | ) | (139,789 | ) | (13,591 | ) | ||||||
|
Provision for loan losses |
(41 | ) | (531 | ) | 605 | |||||||
|
Net interest loss after provision for loan losses |
(367,788 | ) | (139,258 | ) | (14,196 | ) | ||||||
|
Other income: |
||||||||||||
|
Dividends from consolidated subsidiaries: |
||||||||||||
|
Commercial banks and bank holding company |
– | 4,603 | 110,500 | |||||||||
|
Other operating companies |
450 | 425 | 500 | |||||||||
|
Equity and fixed income securities gains (losses), net |
386 | (11,042 | ) | (11,220 | ) | |||||||
|
Net impairment losses on investment securities |
(70,306 | ) | (191,351 | ) | (96,890 | ) | ||||||
|
Gain on subordinated debt modification |
– | 508,945 | – | |||||||||
|
Other income (loss) |
(3,802 | ) | 2,737 | (7,611 | ) | |||||||
| (73,272 | ) | 314,317 | (4,721 | ) | ||||||||
|
Expenses: |
||||||||||||
|
Salaries and employee benefits |
14,720 | 21,663 | 11,673 | |||||||||
|
Other operating expenses |
11,465 | 2,882 | 16,962 | |||||||||
| 26,185 | 24,545 | 28,635 | ||||||||||
|
Income (loss) before income tax benefit and undistributed income (losses) of consolidated subsidiaries |
(467,245 | ) | 150,514 | (47,552 | ) | |||||||
|
Income taxes (benefit) |
(141,983 | ) | 27,939 | (71,837 | ) | |||||||
|
Income before equity in undistributed income (losses) of consolidated subsidiaries |
(325,262 | ) | 122,575 | 24,285 | ||||||||
|
Equity in undistributed income (losses) of consolidated subsidiaries: |
||||||||||||
|
Commercial banks and bank holding company |
34,820 | (1,325,678 | ) | (272,963 | ) | |||||||
|
Other operating companies |
(3,271 | ) | (21,995 | ) | (35,377 | ) | ||||||
|
Nonoperating – ZMFU II, Inc. |
985 | 8,987 | 17,786 | |||||||||
|
Net income (loss) |
(292,728 | ) | (1,216,111 | ) | (266,269 | ) | ||||||
|
Preferred stock dividends |
(122,884 | ) | (102,969 | ) | (24,424 | ) | ||||||
|
Preferred stock redemption and conversion to common stock |
3,107 | 84,633 | – | |||||||||
|
Net earnings (loss) applicable to common shareholders |
$ | (412,505 | ) | $ | (1,234,447 | ) | $ | (290,693 | ) | |||
169
Table of Contents
CONDENSED STATEMENTS OF CASH FLOWS
| Year Ended December 31, | ||||||||||||
| (In thousands) | 2010 | 2009 | 2008 | |||||||||
|
CASH FLOWS FROM OPERATING ACTIVITIES |
||||||||||||
|
Net loss |
$ | (292,728 | ) | $ | (1,216,111 | ) | $ | (266,269 | ) | |||
|
Adjustments to reconcile net loss to net cash provided by (used in) operating activities: |
||||||||||||
|
Undistributed net losses (income) of consolidated subsidiaries |
(32,534 | ) | 1,338,686 | 290,554 | ||||||||
|
Unrealized equity securities losses, net |
– | 3,530 | 9,913 | |||||||||
|
Net impairment losses on investment securities |
70,306 | 191,351 | 96,890 | |||||||||
|
Gain on subordinated debt modification |
– | (508,946 | ) | – | ||||||||
|
Other, net |
(2,699 | ) | 171,173 | 93,859 | ||||||||
|
Net cash provided by (used in) operating activities |
(257,655 | ) | (20,317 | ) | 224,947 | |||||||
|
CASH FLOWS FROM INVESTING ACTIVITIES |
||||||||||||
|
Net decrease (increase) in interest-bearing deposits |
(7,791 | ) | 440,654 | (895,129 | ) | |||||||
|
Collection of advances to subsidiaries |
2,900 | 779,550 | 816,184 | |||||||||
|
Advances to subsidiaries |
(2,000 | ) | (6,970 | ) | (184,731 | ) | ||||||
|
Proceeds from sales and maturities of equity and fixed income securities |
23,218 | 9,895 | 265,835 | |||||||||
|
Purchases of investment securities |
(807,441 | ) | (297,877 | ) | (241,846 | ) | ||||||
|
Increase of investment in subsidiaries |
(141,550 | ) | (1,509,150 | ) | (1,292,821 | ) | ||||||
|
Other, net |
29,549 | 15,392 | (29,281 | ) | ||||||||
|
Net cash used in investing activities |
(903,115 | ) | (568,506 | ) | (1,561,789 | ) | ||||||
|
CASH FLOWS FROM FINANCING ACTIVITIES |
||||||||||||
|
Net change in short-term funds borrowed |
113,108 | (138,659 | ) | (30,843 | ) | |||||||
|
Proceeds from issuance of long-term debt |
255,845 | 703,932 | 28,495 | |||||||||
|
Repayments of long-term debt |
(72,923 | ) | (295,630 | ) | (155,025 | ) | ||||||
|
Proceeds from issuance of preferred stock |
138,657 | – | 1,338,605 | |||||||||
|
Proceeds from issuance of common stock and warrants |
838,488 | 464,110 | 354,302 | |||||||||
|
Payments to redeem and convert preferred stock |
– | (47,166 | ) | – | ||||||||
|
Dividends paid on preferred stock |
(102,666 | ) | (84,408 | ) | (21,775 | ) | ||||||
|
Dividends paid on common stock |
(6,650 | ) | (11,863 | ) | (173,904 | ) | ||||||
|
Other, net |
(3,495 | ) | (1,374 | ) | (2,881 | ) | ||||||
|
Net cash provided by financing activities |
1,160,364 | 588,942 | 1,336,974 | |||||||||
|
Net increase (decrease) in cash and due from banks |
(406 | ) | 119 | 132 | ||||||||
|
Cash and due from banks at beginning of year |
2,254 | 2,135 | 2,003 | |||||||||
|
Cash and due from banks at end of year |
$ | 1,848 | $ | 2,254 | $ | 2,135 | ||||||
As of December 31, 2010, the Parent had $182 million of loans outstanding with three of its subsidiary banks. No loans were outstanding at December 31, 2009. Maturities vary up to June 2013 at variable interest rates. The loans are secured by Parent deposits at the subsidiary banks.
The Parent paid interest of $147.2 million in 2010, $122.8 million in 2009, and $99.5 million in 2008.
170
Table of Contents
| ITEM 9. | CHANGES IN AND DISAGREEMENTS WITH ACCOUNTANTS ON ACCOUNTING AND FINANCIAL DISCLOSURE |
None.
| ITEM 9A. | CONTROLS AND PROCEDURES |
The Company’s management, with the participation of the Company’s Chief Executive Officer and Chief Financial Offer, has evaluated the effectiveness of the Company’s disclosure controls and procedures as of December 31, 2010. Based on that evaluation, the Company’s Chief Executive Officer and Chief Financial Offer concluded that the Company’s disclosure controls and procedures were effective as of December 31, 2010. There were no material changes in the Company’s internal control over financial reporting during the fourth quarter of 2010. See “Report on Management’s Assessment of Internal Control over Financial Reporting” included in Item 8 on page 91 for management’s report on the adequacy of internal control over financial reporting. Also see “Report on Internal Control over Financial Reporting” issued by Ernst & Young LLP included in Item 8 on page 92.
| ITEM 9B. | OTHER INFORMATION |
None.
171
Table of Contents
| ITEM 10. | DIRECTORS, EXECUTIVE OFFICERS AND CORPORATE GOVERNANCE |
Incorporated by reference from the Company’s Proxy Statement to be subsequently filed.
| ITEM 11. | EXECUTIVE COMPENSATION |
Incorporated by reference from the Company’s Proxy Statement to be subsequently filed.
| ITEM 12. | SECURITY OWNERSHIP OF CERTAIN BENEFICIAL OWNERS AND MANAGEMENT AND RELATED STOCKHOLDER MATTERS |
EQUITY COMPENSATION PLAN INFORMATION
The following schedule provides information as of December 31, 2010 with respect to the shares of the Company’s common stock that may be issued under existing equity compensation plans:
|
Plan Category 1 |
(a)
Number of securities to be issued upon exercise of outstanding options, warrants and rights |
(b)
Weighted average exercise price of outstanding options, warrants and rights |
(c)
Number of securities remaining available for future issuance under equity compensation plans (excluding securities reflected in column (a)) |
|||||||||
|
Equity Compensation Plans Approved by Security Holders: |
||||||||||||
|
Zions Bancorporation 2005 Stock Option and Incentive Plan |
4,965,101 | $ | 45.05 | 3,057,780 | ||||||||
|
Zions Bancorporation 1996 Non-Employee Directors Stock Option Plan |
104,000 | 53.53 | – | |||||||||
|
Zions Bancorporation Key Employee Incentive Stock Option Plan |
820,002 | 56.76 | – | |||||||||
|
Total |
5,889,103 | 3,057,780 | ||||||||||
| 1 |
The schedule does not include information for equity compensation plans assumed by the Company in mergers. A total of 489,670 shares of common stock with a weighted average exercise price of $53.27 were issuable upon exercise of options granted under plans assumed in mergers and outstanding at December 31, 2010. The Company cannot grant additional awards under these assumed plans. Column (a) also excludes 1,604,156 shares of unvested restricted stock and 109,748 salary stock units (each unit representing the right to one share of common stock). |
Other information required by Item 12 is incorporated by reference from the Company’s Proxy Statement to be subsequently filed.
| ITEM 13. | CERTAIN RELATIONSHIPS AND RELATED TRANSACTIONS, AND DIRECTOR INDEPENDENCE |
Incorporated by reference from the Company’s Proxy Statement to be subsequently filed.
| ITEM 14. | PRINCIPAL ACCOUNTING FEES AND SERVICES |
Incorporated by reference from the Company’s Proxy Statement to be subsequently filed.
172
Table of Contents
| ITEM 15. | EXHIBITS, FINANCIAL STATEMENT SCHEDULES |
|
(a) |
(1) Financial statements – The following consolidated financial statements of Zions Bancorporation and subsidiaries are filed as part of this Form10-K under Item 8, Financial Statements and Supplementary Data: |
|
|
Consolidated balance sheets – December 31, 2010 and 2009 |
||
|
Consolidated statements of income – Years ended December 31, 2010, 2009 and 2008 |
||
|
Consolidated statements of changes in shareholders’ equity and comprehensive income – Years ended December 31, 2010, 2009 and 2008 |
||
|
Consolidated statements of cash flows – Years ended December 31, 2010, 2009 and 2008 |
||
|
Notes to consolidated financial statements – December 31, 2010 |
||
|
(2) Financial statement schedules – All financial statement schedules for which provision is made in the applicable accounting regulations of the Securities and Exchange Commission are not required under the related instructions, the required information is contained elsewhere in the Form 10-K, or the schedules are inapplicable and have therefore been omitted. |
||
|
(3) List of Exhibits: |
||
|
Exhibit
|
Description |
|||||
| 3.1 | Restated Articles of Incorporation of Zions Bancorporation dated November 8, 1993, incorporated by reference to Exhibit 3.1 of Form S-4 filed on November 22, 1993. | * | ||||
| 3.2 | Articles of Amendment to the Restated Articles of Incorporation of Zions Bancorporation dated April 30, 1997, incorporated by reference to Exhibit 3.2 of Form 10-Q for the quarter ended March 31, 2008. | * | ||||
| 3.3 | Articles of Amendment to the Restated Articles of Incorporation of Zions Bancorporation dated April 24, 1998, incorporated by reference to Exhibit 3.3 of Form 10-Q for the quarter ended March 31, 2009. | * | ||||
| 3.4 | Articles of Amendment to Restated Articles of Incorporation of Zions Bancorporation dated April 25, 2001, incorporated by reference to Exhibit 3.6 of Form S-4 filed July 13, 2001. | * | ||||
| 3.5 | Articles of Amendment to the Restated Articles of Incorporation of Zions Bancorporation, dated December 5, 2006, incorporated by reference to Exhibit 3.1 of Form 8-K filed December 7, 2006. | * | ||||
| 3.6 | Articles of Merger of The Stockmen’s Bancorp, Inc. with and into Zions Bancorporation, effective January 17, 2007, incorporated by reference to Exhibit 3.6 of Form 10-K for the year ended December 31, 2006. | * | ||||
| 3.7 | Articles of Amendment to the Restated Articles of Incorporation of Zions Bancorporation, dated July 7, 2008, incorporated by reference to Exhibit 3.1 of Form 8-K filed July 8, 2008. | * | ||||
| 3.8 | Articles of Amendment to the Restated Articles of Incorporation of Zions Bancorporation, dated November 12, 2008, incorporated by reference to Exhibit 3.1 of Form 8-K filed November 17, 2008. | * | ||||
173
Table of Contents
|
Exhibit
|
Description |
|||||
| 3.9 | Articles of Amendment to the Restated Articles of Incorporation of Zions Bancorporation, dated June 30, 2009, incorporated by reference to Exhibit 3.1 of Form 8-K filed July 2, 2009. | * | ||||
| 3.10 | Articles of Amendment to the Restated Articles of Incorporation of Zions Bancorporation dated June 30, 2009, incorporated by reference to Exhibit 3.10 of Form 10-Q for the quarter ended June 30, 2009. | * | ||||
| 3.11 | Articles of Amendment to the Restated Articles of Incorporation of Zions Bancorporation dated June 1, 2010, incorporated by reference to Exhibit 3.1 of Form 8-K filed June 3, 2010. | * | ||||
| 3.12 | Articles of Amendment to the Restated Articles of Incorporation of Zions Bancorporation dated June 14, 2010, incorporated by reference to Exhibit 3.1 of Form 8-K filed June 15, 2010. | * | ||||
| 3.13 | Amended and Restated Bylaws of Zions Bancorporation dated May 4, 2007, incorporated by reference to Exhibit 3.2 of Form 8-K filed on May 9, 2007. | * | ||||
| 4.1 | Senior Debt Indenture dated September 10, 2002 between Zions Bancorporation and The Bank of New York Mellon Trust Company, N.A. as successor to J.P. Morgan Trust Company, N.A., as trustee, with respect to senior debt securities of Zions Bancorporation, incorporated by reference to Exhibit 4.1 of Form S-3ARS filed March 31, 2006. | * | ||||
| 4.2 | Subordinated Debt Indenture dated September 10, 2002 between Zions Bancorporation and The Bank of New York Mellon Trust Company, N.A. as successor to J.P. Morgan Trust Company, N.A., as trustee, with respect to subordinated debt securities of Zions Bancorporation, incorporated by reference to Exhibit 4.2 of Form S-3ARS filed March 31, 2006. | * | ||||
| 4.3 | Junior Subordinated Indenture dated August 21, 2002 between Zions Bancorporation and The Bank of New York Mellon Trust Company, N.A. as successor to J.P. Morgan Trust Company, N.A., as trustee, with respect to junior subordinated debentures of Zions Bancorporation, incorporated by reference to Exhibit 4.3 of Form S-3ARS filed March 31, 2006. | * | ||||
| 4.4 | Warrant Agreement, between Zions Bancorporation and Zions First National Bank, and Warrant Certificate, incorporated by reference to Exhibit 4.1 of Form 10-Q for the quarter ended September 30, 2010. | * | ||||
| 10.1 | Zions Bancorporation 2006-2008 Value Sharing Plan, incorporated by reference to Exhibit 10.1 of Form 10-Q for the quarter ended June 30, 2006. | * | ||||
| 10.2 | First amendment to the Zions Bancorporation 2006-2008 Value Sharing Plan, incorporated by reference to Exhibit 10.2 of Form 10-K for the year ended December 31, 2008. | * | ||||
| 10.3 | Form of Zions Bancorporation 2006-2008 Value Sharing Plan, Subsidiary Banks, incorporated by reference to Exhibit 10.2 of Form 10-Q for the quarter ended June 30, 2006. | * | ||||
| 10.4 | Amegy Bank of Texas 2007-2008 Value Sharing Plan, incorporated by reference to Exhibit 10.7 of Form 10-Q for the quarter ended June 30, 2007. | * | ||||
| 10.5 | Zions Bancorporation 2009-2011 Value Sharing Plan, incorporated by reference to Exhibit 10.5 of Form 10-K for the year ended December 31, 2009. | * | ||||
| 10.6 | 2005 Management Incentive Compensation Plan (filed herewith). | |||||
| 10.7 | Zions Bancorporation Second Restated and Revised Deferred Compensation Plan, incorporated by reference to Exhibit 10.6 of Form 10-K for the year ended December 31, 2008. | * | ||||
| 10.8 | Zions Bancorporation Third Restated Deferred Compensation Plan for Directors, incorporated by reference to Exhibit 10.7 of Form 10-K for the year ended December 31, 2008. | * | ||||
174
Table of Contents
|
Exhibit
|
Description |
|||||
| 10.9 | Fifth Amended and Restated Amegy Bancorporation, Inc. Non-Employee Directors Deferred Fee Plan, incorporated by reference to Exhibit 10.8 of Form 10-K for the year ended December 31, 2008. | * | ||||
| 10.10 | Zions Bancorporation First Restated Excess Benefit Plan, incorporated by reference to Exhibit 10.9 of Form 10-K for the year ended December 31, 2008. | * | ||||
| 10.11 | Trust Agreement establishing the Zions Bancorporation Deferred Compensation Plan Trust by and between Zions Bancorporation and Cigna Bank & Trust Company, FSB effective October 1, 2002, incorporated by reference to Exhibit 10.10 of Form 10-K for the year ended December 31, 2006. | * | ||||
| 10.12 | Amendment to the Trust Agreement establishing the Zions Bancorporation Deferred Compensation Plan Trust by and between Zions Bancorporation and Cigna Bank & Trust Company, FSB substituting Prudential Bank & Trust, FSB as the trustee (filed herewith). | |||||
| 10.13 | Amendment to Trust Agreement Establishing the Zions Bancorporation Deferred Compensation Plans Trust, effective September 1, 2006, incorporated by reference to Exhibit 10.12 of Form 10-K for the year ended December 31, 2006. | * | ||||
| 10.14 | Zions Bancorporation Deferred Compensation Plans Master Trust between Zions Bancorporation and Fidelity Management Trust Company, effective September 1, 2006, incorporated by reference to Exhibit 10.13 of Form 10-K for the year ended December 31, 2006. | * | ||||
| 10.15 | Revised schedule C to Zions Bancorporation Deferred Compensation Plans Master Trust between Zions Bancorporation and Fidelity Management Trust Company, effective September 13, 2006, incorporated by reference to Exhibit 10.14 of Form 10-K for the year ended December 31, 2006. | * | ||||
| 10.16 | Zions Bancorporation Restated Pension Plan effective January 1, 2002, including amendments adopted through December 31, 2010 (filed herewith). | |||||
| 10.17 | Zions Bancorporation Executive Management Pension Plan, incorporated by reference to Exhibit 10.20 of Form 10-K for the year ended December 31, 2008. | * | ||||
| 10.18 | Zions Bancorporation Payshelter 401(k) and Employee Stock Ownership Plan, Restated and Amended effective January 1, 2002, including amendments adopted thru December 31, (filed herewith). | |||||
| 10.19 | Zions Bancorporation Payshelter 401(k) and Employee Stock Ownership Plan Trust Agreement between Zions Bancorporation and Fidelity Management Trust Company, dated July 3, 2006, incorporated by reference to Exhibit 10.1 of Form 10-Q for the quarter ended March 31, 2007. | * | ||||
| 10.20 | First Amendment to the Zions Bancorporation Payshelter 401(k) and Employee Stock Ownership Plan Trust Agreement between Zions Bancorporation and Fidelity Management Trust Company, dated April 5, 2010, incorporated by reference to Exhibit 10.2 of Form 10-Q for the quarter ended June 30, 2010. | * | ||||
| 10.21 | Second Amendment to the Zions Bancorporation Payshelter 401(k) and Employee Stock Ownership Plan Trust Agreement between Zions Bancorporation and Fidelity Management Trust Company, dated April 5, 2010, incorporated by reference to Exhibit 10.2 of Form 10-Q for the quarter ended June 30, 2010. | * | ||||
| 10.22 | Third Amendment to the Zions Bancorporation Payshelter 401(k) and Employee Stock Ownership Plan Trust Agreement between Zions Bancorporation and Fidelity Management Trust Company, dated April 30, 2010, incorporated by reference to Exhibit 10.3 of Form 10-Q for the quarter ended June 30, 2010. | * | ||||
175
Table of Contents
|
Exhibit
|
Description |
|||||
| 10.23 | Amended and Restated Zions Bancorporation Key Employee Incentive Stock Option Plan, incorporated by reference to Exhibit 10.38 of Form 10-K for the year ended December 31, 2010. | * | ||||
| 10.24 | Amended and Restated Zions Bancorporation 1996 Non-Employee Directors Stock Option Plan, incorporated by reference to Exhibit 10.38 of Form 10-K for the year ended December 31, 2007. | * | ||||
| 10.25 | Amended and Restated Zions Bancorporation 2005 Stock Option and Incentive Plan, incorporated by reference to Exhibit 10.1 of Form 10-Q for the quarter ended June 30, 2009. | * | ||||
| 10.26 | Standard Stock Option Award Agreement, Zions Bancorporation 2005 Stock Option and Incentive Plan, incorporated by reference to Exhibit 10.2 of Form 10-Q for the quarter ended June 30, 2009. | * | ||||
| 10.27 | Standard Restricted Stock Award Agreement, Zions Bancorporation 2005 Stock Option and Incentive Plan, incorporated by reference to Exhibit 10.3 of Form 10-Q for the quarter ended June 30, 2009. | * | ||||
| 10.28 | Standard Directors Restricted Stock Award Agreement, Zions Bancorporation 2005 Stock Option and Incentive Plan, incorporated by reference to Exhibit 10.4 of Form 10-Q for the quarter ended June 30, 2009. | * | ||||
| 10.29 | Standard Directors Stock Option Award Agreement, Zions Bancorporation 2005 Stock Option and Incentive Plan (filed herewith). | |||||
| 10.30 | Standard Salary Stock Unit Award Agreement, Zions Bancorporation 2005 Stock Option and Incentive Plan, incorporated by reference to Exhibit 10.1 of Form 8-K filed December 28, 2009. | * | ||||
| 10.31 | Standard Deferred Salary Stock Unit Award Agreement, Zions Bancorporation 2005 Stock Option and Incentive Plan (filed herewith). | |||||
| 10.32 | Amegy Bancorporation (formerly Southwest Bancorporation of Texas, Inc.) 1996 Stock Option Plan, as amended and restated as of June 4, 2002, incorporated by reference to Exhibit 10.45 of Form 10-K for the year ended December 31, 2007. | * | ||||
| 10.33 | Amegy Bancorporation 2004 (formerly Southwest Bancorporation of Texas, Inc.) Omnibus Incentive Plan, incorporated by reference to Exhibit 10.47 of Form 10-K for the year ended December 31, 2009. | * | ||||
| 10.34 | Form of Change in Control Agreement between the Company and Certain Executive Officers, incorporated by reference to Exhibit 10.39 of Form 10-K for the year ended December 31, 2006. | * | ||||
| 10.35 | Form of Change in Control Agreement between the Company and Scott J. McLean, incorporated by reference to Exhibit 10.48 of Form 10-K for the year ended December 31, 2007. | * | ||||
| 10.36 | Addendum to Change in Control Agreement, incorporated by reference to Exhibit 10.43 of Form 10-K for the year ended December 31, 2008. | * | ||||
| 10.37 | Form of Change in Control Agreement between the Company and Kenneth E. Peterson (filed herewith). | |||||
| 10.38 | Stock Purchase and Shareholder Agreement dated June 1, 2004 among Welman Holdings, Inc., the Company, Zions First National Bank and PSC Wealth Management, LLC (filed herewith). | |||||
| 10.39 | Employment Agreement between the Company and Scott J. McLean, incorporated by reference to Exhibit 10.41 of Form 10-K for the year ended December 31, 2006. | * | ||||
176
Table of Contents
|
Exhibit
|
Description |
|||||
| 10.40 | Employment Agreement between the Company and Dallas Haun, incorporated by reference to Exhibit 10.53 of Form 10-K for the year ended December 31, 2007. | * | ||||
| 10.41 | Employment agreement between the Company and Kenneth E. Peterson, incorporated by reference to Exhibit 10.1 of Form 10-Q for the quarter ended March 31, 2010. | * | ||||
| 10.42 | Warrant to purchase up to 5,789,909 shares of Common Stock, issued on November 14, 2008, incorporated by reference to Exhibit 4.2 of Form 8-K filed November 17, 2008. | * | ||||
| 10.43 | Performance stock agreement between Zions Bancorporation and Scott McLean, dated August 15, 2008, incorporated by reference to Exhibit 10.51 of Form 10-K filed December 31, 2008. | * | ||||
| 10.44 | Form of Change in Control Agreement between the Company and Dallas E. Haun, dated May 23, 2008, incorporated by reference to Exhibit 10.52 of Form 10-K filed December 31, 2008. | * | ||||
| 12 | Ratio of Earnings to Fixed Charges (filed herewith). | |||||
| 21 | List of Subsidiaries of Zions Bancorporation (filed herewith). | |||||
| 23 | Consent of Independent Registered Public Accounting Firm (filed herewith). | |||||
| 31.1 | Certification by Chief Executive Officer required by Rules 13a-15(f) and 15d-15(f) under the Securities Exchange Act of 1934 (filed herewith). | |||||
| 31.2 | Certification by Chief Financial Officer required by Rules 13a-15(f) and 15d-15(f) under the Securities Exchange Act of 1934 (filed herewith). | |||||
| 32 | Certification by Chief Executive Officer and Chief Financial Officer required by Sections 13(a) or 15(d), as applicable, of the Securities Exchange Act of 1934 (15 U.S.C. 78m) and 18 U.S.C. Section 1350 (furnished herewith). | |||||
| 99.1 | Certification by Chief Executive Officer required by 111(b)(4) of the Emergency Economic Stabilization Act (filed herewith). | |||||
| 99.2 | Certification by Chief Financial Officer required by 111(b)(4) of the Emergency Economic Stabilization Act (filed herewith). | |||||
| 101 | Interactive data files pursuant to Rule 405 of Regulation S-T: (i) the Consolidated Balance Sheets as of December 31, 2010 and December 31, 2009, (ii) the Consolidated Statements of Income for the years ended December 31, 2010, December 31, 2009, and December 31, 2008, (iii) the Consolidated Statements of Changes in Shareholders’ Equity and Comprehensive Income for the years ended December 31, 2010, December 31, 2009, and December 31, 2008, (iv) the Consolidated Statements of Cash Flows for the years ended December 31, 2010, December 31, 2009, and December 31, 2008 and (v) the Notes to Consolidated Financial Statements, tagged as blocks of text (furnished herewith). | |||||
| * | Incorporated by reference |
Certain instruments defining the rights of holders of long-term debt securities of the Registrant and its subsidiaries are omitted pursuant to Item 601(b)(4)(iii) of Regulation S-K. The Registrant hereby undertakes to furnish to the SEC, upon request, copies of any such instruments.
177
Table of Contents
Pursuant to the requirements of Section 13 or 15(d) of the Securities Exchange Act of 1934, the Registrant has duly caused this report to be signed on its behalf by the undersigned, thereunto duly authorized.
| March 1, 2011 | ZIONS BANCORPORATION | |||
|
By |
/s/ H ARRIS H. S IMMONS | |||
|
HARRIS H. SIMMONS, Chairman, President and Chief Executive Officer |
||||
Pursuant to the requirements of the Securities Exchange Act of 1934, this report has been signed below by the following persons on behalf of the Registrant and in the capacities and on the date indicated.
March 1, 2011
|
/s/ H ARRIS H. S IMMONS |
/s/ D OYLE L. A RNOLD |
|
|
HARRIS H. SIMMONS, Director, Chairman, President and Chief Executive Officer (Principal Executive Officer) |
DOYLE L. ARNOLD, Vice Chairman and Chief Financial Officer (Principal Financial Officer) |
|
|
/s/ A LEXANDER J. H UME |
/s/ J ERRY C. A TKIN |
|
|
ALEXANDER J. HUME, Controller (Principal Accounting Officer) |
JERRY C. ATKIN, Director | |
|
/s/ R. D. C ASH |
/s/ P ATRICIA F ROBES |
|
| R. D. CASH, Director | PATRICIA FROBES, Director | |
|
/s/ J. D AVID H EANEY |
/s/ R OGER B. P ORTER |
|
| J. DAVID HEANEY, Director | ROGER B. PORTER, Director | |
|
/s/ S TEPHEN D. Q UINN |
/s/ L. E. S IMMONS |
|
| STEPHEN D. QUINN, Director | L. E. SIMMONS, Director | |
|
/s/ S TEVEN C. W HEELWRIGHT |
/s/ S HELLEY T HOMAS W ILLIAMS |
|
| STEVEN C. WHEELWRIGHT, Director | SHELLEY THOMAS WILLIAMS, Director | |
178