ZIONS BANCORPORATION, NATIONAL ASSOCIATION /UT/
10-Ks and 10-Qs
|
|
|
|
|
|
|
|
|
|
|
|
|
|
|
|
|
|
|
|
|
|
|
|
|
|
|
|
|
|
|
|
|
|
|
|
|
|
|
|
|
|
|
|
|
|
|
UNITED STATES
SECURITIES AND EXCHANGE COMMISSION
Washington, D.C. 20549
FORM
10-Q
(Mark One)
COMMISSION FILE NUMBER
001-12307
(Exact name of registrant as specified in its charter)
|
|
|
||||
|
(State or other jurisdiction of
incorporation or organization) |
(I.R.S. Employer
Identification No.) |
||||
|
|
|||||
|
|
|
||||
| (Address of principal executive offices) | (Zip Code) | ||||
Registrant’s telephone number, including area code: (
801
)
844-7637
Securities registered pursuant to Section 12(b) of the Act:
| Title of Each Class | Trading Symbols | Name of Each Exchange on Which Registered | ||||||
|
|
|
|
||||||
| Depositary Shares each representing a 1/40th ownership interest in a share of: | ||||||||
|
|
|
|
||||||
|
|
|
|
||||||
|
|
|
|
||||||
Indicate by check mark whether the registrant (1) has filed all reports required to be filed by Section 13 or 15(d) of the Securities Exchange Act of 1934 during the preceding 12 months (or for such shorter period that the registrant was required to file such reports), and (2) has been subject to such filing requirements for the past 90 days.
Yes
ý
No
¨
Indicate by check mark whether the registrant has submitted electronically every Interactive Data File required to be submitted pursuant to Rule 405 of Regulation S-T (§232.405 of this chapter) during the preceding 12 months (or for such shorter period that the registrant was required to submit such files).
Yes
ý
No
¨
Indicate by check mark whether the registrant is a large accelerated filer, an accelerated filer, a non-accelerated filer, a smaller reporting company, or an emerging growth company. See the definitions of “large accelerated filer,” “accelerated filer,” “smaller reporting company,” and “emerging growth company” in Rule 12b-2 of the Exchange Act.
If an emerging growth company, indicate by check mark if the registrant has elected not to use the extended transition period for complying with any new or revised financial accounting standards provided pursuant to Section 13(a) of the Exchange Act.
¨
Indicate by check mark whether the registrant is a shell company (as defined in Rule 12b-2 of the Exchange Act). Yes
¨
No
ý
Indicate the number of shares outstanding of each of the issuer’s classes of common stock, as of the latest practicable date.
Number of common shares outstanding at October 29, 2021
156,463,463
shares
1
ZIONS BANCORPORATION, NATIONAL ASSOCIATION AND SUBSIDIARIES
Table of Contents
| Page | ||||||||
| Item 1. | ||||||||
| Item 2. | ||||||||
| Item 3. | ||||||||
| Item 4. | ||||||||
| Item 1. | ||||||||
| Item 1A. | ||||||||
| Item 2. | ||||||||
| Item 6. | ||||||||
2
Table of Contents
ZIONS BANCORPORATION, NATIONAL ASSOCIATION AND SUBSIDIARIES
GLOSSARY OF ACRONYMS
| ACL | Allowance for Credit Losses | IMG | International Manufacturing Group | ||||||||
| AFS | Available-for-Sale | IOSCO | International Organization of Securities Commissions | ||||||||
| ALCO | Asset/Liability Committee | IPO | Initial Public Offering | ||||||||
| ALLL | Allowance for Loan and Lease Losses | LIBOR | London Interbank Offered Rate | ||||||||
| ALM | Asset Liability Management | MD&A | Management’s Discussion and Analysis | ||||||||
| Amegy | Amegy Bank, a division of Zions Bancorporation, National Association | Municipalities | State and Local Governments | ||||||||
| AOCI | Accumulated Other Comprehensive Income | NASDAQ | National Association of Securities Dealers Automated Quotations | ||||||||
| ASC | Accounting Standards Codification | NBAZ | National Bank of Arizona, a division of Zions Bancorporation, National Association | ||||||||
| ASR | Accelerated Share Repurchase | NIM | Net Interest Margin | ||||||||
| ASU | Accounting Standards Update | NM | Not Meaningful | ||||||||
| bps | basis points | NSB | Nevada State Bank, a division of Zions Bancorporation, National Association | ||||||||
| BSBY | Bloomberg Short-Term Bank Yield Index | OCI | Other Comprehensive Income | ||||||||
| CB&T | California Bank & Trust, a division of Zions Bancorporation, National Association | OREO | Other Real Estate Owned | ||||||||
| CECL | Current Expected Credit Loss | PEI | Private Equity Investment | ||||||||
| CET1 | Common Equity Tier 1 (Basel III) | PPNR | Pre-provision Net Revenue | ||||||||
| CLTV | Combined Loan-to-Value Ratio | PPP | Paycheck Protection Program | ||||||||
| CRE | Commercial Real Estate | ROC | Risk Oversight Committee | ||||||||
| CVA | Credit Valuation Adjustment | ROU | Right-of-Use | ||||||||
| Dodd-Frank Act | Dodd-Frank Wall Street Reform and Consumer Protection Act | RULC | Reserve for Unfunded Lending Commitments | ||||||||
| DTL | Deferred Tax Liability | S&P | Standard and Poor's | ||||||||
| EaR | Earnings at Risk | SBA | Small Business Administration | ||||||||
| ERM | Enterprise Risk Management | SBIC | Small Business Investment Company | ||||||||
| EVE | Economic Value of Equity at Risk | SEC | Securities and Exchange Commission | ||||||||
| FASB | Financial Accounting Standards Board | SOFR | Secured Overnight Financing Rate | ||||||||
| FCA | Financial Conduct Authority | TCBW | The Commerce Bank of Washington, a division of Zions Bancorporation, National Association | ||||||||
| FDIC | Federal Deposit Insurance Corporation | TDR | Troubled Debt Restructuring | ||||||||
| FHLB | Federal Home Loan Bank | Tier 1 | Common Equity Tier 1 (Basel III) and Additional Tier 1 Capital | ||||||||
| FTP | Funds Transfer Pricing | U.S. | United States | ||||||||
| GAAP | Generally Accepted Accounting Principles | Vectra | Vectra Bank Colorado, a division of Zions Bancorporation, National Association | ||||||||
| HECL | Home Equity Credit Line | Zions Bancorporation, N.A. | Zions Bancorporation, National Association | ||||||||
| HTM | Held-to-Maturity | Zions Bank | Zions Bank, a division of Zions Bancorporation, National Association | ||||||||
3
PART I. FINANCIAL INFORMATION
ITEM 2. MANAGEMENT’S DISCUSSION AND ANALYSIS OF FINANCIAL CONDITION AND RESULTS OF OPERATIONS
FORWARD-LOOKING INFORMATION
This quarterly report includes “forward-looking statements” as that term is defined in the Private Securities Litigation Reform Act of 1995. These statements are based on management’s current expectations and assumptions regarding future events or determinations, all of which are subject to known and unknown risks, uncertainties, and other factors that may cause our actual results, performance or achievements, industry trends, and results or regulatory outcomes to differ materially from those expressed or implied. Forward-looking statements include, among others:
•
statements with respect to the beliefs, plans, objectives, goals, targets, commitments, designs, guidelines, expectations, anticipations, and future financial condition, results of operations and performance of Zions Bancorporation, National Association and its subsidiaries (collectively “Zions Bancorporation, N.A.,” “the Bank,” “we,” “our,” “us”); and
•
statements preceded or followed by, or that include the words “may,” “might,” “can,” “continue,” “could,” “should,” “would,” “believe,” “anticipate,” “estimate,” “forecasts,” “expect,” “intend,” “target,” “commit,” “design,” “plan,” “projects,” “will,” and the negative thereof and similar words and expressions.
These forward-looking statements are not guarantees, nor should they be relied upon as representing management’s views as of any subsequent date. Actual results and outcomes may differ materially from those presented.
Although this list is not comprehensive, important factors that may cause such material differences include changes in general industry and economic conditions, including inflation; changes and uncertainties in legislation and fiscal, monetary, regulatory, trade and tax policies; changes in interest rates and uncertainty regarding the transition away from the London Interbank Offered Rate (“LIBOR”) toward other reference rates; the quality and composition of our loan and securities portfolios; competitive pressures and other factors that may affect aspects of our business, such as pricing, demand for our products and services, our ability to recruit and retain talent, including increased compensation expenses; our ability to execute our strategic plans, manage our risks, and achieve our business objectives; our ability to develop and maintain information security systems and controls designed to guard against fraud, cyber, and privacy risks; and the effects of the COVID-19 pandemic or other national or international crises or conflicts that may occur in the future and governmental responses to such matters. These factors, risks, and uncertainties, among others, are discussed in our 2020 Form 10-K and subsequent filings with the Securities and Exchange Commission.
We caution against the undue reliance on forward-looking statements, which reflect our views only as of the date they are made. Except to the extent required by law, we specifically disclaim any obligation to update any factors or to publicly announce the revisions to any of the forward-looking statements included herein to reflect future events or developments.
GAAP to NON-GAAP RECONCILIATIONS
This Form 10-Q presents non-GAAP financial measures, in addition to GAAP financial measures, to provide investors with additional information. The adjustments to reconcile from the applicable GAAP financial measures to the non-GAAP financial measures are presented in the following schedules. We consider these adjustments to be relevant to ongoing operating results as they provide a meaningful base for period-to-period and company-to-company comparisons. We use these non-GAAP financial measures to assess our performance, financial position, and for presentations of our performance to investors. We believe that presenting these non-GAAP financial measures permits investors to assess our performance on the same basis as that applied by our management and the financial services industry.
Non-GAAP financial measures have inherent limitations and are not necessarily comparable to similar capital measures that may be presented by other financial services companies. Although non-GAAP financial measures are
4
frequently used by stakeholders to evaluate a company, they have limitations as an analytical tool and should not be considered in isolation or as a substitute for analysis of results reported under GAAP.
Tangible Common Equity and Related Measures
Tangible common equity and related measures are non-GAAP measures that exclude the impact of intangible assets and their related amortization. We believe these non-GAAP measures provide useful information about our use of shareholders’ equity and provide a basis for evaluating the performance of a business more consistently, whether acquired or developed internally.
RETURN ON AVERAGE TANGIBLE COMMON EQUITY (NON-GAAP)
| Three Months Ended | ||||||||||||||||||||
| (Dollar amounts in millions) |
September 30,
2021 |
June 30,
2021 |
September 30,
2020 |
|||||||||||||||||
|
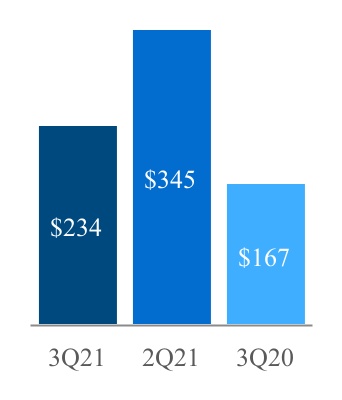
Net earnings applicable to common shareholders, net of tax
|
(a) | $ | 234 | $ | 345 | $ | 167 | |||||||||||||
| Average common equity (GAAP) | $ | 7,569 | $ | 7,436 | $ | 7,078 | ||||||||||||||
| Average goodwill and intangibles | (1,015) | (1,015) | (1,015) | |||||||||||||||||
| Average tangible common equity (non-GAAP) | (b) | $ | 6,554 | $ | 6,421 | $ | 6,063 | |||||||||||||
| Number of days in quarter | (c) | 92 | 91 | 92 | ||||||||||||||||
| Number of days in year | (d) | 365 | 365 | 366 | ||||||||||||||||
|
Return on average tangible common equity (non-GAAP)
|
(a/b/c)*d | 14.2 | % | 21.6 | % | 11.0 | % | |||||||||||||
TANGIBLE EQUITY RATIO, TANGIBLE COMMON EQUITY RATIO, AND TANGIBLE BOOK VALUE PER COMMON SHARE (ALL NON-GAAP MEASURES)
| (Dollar amounts in millions, except per share amounts) |
September 30,
2021 |
June 30,
2021 |
September 30,
2020 |
|||||||||||||||||
| Total shareholders’ equity (GAAP) | $ | 7,774 | $ | 8,033 | $ | 7,668 | ||||||||||||||
| Goodwill and intangibles | (1,015) | (1,015) | (1,016) | |||||||||||||||||
| Tangible equity (non-GAAP) | (a) | 6,759 | 7,018 | 6,652 | ||||||||||||||||
| Preferred stock | (440) | (440) | (566) | |||||||||||||||||
| Tangible common equity (non-GAAP) | (b) | $ | 6,319 | $ | 6,578 | $ | 6,086 | |||||||||||||
| Total assets (GAAP) | $ | 88,306 | $ | 87,208 | $ | 78,357 | ||||||||||||||
| Goodwill and intangibles | (1,015) | (1,015) | (1,016) | |||||||||||||||||
| Tangible assets (non-GAAP) | (c) | $ | 87,291 | $ | 86,193 | $ | 77,341 | |||||||||||||
| Common shares outstanding (thousands) | (d) | 156,530 | 162,248 | 164,009 | ||||||||||||||||
| Tangible equity ratio (non-GAAP) | (a/c) | 7.7 | % | 8.1 | % | 8.6 | % | |||||||||||||
| Tangible common equity ratio (non-GAAP) | (b/c) | 7.2 | % | 7.6 | % | 7.9 | % | |||||||||||||
| Tangible book value per common share (non-GAAP) | (b/d) | $ | 40.37 | $ | 40.54 | $ | 37.11 | |||||||||||||
5
Efficiency Ratio and Adjusted Pre-Provision Net Revenue
The efficiency ratio is a measure of operating expense relative to revenue. We believe the efficiency ratio provides useful information regarding the cost of generating revenue. The methodology of determining the efficiency ratio may differ among companies. We make adjustments to exclude certain items that are not generally expected to recur frequently, as identified in the subsequent schedule, which we believe allow for more consistent comparability among periods. Adjusted noninterest expense provides a measure as to how well we are managing our expenses; adjusted pre-provision net revenue (“PPNR”) enables management and others to assess our ability to generate capital to cover credit losses through a credit cycle. Taxable-equivalent net interest income allows us to assess the comparability of revenue arising from both taxable and tax-exempt sources.
EFFICIENCY RATIO (NON-GAAP) AND ADJUSTED PRE-PROVISION NET REVENUE (NON-GAAP)
| Three Months Ended | Nine Months Ended | Year Ended | ||||||||||||||||||||||||||||||||||||
| (Dollar amounts in millions) |
September 30,
2021 |
June 30,
2021 |
September 30,
2020 |
September 30,
2021 |
September 30,
2020 |
December 31,
2020 |
||||||||||||||||||||||||||||||||
| Noninterest expense (GAAP) | (a) | $ | 429 | $ | 428 | $ | 442 | $ | 1,292 | $ | 1,279 | $ | 1,704 | |||||||||||||||||||||||||
| Adjustments: | ||||||||||||||||||||||||||||||||||||||
|
Severance costs
|
1 | — | 1 | 1 | — | 1 | ||||||||||||||||||||||||||||||||
|
Other real estate expense, net
|
— | — | — | — | — | 1 | ||||||||||||||||||||||||||||||||
|
Restructuring costs
|
— | — | 1 | — | 2 | 1 | ||||||||||||||||||||||||||||||||
|
Pension termination-related (income) expense
|
— | — | — | (5) | 28 | 28 | ||||||||||||||||||||||||||||||||
|
SBIC investment success fee accrual
1
|
(4) | 9 | — | 5 | — | — | ||||||||||||||||||||||||||||||||
|
Total adjustments
|
(b) | (3) | 9 | 2 | 1 | 30 | 31 | |||||||||||||||||||||||||||||||
|
Adjusted noninterest expense (non-GAAP)
|
(a-b)=(c) | $ | 432 | $ | 419 | $ | 440 | $ | 1,291 | $ | 1,249 | $ | 1,673 | |||||||||||||||||||||||||
| Net interest income (GAAP) | (d) | $ | 555 | $ | 555 | $ | 555 | $ | 1,655 | $ | 1,665 | $ | 2,216 | |||||||||||||||||||||||||
|
Fully taxable-equivalent adjustments
|
(e) | 7 | 7 | 7 | 22 | 21 | 27 | |||||||||||||||||||||||||||||||
|
Taxable-equivalent net interest income (non-GAAP)
|
(d+e)=f | 562 | 562 | 562 | 1,677 | 1,686 | 2,243 | |||||||||||||||||||||||||||||||
| Noninterest income (GAAP) | g | 139 | 205 | 157 | 513 | 408 | 574 | |||||||||||||||||||||||||||||||
|
Combined income (non-GAAP)
|
(f+g)=(h) | 701 | 767 | 719 | 2,190 | 2,094 | 2,817 | |||||||||||||||||||||||||||||||
| Adjustments: | ||||||||||||||||||||||||||||||||||||||
|
Fair value and nonhedge derivative gain (loss)
|
2 | (5) | 8 | 15 | (15) | (6) | ||||||||||||||||||||||||||||||||
|
Securities gains (losses), net
1
|
(23) | 63 | 4 | 51 | (5) | 7 | ||||||||||||||||||||||||||||||||
|
Total adjustments
|
(i) | (21) | 58 | 12 | 66 | (20) | 1 | |||||||||||||||||||||||||||||||
|
Adjusted taxable-equivalent revenue (non-GAAP)
|
(h-i)=(j) | $ | 722 | $ | 709 | $ | 707 | $ | 2,124 | $ | 2,114 | $ | 2,816 | |||||||||||||||||||||||||
|
Pre-provision net revenue (PPNR) (non-GAAP)
|
(h)-(a) | $ | 272 | $ | 339 | $ | 277 | $ | 898 | $ | 815 | $ | 1,113 | |||||||||||||||||||||||||
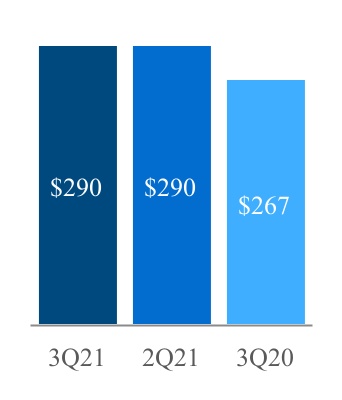
| Adjusted PPNR (non-GAAP) | (j)-(c) | 290 | 290 | 267 | 833 | 865 | 1,143 | |||||||||||||||||||||||||||||||
| Efficiency ratio (non-GAAP) | (c/j) | 59.8 | % | 59.1 | % | 62.2 | % | 60.8 | % | 59.1 | % | 59.4 | % | |||||||||||||||||||||||||
1
The success fee accrual is associated with the unrealized gain/(loss) from our SBIC investment in Recursion Pharmaceuticals, Inc., and is adjusted based on the mark-to-market value of the investment. The unrealized gain/(loss) is excluded from the efficiency ratio through securities gains (losses). Both are excluded from the efficiency ratio calculation for the applicable periods.
6
RESULTS OF OPERATIONS
Executive Summary
The financial performance in the third quarter of 2021 reflected strong credit performance, continued deposit growth, and improving customer-related fee income. Diluted earnings per share in the third quarter of 2021 increased to $1.45, compared with $1.01 in the third quarter of 2020.
Net interest income remained stable at $555 million, as the ongoing impact of a low interest rate environment was offset by a significant increase in average interest-earning assets of $10.1 billion from the prior year period. Net interest margin was 2.68% in the third quarter of 2021, compared with 3.06%.
The provision for credit losses was a negative $46 million, compared with a positive $55 million in the third quarter of 2020, reflecting improvements in economic forecasts, portfolio changes, and strong credit quality. Net loan and lease recoveries were $1 million, or 0.01% of average loans (excluding U.S. Small Business Administration (“SBA”) Paycheck Protection Program (“PPP”) loans), in the third quarter of 2021, compared with net charge-offs of $52 million, or 0.43% of average loans (ex-PPP), in the prior year quarter.
Total customer-related fees increased $12 million, or 9%, primarily due to improved customer transaction volume, new client activity, and deepening of existing client relationships. Total noninterest income decreased $18 million, or 11%, largely as a result of a $28 million negative mark-to-market adjustment during the quarter, which reduced our previously recorded unrealized gain of $63 million from the second quarter of 2021 relating to our SBIC investment in Recursion Pharmaceuticals, Inc.
Total noninterest expense declined $13 million, or 3%. The decline was attributable to a $28 million decrease in other noninterest expense that was primarily due to a $30 million donation to our charitable foundation during the third quarter of 2020, which was associated with PPP lending activity. Our efficiency ratio was 59.8%, compared with 62.2% for the third quarter of 2020. Excluding the $30 million charitable contribution in the prior year, the efficiency ratio would have been 58.0%.
The growth in average interest-earning assets was driven by a $9.6 billion increase in average money market investments and a $4.7 billion increase in average investment securities. Additionally, total deposits increased $10.8 billion, or 16%, primarily due to a $7.8 billion increase in noninterest-bearing deposits. We are actively managing our balance sheet in view of the low interest rate environment and continue to evaluate opportunities to deploy cash and money market investments into higher-yielding, low-to-medium duration assets, particularly given that deposit growth has been less transitory than we originally envisaged. We seek to balance the competing objectives of increasing current income, maintaining asset sensitivity to benefit from rising rates, and maintaining sufficient liquidity for loan growth and changes in deposit trends.
Total loans and leases decreased $4.1 billion, or 7%, primarily due to the forgiveness of PPP loans and a decline in 1-4 family residential mortgage loans. The decrease was partially offset by modest increases in the municipal, commercial real estate construction and land development, and commercial owner-occupied loan portfolios.
SBA Paycheck Protection Program
Designed to address the effects of the COVID-19 pandemic, the PPP provided small businesses with funds to be used for specific expenses, such as payroll, as defined by the SBA. Since the inception of the program in the first quarter of 2020, we processed $10 billion of PPP loans for approximately 77,000 customers, which included more than 20,000 new customers. We continue to deepen our relationships with these new customers, which has resulted in additional revenue generating services. The following schedule presents additional information related to our PPP loans.
7
PPP LOANS
| Three Months Ended | Year Ended | ||||||||||||||||||||||||||||
| (In billions) | September 30, 2021 | June 30, 2021 | March 31, 2021 | December 31, 2020 | Total | ||||||||||||||||||||||||
| Balance of loan originations during the period | $ | — | $ | 0.3 | $ | 2.6 | $ | 7.3 | $ | 10.2 | |||||||||||||||||||
| Balance of loans forgiven by the SBA during the period | 1.5 | 2.3 | 1.6 | 1.3 | 6.7 | ||||||||||||||||||||||||
| (In millions) | |||||||||||||||||||||||||||||
| Interest and amortization of fees | 22 | 32 | 29 | 120 | 203 | ||||||||||||||||||||||||
|
Accelerated recognition of unamortized net origination fees
1
|
41 | 36 | 31 | 26 | 134 | ||||||||||||||||||||||||
| Total interest income related to PPP loans | $ | 63 | $ | 68 | $ | 60 | $ | 146 | $ | 337 | |||||||||||||||||||
| Total unamortized net origination fees, at period end | $ | 83 | $ | 137 | $ | 168 | $ | 102 | |||||||||||||||||||||
| Loan yield | 6.66 | % | 4.56 | % | 3.98 | % | 3.22 | % | |||||||||||||||||||||
1
When a PPP loan is paid off or forgiven by the SBA prior to its maturity date, the remaining net unamortized deferred fees are immediately recognized into interest income at that time, increasing the PPP loan portfolio yield in that period.
Third Quarter 2021 Financial Performance
|
Net Earnings Applicable to Common Shareholders
(in millions) |
Diluted EPS |
Adjusted PPNR
(in millions) |
Efficiency ratio | |||||||||||||||||


|
Net earnings applicable to common shareholders increased from the third quarter of 2020, primarily due to a negative $46 million provision for credit losses and a $28 million decrease in other noninterest expense, largely attributable to a $30 million donation to our charitable foundation during the third quarter of 2020, which was associated with PPP lending activity.
|
Diluted earnings per share increased from the third quarter of 2020 as a result of increased net earnings and a 3.3 million decrease in average diluted shares, primarily due to share repurchases.
|
Adjusted PPNR increased $23 million from the third quarter of 2020, mainly due to the decrease in other noninterest expense related to the $30 million donation to our charitable foundation during the prior year quarter, and an increase in customer-related fees.
|
The decrease in our efficiency ratio from the prior year quarter is primarily a result of a decline in adjusted noninterest expense, driven by the previously mentioned charitable contribution, as well as improved customer-related fees.
|
|||||||||||||||||
Net Interest Income and Net Interest Margin
Net interest income is the difference between interest earned on interest-earning assets and interest paid on interest-bearing liabilities, and was approximately 80% of our net revenue (net interest income plus noninterest income) for the quarter. Net interest margin is derived from both the amount of interest-earning assets and interest-bearing liabilities and their respective yields and rates.
8
NET INTEREST INCOME AND NET INTEREST MARGIN
|
Three Months Ended
September 30, |
Amount change | Percent change | |||||||||||||||||||||
| (Dollar amounts in millions) | 2021 | 2020 | |||||||||||||||||||||
| Interest and fees on loans | $ | 484 | $ | 505 | $ | (21) | (4) | % | |||||||||||||||
| Interest on money market investments | 7 | 2 | 5 | NM | |||||||||||||||||||
| Interest on securities | 78 | 74 | 4 | 5 | |||||||||||||||||||
|
Total interest income
|
569 | 581 | (12) | (2) | |||||||||||||||||||
| Interest on deposits | 7 | 18 | (11) | (61) | |||||||||||||||||||
| Interest on short- and long-term borrowings | 7 | 8 | (1) | (13) | |||||||||||||||||||
|
Total interest expense
|
14 | 26 | (12) | (46) | |||||||||||||||||||
|
Net interest income
|
$ | 555 | $ | 555 | $ | — | — | % | |||||||||||||||
| Average interest-earning assets | $ | 83,189 | $ | 73,108 | $ | 10,081 | 14 | % | |||||||||||||||
| Average interest-bearing liabilities | $ | 40,925 | $ | 38,144 | $ | 2,781 | 7 | % | |||||||||||||||
| bps | |||||||||||||||||||||||
|
Yield on interest-earning assets
1
|
2.75 | % | 3.20 | % | (45) | ||||||||||||||||||
|
Rate paid on total deposits and interest-bearing liabilities
1
|
0.07 | % | 0.15 | % | (8) | ||||||||||||||||||
|
Cost of total deposits
1
|
0.03 | % | 0.11 | % | (8) | ||||||||||||||||||
|
Net interest margin
1
|
2.68 | % | 3.06 | % | (38) | ||||||||||||||||||
1
Rates are calculated using amounts in thousands; taxable-equivalent rates are used where applicable.
Net interest income remained stable at $555 million in the third quarter of 2021. Total interest income decreased $12 million, or 2%, primarily due to a $21 million decrease in interest and fees on loans, partially offset by a $5 million increase in interest on money market investments, and a $4 million increase in interest on securities. The decrease in total interest income was primarily attributable to the low interest rate environment and portfolio mix. Interest expense decreased $12 million, or 46%, largely due to an $11 million decline in interest paid on deposits, which was also attributable to low interest rates.
The net interest margin (“NIM”) was 2.68% in the third quarter of 2021, compared with 3.06% in the same prior year period. The yield on average interest-earning assets was 2.75%, a decrease of 45 bps, 32 bps of which was driven by a significant increase in average money market investments. The yield on average money market investments was 20 bps, compared with 25 bps in the same prior year period. The yield on loans increased 14 bps, the yield on securities decreased 41 bps, and the rates paid on interest-bearing deposits decreased 13 bps. The impact of low interest rates was partially offset by a shift in liability balances from borrowed funds to lower-cost deposits.
Average interest-earning assets increased $10.1 billion, or 14%, and included $3.8 billion of PPP loans. Average money market investments, including short-term deposits held at the Federal Reserve, increased $9.6 billion. We are actively managing our balance sheet in view of the low interest rate environment and continue to evaluate opportunities to deploy cash and money market investments into higher-yielding, low-to-medium duration assets.
9

Average loans and leases decreased $4.1 billion, or 8%, from $55.0 billion in the third quarter of 2020, primarily due to the forgiveness of PPP loans and a decrease in 1-4 family residential mortgage loans. The decline in our mortgage loan portfolio is partly due to the low interest rate environment and refinancing activity. We generally originate these mortgage loans and sell them to government sponsored entities as part of our interest rate risk management efforts to limit our balance sheet exposure to long-term assets. The yield on loans and leases increased 14 bps from the prior year quarter, primarily due to accelerated amortization of deferred fees on paid off or forgiven PPP loans. Excluding PPP loans, the yield on loans decreased 18 basis points from the third quarter of 2020. The yield on non-PPP loans originated during the third quarter of 2021 was moderately less than the yield on loans maturing or otherwise paying down.
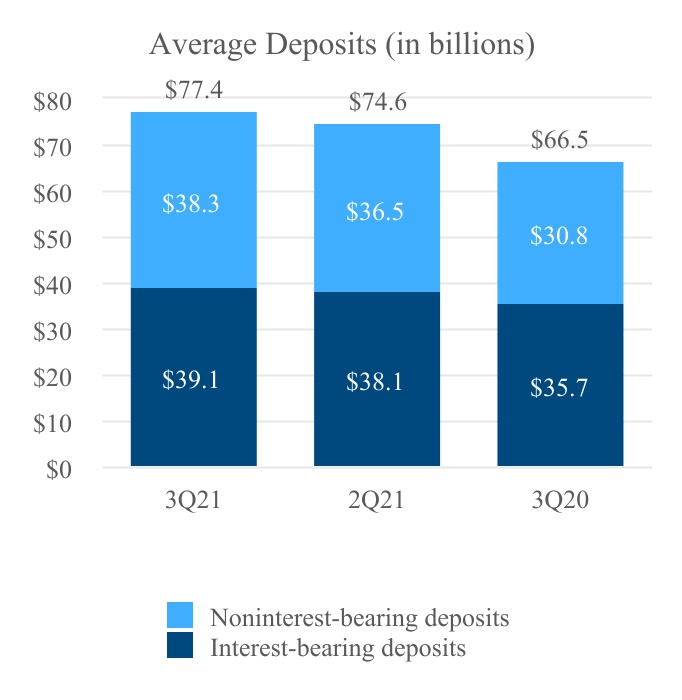
Average total deposits increased $10.9 billion to $77.4 billion at an average cost of 0.03%, from $66.5 billion at an average cost of 0.11% for the third quarter of 2020. Average interest-bearing liabilities increased $2.8 billion, or 7%, and the average rate paid on interest-bearing liabilities decreased 14 bps to 0.13%. The rate paid on total deposits and interest-bearing liabilities was 0.07%, a decrease from 0.15% during the third quarter of 2020, which was primarily due to low interest-bearing deposit rates and strong noninterest-bearing deposit growth.
Average interest-bearing deposits were $39.1 billion at an average cost of 0.07%, compared with $35.7 billion at an average cost of 0.20% for the same prior year period. Average noninterest-bearing deposits increased $7.5 billion, or 24%, and comprised 50% and 46% of average total deposits for the third quarter of 2021 and 2020, respectively. The net positive impact of noninterest-bearing sources of funds on the NIM was 0.06%, compared with 0.13% during the third quarter of 2020.
10
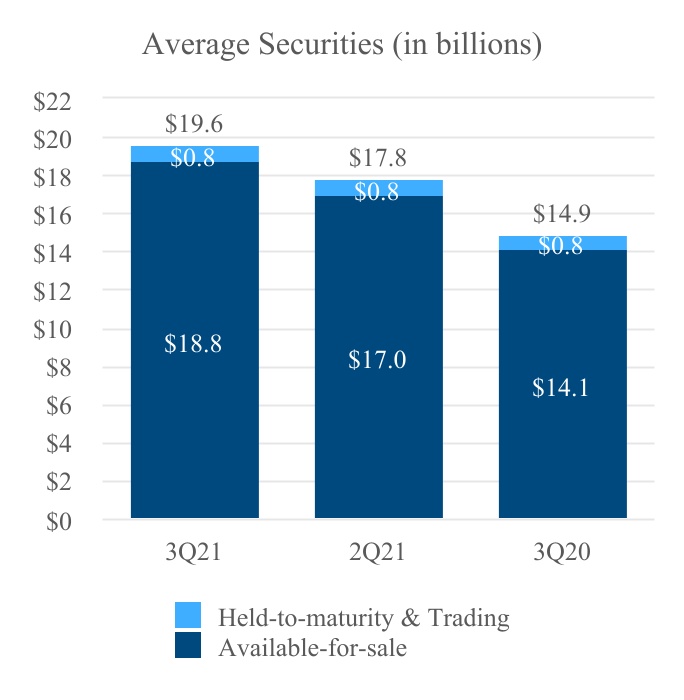

Average available-for-sale (“AFS”) securities balances increased $4.7 billion, or 34%, from $14.1 billion, in the third quarter of 2020, mainly due to an increase in our mortgage-backed securities portfolio. The yield on securities decreased 41 bps from the same prior year period, primarily due to lower yields on re-investment of principal payments and other purchases throughout the previous four quarters. We purchased $3.6 billion of AFS securities during the third quarter of 2021 with an average yield of 1.53%, and the principal repayment volume on AFS securities during the quarter was $1.1 billion. Given our current strong liquidity profile, we anticipate investment security purchases to exceed runoff over the near term.
Average borrowed funds decreased $0.6 billion from the third quarter of 2020, with average short-term borrowings decreasing $0.5 billion, and average long-term borrowings decreasing $0.1 billion. The decrease continues to reflect less reliance on borrowed funds due to strong deposit growth, which significantly exceeded earning-asset growth. The average rate paid on short-term borrowings decreased 1 bp; the rate paid on long-term debt increased 2 bps from the prior year quarter, primarily due to lower-yielding senior debt that matured over the past few quarters.
The spread on average interest-bearing funds was 2.62%, compared with 2.93% for the third quarter of 2020, and was affected by the same factors that impacted the NIM. Interest rate spreads and margins are impacted by the composition of our loan and securities portfolios and the type of funding used. For information regarding how we manage interest rate risk, see “Interest Rate and Market Risk Management” on page 28.
The following schedule summarizes the average balances, the amount of interest earned or paid, and the applicable yields for interest-earning assets and the costs of interest-bearing liabilities that generate taxable-equivalent net interest income.
11
CONSOLIDATED AVERAGE BALANCE SHEETS, YIELDS AND RATES
| (Unaudited) |
Three Months Ended
September 30, 2021 |
Three Months Ended
September 30, 2020 |
|||||||||||||||||||||||||||||||||
| (Dollar amounts in millions) |
Average
balance |
Amount of
interest
1
|
Average
yield/rate |
Average
balance |
Amount of
interest
1
|
Average
yield/rate |
|||||||||||||||||||||||||||||
| ASSETS | |||||||||||||||||||||||||||||||||||
| Money market investments | $ | 12,716 | $ | 7 | 0.20 | % | $ | 3,116 | $ | 2 | 0.25 | % | |||||||||||||||||||||||
| Securities: | |||||||||||||||||||||||||||||||||||
| Held-to-maturity | 557 | 4 | 2.87 | 672 | 6 | 3.39 | |||||||||||||||||||||||||||||
| Available-for-sale | 18,814 | 74 | 1.56 | 14,083 | 69 | 1.95 | |||||||||||||||||||||||||||||
| Trading account | 199 | 2 | 4.41 | 158 | 1 | 4.31 | |||||||||||||||||||||||||||||
|
Total securities
2
|
19,570 | 80 | 1.63 | 14,913 | 76 | 2.04 | |||||||||||||||||||||||||||||
| Loans held for sale | 52 | — | 3.03 | 86 | 1 | 4.32 | |||||||||||||||||||||||||||||
|
Loans and leases
3
|
|||||||||||||||||||||||||||||||||||
| Commercial - excluding PPP loans | 24,854 | 235 | 3.76 | 24,909 | 248 | 3.96 | |||||||||||||||||||||||||||||
| Commercial - PPP loans | 3,795 | 63 | 6.66 | 6,771 | 52 | 3.03 | |||||||||||||||||||||||||||||
| Commercial real estate | 12,144 | 105 | 3.42 | 11,986 | 106 | 3.52 | |||||||||||||||||||||||||||||
| Consumer | 10,058 | 86 | 3.38 | 11,327 | 103 | 3.60 | |||||||||||||||||||||||||||||
| Total loans and leases | 50,851 | 489 | 3.82 | 54,993 | 509 | 3.68 | |||||||||||||||||||||||||||||
| Total interest-earning assets | 83,189 | 576 | 2.75 | 73,108 | 588 | 3.20 | |||||||||||||||||||||||||||||
| Cash and due from banks | 597 | 583 | |||||||||||||||||||||||||||||||||
| Allowance for credit losses on loans and debt securities | (536) | (852) | |||||||||||||||||||||||||||||||||
| Goodwill and intangibles | 1,015 | 1,015 | |||||||||||||||||||||||||||||||||
| Other assets | 4,291 | 4,129 | |||||||||||||||||||||||||||||||||
| Total assets | $ | 88,556 | $ | 77,983 | |||||||||||||||||||||||||||||||
| LIABILITIES AND SHAREHOLDERS’ EQUITY | |||||||||||||||||||||||||||||||||||
| Interest-bearing deposits: | |||||||||||||||||||||||||||||||||||
| Savings and money market | $ | 37,262 | $ | 5 | 0.05 | % | $ | 32,111 | $ | 9 | 0.11 | % | |||||||||||||||||||||||
| Time | 1,829 | 2 | 0.32 | 3,602 | 9 | 0.96 | |||||||||||||||||||||||||||||
| Total interest-bearing deposits | 39,091 | 7 | 0.07 | 35,713 | 18 | 0.20 | |||||||||||||||||||||||||||||
| Borrowed funds: | |||||||||||||||||||||||||||||||||||
|
Federal funds purchased and other short-term borrowings
|
630 | — | 0.08 | 1,078 | — | 0.09 | |||||||||||||||||||||||||||||
| Long-term debt | 1,204 | 7 | 2.34 | 1,353 | 8 | 2.32 | |||||||||||||||||||||||||||||
| Total borrowed funds | 1,834 | 7 | 1.56 | 2,431 | 8 | 1.33 | |||||||||||||||||||||||||||||
| Total interest-bearing liabilities | 40,925 | 14 | 0.13 | 38,144 | 26 | 0.27 | |||||||||||||||||||||||||||||
| Noninterest-bearing demand deposits | 38,320 | 30,789 | |||||||||||||||||||||||||||||||||
| Other liabilities | 1,302 | 1,406 | |||||||||||||||||||||||||||||||||
| Total liabilities | 80,547 | 70,339 | |||||||||||||||||||||||||||||||||
| Shareholders’ equity: | |||||||||||||||||||||||||||||||||||
| Preferred equity | 440 | 566 | |||||||||||||||||||||||||||||||||
| Common equity | 7,569 | 7,078 | |||||||||||||||||||||||||||||||||
| Total shareholders’ equity | 8,009 | 7,644 | |||||||||||||||||||||||||||||||||
| Total liabilities and shareholders’ equity | $ | 88,556 | $ | 77,983 | |||||||||||||||||||||||||||||||
| Spread on average interest-bearing funds | 2.62 | % | 2.93 | % | |||||||||||||||||||||||||||||||
| Net impact of noninterest-bearing sources of funds | 0.06 | % | 0.13 | % | |||||||||||||||||||||||||||||||
|
Net interest margin
|
$ | 562 | 2.68 | % | $ | 562 | 3.06 | % | |||||||||||||||||||||||||||
| Memo: total loans and leases, excluding PPP loans | $ | 47,056 | 426 | 3.59 | % | $ | 48,222 | 457 | 3.77 | % | |||||||||||||||||||||||||
|
Memo: total cost of deposits
|
0.03 | % | 0.11 | % | |||||||||||||||||||||||||||||||
| Memo: total deposits and interest-bearing liabilities | 79,245 | 14 | 0.07 | % | 68,933 | 26 | 0.15 | % | |||||||||||||||||||||||||||
1
Rates are calculated using amounts in thousands and a tax rate of 21% for the periods presented. The taxable-equivalent rates used are the rates that were applicable at the time of each respective reporting period.
2
Interest on total securities includes $29 million and $26 million of taxable-equivalent premium amortization for the third quarters of 2021 and 2020, respectively.
3
Net of unamortized purchase premiums, discounts, and deferred loan fees and costs.
|
Nine Months Ended
September 30, 2021 |
Nine Months Ended
September 30, 2020 |
||||||||||||||||||||||||||||||||||
| (Dollar amounts in millions) |
Average
balance |
Amount of
interest
1
|
Average
yield/rate |
Average
balance |
Amount of
interest
1
|
Average
yield/rate |
|||||||||||||||||||||||||||||
| ASSETS | |||||||||||||||||||||||||||||||||||
| Money market investments | $ | 10,271 | $ | 14 | 0.18 | % | $ | 2,250 | $ | 11 | 0.65 | % | |||||||||||||||||||||||
| Securities: | |||||||||||||||||||||||||||||||||||
| Held-to-maturity | 599 | 13 | 2.92 | 632 | 17 | 3.56 | |||||||||||||||||||||||||||||
| Available-for-sale | 17,255 | 209 | 1.62 | 13,967 | 220 | 2.11 | |||||||||||||||||||||||||||||
| Trading account | 213 | 7 | 4.25 | 157 | 5 | 4.29 | |||||||||||||||||||||||||||||
|
Total securities
2
|
18,067 | 229 | 1.70 | 14,756 | 242 | 2.19 | |||||||||||||||||||||||||||||
| Loans held for sale | 61 | 1 | 2.77 | 106 | 4 | 4.19 | |||||||||||||||||||||||||||||
|
Loans and leases
3
|
|||||||||||||||||||||||||||||||||||
| Commercial - excluding PPP loans | 24,716 | 705 | 3.81 | 25,398 | 794 | 4.18 | |||||||||||||||||||||||||||||
| Commercial - PPP loans | 5,283 | 191 | 4.84 | 3,938 | 91 | 3.08 | |||||||||||||||||||||||||||||
| Commercial real estate | 12,104 | 313 | 3.46 | 11,800 | 351 | 3.98 | |||||||||||||||||||||||||||||
| Consumer | 10,315 | 270 | 3.50 | 11,558 | 325 | 3.75 | |||||||||||||||||||||||||||||
| Total loans and leases | 52,418 | 1,479 | 3.77 | 52,694 | 1,561 | 3.96 | |||||||||||||||||||||||||||||
| Total interest-earning assets | 80,817 | 1,723 | 2.85 | 69,806 | 1,818 | 3.48 | |||||||||||||||||||||||||||||
| Cash and due from banks | 597 | 625 | |||||||||||||||||||||||||||||||||
| Allowance for loan losses | (651) | (692) | |||||||||||||||||||||||||||||||||
| Goodwill and intangibles | 1,015 | 1,014 | |||||||||||||||||||||||||||||||||
| Other assets | 4,106 | 3,960 | |||||||||||||||||||||||||||||||||
| Total assets | $ | 85,884 | $ | 74,713 | |||||||||||||||||||||||||||||||
| LIABILITIES AND SHAREHOLDERS’ EQUITY | |||||||||||||||||||||||||||||||||||
| Interest-bearing deposits: | |||||||||||||||||||||||||||||||||||
| Savings and money market | $ | 36,168 | $ | 16 | 0.06 | % | $ | 30,360 | $ | 53 | 0.23 | % | |||||||||||||||||||||||
| Time | 2,140 | 7 | 0.44 | 3,968 | 39 | 1.33 | |||||||||||||||||||||||||||||
| Total interest-bearing deposits | 38,308 | 23 | 0.08 | 34,328 | 92 | 0.36 | |||||||||||||||||||||||||||||
| Borrowed funds: | |||||||||||||||||||||||||||||||||||
|
Federal funds purchased and other short-term borrowings
|
856 | 1 | 0.07 | 2,073 | 10 | 0.61 | |||||||||||||||||||||||||||||
| Long-term debt | 1,277 | 22 | 2.32 | 1,611 | 30 | 2.50 | |||||||||||||||||||||||||||||
| Total borrowed funds | 2,133 | 23 | 1.41 | 3,684 | 40 | 1.44 | |||||||||||||||||||||||||||||
| Total interest-bearing liabilities | 40,441 | 46 | 0.15 | 38,012 | 132 | 0.46 | |||||||||||||||||||||||||||||
| Noninterest-bearing demand deposits | 36,213 | 27,825 | |||||||||||||||||||||||||||||||||
| Other liabilities | 1,267 | 1,299 | |||||||||||||||||||||||||||||||||
| Total liabilities | 77,921 | 67,136 | |||||||||||||||||||||||||||||||||
| Shareholders’ equity: | |||||||||||||||||||||||||||||||||||
| Preferred equity | 516 | 566 | |||||||||||||||||||||||||||||||||
| Common equity | 7,447 | 7,011 | |||||||||||||||||||||||||||||||||
| Total shareholders’ equity | 7,963 | 7,577 | |||||||||||||||||||||||||||||||||
| Total liabilities and shareholders’ equity | $ | 85,884 | $ | 74,713 | |||||||||||||||||||||||||||||||
| Spread on average interest-bearing funds | 2.70 | % | 3.02 | % | |||||||||||||||||||||||||||||||
| Net impact of noninterest-bearing sources of funds | 0.08 | % | 0.21 | % | |||||||||||||||||||||||||||||||
|
Net interest margin
|
$ | 1,677 | 2.78 | % | $ | 1,686 | 3.23 | % | |||||||||||||||||||||||||||
| Memo: total loans and leases, excluding PPP loans | $ | 47,135 | 1,288 | 3.65 | % | $ | 48,756 | 1,470 | 4.03 | % | |||||||||||||||||||||||||
|
Memo: total cost of deposits
|
0.04 | % | 0.20 | % | |||||||||||||||||||||||||||||||
| Memo: total deposits and interest-bearing liabilities | 76,654 | 46 | 0.08 | % | 65,837 | 132 | 0.48 | % | |||||||||||||||||||||||||||
1
Rates are calculated using amounts in thousands and a tax rate of 21% for the periods presented. The taxable-equivalent rates used are the rates that were applicable at the time of each respective reporting period.
2
Interest on total securities includes $87 million and $80 million of taxable-equivalent premium amortization for the first nine months of 2021 and 2020, respectively.
3
Net of unamortized purchase premiums, discounts, and deferred loan fees and costs.
12
Provision for Credit Losses
The allowance for credit losses (“ACL”) is the combination of both the allowance for loan and lease losses (“ALLL”) and the reserve for unfunded lending commitments (“RULC”). The ALLL represents the estimated current expected credit losses related to the loan and lease portfolio as of the balance sheet date. The RULC represents the estimated reserve for current expected credit losses associated with off-balance sheet commitments. Changes in the ALLL and RULC, net of charge-offs and recoveries, are recorded as the provision for loan and lease losses and the provision for unfunded lending commitments, respectively, in the income statement. The ACL for debt securities is estimated separately from loans.
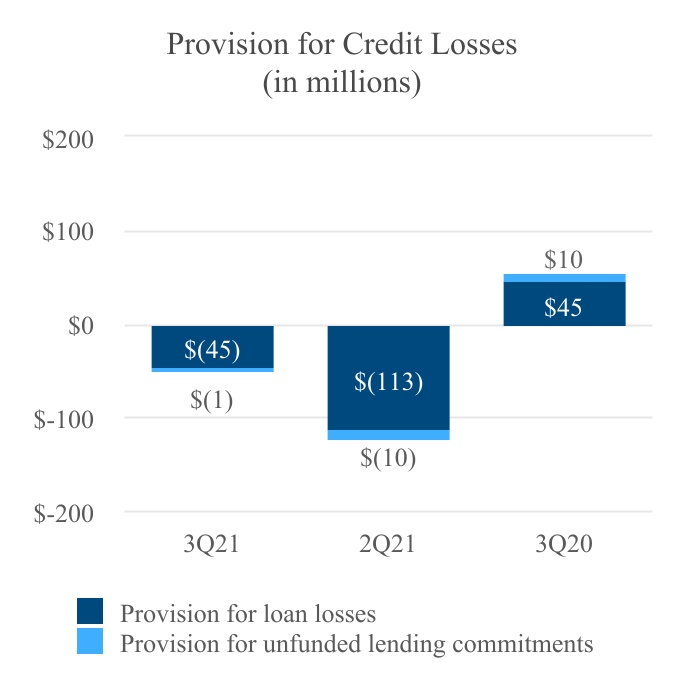

The provision for credit losses, which is the combination of both the provision for loan losses and the provision for unfunded lending commitments, was a negative $46 million, compared with a positive $55 million in the third quarter of 2020. The ACL was $529 million at September 30, 2021, compared with $917 million at September 30, 2020. The year-over-year decrease in the ACL was due largely to improvements in economic forecasts and credit quality, brought about by the reduction in economic stress caused by the COVID-19 pandemic, compared with the prior year period. The ratio of ACL to net loans and leases (ex-PPP) was 1.11% and 1.91% at September 30, 2021 and 2020, respectively.
Net loan and lease recoveries were $1 million, or 0.01% of average loans (ex-PPP), in the third quarter of 2021, compared with net charge-offs of $52 million, or 0.43% of average loans (ex-PPP), in the prior year quarter.
13
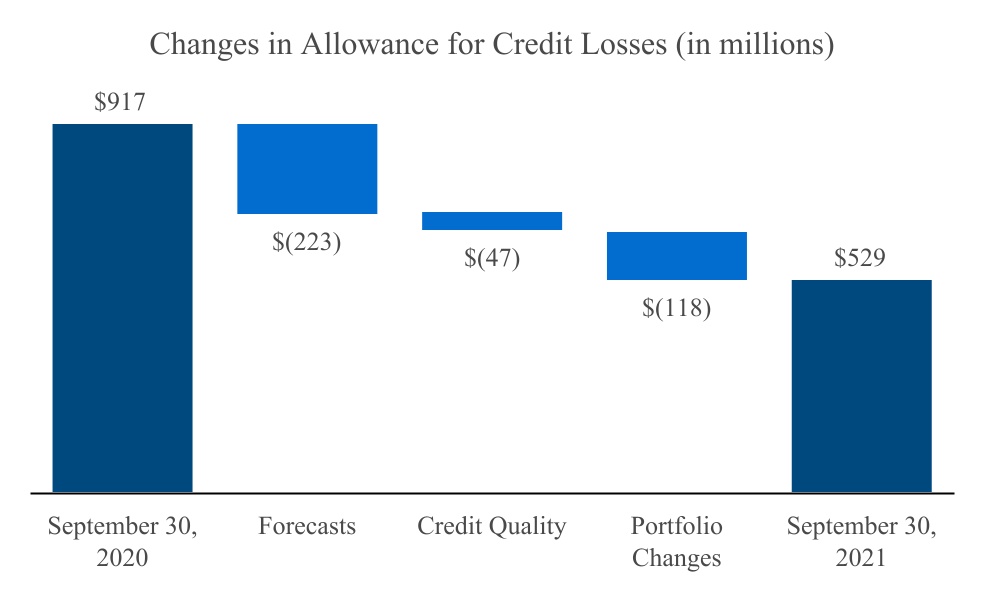
The total ACL was $529 million at September 30, 2021, compared with $917 million at September 30, 2020. The bar chart above illustrates the broad categories of change in the ACL from the prior year period. The second bar represents changes in economic forecasts and current economic conditions, which decreased the ACL by $223 million from the prior year quarter due to improvements in both realized economic results and economic forecasts.
The third bar represents changes in credit quality factors and includes risk-grade migration and specific reserves against loans, which, when combined, decreased the ACL by $47 million, indicating improved credit quality. The fourth bar represents loan portfolio changes, driven by changes in portfolio mix, the aging of the portfolio, and other risk factors; all of which resulted in a $118 million reduction in the ACL.
For more information on how we determine the appropriate level of the ACL, see “Credit Risk Management” on page 21 and Note 6 of our 2020 Form 10-K.
Noninterest Income
Noninterest income represents revenue we earn from products and services that generally have no associated interest rate or yield and is classified as either customer-related or noncustomer-related income. Customer-related fees exclude items such as securities gains and losses, dividends, insurance-related income, and mark-to-market adjustments on certain derivatives.
Total noninterest income decreased $18 million, or 11%, from $157 million for the prior year quarter. Noninterest income accounted for 20% and 22% of net revenue during the third quarter of 2021 and 2020, respectively. The following schedule presents the major components of noninterest income.
14
NONINTEREST INCOME
|
Three Months Ended
September 30, |
Amount
change |
Percent
change |
Nine Months Ended
September 30, |
Amount
change |
Percent
change |
||||||||||||||||||||||||||||||||||||||||||
| (Dollar amount in millions) | 2021 | 2020 | 2021 | 2020 | |||||||||||||||||||||||||||||||||||||||||||
|
Commercial account fees
|
$ | 34 | $ | 32 | $ | 2 | 6 | % | $ | 100 | $ | 93 | $ | 7 | 8 | % | |||||||||||||||||||||||||||||||
|
Card fees
|
25 | 21 | 4 | 19 | 70 | 61 | 9 | 15 | |||||||||||||||||||||||||||||||||||||||
| Retail and business banking fees | 20 | 17 | 3 | 18 | 55 | 50 | 5 | 10 | |||||||||||||||||||||||||||||||||||||||
| Loan-related fees and income | 27 | 32 | (5) | (16) | 73 | 84 | (11) | (13) | |||||||||||||||||||||||||||||||||||||||
| Capital markets and foreign exchange fees | 17 | 16 | 1 | 6 | 49 | 58 | (9) | (16) | |||||||||||||||||||||||||||||||||||||||
| Wealth management fees | 13 | 10 | 3 | 30 | 37 | 32 | 5 | 16 | |||||||||||||||||||||||||||||||||||||||
| Other customer-related fees | 15 | 11 | 4 | 36 | 39 | 33 | 6 | 18 | |||||||||||||||||||||||||||||||||||||||
|
Customer-related fees
|
151 | 139 | 12 | 9 | 423 | 411 | 12 | 3 | |||||||||||||||||||||||||||||||||||||||
| Fair value and nonhedge derivative income (loss) | 2 | 8 | (6) | (75) | 15 | (15) | 30 | NM | |||||||||||||||||||||||||||||||||||||||
| Dividends and other income | 9 | 6 | 3 | 50 | 24 | 17 | 7 | 41 | |||||||||||||||||||||||||||||||||||||||
| Securities gains (losses), net | (23) | 4 | (27) | NM | 51 | (5) | 56 | NM | |||||||||||||||||||||||||||||||||||||||
|
Total noninterest income
|
$ | 139 | $ | 157 | $ | (18) | (11) | % | $ | 513 | $ | 408 | $ | 105 | 26 | % | |||||||||||||||||||||||||||||||
Customer-related fees
Total customer-related fees increased $12 million, or 9%, from $139 million for the third quarter of 2020, primarily due to improved customer transaction volume, new client activity, and deepening of existing client relationships. Loan-related fees and income decreased $5 million, primarily due to a decline in mortgage banking revenue.
Noncustomer-related fees
Securities gains and losses decreased $27 million from the third quarter of 2020, largely as a result of a $28 million negative mark-to-market adjustment during the quarter, which reduced our previously recorded $63 million unrealized gain from the second quarter of 2021 relating to our SBIC investment in Recursion Pharmaceuticals, Inc. This investment will continue to be marked-to-market until the SBIC fund manager divests of the shares, which are subject to a minimum 180-day lock-up period from the initial offering in April 2021. During the second quarter of 2021, we accrued an associated success fee of $9 million in other noninterest expense, and reversed $4 million of this accrual during the current quarter based on the fair value of the investment.
We also recognized a $2 million gain related to a credit valuation adjustment (“CVA”) on client-related interest rate swaps, compared with a $8 million CVA gain in the third quarter of 2020. The CVA gain for the current quarter was primarily due to improvements in the credit quality of our clients with interest rate swaps, as well as changes in interest rates, which decreased the value of, and our credit exposure to, the client-related interest rate swaps.
Noninterest Expense
Noninterest expense decreased $13 million, or 3%, from $442 million for the third quarter of 2020. Adjusted noninterest expense decreased $8 million, or 2%, from $440 million for the same prior year quarter. The following schedule presents the major components of noninterest expense.
15
NONINTEREST EXPENSE
|
Three Months Ended
September 30, |
Amount
change |
Percent
change |
Nine Months Ended
September 30, |
Amount
change |
Percent
change |
||||||||||||||||||||||||||||||||||||||||||
| (Dollar amount in millions) | 2021 | 2020 | 2021 | 2020 | |||||||||||||||||||||||||||||||||||||||||||
| Salaries and employee benefits | $ | 285 | $ | 269 | $ | 16 | 6 | % | $ | 845 | $ | 810 | $ | 35 | 4 | % | |||||||||||||||||||||||||||||||
| Occupancy, net | 33 | 33 | — | — | 99 | 97 | 2 | 2 | |||||||||||||||||||||||||||||||||||||||
| Furniture, equipment and software, net | 31 | 32 | (1) | (3) | 95 | 97 | (2) | (2) | |||||||||||||||||||||||||||||||||||||||
| Credit-related expense | 7 | 6 | 1 | 17 | 19 | 16 | 3 | 19 | |||||||||||||||||||||||||||||||||||||||
| Professional and legal services | 16 | 12 | 4 | 33 | 53 | 34 | 19 | 56 | |||||||||||||||||||||||||||||||||||||||
| Advertising | 4 | 7 | (3) | (43) | 13 | 13 | — | — | |||||||||||||||||||||||||||||||||||||||
| FDIC premiums | 5 | 7 | (2) | (29) | 18 | 18 | — | — | |||||||||||||||||||||||||||||||||||||||
| Other | 48 | 76 | (28) | (37) | 150 | 194 | (44) | (23) | |||||||||||||||||||||||||||||||||||||||
|
Total noninterest expense
|
$ | 429 | $ | 442 | $ | (13) | (3) | % | $ | 1,292 | $ | 1,279 | $ | 13 | 1 | % | |||||||||||||||||||||||||||||||
|
Adjusted noninterest expense
1
|
$ | 432 | $ | 440 | $ | (8) | (2) | % | $ | 1,291 | $ | 1,249 | $ | 42 | 3 | % | |||||||||||||||||||||||||||||||
1
For information on non-GAAP financial measures, see “GAAP to Non-GAAP Reconciliations” on page 4.
Noninterest expense declined $13 million, when compared with the third quarter of 2020. The decline was largely attributable to a $28 million decrease in other noninterest expense that was primarily due to a $30 million donation to our charitable foundation during the third quarter of 2020, which was associated with PPP lending activity. Salaries and benefits expense increased $16 million, or 6%, primarily due to higher incentive compensation and profit sharing as a result of improved profitability and inflationary pressure on wages. Professional and legal services expense increased $4 million, or 33%, mainly due to various technology-related and other outsourced services.
Adjusted noninterest expense was $432 million, compared with $440 million for the same prior year quarter, primarily due to the decrease in other noninterest expense previously discussed.
Income Taxes
The following schedule summarizes the income tax expense and effective tax rates for the periods presented:
INCOME TAXES
|
Three Months Ended
September 30, |
Nine Months Ended
September 30, |
||||||||||||||||||||||
| (Dollar amounts in millions) | 2021 | 2020 | 2021 | 2020 | |||||||||||||||||||
| Income before income taxes | $ | 311 | $ | 215 | $ | 1,177 | $ | 313 | |||||||||||||||
| Income tax expense | 71 | 40 | 261 | 58 | |||||||||||||||||||
| Effective tax rate | 22.8 | % | 18.6 | % | 22.2 | % | 18.5 | % | |||||||||||||||
See Note 12 of the Notes to Consolidated Financial Statements for more information about the factors that influenced the income tax rates as well as information about deferred income tax assets and liabilities.
Preferred Stock Dividends
Preferred stock dividends were $6 million and $8 million for the third quarter of 2021 and 2020, respectively.
BALANCE SHEET ANALYSIS
Interest-Earning Assets
Interest-earning assets are those assets that have associated interest rates or yields, and generally consist of money market investments, securities, loans, and leases. We strive to maintain a high level of interest-earning assets relative to total assets.
For more information regarding the average balances of our interest-earning assets, the amount of revenue generated by them, and their respective yields, see the Consolidated Average Balance Sheet on page 12.
16
Investment Securities Portfolio
We invest in securities to manage liquidity and interest rate risk, in addition to generating revenue. Refer to the “Liquidity Risk Management” section on page 32 for additional information. The following schedule presents the components of our investment securities portfolio. The amortized cost amounts represent the original cost of the investments, adjusted for related amortization or accretion of any purchase premiums or discounts, and for any impairment losses, including credit-related impairment. The estimated fair value measurement levels and methodology are discussed in Note 3
of our 2020 Form 10-K.
INVESTMENT SECURITIES PORTFOLIO
| September 30, 2021 | December 31, 2020 | ||||||||||||||||||||||||||||||||||
| (In millions) | Par value |
Amortized
cost |
Estimated
fair value |
Par value |
Amortized
cost |
Estimated
fair value |
|||||||||||||||||||||||||||||
| Held-to-maturity | |||||||||||||||||||||||||||||||||||
| Municipal securities | $ | 459 | $ | 459 | $ | 461 | $ | 636 | $ | 636 | $ | 640 | |||||||||||||||||||||||
| Available-for-sale | |||||||||||||||||||||||||||||||||||
| U.S. Treasury securities | 155 | 155 | 128 | 205 | 205 | 192 | |||||||||||||||||||||||||||||
|
U.S. Government agencies and corporations:
|
|||||||||||||||||||||||||||||||||||
| Agency securities | 874 | 874 | 895 | 1,051 | 1,051 | 1,091 | |||||||||||||||||||||||||||||
|
Agency guaranteed mortgage-backed securities
|
16,640 | 16,841 | 16,819 | 11,259 | 11,439 | 11,693 | |||||||||||||||||||||||||||||
|
Small Business Administration loan-backed securities
|
938 | 1,015 | 988 | 1,103 | 1,195 | 1,160 | |||||||||||||||||||||||||||||
| Municipal securities | 1,370 | 1,513 | 1,556 | 1,237 | 1,352 | 1,420 | |||||||||||||||||||||||||||||
| Other debt securities | 75 | 75 | 75 | 175 | 175 | 175 | |||||||||||||||||||||||||||||
| Total available-for-sale | 20,052 | 20,473 | 20,461 | 15,030 | 15,417 | 15,731 | |||||||||||||||||||||||||||||
| Total HTM and AFS investment securities | $ | 20,511 | $ | 20,932 | $ | 20,922 | $ | 15,666 | $ | 16,053 | $ | 16,371 | |||||||||||||||||||||||
The amortized cost of investment securities increased 30% from December 31, 2020, and approximately 14% of the total investment securities are floating rate at September 30, 2021, compared with 23% at December 31, 2020.
The investment securities portfolio includes $421 million of net premium that is distributed across various security classes. Tax-equivalent premium amortization for the third quarter of 2021 was $29 million, compared with $26 million for the same prior year period.
At September 30, 2021, in accordance with the GAAP fair value hierarchy, 0.6% and 99.4% of the $20.5 billion AFS securities portfolio was valued at Level 1 and Level 2, respectively. This compares with 1.2% and 98.8% at December 31, 2020. None of the AFS securities portfolio was valued at Level 3 for either period. See Note 3 of our 2020 Form 10-K for further discussion of fair value accounting.
Exposure to Municipalities
We provide multiple products and services to state and local governments (referred to collectively as “municipalities”), including deposit services, loans, and investment banking services. We also invest in securities issued by municipalities. The following schedule summarizes our exposure to state and local municipalities:
MUNICIPALITIES
| (In millions) |
September 30,
2021 |
December 31,
2020 |
|||||||||
| Loans and leases | $ | 3,400 | $ | 2,951 | |||||||
| Held-to-maturity – municipal securities | 459 | 636 | |||||||||
| Available-for-sale – municipal securities | 1,556 | 1,420 | |||||||||
| Trading account – municipal securities | 235 | 149 | |||||||||
| Unfunded lending commitments | 322 | 359 | |||||||||
|
Total direct exposure to municipalities
|
$ | 5,972 | $ | 5,515 | |||||||
17
The municipal loan and lease portfolio primarily consists of general obligations of municipal entities, or is secured by real estate, a revenue pledge, or equipment. Our municipal loans and securities primarily relate to municipalities located within our geographic footprint. At September 30, 2021, no municipal loans were on nonaccrual. Municipal securities are internally graded, similar to loans, using risk-grading systems which vary based on the size and type of credit risk exposure. The internal risk grades assigned to our municipal securities are consistent with published definitions of regulatory risk classifications. At September 30, 2021, approximately $1 million of our municipal securities were classified as Substandard, and the remaining amount was classified as Pass. See Notes 5 and 6 of the Notes to Consolidated Financial Statements for additional information about the credit quality of these municipal loans and securities.
Loan and Lease Portfolio
At September 30, 2021 and December 31, 2020, the ratio of loans and leases to total assets was 57% and 66%, respectively. The largest loan category was commercial and industrial loans, which constituted 26% and 25% of our total loan portfolio for the same time periods. The following schedule presents our loans and leases according to major portfolio segment, specific loan class, and percentage of total loans:
LOAN AND LEASE PORTFOLIO
| September 30, 2021 | December 31, 2020 | ||||||||||||||||||||||
| (Dollar amounts in millions) | Amount |
% of
total loans |
Amount |
% of
total loans |
|||||||||||||||||||
| Commercial: | |||||||||||||||||||||||
| Commercial and industrial | $ | 13,230 | 26.1 | % | $ | 13,444 | 25.1 | % | |||||||||||||||
| PPP | 3,080 | 6.1 | 5,572 | 10.5 | |||||||||||||||||||
| Leasing | 293 | 0.6 | 320 | 0.6 | |||||||||||||||||||
| Owner-occupied | 8,446 | 16.6 | 8,185 | 15.3 | |||||||||||||||||||
| Municipal | 3,400 | 6.7 | 2,951 | 5.5 | |||||||||||||||||||
| Total commercial | 28,449 | 56.1 | 30,472 | 57.0 | |||||||||||||||||||
| Commercial real estate: | |||||||||||||||||||||||
| Construction and land development | 2,843 | 5.6 | 2,345 | 4.4 | |||||||||||||||||||
| Term | 9,310 | 18.4 | 9,759 | 18.2 | |||||||||||||||||||
| Total commercial real estate | 12,153 | 24.0 | 12,104 | 22.6 | |||||||||||||||||||
| Consumer: | |||||||||||||||||||||||
| Home equity credit line | 2,834 | 5.6 | 2,745 | 5.2 | |||||||||||||||||||
| 1-4 family residential | 6,140 | 12.1 | 6,969 | 13.0 | |||||||||||||||||||
| Construction and other consumer real estate | 584 | 1.2 | 630 | 1.2 | |||||||||||||||||||
| Bankcard and other revolving plans | 395 | 0.8 | 432 | 0.8 | |||||||||||||||||||
| Other | 123 | 0.2 | 124 | 0.2 | |||||||||||||||||||
| Total consumer | 10,076 | 19.9 | 10,900 | 20.4 | |||||||||||||||||||
| Total net loans and leases | $ | 50,678 | 100.0 | % | $ | 53,476 | 100.0 | % | |||||||||||||||
The loan and lease portfolio decreased $2.8 billion from December 31, 2020, primarily due to the forgiveness of PPP loans. Excluding PPP loans, commercial loans increased $469 million. Within commercial loans, municipal loans and owner-occupied loans increased $449 million and $261 million, respectively. Commercial real estate construction and land development loans increased $498 million, while term commercial real estate loans decreased $449 million. Consumer loans decreased $824 million, primarily due to a decline in 1-4 family residential mortgage loans.
Other Noninterest-Bearing Investments
Other noninterest-bearing investments are equity investments that do not generally provide interest income, but are held primarily for capital appreciation, dividends, or for certain regulatory requirements. The following schedule summarizes our other noninterest-bearing investments:
18
OTHER NONINTEREST-BEARING INVESTMENTS
| (Dollar amounts in millions) |
September 30,
2021 |
December 31,
2020 |
Amount change | Percent change | |||||||||||||||||||
| Bank-owned life insurance | $ | 535 | $ | 532 | $ | 3 | 1 | % | |||||||||||||||
| Federal Home Loan Bank stock | 11 | 11 | — | — | |||||||||||||||||||
| Federal Reserve stock | 90 | 98 | (8) | (8) | |||||||||||||||||||
| Farmer Mac stock | 18 | 28 | (10) | (36) | |||||||||||||||||||
| SBIC investments | 190 | 135 | 55 | 41 | |||||||||||||||||||
| Other | 24 | 13 | 11 | 85 | |||||||||||||||||||
| Total other noninterest-bearing investments | $ | 868 | $ | 817 | $ | 51 | 6 | % | |||||||||||||||
Total other noninterest-bearing investments increased $51 million, or 6%, during the first nine months of 2021, primarily due to a $55 million increase in the value of our SBIC investments. This increase was largely due to a $35 million net unrealized gain since the initial public offering (“IPO”) of our investment in Recursion Pharmaceuticals, Inc. in April 2021.
Premises, Equipment, and Software
Net premises, equipment, and software increased $73 million, or 6%, from December 31, 2020. We are in the final phase of a three-phase project to replace our core loan and deposit banking systems, and are well underway to convert our deposit servicing system by 2023. The total core system replacement project spend amount is comprised of both capitalized amounts and amounts that are expensed as incurred. The useful life for most of the capitalized costs is 10 years. The following schedule summarizes the total amount of capitalized costs, less accumulated depreciation, by phase, for the core system replacement project.
CAPITALIZED COSTS ASSOCIATED WITH THE CORE SYSTEM REPLACEMENT PROJECT
| September 30, 2021 | |||||||||||||||||||||||
| (In millions) | Phase 1 | Phase 2 | Phase 3 | Total | |||||||||||||||||||
| Total amount of capitalized costs, less accumulated depreciation | $ | 40 | $ | 67 | $ | 143 | $ | 250 | |||||||||||||||
Deposits
Deposits are our primary funding source. The following schedule presents our deposits by category and percentage of total deposits:
DEPOSITS
| September 30, 2021 | December 31, 2020 | ||||||||||||||||||||||
| (Dollar amounts in millions) | Amount |
% of
total deposits |
Amount |
% of
total deposits |
|||||||||||||||||||
| Noninterest-bearing demand | $ | 39,150 | 50.3 | % | $ | 32,494 | 46.7 | % | |||||||||||||||
| Interest-bearing: | |||||||||||||||||||||||
| Savings and money market | 37,046 | 47.5 | 34,571 | 49.6 | |||||||||||||||||||
| Time | 1,688 | 2.2 | 2,588 | 3.7 | |||||||||||||||||||
| Total deposits | $ | 77,884 | 100.0 | % | $ | 69,653 | 100.0 | % | |||||||||||||||
Total deposits increased $8.2 billion, or 12%, from December 31, 2020, primarily due to a $6.7 billion increase in noninterest-bearing deposits. When combined, savings and money market deposits and noninterest-bearing deposits comprised 98% and 96% of total deposits at September 30, 2021 and December 31, 2020, respectively. Total deposits included $0.4 billion and $1.3 billion of brokered deposits for the same periods. See “Liquidity Risk Management” on page 32 for additional information on funding and borrowed funds.
19
RISK MANAGEMENT
Risk management is an integral part of our operations and is a key determinant of our overall performance. We apply various strategies to mitigate the risks to which our operations are exposed, including credit risk, interest rate and market risk, liquidity risk, strategic risk, business and corporate governance risk, operational/technology risk, cyber risk, capital/financial reporting risk, legal/compliance risk (including regulatory risk), and reputational risk. These risks are overseen by the various management committees of which the Enterprise Risk Management Committee is the focal point. For a more comprehensive discussion of these risks, see “Risk Factors” in our 2020 Form 10-K.
In support of management's efforts, the Board of Directors has established certain committees consisting of appointed Board members to oversee our risk management processes. The Audit Committee oversees financial reporting risk, and the Risk Oversight Committee (“ROC”) oversees the other risk management processes. The ROC meets on a regular basis to monitor and review Enterprise Risk Management (“ERM”) activities. As required by its charter, the ROC performs oversight for various ERM activities and approves ERM policies and activities as detailed in the ROC charter.
Credit Risk Management
Credit risk is the possibility of loss from the failure of a borrower, guarantor, or another obligor to fully perform under the terms of a credit-related contract. Credit risk arises primarily from our lending activities, as well as from off-balance sheet credit instruments. For a more comprehensive discussion of our credit risk management, see “Credit Risk Management” in our 2020 Form 10-K.
Government Agency Guaranteed Loans
We participate in various guaranteed lending programs sponsored by U.S. government agencies, such as the SBA, Federal Housing Authority, U.S. Department of Veterans Affairs, Export-Import Bank of the U.S., and the U.S. Department of Agriculture. At September 30, 2021, the principal balance of these loans was $3.7 billion, of which $3.5 billion was guaranteed primarily by the SBA. The following schedule presents the composition of government agency guaranteed loans and includes $3.1 billion of the previously mentioned PPP loans.
GOVERNMENT GUARANTEES
| (Dollar amounts in millions) |
September 30,
2021 |
Percent
guaranteed |
December 31,
2020 |
Percent
guaranteed |
|||||||||||||||||||
| Commercial | $ | 3,650 | 96 | % | $ | 6,116 | 98 | % | |||||||||||||||
| Commercial real estate | 23 | 74 | 18 | 72 | |||||||||||||||||||
| Consumer | 4 | 100 | 5 | 100 | |||||||||||||||||||
| Total loans | $ | 3,677 | 96 | % | $ | 6,139 | 98 | % | |||||||||||||||
20
Commercial Lending
The following schedule provides information regarding lending concentrations to certain industries in our commercial lending portfolio.
COMMERCIAL LENDING BY INDUSTRY GROUP
| September 30, 2021 | December 31, 2020 | ||||||||||||||||||||||
| (Dollar amounts in millions) | Amount | Percent | Amount | Percent | |||||||||||||||||||
| Real estate, rental and leasing | $ | 2,465 | 8.7 | % | $ | 2,408 | 7.9 | % | |||||||||||||||
| Manufacturing | 2,432 | 8.5 | 2,480 | 8.1 | |||||||||||||||||||
| Healthcare and social assistance | 2,398 | 8.4 | 2,686 | 8.8 | |||||||||||||||||||
| Retail trade | 2,359 | 8.3 | 2,736 | 9.0 | |||||||||||||||||||
| Finance and insurance | 2,172 | 7.6 | 2,115 | 6.9 | |||||||||||||||||||
| Public Administration | 1,755 | 6.2 | 1,512 | 5.0 | |||||||||||||||||||
| Hospitality and food services | 1,619 | 5.7 | 1,545 | 5.1 | |||||||||||||||||||
| Wholesale trade | 1,582 | 5.5 | 1,735 | 5.7 | |||||||||||||||||||
| Construction | 1,553 | 5.5 | 2,001 | 6.6 | |||||||||||||||||||
|
Utilities
1
|
1,473 | 5.2 | 1,507 | 4.9 | |||||||||||||||||||
| Transportation and warehousing | 1,317 | 4.6 | 1,526 | 5.0 | |||||||||||||||||||
| Other Services (except Public Administration) | 1,222 | 4.3 | 1,207 | 4.0 | |||||||||||||||||||
| Professional, scientific, and technical services | 1,185 | 4.2 | 1,598 | 5.2 | |||||||||||||||||||
| Educational services | 1,131 | 4.0 | 1,181 | 3.9 | |||||||||||||||||||
|
Other
2
|
3,786 | 13.3 | 4,235 | 13.9 | |||||||||||||||||||
| Total | $ | 28,449 | 100.0 | % | $ | 30,472 | 100.0 | % | |||||||||||||||
1
Includes primarily utilities, power, and renewable energy.
2
No other industry group exceeds 3.9%.
21
Commercial Real Estate Loans
Certain information regarding our commercial real estate (“CRE”) loan portfolio is presented in the following schedule.
COMMERCIAL REAL ESTATE PORTFOLIO BY LOAN TYPE AND COLLATERAL LOCATION
| (Dollar amounts in millions) | Collateral Location | |||||||||||||||||||||||||||||||||||||||||||||||||||||||||||||||||||
| Loan type |
As of
date |
Arizona | California | Colorado | Nevada | Texas |
Utah/
Idaho |
Wash-ington |
Other
1
|
Total |
% of
total CRE |
|||||||||||||||||||||||||||||||||||||||||||||||||||||||||
| Commercial term | ||||||||||||||||||||||||||||||||||||||||||||||||||||||||||||||||||||
|
Balance outstanding
|
9/30/2021 | $ | 1,063 | $ | 3,182 | $ | 536 | $ | 739 | $ | 1,449 | $ | 1,399 | $ | 486 | $ | 456 | $ | 9,310 | 76.6 | % | |||||||||||||||||||||||||||||||||||||||||||||||
| % of loan type | 11.4 | % | 34.2 | % | 5.8 | % | 7.9 | % | 15.6 | % | 15.0 | % | 5.2 | % | 4.9 | % | 100.0 | % | ||||||||||||||||||||||||||||||||||||||||||||||||||
|
Delinquency rates
2
:
|
||||||||||||||||||||||||||||||||||||||||||||||||||||||||||||||||||||
|
30-89 days
|
9/30/2021 | 0.2 | % | 0.1 | % | — | % | — | % | 0.2 | % | — | % | — | % | — | % | 0.1 | % | |||||||||||||||||||||||||||||||||||||||||||||||||
| 12/31/2020 | 0.7 | % | 1.1 | % | — | % | — | % | 0.7 | % | — | % | — | % | 0.2 | % | 0.6 | % | ||||||||||||||||||||||||||||||||||||||||||||||||||
|
≥ 90 days
|
9/30/2021 | — | % | — | % | — | % | — | % | 0.8 | % | 0.2 | % | — | % | — | % | 0.2 | % | |||||||||||||||||||||||||||||||||||||||||||||||||
| 12/31/2020 | 0.1 | % | 0.2 | % | — | % | — | % | — | % | 0.2 | % | — | % | 0.2 | % | 0.1 | % | ||||||||||||||||||||||||||||||||||||||||||||||||||
|
Accruing loans past due 90 days or more
|
9/30/2021 | $ | — | $ | — | $ | — | $ | — | $ | — | $ | — | $ | — | $ | — | $ | — | |||||||||||||||||||||||||||||||||||||||||||||||||
| 12/31/2020 | — | 4 | — | — | — | — | — | — | 4 | |||||||||||||||||||||||||||||||||||||||||||||||||||||||||||
|
Nonaccrual loans
|
9/30/2021 | $ | — | $ | 3 | $ | — | $ | — | $ | 17 | $ | 4 | $ | — | $ | 1 | $ | 25 | |||||||||||||||||||||||||||||||||||||||||||||||||
| 12/31/2020 | 1 | 5 | — | — | 18 | 6 | — | 1 | 31 | |||||||||||||||||||||||||||||||||||||||||||||||||||||||||||
|
Residential construction and land development
3
|
||||||||||||||||||||||||||||||||||||||||||||||||||||||||||||||||||||
|
Balance outstanding
|
9/30/2021 | $ | 67 | $ | 168 | $ | 55 | $ | — | $ | 185 | $ | 172 | $ | 9 | $ | 21 | $ | 677 | 5.6 | % | |||||||||||||||||||||||||||||||||||||||||||||||
| % of loan type | 9.9 | % | 24.7 | % | 8.0 | % | — | % | 27.4 | % | 25.4 | % | 1.4 | % | 3.2 | % | 100.0 | % | ||||||||||||||||||||||||||||||||||||||||||||||||||
| Commercial construction and land development | ||||||||||||||||||||||||||||||||||||||||||||||||||||||||||||||||||||
|
Balance outstanding
|
9/30/2021 | $ | 222 | $ | 422 | $ | 98 | $ | 98 | $ | 577 | $ | 583 | $ | 144 | $ | 22 | $ | 2,166 | 17.8 | % | |||||||||||||||||||||||||||||||||||||||||||||||
| % of loan type | 10.3 | % | 19.5 | % | 4.5 | % | 4.5 | % | 26.7 | % | 26.9 | % | 6.6 | % | 1.0 | % | 100.0 | % | ||||||||||||||||||||||||||||||||||||||||||||||||||
|
Delinquency rates
2
:
|
||||||||||||||||||||||||||||||||||||||||||||||||||||||||||||||||||||
|
30-89 days
|
9/30/2021 | — | % | — | % | — | % | — | % | — | % | — | % | 13.2 | % | — | % | 0.9 | % | |||||||||||||||||||||||||||||||||||||||||||||||||
| 12/31/2020 | — | % | — | % | — | % | — | % | — | % | — | % | — | % | — | % | — | % | ||||||||||||||||||||||||||||||||||||||||||||||||||
|
≥ 90 days
|
9/30/2021 | — | % | — | % | — | % | — | % | — | % | — | % | — | % | — | % | — | % | |||||||||||||||||||||||||||||||||||||||||||||||||
| 12/31/2020 | — | % | — | % | — | % | — | % | — | % | — | % | 3.9 | % | — | % | 0.2 | % | ||||||||||||||||||||||||||||||||||||||||||||||||||
|
Accruing loans past due 90 days or more
|
9/30/2021 | $ | — | $ | — | $ | — | $ | — | $ | — | $ | — | $ | — | $ | — | $ | — | |||||||||||||||||||||||||||||||||||||||||||||||||
| 12/31/2020 | — | — | — | — | — | — | 4 | — | 4 | |||||||||||||||||||||||||||||||||||||||||||||||||||||||||||
|
Total construction and land development
|
9/30/2021 | $ | 289 | $ | 590 | $ | 153 | $ | 98 | $ | 762 | $ | 755 | $ | 153 | $ | 43 | $ | 2,843 | |||||||||||||||||||||||||||||||||||||||||||||||||
|
Total commercial real estate
|
9/30/2021 | $ | 1,352 | $ | 3,772 | $ | 689 | $ | 837 | $ | 2,211 | $ | 2,154 | $ | 639 | $ | 499 | $ | 12,153 | 100.0 | % | |||||||||||||||||||||||||||||||||||||||||||||||
1
No other geography exceeds $51 million for all three loan types.
2
Delinquency rates include nonaccrual loans.
3
At September 30, 2021 and December 31, 2020, there was no meaningful delinquency or nonaccrual activity for residential construction and land development loans.
At September 30, 2021, our CRE construction and land development and term loan portfolios represent approximately 24% of the total loan portfolio. The majority of our CRE loans are secured by real estate located within our geographic footprint. Approximately 21% of the CRE loan portfolio matures in the next 12 months. Construction and land development loans generally mature in 18 to 36 months and contain full or partial recourse guarantee structures with one- to five-year extension options or roll-to-perm options that often result in term debt. Term CRE loans generally mature within a three- to seven-year period and consist of full, partial, and non-recourse guarantee structures. Typical term CRE loan structures include annually tested operating covenants that require loan rebalancing based on minimum debt service coverage, debt yield, or loan-to-value tests.
22
Approximately $146 million, or 5%, of the construction and land development portfolio at September 30, 2021 consists of land acquisition and development loans. Most of these land acquisition and development loans are secured by specific retail, apartment, office, or other types of real estate. For a more comprehensive discussion of CRE loans, see the “Commercial Real Estate Loans” section in our 2020 Form 10-K.
Consumer Loans
We originate first and second-lien residential home mortgages, generally considered to be of prime quality. We generally hold variable-rate loans in our portfolio and sell “conforming” fixed-rate loans to third parties, including Federal National Mortgage Association and Federal Home Loan Mortgage Corporation, for which we make representations and warranties that the loans meet certain underwriting and collateral documentation standards.
We also originate home equity credit lines (“HECL”). At September 30, 2021 and December 31, 2020, our HECL portfolio totaled $2.8 billion and $2.7 billion, respectively. The following schedule presents our HECL portfolio by lien status.
HECL PORTFOLIO BY LIEN STATUS
| (In millions) |
September 30,
2021 |
December 31, 2020 | |||||||||
| Secured by first liens | $ | 1,441 | $ | 1,354 | |||||||
| Secured by second (or junior) liens | 1,393 | 1,391 | |||||||||
| Total | $ | 2,834 | $ | 2,745 | |||||||
At September 30, 2021, loans representing less than 1% of the outstanding balance in the HECL portfolio were estimated to have combined loan-to-value ratios (“CLTV”) above 100%. An estimated CLTV ratio is the ratio of our loan plus any prior lien amounts divided by the estimated current collateral value. At origination, underwriting standards for the HECL portfolio generally include a maximum 80% CLTV with high credit scores.
Approximately 90% of our HECL portfolio is still in the draw period, and approximately 13% of those loans are scheduled to begin amortizing within the next five years. We believe the risk of borrower default in the event of a loan becoming fully amortizing and the risk of higher interest rates is minimal in the current economic environment. The ratio of net charge-offs for the trailing twelve months to average balances at September 30, 2021 and 2020 was (0.01)% and 0.02%, respectively. See Note 6 of the Notes to Consolidated Financial Statements for additional information on the credit quality of this portfolio.
Nonperforming Assets
Nonperforming assets as a percentage of loans and leases and other real estate owned (“OREO”) decreased to 0.64% at September 30, 2021, compared with 0.69% at December 31, 2020.
Total nonaccrual loans at September 30, 2021 decreased to $323 million from $367 million at December 31, 2020, primarily in the commercial and industrial loan portfolio.
The balance of nonaccrual loans can decrease due to paydowns, charge-offs, and the return of loans to accrual status under certain conditions. If a nonaccrual loan is refinanced or restructured, the new note is immediately placed on nonaccrual. If a restructured loan performs under the new terms for at least a period of six months, the loan can be considered for return to accrual status. See “Restructured Loans” following for more information. See also Note 6 of the Notes to Consolidated Financial Statements for more information on nonaccrual loans.
23
The following schedule presents our nonperforming assets:
NONPERFORMING ASSETS
| (Dollar amounts in millions) |
September 30,
2021 |
December 31,
2020 |
|||||||||
|
Nonaccrual loans
1
|
$ | 323 | $ | 367 | |||||||
|
Other real estate owned
2
|
1 | 4 | |||||||||
| Total nonperforming assets | $ | 324 | $ | 371 | |||||||
|
Ratio of nonperforming assets to net loans and leases
1
and other real estate owned
|
0.64 | % | 0.69 | % | |||||||
| Accruing loans past due 90 days or more | $ | 4 | $ | 12 | |||||||
|
Ratio of accruing loans past due 90 days or more to loans and leases
1
|
0.01 | % | 0.02 | % | |||||||
| Nonaccrual loans and accruing loans past due 90 days or more | $ | 327 | $ | 379 | |||||||
|
Ratio of nonaccrual loans and accruing loans past due 90 days or more to loans and leases
1
|
0.64 | % | 0.71 | % | |||||||
| Accruing loans past due 30-89 days | $ | 114 | $ | 112 | |||||||
|
Nonaccrual loans
1
current as to principal and interest payments
|
70.3 | % | 58.3 | % | |||||||
1
Includes loans held for sale.
2
Does not include banking premises held for sale.
Troubled Debt Restructured Loans
Loans may be modified in the normal course of business for competitive reasons or to strengthen our collateral position. Loan modifications and restructurings may also occur when the borrower experiences financial difficulty and needs temporary or permanent relief from the original contractual terms of the loan. Loans that have been modified to accommodate a borrower who is experiencing financial difficulties, and for which we have granted a concession that we would not otherwise consider, are deemed troubled debt restructurings (“TDRs”). Modifications that qualified for applicable accounting and regulatory exemption for borrowers experiencing financial difficulties exclusively related to the COVID-19 pandemic were not classified and reported as TDRs.
TDRs totaled $352 million at September 30, 2021, compared with $311 million at December 31, 2020. The increase was primarily due to borrowers experiencing financial difficulty as a result of the COVID-19 pandemic and whose modifications did not qualify for the related accounting and regulatory exemption. Commercial loans may be modified to provide borrowers more time to complete the project, to achieve a higher lease-up percentage, to sell the property, or for other reasons. Consumer loan TDRs represent loan modifications in which a concession has been granted to a borrower who is unable to refinance the loan with another lender, or who is experiencing economic hardship. Such consumer loan TDRs may include first-lien residential mortgage loans and home equity loans.
If the restructured loan performs for at least six months according to the modified terms, and an analysis of the customer’s financial condition indicates that we are reasonably assured of repayment of the modified principal and interest, the loan may be returned to accrual status. The borrower’s payment performance prior to and following the restructuring is taken into account to determine whether a loan should be returned to accrual status.
ACCRUING AND NONACCRUING TROUBLED DEBT RESTRUCTURED LOANS
| (In millions) |
September 30,
2021 |
December 31,
2020 |
|||||||||
| Restructured loans – accruing | $ | 231 | $ | 198 | |||||||
| Restructured loans – nonaccruing | 121 | 113 | |||||||||
| Total | $ | 352 | $ | 311 | |||||||
24
In the periods following the calendar year in which a loan was restructured, a loan may no longer be reported as a TDR if it is on accrual, is in compliance with its modified terms, and yields a market rate (as determined and documented at the time of the modification or restructure). See Note 6 of the Notes to Consolidated Financial Statements for additional information regarding TDRs.
TROUBLED DEBT RESTRUCTURED LOANS ROLLFORWARD
|
Three Months Ended
September 30, |
Nine Months Ended
September 30, |
|||||||||||||||||||||||||
| (In millions) | 2021 | 2020 | 2021 | 2020 | ||||||||||||||||||||||
| Balance at beginning of period | $ | 458 | $ | 285 | $ | 311 | $ | 153 | ||||||||||||||||||
| New identified TDRs and principal increases | 17 | 50 | 200 | 222 | ||||||||||||||||||||||
| Payments and payoffs | (33) | (13) | (64) | (35) | ||||||||||||||||||||||
| Charge-offs | — | (33) | (3) | (48) | ||||||||||||||||||||||
| No longer reported as TDRs | (86) | — | (86) | (2) | ||||||||||||||||||||||
| Sales and other | (4) | (8) | (6) | (9) | ||||||||||||||||||||||
| Balance at end of period | $ | 352 | $ | 281 | $ | 352 | $ | 281 | ||||||||||||||||||
Allowance for Credit Losses
The ACL includes the ALLL and the RULC. The ACL represents our estimate of current expected credit losses related to the loan and lease portfolio and unfunded lending commitments as of the balance sheet date. To determine the adequacy of the allowance, we segment our loan and lease portfolio based on loan type.
25
The following schedule shows the changes in the ACL and a summary of credit loss experience:
SUMMARY OF CREDIT LOSS EXPERIENCE
| (Dollar amounts in millions) |
Nine Months Ended
September 30, 2021 |
Twelve Months Ended
December 31, 2020 |
Nine Months Ended
September 30, 2020 |
||||||||||||||
| Loans and leases outstanding (net of unearned income) | $ | 50,678 | $ | 53,476 | $ | 54,745 | |||||||||||
| Average loans and leases outstanding (net of unearned income) | $ | 52,418 | $ | 53,016 | $ | 52,694 | |||||||||||
| Allowance for loan losses: | |||||||||||||||||
| Balance at beginning of period | $ | 777 | $ | 497 | $ | 497 | |||||||||||
| Provision for loan losses | (281) | 385 | 446 | ||||||||||||||
| Charge-offs: | |||||||||||||||||
| Commercial | 27 | 113 | 95 | ||||||||||||||
| Commercial real estate | — | 1 | 1 | ||||||||||||||
| Consumer | 10 | 14 | 11 | ||||||||||||||
| Total | 37 | 128 | 107 | ||||||||||||||
| Recoveries: | |||||||||||||||||
| Commercial | 24 | 14 | 11 | ||||||||||||||
| Commercial real estate | — | — | — | ||||||||||||||
| Consumer | 8 | 9 | 6 | ||||||||||||||
| Total | 32 | 23 | 17 | ||||||||||||||
| Net loan and lease charge-offs | 5 | 105 | 90 | ||||||||||||||
| Balance at end of period | $ | 491 | $ | 777 | $ | 853 | |||||||||||
| Reserve for unfunded lending commitments: | |||||||||||||||||
| Balance at beginning of period | $ | 58 | $ | 29 | $ | 29 | |||||||||||
| Provision for unfunded lending commitments | (20) | 29 | 35 | ||||||||||||||
| Balance at end of period | $ | 38 | $ | 58 | $ | 64 | |||||||||||
| Total allowance for credit losses: | |||||||||||||||||
| Allowance for loan losses | $ | 491 | $ | 777 | $ | 853 | |||||||||||
| Reserve for unfunded lending commitments | 38 | 58 | 64 | ||||||||||||||
| Total allowance for credit losses | $ | 529 | $ | 835 | $ | 917 | |||||||||||
|
Annualized ratio of net charge-offs to average loans and leases
1
|
0.02 | % | 0.20 | % | 0.23 | % | |||||||||||
|
Ratio of allowance for credit losses to net loans and leases, at period end
2
|
1.04 | % | 1.56 | % | 1.68 | % | |||||||||||
| Ratio of allowance for credit losses to nonaccrual loans, at period end | 164 | % | 228 | % | 261 | % | |||||||||||
| Ratio of allowance for credit losses to nonaccrual loans and accruing loans past due 90 days or more, at period end | 162 | % | 220 | % | 245 | % | |||||||||||
1
The annualized ratio of net charge-offs to average loans and leases (excluding PPP loans) was 0.02% and 0.22% at September 30, 2021 and December 31, 2020, respectively. Ratios are annualized for the periods presented except for the period representing the full twelve months.
2
The ratio of allowance for credit losses to net loans and leases (excluding PPP loans) was 1.11% and 1.74% at September 30, 2021 and December 31, 2020, respectively.
The total ACL decreased during the first nine months of 2021 by $306 million, primarily due to improvement in economic forecasts and credit quality, compared with the more stressed economic outlook in the prior year due to the COVID-19 pandemic.
The RULC represents a reserve for potential losses associated with off-balance sheet commitments and standby letters of credit. The reserve is separately shown in the balance sheet and any related increases or decreases in the reserve are shown separately in the income statement. At September 30, 2021, the reserve was $38 million, compared with $58 million and $64 million at December 31, 2020 and September 30, 2020, respectively.
26
See Note 6 of the Notes to Consolidated Financial Statements for additional information related to the ACL and credit quality of each loan portfolio segment. See Note 5 for information related to the ACL for the debt securities portfolio.
Interest Rate and Market Risk Management
Interest rate risk is the potential for reduced net interest income and other rate-sensitive income resulting from adverse changes in the level of interest rates. Market risk is the potential for loss arising from adverse changes in the fair value of fixed-income securities, equity securities, other earning assets, and derivative financial instruments as a result of changes in interest rates or other factors. As a financial institution that engages in transactions involving various financial products, we are exposed to both interest rate risk and market risk. For a more comprehensive discussion of our interest rate and market risk management, see “Interest Rate and Market Risk Management” in our 2020 Form 10-K.
Interest Rate Risk
Average total deposits increased 16% from September 30, 2020, and a significant portion of the deposits were invested in money market investments, resulting in increased asset sensitivity to rising rates. The higher asset sensitivity to rising rates is dependent upon the assumptions we used for deposit runoff and repricing behavior, which is more uncertain given the higher level of new deposits. We are less asset-sensitive to declining rates than rising rates due to the limited amount that the spread between the cost of deposits and the yield on money market investments could compress. Due to our concentration in noninterest-bearing deposits and the low interest rates paid on our interest-bearing deposits, there is reduced opportunity to lower the cost of deposits.
The following schedule presents derivatives utilized in our asset-liability management (“ALM”) activities that are designated in qualifying hedging relationships as defined by GAAP at September 30, 2021 and December 31, 2020. Included in the schedule are the notional amount, fair value, and the weighted average fixed-rate for each category of interest rate derivatives, as well as cash flow and fair value hedges by their contractual maturities.
ASSET LIABILITY MANAGEMENT DERIVATIVE POSITIONS
| September 30, 2021 | |||||||||||||||||||||||||||||||||||||||||||||||
| Contractual Maturity | |||||||||||||||||||||||||||||||||||||||||||||||
| (Dollar amounts in millions) | Total |
2022
|
2023
|
2024
|
2025
|
2026 | Thereafter |
Matured in 2021
|
|||||||||||||||||||||||||||||||||||||||
| Cash flow hedges | |||||||||||||||||||||||||||||||||||||||||||||||
| Cash flow asset hedges | |||||||||||||||||||||||||||||||||||||||||||||||
|
Net fair value
1
|
$ | 45 | $ | 21 | $ | 9 | $ | 19 | $ | — | $ | (1) | $ | (3) | $ | — | |||||||||||||||||||||||||||||||
| Total notional amount | 5,383 | 2,400 | 300 | 400 | 683 | 800 | 800 | 50 | |||||||||||||||||||||||||||||||||||||||
| Weighted average fixed-rate | 1.64 | % | 2.06 | % | 2.35 | % | 2.35 | % | 0.81 | % | 1.03 | % | 1.11 | % | 1.81 | % | |||||||||||||||||||||||||||||||
| Fair value hedges | 2021 - 2025 | 2026 - 2030 | 2031 - 2035 | 2036 - 2040 | 2041 - 2050 | Thereafter | |||||||||||||||||||||||||||||||||||||||||
| Fair value debt hedges | |||||||||||||||||||||||||||||||||||||||||||||||
|
Net fair value
1
|
$ | 10 | $ | — | $ | 10 | $ | — | $ | — | $ | — | $ | — | $ | — | |||||||||||||||||||||||||||||||
| Total notional amount | 500 | — | 500 | — | — | — | — | — | |||||||||||||||||||||||||||||||||||||||
| Weighted average fixed-rate | 1.70 | % | — | % | 1.70 | % | — | % | — | % | — | % | — | % | — | % | |||||||||||||||||||||||||||||||
|
Fair value asset hedges
2
|
|||||||||||||||||||||||||||||||||||||||||||||||
|
Net fair value
1
|
$ | 48 | $ | — | $ | — | $ | 20 | $ | — | $ | 28 | $ | — | $ | — | |||||||||||||||||||||||||||||||
| Total notional amount | 384 | — | — | 229 | — | 155 | — | — | |||||||||||||||||||||||||||||||||||||||
| Weighted average fixed-rate | 1.05 | % | — | % | — | % | 1.05 | % | — | % | 1.04 | % | — | % | — | % | |||||||||||||||||||||||||||||||
| Total ALM fair value hedges | |||||||||||||||||||||||||||||||||||||||||||||||
|
Net fair value
1
|
$ | 58 | $ | — | $ | 10 | $ | 20 | $ | — | $ | 28 | $ | — | $ | — | |||||||||||||||||||||||||||||||
| Total notional amount | 884 | — | 500 | 229 | — | 155 | — | — | |||||||||||||||||||||||||||||||||||||||
27
| December 31, 2020 | |||||||||||||||||||||||||||||||||||||||||||||||
| Contractual Maturity | |||||||||||||||||||||||||||||||||||||||||||||||
| (Dollar amounts in millions) | Total |
2021
|
2022
|
2023
|
2024
|
2025
|
Thereafter |
Matured in 2020
|
|||||||||||||||||||||||||||||||||||||||
| Cash flow hedges | |||||||||||||||||||||||||||||||||||||||||||||||
| Cash flow asset hedges | |||||||||||||||||||||||||||||||||||||||||||||||
|
Net fair value
1
|
$ | 98 | $ | — | $ | 56 | $ | 14 | $ | 28 | $ | — | $ | — | $ | — | |||||||||||||||||||||||||||||||
| Total notional amount | 3,150 | 50 | 2,400 | 300 | 400 | — | — | 438 | |||||||||||||||||||||||||||||||||||||||
| Weighted average fixed-rate | 2.12 | % | 1.81 | % | 2.06 | % | 2.35 | % | 2.35 | % | — | % | — | % | 1.41 | % | |||||||||||||||||||||||||||||||
| Fair value hedges | 2021 - 2025 | 2026 - 2030 | 2031 - 2035 | 2036 - 2040 | 2041 - 2050 | Thereafter | |||||||||||||||||||||||||||||||||||||||||
| Fair value debt hedges | |||||||||||||||||||||||||||||||||||||||||||||||
|
Net fair value
1
|
$ | 37 | $ | — | $ | 37 | $ | — | $ | — | $ | — | $ | — | $ | — | |||||||||||||||||||||||||||||||
| Total notional amount | 500 | — | 500 | — | — | — | — | — | |||||||||||||||||||||||||||||||||||||||
| Weighted average fixed-rate | 1.70 | % | — | % | 1.70 | % | — | % | — | % | — | % | — | % | — | % | |||||||||||||||||||||||||||||||
|
Fair value asset hedges
2
|
|||||||||||||||||||||||||||||||||||||||||||||||
|
Net fair value
1
|
$ | 21 | $ | — | $ | — | $ | 7 | $ | — | $ | 14 | $ | — | $ | — | |||||||||||||||||||||||||||||||
| Total notional amount | 383 | — | — | 228 | — | 155 | — | — | |||||||||||||||||||||||||||||||||||||||
| Weighted average fixed-rate | 1.05 | % | — | % | — | % | 1.05 | % | — | % | 1.04 | % | — | % | — | % | |||||||||||||||||||||||||||||||
| Total ALM fair value hedges | |||||||||||||||||||||||||||||||||||||||||||||||
|
Net fair value
1
|
$ | 58 | $ | — | $ | 37 | $ | 7 | $ | — | $ | 14 | $ | — | $ | — | |||||||||||||||||||||||||||||||
| Total notional amount | 883 | — | 500 | 228 | — | 155 | — | — | |||||||||||||||||||||||||||||||||||||||
1
Fair values shown in the schedule above are presented net and exclude the effects of collateral settlements for centrally cleared derivatives.
2
Fair value asset hedges consist of pay-fixed swaps hedging AFS fixed-rate securities.
Under most rising interest rate environments, we expect some customers to move balances from demand deposits to interest-bearing accounts such as money market, savings, or certificates of deposit. The models are particularly sensitive to the assumption about the rate of such migration.
In addition, we assume certain correlation rates, often referred to as a “deposit beta,” of interest-bearing deposits, wherein the rates paid to customers change at a different pace when compared with changes in average benchmark interest rates. Generally, certificates of deposit are assumed to have a high correlation rate, while interest-on-checking accounts are assumed to have a lower correlation rate. Actual results may differ materially due to factors including the shape of the yield curve, competitive pricing, money supply, our credit worthiness, and so forth; however, we use our historical experience as well as industry data to inform our assumptions.
We used the following deposit behavioral assumptions in our interest risk assessment for the period presented.
DEPOSIT ASSUMPTIONS
| September 30, 2021 | ||||||||||||||
| Product | Effective duration (unchanged) |
Effective duration
(+200 bps) |
||||||||||||
| Demand deposits | 3.5 | % | 2.9 | % | ||||||||||
| Money market | 2.1 | % | 1.8 | % | ||||||||||
| Savings and interest-on-checking | 2.6 | % | 2.4 | % | ||||||||||
For the periods presented and incorporating the assumptions previously described, the following schedule shows EaR, or percentage change in net interest income, based on a static balance sheet size, in the first year after the interest rate change if interest rates were to sustain immediate parallel changes ranging from -100 bps to +300 bps.
28
INCOME SIMULATION – CHANGE IN NET INTEREST INCOME
| September 30, 2021 | December 31, 2020 | |||||||||||||||||||||||||||||||||||||||||||||||||||||||||||||
|
Parallel shift in rates (in bps)
1
|
Parallel shift in rates (in bps)
1
|
|||||||||||||||||||||||||||||||||||||||||||||||||||||||||||||
| Repricing scenario | -100 | 0 | +100 | +200 | +300 | -100 | 0 | +100 | +200 | +300 | ||||||||||||||||||||||||||||||||||||||||||||||||||||
|
Earnings at Risk
(EaR)
|
(5.8) | % | — | % | 12.4 | % | 25.1 | % | 37.1 | % | (2.9) | % | — | % | 9.2 | % | 18.0 | % | 26.4 | % | ||||||||||||||||||||||||||||||||||||||||||
1
Assumes rates cannot go below zero in the negative rate shift.
For non-maturity interest-bearing deposits, the weighted average modeled beta is 26%. If the weighted average deposit beta were to increase 11%, the EaR in the +100 bps rate shock would change from 12.4% to 10.4%. The asset sensitivity, as measured by EaR, increased primarily due to faster prepayment assumptions on mortgage loans and securities.
The EaR analysis focuses on parallel rate ramps across the term structure of rates. The yield curve typically does not move in a parallel manner. If we consider a steepener rate ramp where the short-term rate declines to zero but the ten-year rate moves to +200 bps, the increase in EaR is 59% less over 24 months compared with the parallel +200 bps rate ramp.
CHANGES IN ECONOMIC VALUE OF EQUITY
For the periods presented, the following schedule shows our estimated percentage change in EVE under parallel interest rate changes ranging from -100 bps to +300 bps.
| September 30, 2021 | December 31, 2020 | |||||||||||||||||||||||||||||||||||||||||||||||||||||||||||||
|
Parallel shift in rates (in bps)
1
|
Parallel shift in rates (in bps)
1
|
|||||||||||||||||||||||||||||||||||||||||||||||||||||||||||||
| Repricing scenario | -100 | 0 | +100 | +200 | +300 | -100 | 0 | +100 | +200 | +300 | ||||||||||||||||||||||||||||||||||||||||||||||||||||
|
Economic Value of Equity
(EVE)
|
14.8 | % | — | % | 5.1 | % | 8.4 | % | 11.3 | % | 13.0 | % | — | % | 12.0 | % | 14.4 | % | 16.1 | % | ||||||||||||||||||||||||||||||||||||||||||
1
Assumes rates cannot go below zero in the negative rate shift.
For non-maturity interest-bearing deposits, the weighted average modeled beta is 26%. If the weighted average deposit beta were to increase 11%, it would change the EVE in the +100 bps rate shock from 5.1% to 3.6%. In the -100 bps rate shock, the EVE would increase because we cap the value of our indeterminate deposits at their par value, or equivalently, we assume no premium would be required to dispose of these liabilities given that depositors could be repaid at par. Since our assets increase in value as rates fall and the majority of our liabilities are comprised of indeterminate-maturity deposits, EVE increases disproportionately.
The changes in EVE measures from December 31, 2020 are primarily driven by the behavior of the deposit models. For non-maturity deposits, the deposit premium (or discount below par value) is floored at zero in a low-rate environment.
Our focus on business banking also plays a significant role in determining the nature of our asset-liability management posture. At September 30, 2021, $21 billion of variable-rate commercial and CRE loan balances were scheduled to reprice in the next six months, and approximately 99% are tied to either the prime rate, LIBOR, or AMERIBOR. For these variable-rate loans, we have executed $3.1 billion of cash flow hedges by receiving fixed rates on interest rate swaps. Additionally, asset sensitivity is reduced due to $6 billion of variable-rate loans being priced at floored rates at September 30, 2021, which were above the “index plus spread” rate by an average of 61 bps. At September 30, 2021, we also had $3 billion of variable-rate consumer loans scheduled to reprice in the next six months, and approximately $1 billion were priced at floored rates, which were above the “index plus spread” rate by an average of 32 bps.
See Notes 3 and 7 of the Notes to Consolidated Financial Statements for additional information regarding derivative instruments.
29
LIBOR Exposure
In July 2017, the Financial Conduct Authority (“FCA”), the authority regulating LIBOR, along with various other regulatory bodies, announced that LIBOR would likely be discontinued at the end of 2021. In November 2020, the FCA announced that many tenors of LIBOR would continue to be published through June 2023. During the third quarter of 2021, we originated more non-LIBOR referenced loans than LIBOR referenced loans, and we expect to discontinue new originations referencing LIBOR by the end of 2021. To facilitate the transition process, we have instituted an enterprise-wide program to identify, assess, and monitor risks associated with the expected discontinuance or unavailability of LIBOR, which includes active engagement with industry working groups and regulators. This program includes active involvement of senior management with regular engagement from the Enterprise Risk Management Committee, and seeks to minimize client and internal business operational impacts, while providing reporting transparency, consistency, and a central governance model that aligns with FASB, IRS, and other regulatory guidance.
We have focused on operational readiness, instituting processes and systems to ensure that contract risk is sufficiently mitigated. New originations, and any modifications or renewals of LIBOR-based contracts, contain fallback language to assist the orderly transition to an alternative reference rate. For our contracts that reference LIBOR and have a duration beyond December 31, 2021, all fallback provisions and variations have been identified and classified based upon those provisions. During 2022, clients will be prompted to either voluntarily modify their contracts and migrate to a reference rate other than LIBOR no later than June 2023, or be subject to the fallback provisions in their contracts. Voluntary modifications are expected to qualify for the available Tax Safe-Harbor provisions as allowed by IRS guidance.
We have a significant number of assets and liabilities that reference LIBOR. At September 30, 2021, we had approximately $36 billion of loans (mainly commercial loans), unfunded lending commitments, and securities referencing LIBOR. The amount of borrowed funds referencing LIBOR at September 30, 2021 was less than $1 billion. These amounts exclude derivative assets and liabilities on our consolidated balance sheet. At September 30, 2021, the notional amount of our LIBOR-referenced interest rate derivative contracts was more than $17 billion, of which more than $12 billion related to contracts with central counterparty clearinghouses.
In April 2021, we announced our intent to adopt AMERIBOR as our preferred replacement index for LIBOR. AMERIBOR is an index created by the American Financial Exchange. It represents the volume-weighted actual borrowing costs of thousands of banks across the United States and is compliant with International Organization of Securities Commissions (“IOSCO”) standards. We are using AMERIBOR already in many of our new lending contracts. Amending certain outstanding contracts indexed to LIBOR may require consent from the counterparties, which could be difficult and costly to obtain. Each of the LIBOR-referenced amounts discussed above will vary in future periods as current contracts expire with potential replacement contracts using AMERIBOR or an alternative reference rate. While AMERIBOR will be our preferred index for lending agreements, we are positioned to accommodate several alternative reference rates and anticipate that a variety of indices, including the Secured Overnight Financing Rate (“SOFR”) and the Bloomberg Short-Term Bank Yield Index (“BSBY”), may be used by other lenders. For more information on the transition from LIBOR, see Risk Factors in our 2020 Form 10-K.
Market Risk – Fixed Income
We underwrite municipal and corporate securities. We also trade municipal, agency, and treasury securities. This underwriting and trading activity exposes us to a risk of loss arising from adverse changes in the prices of these fixed-income securities.
At September 30, 2021, we had $305 million of trading assets and $32 million of securities sold, not yet purchased, compared with $266 million and $61 million at December 31, 2020, respectively.
30
We are exposed to market risk through changes in fair value. This includes market risk for interest rate swaps used to hedge interest rate risk. Changes in the fair value of AFS securities and in interest rate swaps that qualify as cash flow hedges are included in accumulated other comprehensive income (“AOCI”) for each financial reporting period. During the third quarter of 2021, the after-tax change in AOCI attributable to AFS securities decreased by $95 million, due largely to changes in the interest rate environment, compared with a $13 million decrease in the same prior year period.
Market Risk – Equity Investments
We hold both direct and indirect investments in predominantly pre-public companies, primarily through various SBIC venture capital funds. Our equity exposure to these investments was $190 million and $135 million at September 30, 2021 and December 31, 2020, respectively. On occasion, some of the companies within our SBIC investments may issue an IPO. In this case, the fund is generally subject to a lock-up period before liquidating the investment, which can introduce additional market risk. During the second quarter of 2021, one of our SBIC investments, Recursion Pharmaceuticals, Inc., completed an IPO. This investment will continue to be marked-to-market until the SBIC fund manager divests of the shares, which are subject to a minimum 180-day lock-up period from the initial offering. See Note 3 of the Notes to Consolidated Financial Statements for additional information regarding the valuation of our SBIC investments.
Liquidity Risk Management
Overview
Liquidity refers to our capacity to meet our cash and collateral obligations and to manage both expected and unexpected cash flows without adversely impacting our operations or financial strength. Sources of liquidity include deposits, borrowings, equity, and unencumbered assets, such as marketable loans and investment securities. For a more comprehensive discussion of our liquidity risk management, see “Liquidity Risk Management” in our 2020 Form 10-K.
Strong deposit growth over the past several quarters has contributed to the increase in our overall liquidity position. At September 30, 2021, our investment securities portfolio of $21.2 billion and cash and money market investments of $11.9 billion, collectively comprised 38% of total assets, compared with $16.6 billion of investment securities, and $7.4 billion of cash and money market investments, collectively comprising 29% of total assets at December 31, 2020.
Liquidity Management Actions
During the third quarter of 2021, the primary sources of cash were from increases in deposits and net cash provided by operating activities. Uses of cash during the same period included primarily (1) an increase in investment securities, (2) repurchases of our common stock, (3) a decrease in long-term debt and other short-term borrowings, and (4) dividends on common and preferred stock. Cash payments for interest, reflected in operating expenses, were $61 million and $164 million for the first nine months of 2021 and 2020, respectively.
Total deposits were $77.9 billion at September 30, 2021, compared with $69.7 billion at December 31, 2020. The growth in deposits was primarily due to a $6.7 billion increase in noninterest-bearing demand deposits and $2.5 billion increase in savings and money market deposits. The funding of PPP loan proceeds into customer deposit accounts contributed meaningfully to overall deposit growth. Our core deposits, consisting of noninterest-bearing demand deposits, savings and money market deposits, and time deposits under $250,000, were $77.0 billion at September 30, 2021, compared with $68.2 billion at December 31, 2020. Our loan to total deposit ratio was 65% at September 30, 2021, compared with 77% at December 31, 2020, reflecting higher deposit growth relative to loan growth.
31
Our credit ratings are presented in the following schedule:
| CREDIT RATINGS | ||||||||||||||||||||||||||
| as of October 31, 2021: | ||||||||||||||||||||||||||
| Rating agency | Outlook |
Long-term issuer/senior
debt rating |
Subordinated debt rating | Short-term debt rating | ||||||||||||||||||||||
| Kroll | Stable | A- | BBB+ | K2 | ||||||||||||||||||||||
| S&P | Stable | BBB+ | BBB | NR | ||||||||||||||||||||||
| Fitch | Stable | BBB+ | BBB | F1 | ||||||||||||||||||||||
| Moody's | Stable | Baa2 | NR | NR | ||||||||||||||||||||||
The Federal Home Loan Bank (“FHLB”) system and Federal Reserve Banks have been, and continue to be, a significant source of back-up liquidity and funding. We are a member of the FHLB of Des Moines, which allows member banks to borrow against their eligible loans and securities to satisfy liquidity and funding requirements. We are required to invest in FHLB and Federal Reserve stock to maintain our borrowing capacity. At September 30, 2021, our total investment in FHLB and Federal Reserve stock was $11 million and $90 million, respectively, compared with $11 million and $98 million at December 31, 2020.
The amount available for additional FHLB and Federal Reserve borrowings was $19.1 billion at September 30, 2021, compared with $17.1 billion at December 31, 2020, primarily due to the pledging of PPP loans to the FHLB during the current quarter. Loans with a carrying value of approximately $27.5 billion at September 30, 2021 have been pledged at the FHLB and the Federal Reserve as collateral for potential borrowings, compared with $24.7 billion at December 31, 2020. At both September 30, 2021 and December 31, 2020, we had no FHLB or Federal Reserve borrowings outstanding.
We manage our short-term funding needs through secured borrowing with securities pledged as collateral. Our AFS investment securities are primarily held as a source of contingent liquidity. During the third quarter of 2021, our AFS securities balances increased by $2.3 billion. We target securities that can be easily monetized and whose value remains relatively stable during market disruptions.
We may, at times, rely on more expensive wholesale funding sources to support loan growth when other lower cost sources of funding are not sufficient or readily available. Our use of borrowed funds (both short- and long-term) decreased by $1.3 billion during the first nine months of 2021, as deposit growth has exceeded loan demand. We used deposit funding to increase money market investments and investment securities, which increased $4.5 billion and $4.6 billion, respectively, from December 31, 2020.
We may also, from time to time, issue additional preferred stock, senior or subordinated notes, or other forms of capital or debt instruments, depending on our capital, funding, asset-liability management, or other needs as market conditions warrant and subject to any required regulatory approvals. We believe that the sources of available liquidity are adequate to meet all reasonably foreseeable short-term and intermediate-term demands.
Capital Management
Overview
A strong capital position is vital to continued profitability and to promoting depositor and investor confidence. We strive to consistently improve risk-adjusted returns on our shareholders’ capital by allocating capital to our highest return and growing businesses and through the prudent return of capital to shareholders by means of dividends and share repurchases. We entered the economic downturn in 2020 with a strong capital position and have improved our position during the last several quarters. Our common equity tier 1 capital increased to 10.9% at September 30, 2021, compared with 10.4% at September 30, 2020.
We continue to utilize stress testing as an important mechanism to inform our decisions on the appropriate level of capital, based upon actual and hypothetically stressed economic conditions, which are comparable in severity to the scenarios published by the FRB. The timing and amount of capital actions are subject to various factors, including
32
our financial performance, business needs, prevailing and anticipated economic conditions, and the results of our internal stress testing, as well as Board and OCC approval. Shares may be repurchased occasionally in the open market, through privately negotiated transactions. For a more comprehensive discussion of our capital risk management, see “Capital Management” in our 2020 Form 10-K.
SHAREHOLDERS' EQUITY
| (In millions, except share data) |
September 30,
2021 |
December 31,
2020 |
Amount change | Percent change | |||||||||||||||||||
| Shareholders’ equity: | |||||||||||||||||||||||
|
Preferred stock
|
$ | 440 | $ | 566 | $ | (126) | (22) | % | |||||||||||||||
|
Common stock and additional paid-in capital
|
2,245 | 2,686 | (441) | (16) | |||||||||||||||||||
|
Retained earnings
|
5,025 | 4,309 | 716 | 17 | |||||||||||||||||||
|
Accumulated other comprehensive income
|
64 | 325 | (261) | (80) | |||||||||||||||||||
| Total shareholders' equity | $ | 7,774 | $ | 7,886 | $ | (112) | (1) | % | |||||||||||||||
Total shareholders’ equity was $7.8 billion at September 30, 2021, compared with $7.9 billion at December 31, 2020. A $716 million increase in retained earnings was partially offset by decreases in common stock and additional paid-in capital, AOCI, and preferred stock. Common stock and additional paid-in capital decreased $441 million, primarily due to common stock repurchases. AOCI decreased $261 million, primarily from an increase in unrealized losses on AFS securities, which was driven largely by changes in the interest rate environment. Preferred stock decreased $126 million due to the redemption of the outstanding shares of our 5.75% Series H Non-Cumulative Perpetual Preferred Stock at par value during the second quarter of 2021.
Capital Management Actions
Weighted average diluted shares outstanding decreased 2.6 million from the second quarter of 2021, primarily due to common stock repurchases. During the third quarter of 2021, we repurchased 5.8 million common shares outstanding for $325 million, which is equivalent to 3.6% of common stock outstanding as of June 30, 2021. In October 2021, the Board approved a plan to repurchase up to $325 million of common shares outstanding during the fourth quarter of 2021.
To facilitate the repurchase of the common shares, we entered into an accelerated share repurchase (“ASR”) program in November 2021. Under the terms of the ASR program, we received an initial delivery of more than four million common shares. Subject to certain adjustments, the final number of shares will be repurchased by December 31, 2021 and will be based on the volume-weighted average share price of our common stock during the term of the program.
CAPITAL DISTRIBUTIONS
| (In millions, except share data) |
September 30,
2021 |
June 30,
2021 |
March 31,
2021 |
Year-to-date 2021
|
|||||||||||||||||||
| Capital distributions: | |||||||||||||||||||||||
| Preferred dividends paid | $ | 6 | $ | 9 | $ | 8 | $ | 23 | |||||||||||||||
| Bank preferred stock redeemed | — | 126 | — | 126 | |||||||||||||||||||
| Total capital distributed to preferred shareholders | 6 | 135 | 8 | 149 | |||||||||||||||||||
| Common dividends paid | 62 | 56 | 56 | 174 | |||||||||||||||||||
| Bank common stock repurchased | 325 | 100 | 50 | 475 | |||||||||||||||||||
| Total capital distributed to common shareholders | 387 | 156 | 106 | 649 | |||||||||||||||||||
| Total capital distributed to preferred and common shareholders | $ | 393 | $ | 291 | $ | 114 | $ | 798 | |||||||||||||||
|
Weighted average diluted common shares outstanding (in thousands)
|
160,480 | 163,054 | 163,887 | ||||||||||||||||||||
| Common shares outstanding, at period end (in thousands) | 156,530 | 162,248 | 163,800 | ||||||||||||||||||||
33
Under the OCC’s “Earnings Limitation Rule,” our dividend payments are restricted to an amount equal to the sum of the total of (1) our net income for that year, and (2) retained earnings for the preceding two years, unless the OCC approves the declaration and payment of dividends in excess of such amount. At September 30, 2021, we had $1.6 billion of retained net profits available for distribution.
We paid common dividends of $62 million, or $0.38 per share, during the third quarter of 2021, an increase from $0.34 per share during the second quarter of 2021. In October 2021, the Board declared a regular quarterly dividend of $0.38 per common share, payable on November 18, 2021, to shareholders of record on November 10, 2021. We also paid dividends on preferred stock of $6 million during the third quarter of 2021. See Note 9 for additional information about our capital management actions.
CECL
We elected to phase-in the regulatory capital effects of the adoption of CECL, as allowed by federal bank agencies, and as described in Note 15 of the Notes to Consolidated Financial Statements of our 2020 Form 10-K. At September 30, 2021, the application of these provisions had no impact on our CET1, Tier 1 risk-based, Total risk-based capital, and Tier 1 leverage capital ratios.
Basel III
We are subject to Basel III capital requirements which define adequate levels of capital as measured by several regulatory capital ratios. At September 30, 2021, we met all capital adequacy requirements under the Basel III Capital Rules. Based on our internal stress testing and other assessments of capital adequacy, we believe we hold capital sufficiently in excess of internal and regulatory requirements for well-capitalized banks. Notably, recent deposit-driven balance sheet growth has made the regulatory Tier 1 leverage ratio more relevant in our capital adequacy assessments. The following schedule presents our capital and other performance ratios.
CAPITAL RATIOS
|
September 30,
2021 |
December 31,
2020 |
September 30,
2020 |
|||||||||||||||
|
Tangible common equity ratio
1
|
7.2 | % | 7.8 | % | 7.9 | % | |||||||||||
|
Tangible equity ratio
1
|
7.7 | 8.5 | 8.6 | ||||||||||||||
| Average equity to average assets (three months ended) | 9.0 | 9.7 | 9.8 | ||||||||||||||
|
Basel III risk-based capital ratios
2
:
|
|||||||||||||||||
| Common equity tier 1 capital | 10.9 | 10.8 | 10.4 | ||||||||||||||
| Tier 1 leverage | 7.6 | 8.3 | 8.3 | ||||||||||||||
| Tier 1 risk-based | 11.6 | 11.8 | 11.4 | ||||||||||||||
| Total risk-based | 13.6 | 14.1 | 13.7 | ||||||||||||||
| Return on average common equity (three months ended) | 12.3 | 15.3 | 9.4 | ||||||||||||||
|
Return on average tangible common equity (three months ended)
1
|
14.2 | 17.8 | 11.0 | ||||||||||||||
1
See “GAAP to Non-GAAP Reconciliations” on page 4 for more information regarding these ratios.
2
Based on the applicable phase-in periods.
Our Basel III regulatory tier 1 risk-based capital and total risk-based capital was $6.7 billion and $7.8 billion at September 30, 2021, compared with $6.6 billion and $7.9 billion, respectively, at December 31, 2020. See the “Supervision and Regulation” section of our 2020 Form 10-K and Note 15 of the Notes to Consolidated Financial Statements for more information about our compliance with the Basel III capital requirements.
34
ITEM 1. FINANCIAL STATEMENTS
(Unaudited)
CONSOLIDATED BALANCE SHEETS
| (In millions, shares in thousands) |
September 30,
2021 |
December 31,
2020 |
|||||||||
| (Unaudited) | |||||||||||
| ASSETS | |||||||||||
| Cash and due from banks | $ |
|
$ |
|
|||||||
| Money market investments: | |||||||||||
| Interest-bearing deposits |
|
|
|||||||||
| Federal funds sold and security resell agreements |
|
|
|||||||||
| Investment securities: | |||||||||||
|
Held-to-maturity, at amortized cost (included $
|
|
|
|||||||||
| Available-for-sale, at fair value |
|
|
|||||||||
| Trading account, at fair value |
|
|
|||||||||
| Total securities |
|
|
|||||||||
| Loans held for sale |
|
|
|||||||||
| Loans and leases, net of unearned income and fees |
|
|
|||||||||
| Less allowance for loan losses |
|
|
|||||||||
| Loans held for investment, net of allowance |
|
|
|||||||||
| Other noninterest-bearing investments |
|
|
|||||||||
| Premises, equipment and software, net |
|
|
|||||||||
| Goodwill and intangibles |
|
|
|||||||||
| Other real estate owned |
|
|
|||||||||
| Other assets |
|
|
|||||||||
| Total assets | $ |
|
$ |
|
|||||||
| LIABILITIES AND SHAREHOLDERS’ EQUITY | |||||||||||
| Deposits: | |||||||||||
| Noninterest-bearing demand | $ |
|
$ |
|
|||||||
| Interest-bearing: | |||||||||||
| Savings and money market |
|
|
|||||||||
| Time |
|
|
|||||||||
| Total deposits |
|
|
|||||||||
| Federal funds purchased and other short-term borrowings |
|
|
|||||||||
| Long-term debt |
|
|
|||||||||
| Reserve for unfunded lending commitments |
|
|
|||||||||
| Other liabilities |
|
|
|||||||||
| Total liabilities |
|
|
|||||||||
| Shareholders’ equity: | |||||||||||
|
Preferred stock, without par value; authorized
|
|
|
|||||||||
|
Common stock ($
|
|
|
|||||||||
| Retained earnings |
|
|
|||||||||
| Accumulated other comprehensive income (loss) |
|
|
|||||||||
| Total shareholders’ equity |
|
|
|||||||||
| Total liabilities and shareholders’ equity | $ |
|
$ |
|
|||||||
See accompanying notes to consolidated financial statements.
35
CONSOLIDATED STATEMENTS OF INCOME
| (Unaudited) |
Three Months Ended
September 30, |
Nine Months Ended
September 30, |
|||||||||||||||||||||
| (In millions, except shares and per share amounts) | 2021 | 2020 | 2021 | 2020 | |||||||||||||||||||
| Interest income: | |||||||||||||||||||||||
| Interest and fees on loans | $ |
|
$ |
|
$ |
|
$ |
|
|||||||||||||||
| Interest on money market investments |
|
|
|
|
|||||||||||||||||||
| Interest on securities |
|
|
|
|
|||||||||||||||||||
| Total interest income |
|
|
|
|
|||||||||||||||||||
| Interest expense: | |||||||||||||||||||||||
| Interest on deposits |
|
|
|
|
|||||||||||||||||||
| Interest on short- and long-term borrowings |
|
|
|
|
|||||||||||||||||||
| Total interest expense |
|
|
|
|
|||||||||||||||||||
| Net interest income |
|
|
|
|
|||||||||||||||||||
| Provision for credit losses: | |||||||||||||||||||||||
| Provision for loan losses |
(
|
|
(
|
|
|||||||||||||||||||
| Provision for unfunded lending commitments |
(
|
|
(
|
|
|||||||||||||||||||
| Total provision for credit losses |
(
|
|
(
|
|
|||||||||||||||||||
| Net interest income after provision for credit losses |
|
|
|
|
|||||||||||||||||||
| Noninterest income: | |||||||||||||||||||||||
| Commercial account fees |
|
|
|
|
|||||||||||||||||||
| Card fees |
|
|
|
|
|||||||||||||||||||
| Retail and business banking fees |
|
|
|
|
|||||||||||||||||||
| Loan-related fees and income |
|
|
|
|
|||||||||||||||||||
| Capital markets and foreign exchange fees |
|
|
|
|
|||||||||||||||||||
| Wealth management fees |
|
|
|
|
|||||||||||||||||||
| Other customer-related fees |
|
|
|
|
|||||||||||||||||||
| Customer-related fees |
|
|
|
|
|||||||||||||||||||
| Fair value and nonhedge derivative gain (loss) |
|
|
|
(
|
|||||||||||||||||||
| Dividends and other investment income |
|
|
|
|
|||||||||||||||||||
| Securities gains (losses), net |
(
|
|
|
(
|
|||||||||||||||||||
| Total noninterest income |
|
|
|
|
|||||||||||||||||||
| Noninterest expense: | |||||||||||||||||||||||
| Salaries and employee benefits |
|
|
|
|
|||||||||||||||||||
| Occupancy, net |
|
|
|
|
|||||||||||||||||||
| Furniture, equipment and software, net |
|
|
|
|
|||||||||||||||||||
| Other real estate expense, net |
|
|
|
|
|||||||||||||||||||
| Credit-related expense |
|
|
|
|
|||||||||||||||||||
| Professional and legal services |
|
|
|
|
|||||||||||||||||||
| Advertising |
|
|
|
|
|||||||||||||||||||
| FDIC premiums |
|
|
|
|
|||||||||||||||||||
| Other |
|
|
|
|
|||||||||||||||||||
| Total noninterest expense |
|
|
|
|
|||||||||||||||||||
| Income before income taxes |
|
|
|
|
|||||||||||||||||||
| Income taxes |
|
|
|
|
|||||||||||||||||||
| Net income |
|
|
|
|
|||||||||||||||||||
| Preferred stock dividends |
(
|
(
|
(
|
(
|
|||||||||||||||||||
| Net earnings applicable to common shareholders | $ |
|
$ |
|
$ |
|
$ |
|
|||||||||||||||
| Weighted average common shares outstanding during the period: | |||||||||||||||||||||||
| Basic shares (in thousands) |
|
|
|
|
|||||||||||||||||||
| Diluted shares (in thousands) |
|
|
|
|
|||||||||||||||||||
| Net earnings per common share: | |||||||||||||||||||||||
| Basic | $ |
|
$ |
|
$ |
|
$ |
|
|||||||||||||||
| Diluted |
|
|
|
|
|||||||||||||||||||
See accompanying notes to consolidated financial statements.
36
CONSOLIDATED STATEMENTS OF COMPREHENSIVE INCOME
(Unaudited)
|
Three Months Ended
September 30, |
Nine Months Ended
September 30, |
||||||||||||||||||||||
| (In millions) | 2021 | 2020 | 2021 | 2020 | |||||||||||||||||||
| Net income for the period | $ |
|
$ |
|
$ |
|
$ |
|
|||||||||||||||
| Other comprehensive income (loss), net of tax: | |||||||||||||||||||||||
| Net unrealized holding gains (losses) on investment securities |
(
|
(
|
(
|
|
|||||||||||||||||||
|
Net unrealized gains (losses) on other noninterest-bearing investments
|
|
|
|
(
|
|||||||||||||||||||
| Net unrealized holding gains (losses) on derivative instruments |
(
|
(
|
(
|
|
|||||||||||||||||||
|
Reclassification adjustment for increase in interest income recognized in earnings on derivative instruments
|
(
|
(
|
(
|
(
|
|||||||||||||||||||
|
Reclassification to earnings for termination of pension plan
|
|
|
|
|
|||||||||||||||||||
| Other comprehensive income (loss) |
(
|
(
|
(
|
|
|||||||||||||||||||
| Comprehensive income | $ |
|
$ |
|
$ |
|
$ |
|
|||||||||||||||
See accompanying notes to consolidated financial statements.
CONSOLIDATED STATEMENTS OF CHANGES IN SHAREHOLDERS’ EQUITY
(Unaudited)
|
(In millions, except shares
and per share amounts) |
Preferred
stock |
Common stock | Accumulated paid-in capital | Retained earnings |
Accumulated other
comprehensive income (loss) |
Total
shareholders’ equity |
|||||||||||||||||||||||||||||||||||||||||
|
Shares
(in thousands)
|
Amount | ||||||||||||||||||||||||||||||||||||||||||||||
| Balance at June 30, 2021 | $ |
|
|
$ |
|
$ |
|
$ |
|
$ |
|
$ |
|
||||||||||||||||||||||||||||||||||
| Net income for the period |
|
|
|||||||||||||||||||||||||||||||||||||||||||||
|
Other comprehensive loss, net of tax
|
(
|
(
|
|||||||||||||||||||||||||||||||||||||||||||||
|
Bank common stock repurchased
|
(
|
(
|
(
|
||||||||||||||||||||||||||||||||||||||||||||
|
Net activity under employee plans and related tax benefits
|
|
|
|
||||||||||||||||||||||||||||||||||||||||||||
| Dividends on preferred stock |
(
|
(
|
|||||||||||||||||||||||||||||||||||||||||||||
|
Dividends on common stock, $
|
(
|
(
|
|||||||||||||||||||||||||||||||||||||||||||||
| Balance at September 30, 2021 | $ |
|
|
$ |
|
$ |
|
$ |
|
$ |
|
$ |
|
||||||||||||||||||||||||||||||||||
| Balance at June 30, 2020 | $ |
|
|
$ |
|
$ |
|
$ |
|
$ |
|
$ |
|
||||||||||||||||||||||||||||||||||
| Net income for the period |
|
|
|||||||||||||||||||||||||||||||||||||||||||||
|
Other comprehensive loss, net of tax
|
(
|
(
|
|||||||||||||||||||||||||||||||||||||||||||||
|
Net activity under employee plans and related tax benefits
|
|
|
|
||||||||||||||||||||||||||||||||||||||||||||
| Dividends on preferred stock |
(
|
(
|
|||||||||||||||||||||||||||||||||||||||||||||
|
Dividends on common stock, $
|
(
|
(
|
|||||||||||||||||||||||||||||||||||||||||||||
| Change in deferred compensation |
|
|
|||||||||||||||||||||||||||||||||||||||||||||
| Balance at September 30, 2020 | $ |
|
|
$ |
|
$ |
|
$ |
|
$ |
|
$ |
|
||||||||||||||||||||||||||||||||||
|
(In millions, except shares
and per share amounts) |
Preferred
stock |
Common stock | Accumulated paid-in capital | Retained earnings |
Accumulated other
comprehensive income (loss) |
Total
shareholders’ equity |
|||||||||||||||||||||||||||||||||||||||||
|
Shares
(in thousands)
|
Amount | ||||||||||||||||||||||||||||||||||||||||||||||
| Balance at December 31, 2020 | $ |
|
|
$ |
|
$ |
|
$ |
|
$ |
|
$ |
|
||||||||||||||||||||||||||||||||||
| Net income for the period |
|
|
|||||||||||||||||||||||||||||||||||||||||||||
|
Other comprehensive loss, net of tax
|
(
|
(
|
|||||||||||||||||||||||||||||||||||||||||||||
| Preferred stock redemption |
(
|
|
(
|
(
|
|||||||||||||||||||||||||||||||||||||||||||
|
Bank common stock repurchased
|
(
|
(
|
(
|
||||||||||||||||||||||||||||||||||||||||||||
|
Net activity under employee plans and related tax benefits
|
|
|
|
||||||||||||||||||||||||||||||||||||||||||||
| Dividends on preferred stock |
(
|
(
|
|||||||||||||||||||||||||||||||||||||||||||||
|
Dividends on common stock, $
|
(
|
(
|
|||||||||||||||||||||||||||||||||||||||||||||
| Balance at September 30, 2021 | $ |
|
|
$ |
|
$ |
|
$ |
|
$ |
|
$ |
|
||||||||||||||||||||||||||||||||||
| Balance at December 31, 2019 | $ |
|
|
$ |
|
$ |
|
$ |
|
$ |
|
$ |
|
||||||||||||||||||||||||||||||||||
| Net income for the period |
|
|
|||||||||||||||||||||||||||||||||||||||||||||
|
Other comprehensive income, net of tax
|
|
|
|||||||||||||||||||||||||||||||||||||||||||||
|
Cumulative effect adjustment, adoption of
, Credit Losses: Measurement of Credit Losses on Financial Instruments
|
|
|
|||||||||||||||||||||||||||||||||||||||||||||
|
Bank common stock repurchased
|
(
|
(
|
(
|
||||||||||||||||||||||||||||||||||||||||||||
|
Net shares issued from stock warrant exercises
|
|
||||||||||||||||||||||||||||||||||||||||||||||
|
Net activity under employee plans and related tax benefits
|
|
|
|
||||||||||||||||||||||||||||||||||||||||||||
| Dividends on preferred stock |
(
|
(
|
|||||||||||||||||||||||||||||||||||||||||||||
|
Dividends on common stock, $
|
(
|
(
|
|||||||||||||||||||||||||||||||||||||||||||||
| Balance at September 30, 2020 | $ |
|
|
$ |
|
$ |
|
$ |
|
$ |
|
$ |
|
||||||||||||||||||||||||||||||||||
See accompanying notes to consolidated financial statements.
37
CONSOLIDATED STATEMENTS OF CASH FLOWS
(Unaudited)
| (In millions) |
Nine Months Ended
September 30, |
||||||||||
| 2021 | 2020 | ||||||||||
| CASH FLOWS FROM OPERATING ACTIVITIES | |||||||||||
| Net income for the period | $ |
|
$ |
|
|||||||
|
Adjustments to reconcile net income to net cash provided by operating activities:
|
|||||||||||
|
Provision for credit losses
|
(
|
|
|||||||||
|
Depreciation and amortization
|
(
|
|
|||||||||
|
Share-based compensation
|
|
|
|||||||||
|
Deferred income tax expense (benefit)
|
|
(
|
|||||||||
|
Net decrease in trading securities
|
(
|
(
|
|||||||||
|
Net decrease (increase) in loans held for sale
|
|
(
|
|||||||||
|
Change in other liabilities
|
|
|
|||||||||
|
Change in other assets
|
(
|
(
|
|||||||||
|
Other, net
|
(
|
(
|
|||||||||
| Net cash provided by operating activities |
|
|
|||||||||
| CASH FLOWS FROM INVESTING ACTIVITIES | |||||||||||
| Net increase in money market investments |
(
|
(
|
|||||||||
| Proceeds from maturities and paydowns of investment securities held-to-maturity |
|
|
|||||||||
| Purchases of investment securities held-to-maturity |
(
|
(
|
|||||||||
| Proceeds from sales, maturities and paydowns of investment securities available-for-sale |
|
|
|||||||||
| Purchases of investment securities available-for-sale |
(
|
(
|
|||||||||
| Net change in loans and leases |
|
(
|
|||||||||
| Purchases and sales of other noninterest-bearing investments |
|
|
|||||||||
| Purchases of premises and equipment |
(
|
(
|
|||||||||
|
Other, net
|
|
|
|||||||||
| Net cash used in investing activities |
(
|
(
|
|||||||||
| CASH FLOWS FROM FINANCING ACTIVITIES | |||||||||||
| Net increase in deposits |
|
|
|||||||||
| Net change in short-term funds borrowed |
(
|
(
|
|||||||||
| Cash paid for preferred stock redemption |
(
|
|
|||||||||
| Redemption of long-term debt |
(
|
(
|
|||||||||
| Proceeds from the issuance of common stock |
|
|
|||||||||
| Dividends paid on common and preferred stock |
(
|
(
|
|||||||||
| Bank common stock repurchased |
(
|
(
|
|||||||||
| Other, net |
(
|
(
|
|||||||||
| Net cash provided by financing activities |
|
|
|||||||||
| Net increase (decrease) in cash and due from banks |
|
(
|
|||||||||
| Cash and due from banks at beginning of period |
|
|
|||||||||
| Cash and due from banks at end of period | $ |
|
$ |
|
|||||||
| Cash paid for interest | $ |
|
$ |
|
|||||||
| Net cash paid for income taxes |
|
|
|||||||||
|
Noncash activities are summarized as follows:
|
|||||||||||
| Loans held for investment transferred to other real estate owned |
|
|
|||||||||
| Loans held for investment reclassified to loans held for sale, net |
|
(
|
|||||||||
See accompanying notes to consolidated financial statements.
38
NOTES TO CONSOLIDATED FINANCIAL STATEMENTS
(Unaudited)
September 30, 2021
1.
BASIS OF PRESENTATION
The accompanying unaudited consolidated financial statements of Zions Bancorporation, National Association and its majority-owned subsidiaries (collectively “Zions Bancorporation, N.A.,” “the Bank,” “we,” “our,” “us”) have been prepared in accordance with United States (“U.S.”) generally accepted accounting principles (“GAAP”) for interim financial information and with the instructions to Form 10-Q and Article 10 of Regulation S-X. Accordingly, they do not include all of the information and footnotes required by GAAP for complete financial statements. In the opinion of management, all adjustments (consisting of normal recurring accruals) considered necessary for a fair presentation have been included. References to GAAP, including standards promulgated by the Financial Accounting Standards Board (“FASB”), are made according to sections of the Accounting Standards Codification (“ASC”).
Operating results for the nine months ended September 30, 2021 and 2020 are not necessarily indicative of the results that may be expected in future periods. In preparing the consolidated financial statements, we are required to make estimates and assumptions that affect the amounts reported in the financial statements and accompanying notes. Actual results could differ from those estimates. The consolidated balance sheet at December 31, 2020 is from the audited financial statements at that date, but does not include all the information and footnotes required by GAAP for complete financial statements. For further information, refer to the consolidated financial statements and accompanying footnotes included in our 2020 Form 10-K. Certain prior period amounts have been reclassified to conform with the current period presentation. These reclassifications did not affect net income or shareholders’ equity.
Zions Bancorporation, N.A. is a commercial bank headquartered in Salt Lake City, Utah. We provide a wide range of banking products and related services in
11
Western and Southwestern states through
seven
separately managed “affiliates,” or “affiliate banks,” each with its own local branding and management team, including Zions Bank, in Utah, Idaho and Wyoming; Amegy Bank (“Amegy”), in Texas; California Bank & Trust (“CB&T”); National Bank of Arizona (“NBAZ”); Nevada State Bank (“NSB”); Vectra Bank Colorado (“Vectra”), in Colorado and New Mexico; and The Commerce Bank of Washington (“TCBW”) which operates under that name in Washington and under the name The Commerce Bank of Oregon in Oregon.
2.
RECENT ACCOUNTING PRONOUNCEMENTS AND DEVELOPMENTS
39
3.
FAIR VALUE
Fair Value Measurements
Fair value is defined as the exchange price that would be received for an asset or paid to transfer a liability (an exit price) in the principal or most advantageous market for the asset or liability in an orderly transaction between market participants on the measurement date. For more information about our valuation methodologies for assets and liabilities measured at fair value and the fair value hierarchy, see Note 3 of our 2020 Form 10-K.
Quantitative Disclosure by Fair Value Hierarchy
Assets and liabilities measured at fair value by class on a recurring basis are summarized as follows:
| (In millions) | September 30, 2021 | ||||||||||||||||||||||
| Level 1 | Level 2 | Level 3 | Total | ||||||||||||||||||||
| ASSETS | |||||||||||||||||||||||
|
Available-for-sale securities:
|
|||||||||||||||||||||||
| U.S. Treasury, agencies and corporations | $ |
|
$ |
|
$ |
|
$ |
|
|||||||||||||||
| Municipal securities |
|
|
|||||||||||||||||||||
| Other debt securities |
|
|
|||||||||||||||||||||
| Total available-for-sale |
|
|
|
|
|||||||||||||||||||
| Trading account |
|
|
|
||||||||||||||||||||
| Other noninterest-bearing investments: | |||||||||||||||||||||||
| Bank-owned life insurance |
|
|
|||||||||||||||||||||
|
Private equity investments
1
|
|
|
|
||||||||||||||||||||
| Other assets: | |||||||||||||||||||||||
| Agriculture loan servicing and interest-only strips |
|
|
|||||||||||||||||||||
| Deferred compensation plan assets |
|
|
|||||||||||||||||||||
| Derivatives: | |||||||||||||||||||||||
| Derivatives designated as hedges |
|
|
|||||||||||||||||||||
| Derivatives not designated as hedges: | |||||||||||||||||||||||
| Interest rate |
|
|
|||||||||||||||||||||
| Foreign exchange |
|
|
|||||||||||||||||||||
| Total assets | $ |
|
$ |
|
$ |
|
$ |
|
|||||||||||||||
| LIABILITIES | |||||||||||||||||||||||
| Securities sold, not yet purchased | $ |
|
$ |
|
$ |
|
$ |
|
|||||||||||||||
| Other liabilities: | |||||||||||||||||||||||
| Derivatives: | |||||||||||||||||||||||
| Derivatives not designated as hedges: | |||||||||||||||||||||||
| Interest rate |
|
|
|||||||||||||||||||||
| Foreign exchange |
|
|
|||||||||||||||||||||
| Total liabilities | $ |
|
$ |
|
$ |
|
$ |
|
|||||||||||||||
1
The Level 1 private equity investments relate to the portion of our SBIC investments that are now publicly traded.
40
| (In millions) | December 31, 2020 | ||||||||||||||||||||||
| Level 1 | Level 2 | Level 3 | Total | ||||||||||||||||||||
| ASSETS | |||||||||||||||||||||||
|
Available-for-sale securities:
|
|||||||||||||||||||||||
| U.S. Treasury, agencies and corporations | $ |
|
$ |
|
$ |
|
$ |
|
|||||||||||||||
| Municipal securities |
|
|
|||||||||||||||||||||
| Other debt securities |
|
|
|||||||||||||||||||||
| Total available-for-sale |
|
|
|
|
|||||||||||||||||||
| Trading account |
|
|
|
||||||||||||||||||||
| Other noninterest-bearing investments: | |||||||||||||||||||||||
| Bank-owned life insurance |
|
|
|||||||||||||||||||||
| Private equity investments |
|
|
|||||||||||||||||||||
| Other assets: | |||||||||||||||||||||||
| Agriculture loan servicing and interest-only strips |
|
|
|||||||||||||||||||||
| Deferred compensation plan assets |
|
|
|||||||||||||||||||||
| Derivatives: | |||||||||||||||||||||||
| Derivatives designated as hedges |
|
|
|||||||||||||||||||||
| Derivatives not designated as hedges: | |||||||||||||||||||||||
| Interest rate |
|
|
|||||||||||||||||||||
| Foreign exchange |
|
|
|||||||||||||||||||||
| Total assets | $ |
|
$ |
|
$ |
|
$ |
|
|||||||||||||||
| LIABILITIES | |||||||||||||||||||||||
| Securities sold, not yet purchased | $ |
|
$ |
|
$ |
|
$ |
|
|||||||||||||||
| Other liabilities: | |||||||||||||||||||||||
| Derivatives: | |||||||||||||||||||||||
| Derivatives not designated as hedges: | |||||||||||||||||||||||
| Interest rate |
|
|
|||||||||||||||||||||
| Foreign exchange |
|
|
|||||||||||||||||||||
| Total liabilities | $ |
|
$ |
|
$ |
|
$ |
|
|||||||||||||||
Level 3 Valuations
Our Level 3 holdings include private equity investments (“PEIs”), agriculture loan servicing, and interest-only strips. For additional information regarding our Level 3 financial instruments, including the methods and significant assumptions used to estimate their fair value, see Note 3 of our 2020 Form 10-K.
41
Rollforward of Level 3 Fair Value Measurements
The following schedule presents the changes to the assets and liabilities measured at fair value by class on a recurring basis using Level 3 inputs:
| Level 3 Instruments | |||||||||||||||||||||||||||||||||||||||||||||||
| Three Months Ended | Nine Months Ended | ||||||||||||||||||||||||||||||||||||||||||||||
| September 30, 2021 | September 30, 2020 | September 30, 2021 | September 30, 2020 | ||||||||||||||||||||||||||||||||||||||||||||
| (In millions) | Private equity investments | Ag loan svcg and int-only strips | Private equity investments | Ag loan svcg and int-only strips | Private equity investments | Ag loan svcg and int-only strips | Private equity investments | Ag loan svcg and int-only strips | |||||||||||||||||||||||||||||||||||||||
|
Balance at beginning of period
|
$ |
|
$ |
|
$ |
|
$ |
|
$ |
|
$ |
|
$ |
|
$ |
|
|||||||||||||||||||||||||||||||
| Unrealized securities gains (losses), net |
|
|
|
|
|
|
(
|
|
|||||||||||||||||||||||||||||||||||||||
| Other noninterest income (expense) |
|
(
|
|
|
|
(
|
|
(
|
|||||||||||||||||||||||||||||||||||||||
| Purchases |
|
|
|
|
|
|
|
|
|||||||||||||||||||||||||||||||||||||||
| Cost of investments sold |
(
|
|
|
|
(
|
|
(
|
|
|||||||||||||||||||||||||||||||||||||||
|
Transfers out
1
|
(
|
|
|
|
(
|
|
|
|
|||||||||||||||||||||||||||||||||||||||
|
Balance at end of period
|
$ |
|
$ |
|
$ |
|
$ |
|
$ |
|
$ |
|
$ |
|
$ |
|
|||||||||||||||||||||||||||||||
1
Represents the transfer of the SBIC investments that are now publicly traded out of Level 3 and into Level 1.
The rollforward of Level 3 fair value measurements includes the following realized gains and losses in the income statement:
| (In millions) | Three Months Ended | Nine Months Ended | |||||||||||||||||||||
| September 30, 2021 | September 30, 2020 | September 30, 2021 | September 30, 2020 | ||||||||||||||||||||
| Securities gains (losses), net | $ |
(
|
$ |
|
$ |
(
|
$ |
|
|||||||||||||||
Nonrecurring Fair Value Measurements
| (In millions) | Fair value at September 30, 2021 | Fair value at December 31, 2020 | |||||||||||||||||||||||||||||||||||||||||||||
| Level 1 | Level 2 | Level 3 | Total | Level 1 | Level 2 | Level 3 | Total | ||||||||||||||||||||||||||||||||||||||||
| Private equity investments | $ |
|
$ |
|
$ |
|
$ |
|
$ |
|
$ |
|
$ |
|
$ |
|
|||||||||||||||||||||||||||||||
| Collateral-dependent loans |
|
|
|
|
|
|
|
|
|||||||||||||||||||||||||||||||||||||||
| Other real estate owned (OREO) |
|
|
|
|
|
|
|
|
|||||||||||||||||||||||||||||||||||||||
| Total | $ |
|
$ |
|
$ |
|
$ |
|
$ |
|
$ |
|
$ |
|
$ |
|
|||||||||||||||||||||||||||||||
The fair values presented above may not be current as of the periods presented, but rather as of the date the fair value change occurred, such as a charge for impairment. Accordingly, carrying values may not equal current fair value.
PEIs carried at cost were $
18
million at September 30, 2021 and $
8
million at December 31, 2020. Other noninterest-bearing investments carried at cost were $
102
million at September 30, 2021 and $
109
million at December 31, 2020, which were comprised of Federal Reserve and FHLB stock. PEIs accounted for using the equity method were $
74
million at September 30, 2021 and $
61
million at December 31, 2020.
Collateral-dependent loans were measured at the lower of amortized cost or the fair value of the collateral. Other real estate owned (“OREO”) assets were measured initially at fair value based on collateral appraisals at the time of transfer and subsequently at the lower of cost or fair value. For additional information regarding the measurement of fair value for impaired loans, collateral-dependent loans, and OREO, see Note 3 of our 2020 Form 10-K.
42
Fair Value of Certain Financial Instruments
| September 30, 2021 | December 31, 2020 | ||||||||||||||||||||||||||||||||||
| (In millions) |
Carrying
value |
Estimated
fair value |
Level |
Carrying
value |
Estimated
fair value |
Level | |||||||||||||||||||||||||||||
| Financial assets: | |||||||||||||||||||||||||||||||||||
| HTM investment securities | $ |
|
$ |
|
2 | $ |
|
$ |
|
2 | |||||||||||||||||||||||||
|
Loans and leases (including loans held for sale), net of allowance
|
|
|
3 |
|
|
3 | |||||||||||||||||||||||||||||
| Financial liabilities: | |||||||||||||||||||||||||||||||||||
| Time deposits |
|
|
2 |
|
|
2 | |||||||||||||||||||||||||||||
| Long-term debt |
|
|
2 |
|
|
2 | |||||||||||||||||||||||||||||
This summary excludes financial assets and liabilities for which carrying value approximates fair value and financial instruments that are recorded at fair value on a recurring basis. For additional information regarding the financial instruments within the scope of this disclosure, and the methods and significant assumptions used to estimate their fair value, see Note 3 of our 2020 Form 10-K.
4.
OFFSETTING ASSETS AND LIABILITIES
Security repurchase and reverse repurchase (“resell”) agreements are offset, when applicable, in the balance sheet according to master netting agreements. Security repurchase agreements are included with “Federal funds purchased and other short-term borrowings.” Derivative instruments may be offset under their master netting agreements; however, for accounting purposes, we present these items on a gross basis in our balance sheet. See Note 7 for further information regarding derivative instruments.
| September 30, 2021 | ||||||||||||||||||||||||||||||||||||||
| Gross amounts not offset in the balance sheet | ||||||||||||||||||||||||||||||||||||||
| (In millions) | Gross amounts recognized | Gross amounts offset in the balance sheet | Net amounts presented in the balance sheet | Financial instruments | Cash collateral received/pledged | Net amount | ||||||||||||||||||||||||||||||||
| Assets: | ||||||||||||||||||||||||||||||||||||||
|
Federal funds sold and security resell agreements
|
$ |
|
$ |
|
$ |
|
$ |
|
$ |
|
$ |
|
||||||||||||||||||||||||||
| Derivatives (included in other assets) |
|
|
|
(
|
|
|
||||||||||||||||||||||||||||||||
| Total assets | $ |
|
$ |
|
$ |
|
$ |
(
|
$ |
|
$ |
|
||||||||||||||||||||||||||
| Liabilities: | ||||||||||||||||||||||||||||||||||||||
|
Federal funds purchased and other short-term borrowings
|
$ |
|
$ |
|
$ |
|
$ |
|
$ |
|
$ |
|
||||||||||||||||||||||||||
|
Derivatives (included in other liabilities)
|
|
|
|
(
|
(
|
|
||||||||||||||||||||||||||||||||
| Total liabilities | $ |
|
$ |
|
$ |
|
$ |
(
|
$ |
(
|
$ |
|
||||||||||||||||||||||||||
43
| December 31, 2020 | ||||||||||||||||||||||||||||||||||||||
| Gross amounts not offset in the balance sheet | ||||||||||||||||||||||||||||||||||||||
| (In millions) | Gross amounts recognized | Gross amounts offset in the balance sheet | Net amounts presented in the balance sheet | Financial instruments | Cash collateral received/pledged | Net amount | ||||||||||||||||||||||||||||||||
| Assets: | ||||||||||||||||||||||||||||||||||||||
|
Federal funds sold and security resell agreements
|
$ |
|
$ |
(
|
$ |
|
$ |
|
$ |
|
$ |
|
||||||||||||||||||||||||||
| Derivatives (included in other assets) |
|
|
|
(
|
(
|
|
||||||||||||||||||||||||||||||||
| Total assets | $ |
|
$ |
(
|
$ |
|
$ |
(
|
$ |
(
|
$ |
|
||||||||||||||||||||||||||
| Liabilities: | ||||||||||||||||||||||||||||||||||||||
|
Federal funds purchased and other short-term borrowings
|
$ |
|
$ |
(
|
$ |
|
$ |
|
$ |
|
$ |
|
||||||||||||||||||||||||||
|
Derivatives (included in other liabilities)
|
|
|
|
(
|
(
|
|
||||||||||||||||||||||||||||||||
| Total liabilities | $ |
|
$ |
(
|
$ |
|
$ |
(
|
$ |
(
|
$ |
|
||||||||||||||||||||||||||
5.
INVESTMENTS
Investment Securities
Investment securities are classified as held-to-maturity (“HTM”), AFS, or trading. HTM securities, which management has the intent and ability to hold until maturity, are carried at amortized cost. AFS securities are carried at fair value and changes in fair value (unrealized gains and losses) are reported as net increases or decreases to accumulated other comprehensive income (“AOCI”), net of related taxes. Trading securities are carried at fair value with gains and losses recognized in current period earnings. The carrying values of our securities do not include accrued interest receivables of $
57
million and $
54
million at September 30, 2021 and December 31, 2020, respectively. These receivables are presented in the Consolidated Balance Sheet within the “Other Assets” line item. See Note 5 of our 2020 Form 10-K for more information related to our accounting for investment securities. See also Note 3 of our 2020 Form 10-K for discussion on our process to estimate fair value for investment securities.
The following schedule summarizes the amortized cost and estimated fair values of our HTM and AFS securities:
| September 30, 2021 | |||||||||||||||||||||||
| (In millions) |
Amortized
cost |
Gross unrealized gains | Gross unrealized losses |
Estimated
fair value |
|||||||||||||||||||
| Held-to-maturity | |||||||||||||||||||||||
| Municipal securities | $ |
|
$ |
|
$ |
|
$ |
|
|||||||||||||||
| Available-for-sale | |||||||||||||||||||||||
| U.S. Treasury securities |
|
|
|
|
|||||||||||||||||||
| U.S. Government agencies and corporations: | |||||||||||||||||||||||
| Agency securities |
|
|
|
|
|||||||||||||||||||
| Agency guaranteed mortgage-backed securities |
|
|
|
|
|||||||||||||||||||
| Small Business Administration loan-backed securities |
|
|
|
|
|||||||||||||||||||
| Municipal securities |
|
|
|
|
|||||||||||||||||||
| Other debt securities |
|
|
|
|
|||||||||||||||||||
| Total available-for-sale |
|
|
|
|
|||||||||||||||||||
| Total HTM and AFS investment securities | $ |
|
$ |
|
$ |
|
$ |
|
|||||||||||||||
44
| December 31, 2020 | |||||||||||||||||||||||
| (In millions) |
Amortized
cost |
Gross unrealized gains | Gross unrealized losses |
Estimated
fair value |
|||||||||||||||||||
| Held-to-maturity | |||||||||||||||||||||||
| Municipal securities | $ |
|
$ |
|
$ |
|
$ |
|
|||||||||||||||
| Available-for-sale | |||||||||||||||||||||||
| U.S. Treasury securities |
|
|
|
|
|||||||||||||||||||
| U.S. Government agencies and corporations: | |||||||||||||||||||||||
| Agency securities |
|
|
|
|
|||||||||||||||||||
| Agency guaranteed mortgage-backed securities |
|
|
|
|
|||||||||||||||||||
| Small Business Administration loan-backed securities |
|
|
|
|
|||||||||||||||||||
| Municipal securities |
|
|
|
|
|||||||||||||||||||
| Other debt securities |
|
|
|
|
|||||||||||||||||||
| Total available-for-sale |
|
|
|
|
|||||||||||||||||||
| Total HTM and AFS investment securities | $ |
|
$ |
|
$ |
|
$ |
|
|||||||||||||||
Maturities
The following schedule shows the amortized cost and weighted average yields of investment debt securities by contractual maturity of principal payments at September 30, 2021. Actual principal payments may differ from contractual or expected principal payments because borrowers may have the right to call or prepay obligations with or without call or prepayment penalties.
| September 30, 2021 | |||||||||||||||||||||||||||||||||||||||||||||||||||||||||||
| Total debt investment securities | Due in one year or less | Due after one year through five years | Due after five years through ten years | Due after ten years | |||||||||||||||||||||||||||||||||||||||||||||||||||||||
| (Dollar amounts in millions) | Amortized cost | Average yield | Amortized cost | Average yield | Amortized cost | Average yield | Amortized cost | Average yield | Amortized cost | Average yield | |||||||||||||||||||||||||||||||||||||||||||||||||
| Held-to-maturity | |||||||||||||||||||||||||||||||||||||||||||||||||||||||||||
|
Municipal securities
1
|
$ |
|
|
% | $ |
|
|
% | $ |
|
|
% | $ |
|
|
% | $ |
|
|
% | |||||||||||||||||||||||||||||||||||||||
| Available-for-sale | |||||||||||||||||||||||||||||||||||||||||||||||||||||||||||
| U.S. Treasury securities |
|
|
|
|
|
|
|
|
|
|
|||||||||||||||||||||||||||||||||||||||||||||||||
| U.S. Government agencies and corporations: | |||||||||||||||||||||||||||||||||||||||||||||||||||||||||||
| Agency securities |
|
|
|
|
|
|
|
|
|
|
|||||||||||||||||||||||||||||||||||||||||||||||||
| Agency guaranteed mortgage-backed securities |
|
|
|
|
|
|
|
|
|
|
|||||||||||||||||||||||||||||||||||||||||||||||||
| Small Business Administration loan-backed securities |
|
|
|
|
|
|
|
|
|
|
|||||||||||||||||||||||||||||||||||||||||||||||||
|
Municipal securities
1
|
|
|
|
|
|
|
|
|
|
|
|||||||||||||||||||||||||||||||||||||||||||||||||
| Other debt securities |
|
|
|
|
|
|
|
|
|
|
|||||||||||||||||||||||||||||||||||||||||||||||||
|
Total available-for-sale securities
|
|
|
|
|
|
|
|
|
|
|
|||||||||||||||||||||||||||||||||||||||||||||||||
| Total HTM and AFS investment securities | $ |
|
|
% | $ |
|
|
% | $ |
|
|
% | $ |
|
|
% | $ |
|
|
% | |||||||||||||||||||||||||||||||||||||||
1
The yields on tax-exempt securities are calculated on a tax-equivalent basis.
45
The following schedule summarizes the amount of gross unrealized losses for debt securities and the estimated fair value by length of time the securities have been in an unrealized loss position:
| September 30, 2021 | |||||||||||||||||||||||||||||||||||
| Less than 12 months | 12 months or more | Total | |||||||||||||||||||||||||||||||||
| (In millions) |
Gross
unrealized losses |
Estimated
fair value |
Gross
unrealized losses |
Estimated
fair value |
Gross
unrealized losses |
Estimated
fair value |
|||||||||||||||||||||||||||||
| Held-to-maturity | |||||||||||||||||||||||||||||||||||
| Municipal securities | $ |
|
$ |
|
$ |
|
$ |
|
$ |
|
$ |
|
|||||||||||||||||||||||
| Available-for-sale | |||||||||||||||||||||||||||||||||||
| U.S. Treasury securities |
|
|
|
|
|
|
|||||||||||||||||||||||||||||
| U.S. Government agencies and corporations: | |||||||||||||||||||||||||||||||||||
| Agency securities |
|
|
|
|
|
|
|||||||||||||||||||||||||||||
| Agency guaranteed mortgage-backed securities |
|
|
|
|
|
|
|||||||||||||||||||||||||||||
| Small Business Administration loan-backed securities |
|
|
|
|
|
|
|||||||||||||||||||||||||||||
| Municipal securities |
|
|
|
|
|
|
|||||||||||||||||||||||||||||
| Other |
|
|
|
|
|
|
|||||||||||||||||||||||||||||
| Total available-for-sale |
|
|
|
|
|
|
|||||||||||||||||||||||||||||
| Total HTM and AFS investment securities | $ |
|
$ |
|
$ |
|
$ |
|
$ |
|
$ |
|
|||||||||||||||||||||||
| December 31, 2020 | |||||||||||||||||||||||||||||||||||
| Less than 12 months | 12 months or more | Total | |||||||||||||||||||||||||||||||||
| (In millions) |
Gross
unrealized losses |
Estimated
fair value |
Gross
unrealized losses |
Estimated
fair value |
Gross
unrealized losses |
Estimated
fair value |
|||||||||||||||||||||||||||||
| Held-to-maturity | |||||||||||||||||||||||||||||||||||
| Municipal securities | $ |
|
$ |
|
$ |
|
$ |
|
$ |
|
$ |
|
|||||||||||||||||||||||
| Available-for-sale | |||||||||||||||||||||||||||||||||||
| U.S. Treasury securities |
|
|
|
|
|
|
|||||||||||||||||||||||||||||
| U.S. Government agencies and corporations: | |||||||||||||||||||||||||||||||||||
| Agency securities |
|
|
|
|
|
|
|||||||||||||||||||||||||||||
| Agency guaranteed mortgage-backed securities |
|
|
|
|
|
|
|||||||||||||||||||||||||||||
| Small Business Administration loan-backed securities |
|
|
|
|
|
|
|||||||||||||||||||||||||||||
| Municipal securities |
|
|
|
|
|
|
|||||||||||||||||||||||||||||
| Other |
|
|
|
|
|
|
|||||||||||||||||||||||||||||
| Total available-for-sale |
|
|
|
|
|
|
|||||||||||||||||||||||||||||
| Total HTM and AFS investment securities | $ |
|
$ |
|
$ |
|
$ |
|
$ |
|
$ |
|
|||||||||||||||||||||||
Approximately
122
and
119
HTM and
1,241
and
549
AFS investment securities were in an unrealized loss position at September 30, 2021, and December 31, 2020, respectively.
Impairment
We review investment securities quarterly on an individual security basis for the presence of impairment. For additional information on our policy and impairment evaluation process for investment securities, see Note 5 of our 2020 Form 10-K.
AFS Impairment
We did not recognize any impairment on our AFS investment securities portfolio during the first nine months of 2021. Unrealized losses relate to changes in interest rates subsequent to purchase and are not attributable to credit. At September 30, 2021, we had not initiated any sales of AFS securities, nor did we have an intent to sell any identified securities with unrealized losses. We do not believe it is more likely than not that we would be required to sell such securities before recovery of their amortized cost basis.
46
HTM Impairment
For HTM securities, the ACL is estimated consistent with the approach described in Note 6 for loans carried at amortized cost. The ACL on HTM securities was less than $
1
million at September 30, 2021. No HTM securities were past due at September 30, 2021.
The amortized cost basis of HTM securities categorized by year of issuance and risk classification as monitored by management is summarized as follows:
| September 30, 2021 | |||||||||||||||||||||||||||||||||||||||||
| Amortized cost basis by year of issuance | |||||||||||||||||||||||||||||||||||||||||
| (In millions) |
2021
|
2020
|
2019
|
2018
|
2017
|
Prior | Total Securities | ||||||||||||||||||||||||||||||||||
| Held-to-maturity: | |||||||||||||||||||||||||||||||||||||||||
| Pass | $ |
|
$ |
|
$ |
|
$ |
|
$ |
|
$ |
|
$ |
|
|||||||||||||||||||||||||||
| Accruing substandard |
|
|
|
|
|
|
|
||||||||||||||||||||||||||||||||||
| Total held-to-maturity | $ |
|
$ |
|
$ |
|
$ |
|
$ |
|
$ |
|
$ |
|
|||||||||||||||||||||||||||
Securities Gains and Losses Recognized in Income
The following summarizes gains and losses recognized in income:
| Three Months Ended September 30, | Nine Months Ended September 30, | ||||||||||||||||||||||||||||||||||||||||||||||
| 2021 | 2020 | 2021 | 2020 | ||||||||||||||||||||||||||||||||||||||||||||
| (In millions) | Gross gains | Gross losses | Gross gains | Gross losses | Gross gains | Gross losses | Gross gains | Gross losses | |||||||||||||||||||||||||||||||||||||||
| Other noninterest-bearing investments | $ |
|
$ |
|
$ |
|
$ |
|
$ |
|
$ |
|
$ |
|
$ |
|
|||||||||||||||||||||||||||||||
|
Net gains (losses)
1
|
$ |
(
|
$ |
|
$ |
|
$ |
(
|
|||||||||||||||||||||||||||||||||||||||
1
Net gains (losses) were recognized in securities gains (losses) in the income statement.
Interest income by investment security type is as follows:
| Three Months Ended September 30, | |||||||||||||||||||||||||||||||||||
| 2021 | 2020 | ||||||||||||||||||||||||||||||||||
| (In millions) | Taxable | Nontaxable | Total | Taxable | Nontaxable | Total | |||||||||||||||||||||||||||||
| Investment securities: | |||||||||||||||||||||||||||||||||||
| Held-to-maturity | $ |
|
$ |
|
$ |
|
$ |
|
$ |
|
$ |
|
|||||||||||||||||||||||
| Available-for-sale |
|
|
|
|
|
|
|||||||||||||||||||||||||||||
| Trading |
|
|
|
|
|
|
|||||||||||||||||||||||||||||
| Total securities | $ |
|
$ |
|
$ |
|
$ |
|
$ |
|
$ |
|
|||||||||||||||||||||||
| Nine Months Ended September 30, | |||||||||||||||||||||||||||||||||||
| 2021 | 2020 | ||||||||||||||||||||||||||||||||||
| (In millions) | Taxable | Nontaxable | Total | Taxable | Nontaxable | Total | |||||||||||||||||||||||||||||
| Investment securities: | |||||||||||||||||||||||||||||||||||
| Held-to-maturity | $ |
|
$ |
|
$ |
|
$ |
|
$ |
|
$ |
|
|||||||||||||||||||||||
| Available-for-sale |
|
|
|
|
|
|
|||||||||||||||||||||||||||||
| Trading |
|
|
|
|
|
|
|||||||||||||||||||||||||||||
| Total | $ |
|
$ |
|
$ |
|
$ |
|
$ |
|
$ |
|
|||||||||||||||||||||||
Investment securities with a carrying value of approximately $
2.4
billion and $
2.3
billion at September 30, 2021 and
December 31, 2020, respectively, were pledged to secure public and trust deposits, advances, and for other purposes as required by law. Securities are also pledged as collateral for security repurchase agreements.
47
6.
LOANS, LEASES, AND ALLOWANCE FOR CREDIT LOSSES
Loans, Leases, and Loans Held for Sale
Loans and leases are summarized as follows according to major portfolio segment and specific loan class:
| (In millions) |
September 30,
2021 |
December 31,
2020 |
|||||||||
| Loans held for sale | $ |
|
$ |
|
|||||||
| Commercial: | |||||||||||
| Commercial and industrial | $ |
|
$ |
|
|||||||
| PPP |
|
|
|||||||||
| Leasing |
|
|
|||||||||
| Owner-occupied |
|
|
|||||||||
| Municipal |
|
|
|||||||||
| Total commercial |
|
|
|||||||||
| Commercial real estate: | |||||||||||
| Construction and land development |
|
|
|||||||||
| Term |
|
|
|||||||||
| Total commercial real estate |
|
|
|||||||||
| Consumer: | |||||||||||
| Home equity credit line |
|
|
|||||||||
| 1-4 family residential |
|
|
|||||||||
| Construction and other consumer real estate |
|
|
|||||||||
| Bankcard and other revolving plans |
|
|
|||||||||
| Other |
|
|
|||||||||
| Total consumer |
|
|
|||||||||
|
Total loans and leases
|
$ |
|
$ |
|
|||||||
Loans and leases are presented at their amortized cost basis, which includes net unamortized purchase premiums, discounts, and deferred loan fees and costs totaling $
117
million and $
149
million at September 30, 2021 and December 31, 2020, respectively. Amortized cost basis does not include accrued interest receivables of $
175
million and $
200
million at September 30, 2021 and December 31, 2020, respectively. These receivables are presented in the Consolidated Balance Sheet within the “Other Assets” line item.
Municipal loans generally include loans to state and local governments (“municipalities”) with the debt service being repaid from general funds or pledged revenues of the municipal entity, or to private commercial entities or 501(c)(3) not-for-profit entities utilizing a pass-through municipal entity to achieve favorable tax treatment.
Land acquisition and development loans included in the construction and land development loan portfolio were $
146
million at September 30, 2021 and $
156
million at December 31, 2020.
Loans with a carrying value of $
27.5
billion at September 30, 2021 and $
24.7
billion at December 31, 2020 have been pledged at the Federal Reserve and the FHLB of Des Moines as collateral for potential borrowings.
We sold loans totaling $
384
million and $
1.2
billion for the three and nine months ended September 30, 2021 and $
463
million and $
1.4
billion for the three and nine months ended September 30, 2020, respectively, that were classified as loans held for sale. The sold loans were derecognized from the balance sheet. Loans classified as loans held for sale primarily consist of conforming residential mortgages and the guaranteed portion of SBA loans that are primarily sold to U.S. government agencies or participated to third parties. They do not consist of loans from the SBA's Paycheck Protection Program. At times, we have continuing involvement in the sold loans in the form of servicing rights or guarantees. Amounts added to loans held for sale during these same periods were $
387
million and $
1.2
billion for the three and nine months ended September 30, 2021 and $
480
million and $
1.4
billion for the
48
three and nine months ended September 30, 2020,
respectively. See Note 5 for further information regarding guaranteed securities.
The principal balance of sold loans for which we retain servicing was approximately $
3.1
billion at September 30, 2021, and $
2.7
billion at December 31, 2020. The total income from loans sold, excluding servicing, was $
12
million and $
30
million for the three and nine months ended September 30, 2021, and $
18
million and $
44
million for the three and nine months ended September 30, 2020, respectively.
Allowance for Credit Losses
The allowance for credit losses (“ACL”), which consists of the allowance for loan and lease losses (“ALLL”) and the reserve for unfunded lending commitments (“RULC”), represents our estimate of current expected credit losses related to the loan and lease portfolio and unfunded lending commitments as of the balance sheet date. For additional information regarding our policies and methodologies used to estimate the ACL, see Note 6 of our 2020 Form 10-K.
The ACL for AFS and HTM debt securities is estimated separately from loans. For HTM securities, the ACL is estimated consistent with the approach for loans carried at amortized cost. See Note 5 for further discussion of our estimate of expected credit losses on AFS securities and disclosures related to AFS and HTM securities.
Changes in the ACL are summarized as follows:
| Three Months Ended September 30, 2021 | |||||||||||||||||||||||
| (In millions) | Commercial |
Commercial
real estate |
Consumer | Total | |||||||||||||||||||
| Allowance for loan losses | |||||||||||||||||||||||
| Balance at beginning of period | $ |
|
$ |
|
$ |
|
$ |
|
|||||||||||||||
| Provision for loan losses |
(
|
(
|
(
|
(
|
|||||||||||||||||||
| Gross loan and lease charge-offs |
|
|
|
|
|||||||||||||||||||
| Recoveries |
|
|
|
|
|||||||||||||||||||
| Net loan and lease charge-offs (recoveries) |
(
|
|
|
(
|
|||||||||||||||||||
| Balance at end of period | $ |
|
$ |
|
$ |
|
$ |
|
|||||||||||||||
| Reserve for unfunded lending commitments | |||||||||||||||||||||||
| Balance at beginning of period | $ |
|
$ |
|
$ |
|
$ |
|
|||||||||||||||
| Provision for unfunded lending commitments |
(
|
|
|
(
|
|||||||||||||||||||
| Balance at end of period | $ |
|
$ |
|
$ |
|
$ |
|
|||||||||||||||
| Total allowance for credit losses at end of period | |||||||||||||||||||||||
| Allowance for loan losses | $ |
|
$ |
|
$ |
|
$ |
|
|||||||||||||||
| Reserve for unfunded lending commitments |
|
|
|
|
|||||||||||||||||||
| Total allowance for credit losses | $ |
|
$ |
|
$ |
|
$ |
|
|||||||||||||||
49
| Nine Months Ended September 30, 2021 | |||||||||||||||||||||||
| (In millions) | Commercial |
Commercial
real estate |
Consumer | Total | |||||||||||||||||||
| Allowance for loan losses | |||||||||||||||||||||||
| Balance at beginning of period | $ |
|
$ |
|
$ |
|
$ |
|
|||||||||||||||
| Provision for loan losses |
(
|
(
|
(
|
(
|
|||||||||||||||||||
| Gross loan and lease charge-offs |
|
|
|
|
|||||||||||||||||||
| Recoveries |
|
|
|
|
|||||||||||||||||||
| Net loan and lease charge-offs (recoveries) |
|
|
|
|
|||||||||||||||||||
| Balance at end of period | $ |
|
$ |
|
$ |
|
$ |
|
|||||||||||||||
| Reserve for unfunded lending commitments | |||||||||||||||||||||||
| Balance at beginning of period | $ |
|
$ |
|
$ |
|
$ |
|
|||||||||||||||
| Provision for unfunded lending commitments |
(
|
(
|
|
(
|
|||||||||||||||||||
| Balance at end of period | $ |
|
$ |
|
$ |
|
$ |
|
|||||||||||||||
| Total allowance for credit losses at end of period | |||||||||||||||||||||||
| Allowance for loan losses | $ |
|
$ |
|
$ |
|
$ |
|
|||||||||||||||
| Reserve for unfunded lending commitments |
|
|
|
|
|||||||||||||||||||
| Total allowance for credit losses | $ |
|
$ |
|
$ |
|
$ |
|
|||||||||||||||
| Three Months Ended September 30, 2020 | |||||||||||||||||||||||
| (In millions) | Commercial | Commercial real estate | Consumer | Total | |||||||||||||||||||
| Allowance for loan losses | |||||||||||||||||||||||
| Balance at beginning of period | $ |
|
$ |
|
$ |
|
$ |
|
|||||||||||||||
| Provision for loan losses |
|
|
(
|
|
|||||||||||||||||||
| Gross loan and lease charge-offs |
|
|
|
|
|||||||||||||||||||
| Recoveries |
|
|
|
|
|||||||||||||||||||
| Net loan and lease charge-offs (recoveries) |
|
|
|
|
|||||||||||||||||||
| Balance at end of period | $ |
|
$ |
|
$ |
|
$ |
|
|||||||||||||||
| Reserve for unfunded lending commitments | |||||||||||||||||||||||
| Balance at beginning of period | $ |
|
$ |
|
$ |
|
$ |
|
|||||||||||||||
| Provision for unfunded lending commitments |
|
(
|
|
|
|||||||||||||||||||
| Balance at end of period | $ |
|
$ |
|
$ |
|
$ |
|
|||||||||||||||
| Total allowance for credit losses at end of period | |||||||||||||||||||||||
| Allowance for loan losses | $ |
|
$ |
|
$ |
|
$ |
|
|||||||||||||||
| Reserve for unfunded lending commitments |
|
|
|
|
|||||||||||||||||||
| Total allowance for credit losses | $ |
|
$ |
|
$ |
|
$ |
|
|||||||||||||||
50
| Nine Months Ended September 30, 2020 | |||||||||||||||||||||||
| (In millions) | Commercial |
Commercial
real estate |
Consumer | Total | |||||||||||||||||||
| Allowance for loan losses | |||||||||||||||||||||||
| Balance at beginning of period | $ |
|
$ |
|
$ |
|
$ |
|
|||||||||||||||
| Provision for loan losses |
|
|
|
|
|||||||||||||||||||
| Gross loan and lease charge-offs |
|
|
|
|
|||||||||||||||||||
| Recoveries |
|
|
|
|
|||||||||||||||||||
| Net loan and lease charge-offs (recoveries) |
|
|
|
|
|||||||||||||||||||
| Balance at end of period | $ |
|
$ |
|
$ |
|
$ |
|
|||||||||||||||
| Reserve for unfunded lending commitments | |||||||||||||||||||||||
| Balance at beginning of period | $ |
|
$ |
|
$ |
|
$ |
|
|||||||||||||||
| Provision for unfunded lending commitments |
|
|
|
|
|||||||||||||||||||
| Balance at end of period | $ |
|
$ |
|
$ |
|
$ |
|
|||||||||||||||
| Total allowance for credit losses at end of period | |||||||||||||||||||||||
| Allowance for loan losses | $ |
|
$ |
|
$ |
|
$ |
|
|||||||||||||||
| Reserve for unfunded lending commitments |
|
|
|
|
|||||||||||||||||||
| Total allowance for credit losses | $ |
|
$ |
|
$ |
|
$ |
|
|||||||||||||||
Nonaccrual Loans
Loans are generally placed on nonaccrual status when payment in full of principal and interest is not expected, or the loan is 90 days or more past due as to principal or interest, unless the loan is both well-secured and in the process of collection. Factors we consider in determining whether a loan is placed on nonaccrual include delinquency status, collateral-value, borrower or guarantor financial statement information, bankruptcy status, and other information which would indicate that the full and timely collection of interest and principal is uncertain.
A nonaccrual loan may be returned to accrual status when (1) all delinquent interest and principal become current in accordance with the terms of the loan agreement, (2) the loan, if secured, is well-secured, (3) the borrower has paid according to the contractual terms for a minimum of six months, and (4) an analysis of the borrower indicates a reasonable assurance of the borrower's ability and willingness to maintain payments.
| September 30, 2021 | |||||||||||||||||||||||
| Amortized cost basis | Total amortized cost basis | ||||||||||||||||||||||
| (In millions) | with no allowance | with allowance | Related allowance | ||||||||||||||||||||
| Commercial: | |||||||||||||||||||||||
| Commercial and industrial | $ |
|
$ |
|
$ |
|
$ |
|
|||||||||||||||
| Owner-occupied |
|
|
|
|
|||||||||||||||||||
| Total commercial |
|
|
|
|
|||||||||||||||||||
| Commercial real estate: | |||||||||||||||||||||||
| Term |
|
|
|
|
|||||||||||||||||||
| Total commercial real estate |
|
|
|
|
|||||||||||||||||||
| Consumer: | |||||||||||||||||||||||
| Home equity credit line |
|
|
|
|
|||||||||||||||||||
| 1-4 family residential |
|
|
|
|
|||||||||||||||||||
| Bankcard and other revolving plans |
|
|
|
|
|||||||||||||||||||
| Total consumer loans |
|
|
|
|
|||||||||||||||||||
| Total | $ |
|
$ |
|
$ |
|
$ |
|
|||||||||||||||
51
| December 31, 2020 | |||||||||||||||||||||||
| Amortized cost basis | Total amortized cost basis | ||||||||||||||||||||||
| (In millions) | with no allowance | with allowance | Related allowance | ||||||||||||||||||||
| Commercial: | |||||||||||||||||||||||
| Commercial and industrial | $ |
|
$ |
|
$ |
|
$ |
|
|||||||||||||||
| Owner-occupied |
|
|
|
|
|||||||||||||||||||
| Total commercial |
|
|
|
|
|||||||||||||||||||
| Commercial real estate: | |||||||||||||||||||||||
| Term |
|
|
|
|
|||||||||||||||||||
| Total commercial real estate |
|
|
|
|
|||||||||||||||||||
| Consumer: | |||||||||||||||||||||||
| Home equity credit line |
|
|
|
|
|||||||||||||||||||
| 1-4 family residential |
|
|
|
|
|||||||||||||||||||
| Bankcard and other revolving plans |
|
|
|
|
|||||||||||||||||||
| Total consumer loans |
|
|
|
|
|||||||||||||||||||
| Total | $ |
|
$ |
|
$ |
|
$ |
|
|||||||||||||||
For accruing loans, interest is accrued and interest payments are recognized into interest income according to the contractual loan agreement. For nonaccruing loans, the accrual of interest is discontinued, any uncollected or accrued interest is reversed or written-off from interest income in a timely manner (generally within one month), and any payments received on these loans are not recognized into interest income, but are applied as a reduction to the principal outstanding. For the three and nine months ended September 30, 2021 and 2020, there was
no
interest income recognized on a cash basis during the period the loans were on nonaccrual.
The amount of accrued interest receivables written-off by reversing interest income during the period is summarized by loan portfolio segment as follows:
|
Three Months Ended
September 30, |
Nine Months Ended
September 30, |
||||||||||||||||||||||
| (In millions) | 2021 | 2020 | 2021 | 2020 | |||||||||||||||||||
| Commercial | $ |
|
$ |
|
$ |
|
$ |
|
|||||||||||||||
| Commercial real estate |
|
|
|
|
|||||||||||||||||||
| Consumer |
|
|
|
|
|||||||||||||||||||
| Total | $ |
|
$ |
|
$ |
|
$ |
|
|||||||||||||||
Past Due Loans
Closed-end loans with payments scheduled monthly are reported as past due when the borrower is in arrears for two or more monthly payments. Similarly, open-end credits, such as bankcard and other revolving credit plans, are reported as past due when the minimum payment has not been made for two or more billing cycles. Other multi-payment obligations (i.e., quarterly, semi-annual, etc.), single payment, and demand notes, are reported as past due when either principal or interest is due and unpaid for a period of 30 days or more.
52
Past due loans (accruing and nonaccruing) are summarized as follows:
| September 30, 2021 | |||||||||||||||||||||||||||||||||||||||||
| (In millions) | Current |
30-89 days
past due |
90+ days
past due |
Total
past due |
Total
loans |
Accruing
loans 90+ days past due |
Nonaccrual
loans
that are
current
1
|
||||||||||||||||||||||||||||||||||
| Commercial: | |||||||||||||||||||||||||||||||||||||||||
| Commercial and industrial | $ |
|
$ |
|
$ |
|
$ |
|
$ |
|
$ |
|
$ |
|
|||||||||||||||||||||||||||
| PPP |
|
|
|
|
|
|
|
||||||||||||||||||||||||||||||||||
| Leasing |
|
|
|
|
|
|
|
||||||||||||||||||||||||||||||||||
| Owner-occupied |
|
|
|
|
|
|
|
||||||||||||||||||||||||||||||||||
| Municipal |
|
|
|
|
|
|
|
||||||||||||||||||||||||||||||||||
| Total commercial |
|
|
|
|
|
|
|
||||||||||||||||||||||||||||||||||
| Commercial real estate: | |||||||||||||||||||||||||||||||||||||||||
|
Construction and land development
|
|
|
|
|
|
|
|
||||||||||||||||||||||||||||||||||
| Term |
|
|
|
|
|
|
|
||||||||||||||||||||||||||||||||||
| Total commercial real estate |
|
|
|
|
|
|
|
||||||||||||||||||||||||||||||||||
| Consumer: | |||||||||||||||||||||||||||||||||||||||||
| Home equity credit line |
|
|
|
|
|
|
|
||||||||||||||||||||||||||||||||||
| 1-4 family residential |
|
|
|
|
|
|
|
||||||||||||||||||||||||||||||||||
|
Construction and other consumer real estate
|
|
|
|
|
|
|
|
||||||||||||||||||||||||||||||||||
|
Bankcard and other revolving plans
|
|
|
|
|
|
|
|
||||||||||||||||||||||||||||||||||
| Other |
|
|
|
|
|
|
|
||||||||||||||||||||||||||||||||||
| Total consumer loans |
|
|
|
|
|
|
|
||||||||||||||||||||||||||||||||||
| Total | $ |
|
$ |
|
$ |
|
$ |
|
$ |
|
$ |
|
$ |
|
|||||||||||||||||||||||||||
| December 31, 2020 | |||||||||||||||||||||||||||||||||||||||||
| (In millions) | Current |
30-89 days
past due |
90+ days
past due |
Total
past due |
Total
loans |
Accruing
loans 90+ days past due |
Nonaccrual
loans
that are
current
1
|
||||||||||||||||||||||||||||||||||
| Commercial: | |||||||||||||||||||||||||||||||||||||||||
| Commercial and industrial | $ |
|
$ |
|
$ |
|
$ |
|
$ |
|
$ |
|
$ |
|
|||||||||||||||||||||||||||
| PPP |
|
|
|
|
|
|
|
||||||||||||||||||||||||||||||||||
| Leasing |
|
|
|
|
|
|
|
||||||||||||||||||||||||||||||||||
| Owner-occupied |
|
|
|
|
|
|
|
||||||||||||||||||||||||||||||||||
| Municipal |
|
|
|
|
|
|
|
||||||||||||||||||||||||||||||||||
| Total commercial |
|
|
|
|
|
|
|
||||||||||||||||||||||||||||||||||
| Commercial real estate: | |||||||||||||||||||||||||||||||||||||||||
|
Construction and land development
|
|
|
|
|
|
|
|
||||||||||||||||||||||||||||||||||
| Term |
|
|
|
|
|
|
|
||||||||||||||||||||||||||||||||||
| Total commercial real estate |
|
|
|
|
|
|
|
||||||||||||||||||||||||||||||||||
| Consumer: | |||||||||||||||||||||||||||||||||||||||||
| Home equity credit line |
|
|
|
|
|
|
|
||||||||||||||||||||||||||||||||||
| 1-4 family residential |
|
|
|
|
|
|
|
||||||||||||||||||||||||||||||||||
|
Construction and other consumer real estate
|
|
|
|
|
|
|
|
||||||||||||||||||||||||||||||||||
|
Bankcard and other revolving plans
|
|
|
|
|
|
|
|
||||||||||||||||||||||||||||||||||
| Other |
|
|
|
|
|
|
|
||||||||||||||||||||||||||||||||||
| Total consumer loans |
|
|
|
|
|
|
|
||||||||||||||||||||||||||||||||||
| Total | $ |
|
$ |
|
$ |
|
$ |
|
$ |
|
$ |
|
$ |
|
|||||||||||||||||||||||||||
1
Represents nonaccrual loans that are not past due more than 30 days; however, full payment of principal and interest is still not expected.
53
Credit Quality Indicators
In addition to the nonaccrual and past due criteria, we also analyze loans using loan risk-grading systems, which vary based on the size and type of credit risk exposure. The internal risk grades we assign to loans are classified using the following definitions of Pass, Special Mention, Substandard, and Doubtful, which are consistent with published definitions of regulatory risk classifications.
•
Pass –
A Pass asset is higher-quality and does not fit any of the other categories described below. The likelihood of loss is considered low.
•
Special Mention –
A Special Mention asset has potential weaknesses that deserve management’s close attention. If left uncorrected, these potential weaknesses may result in deterioration of the repayment prospects for the asset or in our credit position at some future date.
•
Substandard –
A Substandard asset is inadequately protected by the current sound worth and paying capacity of the obligor or of the collateral pledged, if any. Assets so classified have well-defined weaknesses and are characterized by the distinct possibility that we may sustain some loss if deficiencies are not corrected.
•
Doubtful –
A Doubtful asset has all the weaknesses inherent in a Substandard asset with the added characteristics that the weaknesses make collection or liquidation in full highly questionable and improbable.
The balance of loans classified as Doubtful was less than $
1
million at September 30, 2021 and was $
4
million at December 31, 2020.
We generally assign internal risk grades to commercial and CRE loans with commitments greater than $
1
million based on financial and statistical models, individual credit analysis, and loan officer experience and judgment. For these larger loans, we assign one of multiple risk grades within the Pass classification or one of the risk classifications described previously. We review and confirm our internal risk grades quarterly, or as soon as we identify information that affects the credit risk of the loan.
For consumer loans and certain small commercial and CRE loans with commitments less than or equal to $
1
million, we generally assign internal risk grades similar to those described previously based on automated rules that depend on refreshed credit scores, payment performance, and other risk indicators. These are generally assigned either a Pass or Substandard grade and are reviewed as we identify information that might warrant a grade change.
| September 30, 2021 | |||||||||||||||||||||||||||||
| Term loans | Revolving loans amortized cost basis | Revolving loans converted to term loans amortized cost basis | |||||||||||||||||||||||||||
| Amortized cost basis by year of origination | |||||||||||||||||||||||||||||
| (In millions) |
2021
|
2020
|
2019
|
2018
|
2017
|
Prior |
Total
loans |
||||||||||||||||||||||
| Commercial: | |||||||||||||||||||||||||||||
| Commercial and industrial | |||||||||||||||||||||||||||||
| Pass | $ |
|
$ |
|
$ |
|
$ |
|
$ |
|
$ |
|
$ |
|
$ |
|
$ |
|
|||||||||||
| Special Mention |
|
|
|
|
|
|
|
|
|
||||||||||||||||||||
| Accruing Substandard |
|
|
|
|
|
|
|
|
|
||||||||||||||||||||
| Nonaccrual |
|
|
|
|
|
|
|
|
|
||||||||||||||||||||
| Total commercial and industrial |
|
|
|
|
|
|
|
|
|
||||||||||||||||||||
| PPP | |||||||||||||||||||||||||||||
| Pass |
|
|
|
|
|
|
|
|
|
||||||||||||||||||||
| Nonaccrual |
|
|
|
|
|
|
|
|
|
||||||||||||||||||||
| Total PPP |
|
|
|
|
|
|
|
|
|
||||||||||||||||||||
| Leasing | |||||||||||||||||||||||||||||
| Pass |
|
|
|
|
|
|
|
|
|
||||||||||||||||||||
| Special Mention |
|
|
|
|
|
|
|
|
|
||||||||||||||||||||
| Accruing Substandard |
|
|
|
|
|
|
|
|
|
||||||||||||||||||||
| Nonaccrual |
|
|
|
|
|
|
|
|
|
||||||||||||||||||||
| Total leasing |
|
|
|
|
|
|
|
|
|
||||||||||||||||||||
| Owner-occupied | |||||||||||||||||||||||||||||
| Pass |
|
|
|
|
|
|
|
|
|
||||||||||||||||||||
| Special Mention |
|
|
|
|
|
|
|
|
|
||||||||||||||||||||
| Accruing Substandard |
|
|
|
|
|
|
|
|
|
||||||||||||||||||||
| Nonaccrual |
|
|
|
|
|
|
|
|
|
||||||||||||||||||||
| Total owner-occupied |
|
|
|
|
|
|
|
|
|
||||||||||||||||||||
| Municipal | |||||||||||||||||||||||||||||
| Pass |
|
|
|
|
|
|
|
|
|
||||||||||||||||||||
| Special Mention |
|
|
|
|
|
|
|
|
|
||||||||||||||||||||
| Accruing Substandard |
|
|
|
|
|
|
|
|
|
||||||||||||||||||||
| Nonaccrual |
|
|
|
|
|
|
|
|
|
||||||||||||||||||||
| Total municipal |
|
|
|
|
|
|
|
|
|
||||||||||||||||||||
| Total commercial |
|
|
|
|
|
|
|
|
|
||||||||||||||||||||
| Commercial real estate: | |||||||||||||||||||||||||||||
| Construction and land development | |||||||||||||||||||||||||||||
| Pass |
|
|
|
|
|
|
|
|
|
||||||||||||||||||||
| Special Mention |
|
|
|
|
|
|
|
|
|
||||||||||||||||||||
| Accruing Substandard |
|
|
|
|
|
|
|
|
|
||||||||||||||||||||
| Nonaccrual |
|
|
|
|
|
|
|
|
|
||||||||||||||||||||
| Total construction and land development |
|
|
|
|
|
|
|
|
|
||||||||||||||||||||
| Term | |||||||||||||||||||||||||||||
| Pass |
|
|
|
|
|
|
|
|
|
||||||||||||||||||||
| Special Mention |
|
|
|
|
|
|
|
|
|
||||||||||||||||||||
| Accruing Substandard |
|
|
|
|
|
|
|
|
|
||||||||||||||||||||
| Nonaccrual |
|
|
|
|
|
|
|
|
|
||||||||||||||||||||
| Total term |
|
|
|
|
|
|
|
|
|
||||||||||||||||||||
| Total commercial real estate |
|
|
|
|
|
|
|
|
|
||||||||||||||||||||
54
| September 30, 2021 | |||||||||||||||||||||||||||||
| Term loans | Revolving loans amortized cost basis | Revolving loans converted to term loans amortized cost basis | |||||||||||||||||||||||||||
| Amortized cost basis by year of origination | |||||||||||||||||||||||||||||
| (In millions) |
2021
|
2020
|
2019
|
2018
|
2017
|
Prior |
Total
loans |
||||||||||||||||||||||
| Consumer: | |||||||||||||||||||||||||||||
| Home equity credit line | |||||||||||||||||||||||||||||
| Pass |
|
|
|
|
|
|
|
|
|
||||||||||||||||||||
| Special Mention |
|
|
|
|
|
|
|
|
|
||||||||||||||||||||
| Accruing Substandard |
|
|
|
|
|
|
|
|
|
||||||||||||||||||||
| Nonaccrual |
|
|
|
|
|
|
|
|
|
||||||||||||||||||||
| Total home equity credit line |
|
|
|
|
|
|
|
|
|
||||||||||||||||||||
| 1-4 family residential | |||||||||||||||||||||||||||||
| Pass |
|
|
|
|
|
|
|
|
|
||||||||||||||||||||
| Special Mention |
|
|
|
|
|
|
|
|
|
||||||||||||||||||||
| Accruing Substandard |
|
|
|
|
|
|
|
|
|
||||||||||||||||||||
| Nonaccrual |
|
|
|
|
|
|
|
|
|
||||||||||||||||||||
| Total 1-4 family residential |
|
|
|
|
|
|
|
|
|
||||||||||||||||||||
| Construction and other consumer real estate | |||||||||||||||||||||||||||||
| Pass |
|
|
|
|
|
|
|
|
|
||||||||||||||||||||
| Special Mention |
|
|
|
|
|
|
|
|
|
||||||||||||||||||||
| Accruing Substandard |
|
|
|
|
|
|
|
|
|
||||||||||||||||||||
| Nonaccrual |
|
|
|
|
|
|
|
|
|
||||||||||||||||||||
| Total construction and other consumer real estate |
|
|
|
|
|
|
|
|
|
||||||||||||||||||||
| Bankcard and other revolving plans | |||||||||||||||||||||||||||||
| Pass |
|
|
|
|
|
|
|
|
|
||||||||||||||||||||
| Special Mention |
|
|
|
|
|
|
|
|
|
||||||||||||||||||||
| Accruing Substandard |
|
|
|
|
|
|
|
|
|
||||||||||||||||||||
| Nonaccrual |
|
|
|
|
|
|
|
|
|
||||||||||||||||||||
| Total bankcard and other revolving plans |
|
|
|
|
|
|
|
|
|
||||||||||||||||||||
| Other consumer | |||||||||||||||||||||||||||||
| Pass |
|
|
|
|
|
|
|
|
|
||||||||||||||||||||
| Special Mention |
|
|
|
|
|
|
|
|
|
||||||||||||||||||||
| Accruing Substandard |
|
|
|
|
|
|
|
|
|
||||||||||||||||||||
| Nonaccrual |
|
|
|
|
|
|
|
|
|
||||||||||||||||||||
| Total other consumer |
|
|
|
|
|
|
|
|
|
||||||||||||||||||||
| Total consumer |
|
|
|
|
|
|
|
|
|
||||||||||||||||||||
| Total loans | $ |
|
$ |
|
$ |
|
$ |
|
$ |
|
$ |
|
$ |
|
$ |
|
$ |
|
|||||||||||
55
| December 31, 2020 | |||||||||||||||||||||||||||||
| Term loans | Revolving loans amortized cost basis | Revolving loans converted to term loans amortized cost basis | |||||||||||||||||||||||||||
| Amortized cost basis by year of origination | |||||||||||||||||||||||||||||
| (In millions) |
2020
|
2019
|
2018
|
2017
|
2016 | Prior |
Total
loans |
||||||||||||||||||||||
| Commercial: | |||||||||||||||||||||||||||||
| Commercial and industrial | |||||||||||||||||||||||||||||
| Pass | $ |
|
$ |
|
$ |
|
$ |
|
$ |
|
$ |
|
$ |
|
$ |
|
$ |
|
|||||||||||
| Special Mention |
|
|
|
|
|
|
|
|
|
||||||||||||||||||||
| Accruing Substandard |
|
|
|
|
|
|
|
|
|
||||||||||||||||||||
| Nonaccrual |
|
|
|
|
|
|
|
|
|
||||||||||||||||||||
| Total commercial and industrial |
|
|
|
|
|
|
|
|
|
||||||||||||||||||||
| PPP | |||||||||||||||||||||||||||||
| Pass |
|
|
|
|
|
|
|
|
|
||||||||||||||||||||
| Total PPP |
|
|
|
|
|
|
|
|
|
||||||||||||||||||||
| Leasing | |||||||||||||||||||||||||||||
| Pass |
|
|
|
|
|
|
|
|
|
||||||||||||||||||||
| Special Mention |
|
|
|
|
|
|
|
|
|
||||||||||||||||||||
| Accruing Substandard |
|
|
|
|
|
|
|
|
|
||||||||||||||||||||
| Nonaccrual |
|
|
|
|
|
|
|
|
|
||||||||||||||||||||
| Total leasing |
|
|
|
|
|
|
|
|
|
||||||||||||||||||||
| Owner-occupied | |||||||||||||||||||||||||||||
| Pass |
|
|
|
|
|
|
|
|
|
||||||||||||||||||||
| Special Mention |
|
|
|
|
|
|
|
|
|
||||||||||||||||||||
| Accruing Substandard |
|
|
|
|
|
|
|
|
|
||||||||||||||||||||
| Nonaccrual |
|
|
|
|
|
|
|
|
|
||||||||||||||||||||
| Total owner-occupied |
|
|
|
|
|
|
|
|
|
||||||||||||||||||||
| Municipal | |||||||||||||||||||||||||||||
| Pass |
|
|
|
|
|
|
|
|
|
||||||||||||||||||||
| Special Mention |
|
|
|
|
|
|
|
|
|
||||||||||||||||||||
| Accruing Substandard |
|
|
|
|
|
|
|
|
|
||||||||||||||||||||
| Nonaccrual |
|
|
|
|
|
|
|
|
|
||||||||||||||||||||
| Total municipal |
|
|
|
|
|
|
|
|
|
||||||||||||||||||||
| Total commercial |
|
|
|
|
|
|
|
|
|
||||||||||||||||||||
| Commercial real estate: | |||||||||||||||||||||||||||||
| Construction and land development | |||||||||||||||||||||||||||||
| Pass |
|
|
|
|
|
|
|
|
|
||||||||||||||||||||
| Special Mention |
|
|
|
|
|
|
|
|
|
||||||||||||||||||||
| Accruing Substandard |
|
|
|
|
|
|
|
|
|
||||||||||||||||||||
| Nonaccrual |
|
|
|
|
|
|
|
|
|
||||||||||||||||||||
| Total construction and land development |
|
|
|
|
|
|
|
|
|
||||||||||||||||||||
| Term | |||||||||||||||||||||||||||||
| Pass |
|
|
|
|
|
|
|
|
|
||||||||||||||||||||
| Special Mention |
|
|
|
|
|
|
|
|
|
||||||||||||||||||||
| Accruing Substandard |
|
|
|
|
|
|
|
|
|
||||||||||||||||||||
| Nonaccrual |
|
|
|
|
|
|
|
|
|
||||||||||||||||||||
| Total term |
|
|
|
|
|
|
|
|
|
||||||||||||||||||||
| Total commercial real estate |
|
|
|
|
|
|
|
|
|
||||||||||||||||||||
56
| December 31, 2020 | |||||||||||||||||||||||||||||
| Term loans | Revolving loans amortized cost basis | Revolving loans converted to term loans amortized cost basis | |||||||||||||||||||||||||||
| Amortized cost basis by year of origination | |||||||||||||||||||||||||||||
| (In millions) |
2020
|
2019
|
2018
|
2017
|
2016 | Prior |
Total
loans |
||||||||||||||||||||||
| Consumer: | |||||||||||||||||||||||||||||
| Home equity credit line | |||||||||||||||||||||||||||||
| Pass |
|
|
|
|
|
|
|
|
|
||||||||||||||||||||
| Special Mention |
|
|
|
|
|
|
|
|
|
||||||||||||||||||||
| Accruing Substandard |
|
|
|
|
|
|
|
|
|
||||||||||||||||||||
| Nonaccrual |
|
|
|
|
|
|
|
|
|
||||||||||||||||||||
| Total home equity credit line |
|
|
|
|
|
|
|
|
|
||||||||||||||||||||
| 1-4 family residential | |||||||||||||||||||||||||||||
| Pass |
|
|
|
|
|
|
|
|
|
||||||||||||||||||||
| Special Mention |
|
|
|
|
|
|
|
|
|
||||||||||||||||||||
| Accruing Substandard |
|
|
|
|
|
|
|
|
|
||||||||||||||||||||
| Nonaccrual |
|
|
|
|
|
|
|
|
|
||||||||||||||||||||
| Total 1-4 family residential |
|
|
|
|
|
|
|
|
|
||||||||||||||||||||
| Construction and other consumer real estate | |||||||||||||||||||||||||||||
| Pass |
|
|
|
|
|
|
|
|
|
||||||||||||||||||||
| Special Mention |
|
|
|
|
|
|
|
|
|
||||||||||||||||||||
| Accruing Substandard |
|
|
|
|
|
|
|
|
|
||||||||||||||||||||
| Nonaccrual |
|
|
|
|
|
|
|
|
|
||||||||||||||||||||
| Total construction and other consumer real estate |
|
|
|
|
|
|
|
|
|
||||||||||||||||||||
| Bankcard and other revolving plans | |||||||||||||||||||||||||||||
| Pass |
|
|
|
|
|
|
|
|
|
||||||||||||||||||||
| Special Mention |
|
|
|
|
|
|
|
|
|
||||||||||||||||||||
| Accruing Substandard |
|
|
|
|
|
|
|
|
|
||||||||||||||||||||
| Nonaccrual |
|
|
|
|
|
|
|
|
|
||||||||||||||||||||
| Total bankcard and other revolving plans |
|
|
|
|
|
|
|
|
|
||||||||||||||||||||
| Other consumer | |||||||||||||||||||||||||||||
| Pass |
|
|
|
|
|
|
|
|
|
||||||||||||||||||||
| Special Mention |
|
|
|
|
|
|
|
|
|
||||||||||||||||||||
| Accruing Substandard |
|
|
|
|
|
|
|
|
|
||||||||||||||||||||
| Nonaccrual |
|
|
|
|
|
|
|
|
|
||||||||||||||||||||
| Total other consumer |
|
|
|
|
|
|
|
|
|
||||||||||||||||||||
| Total consumer |
|
|
|
|
|
|
|
|
|
||||||||||||||||||||
| Total loans | $ |
|
$ |
|
$ |
|
$ |
|
$ |
|
$ |
|
$ |
|
$ |
|
$ |
|
|||||||||||
Modified and Restructured Loans
Loans may be modified in the normal course of business for competitive reasons or to strengthen our collateral position. Loan modifications and restructurings may also occur when the borrower experiences financial difficulty and needs temporary or permanent relief from the original contractual terms of the loan. Loans that have been modified to accommodate a borrower who is experiencing financial difficulties, and for which we have granted a concession that we would not otherwise consider, are considered troubled debt restructurings (“TDRs”). For further discussion of our policies and processes regarding TDRs, see Note 6 of our 2020 Form 10-K.
57
Information on TDRs, including the amortized cost on an accruing and nonaccruing basis by loan class and modification type is summarized in the following schedules:
| September 30, 2021 | |||||||||||||||||||||||||||||||||||||||||
| Amortized cost resulting from the following modification types: | |||||||||||||||||||||||||||||||||||||||||
| (In millions) |
Interest
rate below market |
Maturity
or term extension |
Principal
forgiveness |
Payment
deferral |
Other
1
|
Multiple
modification
types
2
|
Total | ||||||||||||||||||||||||||||||||||
| Accruing | |||||||||||||||||||||||||||||||||||||||||
| Commercial: | |||||||||||||||||||||||||||||||||||||||||
| Commercial and industrial | $ |
|
$ |
|
$ |
|
$ |
|
$ |
|
$ |
|
$ |
|
|||||||||||||||||||||||||||
| Owner-occupied |
|
|
|
|
|
|
|
||||||||||||||||||||||||||||||||||
| Total commercial |
|
|
|
|
|
|
|
||||||||||||||||||||||||||||||||||
| Commercial real estate: | |||||||||||||||||||||||||||||||||||||||||
| Construction and land development |
|
|
|
|
|
|
|
||||||||||||||||||||||||||||||||||
| Term |
|
|
|
|
|
|
|
||||||||||||||||||||||||||||||||||
| Total commercial real estate |
|
|
|
|
|
|
|
||||||||||||||||||||||||||||||||||
| Consumer: | |||||||||||||||||||||||||||||||||||||||||
| Home equity credit line |
|
|
|
|
|
|
|
||||||||||||||||||||||||||||||||||
| 1-4 family residential |
|
|
|
|
|
|
|
||||||||||||||||||||||||||||||||||
| Total consumer loans |
|
|
|
|
|
|
|
||||||||||||||||||||||||||||||||||
| Total accruing |
|
|
|
|
|
|
|
||||||||||||||||||||||||||||||||||
| Nonaccruing | |||||||||||||||||||||||||||||||||||||||||
| Commercial: | |||||||||||||||||||||||||||||||||||||||||
| Commercial and industrial |
|
|
|
|
|
|
|
||||||||||||||||||||||||||||||||||
| Owner-occupied |
|
|
|
|
|
|
|
||||||||||||||||||||||||||||||||||
| Total commercial |
|
|
|
|
|
|
|
||||||||||||||||||||||||||||||||||
| Commercial real estate: | |||||||||||||||||||||||||||||||||||||||||
| Term |
|
|
|
|
|
|
|
||||||||||||||||||||||||||||||||||
| Total commercial real estate |
|
|
|
|
|
|
|
||||||||||||||||||||||||||||||||||
| Consumer: | |||||||||||||||||||||||||||||||||||||||||
| Home equity credit line |
|
|
|
|
|
|
|
||||||||||||||||||||||||||||||||||
| 1-4 family residential |
|
|
|
|
|
|
|
||||||||||||||||||||||||||||||||||
| Total consumer loans |
|
|
|
|
|
|
|
||||||||||||||||||||||||||||||||||
| Total nonaccruing |
|
|
|
|
|
|
|
||||||||||||||||||||||||||||||||||
| Total | $ |
|
$ |
|
$ |
|
$ |
|
$ |
|
$ |
|
$ |
|
|||||||||||||||||||||||||||
1
Includes TDRs that resulted from other modification types including, but not limited to, a legal judgment awarded on different terms, a bankruptcy plan confirmed on different terms, a settlement that includes the delivery of collateral in exchange for debt reduction, etc.
2
Includes TDRs that resulted from a combination of any of the previous modification types.
| December 31, 2020 | |||||||||||||||||||||||||||||||||||||||||
| Amortized cost resulting from the following modification types: | |||||||||||||||||||||||||||||||||||||||||
| (In millions) |
Interest
rate below market |
Maturity
or term extension |
Principal
forgiveness |
Payment
deferral |
Other
1
|
Multiple
modification
types
2
|
Total | ||||||||||||||||||||||||||||||||||
| Accruing | |||||||||||||||||||||||||||||||||||||||||
| Commercial: | |||||||||||||||||||||||||||||||||||||||||
| Commercial and industrial | $ |
|
$ |
|
$ |
|
$ |
|
$ |
|
$ |
|
$ |
|
|||||||||||||||||||||||||||
| Owner-occupied |
|
|
|
|
|
|
|
||||||||||||||||||||||||||||||||||
| Total commercial |
|
|
|
|
|
|
|
||||||||||||||||||||||||||||||||||
| Commercial real estate: | |||||||||||||||||||||||||||||||||||||||||
| Term |
|
|
|
|
|
|
|
||||||||||||||||||||||||||||||||||
| Total commercial real estate |
|
|
|
|
|
|
|
||||||||||||||||||||||||||||||||||
| Consumer: | |||||||||||||||||||||||||||||||||||||||||
| Home equity credit line |
|
|
|
|
|
|
|
||||||||||||||||||||||||||||||||||
| 1-4 family residential |
|
|
|
|
|
|
|
||||||||||||||||||||||||||||||||||
| Total consumer loans |
|
|
|
|
|
|
|
||||||||||||||||||||||||||||||||||
| Total accruing |
|
|
|
|
|
|
|
||||||||||||||||||||||||||||||||||
| Nonaccruing | |||||||||||||||||||||||||||||||||||||||||
| Commercial: | |||||||||||||||||||||||||||||||||||||||||
| Commercial and industrial |
|
|
|
|
|
|
|
||||||||||||||||||||||||||||||||||
| Owner-occupied |
|
|
|
|
|
|
|
||||||||||||||||||||||||||||||||||
| Total commercial |
|
|
|
|
|
|
|
||||||||||||||||||||||||||||||||||
| Commercial real estate: | |||||||||||||||||||||||||||||||||||||||||
| Term |
|
|
|
|
|
|
|
||||||||||||||||||||||||||||||||||
| Total commercial real estate |
|
|
|
|
|
|
|
||||||||||||||||||||||||||||||||||
| Consumer: | |||||||||||||||||||||||||||||||||||||||||
| Home equity credit line |
|
|
|
|
|
|
|
||||||||||||||||||||||||||||||||||
| 1-4 family residential |
|
|
|
|
|
|
|
||||||||||||||||||||||||||||||||||
| Total consumer loans |
|
|
|
|
|
|
|
||||||||||||||||||||||||||||||||||
| Total nonaccruing |
|
|
|
|
|
|
|
||||||||||||||||||||||||||||||||||
| Total | $ |
|
$ |
|
$ |
|
$ |
|
$ |
|
$ |
|
$ |
|
|||||||||||||||||||||||||||
1
Includes TDRs that resulted from other modification types including, but not limited to, a legal judgment awarded on different terms, a bankruptcy plan confirmed on different terms, a settlement that includes the delivery of collateral in exchange for debt reduction, etc.
2
Includes TDRs that resulted from a combination of any of the previous modification types.
Unfunded lending commitments on TDRs totaled $
15
million and
$
3
million
at September 30, 2021 and December 31, 2020, respectively.
The total amortized cost of all TDRs in which interest rates were modified below market was $
91
million at September 30, 2021 and $
76
million at December 31, 2020. These loans are included in the previous schedule in the columns for interest rate below market and multiple modification types.
The net financial impact on interest income due to interest rate modifications below market for accruing TDRs for the three and nine months ended September 30, 2021 and 2020 was not significant.
On an ongoing basis, we monitor the performance of all TDRs according to their restructured terms. Subsequent payment default is defined in terms of delinquency, when principal or interest payments are past due 90 days or more for commercial loans, or 60 days or more for consumer loans.
58
The amortized cost of accruing and nonaccruing TDRs that had a payment default during the three and nine months ended September 30, 2021, which were still in default at period end, and were within 12 months or less of being modified as TDRs was approximately $
2
million and $
5
million, respectively, and $
3
million and $
6
million for the three and nine months ended September 30, 2020,
respectively.
Collateral-Dependent Loans
As discussed previously, when a loan is individually evaluated for expected credit losses, we estimate a specific reserve for the loan based on the projected present value of the loan’s future cash flows discounted at the loan’s effective interest rate, the observable market price of the loan, or the fair value of the loan’s underlying collateral.
Select information on loans for which the repayment is expected to be provided substantially through the operation or sale of the underlying collateral and the borrower is experiencing financial difficulties, including the type of collateral and the extent to which the collateral secures the loans, is summarized as follows:
| September 30, 2021 | |||||||||||||||||
| (Dollar amounts in millions) | Amortized cost | Major types of collateral |
Weighted average LTV
1
|
||||||||||||||
| Commercial: | |||||||||||||||||
| Commercial and industrial | $ |
|
Single family residential, Agriculture |
|
|||||||||||||
| Owner-occupied |
|
Office building |
|
||||||||||||||
| Commercial real estate: | |||||||||||||||||
| Term |
|
Multi-family, Hotel/Motel, Retail |
|
||||||||||||||
| Consumer: | |||||||||||||||||
| Home equity credit line |
|
Single family residential |
|
||||||||||||||
| 1-4 family residential |
|
Single family residential |
|
||||||||||||||
| Total | $ |
|
|||||||||||||||
1
The fair value is based on the most recent appraisal or other collateral evaluation.
| December 31, 2020 | |||||||||||||||||
| (Dollar amounts in millions) | Amortized cost | Major types of collateral |
Weighted average LTV
1
|
||||||||||||||
| Commercial: | |||||||||||||||||
| Commercial and industrial | $ |
|
Single family residential, Agriculture |
|
|||||||||||||
| Owner-occupied |
|
Office Building |
|
||||||||||||||
| Commercial real estate: | |||||||||||||||||
| Term |
|
Multi-family, Hotel/Motel, Retail |
|
||||||||||||||
| Consumer: | |||||||||||||||||
| Home equity credit line |
|
Single family residential |
|
||||||||||||||
| 1-4 family residential |
|
Single family residential |
|
||||||||||||||
| Total | $ |
|
|||||||||||||||
1
The fair value is based on the most recent appraisal or other collateral evaluation.
Foreclosed Residential Real Estate
At September 30, 2021 and December 31, 2020, we did
no
t have any foreclosed residential real estate property. The amortized cost basis of consumer mortgage loans collateralized by residential real estate property that are in the process of foreclosure was $
9
million and $
10
million for the same periods, respectively.
59
7.
DERIVATIVE INSTRUMENTS AND HEDGING ACTIVITIES
Objectives and Accounting
Our primary objective for using derivatives is to manage risks, primarily interest rate risk. We use derivatives to manage volatility in interest income, interest expense, earnings, and capital by adjusting our interest rate sensitivity to minimize the impact of fluctuations in interest rates. Derivatives are used to stabilize forecasted interest income from variable-rate assets and to modify the coupon or the duration of fixed-rate financial assets or liabilities as we consider advisable. We also assist clients with their risk management needs through the use of derivatives. For a more detailed discussion of the use of and accounting policies regarding derivative instruments, see Note 7 of our 2020 Form 10-K.
Fair Value Hedges of Liabilities
– At September 30, 2021, we had
one
receive-fixed interest rate swap with a notional amount of $
500
million designated in a qualifying fair value hedge relationship of fixed-rate debt. The receive-fixed interest rate swap effectively converts the interest on our fixed-rate debt to floating. During the third quarter of 2021, derivatives designated as fair value hedges of debt decreased in value by $
4
million which was offset by changes in the fair value of the hedged debt instruments as shown in the schedules below. During the third quarter of 2021, we amortized $
3
million of cumulative unamortized debt basis adjustments related to previously terminated fair value hedges of debt. We had $
2
million of unamortized debt basis adjustments from previously designated fair value hedges remaining.
Fair Value Hedges of Assets
– At September 30, 2021, we had pay-fixed, receive-floating interest rate swaps with an aggregate notional amount of $
383
million designated as fair value hedges of certain AFS securities. These swaps effectively convert the fixed interest income to a floating rate on the hedged portion of the securities. During the third quarter of 2021, derivatives designated as fair value hedges of fixed-rate AFS securities increased in value by $
4
million, which was offset by changes in value of the hedged securities, as shown in the schedules below. We had $
7
million of unamortized basis adjustments to AFS securities from previously designated fair value hedges.
Cash Flow Hedges
– At September 30, 2021, we had $
5.4
billion notional amount of receive-fixed interest rate swaps designated as cash flow hedges of pools of floating-rate commercial loans. During the third quarter of 2021, we increased the size of our cash flow hedge portfolio by entering into additional swaps with an aggregate notional amount of $
1.4
billion. Also during the quarter, our cash flow hedge portfolio decreased in value by $
21
million, which was recorded in AOCI. The amounts deferred in AOCI are reclassified into earnings in the periods in which the interest payments occur (i.e., when the hedged forecasted transactions affect earnings).
Collateral and Credit Risk
Exposure to credit risk arises from the possibility of nonperformance by counterparties. No significant losses on derivative instruments have occurred as a result of counterparty nonperformance. For a more detailed discussion of collateral and credit risk related to our derivative contracts, see Note 7 of our 2020 Form 10-K.
Our derivative contracts require us to pledge collateral for derivatives that are in a net liability position at a given balance sheet date. Certain of these derivative contracts contain credit-risk-related contingent features that include the requirement to maintain a minimum debt credit rating. We may be required to pledge additional collateral if a credit-risk-related feature were triggered, such as a downgrade of our credit rating. However, in past situations, not all counterparties have demanded that additional collateral be pledged when provided for by the contractual terms. At September 30, 2021, the fair value of our derivative liabilities was $
270
million, for which we were required to pledge cash collateral of $
51
million in the normal course of business. If our credit rating were downgraded one notch by either Standard & Poor’s (“S&P”) or Moody’s at September 30, 2021, there would likely be $
1
million of additional collateral required to be pledged.
60
Derivative Amounts
Certain information with respect to notional amounts and recorded gross fair values at September 30, 2021 and December 31, 2020, is summarized as follows:
| September 30, 2021 | December 31, 2020 | ||||||||||||||||||||||||||||||||||
|
Notional
amount |
Fair value |
Notional
amount |
Fair value | ||||||||||||||||||||||||||||||||
| (In millions) |
Other
assets |
Other
liabilities |
Other
assets |
Other
liabilities |
|||||||||||||||||||||||||||||||
| Derivatives designated as hedging instruments: | |||||||||||||||||||||||||||||||||||
| Cash flow hedges of floating-rate assets: | |||||||||||||||||||||||||||||||||||
|
Receive-fixed interest rate swaps
|
$ |
|
$ |
|
$ |
|
$ |
|
$ |
|
$ |
|
|||||||||||||||||||||||
| Fair value hedges: | |||||||||||||||||||||||||||||||||||
| Debt hedges: Receive-fixed interest rate swaps |
|
|
|
|
|
|
|||||||||||||||||||||||||||||
| Asset hedges: Pay-fixed interest rate swaps |
|
|
|
|
|
|
|||||||||||||||||||||||||||||
| Total derivatives designated as hedging instruments |
|
|
|
|
|
|
|||||||||||||||||||||||||||||
| Derivatives not designated as hedging instruments: | |||||||||||||||||||||||||||||||||||
|
Customer-facing interest rate derivatives
1
|
|
|
|
|
|
|
|||||||||||||||||||||||||||||
|
Offsetting interest rate derivatives
2
|
|
|
|
|
|
|
|||||||||||||||||||||||||||||
| Other interest rate derivatives |
|
|
|
|
|
|
|||||||||||||||||||||||||||||
| Foreign exchange derivatives |
|
|
|
|
|
|
|||||||||||||||||||||||||||||
|
Total derivatives not designated as hedging instruments
|
|
|
|
|
|
|
|||||||||||||||||||||||||||||
| Total derivatives | $ |
|
$ |
|
$ |
|
$ |
|
$ |
|
$ |
|
|||||||||||||||||||||||
1
Customer-facing interest rate derivatives include a net CVA of $
3
million and $
18
million, reducing the fair value amount at September 30, 2021 and December 31, 2020, respectively. These adjustments are required to reflect both our nonperformance risk and that of the respective counterparty.
2
The fair value amounts for these derivatives do not include the settlement amounts for those trades that are centrally cleared. Once the settlement amounts with the clearing houses are included the derivative fair values would be the following:
| September 30, 2021 | December 31, 2020 | ||||||||||||||||||||||
| (In millions) | Other assets | Other liabilities | Other assets | Other liabilities | |||||||||||||||||||
| Offsetting interest rate derivatives | $ |
|
$ |
|
$ |
|
$ |
|
|||||||||||||||
The amount of derivative gains (losses) from cash flow and fair value hedges that was deferred in OCI or recognized in earnings for the three and nine months ended September 30, 2021 and 2020 is shown in the schedules below.
| Amount of derivative gain (loss) recognized/reclassified | |||||||||||||||||||||||||||||
| Three Months Ended September 30, 2021 | |||||||||||||||||||||||||||||
| (In millions) | Effective portion of derivatives gain/(loss) deferred in OCI | Excluded components deferred in OCI (amortization approach) | Amount of gain/(loss) reclassified from OCI into income | Interest on fair value hedges | Hedge ineffectiveness/OCI reclass due to missed forecast | ||||||||||||||||||||||||
|
Cash flow hedges of floating-rate assets:
1
|
|||||||||||||||||||||||||||||
| Purchased interest rate floors | $ |
|
$ |
|
$ |
|
$ |
|
$ |
|
|||||||||||||||||||
| Interest rate swaps |
|
|
|
|
|
||||||||||||||||||||||||
| Fair value hedges of liabilities: | |||||||||||||||||||||||||||||
| Receive-fixed interest rate swaps |
|
|
|
|
|
||||||||||||||||||||||||
|
Basis amortization on terminated hedges
2, 3
|
|
|
|
|
|
||||||||||||||||||||||||
| Fair value hedges of assets: | |||||||||||||||||||||||||||||
| Pay-fixed interest rate swaps |
|
|
|
(
|
|
||||||||||||||||||||||||
|
Basis amortization on terminated hedges
2, 3
|
|
|
|
|
|
||||||||||||||||||||||||
|
Total derivatives designated as hedging instruments
|
$ |
|
$ |
|
$ |
|
$ |
|
$ |
|
|||||||||||||||||||
61
| Amount of derivative gain (loss) recognized/reclassified | |||||||||||||||||||||||||||||
| Nine Months Ended September 30, 2021 | |||||||||||||||||||||||||||||
| (In millions) | Effective portion of derivatives gain/(loss) deferred in OCI | Excluded components deferred in OCI (amortization approach) | Amount of gain/(loss) reclassified from OCI into income | Interest on fair value hedges | Hedge ineffectiveness/OCI reclass due to missed forecast | ||||||||||||||||||||||||
|
Cash flow hedges of floating-rate assets:
1
|
|||||||||||||||||||||||||||||
| Purchased interest rate floors | $ |
|
$ |
|
$ |
|
$ |
|
$ |
|
|||||||||||||||||||
| Interest rate swaps |
(
|
|
|
|
|
||||||||||||||||||||||||
| Fair value hedges of liabilities: | |||||||||||||||||||||||||||||
| Receive-fixed interest rate swaps |
|
|
|
|
|
||||||||||||||||||||||||
|
Basis amortization on terminated hedges
2, 3
|
|
|
|
|
|
||||||||||||||||||||||||
| Fair value hedges of assets: | |||||||||||||||||||||||||||||
| Pay-fixed interest rate swaps |
|
|
|
(
|
|
||||||||||||||||||||||||
|
Basis amortization on terminated hedges
2, 3
|
|
|
|
|
|
||||||||||||||||||||||||
|
Total derivatives designated as hedging instruments
|
$ |
(
|
$ |
|
$ |
|
$ |
|
$ |
|
|||||||||||||||||||
| Amount of derivative gain (loss) recognized/reclassified | |||||||||||||||||||||||||||||
| Three Months Ended September 30, 2020 | |||||||||||||||||||||||||||||
| (In millions) | Effective portion of derivatives gain/(loss) deferred in OCI | Excluded components deferred in OCI (amortization approach) | Amount of gain/(loss) reclassified from OCI into income | Interest on fair value hedges | Hedge ineffectiveness/OCI reclass due to missed forecast | ||||||||||||||||||||||||
|
Cash flow hedges of floating-rate assets:
1
|
|||||||||||||||||||||||||||||
| Purchased interest rate floors | $ |
|
$ |
|
$ |
|
$ |
|
$ |
|
|||||||||||||||||||
| Interest rate swaps |
(
|
|
|
|
|
||||||||||||||||||||||||
| Fair value hedges of liabilities: | |||||||||||||||||||||||||||||
| Receive-fixed interest rate swaps |
|
|
|
|
|
||||||||||||||||||||||||
|
Basis amortization on terminated hedges
2, 3
|
|
|
|
|
|
||||||||||||||||||||||||
| Fair value hedges of assets: | |||||||||||||||||||||||||||||
| Pay-fixed interest rate swaps |
|
|
|
|
|
||||||||||||||||||||||||
|
Basis amortization on terminated hedges
2, 3
|
|
|
|
|
|
||||||||||||||||||||||||
|
Total derivatives designated as hedging instruments
|
$ |
(
|
$ |
|
$ |
|
$ |
|
$ |
|
|||||||||||||||||||
62
| Amount of derivative gain (loss) recognized/reclassified | |||||||||||||||||||||||||||||
| Nine Months Ended September 30, 2020 | |||||||||||||||||||||||||||||
| (In millions) | Effective portion of derivatives gain/(loss) deferred in OCI | Excluded components deferred in OCI (amortization approach) | Amount of gain/(loss) reclassified from OCI into income | Interest on fair value hedges | Hedge ineffectiveness/OCI reclass due to missed forecast | ||||||||||||||||||||||||
|
Cash flow hedges of floating-rate assets:
1
|
|||||||||||||||||||||||||||||
| Purchased interest rate floors | $ |
|
$ |
|
$ |
|
$ |
|
$ |
|
|||||||||||||||||||
| Interest rate swaps |
|
|
|
|
|
||||||||||||||||||||||||
| Fair value hedges of liabilities: | |||||||||||||||||||||||||||||
| Receive-fixed interest rate swaps |
|
|
|
|
|
||||||||||||||||||||||||
|
Basis amortization on terminated hedges
2, 3
|
|
|
|
|
|
||||||||||||||||||||||||
| Fair value hedges of assets: | |||||||||||||||||||||||||||||
| Pay-fixed interest rate swaps |
|
|
|
|
|
||||||||||||||||||||||||
|
Basis amortization on terminated hedges
2, 3
|
|
|
|
|
|
||||||||||||||||||||||||
|
Total derivatives designated as hedging instruments
|
$ |
|
$ |
|
$ |
|
$ |
|
$ |
|
|||||||||||||||||||
1
Amounts recognized in OCI and reclassified from AOCI represent the effective portion of the derivative gain (loss). For the 12 months following September 30, 2021, we estimate that $
42
million will be reclassified from AOCI into interest income.
2
Adjustment to interest expense resulting from the amortization of the debt basis adjustment on fixed-rate debt previously hedged by terminated receive-fixed interest rate.
3
The cumulative unamortized basis adjustment from previously terminated or redesignated fair value hedges at September 30, 2021 is $
2
million and $
7
million of terminated fair value debt and asset hedges, respectively. The amortization of the cumulative unamortized basis adjustment from asset hedges is not shown in the schedules because it is not significant.
| Other Noninterest Income/(Expense) | |||||||||||||||||||||||
| (In millions) | Three Months Ended September 30, 2021 | Nine Months Ended September 30, 2021 | Three Months Ended September 30, 2020 | Nine Months Ended September 30, 2020 | |||||||||||||||||||
|
Derivatives not designated as hedging instruments:
|
|||||||||||||||||||||||
|
Customer-facing interest rate derivatives
|
$ |
(
|
$ |
(
|
$ |
|
$ |
|
|||||||||||||||
| Offsetting interest rate derivatives |
|
|
|
(
|
|||||||||||||||||||
| Other interest rate derivatives |
|
(
|
|
|
|||||||||||||||||||
| Foreign exchange derivatives |
|
|
|
|
|||||||||||||||||||
|
Total derivatives not designated as hedging instruments
|
$ |
|
$ |
|
$ |
|
$ |
|
|||||||||||||||
| Gain/(loss) recorded in income | |||||||||||||||||||||||||||||||||||
| Three Months Ended September 30, 2021 | Three Months Ended September 30, 2020 | ||||||||||||||||||||||||||||||||||
| (In millions) |
Derivatives
2
|
Hedged items | Total income statement impact |
Derivatives
2
|
Hedged items | Total income statement impact | |||||||||||||||||||||||||||||
|
Debt: Receive-fixed interest rate swaps
1, 2
|
$ |
(
|
$ |
|
$ |
|
$ |
(
|
$ |
|
$ |
|
|||||||||||||||||||||||
|
Assets: Pay-fixed interest rate swaps
1, 2
|
|
(
|
|
|
(
|
|
|||||||||||||||||||||||||||||
63
| Gain/(loss) recorded in income | |||||||||||||||||||||||||||||||||||
| Nine Months Ended September 30, 2021 | Nine Months Ended September 30, 2020 | ||||||||||||||||||||||||||||||||||
| (In millions) |
Derivatives
2
|
Hedged items | Total income statement impact |
Derivatives
2
|
Hedged items | Total income statement impact | |||||||||||||||||||||||||||||
|
Debt: Receive-fixed interest rate swaps
1, 2
|
$ |
(
|
$ |
|
$ |
|
$ |
|
$ |
(
|
$ |
|
|||||||||||||||||||||||
|
Assets: Pay-fixed interest rate swaps
1, 2
|
|
(
|
|
|
(
|
|
|||||||||||||||||||||||||||||
1
Consists of hedges of benchmark interest rate risk of fixed-rate long-term debt and fixed-rate AFS securities. Gains and losses were recorded in net interest expense or income consistent with the hedged items.
2
The income/expense for derivatives does not reflect interest income/expense from periodic accruals and payments to be consistent with the presentation of the gains/(losses) on the hedged items.
The following schedule provides information regarding basis adjustments for hedged items.
| Par value of hedged assets/(liabilities) |
Carrying amount of the hedged assets/(liabilities)
1
|
Cumulative amount of fair value hedging adjustment included in the carrying amount of the hedged item | |||||||||||||||||||||||||||||||||
| (In millions) | September 30, 2021 | December 31, 2020 | September 30, 2021 | December 31, 2020 | September 30, 2021 | December 31, 2020 | |||||||||||||||||||||||||||||
| Long-term fixed-rate debt | $ |
(
|
$ |
(
|
$ |
(
|
$ |
(
|
$ |
(
|
$ |
(
|
|||||||||||||||||||||||
| Fixed-rate AFS securities |
|
|
|
|
(
|
(
|
|||||||||||||||||||||||||||||
1
Carrying amounts displayed above exclude (1) issuance and purchase discounts or premiums, (2) unamortized issuance and acquisition costs, and (3) amounts related to terminated fair value hedges.
8.
LEASES
We determine if a contract is a lease or contains a lease at inception. The right to use leased assets for the lease term are considered right-of-use (“ROU”) assets. Operating lease assets are included in “other assets,” and finance lease assets are included in “premises, equipment and software, net,” and lease liabilities for operating leases are included in “other liabilities,” and finance leases are included in “long-term debt” on our consolidated balance sheet. For a more detailed discussion of our lease policies, see Note 8 of our 2020 Form 10-K.
We have operating and finance leases for branches, corporate offices, and data centers. Our equipment leases are not material. At September 30, 2021, we had
419
branches, of which
273
are owned and
146
are leased. We lease our headquarters in Salt Lake City, Utah, and other office or data centers are either owned or leased.
We may enter into certain lease arrangements with a term of 12 months or less, and we have elected to exclude these from capitalization. The remaining maturities of our lease commitments range from the year 2021 to 2062, and some lease arrangements include options to extend or terminate the leases.
ROU assets from operating leases were $
196
million at September 30, 2021, and $
213
million at December 31, 2020. ROU assets from finance leases were $
4
million for the same periods. We utilized a secured incremental borrowing rate based on the term of the lease for the discount rate to determine our lease ROU assets and liabilities.
64
The following schedule presents lease-related assets and liabilities, their weighted average remaining life, and the weighted average discount rate:
| (Dollar amounts in millions) |
September 30,
2021 |
December 31, 2020 | |||||||||
| Operating assets and liabilities | |||||||||||
| Operating right-of-use assets, net of amortization | $ |
|
$ |
|
|||||||
| Operating lease liabilities |
|
|
|||||||||
| Weighted average remaining lease term (years) | |||||||||||
| Operating leases |
|
|
|||||||||
| Finance leases |
|
|
|||||||||
| Weighted average discount rate | |||||||||||
| Operating leases |
|
% |
|
% | |||||||
| Finance leases |
|
% |
|
% | |||||||
The components of lease expense are as follows:
| Three Months Ended September 30, | Nine Months Ended September 30, | ||||||||||||||||||||||
| (In millions) | 2021 | 2020 | 2021 | 2020 | |||||||||||||||||||
| Operating lease costs | $ |
|
$ |
|
$ |
|
$ |
|
|||||||||||||||
| Variable lease costs |
|
|
|
|
|||||||||||||||||||
| Total lease cost | $ |
|
$ |
|
$ |
|
$ |
|
|||||||||||||||
Supplemental cash flow information related to leases is as follows:
| Three Months Ended September 30, | Nine Months Ended September 30, | ||||||||||||||||||||||
| (In millions) | 2021 | 2020 | 2021 | 2020 | |||||||||||||||||||
| Operating cash disbursements from operating leases | $ |
|
$ |
|
$ |
|
$ |
|
|||||||||||||||
New operating lease liabilities are as follows:
| Three Months Ended September 30, | Nine Months Ended September 30, | ||||||||||||||||||||||
| (In millions) | 2021 | 2020 | 2021 | 2020 | |||||||||||||||||||
| New operating lease liabilities | $ |
|
$ |
|
$ |
|
$ |
|
|||||||||||||||
Contractual undiscounted lease payments for operating lease liabilities, due by year, include:
| (In millions) | |||||
|
2021
1
|
$ |
|
|||
| 2022 |
|
||||
| 2023 |
|
||||
| 2024 |
|
||||
| 2025 |
|
||||
| Thereafter |
|
||||
| Total | $ |
|
|||
1
Contractual maturities for the three months remaining in 2021.
We enter into certain lease agreements where we are the lessor of real estate. Real estate leases are made from bank-owned and subleased property to generate cash flow from the property, including from leasing vacant suites in which we occupy portions of the building. Operating lease income was $
3
million for both the third quarter of 2021 and 2020, and $
10
million and $
9
million for the first nine months of 2021 and 2020, respectively.
We originate equipment leases, considered to be sales-type leases or direct financing leases, totaling $
293
million and $
320
million at September 30, 2021 and December 31, 2020, respectively. We recorded income of $
3
million on these leases for both the third quarter of 2021 and 2020, and $
9
million and $
10
million for the first nine months of 2021 and 2020, respectively.
65
9.
LONG-TERM DEBT AND SHAREHOLDERS’ EQUITY
Long-Term Debt
The long-term debt carrying values in the following schedule represent the par value of the debt, adjusted for any unamortized premium or discount, unamortized debt issuance costs, and basis adjustments for interest rate swaps designated as fair value hedges.
LONG-TERM DEBT
| (In millions) |
September 30,
2021 |
December 31, 2020 | Amount change | Percent change | |||||||||||||||||||
| Subordinated notes | $ |
|
$ |
|
$ |
(
|
(
|
% | |||||||||||||||
| Senior notes |
|
|
(
|
(
|
|||||||||||||||||||
| Finance lease obligations |
|
|
|
|
|||||||||||||||||||
| Total | $ |
|
$ |
|
$ |
(
|
(
|
% | |||||||||||||||
The decrease in long-term debt was primarily due to the maturity of $
281
million of
3
-year,
3.50
% senior notes during the third quarter of 2021.
Common Stock
Our common stock is traded on the National Association of Securities Dealers Automated Quotations (“NASDAQ”) Global Select Market. At September 30, 2021, there were
156.5
million shares of $
0.001
par value common stock outstanding. The balance of common stock and additional paid-in capital was $
2.2
billion at September 30, 2021, which decreased $
441
million, or
16
%, from December 31, 2020, primarily due to common stock repurchases. During the first nine months of 2021, we repurchased
8.5
million common shares outstanding for $
475
million at an average price of $
55.88
per share.
Preferred Stock
During the second quarter of 2021, we redeemed the outstanding shares of our
5.75
% Series H Non-Cumulative Perpetual Preferred Stock at par value, resulting in a $
126
million decrease of preferred stock. There were no additional fees or premium paid associated with the redemption.
66
Accumulated Other Comprehensive Income
Accumulated other comprehensive income decreased to $
64
million at September 30, 2021, from $
325
million at December 31, 2020, primarily as a result of decreases in the fair value of AFS securities due to changes in interest rates.
Changes in AOCI by component are as follows:
| (In millions) | Net unrealized gains (losses) on investment securities | Net unrealized gains (losses) on derivatives and other | Pension and post-retirement | Total | |||||||||||||||||||
| Nine Months Ended September 30, 2021 | |||||||||||||||||||||||
| Balance at December 31, 2020 | $ |
|
$ |
|
$ |
(
|
$ |
|
|||||||||||||||
|
OCI (loss) before reclassifications, net of tax
|
(
|
(
|
|
(
|
|||||||||||||||||||
| Amounts reclassified from AOCI, net of tax |
|
(
|
|
(
|
|||||||||||||||||||
| Other comprehensive income (loss) |
(
|
(
|
|
(
|
|||||||||||||||||||
| Balance at September 30, 2021 | $ |
|
$ |
|
$ |
(
|
$ |
|
|||||||||||||||
|
Income tax benefit included in other comprehensive income (loss)
|
$ |
(
|
$ |
(
|
$ |
|
$ |
(
|
|||||||||||||||
| Nine Months Ended September 30, 2020 | |||||||||||||||||||||||
| Balance at December 31, 2019 | $ |
|
$ |
|
$ |
(
|
$ |
|
|||||||||||||||
|
OCI before reclassifications, net of tax
|
|
|
|
|
|||||||||||||||||||
| Amounts reclassified from AOCI, net of tax |
|
(
|
|
(
|
|||||||||||||||||||
| Other comprehensive income |
|
|
|
|
|||||||||||||||||||
| Balance at September 30, 2020 | $ |
|
$ |
|
$ |
(
|
$ |
|
|||||||||||||||
|
Income tax expense included in OCI
|
$ |
|
$ |
|
$ |
|
$ |
|
|||||||||||||||
|
Amounts reclassified
from AOCI
1
|
Amounts reclassified
from AOCI
1
|
Statement of income (SI) | ||||||||||||||||||||||||||||||||||||
| (In millions) |
Three Months Ended
September 30, |
Nine Months Ended
September 30, |
||||||||||||||||||||||||||||||||||||
| Details about AOCI components | 2021 | 2020 | 2021 | 2020 | Affected line item | |||||||||||||||||||||||||||||||||
|
Net unrealized gains on derivative instruments
|
$ |
|
$ |
|
$ |
|
$ |
|
SI | Interest and fees on loans | ||||||||||||||||||||||||||||
| Income tax expense |
|
|
|
|
||||||||||||||||||||||||||||||||||
|
Amounts reclassified from AOCI
|
$ |
|
$ |
|
$ |
|
$ |
|
||||||||||||||||||||||||||||||
1
Positive reclassification amounts indicate increases to earnings in the income statement.
10.
COMMITMENTS, GUARANTEES, AND CONTINGENT LIABILITIES
Commitments and Guarantees
Contractual amounts of various off-balance sheet obligations used to meet the financing needs of our customers are as follows:
| (In millions) |
September 30,
2021 |
December 31,
2020 |
|||||||||
|
Net unfunded commitments to extend credit
1
|
$ |
|
$ |
|
|||||||
| Standby letters of credit: | |||||||||||
| Financial |
|
|
|||||||||
| Performance |
|
|
|||||||||
| Commercial letters of credit |
|
|
|||||||||
| Total unfunded lending commitments | $ |
|
$ |
|
|||||||
1
Net of participations.
67
Our 2020 Form 10-K contains further information about these commitments and guarantees including their terms and collateral requirements. At September 30, 2021, we recorded $
4
million as a liability for the guarantees associated with the standby letters of credit, which consisted of $
2
million in credit reserves and $
2
million of deferred commitment fees.
Legal Matters
We are subject to litigation in court and arbitral proceedings, as well as proceedings, investigations, examinations and other actions brought or considered by governmental and self-regulatory agencies. Litigation may relate to lending, deposit and other customer relationships, vendor and contractual issues, employee matters, intellectual property matters, personal injuries and torts, regulatory and legal compliance, and other matters. While most matters relate to individual claims, we are also subject to putative class action claims and similar broader claims. Proceedings, investigations, examinations and other actions brought or considered by governmental and self-regulatory agencies may relate to our banking, investment advisory, trust, securities, and other products and services; our customers’ involvement in money laundering, fraud, securities violations and other illicit activities or our policies and practices relating to such customer activities; and our compliance with the broad range of banking, securities and other laws and regulations applicable to us. At any given time, we may be in the process of responding to subpoenas, requests for documents, data and testimony relating to such matters and engaging in discussions to resolve the matters.
At September 30, 2021, we were subject to the following material litigation or governmental inquiries:
•
a civil suit,
JTS Communities, Inc. et. al v. CB&T, Jun Enkoji and Dawn Satow
, brought against us in the Superior Court for Sacramento County, California in June 2017. In this case four investors in our former customer, International Manufacturing Group (“IMG”) seek to hold us liable for losses arising from their investments in that company, alleging that we conspired with and knowingly assisted IMG and its principal in furtherance of an alleged Ponzi scheme. Currently, trial is scheduled for November 4, 2021.
•
a civil class action lawsuit,
Evans v. CB&T
, brought against us in the United States District Court for the Eastern District of California in May 2017. This case was filed on behalf of a class of up to 50 investors in IMG and seeks to hold us liable for losses of class members arising from their investments in IMG, alleging that we conspired with and knowingly assisted IMG and its principal in furtherance of an alleged Ponzi scheme. In December 2017, the District Court dismissed all claims against the Bank. In January 2018, the plaintiff filed an appeal with the Court of Appeals for the Ninth Circuit. The appeal was heard in early April 2019 with the Court of Appeals reversing the trial court’s dismissal. This case is in the post-pleading phase and trial will not occur for a substantial period of time.
•
two civil cases,
Lifescan Inc. and Johnson & Johnson Health Care Services v. Jeffrey Smith, et. al.
, brought against us in the United States District Court for the District of New Jersey in December 2017, and
Roche Diagnostics and Roche Diabetes Care Inc. v. Jeffrey C. Smith, et. al.
, brought against us in the United States District Court for the District of New Jersey in March 2019. In these cases, certain manufacturers and distributors of medical products seek to hold us liable for allegedly fraudulent practices of a borrower of the Bank who filed for bankruptcy protection in 2017. The cases are in early phases, with initial motion practice and discovery underway in the
Lifescan
case. Trial has not been scheduled in either case.
•
a civil class action lawsuit,
Gregory, et. al. v. Zions Bancorporation
, brought against us in the United States District Court for Utah in January 2019. This case was filed on behalf of investors in Rust Rare Coin, Inc., alleging that we aided and abetted a Ponzi scheme fraud perpetrated by Rust Rare Coin, a Zions Bank customer. The case follows civil actions and the establishment of a receivership for Rust Rare Coin by The Commodities Futures Trading Commission and the Utah Division of Securities in November 2018, as well as a separate suit brought by the SEC against Rust Rare Coin and its principal, Gaylen Rust. During the third quarter of 2020, the Court granted our motion to dismiss the plaintiffs' claims in part, dismissing claims relating to fraud and fiduciary duty, but allowing a claim for aiding and abetting conversion to proceed. The case is in the discovery phase. Trial has not been scheduled.
68
At least quarterly, we review outstanding and new legal matters, utilizing then available information. In accordance with applicable accounting guidance, if we determine that a loss from a matter is probable and the amount of the loss can be reasonably estimated, we establish an accrual for the loss. In the absence of such a determination, no accrual is made. Once established, accruals are adjusted to reflect developments relating to the matters.
In our review, we also assess whether we can determine the range of reasonably possible losses for significant matters in which we are unable to determine that the likelihood of a loss is remote. Because of the difficulty of predicting the outcome of legal matters, discussed subsequently, we are able to meaningfully estimate such a range only for a limited number of matters. Based on information available at September 30, 2021, we estimated that the aggregate range of reasonably possible losses for those matters to be from $
0 million
to roughly $
40
million in excess of amounts accrued. The matters underlying the estimated range will change from time to time, and actual results may vary significantly from this estimate. Those matters for which a meaningful estimate is not possible are not included within this estimated range and, therefore, this estimated range does not represent our maximum loss exposure.
Based on our current knowledge, we believe that our current estimated liability for litigation and other legal actions and claims, reflected in our accruals and determined in accordance with applicable accounting guidance, is adequate and that liabilities in excess of the amounts currently accrued, if any, arising from litigation and other legal actions and claims for which an estimate as previously described is possible, will not have a material impact on our financial condition, results of operations, or cash flows. However, in light of the significant uncertainties involved in these matters, and the very large or indeterminate damages sought in some of these matters, an adverse outcome in one or more of these matters could be material to our financial condition, results of operations, or cash flows for any given reporting period.
Any estimate or determination relating to the future resolution of litigation, arbitration, governmental or self-regulatory examinations, investigations or actions or similar matters is inherently uncertain and involves significant judgment. This is particularly true in the early stages of a legal matter, when legal issues and facts have not been well articulated, reviewed, analyzed, and vetted through discovery, preparation for trial or hearings, substantive and productive mediation or settlement discussions, or other actions. It is also particularly true with respect to class action and similar claims involving multiple defendants, matters with complex procedural requirements or substantive issues or novel legal theories, and examinations, investigations and other actions conducted or brought by governmental and self-regulatory agencies, in which the normal adjudicative process is not applicable. Accordingly, we usually are unable to determine whether a favorable or unfavorable outcome is remote, reasonably likely, or probable, or to estimate the amount or range of a probable or reasonably likely loss, until relatively late in the course of a legal matter, sometimes not until a number of years have elapsed. Accordingly, our judgments and estimates relating to claims will change from time to time in light of developments and actual outcomes will differ from our estimates. These differences may be material.
11.
REVENUE RECOGNITION
We derive our revenue primarily from interest income on loans and securities, which was approximately
79
% of our total revenue in the third quarter of 2021. Only noninterest income is considered to be revenue from contracts with customers in scope of ASC 606. For a discussion of our revenue recognition from contracts, and the implementation of ASC 606, see Note 17 of our 2020 Form 10-K.
Disaggregation of Revenue
69
| Zions Bank | Amegy | CB&T | |||||||||||||||||||||||||||||||||
| (In millions) | 2021 | 2020 | 2021 | 2020 | 2021 | 2020 | |||||||||||||||||||||||||||||
|
Commercial account fees
|
$ |
|
$ |
|
$ |
|
$ |
|
$ |
|
$ |
|
|||||||||||||||||||||||
|
Card fees
|
|
|
|
|
|
|
|||||||||||||||||||||||||||||
|
Retail and business banking fees
|
|
|
|
|
|
|
|||||||||||||||||||||||||||||
|
Capital markets and foreign exchange fees
|
|
|
|
|
|
|
|||||||||||||||||||||||||||||
| Wealth management fees |
|
|
|
|
|
|
|||||||||||||||||||||||||||||
| Other customer-related fees |
|
|
|
|
|
|
|||||||||||||||||||||||||||||
|
Total noninterest income from contracts with customers (ASC 606)
|
|
|
|
|
|
|
|||||||||||||||||||||||||||||
|
Other noninterest income (non-ASC 606 customer-related)
|
|
|
|
|
|
|
|||||||||||||||||||||||||||||
|
Total customer-related fees
|
|
|
|
|
|
|
|||||||||||||||||||||||||||||
|
Other noninterest income (noncustomer-related)
|
(
|
|
|
|
|
|
|||||||||||||||||||||||||||||
|
Total noninterest income
|
|
|
|
|
|
|
|||||||||||||||||||||||||||||
| Other real estate owned gain from sale |
|
|
|
|
|
|
|||||||||||||||||||||||||||||
|
Net interest income
|
|
|
|
|
|
|
|||||||||||||||||||||||||||||
|
Total income less interest expense
|
$ |
|
$ |
|
$ |
|
$ |
|
$ |
|
$ |
|
|||||||||||||||||||||||
| NBAZ | NSB | Vectra | |||||||||||||||||||||||||||||||||
| (In millions) | 2021 | 2020 | 2021 | 2020 | 2021 | 2020 | |||||||||||||||||||||||||||||
|
Commercial account fees
|
$ |
|
$ |
|
$ |
|
$ |
|
$ |
|
$ |
|
|||||||||||||||||||||||
|
Card fees
|
|
|
|
|
|
|
|||||||||||||||||||||||||||||
|
Retail and business banking fees
|
|
|
|
|
|
|
|||||||||||||||||||||||||||||
|
Capital markets and foreign exchange fees
|
|
|
|
|
|
|
|||||||||||||||||||||||||||||
| Wealth management fees |
|
|
|
|
|
|
|||||||||||||||||||||||||||||
| Other customer-related fees |
|
|
|
|
|
|
|||||||||||||||||||||||||||||
|
Total noninterest income from contracts with customers (ASC 606)
|
|
|
|
|
|
|
|||||||||||||||||||||||||||||
|
Other noninterest income (non-ASC 606 customer-related)
|
|
|
|
|
|
|
|||||||||||||||||||||||||||||
|
Total customer-related fees
|
|
|
|
|
|
|
|||||||||||||||||||||||||||||
|
Other noninterest income (noncustomer-related)
|
|
|
|
|
|
|
|||||||||||||||||||||||||||||
|
Total noninterest income
|
|
|
|
|
|
|
|||||||||||||||||||||||||||||
| Other real estate owned gain from sale |
|
|
|
|
|
|
|||||||||||||||||||||||||||||
|
Net interest income
|
|
|
|
|
|
|
|||||||||||||||||||||||||||||
|
Total income less interest expense
|
$ |
|
$ |
|
$ |
|
$ |
|
$ |
|
$ |
|
|||||||||||||||||||||||
| TCBW | Other | Consolidated Bank | |||||||||||||||||||||||||||||||||
| (In millions) | 2021 | 2020 | 2021 | 2020 | 2021 | 2020 | |||||||||||||||||||||||||||||
|
Commercial account fees
|
$ |
|
$ |
|
$ |
(
|
$ |
|
$ |
|
$ |
|
|||||||||||||||||||||||
|
Card fees
|
|
|
|
|
|
|
|||||||||||||||||||||||||||||
|
Retail and business banking fees
|
|
|
|
|
|
|
|||||||||||||||||||||||||||||
|
Capital markets and foreign exchange fees
|
|
|
|
|
|
|
|||||||||||||||||||||||||||||
| Wealth management fees |
|
|
|
(
|
|
|
|||||||||||||||||||||||||||||
| Other customer-related fees |
|
|
|
|
|
|
|||||||||||||||||||||||||||||
|
Total noninterest income from contracts with customers (ASC 606)
|
|
|
|
|
|
|
|||||||||||||||||||||||||||||
|
Other noninterest income (non-ASC 606 customer-related)
|
|
|
|
|
|
|
|||||||||||||||||||||||||||||
|
Total customer-related fees
|
|
|
|
|
|
|
|||||||||||||||||||||||||||||
|
Other noninterest income (noncustomer-related)
|
|
|
(
|
|
(
|
|
|||||||||||||||||||||||||||||
|
Total noninterest income
|
|
|
(
|
|
|
|
|||||||||||||||||||||||||||||
| Other real estate owned gain from sale |
|
|
|
|
|
|
|||||||||||||||||||||||||||||
|
Net interest income
|
|
|
|
|
|
|
|||||||||||||||||||||||||||||
|
Total income less interest expense
|
$ |
|
$ |
|
$ |
|
$ |
|
$ |
|
$ |
|
|||||||||||||||||||||||
70
| Zions Bank | Amegy | CB&T | |||||||||||||||||||||||||||||||||
| (In millions) | 2021 | 2020 | 2021 | 2020 | 2021 | 2020 | |||||||||||||||||||||||||||||
|
Commercial account fees
|
$ |
|
$ |
|
$ |
|
$ |
|
$ |
|
$ |
|
|||||||||||||||||||||||
|
Card fees
|
|
|
|
|
|
|
|||||||||||||||||||||||||||||
|
Retail and business banking fees
|
|
|
|
|
|
|
|||||||||||||||||||||||||||||
|
Capital markets and foreign exchange fees
|
|
(
|
|
|
|
|
|||||||||||||||||||||||||||||
| Wealth management fees |
|
|
|
|
|
|
|||||||||||||||||||||||||||||
| Other customer-related fees |
|
|
|
|
|
|
|||||||||||||||||||||||||||||
|
Total noninterest income from contracts with customers (ASC 606)
|
|
|
|
|
|
|
|||||||||||||||||||||||||||||
|
Other noninterest income (non-ASC 606 customer-related)
|
|
|
|
|
|
|
|||||||||||||||||||||||||||||
|
Total customer-related fees
|
|
|
|
|
|
|
|||||||||||||||||||||||||||||
|
Other noninterest income (noncustomer-related)
|
(
|
(
|
|
|
|
|
|||||||||||||||||||||||||||||
|
Total noninterest income
|
|
|
|
|
|
|
|||||||||||||||||||||||||||||
| Other real estate owned gain from sale |
|
|
|
|
|
|
|||||||||||||||||||||||||||||
|
Net interest income
|
|
|
|
|
|
|
|||||||||||||||||||||||||||||
|
Total income less interest expense
|
$ |
|
$ |
|
$ |
|
$ |
|
$ |
|
$ |
|
|||||||||||||||||||||||
| NBAZ | NSB | Vectra | |||||||||||||||||||||||||||||||||
| (In millions) | 2021 | 2020 | 2021 | 2020 | 2021 | 2020 | |||||||||||||||||||||||||||||
|
Commercial account fees
|
$ |
|
$ |
|
$ |
|
$ |
|
$ |
|
$ |
|
|||||||||||||||||||||||
|
Card fees
|
|
|
|
|
|
|
|||||||||||||||||||||||||||||
|
Retail and business banking fees
|
|
|
|
|
|
|
|||||||||||||||||||||||||||||
|
Capital markets and foreign exchange fees
|
|
|
|
|
|
|
|||||||||||||||||||||||||||||
| Wealth management fees |
|
|
|
|
|
|
|||||||||||||||||||||||||||||
| Other customer-related fees |
|
|
|
|
|
|
|||||||||||||||||||||||||||||
|
Total noninterest income from contracts with customers (ASC 606)
|
|
|
|
|
|
|
|||||||||||||||||||||||||||||
|
Other noninterest income (non-ASC 606 customer-related)
|
|
|
|
|
|
|
|||||||||||||||||||||||||||||
|
Total customer-related fees
|
|
|
|
|
|
|
|||||||||||||||||||||||||||||
|
Other noninterest income (noncustomer-related)
|
|
|
|
|
|
|
|||||||||||||||||||||||||||||
|
Total noninterest income
|
|
|
|
|
|
|
|||||||||||||||||||||||||||||
| Other real estate owned gain from sale |
|
|
|
|
|
|
|||||||||||||||||||||||||||||
|
Net interest income
|
|
|
|
|
|
|
|||||||||||||||||||||||||||||
|
Total income less interest expense
|
$ |
|
$ |
|
$ |
|
$ |
|
$ |
|
$ |
|
|||||||||||||||||||||||
| TCBW | Other | Consolidated Bank | |||||||||||||||||||||||||||||||||
| (In millions) | 2021 | 2020 | 2021 | 2020 | 2021 | 2020 | |||||||||||||||||||||||||||||
|
Commercial account fees
|
$ |
|
$ |
|
$ |
|
$ |
|
$ |
|
$ |
|
|||||||||||||||||||||||
|
Card fees
|
|
|
|
|
|
|
|||||||||||||||||||||||||||||
|
Retail and business banking fees
|
|
|
(
|
|
|
|
|||||||||||||||||||||||||||||
|
Capital markets and foreign exchange fees
|
|
|
|
|
|
|
|||||||||||||||||||||||||||||
| Wealth management fees |
|
|
|
(
|
|
|
|||||||||||||||||||||||||||||
| Other customer-related fees |
|
|
|
|
|
|
|||||||||||||||||||||||||||||
|
Total noninterest income from contracts with customers (ASC 606)
|
|
|
|
|
|
|
|||||||||||||||||||||||||||||
|
Other noninterest income (non-ASC 606 customer-related)
|
|
|
(
|
|
|
|
|||||||||||||||||||||||||||||
|
Total customer-related fees
|
|
|
|
|
|
|
|||||||||||||||||||||||||||||
|
Other noninterest income (noncustomer-related)
|
|
|
|
(
|
|
(
|
|||||||||||||||||||||||||||||
|
Total noninterest income
|
|
|
|
|
|
|
|||||||||||||||||||||||||||||
| Other real estate owned gain from sale |
|
|
|
|
|
|
|||||||||||||||||||||||||||||
|
Net interest income
|
|
|
|
|
|
|
|||||||||||||||||||||||||||||
|
Total income less interest expense
|
$ |
|
$ |
|
$ |
|
$ |
|
$ |
|
$ |
|
|||||||||||||||||||||||
71
12.
INCOME TAXES
The effective income tax rate was
22.8
% for the third quarter of 2021, compared with
18.6
% for the third quarter of 2020. The effective income tax rate for the first nine months of 2021 and 2020 was
22.2
% and
18.5
%, respectively. These rates were reduced by nontaxable municipal interest income and nontaxable income from certain bank-owned life insurance, and were increased by the non-deductibility of Federal Deposit Insurance Corporation (“FDIC”) premiums, certain executive compensation plans, and other fringe benefits. Compared with 2021, the 2020 tax rate was also lower as a result of the proportional increase in nontaxable items and tax credits relative to pretax book income.
The amount of our net deferred tax liability (“DTL”) was $
26
million at September 30, 2021, compared with $
3
million at December 31, 2020. The increase in the net DTL was primarily due to the negative provision for credit losses, and was partially offset by an increase in unrealized losses in AOCI related to investment securities.
We had
no
valuation allowance at September 30, 2021 and December 31, 2020. We regularly evaluate deferred tax assets to determine whether a valuation allowance is required. This evaluation considers all available evidence, both positive and negative, based on the more likely than not criteria that such assets will be realized. This evaluation also includes, but is not limited to (1) available carryback potential to prior tax years, (2) potential future reversals of existing deferred tax liabilities, which historically has a reversal pattern generally consistent with deferred tax assets, (3) potential tax planning strategies, and (4) future projected taxable income. Based on our evaluation, and considering the weight of the positive evidence compared with the negative evidence, we concluded a valuation allowance was not required at September 30, 2021.
13.
NET EARNINGS PER COMMON SHARE
Basic and diluted net earnings per common share based on the weighted average outstanding shares are summarized as follows:
|
Three Months Ended
September 30, |
Nine Months Ended
September 30, |
||||||||||||||||||||||
| (In millions, except shares and per share amounts) |
2021
|
2020
|
2021
|
2020
|
|||||||||||||||||||
| Basic: | |||||||||||||||||||||||
| Net income | $ |
|
$ |
|
$ |
|
$ |
|
|||||||||||||||
| Less common and preferred dividends |
|
|
|
|
|||||||||||||||||||
| Less impact from redemption of preferred stock |
|
|
|
|
|||||||||||||||||||
| Undistributed earnings |
|
|
|
|
|||||||||||||||||||
| Less undistributed earnings applicable to nonvested shares |
|
|
|
|
|||||||||||||||||||
| Undistributed earnings applicable to common shares |
|
|
|
|
|||||||||||||||||||
| Distributed earnings applicable to common shares |
|
|
|
|
|||||||||||||||||||
| Total earnings applicable to common shares | $ |
|
$ |
|
$ |
|
$ |
|
|||||||||||||||
| Weighted average common shares outstanding (in thousands) |
|
|
|
|
|||||||||||||||||||
| Net earnings per common share | $ |
|
$ |
|
$ |
|
$ |
|
|||||||||||||||
| Diluted: | |||||||||||||||||||||||
| Total earnings applicable to common shares | $ |
|
$ |
|
$ |
|
$ |
|
|||||||||||||||
| Weighted average common shares outstanding (in thousands) |
|
|
|
|
|||||||||||||||||||
| Dilutive effect of common stock warrants (in thousands) |
|
|
|
|
|||||||||||||||||||
| Dilutive effect of stock options (in thousands) |
|
|
|
|
|||||||||||||||||||
|
Weighted average diluted common shares outstanding (in thousands)
|
|
|
|
|
|||||||||||||||||||
| Net earnings per common share | $ |
|
$ |
|
$ |
|
$ |
|
|||||||||||||||
72
|
Three Months Ended
September 30, |
Nine Months Ended
September 30, |
||||||||||||||||||||||
| (In thousands) |
2021
|
2020
|
2021
|
2020
|
|||||||||||||||||||
| Restricted stock and restricted stock units |
|
|
|
|
|||||||||||||||||||
| Stock options |
|
|
|
|
|||||||||||||||||||
14.
OPERATING SEGMENT INFORMATION
We manage our operations and prepare management reports and other information with a primary focus on geographic area. We conduct our operations primarily through
seven
separately managed affiliate banks, each with its own local branding and management team, including Zions Bank, Amegy Bank, California Bank & Trust, National Bank of Arizona, Nevada State Bank, Vectra Bank Colorado, and The Commerce Bank of Washington. These affiliate banks comprise our primary business segments. Performance assessment and resource allocation are based upon this geographic structure. The operating segment identified as “Other” includes certain non-bank financial service subsidiaries, centralized back-office functions, and eliminations of transactions between segments.
We allocate the cost of centrally provided services to the business segments based upon estimated or actual usage of those services. We also allocate capital based on the risk-weighted assets held at each business segment. We use an internal funds transfer pricing (“FTP”) allocation system and process to report results of operations for business segments, which is continually refined. In the third quarter of 2020, we began allocating the net interest income associated with our Treasury department to the business segments. Historically, this amount was presented in the “Other” segment. Prior period amounts have been revised to reflect the impact of this change had it been instituted in the periods presented. Total average loans and deposits presented for the business segments include insignificant intercompany amounts between business segments and may also include deposits with the “Other” segment.
At September 30, 2021, Zions Bank operated
96
branches in Utah,
25
branches in Idaho, and
one
branch in Wyoming. Amegy operated
75
branches in Texas. CB&T operated
83
branches in California. NBAZ operated
56
branches in Arizona. NSB operated
45
branches in Nevada. Vectra operated
34
branches in Colorado and
one
branch in New Mexico. TCBW operated
two
branches in Washington and
one
branch in Oregon.
The accounting policies of the individual business segments are the same as those of the Bank. Transactions between business segments are primarily conducted at fair value, resulting in profits that are eliminated for reporting consolidated results of operations.
The following schedules do not present total assets or income tax expense for each operating segment, but instead present average loans, average deposits, and income before income taxes because we use these metrics when evaluating performance and making decisions pertaining to the business segments. The condensed statement of income identifies the components of income and expense which affect the operating amounts presented in the “Other” segment.
73
| Zions Bank | Amegy | CB&T | |||||||||||||||||||||||||||||||||
| (In millions) | 2021 | 2020 | 2021 | 2020 | 2021 | 2020 | |||||||||||||||||||||||||||||
| SELECTED INCOME STATEMENT DATA | |||||||||||||||||||||||||||||||||||
| Net interest income | $ |
|
$ |
|
$ |
|
$ |
|
$ |
|
$ |
|
|||||||||||||||||||||||
| Provision for credit losses |
(
|
(
|
(
|
|
(
|
|
|||||||||||||||||||||||||||||
|
Net interest income after provision for credit losses
|
|
|
|
|
|
|
|||||||||||||||||||||||||||||
| Noninterest income |
|
|
|
|
|
|
|||||||||||||||||||||||||||||
| Noninterest expense |
|
|
|
|
|
|
|||||||||||||||||||||||||||||
|
Income (loss) before income taxes
|
$ |
|
$ |
|
$ |
|
$ |
|
$ |
|
$ |
|
|||||||||||||||||||||||
| SELECTED AVERAGE BALANCE SHEET DATA | |||||||||||||||||||||||||||||||||||
| Total average loans | $ |
|
$ |
|
$ |
|
$ |
|
$ |
|
$ |
|
|||||||||||||||||||||||
| Total average deposits |
|
|
|
|
|
|
|||||||||||||||||||||||||||||
| NBAZ | NSB | Vectra | |||||||||||||||||||||||||||||||||
| (In millions) | 2021 | 2020 | 2021 | 2020 | 2021 | 2020 | |||||||||||||||||||||||||||||
| SELECTED INCOME STATEMENT DATA | |||||||||||||||||||||||||||||||||||
| Net interest income | $ |
|
$ |
|
$ |
|
$ |
|
$ |
|
$ |
|
|||||||||||||||||||||||
| Provision for credit losses |
(
|
|
(
|
(
|
(
|
|
|||||||||||||||||||||||||||||
|
Net interest income after provision for credit losses
|
|
|
|
|
|
|
|||||||||||||||||||||||||||||
| Noninterest income |
|
|
|
|
|
|
|||||||||||||||||||||||||||||
| Noninterest expense |
|
|
|
|
|
|
|||||||||||||||||||||||||||||
|
Income (loss) before income taxes
|
$ |
|
$ |
|
$ |
|
$ |
|
$ |
|
$ |
(
|
|||||||||||||||||||||||
| SELECTED AVERAGE BALANCE SHEET DATA | |||||||||||||||||||||||||||||||||||
| Total average loans | $ |
|
$ |
|
$ |
|
$ |
|
$ |
|
$ |
|
|||||||||||||||||||||||
| Total average deposits |
|
|
|
|
|
|
|||||||||||||||||||||||||||||
| TCBW | Other | Consolidated Bank | |||||||||||||||||||||||||||||||||
| (In millions) | 2021 | 2020 | 2021 | 2020 | 2021 | 2020 | |||||||||||||||||||||||||||||
| SELECTED INCOME STATEMENT DATA | |||||||||||||||||||||||||||||||||||
| Net interest income | $ |
|
$ |
|
$ |
|
$ |
|
$ |
|
$ |
|
|||||||||||||||||||||||
| Provision for credit losses |
|
|
(
|
|
(
|
|
|||||||||||||||||||||||||||||
|
Net interest income after provision for credit losses
|
|
|
|
|
|
|
|||||||||||||||||||||||||||||
| Noninterest income |
|
|
(
|
|
|
|
|||||||||||||||||||||||||||||
| Noninterest expense |
|
|
|
|
|
|
|||||||||||||||||||||||||||||
|
Income (loss) before income taxes
|
$ |
|
$ |
|
$ |
(
|
$ |
(
|
$ |
|
$ |
|
|||||||||||||||||||||||
| SELECTED AVERAGE BALANCE SHEET DATA | |||||||||||||||||||||||||||||||||||
| Total average loans | $ |
|
$ |
|
$ |
|
$ |
|
$ |
|
$ |
|
|||||||||||||||||||||||
| Total average deposits |
|
|
|
|
|
|
|||||||||||||||||||||||||||||
74
The following schedule presents selected operating segment information for the nine months ended September 30, 2021 and 2020:
| Zions Bank | Amegy | CB&T | |||||||||||||||||||||||||||||||||
| (In millions) | 2021 | 2020 | 2021 | 2020 | 2021 | 2020 | |||||||||||||||||||||||||||||
| SELECTED INCOME STATEMENT DATA | |||||||||||||||||||||||||||||||||||
| Net interest income | $ |
|
$ |
|
$ |
|
$ |
|
$ |
|
$ |
|
|||||||||||||||||||||||
| Provision for credit losses |
(
|
|
(
|
|
(
|
|
|||||||||||||||||||||||||||||
|
Net interest income after provision for credit losses
|
|
|
|
|
|
|
|||||||||||||||||||||||||||||
| Noninterest income |
|
|
|
|
|
|
|||||||||||||||||||||||||||||
| Noninterest expense |
|
|
|
|
|
|
|||||||||||||||||||||||||||||
|
Income (loss) before income taxes
|
$ |
|
$ |
|
$ |
|
$ |
|
$ |
|
$ |
|
|||||||||||||||||||||||
| SELECTED AVERAGE BALANCE SHEET DATA | |||||||||||||||||||||||||||||||||||
| Total average loans | $ |
|
$ |
|
$ |
|
$ |
|
$ |
|
$ |
|
|||||||||||||||||||||||
| Total average deposits |
|
|
|
|
|
|
|||||||||||||||||||||||||||||
| NBAZ | NSB | Vectra | |||||||||||||||||||||||||||||||||
| (In millions) | 2021 | 2020 | 2021 | 2020 | 2021 | 2020 | |||||||||||||||||||||||||||||
| SELECTED INCOME STATEMENT DATA | |||||||||||||||||||||||||||||||||||
| Net interest income | $ |
|
$ |
|
$ |
|
$ |
|
$ |
|
$ |
|
|||||||||||||||||||||||
| Provision for credit losses |
(
|
|
(
|
|
(
|
|
|||||||||||||||||||||||||||||
|
Net interest income after provision for credit losses
|
|
|
|
|
|
|
|||||||||||||||||||||||||||||
| Noninterest income |
|
|
|
|
|
|
|||||||||||||||||||||||||||||
| Noninterest expense |
|
|
|
|
|
|
|||||||||||||||||||||||||||||
|
Income (loss) before income taxes
|
$ |
|
$ |
|
$ |
|
$ |
(
|
$ |
|
$ |
|
|||||||||||||||||||||||
| SELECTED AVERAGE BALANCE SHEET DATA | |||||||||||||||||||||||||||||||||||
| Total average loans | $ |
|
$ |
|
$ |
|
$ |
|
$ |
|
$ |
|
|||||||||||||||||||||||
| Total average deposits |
|
|
|
|
|
|
|||||||||||||||||||||||||||||
| TCBW | Other | Consolidated Bank | |||||||||||||||||||||||||||||||||
| (In millions) | 2021 | 2020 | 2021 | 2020 | 2021 | 2020 | |||||||||||||||||||||||||||||
| SELECTED INCOME STATEMENT DATA | |||||||||||||||||||||||||||||||||||
| Net interest income | $ |
|
$ |
|
$ |
|
$ |
|
$ |
|
$ |
|
|||||||||||||||||||||||
| Provision for credit losses |
(
|
|
(
|
|
(
|
|
|||||||||||||||||||||||||||||
|
Net interest income after provision for credit losses
|
|
|
|
|
|
|
|||||||||||||||||||||||||||||
| Noninterest income |
|
|
|
|
|
|
|||||||||||||||||||||||||||||
| Noninterest expense |
|
|
|
|
|
|
|||||||||||||||||||||||||||||
|
Income (loss) before income taxes
|
$ |
|
$ |
|
$ |
(
|
$ |
(
|
$ |
|
$ |
|
|||||||||||||||||||||||
| SELECTED AVERAGE BALANCE SHEET DATA | |||||||||||||||||||||||||||||||||||
| Total average loans | $ |
|
$ |
|
$ |
|
$ |
|
$ |
|
$ |
|
|||||||||||||||||||||||
| Total average deposits |
|
|
|
|
|
|
|||||||||||||||||||||||||||||
ITEM 3. QUANTITATIVE AND QUALITATIVE DISCLOSURES ABOUT MARKET RISK
Interest rate and market risks are among the most significant risks regularly undertaken by us, and they are closely monitored as previously discussed. A discussion regarding our management of interest rate and market risk is included in the section entitled “Interest Rate and Market Risk Management” in this Form 10-Q.
ITEM 4. CONTROLS AND PROCEDURES
Our management, with the participation of our Chief Executive Officer and Chief Financial Officer, has evaluated the effectiveness of our disclosure controls and procedures at September 30, 2021. Based on that evaluation, our Chief Executive Officer and Chief Financial Officer concluded that our disclosure controls and procedures were effective at September 30, 2021. There were no changes in our internal control over financial reporting during the third quarter of 2021 that have materially affected, or are reasonably likely to materially affect, our internal control over financial reporting.
75
PART II. OTHER INFORMATION
ITEM 1. LEGAL PROCEEDINGS
The information contained in Note 10 of the Notes to Consolidated Financial Statements is incorporated by reference herein.
ITEM 1.A RISK FACTORS
We believe there have been no material changes in the risk factors included in our 2020 Form 10-K.
ITEM 2. UNREGISTERED SALES OF EQUITY SECURITIES AND USE OF PROCEEDS
The following schedule summarizes our share repurchases for the third quarter of 2021:
SHARE REPURCHASES
| Period |
Total number
of shares
repurchased
1
|
Average
price paid per share |
Total number of shares purchased as part of publicly announced plans or programs | |||||||||||||||||||||||||||||
| July | 194,049 | $ | 51.77 | 193,128 | ||||||||||||||||||||||||||||
| August | 1,825,980 | 54.39 | 1,825,980 | |||||||||||||||||||||||||||||
| September | 3,752,266 | 57.51 | 3,750,878 | |||||||||||||||||||||||||||||
|
Third quarter
|
5,772,295 | 56.33 | 5,769,986 | |||||||||||||||||||||||||||||
1
Represents common shares acquired in connection with our stock compensation plan. Shares were acquired from employees to pay for their payroll taxes and stock option exercise cost upon the exercise of stock options under provisions of an employee share-based compensation plan.
76
ITEM 6. EXHIBITS
a.
Exhibits
|
Exhibit
Number |
Description | ||||||||||
| Second Amended and Restated Articles of Association of Zions Bancorporation, National Association, incorporated by reference to Exhibit 3.1 of Form 8-K filed on October 2, 2018. | * | ||||||||||
| Second Amended and Restated Bylaws of Zions Bancorporation, National Association, incorporated by reference to Exhibit 3.2 of Form 8-K filed on April 4, 2019. | * | ||||||||||
| Certification by Chief Executive Officer required by Rules 13a-15(f) and 15d-15(f) under the Securities Exchange Act of 1934 (filed herewith). | |||||||||||
| Certification by Chief Financial Officer required by Rules 13a-15(f) and 15d-15(f) under the Securities Exchange Act of 1934 (filed herewith). | |||||||||||
| Certification by Chief Executive Officer and Chief Financial Officer required by Sections 13(a) or 15(d), as applicable, of the Securities Exchange Act of 1934 (15 U.S.C. 78m) and 18 U.S.C. Section 1350 (furnished herewith). | |||||||||||
| 101 | Pursuant to Rules 405 and 406 of Regulation S-T, the following information is formatted in Inline XBRL (i) the Consolidated Balance Sheets as of September 30,2021 and December 31, 2020, (ii) the Consolidated Statements of Income for the three months ended September 30, 2021 and September 30, 2020 and the nine months ended September 30, 2021 and September 30, 2020, (iii) the Consolidated Statements of Comprehensive Income for the three months ended September 30, 2021 and September 30, 2020 and the nine months ended September 30, 2021 and September 30, 2020, (iv) the Consolidated Statements of Changes in Shareholders’ Equity for the three months ended September 30, 2021 and September 30, 2020 and the nine months ended September 30, 2021 and September 30, 2020, (v) the Consolidated Statements of Cash Flows for the nine months ended September 30, 2021 and September 30, 2020 and (vi) the Notes to Consolidated Financial Statements (filed herewith). | ||||||||||
| 104 | The cover page from this Quarterly Report on Form 10-Q, formatted as Inline XBRL. | ||||||||||
* Incorporated by reference
Pursuant to Item 601(b)(4)(iii)(A) of Regulation S-K, copies of certain instruments defining the rights of holders of long-term debt are not filed. We agree to furnish a copy thereof to the Securities and Exchange Commission and the Office of the Comptroller of the Currency upon request.
77
SIGNATURES
Pursuant to the requirements of the Securities Exchange Act of 1934, the registrant has duly caused this report to be signed on its behalf by the undersigned thereunto duly authorized.
| ZIONS BANCORPORATION, NATIONAL ASSOCIATION | ||
| /s/ Harris H. Simmons | ||
|
Harris H. Simmons, Chairman and
Chief Executive Officer |
||
| /s/ Paul E. Burdiss | ||
| Paul E. Burdiss, Executive Vice President and Chief Financial Officer | ||
Date: November 4, 2021
78
TABLE OF CONTENTS
Part I. Financial InformationItem 2. Management S Discussion and Analysis Of Financial Condition and Results Of OperationsItem 1. Financial Statements (unaudited)Item 1. Financial StatementsItem 3. Quantitative and Qualitative Disclosures About Market RiskItem 4. Controls and ProceduresPart II. Other InformationItem 1. Legal ProceedingsItem 1. A Risk FactorsItem 2. Unregistered Sales Of Equity Securities and Use Of ProceedsItem 6. Exhibits