ZION OIL & GAS INC
10-Ks and 10-Qs
|
|
|
|
|
|
|
|
|
|
|
|
|
|
|
|
|
|
|
|
|
|
|
|
|
|
|
|
|
|
|
|
|
|
|
|
|
|
|
|
|
|
|
|
|
|
|
|
|
|
|
|
|
|
|
|
|
|
|
UNITED STATES
SECURITIES AND EXCHANGE COMMISSION
WASHINGTON, D.C. 20549
FORM 10-K
MARK ONE:
x
ANNUAL REPORT PURSUANT TO SECTION 13 OR 15(d) OF THE SECURITIES EXCHANGE ACT OF 1934 FOR THE FISCAL YEAR ENDED DECEMBER 31, 2010
¨
TRANSITION REPORT PURSUANT TO SECTION 13 OR 15(d) OF THE SECURITIES EXCHANGE ACT OF 1934
Commission file number
:
001-33228
ZION OIL & GAS, INC.
(Exact name of registrant as specified in its charter)
|
Delaware
(State or other Jurisdiction
of Incorporation or Organization)
|
20-0065053
(I.R.S. Employer
Identification No.)
|
|
|
6510 Abrams Rd., Suite 300
Dallas, TX
(Address of Principal Executive Offices)
|
75231
(Zip Code)
|
(214) 221-4610
(Registrant's telephone number, including area code)
Securities registered under Section 12 (b) of the Exchange Act:
|
Common Stock, par value $0.01 per share
|
NASDAQ Global Market
|
|
|
Common Stock Purchase Warrants Expiring
January 31, 2012 |
NASDAQ Global Market
|
|
|
Common Stock Purchase Warrants Expiring
December 31, 2012 |
NASDAQ Global Market
|
|
|
(Title of Class)
|
|
(Name of each exchange on which registered)
|
Securities registered under Section 12 (g) of the Exchange Act: None
Indicate by check mark if the registrant is a well-known seasoned issuer, as defined in Rule 405 of the Securities Act. Yes
¨
No
x
Indicate by check mark if the registrant is not required to file reports pursuant to Section 13 or Section 15(d) of the Act. Yes
¨
No
x
Indicate by check mark whether the registrant: (1) has filed all reports required to be filed by Section 13 or 15(d) of the Securities Exchange Act of 1934 during the preceding 12 months (or for such shorter period that the registrant was required to file such reports), and (2) has been subject to such filing requirements for the past 90 days. Yes
x
No
¨
Indicate by check mark whether the registrant has submitted electronically and posted on its corporate Web site, if any, every Interactive Data File required to be submitted and posted pursuant to Rule 405 of Regulation S-T (§232.405 of this chapter) during the preceding 12 months (or for such shorter period that the registrant was required to submit and post such files). Yes
¨
No
¨
Indicate by check mark if disclosure of delinquent filers pursuant to Item 405 of Regulation S-K is not contained herein, and will not be contained, to the best of the registrant's knowledge, in definitive proxy or information statements incorporated by reference in Part III of this Form 10-K or any amendment to this Form 10-K.
¨
Indicate by check mark whether the registrant is a large accelerated filer, an accelerated filer, a non-accelerated filer, or a smaller reporting company. See the definitions of "large accelerated filer", “accelerated filer” and “smaller reporting company” in Rule 12b-2 of the Exchange Act.
Large accelerated filer
¨
Accelerated filer
x
Non-accelerated filer
¨
Smaller Reporting Company
¨
Indicate by check mark whether the registrant is a shell company (as defined in Rule 12b-2 of the Exchange Act). Yes
¨
No
x
The aggregate market value of the voting and non-voting common stock held by non-affiliates of the registrant as of June 30, 2010 was approximately $89 million. This amount is based on the registrant’s common stock on the NASDAQ Global Market on that date.
The registrant had 25,043,078 shares of common stock, par value $0.01, outstanding as of March 7, 2011.
2010 ANNUAL REPORT (SEC FORM 10-K)
INDEX
Securities and Exchange Commission
Item Number and Description
|
PART I
|
||
|
Item 1
|
Business
|
4
|
|
Item 1A
|
Risk Factors
|
21
|
|
Item 1B
|
Unresolved Staff Comments
|
32
|
|
Item 2
|
Properties
|
32
|
|
Item 3
|
Legal Proceedings
|
34
|
|
Item 4
|
Removed and Reserved
|
34
|
|
PART II
|
||
|
Item 5
|
Market for the Registrant's Common Equity, Related Stockholder Matters and Issuer Purchases of Equity Securities
|
34
|
|
Item 6
|
Selected Financial Data
|
36
|
|
Item 7
|
Management's Discussion and Analysis of Financial Condition and Results of Operations
|
38
|
|
Item 7A
|
Quantitative and Qualitative Disclosures about Market Risk
|
43
|
|
Item 8
|
Financial Statements
|
44
|
|
Item 9
|
Changes in and Disagreements with Accountants on Accounting and Financial Disclosure
|
44
|
|
Item 9A
|
Controls and Procedures
|
44
|
|
Item 9B
|
Other Information
|
45
|
|
PART III
|
||
|
Item 10
|
Directors, Executive Officer and Corporate Governance
|
45
|
|
Item 11
|
Executive Compensation
|
45
|
|
Item 12
|
Security Ownership of Certain Beneficial Owners and Management and Related Stockholder Matters
|
45
|
|
Item 13
|
Certain Relationships and Related Transactions and Director Independence
|
45
|
|
Item 14
|
Principal Accounting Fees and Services
|
45
|
|
Item 15
|
Exhibits, Financial Statement Schedules
|
46
|
FORWARD LOOKING STATEMENTS
This Annual Report on Form 10-K (herein, “Annual Report”) and the documents included or incorporated by reference in this Annual Report contain statements concerning our expectations, beliefs, plans, objectives, goals, strategies, future events or performance and underlying assumptions and other statements that are not historical facts. These statements are “forward-looking statements” within the meaning of the Private Securities Litigation Reform Act of 1995. You generally can identify our forward-looking statements by the words “anticipate,” “believe,” “budgeted,” “continue,” “could,” “estimate,” “expect,” “forecast,” “goal,” “intend,” “may,”
“objective,” “plan,” “potential,” “predict,” “projection,” “scheduled,” “should,” “will” or other similar words. These forward-looking statements include, among others, statements regarding:
|
•
|
our growth strategies;
|
|
|
•
|
our ability to explore for and develop natural gas and oil resources successfully and economically;
|
|
|
•
|
Local (in Israel) as well as global demand for oil and natural gas;
|
|
|
•
|
our estimates of the timing and number of wells we expect to drill and other exploration activities and planned expenditures;
|
2
|
|
•
|
changes in our drilling plans and related budgets;
|
|
|
•
|
the quality of our license areas with regard to, among other things, the existence of reserves in economic quantities;
|
|
•
|
anticipated trends in our business;
|
|
|
•
|
our future results of operations;
|
|
|
•
|
our liquidity and our ability to raise capital to finance our exploration and development activities;
|
|
|
•
|
our capital expenditure program;
|
|
|
•
|
future market conditions in the oil and gas industry;
|
|
|
•
|
the impact of governmental regulation; and
|
|
|
•
|
other factors discussed under “Risk Factors” in Item 1A of this report.
|
More specifically, our forward-looking statements include, among others, statements relating to our schedule, business plan, targets, estimates or results of future drilling, including the number, timing and results of wells, the timing and risk involved in drilling follow-up wells, planned expenditures, prospects budgeted and other future capital expenditures, risk profile of oil and gas exploration, acquisition of seismic data (including number, timing and size of projects), planned evaluation of prospects, probability of prospects having oil and natural gas, expected production or reserves, increases in reserves, acreage, working capital requirements, hedging activities, the ability of expected sources of liquidity to implement our business strategy, future hiring, future exploration activity, production
rates, all and any other statements regarding future operations, financial results, business plans and cash needs and other statements that are not historical fact.
Such statements involve risks and uncertainties, including, but not limited to, those relating to the uncertainties inherent in exploratory drilling activities, the volatility of oil and natural gas prices, operating risks of oil and natural gas operations, our dependence on our key personnel, factors that affect our ability to manage our growth and achieve our business strategy, risks relating to our limited operating history, technological changes, our significant capital requirements, the potential impact of government regulations, adverse regulatory determinations, litigation, competition, the uncertainty of reserve information and future net revenue estimates, property acquisition risks, industry partner issues, availability of equipment, weather and other factors detailed herein and in our other
filings with the Securities and Exchange Commission (the “SEC”).
We have based our forward-looking statements on our management’s beliefs and assumptions based on information available to our management at the time the statements are made. We caution you that assumptions, beliefs, expectations, intentions and projections about future events may and often do vary materially from actual results. Therefore, we cannot assure you that actual results will not differ materially from those expressed or implied by our forward-looking statements.
Some of the factors that could cause actual results to differ from those expressed or implied in forward-looking statements are described under “Risk Factors” in this Annual Report and in our other periodic reports filed with the SEC. Should one or more of these risks or uncertainties materialize, or should underlying assumptions prove incorrect, actual outcomes may vary materially from those indicated. All subsequent written and oral forward-looking statements attributable to us or persons acting on our behalf are expressly qualified in their entirety by reference to these risks and uncertainties. You should not place undue reliance on our forward-looking statements. Each forward-looking statement speaks only as of the date of the particular statement, and we undertake no duty to update any
forward-looking statement.
3
Zion Oil and Gas, Inc., a Delaware corporation (referred to herein as “we”, “our”, “us”, “Zion”, “Zion Oil”, or the “Company”) is an initial stage oil and gas exploration company with a history of over 10 years of oil and gas exploration in Israel. We were incorporated in Florida on April 6, 2000 and reincorporated in Delaware on July 9, 2003. We completed our initial public offering in January 2007. Our common stock currently trades on the NASDAQ Global Market under the symbol “ZN” and our warrants trade on such market under the symbols “ZNWAW” and “ZNWAZ”.
We currently hold two petroleum exploration licenses, which we have named the Joseph License and the Asher-Menashe License, covering approximately 162,100 acres onshore in the State of Israel between Netanya in the south and Haifa in the north. The areas have been subject to a series of exploration permits and licenses that have been granted to and held by us under the Israeli Petroleum Law, 5712-1952 (the “Petroleum Law”). To date, we have drilled two exploratory wells and are currently drilling our third exploratory well in the Joseph License area, and have partly completed drilling one exploratory well in the Asher-Menashe License area.
In February 2011, we submitted to the Israeli Petroleum Commissioner (sometimes referred to herein as the “Petroleum Commissioner” or the “Commissioner”) applications for two additional exploration licenses and an application for a preliminary exploration permit. One of the license applications and the application for the preliminary exploration permit cover substantially all of the area covered by our Issachar-Zebulun Permit, which expired on February 23, 2011. We named this license application the Jordan Valley License Application and we named the preliminary exploration permit the Zebulun Permit Application. We have named the second license application the Dead Sea License Application as it covers areas within the vicinity of the Dead Sea.
The Joseph License and Asher-Menashe License areas are geographically contiguous and within a similar geologic environment. They are located on a relatively continuous regional structure high that runs almost parallel to the current coast of Israel primarily onshore, from just off of Haifa to south of Tel Aviv.
We currently have no revenues or operating income and we are classified as a "development stage" company. Our ability to generate future revenues and operating cash flow will depend on the successful exploration and exploitation of our current and any future petroleum rights or the acquisition of oil and/or gas producing properties, the volume and timing of such production. In addition, even if we are successful in producing oil and gas in commercial quantities, our results will depend upon commodity prices for oil and gas, as well as operating expenses including taxes and royalties. Such pricing factors are largely beyond our control, and may result in fluctuations in our earnings in the event that we do have success with our exploration program and make a commercial discovery.
We hold 100% of the working interest in our license areas, which means we are responsible for 100% of the costs of exploration and, if established, production. Our net revenue interest is 81.5%, which means we would receive 81.5% of the gross proceeds from the sale of oil and gas from license areas upon their conversion to production leases, if there is any commercial production. The 18.5% to which we are not entitled comprises (i) a 12.5% royalty reserved by the State of Israel and (ii) an overriding royalty interest (or equivalent net operating profits interest) of 6% of gross revenue from production given over to two charitable foundations. No royalty would be payable to any landowner with respect to production from our license areas as the State of Israel owns all the mineral rights. In addition, we may
establish a key employee incentive plan that may receive an overriding royalty interest (or equivalent net operating profits interest) of up to 1.5%. In that event, our effective net (pre-tax) revenue interest would be 80%.
Our executive offices are located at 6510 Abrams Road, Suite 300, Dallas, Texas 75231, and our telephone number is (214) 221-4610. Our satellite office in Pennsylvania is located at 270 Walker Drive, Suite 205, State College, PA 16801 and the telephone number is (814) 308-0608. Our field office in Israel is located at 15 Bareket Street, North Industrial Park, Caesarea 38900, and the telephone number is +972-4-623-1425.
4
Background of our License Areas
In 1983, during a visit to Israel, John M. Brown (our Founder and Chairman) became inspired and dedicated to finding oil and gas in Israel. During the next 17 years he made several trips each year to Israel, hired oil and gas consultants in Israel and Texas, met with Israeli government officials, made direct investments with local exploration companies, and assisted Israeli exploration companies in raising money for oil and gas exploration in Israel. This activity led Mr. Brown to form Zion Oil & Gas, Inc. in April 2000, in order to receive the award of a small onshore petroleum license from the Israeli government.
Zion’s vision, as exemplified by its Founder and Chairman, John Brown, of finding oil and/or natural gas in Israel, is biblically inspired. The vision is based, in part, on biblical references alluding to the presence of oil and/or natural gas in territories within the State of Israel that were formerly within certain ancient biblical tribal areas. While John Brown provides the broad vision and goals for our company, the actions taken by the Zion management team as it actively explores for oil and gas in Israel, are based on modern science and good business practice. Zion’s oil and gas exploration activities are supported by appropriate geological, geophysical and other science-based studies and surveys typically carried out by companies engaged in oil and gas exploration activities.
Upon the award of our first petroleum right (License No. 298/“Ma'anit” or the "Ma'anit License") in May 2000, the Israeli government gave us access to most of its data with respect to previous exploration in the area, including geologic reports, seismic records and profiles, drilling reports, well files, gravity surveys, geochemical surveys and regional maps. We also gathered information concerning prior and ongoing geological, geophysical and drilling activity relevant to our planned activities from a variety of publicly accessible sources.
The map below (Map #1) shows the outline of our current Joseph and Asher-Menashe License areas and the exploratory wells drilled to date. The Israeli government itself conducted most of the seismic surveys during the 1970's and 1980's to provide data to encourage oil companies to invest in exploratory drilling. Private and public Israeli, American and international companies conducted additional seismic surveys and drilled most of the wells in the period since 1980. We have also acquired and processed additional 2-D seismic lines as recently as June 2010 in each of the license areas in an effort to identify and mature drilling prospects.
5
LICENSE AREAS CURRENTLY OWNED BY ZION
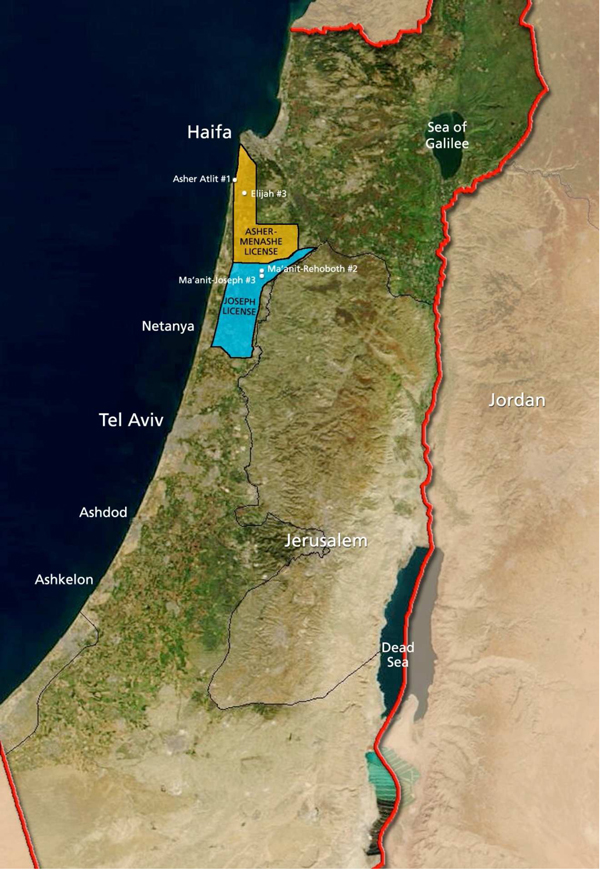 Map #1
6
As reflected on the Map, the Joseph License and Asher-Menashe License areas are geographically contiguous and within a similar geologic environment. They are located on a relatively continuous regional structural high that runs almost parallel to the current coast of Israel primarily onshore from just off of Haifa to south of Tel Aviv. The regional structural high is evidenced by gravimetric anomalies in both license areas. This structure and other geologic elements common to both areas, including particularly the Triassic-age Ma'anit structure that extends from the Joseph License area into the Asher-Menashe License area, lend themselves to an integrated exploratory program (and, if successful, may lend themselves to an integrated development program).
In the event of a discovery in our license areas, we will be entitled to convert the relevant portions of our licenses to 30-year production leases, extendable to 50 years, subject to compliance with a field development work program and production.
Joseph License
The “Joseph License” covers approximately 83,272 acres on the Israeli coastal plain south of the Asher-Menashe License between Caesarea in the north and Netanya in the south.
In 2005, in accordance with terms of the Ma’anit-Joseph License, the predecessor of our Joseph License, we drilled the Ma’anit #1 well on the Ma’anit prospect. Drilling breaks and shows of hydrocarbons were recorded from approximately 12,000 feet to the total depth of approximately 15,500 feet. Due to mechanical problems that prevented us from isolating highly conductive water bearing zones from the tighter hydrocarbon bearing formations, the shows were never successfully tested and the well was abandoned in June 2007, following unsuccessful remedial workover operations conducted between April and June 2007. Immediately following the relinquishment of the Ma'anit-Joseph License, we applied for a new license covering approximately 83,000 acres of the original Ma'anit-Joseph License,
including the Ma'anit structure on which our Ma'anit # 1 well was drilled and on which we ultimately drilled the Ma'anit-Rehoboth # 2 well.
On October 11, 2007, we were awarded the Joseph License. The Joseph License had an initial term of three years, which could be extended for an additional four years as provided by the Petroleum Law. The license extensions are only granted in increments of a maximum of one year. In April 2010, we were granted a one year extension to this license to October 10, 2011.
In October 2007, we filed with the Petroleum Commissioner a presentation of the Permian-age prospect on the Ma’anit structure on the Joseph License. The presentation provided a detailed geological and economic justification of drilling a test well to the Permian horizons on the Ma’anit structure, in addition to the appraisal well to the Triassic depth that we committed to drill under the terms of the license. In this presentation, which was based on a year-long study of the deep Permian horizons on our Joseph and Asher-Menashe licenses, we noted and analyzed the implications of the similarity between the late Permian Arqov Formation found in Israel and the late Permian Khuff Formation in the Persian Gulf region. The Khuff Formation is the main reservoir for the off-shore gas bearing North Field
in Qatar and the contiguous South Pars Field in Iran. It should be emphasized that, notwithstanding the similarities between the Permian Arqov Formation in Israel and the Permian Khuff Formation in the Persian Gulf region, the gas reservoirs found in the Khuff fields of the Persian Gulf should not be assumed to be present in the Arqov Formation that may lie under Zion’s Joseph License. The comparisons presented in our Permian prospect report were presented to the Petroleum Commissioner solely as part of our overall geological and economic analysis justifying the drilling of a ”wildcat” test well on the Ma’anit structure.
As discussed below under “Summary of Exploration and Drilling Activities”, to date we have drilled two exploratory wells and are currently drilling our third exploratory well, named the Ma’anit-Joseph #3 well, in the Joseph License area. The drilling of the Ma'anit-Joseph #3 well was planned to test the Permian-age geological formation and drilling operations on this well, which commenced in August 2010, are expected to continue through late April 2011, assuming we do not encounter any additional technical difficulties. As of March 10, 2011, the drilling of the Ma'anit-Joseph #3 well had reached a depth of approximately 14,400 feet (4,389 meters).
7
Asher-Menashe License
The “Asher-Menashe License” covers an area of approximately 78,824 acres located on the Israeli coastal plain and the Mount Carmel range between Caesarea in the south and Haifa in the north.
In May 2005, we applied for a preliminary permit with priority rights to conduct exploration activities on areas covering approximately 124,000 acres abutting the former Ma'anit-Joseph License and lying to its north and west in order to continue our exploration of the exploratory trend we developed under the Ma'anit License and Joseph Permit areas. In applying for the permit, we proposed a two-staged program of geological and geophysical work extending over an 18-month period aimed at developing a drillable prospect in the permit area.
On August 1, 2005, we were granted Preliminary Permit No. 186/“Asher” or the “Asher Permit” with priority rights for an area covering approximately 121,100 acres. The permit, covering lands on the Israeli coastal plain and the Mount Carmel range stretching north to the outskirts of Haifa, was for a period of 18 months terminating on January 31, 2007.
In connection with the work program requirements for the Asher Permit and continuing exploration of the Joseph License area, we reprocessed approximately 124 miles (200 kilometers) of existing 2-D seismic lines. In addition, in June 2010, the Geophysical lnstitute of lsrael (Gll), on behalf of Zion, acquired approximately 15 miles (25 kilometers) of 2-D seismic data within the Elijah #3 project area. We used all the data for detailed mapping of prospect leads.
On January 31, 2007, in accordance with the terms of the Asher Permit, we submitted a Final Report and Prospect Identification. In conjunction with the report and in exercise of our priority rights under the permit, we filed an application with the Petroleum Commissioner for a petroleum exploration license on approximately 81,000 acres north of the Ma'anit-Joseph License, of which approximately 78,000 acres were subject of the Asher Permit and some approximately 3,000 acres abutted the Permit acreage to the north.
On June 10, 2007, we were granted the Asher-Menashe License. The Asher-Menashe License has an initial three-year term, which may be extended for an additional four years as provided by the Petroleum Law. The license extensions are only granted in increments of a maximum of one year. In May 2010, we were granted a one year extension to this license to June 9, 2011.
Under the terms of the Asher-Menashe License, as extended, we were required, among other things, to identify a new drilling prospect in the Asher-Menashe License area by April 1, 2011 and to sign, by May 1, 2011, a drilling contract to drill such prospect to the Permian-age geological layer. As further discussed below under “Summary of Exploration and Drilling Activities”, based on the processing, interpretation and analysis of the 2-D seismic data in the Elijah #3 project area, we determined that the Asher volcanics section is greater (i.e., thicker and deeper) than originally estimated. Accordingly, further engineering work is needed to determine if the Elijah #3 well can be successfully re-drilled through this dense volcanic formation. Due to our new determination regarding the
Asher-Menashe volcanics, we are uncertain as to whether we can identify a viable drilling prospect within this license area. Currently, and since August 2010, the drilling rig available to us for our drilling operations and all of our accompanying drilling equipment and resources have been exclusively dedicated to reaching the Permian-age target formation in the Ma’anit-Joseph #3 well (in the Joseph License Area), which we expect to reach in late April 2011, assuming that we do not encounter any further technical difficulties. Following the drilling of the Ma’anit-Joseph #3 well, the analysis of the well and the completion of any testing procedures that we may then deem necessary or desirable (in light of the results of our analysis), we anticipate being in a position to take the appropriate decision as to our next steps in the Asher-Menashe License area. For the reasons noted above, we will not be in a position to identify a new drilling prospect in the Asher-Menashe
License Area by the required date of April 1, 2011. In fact, the results of the Ma’anit-Joseph #3 well may be determinative as to whether we will re-enter the Elijah #3 well and may inform any subsequent decision as to the identity and location of a new drilling prospect, if any, in the Asher-Menashe License area. See “Risk Factors”.
8
As discussed below under “Summary of Exploration and Drilling Activities”, to date we have partly completed one exploratory well in the Asher-Menashe License Area.
Newly Submitted License and Permit Applications
In August 2009, we were awarded a preliminary exclusive petroleum exploration permit on approximately 165,000 acres onshore Israel. The Issachar-Zebulun Permit allowed us to conduct, on an exclusive basis through February 23, 2011, preliminary investigations to ascertain the prospects for discovering petroleum in the area covered by the permit. Unlike a license area, where test drilling may take place, no test drilling is allowed on a permit area.
On February 17, 2011, prior to the expiration of the Issachar-Zebulun Permit, we submitted an application to the Petroleum Commissioner for an exploration license on approximately 87,000 acres of land (the Jordan Valley License Application) and an application for a new preliminary exploration permit on approximately 157,000 acres of land (the Zebulun Permit), all within the area included within our previous Issachar-Zebulun Permit. Taken together, the new Jordan Valley License Application and the new Zebulun Permit Application cover much of the land previously held under the Issachar-Zebulun Permit. The Petroleum Commissioner customarily grants priority application rights to a holder of a permit who applies for a license on land that was previously subject to that same permit; however, no assurance can
be provided that we will be awarded the Jordan Valley License Application or the Zebulun Permit Application.
As noted above, to assist in identifying potential drilling prospects within the previous Issachar-Zebulun Permit area, in June 2010, we acquired an additional 2-D seismic line approximately 19 miles (30 kilometers) in length and the data was processed and integrated into our geological/geophysical database by our geologists. We have identified various areas of potential for further exploration activity within the Jordan Valley License Application area.
On February 17, 2011, we also submitted an application to the Petroleum Commissioner for an exploration license on approximately 75,000 acres of land within the vicinity of the Dead Sea (the Dead Sea License Application). Hydrocarbons in the Dead Sea area have been mentioned throughout recorded history and since Biblical times. After earthquakes, asphalt can be found floating on the Dead Sea and asphalt seeps are well known in the area surrounding the Dead Sea. Our geologists have identified the Dead Sea area as one worthy of exploration and we believe that it is appropriate to apply at this time for a license in the Dead Sea area.
We anticipate that the Petroleum Commissioner will consider our Jordan Valley License Application in March 2011 and the Zebulun Permit Application and Dead Sea License Application in mid-Summer to Fall 2011. No assurance can be provided that our applications (or any part of them) will ultimately be granted.
The map below (Map #2) shows the outline of our Jordan Valley License Application, Zebulun Permit Application and Dead Sea License Application that we submitted to the Petroleum Commissioner in February 2011. No assurance can be provided that we will ultimately be granted, in whole or in part, the requested applications.
9
LICENSE AREAS AND PERMIT AREA APPLIED FOR BY ZION (ON FEBRUARY 17, 2011)
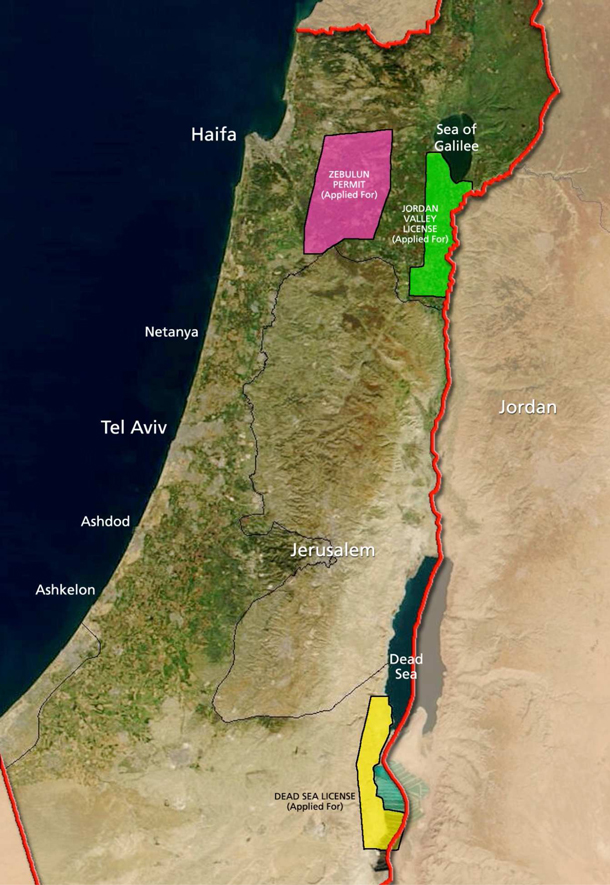 Map #2
10
Summary of Exploration and Drilling Activities to Date
Joseph License Area
To date, we drilled two exploratory wells and are currently drilling our third exploratory well in the Joseph License area. The first exploratory well, named the Ma’anit #1 well, was drilled to a depth of 15,842 feet (4,829 meters) to Triassic-age formations with encouraging but inconclusive results. However, notwithstanding these results, due to the mechanical condition of the well-bore, we determined that the well was incapable of producing oil and/or gas in commercial quantities and, consequently, in June 2007, we abandoned the well.
In 2009, we drilled an additional well (the Ma’anit-Rehoboth #2 well), ‘directionally’ to a depth of 17,913 feet (5,460 meters). The purpose of the Ma’anit-Rehoboth #2 well was both to appraise the apparent findings of the Ma’anit #1 in the Triassic-age formations (at a depth of between approximately 12,000 and 15,400 feet) and to test the deeper Permian-age horizons at a depth of approximately 16,000 to 18,000 feet. The well penetrated a number of geologic formations that were preliminarily deemed to have hydrocarbon potential and, during well operations, a small quantity of crude oil was retrieved. However, in April 2010, following the completion of testing procedures, we determined that commercial quantities of hydrocarbons were not present in the Ma'anit-Rehoboth #2 well
and, accordingly, we suspended drilling operations in that well. In connection with this decision, we recognized a non-cash impairment charge to our unproved oil and gas properties for the quarter ended June 30, 2010.
As the Ma'anit-Rehoboth #2 well did not reach the Permian-age geological formation beneath the Joseph License area, we decided to drill a subsequent well, the "Ma'anit-Joseph #3 well", at a location near the Ma'anit-Rehoboth #2 well (in the Joseph License Area). The drilling of the Ma'anit-Joseph #3 well, which was commenced in August 2010, was planned to test the Permian-age geological formation and drilling operations on this well are expected to continue through late April 2011, assuming that we do not encounter any further technical difficulties. As of March 10, 2011, the drilling of the Ma'anit-Joseph #3 well had reached a depth of approximately 14,400 feet (4,389 meters).
Asher-Menashe License Area
To date, we have partly completed one exploratory well in the Asher-Menashe License Area. In October 2009, we commenced drilling the Elijah #3 well, within the Asher-Menashe License area, toward the Triassic geological formation, which we estimated was below approximately 10,000 feet (3,048 meters). As of January 15, 2010, we had drilled to a depth of 10,938 feet (3,334 meters). In early February 2010, we temporarily suspended drilling operations in the well following our unsuccessful efforts to retrieve a stuck pipe, pending further analysis of the situation.
By December 31, 2010, processing and interpretation of approximately 15 miles (25 kilometers) of 2-D seismic data in the Elijah #3 project area, newly acquired for Zion by the Geophysical Institute of Israel (GII) in June 2010, was completed. Analysis of the newly acquired data helped us to redefine the geologic model of the area and indicated that the Asher volcanics section is likely substantially greater (i.e., thicker and deeper) than originally predicted by the older, original data. Further engineering work is needed to determine if the Elijah #3 well can be successfully re-drilled through this unexpectedly more extensive volcanic section. As our available drilling resources are currently dedicated exclusively to drilling the Ma’anit-Joseph #3 well (in the Joseph License) to the Permian-age
target depth, our geologists and engineering experts will not be in a position to address the future of the Elijah #3 well until after we have completed drilling the Ma’anit-Joseph #3 well and completed any testing or other post drilling procedures that we may deem necessary or desirable once we reach the Permian-age target in such well. In fact, the results of the Ma’anit-Joseph #3 well may be determinative as to whether we will re-enter the Elijah #3 well. As a result, we cannot meet certain deadlines imposed as conditions on the Asher-Menashe License. See “Risk Factors”.
11
Previous Issachar-Zebulun Permit
In August 2009, we were awarded a preliminary exclusive petroleum exploration permit on approximately 165,000 acres onshore Israel. The Issachar-Zebulun Permit allowed us to conduct, on an exclusive basis through February 23, 2011, preliminary investigations to ascertain the prospects for discovering petroleum in the area covered by the permit. Unlike a license area, where test drilling may take place, no test drilling is allowed on a permit area.
The Issachar-Zebulun Permit extended Zion’s petroleum rights from the Mediterranean Sea at Caesarea across the Carmel Mountains to Megiddo and through to the Jordan River immediately south of the Sea of Galilee. During their analysis of northern Israel, our geologists noted the possibility of hydrocarbon bearing structures within the Jordan Valley area.
To help identify potential drilling prospects within the previous Issachar-Zebulun Permit area, in June 2010, Zion acquired through GII an additional 2-D seismic line approximately 19 miles (30 kilometers) in length in the Jordan Valley region and the data was processed and integrated into our geological/geophysical database by our geologists. We identified various areas of potential for further exploration activity. As discussed above, in February 2011 we applied for both a license (Jordan Valley License) on part of the previous Issachar-Zebulun Permit area and a new permit application (Zebulun Permit) for substantially the remainder of the area covered by the previous Issachar-Zebulun Permit.
Drilling Program
Our work program calls for the drilling of the Ma’anit-Joseph #3 well to a depth of approximately 19,357 feet (5,900 meters) on the Joseph License. We anticipate reaching the Permian-age target depth in late April 2011, assuming we do not encounter any further technical difficulties. We will then test select intervals (if any) that have hydrocarbon-bearing potential. If the results indicate the presence of hydrocarbons, we may then need to drill an offset appraisal well to the Ma’anit-Joseph #3 well or consider re-entering the suspended Ma’anit-Rehoboth #2 well.
We also intend to negotiate a drilling contract for a multi-well development program, likely to include the Ma’anit structure and the Jordan Valley and Dead Sea Applications areas. We have identified various areas of potential for further exploration activity within the newly proposed Jordan Valley License Application area.
A "dry hole" is a well that for either geological or mechanical reasons is judged by us to be incapable of producing oil or gas in commercial quantities. If any well is not a "dry hole", then a completion attempt would be made. The completion cost will depend on the well depth, scope, and complexity of operations. The range of the possible completion cost is between a minimum of $300,000 and a maximum of several million dollars, in order to set production casing, perforate, install the production tubing and wellhead and conduct extended tests of the well. We cannot provide any assurance at this time that any well will be completed or produce oil and/or gas in commercial quantities. It is well established that oil and gas exploration activities are inherently risky operations, particularly in areas
like Israel where we are drilling deep, wildcat wells.
We estimate that, in order to be commercially productive, any of the wells we intend to drill to the approximate depth of 14,764 feet (4,500 meters) or deeper, based on industry standards, would need to be capable of producing at least 150 barrels of oil per day or gas equivalent. Such production levels will not pay out the cost of drilling the well, but only the costs of operating the well on a current basis. In order to justify the costs of drilling of additional wells, there would need to be the expectation that each additional well would have initial production rates in excess of 500 barrels of oil per day or gas equivalent, or some combination of the two, based upon minimum oil prices of $75.00 per barrel.
12
Exploration Related Activities
If our Dead Sea License Application is granted, of which no assurance can be provided, we anticipate to acquire and incorporate over 150 miles (over 240 kilometers) of existing 2-D seismic data in the area to identify and mature new drilling prospects.
We also intend to apply for additional permits in other specified areas onshore Israel. If granted, we will then need to acquire, process and incorporate process over 30 miles (approximately 50 kilometers) of new seismic data in these areas to identify potential drilling prospects.
Our 2011 plans also include trying to acquire a majority working interest in a deep-drilling capacity onshore drilling rig. Toward that end, we entered into a memorandum of understanding (“MOU”) with the operator of the 2,000 horsepower rig which we used to drill the Ma’anit-Rehoboth #2 well, the Elijah #3 well and the Ma’anit-Joseph #3 well, to purchase a 51% interest in a company that would own the drilling rig. Aladdin Middle East Ltd. (“AME”), the operator of the rig, or an affiliated entity, would own the remaining 49% of the drilling company. However, by its terms, the MOU expired on December 31, 2010, and, due to certain internal disputes within the Sayer Group, we have not been able to reach definitive agreements or to extend the term of the MOU.
Although we may continue discussions with AME, we do not believe it is likely that we will reach an arrangement with them regarding a drilling subsidiary at this time, unless they completely settle the internal disputes affecting them.
We continue in our efforts to secure control of an appropriate drilling rig and experienced crew. At present, in order to secure control of a rig, we anticipate that we will either need to collaborate with a third party who owns an appropriate rig or purchase such a rig. If we are not able to secure control of an appropriate rig, then we will likely seek, as previously, to contract for a suitable rig on an “as required” basis.
Geological Background of Exploration Plans in our License Areas
In order to better understand and interpret the geology of the Joseph and Asher-Menashe License areas, our staff of geologists is using an Israeli country-wide 2-D seismic database residing in our "Kingdom" (seismic interpretation and geologic mapping) software from Seismic Micro Technology. Our geo-scientists are utilizing two workstations containing the software, one in the U.S.A. and one in Israel. The database consists of approximately 250 seismic lines totaling approximately 2,050 miles (3,300 kilometers) of coverage and also includes the stratigraphic sections from all the deep wells drilled in Israel. In addition, we have access to additional geophysical data such as gravity and magnetic surveys that are useful in establishing the overall geologic picture.
From studies conducted by us to date, we have several areas under investigation, each as shown on the maps appearing at pages 6 and 10. The primary areas of interest, apart from the areas already drilled and being drilled, include the Jordan Rift Valley – Dead Sea province and the general area of the continental shelf which encompasses the Judean and Sharon plains.
The prospective geological reservoirs in Zion’s areas of interest range in geologic age from the younger Tertiary Period of the Cenozoic Era to the older Permian Period of the Paleozoic Era. Oil source rocks range in age from the late Cretaceous to upper Paleozoic age. The potential carbonate reservoirs are believed to have been deposited in a high energy environment in shallow water close to the shoreline with high-energy characteristics such as wave action, strong tidal currents, etc. As discussed above, in the presentation of the Permian prospect submitted to the Petroleum Commissioner on October 29, 2007, the Upper Permian Arqov Formation, which appears to underlie both Zion’s Joseph and Asher-Menashe Licenses, bears a striking similarity to the Upper Permian
Khuff Formation in the Persian Gulf region. As discussed, the Khuff Formation is the main reservoir for the prolific offshore gas bearing North Field in Qatar and South Pars Field in Iran. The Khuff Formation, however, is much shallower than our geologic targets in our license areas. As such, our primary well targets will be deeper than the Khuff wells and require a secondary source of porosity (e.g. faulting) to be productive.
13
Competition and Markets
The oil and gas exploration industry in Israel currently consists of a number of exploration companies. These include relatively small local or foreign companies with limited financial resource and consortia of local Israeli and foreign participants with substantial financial resources. Most groups are engaged primarily in off-shore activities, which is not an area in which we are currently active. Some groups are exploring for oil shale projects which is not a current interest of ours. Of the participants in onshore activities, only two companies other than Zion are active in the northern half of Israel in which our activities are concentrated. We are aware of no oil and gas exploration companies which are at present actively considering exploration activities in the areas that are the subject of our
Joseph and Asher-Menashe Licenses or our recently expired Issachar-Zebulun Permit are (which is included in our Jordan Valley License Application and Zebulun Permit Application). Historically, primarily for geopolitical reasons, Israel (particularly on-shore) has not been an area of interest for international integrated or large or mid-size independent oil and gas exploration companies. Since the announcement of the Tamar and Leviathan discoveries, this is beginning to change. However, given the current limited availability in Israel of oil field service companies, equipment and personnel, including our drilling contractor, in periods of increased exploration interest and activity as at present, there is competition for available equipment and services. In this market Zion has no particular advantage. We attempt to enhance our position by developing and maintaining good professional relations with oil field service providers and a high level of credibility in making and meeting
commercial commitments.
If any of our exploratory wells are commercially productive, we would install the appropriate production equipment which includes among other items oil and gas separation facilities and storage tanks. Under the terms of the Petroleum Law, we may be required by the Minister of National Infrastructures to offer first refusal for any oil and gas discovered to Israeli domestic purchasers at market prices.
Because Israel imports all of its crude oil needs and the market for crude oil in Israel is limited to two local oil refineries, the closest located in Haifa approximately 25 miles from the site of the Ma’anit-Joseph #3 well, no special marketing strategy need be adopted initially with regard to any oil that Zion may discover. Zion believes that it would have a ready local market for its oil at market prices and would have the option of exporting to the international market. An oil transfer pipeline between the Haifa and the Ashdod refineries lies approximately five miles from the site of the Ma’anit-Joseph #3 well.
The natural gas market began its development in Israel following the offshore discovery of the Mari-B field in 2000. Since that date, the national electric company has six natural gas-fired generating stations either producing electricity or under construction. Additionally, there is the planned construction of several gas-fired independent power producers (IPPs) and inside-the-fence plants by a number of large industrial users, the first of which was inaugurated at the end of August 2007. Since inception, the Mari-B field has averaged producing 250,000 mcfg per day (1,000 cubic feet of natural gas). That volume is being augmented by approximately 100,000 mcfg per day from Egypt.
In January 2009, in deep water offshore Israel, the Tamar discovery was announced by a consortium headed by Noble Energy. The expected date of production is 2013. Following the Tamar discovery, in December 2010, the Leviathan offshore discovery was also announced. These very significant offshore finds reinforced the Israeli government’s encouragement to the power and industrial sectors to convert to natural gas. To date, most of the offshore underwater natural gas pipeline infrastructure intended to connect the offshore gas fields to the markets in Israel has been completed. It is believed that the electrical generating sector, together with the industrial, commercial, and future residential sectors when developed, should be able to absorb any gas discovery within a
reasonable period. As the system is being developed we are seeing the gas price in the range of $3.50 to $4.50 per thousand BTU. The Israeli government is currently considering issuing tenders to establish local distribution companies in several regions of the country and the Israeli government has announced its strategic need to find additional suppliers of natural gas for the anticipated significant expansion of the market.
14
Israel's Petroleum Law
Our business in Israel is subject to regulation by the State of Israel under the Petroleum Law. The administration and implementation of the Petroleum Law is vested in the Minister of National Infrastructures, the Petroleum Commissioner and an advisory council The following discussion includes a brief summary review of certain provisions of the Petroleum Law as currently in effect. This review is not complete and it should not be relied on as a definitive restatement of the law related to petroleum exploration and production activities in Israel.
Petroleum resources are owned by the State of Israel, regardless of whether they are located on state lands or the offshore continental shelf. No person is allowed to explore for or produce petroleum without being granted a specific right under the Petroleum Law. Israeli law provides for three types of rights, two relevant to the exploration stage and the third for production.
Preliminary permit.
The "preliminary permit" allows a prospector to conduct preliminary investigations, such as field geology, airborne magnetometer surveys and seismic data acquisition, but does not allow test drilling. It may be granted for a period not to exceed 18 months. The holder of a preliminary permit is entitled to request a priority right on the permit area, which, if granted, prevents an award of petroleum rights on the permit area to any other party. There are no restrictions as to size of the permit area or to the number of permits that may be held by one prospector. However, Israeli policy is to award an area no larger than that for which the applicant has a reasonable plan of operation and has shown evidence of the necessary financial
resources to execute the plan.
License.
The next level of petroleum right is the "license", bestowing an exclusive right for further exploration work and requiring the drilling of one or more test wells. The initial term of a license is up to three years and it may be extended for up to an additional four years (in one year increments). A license area may not exceed 400,000 dunam (approximately 98,800 acres). One dunam is equal to 1,000 square meters (approximately .24711 of an acre). No one entity may hold more than 12 licenses or hold more than a total of four million dunam in aggregate license area.
Production lease.
Upon discovery of petroleum in commercial quantities, a licensee has a statutory "right" to receive a production "lease." The initial lease term is 30 years, extendable for an additional 20 years (up to a maximum period of 50 years). A lease confers upon the lessee the exclusive right to explore for and produce petroleum in the lease area and requires the lessee to produce petroleum in commercial quantities (or pursue test or development drilling). The lessee is entitled to transport and market the petroleum produced, subject, however, to the right of the government to require the lessee to supply local needs first, at market price.
Petroleum rights fees.
The holders of preliminary permits, licenses and leases are required to pay fees to the government of Israel to maintain the rights. The fees vary according to the nature of the right, the size and location (onshore or offshore) of the right, acreage subject of the right and, in the case of a license, the period during which the license has been maintained. For a permit, the fees are New Israeli Shekels (NIS) 97.82 (approx. US$26.60 at the Bank of Israel representative rate published on February 8, 2011) per 1,000 dunam (approx. 247.11 acres) per year. For a license, the initial year fees are New Israeli Shekels (NIS) 103.85 (approx. US$28.24 at the Bank of Israel representative rate published on February 8, 2011) per dunam
(approx. 247.11 acres) per year. Every subsequent year, the license fee increases incrementally.
Requirements and entitlements of holders of petroleum rights.
The holder of a petroleum right (permit, license or lease) is required to conduct its operations in accordance with a work program set as part of the petroleum right, with due diligence and in accordance with the accepted practice in the petroleum industry. The holder is required to submit progress and final reports; provided, however, the information disclosed in such reports remains confidential for as long as the holder owns a petroleum right on the area concerned.
If the holder of a petroleum right does not comply with the work program provided for by the terms of the right, the Petroleum Commissioner may issue a notice requiring that the holder cure the default within 60 days of the giving of the notice, together with a warning that failure to comply within the 60-day cure period may entail cancellation of the right. If the petroleum right is cancelled following such notice, the holder of the right may, within 30 days of the date of notice of the Commissioner's decision, appeal such cancellation to the Minister of National Infrastructures. No petroleum right shall be cancelled until the Minister has ruled on the appeal.
15
The holder of a license or lease on which there is a producing well is required to pay a royalty to the government of 12.5% of production. The government may elect to take the royalty in kind, or take payment in cash for its share of production. However, while the existing royalty rate of 12.5% is not expected to change in the near future, in January 2011, the Finance Ministry advisory committee established by the Finance Minister of Israel to study the country’s fiscal policy as it relates to the upstream oil and natural gas sector, recommended the imposition of a special levy ranging from 20% to 50%, on oil and gas profits after a return on investment has been achieved. These recommendations need to be voted on by Israel’s parliament.
The grant of a petroleum right does not automatically entitle its holder to enter upon the land to which the right applies or to carry out exploration and production work thereon. Entry requires the consent of the private or public holders of the surface rights and of other public regulatory bodies (e.g. planning and building authorities, Nature Reserves Authority, municipal and security authorities, etc.). The holder of a petroleum right may request the government to acquire, on its behalf, land needed for petroleum purposes. The petroleum right holder is required to obtain all other necessary approvals.
Petroleum Taxation
Our activities in Israel will be subject to taxation both in Israel and in the United States. Under the U.S. Internal Revenue Code, we will be entitled to claim either a deduction or a foreign tax credit with respect to Israeli income taxes paid or incurred on our Israeli source oil and gas income. As a general rule, we anticipate that it will be more advantageous for us to claim a credit rather than a deduction for applicable Israeli income taxes on our U.S tax return. A tax treaty exists between the U.S. and Israel that would provide opportunity to use the tax credit.
Exploration and development expenses.
Under current US and Israeli tax laws, exploration and development expenses incurred by a holder of a petroleum right can, at the option of such holder, either be expensed in the year incurred or capitalized and expensed (or amortized) over a period of years. Most of our expenses to date have been expensed for both U.S. and Israeli income tax purposes.
Depletion allowances.
Under current Israeli tax laws, the holder of an interest in a petroleum license or lease is allowed a deduction for income tax purposes on account of the depletion of the petroleum reserve relating to such interest. This may be by way of percentage depletion or cost depletion, whichever is greater. Percentage depletion is at the rate of 27.5% of the gross income, but subject to a limit of 50% of the net income attributed to the relevant petroleum license or lease in that tax year. Cost depletion is the amount calculated by dividing the "adjusted cost" of the petroleum interest, being the cost less accrued depletion allowances to date, at the beginning of the tax year, by the number of units remaining in the estimated petroleum
reservoir at the beginning of such year, and multiplying this sum by the number of units of petroleum produced from the interest and saved during the tax year. In 2010, the Finance Minister of Israel established an advisory committee to study the country’s fiscal policy as it relates to the upstream oil and natural gas sector, as well as various options, including an increase in royalties or cancellation of tax incentives. In January 2011, the Finance Ministry advisory committee issued its final recommendations which included cancellation of currently-existing tax incentives, including the depletion allowance.
Corporate tax.
Under current Israeli tax laws, whether a company is registered in Israel or is a foreign company operating in Israel through a branch, it is subject to Israeli Companies Tax on its taxable income (including capital gains) from Israeli sources at a flat rate of 26% in 2010; thereafter, beginning 2011, the tax rate will be 25% and continue to decrease by 1% each year until 2015. From 2016 onward, the tax rate will be 18%. Furthermore, until 2010, capital gains were subject to a corporate tax rate of 25%. Beginning, 2010, capital gains will be equal to the regular corporate tax rate.
16
Import duties
. Insofar as similar items are not available in Israel, the Petroleum Law provides that the owner of a petroleum right may import into Israel, free of most customs, purchase taxes and other import duties, all machinery, equipment, installations, fuel, structures, transport facilities, etc. (apart from consumer goods and private cars and similar vehicles) that are required for the petroleum exploration and production purposes, subject to the requirement that security be provided to ensure that the equipment is exported out of Israel within the agreed upon time frame.
Exploration Expenditures
The following table summarizes the amounts we expended on our exploration efforts between 2008 and 2010:
|
2010
|
2009
|
2008
|
||||||||||
|
US $(000)
|
US $(000)
|
US $(000)
|
||||||||||
|
Joseph Licenses
|
||||||||||||
|
Geological & Geophysical Operations
|
195 | 271 | 85 | |||||||||
|
Exploratory Drilling Operations
|
18,050 | 12,215 | 1,811 | |||||||||
|
Asher-Menashe License
|
||||||||||||
|
Geological & Geophysical Operations
|
180 | 123 | 720 | |||||||||
|
Exploratory Drilling Operations
|
5,153 | 5,838 | ||||||||||
|
Issachar-Zebulun Permit Area (Expired on February 23, 2011)
|
||||||||||||
|
Geological & Geophysical Operations
|
567 | 66 | 40 | |||||||||
| - | - | - | ||||||||||
|
Total
|
24,145 | 18,513 | 2,656 | |||||||||
The drilling rig and crew which we are utilizing to complete the Ma'anit-Joseph #3 well and which we also utilized to drill the Ma’anit-Rehoboth #2 well and the Elijah #3 well were obtained from Aladdin Middle East Ltd. (“AME”), a Turkish based drilling rig operator. The drilling contract that we entered into with AME in September 2008 provides for drilling on a day-work basis with payment to AME at the rate of $28,500 per drilling day and other scheduled rates for non-operating days. The contract originally provided for mobilization and de-mobilization fees of $675,000 each. Under modified terms, we paid AME $475,000 on account of mobilization fees, which is included in the cost of the well. Subsequent amendments provided that the remaining $200,000 payment was to be offset against the
amount paid by us for the drilling and no additional cash outlay was due upon mobilization. The contract, as amended, provided for a demobilization fee of $550,000, provided further that, in the event that AME enters into a drilling contract with another operator in Israel, then the demobilization fee would be reduced if and to the extent that AME receives funds from such other operator. The contract was further amended pursuant to which we provided to AME, at its request, advances in an amount equal to $550,000 as pre-payment for services under the contract, thereby releasing us from any further payment in respect of demobilization fees. AME continues to be bound to reimburse us with respect to any demobilization fee it may receive from another operator. At the conclusion of drilling operations, depending on the circumstances, the Company may recover, by reimbursement or credit, the $550,000 demobilization fee.
Budget for 2011
Our budgeted capital spending for 2011 is approximately $17,000,000. Our 2011 capital budget contemplates completing the drilling of the Ma’anit-Joseph #3 well to a depth of approximately 19,357 feet (5,900 meters) on the Joseph License and testing selected intervals (if any) that have hydrocarbon bearing potential. If we are awarded all or part of the exploration areas that we applied for in February 2011, we intend to both purchase already existing seismic data and acquire, process and integrate new seismic data. If we can reach agreement regarding the establishment of a majority owned drilling subsidiary in collaboration with a suitable rig owner, then we will establish a drilling subsidiary and purchase majority-ownership in a drilling rig. The estimate above does not include any provision
relating to the establishment of the drilling subsidiary and/or purchase of the interest in the rig.
17
The estimated capital expenditures are dependent on a number of factors, including industry conditions, being awarded further exploration areas, drilling success, capital market conditions, satisfactory negotiations with a suitable drilling rig owner and are subject to change.
Environmental Matters
Oil and gas drilling operations could potentially harm the environment if there are polluting spills caused by the loss of well control. The Petroleum Law and regulations provide that the conduct of petroleum exploration and drilling operations be pursued in compliance with “good oil field practices” and that measures of due care be taken to avoid seepage of oil, gas and well fluids into the ground and from one geologic formation to another. The Petroleum Law and regulations also require that, upon the abandonment of a well, it be adequately plugged and marked. Recently, as a condition for issuing the required permit for the construction of a drilling location, the planning commissions have required the submission of a site remediation plan, subject to approval of the environmental
authorities. The costs of future restoration and remediation can be estimated as the restoration and remediation are typical for the industry and part of “oil field best practices”. At this time, we anticipate that the future cost of the environmental requirements, site remediation and plugging will not be greater than approximately $290,000 per well drilled on either the Joseph or Asher-Menashe License. Our operations are also subject to claims for personal injury and property damage caused by the release of chemicals or petroleum substance by us or others in connection with the conduct of petroleum operations on our behalf.
On October 22, 2007, a private (non-government sponsored) bill entitled “Proposed Law for the Remediation of Polluted Lands, 5768-2007” was introduced in the Knesset (the Israeli parliament). If adopted the proposed law will provide for a regulatory regime that will require persons engaged in activities involving “dangerous materials” (which are defined to include also crude oil, natural gas and other forms of hydrocarbons produced under the Petroleum Law), including their production, treatment, handling, storage and transportation, that may affect land or water resources to prepare environmental impact statements and remediation plans either prior to commencing activities or following the occurrence of an event that may cause pollution to land or water resources or endanger public
health. Under the proposal, persons responsible, directly or indirectly, will be liable for the clean-up costs; violations of the law may result in criminal sanctions. In January 2011, a ministerial committee charged with overseeing legislation unanimously approved the draft law and sent it to the Israeli Parliament for consideration.
In December 2008, a government ministry, the Ministry of Environmental Protection, distributed for comment a proposal for enactment of new legislation under the proposed name "Prevention of Polluted Land and Treatment of Polluted Lands, 5769-2008". An identical bill was re-introduced in the Knesset on June 8, 2009 by the Ministry. If adopted, the Government sponsored proposed law will provide for a regulatory regime that will require persons engaged in activities involving “polluted materials” (which are defined to include also petroleum crude oil or any other materials defined as such by the commissioner) including their production, treatment, handling, storage and transportation, that may affect land or water resources to prepare environmental impact statements and remediation plans either
prior to commencing activities or following the occurrence of an event that may cause pollution to land or water resources or endanger public health. Under the proposal, persons responsible, directly or indirectly, will be liable for the clean-up costs; violations of the law may result in criminal sanction. We do not know and cannot predict whether any legislation in this area will be enacted and, if so, in what form and which of its provisions, if any, will relate to and affect our activities, how and to what extent nor what impact, if any, it might have on our financial statements. There are no known proceedings instituted by governmental authorities, pending or known to be contemplated against us under any environmental laws. We are not aware of any events of noncompliance in our operations in connection with any environmental laws or regulations and we are not aware of any potentially material contingencies related to environmental issues. However, we cannot predict whether any new
or amended environmental laws or regulations introduced in the future will have a material adverse effect on our future business.
18
Proposed Fuel Market Law Legislation
In January 2007, the Ministry of National Infrastructures (the “Ministry”) distributed for comment a proposal for the enactment of new legislation under the proposed name “Fuel Market Law”. Under the proposal as currently drafted, the following activities among others as they relate to crude oil and its products would require licenses by the Director of the Fuel Authority in the Ministry of National Infrastructures: import, export, refining, storage, dispensing and loading, transport, marketing and sale. Further under the proposal a condition for the receipt of a license is that the licensee be a corporation incorporated under the Israeli Companies Law. As currently drafted, the proposal does not provide for exceptions for entities holding petroleum rights under the Petroleum Law;
however, it is not certain that, even if enacted as currently proposed, the provisions of the proposed law would supersede the provisions of the Petroleum Law. We submitted comments to the Ministry with the aim of clarifying that any law to be presented for enactment clarify that the rights of holders of licenses and leases granted under the Petroleum Law will not be compromised. As of the date of the filing of this annual report on Form 10-K, no further legislative action has been taken on this particular topic.
In discussions that took place in 2007 between Zion executives and the Deputy Legal Advisor in the Ministry, we were told that, while the proposal is intended to introduce a licensing regime applicable to all participants in the fuel economy, including holders of petroleum rights, there is no intention to deprive a petroleum rights holder of its right to market and sell hydrocarbons produced under a petroleum right issued pursuant to the Petroleum Law. The Deputy Legal Advisor stated that the Ministry intended to amend the language of the proposal taking into consideration our comments and those of other interested persons. We do not know and cannot predict the results of any attempt to enact the proposed Fuel Economy Law, as currently drafted or as may be amended or, if enacted, the effect of such
law on our rights under the Petroleum Law or the results of any legal challenge to the law by a holder of a license or lease issued under the Petroleum Law.
Political Climate
Between October 2000 and the summer of 2004, there was a significant increase in violence primarily in the West Bank and the Gaza Strip, and negotiations between Israel and Palestinian representatives ceased for a period of over 30 months. Negotiations recommenced in June 2003 with the internationally sponsored "Road Map" plan, to which there is significant opposition from extremists on both sides. With the death of the former chairman of the Palestinian Authority in November 2004, violence subsided and Israel effectively completed a disengagement process in the Gaza Strip and northern Samaria. Violence further diminished with the building by Israel of the security fence between centers of Israeli and Palestinian populations. The chances for this renewed peace process cannot be predicted. This uncertainty
was heightened with the election in early 2006 of a majority of Hamas Party candidates to the Palestinian Authority parliament and the establishment of a Hamas-led government in the Palestinian Authority. In late June 2006, following a terrorist attack from Gaza on an Israeli army outpost in Israel and the kidnapping of an Israeli soldier, Israel commenced military action in Gaza. In July 2006, following the launching of rocket attacks on Israeli border villages and the killing and kidnapping of several Israeli soldiers on patrol in Israel by the Lebanese-based Hezbollah terrorist organization, Israel commenced military action aimed at returning the kidnapped soldiers and removing the Hezbollah threat from Israel's northern border. Following international diplomatic efforts and a United Nations Security Council resolution, a cease-fire was implemented in Lebanon in August 2006. In February 2007, pursuant to an arrangement sponsored by Saudi Arabia, the rival Palestinian Hamas and Fatah
parties agreed to a plan (the "Mecca Accords") pursuant to which the Hamas government agreed to resign and be replaced by a multi-party coalition government.
Following a military coup in mid-2007 by Hamas in Gaza, the multi-party coalition government formed under the Mecca Accords was disbanded and a new Fatah-led Palestinian Authority government established with effective control of the West Bank; Hamas maintains in effective control of the Gaza Strip. While shelling of Israeli settlements from Gaza continues, political dialogue between Israel and the Palestinian Authority has been restarted under the auspices of the United States and supported by the international community in the context of the regional conference convened in Annapolis, Maryland in late November 2007,in accordance with the resolutions of which direct negotiations between Israel and the Palestinian Authority commenced in January 2008 with a declared aim of reaching an agreement by early 2009.
Active hostilities between the Israel Defense Forces and the Hamas resumed in December 2008 but subsided in January 2009. Sporadic hostilities have continued since such time.
19
More recently, civil unrest, which began in Tunisia and subsequently spread to Egypt and resulted in changes in the Egyptian and Tunisian governments, has spread throughout the Middle East. There have been numerous demonstrations by protestors in several countries and territories throughout the region demanding regime change and some of the demonstrations have been marked by violence. Recently, the King of Jordan reconstituted his government after protestors demanded economic and political reforms.
Civil unrest could continue to spread throughout the region and involve other areas such as the Gaza Strip or nations such as Syria, Yemen, Lebanon or others. Such unrest, if it continues to spread or grow in intensity, could lead to civil wars or regime changes resulting in governments that are hostile to the US and/or Israel, such as has previously occurred in the region, violations of the 1979 Egypt-Israel Peace Treaty, or regional conflict.
We cannot predict the effect, if any, on our business of renewed hostilities between Israel and its neighbors or any other changes in the political climate in the area.
Employees
As of December 31, 2010, we had 23 employees, four of whom are on a part-time basis. None of our current employees are subject to any collective bargaining agreements and there have been no strikes. We regularly utilize independent consultants and contractors to perform various professional services, particularly for services connected to drilling operations, such as specialized engineering, logging, cementing and well-testing.
Foundations
If we are successful in finding commercial quantities of hydrocarbons in Israel, 6% of our gross revenues from production will go to fund two charitable foundations that we established with the purpose of donating to charities in Israel, the U.S. and elsewhere in the world.
For charitable activities concerning Israel, we established the Bnei Joseph Foundation (R.A.). On November 11, 2008, both the Articles of Association and Incorporation Certificate were certified by the Registrar of Amutot (i.e. Charitable Foundations) in Israel.
For the U.S. and worldwide charitable activities, we established the Abraham Foundation - in Geneva, Switzerland. On June 20, 2008, the Articles of Incorporation were executed and filed by the Swiss Notary in the Commercial Registrar in Geneva. On June 23, 2008, the initial organizational meeting of the founding members was convened in Israel. Regulations for the Organization of the Abraham Foundation, signed by the founding members, were then filed with the Registrar. On November 19, 2008, the Swiss Confederation approved the Foundation as an international foundation under the supervision of the federal government. On December 8, 2008, the Republic of Geneva and the Federal government of Switzerland issued a tax ruling providing complete tax exemption for the Foundation.
Our shareholders, in a resolution passed at the 2002 Annual Meeting, gave authority to the Zion Board of Directors to transfer a 3% overriding royalty interest to each of the two foundations. In accordance with that resolution, we took steps to legally donate a 3% overriding royalty interest to the Bnei Joseph Foundation (in Israel) and a 3% overriding royalty interest to the Abraham Foundation (in Switzerland).
20
On June 22, 2009, we received an official letter from the Commissioner informing us that the 3% overriding royalty interest to each of the Bnei Joseph Foundation and the Abraham Foundation had been registered in the Israeli Oil Register.
Available Information
Zion’s internet website address is “www.zionoil.com”. We make available, free of charge, on our website, under “SEC Reports”, our annual report on Form 10-K, quarterly reports on Form 10-Q, current reports on Form 8-K, Forms 3, 4 and 5 filed on behalf of directors and executive officers and amendments to those reports, as soon as reasonably practicable after providing the SEC such reports.
Our Corporate Governance Policy, the charters of the Audit Committee, the Compensation Committee and the Nominating and Governance Committee, and the Code of Ethics for directors, officers, employees and financial officers are also available on our website under “Corporate Governance” and in print to any stockholder who provides a written request to the Corporate Secretary at Zion Oil & Gas, Inc., 6510 Abrams Rd., Suite 300, Dallas, TX 75231, Attn: Corporate Secretary.
We file annual reports on Form 10-K, quarterly reports on Form 10-Q, current reports on Form 8-K, proxy statements and other documents with the SEC under the Securities Exchange Act of 1934, as amended. The public may read and copy any materials that we file with the SEC at the SEC’s Public Reference Room at 450 Fifth Street, N.W., Washington, D.C. 20549. The public may obtain information on the operation of the Public Reference Room by calling the SEC at 1-800-SEC-0330. Also, the SEC maintains an internet website that contains reports, proxy and information statements, and other information regarding issuers, including Zion Oil & Gas, Inc., that file electronically with the SEC. The public can obtain any document we file with the SEC at www.sec.gov. Information contained on or connected to our
website is not incorporated by reference into this Form 10-K and should not be considered part of this report or any other filing that we make with the SEC.
In evaluating our company, the factors described below should be considered carefully. The occurrence of one or more of these events could significantly and adversely affect our business, prospects, financial condition, results of operations and cash flows.
We are an exploration stage company with no current source of revenue. Our ability to continue in business depends upon our continued ability to obtain significant financing from external sources and the success of our exploration efforts, none of which can be assured.
We were incorporated in April 2000 and are still an exploration stage company. Our operations are subject to all of the risks inherent in exploration stage companies with no revenues or operating income. Our potential for success must be considered in light of the problems, expenses, difficulties, complications and delays frequently encountered in connection with a new business, especially the oil and gas exploration business, and in particular the deep, wildcat wells in which we are engaged in Israel. We cannot warrant or provide any assurance that our business objectives will be accomplished.
We have historically depended entirely upon capital infusions from the issuance of equity securities to provide the cash needed to fund our operations. Between June 2009 and December 2010, we raised approximately US$ 70 million in the public equity market from rights offerings of our common stock and warrants to our stockholders. However, we cannot assure you that we will be able to continue to raise funds in the public (or private) equity markets. Our ability to continue in business depends upon our continued ability to obtain significant financing from external sources and the success of our exploration efforts. Any reduction in our ability to raise equity capital in the future would force us to reallocate funds from other planned uses and could have a
significant negative effect on our business plans and operations, including our ability to continue our current exploration activities.
All of our audited financial statements since inception have contained a statement by the auditors that raises substantial doubt about us being able to continue as a "going concern" unless we are able to raise additional capital.
21
We will require substantial additional funds to drill additional wells and to realize our business plan
Our planned work program is expensive. Our current cash resources are sufficient to allow us to reach the target depth of the exploratory well that we are currently drilling (the Ma’anit-Joseph #3 well), conduct any production testing that may be required thereon, undertake additional non-drilling exploratory activities in our current license areas and in the applied for license and permit areas and otherwise meet our drilling plans through December 31, 2011. In addition, as of March 7, 2011, we have outstanding publicly traded warrants exercisable through December 31, 2012 for cash proceeds payable to us of approximately $17,800,000. Unless we receive significant proceeds during 2011 from the exercise of these publicly traded warrants (of which no assurance can be provided), we
anticipate needing to raise substantial additional capital in order to implement our multi-well drilling program and acquire a majority interest in an onshore rig. We have no commitments for any financing and no assurance can be provided that we will be able to raise funds when needed. We estimate that, when we are not actively drilling a well, our monthly expenditure is approximately $400,000 per month. However, when we are engaged in active drilling operations, as we currently are with Ma’anit Joseph #3 well, we estimate that there is an additional cost of approximately $75,000 per day (equivalent to approximately $2,250,000 per month). If there is turmoil in the credit and equity markets, then our ability to raise funds may be significant and adversely affected.
Additional financing could cause your relative interest in our assets and potential earnings to be significantly diluted (unless you participated in such financings). Even if we have exploration success, we may not be able to generate sufficient revenues to offset the cost of dry holes and general and administrative expenses.
We may not have a rig at our disposal following the completion of our currently drilled well and, unless we acquire control of a rig and/or make other appropriate arrangements, we may not be able to continue with our future drilling plans.
We anticipate that we will have reached our target drilling depth on the Ma’anit-Joseph #3 well by late April 2011, assuming we do not encounter any additional technical difficulties. Depending on a number of factors, including the results of the Ma’anit-Joseph #3 well, the decision to be taken as to whether to re-enter the Elijah #3 well and the identification of additional appropriate drilling prospects in these license areas, the drilling rig currently at our disposal may be moved out of Israel. Unless we reach an understanding with the current operators of this rig or identify and obtain access to an alternative rig, of which no assurance can be provided, we may not be able to continue with our drilling plans without substantial delay. Any delay in our drilling timetables can have a material
adverse effect on the implementation of our business plan.
Our future operations may be adversely affected by the recent changes in Israel’s current tax policy with respect to oil and gas resources.
Under Israeli law, we are required to pay royalties to the Government of Israel on the gross production of any oil and gas that we may discover in Israel. The current royalty rate to which we are subject is 12.5% of the produced reserves. To date, no proved reserves have yet been discovered on our license areas, and therefore we have not had any outstanding obligation with respect to royalty payments.
In 2010, the Finance Minister of Israel established an advisory committee to study the country’s fiscal policy as it relates to the upstream oil and natural gas sector, as well as various options, including an increase in royalties or cancellation of tax incentives. In January 2011, the Finance Ministry advisory committee issued its final recommendations which included cancellation of currently-existing tax incentives, including the depletion allowance, and imposition of a special levy ranging from 20% to 50%, on oil and gas profits after a return on investment has been achieved. The existing rate of royalties of 12.5% remained unchanged. At this time we are uncertain of the final outcome of these recommendations, which must be voted on by Israel’s Parliament, and are unable to
predict the complete economic impact any change in Israel’s fiscal regime would have on our operations or future drilling activities.
22
We are not currently in full compliance with the terms of the one of our licenses which may result in the loss or forfeiture of such license. The loss or forfeiture of such license may have an adverse effect on our business and prospects
.
We currently hold two petroleum exploration licenses, the Joseph License and the Asher-Menashe License, covering approximately 162,100 acres onshore in the State of Israel between Netanya in the south and Haifa in the north. Under the terms of the Asher-Menashe License, as extended, we were required, among other things, to identify a new drilling prospect in the Asher-Menashe License area by April 1, 2011 and sign, by May 1, 2011, a drilling contract to drill such prospect to the Permian-age geological layer. As discussed above, based on the processing, interpretation and analysis of the 2-D seismic data in the Elijah #3 project area (in the Asher-Menashe License Area), we determined that the volcanics in the Asher-Menashe License area are substantially greater (i.e., thicker and deeper) than
originally estimated. Accordingly, further engineering work is needed to determine if the Elijah #3 well can be successfully re-drilled (or should be) through this dense volcanic formation or even whether we can identify a viable drilling prospect within the Asher-Menashe License area. Currently, and since August 2010, the drilling rig available to us and all of our accompanying available drilling equipment and resources have been exclusively dedicated to reaching the Permian-age target in the Ma’anit-Joseph #3 well (in the Joseph License Area), which we expect to reach in late April 2011, assuming we do not encounter any further technical difficulties. Following the completion of the drilling of the Ma’anit-Joseph #3 well, the analysis of the well and the completion of any testing procedures that we may then deem necessary or desirable (in light of the results of our analysis), we anticipate being in a position to take the appropriate decision as to our next step in the
Asher-Menashe License area.
For the reasons noted above, we will not identify a new drilling prospect in the Asher-Menashe License area by the required date of April 1, 2011, the result of which is that we are not in full compliance with the terms of the Asher-Menashe License. In fact, the results of the Ma’anit Joseph #3 well may be determinative as to whether we will re-enter the Elijah #3 well and may inform any subsequent decision as to the identity and location of a new drilling prospect, if any, in the Asher-Menashe License area. Our partial non-compliance with the license terms could result in the loss or forfeiture of the Asher-Menashe License and may jeapordize our obtaining any subsequent rights that we may want to have in such license area. Any such development may have an adverse material effect on our business and
prospects.
Depending on the results of our current exploratory well, the Ma’anit-Joseph #3 well, we may elect to surrender some or all of the Joseph License area. We cannot, at this time, assess the effects, if any, that the loss or forfeiture of such license may have on our business or prospects
.
Our work program calls for the drilling of the Ma’anit-Joseph #3 well to a depth of approximately 19,357 feet (5,900 meters) on the Joseph License. We anticipate reaching the Permian-age target depth in late April 2011, assuming that we do not encounter any further technical difficulties. We will then select the intervals (if any) that appear to be hydrocarbon bearing and carry out testing procedures.
If we ultimately determine that the Ma’anit-Joseph #3 well does not contain any commercial quantity of hydrocarbons, we will need to decide on our subsequent activity in the Joseph License area. We may, based on these results and other factors, determine to surrender the Ma’anit Joseph License and/or request a new permit for certain of the acreage currently subject to the license so that we can undertake further geologic studies (but not drilling) in such part of the current license area that our geologists conclude contains the greatest potential for hydrocarbons. Thus, subsequent developments may lead us to surrender or abandon the Ma’anit-Joseph License and also surrender, forfeit or lose the Asher-Menashe License. Our Jordan Valley License Application is to be considered by the
Petroleum Commissioner's Committee in their March 2011 meeting. The Dead Sea License Application as well as the Zebulun Permit Application which we submitted to the Petroleum Commissioner will not be considered until Mid-Summer to late Fall of 2011 and no assurance can be provided that we will be awarded all (or any part) of these application. The loss of our exploration rights, even on a temporary basis, may have a material adverse effect on our business and prospects.
23
We rely on independent experts and technical or operational service providers over whom we may have limited control.
The success of our oil and gas exploration efforts is dependent upon the efforts of various third parties that we do not control. These third parties provide critical engineering, geological, geophysical and other scientific analytical services, including 2-D seismic imaging technology to explore for and develop oil and gas prospects. Given our small size and limited resources, we do not have all the required expertise on staff. As a result, we rely upon various companies and other third persons to assist us in identifying desirable hydrocarbon prospects to acquire and to provide us with technical assistance and services. In addition, we rely upon the owners and operators of drilling rigs and related equipment. The drilling rig and much of its crew which we are currently using to drill the
Ma’anit-Joseph #3 well and which we used to drill most of our previous exploratory wells is operated by AME, a subsidiary company of the Sayer Group.
Although we have developed relationships with AME and the Sayer Group and with a number of other third-party service providers, we cannot provide assurance that we will be able to continue to rely on such persons. If any of these relationships with third-party service providers are terminated or are unavailable on commercially acceptable terms, we may not be able to execute our business plan. Our limited control over the activities and business practices of these third parties, any inability on our part to maintain satisfactory commercial relationships with them, their limited availability or their failure to provide quality services could materially and adversely affect our business, results of operations and financial condition.
We typically commence exploration drilling operations without undertaking extensive analytical testing thereby potentially increasing the risk (and associated costs) of drilling a non-producing well.
Larger oil and gas exploration companies typically conduct extensive analytical pre drilling testing. These include 3-D seismic imaging, the drilling of an expendable “pilot” well or “stratigraphic test” to collect data (logs, cores, fluid samples, pressure data) to determine if drilling a well capable of producing oil or gas well (full completion with casing and well testing) is justified. The use of pilot or stratigraphic tests is often used in areas where there is little or no offset well data, like Israel, where our exploration license and permits areas are located. While 3-D seismic imaging data is more useful than 2-D data in identifying potential new drilling prospect, its acquisition and processing costs are many multiples greater than that for 2-D data, and GII, our
primary provider of geophysical data, has limited ability to acquire and process onshore 3-D data. In addition to using 2-D seismic technology prior to drilling, we have historically also utilized gravity and magnetic data, built cross section maps from offset wells and utilized geophysical analysis from similar geologic targets. We believe that the additional months, delays and associated costs associated with more extensive pre-drilling testing typically undertaken by larger oil and gas exploration companies is not necessarily justified when drilling vertical exploration wells (as we have historically been doing). Nonetheless, the absence of more extensive pre-drilling testing may potentially increase the risk of drilling a non-producing well, which would in turn result in increased costs and expenses. Additionally, Zion is typically engaged in drilling very deep onshore wildcat wells in Israel where only approximately 500 total wells have ever been drilled, the vast majority of
which are relatively substantially shallower. As such, exploration risks are inherently very substantial.
A substantial and extended decline in oil or natural gas prices could adversely impact our future rate of growth and the carrying value of our unproved oil & gas assets.
Prices for oil and natural gas fluctuate widely. Fluctuations in the prices of oil and natural gas will affect many aspects of our business, including our ability to attract capital to finance our operations, our cost of capital, and the value of our unproved oil and natural gas properties. Prices for oil and natural gas may fluctuate widely in response to relatively minor changes in the supply of and demand for oil and natural gas, market uncertainty and a wide variety of additional factors (such as the current political turmoil in the Middle East) that are beyond our control, such as the domestic and foreign supply of oil and natural gas, the ability of members of the Organization of Petroleum Exporting Countries to agree to and maintain oil price and production controls, technological advances affecting
energy consumption, and domestic and foreign governmental regulations. Significant and extended reductions in oil and natural gas prices could require us to reduce our capital expenditures and impair the carrying value of our assets.
24
If we are successful in finding commercial quantities of oil and/or gas, our revenues, operating results, financial condition and ability to borrow funds or obtain additional capital will depend substantially on prevailing prices for oil and natural gas. Declines in oil and gas prices may materially adversely affect our financial condition, liquidity, ability to obtain financing and operating results. Lower oil and gas prices also may reduce the amount of oil and gas that we could produce economically.
Historically, oil and gas prices and markets have been volatile, with prices fluctuating widely, and they are likely to continue to be volatile, making it impossible to predict with any certainty the future prices of oil and gas.
We may continue to recognize substantial write-downs with respect to well impairment costs.
We account for our oil and gas property costs using the full-cost method of accounting for oil and gas properties. Accordingly, all costs associated with acquisition, exploration and development of oil and gas reserves, including directly related overhead costs, are capitalized. We record an investment impairment charge when we believe an investment has experienced a decline in value that is other than temporary.
We drilled the Ma’anit-Rehoboth #2 well to a depth of 17,913 feet (5,460 meters). Our testing procedures conclusively determined in April 2010 that the well was currently incapable of producing oil and/or gas in commercial quantities, so we temporarily suspended operations on the well and have recorded a non-cash impairment charge of $22,022,000 to our unproved oil and gas properties for the quarter ending June 30, 2010.
As of January 2010, we drilled the Elijah #3 well to a depth of 10,938 feet (3,334 meters), however, as certain drill pipe became stuck in the well, the well was temporarily suspended. In June 2010, we acquired approximately 20 miles (32 kilometers) of additional field seismic data to help us to resolve certain questions regarding the geology of the area surrounding the Elijah #3 well. The Elijah #3 well remains temporarily suspended. We currently anticipate making the determination relating to the Elijah #3 well after we complete drilling the Ma’anit Joseph #3 well to the target depth, which we expect to reach in late April 2011, assuming we do not encounter additional technical difficulties. The determination relating to the Elijah #3 well will partly depend on the results from drilling
the Ma'anit-Joseph #3 well and may require us to abandon the Elijah #3 well or lead us to restart operations on it.
Abandonment of properties is accounted for as adjustments to capitalized costs. The net capitalized costs are subject to a “ceiling test,” which limits such costs to the aggregate of the estimated present value of future net revenues from proved reserves discounted at ten percent based on current economic and operating conditions, plus the lower of cost or fair market value of unproved properties. The recoverability of amounts capitalized for oil and gas properties is dependent upon the identification of economically recoverable reserves, together with obtaining the necessary financing to exploit such reserves and the achievement of profitable operations.
We review our unproved oil and gas properties periodically to determine whether they have been impaired. An impairment allowance is provided on an unproved property when we determine that the property will not be developed. Any impairment charge incurred is recorded in accumulated depletion, impairment and amortization to reduce our recorded basis in the asset.
25
The failure to obtain extensions of our existing exploration licenses would have a material adverse effect on our business and prospects.
The Asher-Menashe License had an initial three-year term which commenced on June 10, 2007 and ran through June 9, 2010. It was extended by one year to June 9, 2011 and may be extended for up to an additional three years as provided by the Petroleum Law. The license extensions are only granted in increments of a maximum of one year. The Joseph License had an initial three-year term which commenced on October 11, 2007 and ran through October 10, 2010. It was extended by one year to October 10, 2011 and may be extended for an additional three years as provided by the Petroleum Law. While we are not aware of any reason that may prevent the granting of future extensions, no assurance can be given that such extensions will be forthcoming. The Petroleum Commissioner’s refusal to extend a license, or even
delay in such extensions, can have a material adverse effect on our business and prospects.
The failure to obtain the approval of applications submitted for new exploration licenses and exploration permits would have a material adverse effect on our business and prospects
On February 17, 2011, we applied for a new license and permit covering most of the territory under our recently expired Issachar-Zebulun Permit. On or about the same time, we also filed an application for a license on areas in the vicinity of the Dead Sea. As of the filing of this report on Form 10-K, these applications are pending before the Petroleum Commissioner. No assurance can be provided that we will be awarded these applied for licenses and the permit. The Petroleum Commissioner’s refusal to award these applications can have a material adverse effect on our business and prospects.
Our lack of diversification increases the risk of an investment in us, and our financial condition and results of operations may deteriorate if we fail to diversify.
Our business focus is on oil and gas exploration on a limited number of properties in Israel. As a result, we lack diversification, in terms of both the nature and geographic scope of our business. We will likely be impacted more acutely by factors affecting our industry or the regions in which we operate than we would if our business were more diversified. If we are unable to diversify our operations, our financial condition and results of operations could deteriorate.
We currently have no proved reserves or current production and we may never have any.
We do not have any proved reserves or current production of oil or gas. We cannot assure you that any wells will be completed or produce oil or gas in commercially profitable quantities.
We have a history of losses and we cannot assure you that we will ever be profitable.
We incurred net losses of $27,658,000 for the year ended December 31, 2010, $4,424,000 for the year ended December 31, 2009, $4,018,000 for the year ended December 31, 2008, and $56,487,000 for period from April 6, 2000 (inception) to December 31, 2010. We cannot provide any assurance that we will ever be profitable.
Oil and gas exploration is an inherently risky business.
Exploratory drilling involves enormous risks, including the risk that no commercially productive oil or natural gas reservoirs will be discovered. Even when properly used and interpreted, seismic data analysis and other computer simulation techniques are only tools used to assist geoscientists in trying to identify subsurface structures and hydrocarbon indicators. They do not allow the interpreter to know conclusively if hydrocarbons are present or economically available. The risk analysis techniques we use in evaluating potential drilling sites rely on subjective judgments of our personnel and consultants. Additionally, Zion is typically engaged in drilling very deep onshore wildcat wells in Israel where only approximately 500 total wells have ever been drilled, the vast majority of which are relatively
substantially shallower. As such, exploration risks are inherently very substantial.
26
Operating hazards and uninsured risks with respect to the oil and gas operations may have material adverse effects on our operations.
Our exploration and, if successful, development and production operations are subject to all of the risks normally incident to the exploration for and the development and production of oil and gas, including blowouts, cratering, uncontrollable flows of oil, gas or well fluids, fires, pollution and other environmental and operating risks. These hazards could result in substantial losses due to injury or loss of life, severe damage to or destruction of property and equipment, pollution and other environmental damage and suspension of operations. While as a matter of practice we take out insurance against some or all of these risks, such insurance may not cover the particular hazard and may not be sufficient to cover all losses. The occurrence of a significant event adversely affecting any of the oil and gas
properties in which we have an interest could have a material adverse affect on us, could materially affect our continued operation and could expose us to material liability.
Political risks may adversely affect our operations and/or inhibit our ability to raise capital.
Our operations are concentrated in Israel and could be directly affected by political, economic and military conditions in Israel. Efforts to secure a lasting peace between Israel and its Arab neighbors and Palestinian residents have been underway since Israel became a country in 1948 and the future of these peace efforts is still uncertain.
Kibbutz Ma'anit (where we drilled our first and second wells and are currently drilling our third well) is in an area adjacent to Israeli Arab towns where anti-Israeli rioting broke out in late 2000. On December 27, 2008, Israel began a military offensive against the Hamas terrorist organization based in Gaza. (Gaza is in the South and our license areas are in the North of Israel.) Currently, a cease-fire is in effect.
In recent weeks, civil unrest, which initially began in Tunisia and then spread to Egypt, have resulted in changes in the Tunisian and Egyptian governments, has spread to other areas in the Middle East. There have been numerous demonstrations by protestors demanding a regime change in their country, and some of the demonstrations have been marked by violence. Recently, the King of Jordan reconstituted his government after protestors demanded economic and political reforms.
Civil unrest could continue to spread throughout the region and involve other areas such as the Gaza Strip or nations such as Syria, Yemen, Lebanon or others. Such unrest, if it continues to spread or grow in intensity, could lead to civil wars; regime changes resulting in governments that are hostile to the US and/or Israel, such as has previously occurred in the region; violations of the 1979 Egypt-Israel Peace Treaty; or regional conflict.
At this time, we are uncertain of the outcome of these events. However, prolonged and/or widespread regional conflict in the Middle East could have the following results, among others:
|
|
·
|
capital market reassessment of risk and subsequent redeployment of capital to more stable areas making it more difficult for us or our partners to obtain financing for potential development projects;
|
|
|
·
|
security concerns in Israel, making it more difficult for our personnel or supplies to enter or exit the country;
|
|
|
·
|
security concerns leading to evacuation of our personnel;
|
|
|
·
|
damage to or destruction of our wells, production facilities, receiving terminals or other operating assets;
|
|
|
·
|
inability of our service and equipment providers to deliver items necessary for us to conduct our operations in, resulting in delays; and
|
|
|
·
|
lack of availability of drilling rig and experienced crew, oilfield equipment or services if third party providers decide to exit the region.
|
Loss of property and/or interruption of our business plans resulting from hostile acts could have a significant negative impact on our earnings and cash flow. In addition, we may not have enough insurance to cover any loss of property or other claims resulting from these risks.
27
We face various risks associated with the trend toward increased activism against oil and gas exploration and development activities.
Opposition toward oil and gas drilling and development activity has been growing globally and is particularly pronounced in OECD countries which include the US, the UK and Israel. Companies in the oil and gas industry, such as us, are often the target of activist efforts from both individuals and non-governmental organizations regarding safety, human rights, environmental compliance and business practices. Future activist efforts could result in the following:
|
·
|
delay or denial of drilling permits;
|
|
|
·
|
shortening of lease terms or reduction in lease size;
|
|
|
·
|
restrictions on installation or operation of gathering or processing facilities;
|
|
|
·
|
restrictions on the use of certain operating practices, such as hydraulic fracturing;
|
|
|
·
|
legal challenges or lawsuits;
|
|
|
·
|
damaging publicity about us;
|
|
|
·
|
increased costs of doing business;
|
|
|
·
|
reduction in demand for our products; and
|
|
|
·
|
other adverse affects on our ability to develop our properties and expand production.
|
Our need to incur costs associated with responding to these initiatives or complying with any resulting new legal or regulatory requirements resulting from these activities that are substantial and not adequately provided for, could have a material adverse effect on our business, financial condition and results of operations.
Economic risks may adversely affect our operations and/or inhibit our ability to raise additional capital.
Economically, our operations in Israel may be subject to:
|
|
·
|
exchange rate fluctuations;
|
|
|
·
|
royalty and tax increases and other risks arising out of Israeli State sovereignty over the mineral rights in Israel
and its taxing authority; and
|
|
|
·
|
changes in Israel's economy that could cause the legislation of oil and gas price controls.
|
Consequently, our operations may be substantially affected by local economic factors beyond our control, any of which could negatively affect our financial performance and prospects.
Legal risks could negatively affect Zion’s value.
Legally, our operations in Israel may be subject to:
|
|
·
|
changes in the Petroleum Law resulting in modification of license and permit rights;
|
|
|
·
|
adoption of new legislation relating to the terms and conditions pursuant to which operations in the energy sector may be conducted;
|
|
|
·
|
changes in laws and policies affecting operations of foreign-based companies in Israel; and
|
|
|
·
|
changes in governmental energy and environmental policies or the personnel administering them.
|
The Israeli Ministry of National Infrastructures is considering proposed legislation relating to licensing requirements for entities engaged in the fuel sector that, if adopted as currently proposed, may result in our having to obtain additional licenses to market and sell hydrocarbons that may be discovered by us. We have been advised by the Ministry that they do not intend to deprive a holder of petroleum rights under the Petroleum Law of its right under that law to sell hydrocarbons discovered and produced under its petroleum rights. See “BUSINESS—Proposed Legislation” at page 19. We cannot now predict whether or in what form the proposed legislation may be adopted or, if adopted, its possible impact on our operations.
28
Further, in the event of a legal dispute in Israel, we may be subject to the exclusive jurisdiction of Israeli courts or we may not be successful in subjecting persons who are not United States residents to the jurisdiction of courts in the United States, either of which could adversely affect the outcome of a dispute.
The Ministry of Environmental Protection is considering proposed legislation relating to polluted materials, including their production, treatment, handling, storage and transportation, that may affect land or water resources. Persons engaged in activities involving these types of materials will be required to prepare environmental impact statements and remediation plans either prior to commencing activities or following the occurrence of an event that may cause pollution to land or water resources or endanger public health. See “BUSINESS—Environmental Matters” at page 18. We do now know and cannot predict whether any legislation in this area will be enacted and, if so, in what form and which of its provisions, if any, will relate to and affect our activities, how and to
what extent.
Our petroleum rights (including licenses and permits) could be canceled, terminated or not extended, and we would not be able to successfully execute our business plan.
Any license or other petroleum right we hold or may be granted is granted for fixed periods and requires compliance with a work program detailed in the license or other petroleum right. If we do not fulfill the relevant work program due to inadequate funding or for any other reason, the Israeli government may terminate the license or any other petroleum right before its scheduled expiration date. No assurance can be provided that we will be able to obtain an extension to this if in fact we are unable to begin drilling by such date.
There are
limitations on the transfer of interests in our petroleum rights, which could impair our ability to raise additional funds to execute our business plan
.
The Israeli government has the right to approve any transfer of rights and interests in any license or other petroleum right we hold or may be granted and any mortgage of any license or other petroleum rights to borrow money. If we attempt to raise additional funds through borrowings or joint ventures with other companies and are unable to obtain required approvals from the government, the value of your investment could be significantly diluted or even lost.
Our dependence on the limited contractors, equipment and professional services available in Israel may result in increased costs and possibly material delays in our work schedule
.
Due to the lack of competitive resources in Israel, costs for our operations may be more expensive than costs for similar operations in other parts of the world. We are also more likely to incur delays in our drilling schedule and be subject to a greater risk of failure in meeting our required work schedule. Similarly, some of the oil field personnel we need to undertake our planned operations are not necessarily available in Israel or available on short notice for work in Israel. Any or all of the factors specified above may result in increased costs and delays in the work schedule.
Our dependence on Israeli local licenses and permits may require more funds than we have budgeted and may cause delays in our work schedule.
In connection with drilling operations, we are subject to a number of Israeli local licenses and permits. Some of these are issued by the Israeli security forces, the Civil Aviation Authority, the Israeli Water Commission, the Israel Lands Authority, the holders of the surface rights in the lands on which we intend to conduct drilling operations, including Kibbutz Ma'anit, Kibbutz Ein Carmel, local and regional planning commissions and environmental authorities.
29
The surface rights to the drill site on which we are drilling the Ma’anit- Joseph #3 well are held under a long-term lease by Kibbutz Ma'anit. The rights are owned by the State of Israel and administered by the Israel Lands Authority. Permission has been granted to Zion by both Kibbutz Ma'anit and the Israel Lands Authority for the use of the surface rights.
The surface rights to the drill site of the Elijah #3 well are held under a long-term lease by Kibbutz Ein Carmel. The rights are owned by the State of Israel and administered by the Israel Lands Authority. Permission has been granted to Zion by both Kibbutz Ein Carmel and the Israel Lands Authority for the use of the surface rights.
In the event of a commercial discovery and depending on the nature of the discovery and the production and related distribution equipment necessary to produce and sell the discovered hydrocarbons, we will be subject to additional licenses and permits, including from various departments in the Ministry of National Infrastructures, regional and local planning commissions, the environmental authorities and the Israel Lands Authority. If we are unable to obtain some or all of these permits or the time required to obtain them is longer than anticipated, we may have to alter or delay our planned work schedule, which would increase our costs.
If we are successful in finding commercial quantities of oil and/or gas, our operations will be subject to laws and regulations relating to the generation, storage, handling, emission, transportation and discharge of materials into the environment, which can adversely affect the cost, manner or feasibility of our doing business. Many Israeli laws and regulations require permits for the operation of various facilities, and these permits are subject to revocation, modification and renewal. Governmental authorities have the power to enforce compliance with their regulations, and violations could subject us to fines, injunctions or both.
If compliance with environmental regulations is more expensive than anticipated, it could adversely impact the profitability of our business.
Risks of substantial costs and liabilities related to environmental compliance issues are inherent in oil and gas operations. It is possible that other developments, such as stricter environmental laws and regulations, and claims for damages to property or persons resulting from oil and gas exploration and production, would result in substantial costs and liabilities. This could also cause our insurance premiums to be significantly greater than anticipated. See “BUSINESS – Environmental Matters” at page 18.
Earnings will be diluted due to charitable contributions and key employee incentive plan.
We are legally bound to fund in the form of a royalty interest or equivalent net operating profits interest, 6% of our gross sales revenues, if any, to two charitable foundations. In addition, we may allocate 1.5% royalty interest or equivalent net operating profits interest to a key employee incentive plan designed as bonus compensation over and above our executive compensation payments. This means that the total royalty burden on our property (including the government royalty of 12.5%) may be up to 20% of gross revenue. As our expenses increase with respect to the amount of sales, these donations and allocation could significantly dilute future earnings and, thus, depress the price of the common stock.
The exercise of currently outstanding warrants and options or an offering under our shelf registration statement may adversely affect the market price of our common stock.
In connection with our Follow On Public Offering which we completed in January 2009, we issued warrants (trading on the NASDAQ Global Market under the symbol ZNWAW) to purchase up to 666,343 shares of our common stock at a per share exercise price of $7.00, exercisable through January 31, 2012. The shares underlying these warrants have been registered and, accordingly, any shares issued upon the exercise of these warrants will be immediately resalable on the open market. As of March 7, 2011, warrants (trading under the symbol ZNWAW) for 506,079 shares of our common stock were outstanding.
30
In connection with our Rights Offering which we completed on December 15, 2010, we issued warrants (trading on the NASDAQ Global Market under the symbol ZNWAZ) to purchase up to 3,642,821 shares of our common stock at a per share exercise price of $4.00, exercisable through December 31, 2012. The shares underlying these warrants have been registered and, accordingly, any shares issued upon the exercise of these warrants will be immediately resalable on the open market. As of March 7, 2011, warrants (trading with the symbol ZNWAZ) for 3,567,561 shares of our common stock are outstanding.
Additionally, as of March 7, 2011, we had employee stock options outstanding to purchase 737,665 shares of common stock at prices ranging between $0.01 and $8.25 per share.
The exercise or possibility of exercise of outstanding warrants and employee stock options, or any offering under the S-3 shelf registration statement that we may complete, could have an adverse effect on the market price for our common stock, and you may experience dilution to your holdings.
Cash dividends will not be paid to shareholders for the foreseeable future.
You may receive little or no cash or stock dividends on your shares of common stock. The board of directors has not directed the payment of any dividend, does not anticipate paying dividends on the shares for the foreseeable future and intends to retain any future earnings to the extent necessary to develop and expand our business. Payment of cash dividends, if any, will depend, among other factors, on our earnings, capital requirements, and the general operating and financial condition, and will be subject to legal limitations on the payment of dividends out of paid-in capital.
Our stock price and trading volume may be volatile, which could result in losses for our stockholders.
The equity trading markets may experience periods of volatility, which could result in highly variable and unpredictable pricing of equity securities. The market for our common stock could change in ways that may or may not be related to our business, our industry or our operating performance and financial condition. In addition, the trading volume in our common stock may fluctuate and cause significant price variations to occur. Some of the factors that could negatively affect our share price or result in fluctuations in the price or trading volume of our common stock include:
|
|
•
|
actual or anticipated quarterly variations in our operating results,
|
|
|
•
|
changes in expectations as to our future financial performance or changes in financial estimates, if any,
|
|
|
•
|
announcements relating to our business or the business of our competitors,
|
|
|
•
|
conditions generally affecting the oil and natural gas industry,
|
|
|
•
|
the success of our operating strategy, and
|
|
|
•
|
the operating and stock performance of other comparable companies.
|
Many of these factors are beyond our control, and we cannot predict their potential effects on the price of our common stock. In addition, the stock market is subject to extreme price and volume fluctuations. This volatility has had a significant effect on the market price of securities issued by many companies for reasons unrelated to their operating performance and could have the same effect on our common stock.
No assurance can be provided that you will be able to resell your shares of common stock at or above the price you acquired those shares in this offering. We cannot assure you that the market price of our common stock will increase to the per share price at which the Unit was offered or that the market price of common stock will not fluctuate or decline significantly.
31
Future sales of our common stock may adversely affect the prevailing market price for our common stock.
We are authorized to issue up to 50,000,000 shares of common stock, of which there were 25,043,078 shares of our common stock outstanding as of March 7, 2011. An additional 4,979,758 shares of common stock have been reserved for issuance upon the exercise of outstanding warrants and options previously issued, including the warrants issued in connection with our follow-on public offering which terminated on January 9, 2009 and our most recent rights offering which we completed in December 2010. The exercise of these warrants and/or the issuance of additional shares of our common stock in connection with the above would dilute the interest in our company represented by each share of common stock and may adversely affect the prevailing
market price of our common.
As of the date of this filing, we have no unresolved comments from the staff of the SEC.
Oil and Gas Interests
Our current oil and gas interests consist of two petroleum exploration licenses, the Joseph License and the Asher Menashe License, covering approximately 162,100 acres onshore in the State of Israel between Netanya in the south and Haifa in the north. In August 2009, we were awarded a preliminary exclusive petroleum exploration permit on an additional approximately 165,000 acres onshore Israel. The Issachar-Zebulun Permit allowed us to conduct, on an exclusive basis through its scheduled expiration date of February 23, 2011, preliminary investigations to ascertain the prospects for discovering petroleum in the area covered by the permit. Unlike a license area, where test drilling may take place, no test drilling is allowed on a permit area. As noted above, in February 2010, we submitted
applications to the Petroleum Commissioner for exploration rights with respect to substantially all of the acreage subject to the expired permit.
The table below summarizes certain data for our license areas for the year ended December 31, 2010:
|
Type of Right
|
Name
|
Area (Acres)
|
Working Interest
|
Expiration Date
|
|||||||
|
License
|
Asher-Menashe
|
78,824 | 100%(1) |
June 9, 2011(2) (3)
|
|||||||
|
License
|
Joseph
|
83,272 | 100%(1) |
October 10, 2011(2) (3)
|
|||||||
(1) All of the rights are subject to a 12.5% royalty interest due to the government of Israel under the Petroleum Law. Zion has also donated the equivalent of a 6% royalty interest (or equivalent net operating profits interest) to two foundations. In addition, Zion may allocate a 1.5% royalty interest (or equivalent net operating profits interest) to a key employee incentive plan that may be established.
(2) Extendable for periods of up to a total of seven years in all, subject to compliance with the terms of the license as may be amended.
(3) Declaration of a commercial discovery during the license term, as may in certain circumstances be extended for two years to define the boundaries of the field, will entitle Zion to receive a 30-year lease (extendable for up to an additional 20 years - 50 years in all) subject to compliance with a field development work program and production.
Surface Rights
The surface rights to the drill site on which we are drilling the Ma’anit- Joseph #3 well are held under a long-term lease by Kibbutz Ma'anit. The rights are owned by the State of Israel and administered by the Israel Lands Authority. Permission has been granted to Zion by both Kibbutz Ma'anit and the Israel Lands Authority for the use of the surface rights.
32
The surface rights to the drill site of the Elijah #3 well are held under a long-term lease by Kibbutz Ein Carmel. The rights are owned by the State of Israel and administered by the Israel Lands Authority. Permission has been granted to Zion by both Kibbutz Ein Carmel and the Israel Lands Authority for the use of the surface rights.
Summary of Exploration Activities/ Present Activities
To date, we have drilled two exploratory wells in the Joseph License area. The first exploratory well, the Ma’anit #1 well, was drilled to a depth of 15,842 feet (4,829 meters) to the Triassic-age formation. We determined that the well was incapable of producing oil and/or gas in commercial quantities and in June 2007 we abandoned the well. In 2009, we drilled an additional well (the Ma’anit-Rehoboth #2 well), ‘directionally’ to a depth of 17,913 feet (5,460 meters). The Ma’anit-Rehoboth #2 well penetrated a number of geologic formations that were preliminarily deemed to have hydrocarbon potential. However, in April 2010, following the completion of testing procedures, we determined that commercial quantities of hydrocarbons were not present in the Ma'anit-Rehoboth
#2 well and, accordingly, we suspended drilling operations in that well.
As the Ma'anit-Rehoboth #2 well did not reach the Permian-age geological formation beneath the Joseph license area, in August 2010 we commenced drilling the third exploratory well in the Joseph License area, the Ma’anit-Joseph #3 well. The Ma'anit-Joseph #3 well is planned to test the Permian-age geological formation, at approximately 19,357 feet (5,900 meters), and drilling operations on this well are expected to continue through late April 2011, assuming that we do not encounter any further technical difficulties. As of March 10, 2011, the drilling of the Ma'anit-Joseph #3 well had reached a depth of approximately 14,400 feet (4,389 meters). We anticipate reaching the drilling target depth by late April 2011.
In the Asher-Menashe License area, we have partly completed one exploratory well, the Elijah #3 well, which we commenced drilling in October 2009 toward the Triassic geological formation, which we estimated was below approximately 10,000 feet (3,048 meters). As of January 15, 2010, we had drilled to a depth of 10,938 feet (3,334 meters). In early February 2010, we temporarily suspended drilling operations in the well following our unsuccessful efforts to retrieve a stuck pipe, pending further analysis of the situation. In addition, in June 2010, the Geophysical Institute of Israel (GII), on behalf of Zion, acquired approximately 15 miles (25 kilometers) of 2-D seismic data within the Elijah #3 project area. Analysis of the newly acquired data helped us to redefine the geologic model of the area and
indicated that the Asher volcanic section is likely substantially greater (i.e. thicker and deeper) than originally predicted. Further engineering work is needed to determine if the Elijah #3 well can be successfully re-drilled through this unexpectedly more extensive volcanic section.
To help us identify potential drilling prospects within the previous Issachar-Zebulun Permit area, in June 2010, we acquired an additional 2-D seismic line approximately 19 miles (approximately 30 kilometers) in length in the Jordan Valley region and the data was processed and integrated into our geological database by our geologists. We identified various areas of potential for further exploration activity. As discussed above, in February 2011 we applied for both a license on part of the previous Issachar-Zebulun Permit area and a new permit application for substantially the remainder of the area covered by the previous Issachar-Zebulun Permit.
Office Properties
We lease approximately 3,600 square feet of office space in Dallas under a lease which expires on October 31, 2011. The monthly rent was $4,000 for the twelve-month period ending October 31, 2008, $4,500 for the twelve-month period ending October 31, 2009 and $4,600 for the twelve-month period ending October 31, 2010 and is $4,700 for the twelve-month period ending October 31, 2011.
In July 2005, we entered into a rental agreement for office premises in the industrial area of Caesarea, Israel. The rental was for a six-month period commencing August 1, 2005 with two additional three-month option periods at a monthly rental cost of $3,000. We subsequently extended the rental agreement through January 31, 2009, and then exercised the option to extend the lease for two additional periods of six months each (through January 31, 2010). We have subsequently entered into an additional six month rental period, with two additional six-month option periods available through April 30, 2011. The monthly rental cost during this extended period continues at $3,000.
33
In December 2010, we entered into a sublease agreement for the lease of office premises in Caesarea, Northern Industrial Park, Israel. The sublease agreement provides for the rental of approximately 5,500 square feet in an office building. The sublease term is scheduled to begin on April 3, 2011 and continue through March 31, 2014. Notwithstanding the foregoing, the sublease agreement term is expressly subject to the primary lease agreement that the sub lessor has with the landlord of the premises and such sublease lease agreement term will expire upon the termination, for whatever reason, of the primary lease. In addition, under the sublease agreement, at the end of the initial 12 months of the sublease term, either the sub lessor or we, may, at its sole discretion upon the furnishing to the other of
written notice within seven days after the end of the initial 12 month period, terminate the sublease agreement, whereupon we will be required to vacate the subleased premises within six months of the giving of such notice. The right to terminate early as described above shall also inure to each of us and the sub-lessor at the end of each of the 18
th
and 24
th
month following the commencement of the sublease lease agreement term. Under the sublease agreement, we are authorized to further sublease all or part of the subleased premises to a third party that is pre-approved by the Sub-lessor.
Rent is to be paid on a monthly basis in the base amount of approximately NIS 28,600 per month (approximately $8,000 per month at the exchange rate in effect on the date of this report). We are also obligated to pay all cost of living adjustments, as well as its pro-rated portion of all taxes, utilities, insurance and maintenance payments during the sublease term.
In March 2010, we leased approximately 500 square feet of office space in State College, Pennsylvania for its President and Chief Operating Officer. The initial lease was for 12 months and expired at the end of February 2011. The monthly rental amount was $525. In February 2011, the lease was extended by 12 months to the end of February 2012 and the monthly rental amount was increased to $550.
We are involved in various legal proceedings in the ordinary course of business. These proceedings are subject to the uncertainties inherent in any litigation. We are defending ourselves vigorously in all such matters and we do not believe that the ultimate disposition of such proceedings will have a material adverse effect on our financial position, results of operations or cash flows.
|
ITEM 5.
|
MARKET FOR THE REGISTRANT'
S
COMMON EQUITY, RELATED STOCKHOLDER MATTERS AND ISSUER PURCHASES OF EQUITY SECURITIES
|
We completed the initial public offering of our common stock in January 2007. From January 3, 2007 and through September 1, 2009, shares of our common stock were traded on the NYSE Amex under the symbol “ZN”. Since September 2, 2009, our common stock has been trading on the NASDAQ Global Market, also under the symbol “ZN”.
34
The following table sets forth the high and low sales prices for the Common Stock for the periods indicated, as reported by the NYSE Amex and the NASDAQ Global Market.
|
Fiscal Year
|
High
|
Low
|
||||||
|
2010:
|
||||||||
|
First Quarter
|
$ | 7.39 | $ | 4.95 | ||||
|
Second Quarter
|
7.24 | 4.91 | ||||||
|
Third Quarter
|
6.44 | 4.40 | ||||||
|
Fourth Quarter
|
5.42 | 4.54 | ||||||
|
Fiscal Year
|
High
|
Low
|
||||||
|
2009:
|
||||||||
|
First Quarter
|
$ | 17.03 | $ | 6.50 | ||||
|
Second Quarter
|
11.74 | 7.00 | ||||||
|
Third Quarter
|
13.30 | 7.08 | ||||||
|
Fourth Quarter
|
10.71 | 6.12 | ||||||
The closing per share sales price of our Common Stock on March 14, 2011 was $4.95.
Holders
As of March 14, 2011 there were approximately 4,229 shareholders of record of our common stock. A significant number of shares of our Common Stock are held in either nominee name or street name brokerage accounts and, consequently, we are unable to determine the number of beneficial owners of our stock.
Dividends
We have never paid dividends on our common stock and do not plan to pay dividends on the common stock in the foreseeable future. Whether dividends will be paid in the future will be in the discretion of our board of directors and will depend on various factors, including our earnings and financial condition and other factors our board of directors considers relevant. We currently intend to retain earnings to develop and expand our business.
Issuer Purchases of Equity Securities
We do not have a stock repurchase program for our common stock.
Performance Graph
The following graph presents a comparison of the yearly percentage change in the cumulative total return on our common stock over the period from January 3, 2007, the date our common stock was first publicly traded at an Initial Public Offering (IPO) price of $7.00 per share of common stock, to December 31, 2010, with the cumulative total return of the S&P 500 index and the Dow Jones US Oil & Gas Explorers Index (IEO) over the same period. The graph assumes that $100 was invested on January 3, 2007 in our common stock at the $7.00 IPO price and in each of the other two indices.
This historic stock price performance is not necessarily indicative of future stock performance.
35
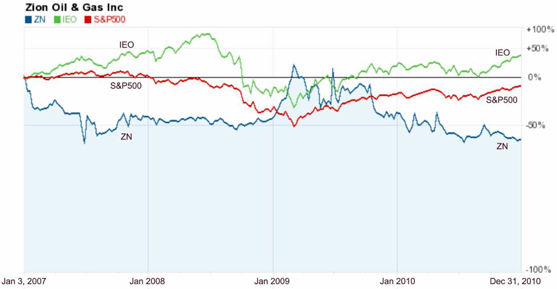
|
S&P 500
|
US Oil & Gas
Explorers
Index
|
Zion Oil & Gas
|
||||||||||
|
January 3, 2007
|
$ | 100 | $ | 100 | $ | 100 | ||||||
|
December 31, 2007
|
$ | 103.65 | $ | 144.67 | $ | 95.57 | ||||||
|
December 31, 2008
|
$ | 63.76 | $ | 84.03 | $ | 92.71 | ||||||
|
December 31, 2009
|
$ | 78.72 | $ | 118.55 | $ | 102.14 | ||||||
|
December 31, 2010
|
$ | 88.78 | $ | 140.64 | $ | 68.29 | ||||||
The performance graph and the information contained in this section is not “soliciting material,” is being “furnished,” not “filed” with the SEC and is not to be incorporated by reference into any of our filings under the Securities Act or the Exchange Act, whether made before or after the date hereof, and irrespective of any general incorporation language contained in such filing.
The following selected financial data should be read in conjunction with the financial statements and the notes thereto and the information contained in Item 7, “Management’s Discussion and Analysis of Financial Condition and Results of Operations.” Historical results are not necessarily indicative of future results. The selected financial data for the years ended December 31, 2007 and 2006 and at December 31, 2008, 2007 and 2006 are derived from our audited financial statements not included in this report. All data is in thousands, except share data:
36
|
2010
|
2009
|
2008
|
2007
|
2006
|
Period from
April 6, 2000
(inception) to
December 31,
2010
|
|||||||||||||||||||
|
Statement of Operations Data
|
||||||||||||||||||||||||
|
Revenues
|
— | — | — | — | — | — | ||||||||||||||||||
|
General and administrative expenses
|
||||||||||||||||||||||||
|
Legal and professional
|
895 | 861 | 1,015 | 1,209 | 875 | 6,850 | ||||||||||||||||||
|
Salaries
|
2,393 | 2,360 | 1,663 | 1,337 | 1,108 | 10,461 | ||||||||||||||||||
|
Other
|
2,366 | 1,344 | 1,397 | 1,074 | 475 | 7,364 | ||||||||||||||||||
|
Impairment of unproved oil and gas properties
|
22,022 | 0 | 0 | 9,494 | 0 | 31,516 | ||||||||||||||||||
|
Loss from operations
|
(27,676 | ) | (4,565 | ) | (4,075 | ) | (13,114 | ) | (2,458 | ) | (56,191 | ) | ||||||||||||
|
Loss before Income taxes
|
(27,658 | ) | (4,424 | ) | (4,018 | ) | (12,909 | ) | (2,510 | ) | (56,487 | ) | ||||||||||||
|
Net loss
|
(27,658 | ) | (4,424 | ) | (4,018 | ) | (12,909 | ) | (2,510 | ) | (56,487 | ) | ||||||||||||
|
Net loss per share of Common Stock
|
(1.29 | ) | (0.37 | ) | (0.36 | ) | (1.33 | ) | (0.32 | ) | (5.38 | ) | ||||||||||||
|
Balance Sheet Data
|
||||||||||||||||||||||||
|
Cash and cash equivalents
|
21,243 | 20,734 | 1,726 | 4,590 | 3,370 | - | ||||||||||||||||||
|
Unproved Oil&Gas properties
|
25,882 | 23,759 | 5,246 | 2,590 | 8,496 | - | ||||||||||||||||||
|
Current Liabilities
|
2,595 | 2,601 | 1,827 | 874 | 1,369 | - | ||||||||||||||||||
|
Total Liabilities
|
2,934 | 2,786 | 2,121 | 1,495 | 2,485 | - | ||||||||||||||||||
|
Stockholders equity
|
46,369 | 43,439 | 5,555 | 5,926 | 9,619 | - | ||||||||||||||||||
37
Introduction
THE FOLLOWING DISCUSSION AND ANALYSIS SHOULD BE READ IN CONJUNCTION WITH ITEM 6. SELECTED FINANCIAL DATA” AND OUR ACCOMPANYING FINANCIAL STATEMENTS AND THE NOTES TO THOSE FINANCIAL STATEMENTS INCLUDED ELSEWHERE IN THIS ANNUAL REPORT. SOME OF OUR DISCUSSION IS FORWARD-LOOKING AND INVOLVE RISKS AND UNCERTAINTIES. FOR INFORMATION REGARDING FACTORS THAT COULD HAVE A MATERIAL ADVERSE EFFECT ON OUR BUSINESS, REFER TO RISK FACTORS UNDER THE “DESCRIPTION OF BUSINESS” SECTION ABOVE.
Overview
Zion Oil is an initial stage oil and gas exploration company with a history of over 10 years of oil and gas exploration in Israel. We currently have no revenues or operating income and we are classified as an "exploration stage" company.
We are headquartered in Dallas, Texas, have an engineering satellite office in Pennsylvania and a field office in Caesaria, Israel.
The Company currently holds two petroleum exploration licenses, named the “Joseph License” and the “Asher-Menashe License”, covering approximately 162,100 acres of land onshore Northern Israel. To date, we have completed drilling two exploratory wells and are currently drilling our third exploratory well in the Joseph License area and have partly completed drilling one exploratory well in the Asher-Menashe License area.
In February 2011, we submitted to the Petroleum Commissioner applications for two additional exploration licenses and an application for a preliminary exploration permit. One of the license applications and the application for the preliminary exploration permit cover substantially all of the area covered by our previous Issachar-Zebulun Permit, which expired on February 23, 2011. We named one license application (with respect to part of the previous Issachar-Zebulun Permit) the Jordan Valley License Application and the preliminary exploration permit (applied for with respect to substantially the balance of such area) the Zebulun Permit. We named the other license application the Dead Sea License Application as it relates to areas within the vicinity of the Dead Sea. We anticipate that the Jordan Valley
License Application will be considered by the Petroleum Commissioner in March 2011 and both the Zebulun Permit Application and Dead Sea License Application in mid-Summer to Fall of 2011. No assurance can be provided that our license and permit applications will ultimately be granted.
Our work program calls for the drilling of the Ma’anit-Joseph #3 well to a depth of approximately 19,357 feet (5,900 meters) on the Joseph License. We anticipate reaching the Permian-age target depth in late April 2011, assuming that we do not encounter any further technical difficulties. We will then test select intervals (if any) that have hydrocarbon bearing potential. Depending on the results, we may then need to drill an offset appraisal well to the Ma’anit-Joseph #3 well. As of March 10, 2011, the drilling of the Ma'anit-Joseph #3 well had reached a depth of approximately 14,400 feet (4,389 meters).
Financing Activities
To date, we have funded our operations through the issuance of our securities. Our recent financings are discussed below.
Between October 24, 2008 and January 9, 2009, we raised from a follow-on public offering gross proceeds of $6,663,000 from the sale of units of our securities, of which $240,000 was for debt conversion. Each unit offered in the follow-on offering consisted of (i) one share of common stock, par value $.01 per share and (ii) one warrant to purchase one share of common stock at a per share exercise price equal to $7.00.
38
In June 2009, we raised gross proceeds of $21 million from a rights offering to common stockholders of up to 4.2 million shares of our common stock. The rights offering was fully subscribed, resulting in our distribution of all of the 4.2 million shares that were offered.
In November 2009, we raised an additional $18 million from a rights offering to common stockholders of up to 3.6 million shares of our common stock. The rights offering was fully subscribed, resulting in our distribution of all of the 3.6 million shares that were offered.
In July 2010, utilizing a shelf registration statement, we raised approximately $12.4 million from rights offering to common stockholders of up to 10 million shares of our common stock. The rights offering resulted in our distribution of 2,471,117 shares.
In December 2010, utilizing the shelf registration statement, we raised an approximately $18.2 million from a fourth rights offering to common stockholders of up to 3,820,391 shares of our common stock and warrants to purchase an additional 3,820,391 shares of our common stock. The rights offering was subscribed for a total of 3,642,821 shares of our common stock and warrants to purchase an additional 3,642,821 shares of our common stock.
Between January 1, 2011 and March 2011, we raised approximately $402,400 from the exercise of our publicly traded warrants trading under the symbol ZNWAW that we previously issued to investors in connection with our follow-on-public offering which we completed in January 2009. We reduced the exercise price of these warrants, for a limited time period extending from January 3, 2011 through March 7, 2011, to $4 (from an original per share exercise price of $7). In addition, between January 1, 2011 to March 7, 2011, we raised an additional $301,040 from the exercise of the $4 warrants that we issued in December 2010 in connection with our last completed rights offering that trade under the symbol ZNWAZ.
Principal Components of our Cost Structure
Our operating and other expenses primarily consist of the following:
|
·
|
Impairment of Unproved oil and gas properties: Impairment expense is recognized if a determination is made that a well will not be able to be commercially productive. The amounts include amounts paid in respect of the drilling operations as well as geological and geophysical costs and various amounts that were paid to Israeli regulatory authorities.
|
|
·
|
General and Administrative Expenses: Overhead, including payroll and benefits for our corporate staff, costs of managing our exploratory operations, audit and other professional fees, and legal compliance are included in general and administrative expense. General and administrative expense also includes non-cash stock-based compensation expense, investors relations related expenses, lease and insurance and related expenses.
|
|
·
|
Depreciation, Depletion, Amortization and Accretion
.
The systematic expensing of the capital costs incurred to explore for natural gas and oil. As a full cost company, we capitalize all costs associated with our exploration, and apportion these costs to each unit of production, if any, through depreciation, depletion and amortization expense. As we have yet to have production, the costs of abandoned wells are written off immediately versus being included in this amortization pool.
|
Our financial statements have been prepared on a going concern basis, which contemplates realization of assets and liquidation of liabilities in the ordinary course of business. Since we are in the development stage, we have limited capital resources, no revenue to date and a loss from operations. The appropriateness of using the going concern basis is dependent upon our ability to obtain additional financing or equity capital and, ultimately, to achieve profitable operations. The uncertainty of these conditions in the past has raised substantial doubt about our ability to continue as a going concern. The financial statements do not include any adjustments that might result from the outcome of this uncertainty.
39
Critical Accounting Policies
Management's discussion and analysis of financial condition and results of operations is based upon our consolidated financial statements, which have been prepared in accordance with accounting principles generally accepted in the United States of America. The preparation of these financial statements requires management to make estimates and assumptions that affect the reported amounts of assets and liabilities and the disclosure of contingent assets and liabilities at the date of the financial statements and the reported amounts of revenues and expense during the reporting period.
We have identified the accounting principles which we believe are most critical to the reported financial status by considering accounting policies that involve the most complex of subjective decisions or assessment.
We follow the full-cost method of accounting for oil and gas properties. Accordingly, all costs associated with acquisition, exploration and development of oil and gas reserves, including directly related overhead costs, are capitalized.
All capitalized costs of oil and gas properties, including the estimated future costs to develop proved reserves, are amortized on the unit-of-production method using estimates of proved reserves. Investments in unproved properties and major development projects are not amortized until proved reserves associated with the projects can be determined or until impairment occurs. If the results of an assessment indicate that the properties are impaired, the amount of the impairment is included in income from continuing operations before income taxes and the adjusted carrying amount of the unproved properties is amortized on the unit-of-production method.
The Company’s oil and gas property represents an investment in unproved properties and two major development projects on that property. These costs are excluded from the amortized cost pool until proved reserves are found or until it is determined that the costs are impaired. All costs excluded are reviewed at least quarterly to determine if impairment has occurred. The amount of any impairment is charged to expense since a reserve base has not yet been established. A further impairment requiring a charge to expense may be indicated through evaluation of drilling results, relinquishing drilling rights or other information, but has not occurred since July 2007.
Abandonment of properties is accounted for as adjustments to capitalized costs. The net capitalized costs are subject to a “ceiling test” which limits such costs to the aggregate of the estimated present value of future net revenues from proved reserves discounted at ten percent based on current economic and operating conditions, plus the lower of cost or fair market value of unproved properties. The recoverability of amounts capitalized for oil and gas properties is dependent upon the identification of economically recoverable reserves, together with obtaining the necessary financing to exploit such reserves and the achievement of profitable operations.
In June 2007, following the analysis of the results of the testing of our Ma’anit #1 well workover and an evaluation of the mechanical condition of the well, we determined that the well was incapable of producing oil and/or gas in commercial quantities. In order to optimize drilling operations on the Company’s planned Ma’anit-Rehoboth #2 well, we ceased operations on the Ma’anit #1 well and, as required by the Petroleum Law, formally relinquished the Ma’anit-Joseph License. As planned, we used the Ma’anit #1 wellbore, down to approximately 9,842 feet (3,000 meters), as the upper part of the wellbore for the Ma’anit-Rehoboth #2 well. As a result of the abandonment of the Ma’anit #1 well and formal relinquishment of the
Ma’anit-Joseph License, the Company recorded in June 2007 an impairment of $9,494,000 to its unproved oil and gas properties.
We ultimately drilled the Ma’anit-Rehoboth #2 well to a depth of 17,913 feet (5,460 meters). Our testing procedures conclusively determined in April 2010 that the well was at the time incapable of producing oil and/or gas in commercial quantities, so we temporarily suspended operations on the well and recorded a non-cash impairment charge of $22,022,000 to our unproved oil and gas properties for the quarter ending June 30, 2010.
40
We record a valuation allowance to reduce our deferred tax asset to the amount that we believe, is likely to be realized in the future. In assessing the need for the valuation allowance we have considered not only future taxable income but also feasible and prudent tax planning strategies. In the event that we were to determine that it would be likely that we would, in the future, realize our deferred tax assets in excess of the net recorded amount, an adjustment to the deferred tax asset would be made. In the period that such a determination was made, the adjustment to the deferred tax asset would produce an increase in our net income.
We do not participate in, nor have we created, any off-balance sheet special purpose entities or other off-balance sheet financing. In addition, we do not enter into any derivative financial instruments.
We record a liability for asset retirement obligation at fair value in the period in which it is incurred and a corresponding increase in the carrying amount of the related long lived assets.
RESULTS OF OPERATIONS
The following table sets forth our Statements of Operations data for the years ended December 31st. All data is in thousands:
|
2010
|
2009
|
2008
|
||||||||||
|
General and administrative expenses
|
||||||||||||
|
Legal and Professional
|
895 | 861 | 1,015 | |||||||||
|
Salaries
|
2,393 | 2,360 | 1,663 | |||||||||
|
Other
|
2,366 | 1,344 | 1,397 | |||||||||
|
Impairment of unproved oil and gas properties
|
22,022 | — | — | |||||||||
|
Interest Income
|
18 | 65 | 77 | |||||||||
|
Net loss
|
(27,658 | ) | (4,424 | ) | (4,018 | ) | ||||||
FOR THE YEAR ENDED DECEMBER 31, 2010 COMPARED TO DECEMBER 31, 2009
Revenue.
We currently have no revenue generating operations as we are still a development stage company.
General and administrative expenses.
General and administrative expenses for the year ended December 31, 2010 were $27,676,000 compared to $4,565,000 for the year ended December 31, 2009. The increase in general and administrative expenses in 2010 compared to 2009 is primarily attributable to the impairment charge of $22,022,000 recorded during the three months ended June 30, 2010 in respect of the Ma’anit-Rehoboth #2 well. Salary expenses for the year ended December 31, 2010 were $2,393,000 compared to $2,360,000 for the year ended December 31, 2009. Legal and professional fees for 2010 were $895,000 compared to $861,000 for 2009. Other general and administrative expenses for the year ended December 31, 2010 was $2,366,000
compared to $1,344,000 for 2009, representing an increase of 76%. The increase in other general and administrative expenses, which is comprised of non-compensation, non-professional and non-operational expenses incurred in our three offices, is primarily attributable to an increase in marketing and investor relations related expenses ($669,000), and in insurance related expenses ($163,000).
41
Interest income, net.
Interest income for the year ended December 31, 2010 was $18,000 compared to $65,000 for the year ended December 31, 2009. The decrease in interest income, net is attributable to the reduction in the rate of interest offered on cash deposits by financial institutions.
Net Loss
. Net loss for the year ended December 31, 2010 was $27,658,000 compared to $4,424,000 for the year ended December 31, 2009.
FOR THE YEAR ENDED DECEMBER 31, 2009 COMPARED TO DECEMBER 31, 2008
General and administrative expenses.
General and administrative expenses for the year ended December 31, 2009 were $4,565,000, compared to $4,075,000 for the year ended December 31, 2008, representing an increase of 12%. The increase in general and administrative expenses in 2009 compared to 2008 is primarily attributable to higher non-cash salary expenses for recognition of compensation expense related to option grants and stock awards. Salary expenses for the year ended December 31, 2009 were $2,360,000 compared to $1,663,000 for the year ended December 31, 2008. The $697,000 increase in salary expenses during 2009 is attributable to $608,000 in non-cash expenses related to $558,000 of additional compensation expense this year over 2009 as
compared to 2008 related to stock option grants and $50,000 related to stock grants and gifts. The rest of the increase is due to the expansion of staff to support operations. Legal and professional fees for 2009 were $861,000 as compared to $1,015,000 for 2008, representing a decrease of approximately 15%. The decrease in legal and professional fees is primarily attributable to the increased utilization of in-house legal staff. Other general and administrative expenses for the year ended December 31, 2009 were $1,344,000 compared to $1,397,000 for 2008. The decrease in other general and administrative expenses during 2009 is primarily attributable to our continued efforts to control support costs.
Interest income, net.
Interest income for the year ended December 31, 2009 was $65,000 compared to $77,000 for the year ended December 31, 2008. The decrease in interest income, net is attributable to extremely lower rates being paid by the banks despite the higher average cash balances during 2009.
Net Loss
. Net loss for the year ended December 31, 2009 was $4,424,000 compared to $4,018,000 for the year ended December 31, 2008.
Liquidity and Capital Resources
At December 31, 2010, we had approximately $21,250,000 in cash and cash equivalents compared to $20,700,000 at December 31, 2009. Our working capital (current assets minus current liabilities) was $20,575,000 at December 31, 2010 and $19,741,000 at December 31, 2009.
During the year ended December 31, 2010, we recorded expenses paid, relating to the rights offering completed in July 2010 and the subsequent rights offering completed in December 2010, in the aggregate amount of $479,000. Net cash provided by financing activities was $30,094,000. Net cash used for investment in our unproved oil and gas properties was $24,145,000 for the year ended December 31, 2010 and $18,513,000 for the year ended December 31, 2009; these amounts were primarily drilling related expenditures.
We believe that our currently available cash resources will be sufficient to enable us to meet our operating requirements in carrying out our plans through December 2011, including completing the Ma’anit-Joseph #3 well and any production testing and other analyses that may be required. As of March 7, 2011 we had outstanding publicly traded warrants exercisable through December 31, 2012 and trading under the symbol ZNWAZ at a per share exercise price of $4, for potential aggregate cash proceeds payable to us of approximately $14,300,000. Additionally, as of March 7, 2011 had outstanding publicly traded warrants exercisable through January 31, 2012 and trading under the symbol ZNWAW at a per share exercise price of $7, for potential aggregate cash proceeds payable to us of approximately $3,600,000.
Unless we receive significant proceeds during 2011 from the exercise of these publicly traded warrants (of which no assurance can be provided), we anticipate needing to raise additional funds to maintain operations beyond that date and in order to realize our multi-well drilling plan and acquire a majority working interest in an onshore deep-drilling rig in Israel. We anticipate that we can raise funds by attracting additional investment in our company or additional parties to join our drilling operations. Finally, we can raise up to approximately $4.8 million from additional sales of our securities under an existing shelf registration statement. We have no commitments for any such financing or participation and no assurance can be provided that we will be successful in attracting any such investment.
42
Contractual Obligations
In addition to our capital expenditure program, we are committed to making cash payments in the future on three types of contracts: drilling commitments, employment agreements and operating leases. As of December 31, 2010, we do not have any off-balance sheet debt or other such unrecorded obligations and we have not guaranteed the debt of any other party. The table below provides estimates of the timing of future payments that we are obligated to make based on agreements in place at December 31, 2010.
The following summarizes our contractual financial obligations for continuing operations at December 31, 2010 and their future maturities.
|
Payment due by period (in Thousands)
|
||||||||||||||||||||||||||||
|
2011
|
2012
|
2013
|
2014
|
2015
|
Thereafter
|
Total
|
||||||||||||||||||||||
|
Drilling Commitments
|
$ | 1,201 | — | — | — | — | — | $ | 1,201 | |||||||||||||||||||
|
Operating Leases
|
$ | 178 | $ | 132 | $ | 98 | $ | 24 | $ | — | — | $ | 432 | |||||||||||||||
|
Employment Agreements
|
$ | 764 | — | — | — | — | — | $ | 764 | |||||||||||||||||||
| — | ||||||||||||||||||||||||||||
| $ | 2,143 | $ | 132 | $ | 98 | $ | 24 | $ | — | — | $ | 2,397 | ||||||||||||||||
Off-Balance Sheet Arrangements
We do not currently use any off-balance sheet arrangements to enhance our liquidity or capital resource position, or for any other purpose.
Recently Issued Accounting Pronouncements
During 2010, there were no accounting pronouncements which were issued and which have relevancy to our business.
|
ITEM 7A.
|
QUANTITATIVE AND QUALITATIVE DISCLOSURES ABOUT MARKET RISK
|
Market risk is a broad term for the risk of economic loss due to adverse changes in the fair value of a financial instrument. These changes may be the result of various factors, including interest rates, foreign exchange rates, commodity prices and/or equity prices. In the normal course of doing business, we are exposed to the risks associated with foreign currency exchange rates and changes in interest rates.
Foreign Currency Exchange Rate Risks
. A portion of our expenses, primarily labor expenses and certain supplier contracts, are nominated in New Israeli Shekels “NIS”. As a result, we have significant exposure to the risk of fluctuating exchange rates with the US Dollar, our primary reporting currency. The recent weakness of the US Dollar in the international markets has been equally reflected against NIS and this may continue in the future. Since December 31, 2010, 2009 and 2008, to the current date, the US Dollar has devalued by approximately nil%, 6% and 7% respectively against the NIS. Continuing devaluation of the US dollar against the NIS will result in higher operating costs from NIS denominated expenses. We do not currently hedge against
currency exchange rate risks.
43
Interest Rate Risk.
Our exposure to market risk relates to our cash and investments. We maintain an investment portfolio of short term bank deposits and money market funds. The securities in our investment portfolio are not leveraged, and are, due to their very short-term nature, subject to minimal interest rate risk. We currently do not hedge interest rate exposure. Because of the short-term maturities of our investments, we do not believe that a change in market interest rates would have a significant negative impact on the value of our investment portfolio except for reduced income in a low interest rate environment. At December 31, 2010, we had cash, cash equivalents and short-term bank deposits of approximately $21,493,000. The weighted
average annual interest rate related to our cash and cash equivalents for the year ended December 31, 2010 was approximately 0.3%.
The primary objective of our investment activities is to preserve principal while at the same time maximizing yields without significantly increasing risk. To achieve this objective, we invest our excess cash in short-term bank deposits and money market funds that may invest in high quality debt instruments.
|
ITEM 8.
|
FINANCIAL STATEMENTS
|
The financial statements required by this item are included beginning at page F-1 below.
|
ITEM 9.
|
CHANGES IN AND DISAGREEMENTS WITH ACCOUNTANTS ON ACCOUNTING AND FINANCIAL DISCLOSURE
|
None.
|
ITEM 9A.
|
CONTROLS AND PROCEDURES
|
EVALUATION OF DISCLOSURE CONTROLS AND PROCEDURES
.
We carried out an evaluation required by the 1934 Act, under the supervision and with the participation of our principal executive officer and principal financial and accounting officer, of the effectiveness of the design and operation of our disclosure controls and procedures, as defined in Rule 13a-15(e) of the 1934 Act, as of December 31, 2010. Based on this evaluation, our principal executive officer and our principal financial and accounting officer concluded that our disclosure controls and procedures were effective, as of December 31, 2010, to provide reasonable assurance that information required to be disclosed by us in the reports that we file or submit under the 1934 Act is recorded, processed, summarized and reported within the time periods specified in the SEC’s rules and forms and
to provide reasonable assurance that such information is accumulated and communicated to our management, including our principal executive officer and principal financial and accounting officer, as appropriate to allow timely decisions regarding required disclosures.
MANAGEMENT’S REPORT ON INTERNAL CONTROL OVER FINANCIAL REPORTING; CHANGES IN INTERNAL CONTROLS OVER FINANCIAL REPORTING.
During the year ended December 31, 2010, there have been no changes in our internal controls over financial reporting that have materially affected, or are reasonably likely to materially affect, these controls, although a number of new controls were implemented during 2010.
Our management is responsible for establishing and maintaining adequate internal control over financial reporting. Our management, including our principal executive officer and principal financial officer, conducted an evaluation of the effectiveness of our internal control over financial reporting based on the framework in
Internal Control - Integrated Framework
issued by the Committee of Sponsoring Organizations of the Treadway Commission (COSO). Based on its evaluation under the framework in
Internal Control - Integrated Framework
, our management concluded that our internal control over financial reporting was effective as of December 31, 2010 in providing reasonable assurance
regarding the reliability of financial reporting and the preparation of financial statements for external purposes in accordance with generally accepted accounting principles. The effectiveness of our internal control over financial reporting as of December 31, 2010 has been independently assessed by Somekh Chaikin, a member of KPMG International, an independent registered public accounting firm, as stated in their report which is included in Item 8 of this Annual Report on Form 10-K.
44
Limitations on Controls
Our disclosure controls and procedures and internal control over financial reporting are designed to provide reasonable assurance of achieving their objectives as specified above. Management does not expect, however, that our disclosure controls and procedures or our internal control over financial reporting will prevent or detect all error and fraud. Any control system, no matter how well designed and operated, is based upon certain assumptions and can provide only reasonable, not absolute, assurance that its objectives will be met. Further, no evaluation of controls can provide absolute assurance that misstatements due to error or fraud will not occur or that all control issues and instances of fraud, if any, within the Company have been detected.
None.
The information required by this item is incorporated by reference to such information as set forth in our definitive Proxy Statement (the “2011 Proxy Statement”) for our 2011 annual meeting of stockholders. The 2011 Proxy statement will be filed with the SEC not later than 120 days subsequent to December 31, 2010.
The information required by this item is incorporated herein by reference to the 2011 Proxy Statement for the 2011 annual meeting of stockholders, which will be filed with the SEC not later than 120 days subsequent to December 31, 2010.
|
SECURITY OWNERSHIP OF CERTAIN BENEFICIAL OWNERS AND MANAGEMENT AND RELATED STOCKHOLDER MATTERS
|
The information required by this item is incorporated herein by reference to the 2011 Proxy Statement for the 2011 annual meeting of stockholders, which will be filed with the SEC not later than 120 days subsequent to December 31, 2010.
The information required by this item is incorporated herein by reference to the 2011 Proxy Statement for the 2011 annual meeting of stockholders, which will be filed with the SEC not later than 120 days subsequent to December 31, 2010.
The information required by this item is incorporated herein by reference to the 2010 Proxy Statement for the 2011 annual meeting of stockholders, which will be filed with the SEC not later than 120 days subsequent to December 31, 2010.
45
|
ITEM 15.
|
EXHIBITS, FINANCIAL STATEMENTS SCHEDULES
|
EXHIBIT INDEX –
|
Exhibit
Number
|
Description
|
|
|
3.1
|
Certificate of Amendment to Amended and Restated Certificate of Incorporation of Zion Oil & Gas, Inc. Incorporation (incorporated herein by reference to the Company’s Quarterly Report on Form 10-Q, for the quarter ended June 30, 2009, filed with the SEC on August 14, 2009, Exhibits 3.1 and 3.1.2)
|
|
|
3.2
|
Amended and Restated Bylaws of Zion Oil & Gas, Inc. (incorporated by reference to Exhibit 3.2 to the Company’s Form 10-KSB for the year ended December 31, 2007 as filed with the SEC on March 28, 2008)
|
|
|
9.1
|
Rinberg-Brown Voting Agreement (incorporated by reference to Exhibit 9.4 to the Company’s Form 10-KSB for the year ended December 31, 2005 as filed with the SEC on September 14, 2006)
|
|
|
10.1
|
Joseph License (incorporated by reference to Exhibit 10.1 to the Company’s Current Report on Form 8-K as filed with the SEC on October 16, 2007)
|
|
|
10.2
|
Asher –Menashe License (incorporated by reference to Exhibit 10-2 to the Company’s Form 10-QSB for the quarter ended June 30, 2007 as filed with the SEC on August 20, 2007)Memorandum
|
|
|
10.3
|
Issachar Zebulun Permit
|
|
|
10.4
|
Executive Employment and Retention Agreements (Management Agreements)
|
|
|
(i) Employment Agreement dated as of November 1, 2007, between Zion Oil & Gas, Inc. and Richard J. Rinberg (incorporated by reference to Exhibit 10.1 to the Company’s Current Report on Form 8-K as filed with the SEC on December 10, 2007)
|
||
|
(ii) Retention and Management Services Agreement dated as of November 1, 2005, between Zion Oil & Gas and Richard Rinberg (incorporated by reference to Exhibit 10.4(vii) to the Company’s Form 10-KSB for the year ended December 31, 2005 as filed with the SEC on September 14, 2006)
|
||
|
(iii) Employment Agreement dated February 1, 2009 between Zion Oil & Gas, Inc. and Sandra F. Green (incorporated by reference to Exhibit 10.1 to the Company’s Current Report on Form 8-K as filed with the SEC on February 5, 2009)
|
||
|
(iv) Employment Agreement dated as of January 1, 2010 between Zion Oil & Gas, Inc. and John Brown (incorporated by reference to Exhibit 10.1 to the Company’s Current Report on Form 8-K as filed with the SEC on January 27, 2010)
|
||
|
(vi) Employment Agreement dated as of Janaury 1, 2010 between Zion Oil & Gas, Inc. and William L. Ottaviani (incorporated by reference to Exhibit 10.1 to the Company’s Current Report on Form 8-K as filed with the SEC on February 1, 2010)
|
||
|
(vii) Employment Letter Agreement entered into on August 10, 2010 between between Zion Oil & Gas, Inc. and Kent Siegel(incorporated by reference to Exhibit 10.1 to the Company’s Current Report on Form 8-K as filed with the SEC on August 12, 2010)
|
||
|
*
|
(viii) Employment Letter Agreement entered into on January 31, 2011 between between Zion Oil & Gas, Inc. and Victor Carrillo
|
|
|
10.5
|
International Daywork Drilling Contract – Land dated as of September 12, 2008 between Zion Oil & Gas, Inc. and Aladdin Middle East Ltd. (incorporated by reference to Exhibit 10.1 to the Company’s Current Report on Form 8-K as filed with the SEC on September 16, 2008)
|
|
|
10.6
|
Amendment No. 1, dated as of December 7, 2008, to International Daywork Drilling Contract – Land dated as of September 12, 2008 between Zion Oil & Gas, Inc. and Aladdin Middle East Ltd.
(incorporated by reference to Exhibit 10.1 to the Company’s Current Report on Form 8-K as filed with the SEC on December 16, 2008)
|
46
|
10.7
|
Settlement Agreement dated as of January 9, 2009, between Zion Oil & Gas, Inc. and Philip Mandelker
|
|
|
10.8
|
Settlement Agreement dated as of December 7, 2009, between Zion Oil & Gas, Inc. and Glen H. Perry
|
|
|
10.9
|
2005 Stock Option Plan (incorporated by reference to Exhibit 10.5 to the Company’s Form 10-KSB for the year ended December 31, 2005 as filed with the SEC on September 14, 2006)
|
|
|
10.10
|
Extension to Jospeh License (incorporated by reference to Exhibit 10.1 to the Company’s Current Report on Form 8-K as filed with the SEC on April 28, 2010)
|
|
|
10.11
|
Extension to Asher-Menashe License (incorporated by reference to Exhibit 10.1 to the Company’s Current Report on Form 8-K as filed with the SEC on May 20, 2010)
|
|
|
10.12
|
Amendment No. 4, dated as of April 23, 2010, to International Daywork Drilling Contract – Land dated as of September 12, 2008 between Zion Oil & Gas, Inc. and Aladdin Middle East Ltd.
(incorporated by reference to Exhibit 10.1 to the Company’s Current Report on Form 8-K as filed with the SEC on May 24, 2010)
|
|
|
10.13
|
Settlement Agreement dated as of July 8, 2010, between Zion Oil & Gas, Inc. and Sandar F. Green (incorporated by reference to Exhibit 10.1 to the Company’s Curretn Report Form 8-K as filed with the SEC on July 9, 2010)
|
|
|
10.14 *
|
Office Sublease Agreement dated as of December 30, 2010 between Zion Oil & Gas, Inc. and Spectrum Dynamics (Israel) Ltd., as sublessor
|
|
|
14.1
|
Code of Ethics (incorporated by reference to Exhibit 14.1 to the Company’s Current Report on Form 8-K as filed with the SEC on December 10, 2007)
|
|
|
23.1*
|
Consent of Lane Gorman Trubitt, PLLC
|
|
|
23.2*
|
Consent of Somekh Chaikin, a member of KPMG International
|
|
|
31.1*
|
Certification of Chief Executive Officer pursuant to Section 302 of the Sarbanes-Oxley Act of 2002
|
|
|
31.2*
|
Certification of Chief Financial Officer pursuant to Section 302 of the Sarbanes-Oxley Act of 2002
|
|
|
32.1*
|
|
Certification of Chief Executive Officer pursuant to Section 906 of the Sarbanes-Oxley Act of 2002
|
| 32.2* |
Certification of Chief Financial Officer pursuant to Section 906 of the Sarbanes-Oxley Act of 2002
|
*filed herewith
47
SIGNATURES
Pursuant to the requirements of Section 13 or 15(d) of the Securities Exchange Act of 1934, the registrant has duly caused this report to be signed on its behalf by the undersigned, thereunto duly authorized.
|
ZION OIL & GAS, INC.
|
||||
|
(Registrant)
|
||||
|
By:
|
/s/ Richard J. Rinberg
|
By:
|
/s/ Kent S. Siegel
|
|
|
Richard J. Rinberg
|
Kent S. Siegel,
|
|||
|
Chief Executive Officer
(Principal Executive Officer)
|
Chief Financial Officer
(Principal Financial Officer)
|
|||
|
Date:
|
March 16, 2011
|
Date:
|
March 16, 2011
|
|
|
By:
|
/s/ Patti Beal
|
|
|
|
Patti Beals
|
|
|
Chief Accounting Officer
(Principal Accounting Officer)
|
||
|
Date:
|
March 16, 2011
|
Pursuant to the requirements of the Securities Exchange Act of 1934, this report has been signed below by the following persons on behalf of the registrant and in the capacities and on the dates indicated:
|
/s/ John M. Brown
|
||||
|
John M. Brown
|
Chairman of the Board
|
March 16, 2011
|
||
|
/s/ Richard Rinberg
|
||||
|
Richard Rinberg
|
Chief Executive Officer and Director
|
March 16, 2011
|
||
|
/s/ William Ottaviani
|
||||
|
William Ottaviani
|
Chief Operating Officer, President and Director
|
March 16, 2011
|
||
|
/s/ Kent S. Siegel
|
||||
|
Kent S. Siegel
|
Chief Financial Officer, Vice-President and Director
|
March 16, 2011
|
||
|
/s/ Victor Carrillo
|
||||
|
Victor Carrillo
|
Executive Vice President and Director
|
March 16, 2011
|
||
|
/s/ Paul Oroian
|
||||
|
Paul Oroian
|
Director
|
March 16, 2011
|
||
|
/s/ Marc Singer
|
||||
|
Marc Singer
|
Director
|
March 16, 2011
|
||
|
/s/ Yehezkel Druckman
|
||||
|
Yehezkel Druckman
|
Director
|
March 16, 2011
|
||
|
/s/ Forrest A. Garb
|
||||
|
Forrest A. Garb
|
Director
|
March 16, 2011
|
||
|
/s/ Julian Taylor
|
||||
|
Julian Taylor
|
Director
|
March 16, 2011
|
||
|
/s/ Robert Render
|
||||
|
Robert Render
|
Director
|
March 16, 2011
|
||
48
Zion Oil & Gas, Inc.
(A Development Stage Company)
Notes to Financial Statements as of December 31, 2010
|
INDEX TO FINANCIAL STATEMENTS
|
|
|
Page
|
|
|
Report of Independent Registered Public Accounting Firm - Somekh Chaikin
|
F-2
|
|
Report of Independent Registered Public Accounting Firm - Lane Gorman Trubitt, PLLC
|
F-4
|
|
Balance Sheets
|
F-5
|
|
Statements of Operations
|
F-6
|
|
Statements of Changes in Stockholders' Equity
|
F-7
|
|
Statements of Cash Flows
|
F-17
|
|
Notes to Financial Statements
|
F-19 to F-51
|
F-1
Report of Independent Registered Public Accounting Firm
The Board of Directors and Stockholders
Zion Oil & Gas, Inc.
We have audited the accompanying balance sheets of Zion Oil & Gas, Inc. (a development stage company) as of December 31, 2010 and 2009, and the related statements of operations, changes in stockholders’ equity, and cash flows for each of the three years in the three year period ended December 31, 2010 and for the period from April 6, 2000 (inception) to December 31, 2010. We have also audited Zion Oil & Gas Inc’s internal control over financial reporting as of December 31, 2010, based on criteria established in
Internal Control – Integrated Framework
issued by the Committee of Sponsoring Organizations of the Treadway Commission (COSO). Zion Oil & Gas, Inc.’s management is responsible for these financial
statements, for maintaining effective internal control over financial reporting and for its assessment of the effectiveness of internal control over financial reporting, included in the accompanying
Management’s Annual Report on Internal Control Over Financial Reporting
appearing under Item 15 of Part III of this Form 10-K. Our responsibility is to express an opinion on these financial statements and an opinion on the Company’s internal control over financial reporting based on our audits.
The cumulative statements of operations, stockholders’ equity, and cash flows for the period from April 6, 2000 (inception) to December 31, 2010 include amounts for the period from April 6, 2000 (inception) to December 31, 2010 and for each of the years in the four-year period ending December 31, 2004 which were audited by other auditors whose report has been furnished to us, and our opinion, insofar as it relates to the amounts included for the period from April 6, 2000 (inception) through December 31, 2004 is based solely on the report of other auditors.
We conducted our audits in accordance with the standards of the Public Company Accounting Oversight Board (United States). Those standards require that we plan and perform the audit to obtain reasonable assurance about whether the financial statements are free of material misstatement and whether effective internal control over financial reporting was maintained in all material respects. An audit includes examining, on a test basis, evidence supporting the amounts and disclosures in the financial statements. Assessing the accounting principles used and significant estimates made by management, and evaluating the overall financial statement presentation. Our audit of internal control over financial reporting included obtaining an understanding of internal control over financial reporting, assessing the risk that a
material weakness exists, and testing and evaluating the design and operating effectiveness of internal control based on the assessed risk. Our audits also included performing such other procedures as we considered necessary in the circumstances. We believe that our audits provide a reasonable basis for our opinions.
A company's internal control over financial reporting is a process designed to provide reasonable assurance regarding the reliability of financial reporting and the preparation of financial statements for external purposes in accordance with generally accepted accounting principles. A company's internal control over financial reporting includes those policies and procedures that (1) pertain to the maintenance of records that, in reasonable detail, accurately and fairly reflect the transactions and dispositions of the assets of the company; (2) provide reasonable assurance that transactions are recorded as necessary to permit preparation of financial statements in accordance with generally accepted accounting principles, and that receipts and expenditures of the company are being made only in accordance with
authorizations of management and directors of the company; and (3) provide reasonable assurance regarding prevention or timely detection of unauthorized acquisition, use, or disposition of the company's assets that could have a material effect on the financial statements.
Because of its inherent limitations, internal control over financial reporting may not prevent or detect misstatements. Also, projections of any evaluation of effectiveness to future periods are subject to the risk that controls may become inadequate because of changes in conditions, or that the degree of compliance with the policies or procedures may deteriorate.
In our opinion, based on our audits and the report of other auditors, the financial statements referred to above present fairly, in all material respects, the financial position of Zion Oil & Gas, Inc. (a development stage company) as of December 31, 2010 and 2009, and the results of its operations and its cash flows for each of the three years in the three year period ended December 31, 2010 and for the period from April 6, 2000 (inception) to December 31, 2010, in conformity with U.S generally accepted accounting principles. Also in our opinion, Zion Oil & Gas Inc. maintained, in all material respects, effective internal control over financial reporting as of December 31, 2010, based on criteria established in
Internal Control - Integrated
Framework
issued by the Committee of Sponsoring Organizations of the Treadway Commission.
F-2
The accompanying financial statements have been prepared assuming that the Company will continue as a going concern. As discussed in Note 1 to the financial statements, the Company is in its development stage and has no operating revenue, limited capital resources and a loss from operations, all of which raise substantial doubt about its ability to continue as a going concern. Management’s plans in regard to these matters are also described in Note 1. The financial statements do not include any adjustments that might result from the outcome of this uncertainty.
/s/ Somekh Chaikin
Certified Public Accountants (Isr.),
A Member of KPMG International
Tel Aviv, Israel
March 16, 2011
F-3
Report of Independent Registered Public Accounting Firm
Board of Directors and Stockholders
Zion Oil & Gas, Inc.
We have audited the cumulative amounts from April 6, 2000 (inception) to December 31, 2004 included in the statements of operations, changes in stockholders’ equity, and cash flows of Zion Oil & Gas, Inc. (a development stage company). These financial statements are the responsibility of the Company’s management. Our responsibility is to express an opinion on these cumulative financial statements based on our audit.
We conducted our audit in accordance with the standards of the Public Company Accounting Oversight Board (United States). Those standards require that we plan and perform the audit to obtain reasonable assurance about whether the financial statements are free of material misstatement. An audit includes examining, on a test basis, evidence supporting the amounts and disclosures in the financial statements. An audit also includes assessing the accounting principles used and significant estimates made by management, as well as evaluating the overall financial statement presentation. We believe that our audit provides a reasonable basis for our opinion.
In our opinion, the cumulative amounts since inception to December 31, 2004 referred to above present fairly, in all material respects, the results of operations and cash flows of Zion Oil & Gas, Inc. since inception to December 31, 2004, in conformity with accounting principles generally accepted in the United States of America.
As described in the first paragraph in Note 1C to the 2010 financial statements, the financial statements for all periods from April 6, 2000 (inception) until December 31, 2004 were previously restated.
The cumulative amounts referred to above have been prepared assuming that the Company will continue as a going concern. As discussed in Note 1 to the financial statements, the Company is in its development stage and has insignificant operating revenue. In addition, the Company has limited capital resources and has initiated a new phase of activity, all of which raise substantial doubt about its ability to continue as a going concern. Management’s plans in regard to these matters are also discussed in Note 1. The financial statements do not include any adjustments that might result from the outcome of this uncertainty.
/s/ Lane Gorman Trubitt, PLLC
Dallas, Texas
April 15, 2005, except for the first
paragraph in Note 1C as to
which the date is July 26, 2006
F-4
Zion Oil & Gas, Inc.
(A Development Stage Company)
Balance Sheets as of
|
December 31
|
December 31
|
|||||||
|
2010
|
2009
|
|||||||
|
US$ thousands
|
US$ thousands
|
|||||||
|
Current assets
|
||||||||
|
Cash and cash equivalents
|
21,243 | 20,734 | ||||||
|
Short term bank deposits
|
250 | - | ||||||
|
Prepaid expenses and other
|
876 | 647 | ||||||
|
Refundable value-added tax
|
801 | 961 | ||||||
|
Total current assets
|
23,170 | 22,342 | ||||||
|
Unproved oil and gas properties, full cost method (See Note 4)
|
25,882 | 23,759 | ||||||
|
Property and equipment
|
||||||||
|
Net of accumulated depreciation of $82,000 and $60,000
|
159 | 78 | ||||||
|
Other assets
|
||||||||
|
Assets held for severance benefits
|
92 | 46 | ||||||
|
Total assets
|
49,303 | 46,225 | ||||||
|
Liabilities and Stockholders’ Equity
|
||||||||
|
Current liabilities
|
||||||||
|
Accounts payable
|
388 | 159 | ||||||
|
Asset retirement obligation
|
50 | 50 | ||||||
|
Accrued liabilities
|
2,136 | 1,915 | ||||||
|
Deferred officers’ compensation – short-term
|
21 | 477 | ||||||
|
Total current liabilities
|
2,595 | 2,601 | ||||||
|
Provision for severance pay
|
339 | 185 | ||||||
|
Total liabilities
|
2,934 | 2,786 | ||||||
|
Commitments and contingencies (See Note 8)
|
||||||||
|
Stockholders’ equity
|
||||||||
|
Common stock, par value $0.01;
Authorized: 50,000,000: Issued and outstanding: 24,867,218 and 18,706,601
shares at December 31, 2010 and 2009 respectively
|
248 | 187 | ||||||
|
Additional paid-in capital
|
102,608 | 72,081 | ||||||
|
Deficit accumulated in development stage
|
(56,487 | ) | (28,829 | ) | ||||
|
Total stockholders’ equity
|
46,369 | 43,439 | ||||||
|
Total liabilities and stockholders' equity
|
49,303 | 46,225 | ||||||
The accompanying notes are an integral part of the financial statements.
F-5
Zion Oil & Gas, Inc.
(A Development Stage Company)
Statements of Operations
|
Period from
|
||||||||||||||||
|
April 6, 2000
|
||||||||||||||||
|
(inception) to
|
||||||||||||||||
|
For the year ended December 31,
|
December 31
|
|||||||||||||||
|
2010
|
2009
|
2008
|
2010
|
|||||||||||||
|
US$ thousands
|
US$ thousands
|
US$ thousands
|
US$ thousands
|
|||||||||||||
|
Revenues
|
- | - | - | - | ||||||||||||
|
General and administrative expenses
|
||||||||||||||||
|
Legal and professional
|
895 | 861 | 1,015 | 6,850 | ||||||||||||
|
Salaries
|
2,393 | 2,360 | 1,663 | 10,461 | ||||||||||||
|
Other
|
2,366 | 1,344 | 1,397 | 7,364 | ||||||||||||
|
Impairment of unproved oil and gas properties
|
22,022 | - | - | 31,516 | ||||||||||||
|
Loss from operations
|
(27,676 | ) | (4,565 | ) | (4,075 | ) | (56,191 | ) | ||||||||
|
Other expense, net
|
||||||||||||||||
|
Termination expenses of offerings
|
- | - | (20 | ) | (527 | ) | ||||||||||
|
Other income, net
|
- | 76 | - | 80 | ||||||||||||
|
Interest income, net
|
18 | 65 | 77 | 151 | ||||||||||||
|
Loss before income taxes
|
(27,658 | ) | (4,424 | ) | (4,018 | ) | (56,487 | ) | ||||||||
|
Income taxes
|
- | - | - | - | ||||||||||||
|
Net loss
|
(27,658 | ) | (4,424 | ) | (4,018 | ) | (56,487 | ) | ||||||||
| Net loss per share of common stock - basic and diluted (in US$) | (1.29 | ) | (0.37 | ) | (0.36 | ) | (5.38 | ) | ||||||||
| Weighted-average shares outstanding – basic and diluted (in thousands) | 21,377 | *11,830 | *11,059 | * 10,506 | ||||||||||||
* Adjusted to reflect bonus element in rights offering, see note 2K.
The accompanying notes are an integral part of the financial statements.
F-6
Zion Oil & Gas, Inc.
(A Development Stage Company)
Statement of Changes in Stockholders' Equity
|
Deficit
|
||||||||||||||||||||||||||||
|
Additional
|
Accumulated
|
|||||||||||||||||||||||||||
|
Preferred Stock
|
Common Stock
|
Paid-in
|
in development
|
|||||||||||||||||||||||||
|
Shares
|
Amount
|
Shares
|
Amount
|
capital
|
stage
|
Total
|
||||||||||||||||||||||
|
Thousands
|
US$ thousands
|
Thousands
|
US$ thousands
|
US$ thousands
|
US$ thousands
|
US$ thousands
|
||||||||||||||||||||||
|
Balances on April 6, 2000
|
- | - | - | - | - | - | - | |||||||||||||||||||||
|
Issued for cash ($0.001 per share)
|
- | - | 2,400 | * - | 2 | - | 2 | |||||||||||||||||||||
|
Issuance of shares and warrants in a private offering ($1 per share)
|
- | - | 100 | * - | 100 | - | 100 | |||||||||||||||||||||
|
Costs associated with the issuance of shares
|
- | - | - | - | (24 | ) | - | (24 | ) | |||||||||||||||||||
|
Waived interest on conversion of debt
|
- | - | - | - | * - | - | * - | |||||||||||||||||||||
|
Value of warrants granted to employees
|
- | - | - | - | 2 | - | 2 | |||||||||||||||||||||
|
Net loss
|
- | - | - | - | - | (5 | ) | (5 | ) | |||||||||||||||||||
|
Balances as of December 31, 2000
|
- | - | 2,500 | * - | 80 | (5 | ) | 75 | ||||||||||||||||||||
|
Issuance of shares and warrants in a private offering in January 2001 ($1 per share)
|
- | - | 135 | * - | 135 | - | 135 | |||||||||||||||||||||
|
Issuance of shares and warrants in a private offering
which closed in September 2001 ($1 per share)
|
- | - | 125 | * - | 125 | - | 125 | |||||||||||||||||||||
|
Payment of accounts payable through issuance of shares and warrants
|
- | - | 40 | * - | 40 | - | 40 | |||||||||||||||||||||
|
Payment of note payable through issuance of shares and warrants
|
- | - | 25 | * - | 25 | - | 25 | |||||||||||||||||||||
|
Issuance of shares and warrants in a private offering which closed in November 2001 ($1 per share)
|
- | - | 175 | * - | 175 | - | 175 | |||||||||||||||||||||
|
Costs associated with the issuance of shares
|
- | - | - | - | (85 | ) | - | (85 | ) | |||||||||||||||||||
|
Waived interest on conversion of debt
|
- | - | - | - | 1 | - | 1 | |||||||||||||||||||||
|
Value of warrants granted to employees
|
- | - | - | - | 37 | - | 37 | |||||||||||||||||||||
|
Value of warrants granted to directors and consultants
|
- | - | - | - | 3 | - | 3 | |||||||||||||||||||||
|
Net loss
|
- | - | - | - | - | (207 | ) | (207 | ) | |||||||||||||||||||
|
Balances as of December 31, 2001
|
- | - | 3,000 | * - | 536 | (212 | ) | 324 | ||||||||||||||||||||
* Represents an amount less than US$ 1 thousand.
F-7
Zion Oil & Gas, Inc.
(A Development Stage Company)
Statement of Changes in Stockholders' Equity (cont’d)
|
Deficit
|
||||||||||||||||||||||||||||
|
|
Accumulated
|
|||||||||||||||||||||||||||
|
Preferred Stock
|
Common Stock
|
Additional
Paid-in
|
in
Development
|
|||||||||||||||||||||||||
|
Shares
|
Amount
|
Shares
|
Amount
|
Capital
|
Stage
|
Total
|
||||||||||||||||||||||
|
Thousands
|
US$ thousands
|
Thousands
|
US$ thousands
|
US$ thousands
|
US$ thousands
|
US$ thousands
|
||||||||||||||||||||||
|
Change in par value of common shares from $ 0.0001 per share to $0.01 per share
|
- | - | - | 30 | (30 | ) | - | - | ||||||||||||||||||||
|
Issuance of shares and warrants in a private offering which closed in January 2002 ($1 per share)
|
- | - | 20 | * - | 20 | - | 20 | |||||||||||||||||||||
|
Issuance of shares and warrants in a private offering which closed in November 2002 ($10 per share)
|
25 | * - | 22 | * - | 254 | - | 254 | |||||||||||||||||||||
|
Payment of accounts payable through issuance of preferred shares and warrants
|
13 | * - | - | - | 127 | - | 127 | |||||||||||||||||||||
|
Payment of accounts payable through issuance of common shares and warrants
|
- | - | 111 | 1 | 131 | - | 132 | |||||||||||||||||||||
|
Payment of note payable through issuance of shares and warrants
|
5 | * - | - | - | 50 | - | 50 | |||||||||||||||||||||
|
Payment of accounts payable to employee through issuance of shares upon exercise of warrants
|
- | - | 400 | 4 | 76 | - | 80 | |||||||||||||||||||||
|
Costs associated with the issuance of shares
|
- | - | - | - | (160 | ) | - | (160 | ) | |||||||||||||||||||
|
Waived interest on conversion of debt
|
- | - | - | - | 3 | - | 3 | |||||||||||||||||||||
|
Deferred financing costs on debt conversions / modifications
|
- | - | - | - | 21 | - | 21 | |||||||||||||||||||||
|
Value of warrants granted to employees
|
- | - | - | - | 1 | - | 1 | |||||||||||||||||||||
|
Value of warrants granted to directors and consultants
|
- | - | - | - | 13 | - | 13 | |||||||||||||||||||||
|
Net loss
|
- | - | - | - | - | (403 | ) | (403 | ) | |||||||||||||||||||
|
Balances as of December 31, 2002
|
43 | * - | 3,553 | 35 | 1,042 | (615 | ) | 462 | ||||||||||||||||||||
* Represents an amount less than US$ 1 thousand.
F-8
Zion Oil & Gas, Inc.
(A Development Stage Company)
Statement of Changes in Stockholders' Equity (cont’d)
|
Deficit
|
||||||||||||||||||||||||||||
|
|
Accumulated
|
|||||||||||||||||||||||||||
|
Preferred Stock
|
Common Stock
|
Additional
Paid-in
|
in
Development
|
|||||||||||||||||||||||||
|
Shares
|
Amount
|
Shares
|
Amount
|
Capital
|
Stage
|
Total
|
||||||||||||||||||||||
|
Thousands
|
US$ thousands
|
Thousands
|
US$ thousands
|
US$ thousands
|
US$ thousands
|
US$ thousands
|
||||||||||||||||||||||
|
Issuance of shares in connection with executive employment
|
- | - | 50 | 1 | 49 | - | 50 | |||||||||||||||||||||
|
Issuance of share on warrants exercise
|
- | - | 165 | 2 | 31 | - | 33 | |||||||||||||||||||||
|
Issuance of dividend shares to record holders as of December 31, 2002
|
4 | * - | - | - | * - | - | - | |||||||||||||||||||||
|
Issuance of shares and warrants in a private offering which closed in February 2003 ($10 per share):
|
||||||||||||||||||||||||||||
|
for cash consideration
|
10 | * - | - | - | 105 | - | 105 | |||||||||||||||||||||
|
for reduction of accounts payable
|
5 | * - | - | - | 45 | - | 45 | |||||||||||||||||||||
|
Issuance of shares and warrants as compensation for extension of $100,000 line of credit
|
1 | * - | - | - | 10 | - | 10 | |||||||||||||||||||||
|
Payment of account payable through issuance of shares and warrants
|
* - | * - | - | - | 1 | - | 1 | |||||||||||||||||||||
|
Conversion of preferred shares to common shares in reincorporation merger
|
(63 | ) | * | (-) | 763 | 7 | (7 | ) | - | - | ||||||||||||||||||
|
Issuance of shares in a private offering which closed in July 2003 ($3 per share):
|
||||||||||||||||||||||||||||
|
for cash consideration
|
- | - | 33 | * - | 99 | - | 99 | |||||||||||||||||||||
|
for reduction of accounts payable
|
- | - | 3 | * - | 9 | - | 9 | |||||||||||||||||||||
|
Issuance of shares upon exercise of warrants:
|
||||||||||||||||||||||||||||
|
for cash consideration
|
- | - | 25 | * - | 25 | - | 25 | |||||||||||||||||||||
|
for reduction of accounts payable
|
- | - | 124 | 1 | 142 | - | 143 | |||||||||||||||||||||
|
Issuance of shares upon exercise of warrants for cash consideration
|
- | - | 63 | 1 | 82 | - | 83 | |||||||||||||||||||||
|
Payment of account payable through issuance of shares
|
- | - | 80 | 1 | 139 | - | 140 | |||||||||||||||||||||
|
Costs associated with the issuance of shares
|
- | - | - | - | (58 | ) | - | (58 | ) | |||||||||||||||||||
|
Value of warrants granted to employees
|
- | - | - | - | 47 | - | 47 | |||||||||||||||||||||
|
Deferred financing costs on debt conversions / modifications
|
- | - | - | - | (10 | ) | - | (10 | ) | |||||||||||||||||||
|
Net loss
|
- | - | - | - | - | (873 | ) | (873 | ) | |||||||||||||||||||
|
Balances as of December 31, 2003
|
- | - | 4,859 | 48 | 1,751 | (1,488 | ) | 311 | ||||||||||||||||||||
* Represents an amount less than US$ 1 thousand.
F-9
Zion Oil & Gas, Inc.
(A Development Stage Company)
Statement of Changes in Stockholders' Equity (cont’d)
|
Deficit
|
||||||||||||||||||||
|
Additional
|
Accumulated
|
|||||||||||||||||||
|
Common Stock
|
Paid-in
|
in Development
|
||||||||||||||||||
|
Shares
|
Amounts
|
Capital
|
Stage
|
Total
|
||||||||||||||||
|
Thousands
|
US$ thousands
|
US$ thousands
|
US$ thousands
|
US$ thousands
|
||||||||||||||||
|
Issuance of shares on warrants exercise
|
123 | 1 | 183 | - | 184 | |||||||||||||||
|
Issuance of shares and warrants in a private offering
|
251 | 3 | 1,002 | - | 1,005 | |||||||||||||||
|
Payment of officer salaries through issuance of shares and warrants
|
46 | 1 | 184 | - | 185 | |||||||||||||||
|
Payment of accounts payable to officers and consultants upon exercise of warrants
|
80 | 1 | 99 | - | 100 | |||||||||||||||
|
Payment of director honorariums through issuance of shares and warrants
|
11 | * - | 45 | - | 45 | |||||||||||||||
|
Payment of account payable through issuance of shares and warrants
|
13 | * - | 50 | - | 50 | |||||||||||||||
|
Payment of bridge loan through issuance of shares and warrants
|
125 | 1 | 499 | - | 500 | |||||||||||||||
|
Payment of bridge loan interest and commitment fee through issuance of shares and warrants
|
8 | * - | 30 | - | 30 | |||||||||||||||
|
Payment of bridge loan finders fee through issuance of shares and warrants
|
2 | * - | 7 | - | 7 | |||||||||||||||
|
Payment of service bonus through issuance of shares and warrants
|
20 | * - | 20 | - | 20 | |||||||||||||||
|
Costs associated with the issuance of shares
|
- | - | (59 | ) | - | (59 | ) | |||||||||||||
|
Value of warrants granted to employees
|
- | - | 41 | - | 41 | |||||||||||||||
|
Deferred financing costs on debt conversions / modifications
|
- | - | 30 | - | 30 | |||||||||||||||
|
Net loss
|
- | - | - | (1,737 | ) | (1,737 | ) | |||||||||||||
|
Balances as of December 31, 2004
|
5,538 | 55 | 3,882 | (3,225 | ) | 712 | ||||||||||||||
* Represents an amount less than US$ 1 thousand.
F-10
Zion Oil & Gas, Inc.
(A Development Stage Company)
Statement of Changes in Stockholders' Equity (cont’d)
|
Deficit
|
||||||||||||||||||||
|
Additional
|
Accumulated
|
|||||||||||||||||||
|
Common Stock
|
Paid-in
|
in Development
|
||||||||||||||||||
|
Shares
|
Amounts
|
Capital
|
Stage
|
Total
|
||||||||||||||||
|
Thousands
|
US$ thousands
|
US$ thousands
|
US$ thousands
|
US$ thousands
|
||||||||||||||||
|
Issuance of shares on warrants exercised:
|
||||||||||||||||||||
|
For cash
|
493 | 5 | 872 | - | 877 | |||||||||||||||
|
For payment of deferred officer salaries
|
17 | * - | 21 | - | 21 | |||||||||||||||
|
For exchange of shares of common stock
|
120 | 1 | (1 | ) | - | - | ||||||||||||||
|
Issuance of shares and warrants in a private offering that closed in March 2005:
|
||||||||||||||||||||
|
For cash
|
519 | 5 | 2,070 | - | 2,075 | |||||||||||||||
|
For payment of deferred officer salaries
|
10 | * - | 40 | - | 40 | |||||||||||||||
|
For payment of accounts payable
|
6 | * - | 25 | - | 25 | |||||||||||||||
|
Issuance of shares and warrants in a private offering that closed in June 2005:
|
||||||||||||||||||||
|
For cash
|
259 | 3 | 1,292 | - | 1,295 | |||||||||||||||
|
For payment of directors honoraria
|
14 | * - | 70 | - | 70 | |||||||||||||||
|
For payment of accounts payable
|
3 | * - | 15 | - | 15 | |||||||||||||||
|
Issuance of shares in a private offering that closed in October 2005:
|
||||||||||||||||||||
|
For cash
|
584 | 6 | 2,914 | - | 2,920 | |||||||||||||||
|
For payment of deferred officer salaries
|
40 | * - | 200 | - | 200 | |||||||||||||||
|
For payment of accounts payable
|
22 | * - | 110 | - | 110 | |||||||||||||||
|
Issuance of shares in a private offering that closed in December 2005
|
80 | 1 | 439 | - | 440 | |||||||||||||||
|
Shares to be issued for services provided by director
|
- | - | 42 | - | 42 | |||||||||||||||
|
Value of warrants and options granted to employees
|
- | - | 216 | - | 216 | |||||||||||||||
|
Value of warrants granted to directors and consultants
|
- | - | 16 | - | 16 | |||||||||||||||
|
Deferred financing costs on debt conversions /modifications
|
- | - | 44 | - | 44 | |||||||||||||||
|
Costs associated with the issuance of shares
|
- | - | (275 | ) | - | (275 | ) | |||||||||||||
|
Net loss
|
- | - | - | (1,605 | ) | (1,605 | ) | |||||||||||||
|
Balances as of December 31, 2005
|
7,705 | 76 | 11,992 | (4,830 | ) | 7,238 | ||||||||||||||
* Represents an amount less than US$ 1 thousand.
F-11
Zion Oil & Gas, Inc.
(A Development Stage Company)
Statement of Changes in Stockholders' Equity (cont’d)
|
Deficit
|
||||||||||||||||||||
|
Additional
|
Accumulated
|
|||||||||||||||||||
|
Common Stock
|
Paid-in
|
in Development
|
||||||||||||||||||
|
Shares
|
Amounts
|
Capital
|
Stage
|
Total
|
||||||||||||||||
|
Thousands
|
US$ thousands
|
US$ thousands
|
US$ thousands
|
US$ thousands
|
||||||||||||||||
|
Issuance of shares on warrants exercised:
|
||||||||||||||||||||
|
For cash
|
253 | 3 | 1,151 | - | 1,154 | |||||||||||||||
|
For debt
|
60 | 1 | 276 | - | 277 | |||||||||||||||
|
Issuance of shares and warrants in private offering closings in first quarter 2006:
|
||||||||||||||||||||
|
For cash
|
66 | 1 | 362 | - | 363 | |||||||||||||||
|
For payment of accounts
payable
|
3 | * - | 14 | - | 14 | |||||||||||||||
|
Shares issued for services provided by officer
|
200 | 2 | 248 | - | 250 | |||||||||||||||
|
Issuance of shares and warrants in a private offering that closed in September 2006 for cash
|
23 | * - | 126 | - | 126 | |||||||||||||||
|
Value of options granted to employees
|
- | - | 162 | - | 162 | |||||||||||||||
|
Value of warrants granted to underwriter
|
- | - | 20 | - | 20 | |||||||||||||||
|
Value of shares gifted to directors, employees and service providers
|
- | - | 147 | - | 147 | |||||||||||||||
|
Costs associated with the issuance of shares
|
- | - | (681 | ) | - | (681 | ) | |||||||||||||
|
Funds received from public offering for subscription shares:
|
||||||||||||||||||||
|
For cash
|
410 | 4 | 2,867 | - | 2,871 | |||||||||||||||
|
For debt
|
27 | * - | 188 | - | 188 | |||||||||||||||
|
Net loss
|
- | - | - | (2,510 | ) | (2,510 | ) | |||||||||||||
|
Balances as of December 31, 2006
|
8,747 | 87 | 16,872 | (7,340 | ) | 9,619 | ||||||||||||||
* Represents an amount less than US$ 1 thousand.
F-12
Zion Oil & Gas, Inc.
(A Development Stage Company)
Statement of Changes in Stockholders' Equity (cont’d)
|
Deficit
|
||||||||||||||||||||
|
Additional
|
Accumulated
|
|||||||||||||||||||
|
Common Stock
|
Paid-in
|
in Development
|
||||||||||||||||||
|
Shares
|
Amounts
|
Capital
|
Stage
|
Total
|
||||||||||||||||
|
Thousands
|
US$ thousands
|
US$ thousands
|
US$ thousands
|
US$ thousands
|
||||||||||||||||
|
Funds received from public offering for subscription shares:
|
||||||||||||||||||||
|
For cash
|
1,336 | 14 | 9,338 | - | 9,352 | |||||||||||||||
|
For debt
|
33 | * | 235 | - | 235 | |||||||||||||||
|
Compensation in respect of shares previously issued for services provided by officer
|
- | - | 208 | - | 208 | |||||||||||||||
|
Value of options granted to employees
|
- | - | 337 | - | 337 | |||||||||||||||
|
Value of warrants granted to underwriter
|
- | - | 79 | - | 79 | |||||||||||||||
|
Value of shares granted to employees
|
5 | * | 25 | - | 25 | |||||||||||||||
|
Value of shares gifted to employees
|
- | - | 7 | - | 7 | |||||||||||||||
|
Costs associated with the issuance of shares
|
- | - | (1,027 | ) | - | (1,027 | ) | |||||||||||||
|
Net loss
|
- | - | - | (13,047 | ) | (13,047 | ) | |||||||||||||
|
Balances as of December 31, 2007
|
10,121 | 101 | 26,074 | (20,387 | ) | 5,788 | ||||||||||||||
* Represents an amount less than US$ 1 thousand.
F-13
Zion Oil & Gas, Inc.
(A Development Stage Company)
Statement of Changes in Stockholders' Equity (cont’d)
|
Deficit
|
||||||||||||||||||||
|
Additional
|
Accumulated
|
|||||||||||||||||||
|
Common Stock
|
Paid-in
|
in Development
|
||||||||||||||||||
|
Shares
|
Amounts
|
Capital
|
Stage
|
Total
|
||||||||||||||||
|
Thousands
|
US$ thousands
|
US$ thousands
|
US$ thousands
|
US$ thousands
|
||||||||||||||||
|
Funds received from Unit
Offering for subscription shares:
|
||||||||||||||||||||
|
For cash
|
405 | 4 | 4,040 | - | 4,044 | |||||||||||||||
|
For debt
|
12 | * | 120 | - | 120 | |||||||||||||||
|
Value of warrants and options granted to employees
|
- | - | 266 | - | 266 | |||||||||||||||
|
Value of options granted to directors and consultants
|
- | - | 44 | - | 44 | |||||||||||||||
|
Value of shares granted to employees
|
4 | * | 25 | - | 25 | |||||||||||||||
|
Value of shares gifted to employees
|
- | - | 101 | - | 101 | |||||||||||||||
|
Costs associated with the issuance of shares
|
- | - | (815 | ) | (815 | ) | ||||||||||||||
|
Net loss
|
- | - | - | (4,018 | ) | (4,018 | ) | |||||||||||||
|
Balances as of December 31, 2008
|
10,542 | 105 | 29,855 | (24,405 | ) | 5,555 | ||||||||||||||
* Represents an amount less than US$ 1 thousand.
F-14
Zion Oil & Gas, Inc.
(A Development Stage Company)
Statement of Changes in Stockholders' Equity (cont’d)
|
Deficit
|
||||||||||||||||||||
|
Additional
|
Accumulated
|
|||||||||||||||||||
|
Common Stock
|
Paid-in
|
in Development
|
||||||||||||||||||
|
Shares
|
Amounts
|
capital
|
Stage
|
Total
|
||||||||||||||||
|
Thousands
|
US$ thousands
|
US$ thousands
|
US$ thousands
|
US$ thousands
|
||||||||||||||||
|
Funds received from Unit
Offering for subscription shares:
|
||||||||||||||||||||
|
For cash
|
237 | 3 | 2,370 | - | 2,373 | |||||||||||||||
|
For debt
|
13 | *- | 126 | - | 126 | |||||||||||||||
|
Funds received from Rights Offering
|
4,200 | 42 | 20,958 | - | 21,000 | |||||||||||||||
|
Funds received from Second Rights Offering
|
3,600 | 36 | 17,964 | - | 18,000 | |||||||||||||||
|
Funds received from warrant exercises
|
59 | 1 | 414 | - | 415 | |||||||||||||||
|
Underwriter warrants exercised in cashless exercise
|
13 | - | - | - | - | |||||||||||||||
|
Director warrants and options exercised in cashless exercises
|
37 | - | - | - | - | |||||||||||||||
|
Value of options granted to employees
|
- | - | 494 | - | 494 | |||||||||||||||
|
Value of options granted to directors and consultants
|
- | - | 328 | - | 328 | |||||||||||||||
|
Value of shares granted to consultants for services
|
5 | * | 46 | - | 46 | |||||||||||||||
|
Value of shares gifted to employees
|
- | - | 4 | - | 4 | |||||||||||||||
|
Costs associated with the issuance of shares
|
- | - | (478 | ) | - | (478 | ) | |||||||||||||
|
Net loss
|
- | - | - | (4,424 | ) | (4,424 | ) | |||||||||||||
|
Balances as of December 31, 2009
|
18,706 | 187 | 72,081 | (28,829 | ) | 43,439 | ||||||||||||||
* Represents an amount less than US$ 1 thousand.
F-15
Zion Oil & Gas, Inc.
(A Development Stage Company)
Statement of Changes in Stockholders' Equity (cont’d)
|
Deficit
|
||||||||||||||||||||
|
Additional
|
Accumulated
|
|||||||||||||||||||
|
Common Stock
|
Paid-in
|
in Development
|
||||||||||||||||||
|
Shares
|
Amounts
|
Capital
|
Stage
|
Total
|
||||||||||||||||
|
Thousands
|
US$ thousands
|
US$ thousands
|
US$ thousands
|
US$ thousands
|
||||||||||||||||
|
Funds received from the Third Rights Offering
|
2,471 | 25 | 12,331 | - | 12,356 | |||||||||||||||
|
Funds received from the Fourth Rights Offering
|
3,643 | 36 | 18,178 | - | 18,214 | |||||||||||||||
|
Funds received from warrant exercises
|
* | * | 3 | - | 3 | |||||||||||||||
|
Funds received from option exercises
|
44 | * | - | - | - | |||||||||||||||
|
Value of options granted to employees
|
- | - | 479 | - | 479 | |||||||||||||||
|
Value of shares granted to consultants for services
|
3 | * | 15 | - | 15 | |||||||||||||||
|
Costs associated with the issuance of shares
|
- | - | (479 | ) | - | (479 | ) | |||||||||||||
|
Net loss
|
- | - | - | (27,658 | ) | (27,658 | ) | |||||||||||||
|
Balances as of December 31, 2010
|
24,867 | 248 | 102,608 | (56,487 | ) | 46,369 | ||||||||||||||
* Represents an amount less than US$ 1 thousand.
The accompanying notes are an integral part of the financial statements.
F-16
Zion Oil & Gas, Inc.
(A Development Stage Company)
Statement of Cash Flows
|
Period from
|
||||||||||||||||
|
April 6, 2000
|
||||||||||||||||
|
(inception) to
|
||||||||||||||||
|
For the year ended December 31
|
December 31,
|
|||||||||||||||
|
2010
|
2009
|
2008
|
2010
|
|||||||||||||
|
US$ thousands
|
US$ thousands
|
US$ thousands
|
US$ thousands
|
|||||||||||||
|
Cash flows from operating activities
|
||||||||||||||||
|
Net loss
|
(27,658 | ) | (4,424 | ) | (4,018 | ) | (56,487 | ) | ||||||||
|
Adjustments required to reconcile net loss to net cash
|
||||||||||||||||
|
used in operating activities:
|
||||||||||||||||
|
Depreciation
|
34 | 22 | 29 | 122 | ||||||||||||
|
Officer, director and other fees, paid via common stock
|
15 | 50 | 126 | 2,330 | ||||||||||||
|
Cost of warrants issued to employees, directors & others
|
479 | 822 | 310 | 2,585 | ||||||||||||
|
Interest paid through issuance of common stock
|
- | - | - | 17 | ||||||||||||
|
Write-off of costs associated with public offering
|
- | - | - | 507 | ||||||||||||
|
Loss on disposal of equipment
|
- | - | - | 4 | ||||||||||||
|
Asset retirement obligation
|
- | 50 | - | 50 | ||||||||||||
|
Impairment of unproved oil and gas properties
|
22,022 | - | - | 31,516 | ||||||||||||
|
Change in assets and liabilities, net:
|
||||||||||||||||
|
Decrease in inventories
|
- | - | - | 150 | ||||||||||||
|
Prepaid expenses and other
|
(229 | ) | (124 | ) | (462 | ) | (876 | ) | ||||||||
|
Decrease (increase) in deferred offering costs
|
- | 14 | (14 | ) | - | |||||||||||
|
Change in refundable value-added tax
|
160 | (935 | ) | 39 | (801 | ) | ||||||||||
|
Severance pay, net
|
108 | 23 | (158 | ) | 247 | |||||||||||
|
Accounts payable
|
229 | 47 | (11 | ) | 1,036 | |||||||||||
|
Accrued liabilities
|
221 | 1,691 | 51 | 2,136 | ||||||||||||
|
Increase (decrease) in deferred officers' compensation (net)
|
(456 | ) | (1,010 | ) | 710 | 261 | ||||||||||
|
Net cash used in operating activities
|
(5,075 | ) | (3,774 | ) | (3,398 | ) | (17,203 | ) | ||||||||
|
Cash flows from investing activities
|
||||||||||||||||
|
Investment in short term bank deposits
|
(250 | ) | (- | ) | (- | ) | (250 | ) | ||||||||
|
Acquisition of property and equipment
|
(115 | ) | (15 | ) | (39 | ) | (283 | ) | ||||||||
|
Investment in oil and gas properties
|
(24,145 | ) | (18,513 | ) | (2,656 | ) | (57,548 | ) | ||||||||
|
Net cash used in investing activities
|
(24,510 | ) | (18,528 | ) | (2,695 | ) | (58,081 | ) | ||||||||
|
Cash flows from financing activities
|
||||||||||||||||
|
Deferred financing costs on debt conversions and modification
|
- | - | - | 89 | ||||||||||||
|
Loan proceeds – related party
|
- | - | - | 259 | ||||||||||||
|
Loan principal repayments – related party
|
- | - | - | (259 | ) | |||||||||||
|
Loan proceeds – other
|
- | - | - | 500 | ||||||||||||
|
Proceeds from sale of stock and warrants
|
30,573 | 41,788 | 4,044 | 100,180 | ||||||||||||
|
Costs associated with the issuance of stock and warrants
|
(479 | ) | (478 | ) | (815 | ) | (4,242 | ) | ||||||||
|
Net cash provided by financing activities
|
30,094 | 41,310 | 3,229 | 96,527 | ||||||||||||
|
Net increase (decrease) in cash and cash equivalents
|
509 | 19,008 | (2,864 | ) | 21,243 | |||||||||||
|
Cash and cash equivalents – beginning of period
|
20,734 | 1,726 | 4,590 | - | ||||||||||||
|
Cash and cash equivalents – end of period
|
21,243 | 20,734 | 1,726 | 21,243 | ||||||||||||
F-17
Zion Oil & Gas, Inc.
(A Development Stage Company)
Statement of Cash Flows (cont'd)
|
Period from
|
||||||||||||||||
|
April 6, 2000
|
||||||||||||||||
|
(inception) to
|
||||||||||||||||
|
For the year ended December 31
|
December 31
|
|||||||||||||||
|
2010
|
2009
|
2008
|
2010
|
|||||||||||||
|
US$ thousands
|
US$ thousands
|
US$ thousands
|
US$ thousands
|
|||||||||||||
|
Supplemental information
|
||||||||||||||||
|
Cash paid for interest
|
14 | 6 | 1 | 78 | ||||||||||||
|
Cash paid for income taxes
|
- | - | - | - | ||||||||||||
|
Non-cash investing and financing activities:
|
||||||||||||||||
|
Payment of note payable through issuance of common stock
|
- | - | - | 575 | ||||||||||||
|
Payment of accounts payable through issuance of note payable
|
- | - | - | 35 | ||||||||||||
|
Financing costs paid through issuance of common stock
|
- | - | - | 25 | ||||||||||||
|
Increase in accounts payable for financing costs
|
- | - | - | 382 | ||||||||||||
|
Waived interest on debt conversions
|
- | - | - | 4 | ||||||||||||
|
Shares issued for debt conversion
|
- | 120 | 120 | 940 | ||||||||||||
|
Value of warrants granted to underwriters
|
- | - | - | 99 | ||||||||||||
|
Deferred financing costs
|
- | - | - | 85 | ||||||||||||
|
Transfer of inventory to oil and gas properties
|
- | - | - | 150 | ||||||||||||
The accompanying notes are an integral part of the financial statements.
F-18
Zion Oil & Gas, Inc.
(A Development Stage Company)
Notes to Financial Statements as of December 31, 2010
|
|
A.
|
Nature of Operations
|
Effective July 9, 2003, Zion Oil & Gas, Inc., a Florida corporation (“Zion Florida”) was merged into its wholly owned Delaware subsidiary, Zion Oil & Gas, Inc. (the “Company”), the purpose of which was solely to reincorporate from Florida to Delaware in anticipation of a public offering. Upon the reincorporation, all the outstanding shares of common stock in Zion Florida were converted into common stock, par value $0.01 (the “Common Stock”) of the Company on a one-to-one basis and all the outstanding shares of preferred stock in Zion Florida were converted into Common Stock of the Company at the ratio of twelve shares of Common Stock for each share of preferred stock. All of the outstanding warrants and options of Zion Florida were converted
into equivalent warrants and options of the Company.
The Company is a development stage oil and gas exploration company with a history of more than 10 years of oil & gas exploration in Israel. The Company currently holds two petroleum exploration licenses, named the Joseph License and the Asher-Menashe License, covering approximately 162,100 acres onshore in the State of Israel between Netanya in the south and Haifa in the north. The areas have been subject to a series of exploration permits and licenses that have been granted to and held by the Company under the Israeli Petroleum Law, 5712-1952 (the “Petroleum Law”).
In addition, in February 2011 the Company submitted an application to the Israeli Petroleum Commissioner (sometimes referred to herein as the “Petroleum Commissioner” or the “Commissioner”) an application for an exploration license on approximately 87,000 acres of land (the Jordan Valley License Application) and an application for a new preliminary exploration permit on approximately 157,500 acres of land (the Zebulun Permit), all substantially within the previous Issachar-Zebulun Permit which expired on February 23, 2011. On February 17, 2011, the Company also submitted an application to the Petroleum Commissioner for an exploration license on approximately 75,000 acres of land within the vicinity of the Dead Sea (the Dead Sea License Application). No assurance can be provided that
these application, in whole or in part, will ultimately be awarded to the Company.
Licenses
(1) The “Asher-Menashe License” covers an area of approximately 78,824 acres located on the Israeli coastal plain and the Mt. Carmel range between Caesarea in the south and Haifa in the north. The Asher-Menashe License had an initial three-year term which commenced on June 10, 2007, and has been extended for an additional one-year period ending June 9, 2011. At the option of the Petroleum Commissioner, the Asher-Menashe License may be extended for additional one-year periods up to 2014. The areas covered by the Asher-Menashe License includes the Elijah-3 well.
To date, we have partly completed one exploratory well in the Asher-Menashe License Area, the Elijah #3 well, which the Company commenced drilling in October
2009 toward the Triassic geological formation, which the Company estimated was below approximately 10,000 feet (3,048 meters). As of January 15, 2010, the Company drilled to a depth of 10,938 feet (3,334 meters). In early February 2010, the Company temporarily suspended drilling operations in the well following its unsuccessful efforts to retrieve a stuck pipe, pending further analysis of the situation. Approximately 32 kilometers of 2D seismic data was acquired in June 2010 and has been processed by a geophysical consultant in the United States and has been integrated into the Company's geological database by the Company's geologists. Analysis of the newly acquired data has been used to redefine the geologic model of the area and indicated that the Asher volcanics section is greater (i.e. deeper) than originally predicted. Further engineering work is needed to determine if the Elijah #3 well can be successfully re-drilled through this greater volcanics section.
F-19
Zion Oil & Gas, Inc.
(A Development Stage Company)
Notes to Financial Statements as of December 31, 2010
Note 1 - Nature of Operations and Basis of Presentation (cont’d)
|
A.
|
Nature of Operations (cont’d)
|
(2) The “Joseph License” covers approximately 83,272 acres on the Israeli coastal plain south of the Asher-Menashe License between Caesarea in the north and Netanya in the south. The Joseph License had an initial three-year term which commenced on October 11, 2007 and has been extended for an additional one-year period ending October 11, 2011. The Joseph License may be extended for additional one-year periods up to 2014. The areas covered by the Joseph License include the Ma’anit structure, on which the Company previously drilled the Ma’anit #1 and Ma’anit-Rehoboth #2 wells and is currently drilling the Ma’anit-Joseph #3 well. Between May 2009 and October 2009, the Company drilled
the Ma’anit-Rehoboth #2 well to a depth of approximately 17,913 feet (5,460 meters). In April 2010, the Company conducted production tests on several zones of interest identified during the drilling of the Ma’anit-Rehoboth #2 well. The productions tests indicated that commercial quantities of hydrocarbons were not present in the Ma’anit-Rehoboth #2 well. Work on this well was subsequently suspended and an impairment charge was recognized during the quarter ended June 30, 2010. (See Note 2C).
In August 2010, the Company began drilling the Ma’anit-Joseph #3 well, at a location near to the Ma'anit-Rehoboth #2 well. The drilling of the Ma'anit-Joseph #3 well was planned to test the Permian geological formation and drilling operations on this well were expected to last approximately six months. As of March 10, 2011, the drilling of the Ma'anit-Joseph #3 well reached a depth of approximately 14,400 feet (4,389 meters). The Company's planned ultimate target depth for the Ma'anit-Joseph #3 well is approximately 19,350 feet (5,900 meters).
In the event of a discovery on either of the licenses held, Zion will be entitled to convert the relevant portions of the license to a 30-year production lease, extendable to 50 years, subject to compliance with a field development work program and production.
Newly Submitted License & Permit Applications
(i) On February 17, 2011, prior to the expiration of the Issachar-Zebulun Permit, the Company submitted anapplication to the Petroleum Commissioner for an exploration license on approximately 87,000 acres ofland (the Jordan Valley License Application) and an application for a new preliminary exploration permit on approximately 157,000 acres of land (the Zebulun Permit), all within the area included within the Company’s previous Issachar-Zebulun Permit. Taken together, the new Jordan Valley License Application and the new Zebulun Permit Application cover much of the land previously held under the Issachar-Zebulun Permit.
To assist in identifying potential drilling prospects within the previous Issachar-Zebulun Permit area, in June 2010, the Company acquired an additional 2-D seismic line approximately 19 miles (30 kilometers) in length and the data was processed and integrated into the Company’s geological/geophysical database by our geologists. The Company has identified various areas of potential for further exploration activity within the Jordan Valley License Application area.
(ii) In February 2010, the Company submitted an application to the Petroleum Commissioner for an exploration license on approximately 75,000 acres of land within the vicinity of the Dead Sea (the Dead Sea License Application). The Company’s geologists have identified the Dead Sea area as one worthy of exploration and the Company believes that it is now appropriate to apply for a license in the Dead Sea area.
F-20
Zion Oil & Gas, Inc.
(A Development Stage Company)
Notes to Financial Statements as of December 31, 2010
Note 1 - Nature of Operations and Basis of Presentation (cont’d)
|
|
A.
|
Nature of Operations (cont’d)
|
Summary of Drilling and Exploration Activities
Joseph License
To date, the Company has drilled two exploratory wells and is currently drilling its third exploratory well in the Joseph License area. The first exploratory well, named the Ma’anit #1 well, was drilled to a depth of 15,842 feet (4,829 meters) to Triassic-age formations with encouraging but inconclusive results. However, notwithstanding these results, due to the mechanical condition of the well-bore, the Company determined that the well was incapable of producing oil and/or gas in commercial quantities and, consequently, in June 2007, it abandoned the well.
In 2009, the Company drilled its second well (the Ma’anit-Rehoboth #2 well), ‘directionally’ to a depth of 17,913 feet (5,460 meters). The purpose of the Ma’anit-Rehoboth #2 well was both to appraise the apparent findings of the Ma’anit #1 in the Triassic-age formations (at a depth of between approximately 12,000 and 15,400 feet) and to test the deeper Permian-age horizons at a depth of approximately 16,000 to 18,000 feet. The well penetrated a number of geologic formations that were preliminarily deemed to have hydrocarbon potential and, during well operations, a small quantity of crude oil was retrieved. However, in April 2010, following the completion of testing procedures, the Company determined that commercial quantities of hydrocarbons were not present in the Ma'anit-Rehoboth
#2 well and, accordingly, it suspended drilling operations in that well. In connection with this decision, the Company recognized a non-cash impairment charge to our unproved oil and gas properties for the quarter ended June 30, 2010.
As the Ma'anit-Rehoboth #2 well did not reach the Permian-age geological formation beneath the JosephLicense area, the Company decided to drill a subsequent well, the "Ma'anit-Joseph #3 well", at a locationnear the Ma'anit-Rehoboth #2 well (in the Joseph License Area). The drilling of the Ma'anit-Joseph #3 well, which was commenced in August 2010, was planned to test the Permian-age geological formation and drilling operations on this well are expected to continue through late April 2011, assuming that we do not encounter any further technical difficulties. As of March 10, 2011, the drilling of the Ma'anit-Joseph #3 well had reached a depth of approximately 14,400 feet (4,389 meters).
Asher Menashe License
To date, the Company has partly completed one exploratory well in the Asher-Menashe License Area. In October 2009, the Company commenced drilling the Elijah #3 well, within the Asher-Menashe License area, toward the Triassic geological formation, which it estimated was below approximately 10,000 feet (3,048 meters). As of January 15, 2010, it had drilled to a depth of 10,938 feet (3,334 meters). In early February 2010, it temporarily suspended drilling operations in the well following our unsuccessful efforts to retrieve a stuck pipe, pending further analysis of the situation.
By December 31, 2010, processing and interpretation of approximately 15 miles (25 kilometers) of 2-D seismic data in the Elijah #3 project area, newly acquired for Zion by the Geophysical Institute of Israel (GII) in June 2010, was completed. Analysis of the newly acquired data helped is being used by the Company to redefine the geologic model of the area and indicated that the Asher volcanics section is likely substantially greater (i.e., thicker and deeper) than originally predicted by the older, original data. Further engineering work is needed to determine if the Elijah #3 well can be successfully re-drilled through this unexpectedly more extensive volcanic section. As the Company’s available drilling resources are currently dedicated exclusively to drilling the Ma’anit-Joseph #3
well (in the Joseph License) to the Permian-age target depth, the Company’s geologists and engineering experts will not be in a position to address the future of the Elijah #3 well until after the Company has completed drilling the Ma’anit-Joseph #3 well and completed any testing or other post drilling procedures that it may then deem necessary or desirable once the Permian-age target is reached.
F-21
Zion Oil & Gas, Inc.
(A Development Stage Company)
Notes to Financial Statements as of December 31, 2010
Note 1 - Nature of Operations and Basis of Presentation (cont’d)
|
|
A.
|
Nature of Operations (cont’d)
|
Summary of Drilling and Exploration Activities
(cont’d)
Previous Issachar-Zebulun Permit
In August 2009, the Company was awarded a preliminary exclusive petroleum exploration permit on approximately 165,000 acres onshore Israel. The Issachar-Zebulun Permit allowed the Company to conduct, on an exclusive basis through February 23, 2011, preliminary investigations to ascertain the prospects for discovering petroleum in the area covered by the permit. Unlike a license area, where test drilling may take place, no test drilling is allowed on a permit area.
To help identify potential drilling prospects within the previous Issachar-Zebulun Permit area, in June 2010, Zion acquired through GII an additional 2-D seismic line approximately 19 miles (30 kilometers) in length in the Jordan Valley region and the data was processed and integrated into our geological/geophysical database by our geologists. The Company identified various areas of potential for further exploration activity. As discussed above, in February 2011 the Company applied for both a license (Jordan Valley License) on part of the previous Issachar-Zebulun Permit area and a new permit application (Zebulun Permit) for substantially the remainder of the area covered by the previous Issachar-Zebulun Permit.
Operations in Israel are conducted through a branch office situated in Caesarea, in northern Israel.
The Asher-Menashe License and the Joseph License are held directly in the name of the Company. The applications for the Jordan Valley License, the Dead Sea License and the Zebulun Permit have all been applied for in the name of the Company.
At present it is expected that, other than investment income, any and all future income will be derived from Israeli operations.
|
B.
|
Management Presentation and Liquidity
|
Between September 2004 and through September 2006, the Company raised capital through debt and private offerings and the exercise of outstanding warrants. During 2006, $1,934,000 was raised in private equity financings and warrant exercises, as described below.
On January 25, 2006 the Company filed the 2006 Registration Statement for a public offering on a “best efforts” basis (the “Public Offering”) of between 350,000 and 2,000,000 shares of common stock at $7.00 per share with a minimum offering requirement of $2,450,000 (350,000 shares) and a maximum of $14,000,000 (2,000,000 shares). On December 29, 2006, the Company completed the first closing of its 2006 Public Offering in which it accepted subscriptions in the amount of $3,059,000 in consideration of the issuance of 436,907 shares of common stock. Between January 1 and May 25, 2007, the Company completed additional closings in which it accepted additional subscriptions for 1,369,428 shares of its common stock in the amount of $9,587,000 bringing the total amount raised in the
2006 Public Offering through its termination following the May 25, 2007 closing to $12,645,000.
F-22
Zion Oil & Gas, Inc.
(A Development Stage Company)
Notes to Financial Statements as of December 31, 2010
Note 1 - Nature of Operations and Basis of Presentation (cont’d)
|
B.
|
Management Presentation and Liquidity (cont’d)
|
On February 1, 2008, the Company filed the 2008 Registration Statement with the Securities and Exchange Commission (SEC) in connection with a public offering (the “Follow On Public Offering”) of 2,500,000 units consisting of one share of the Company’s common stock and one common share purchase warrant, exercisable at $7 per share (hereafter – the “Units”), with each
Unit priced at $10. The Follow On Public Offering had a minimum closing requirement of $3,250,000 (325,000 Units. The Follow On Public Offering commenced on March 14, 2008 and continued through the scheduled expiration date of January 9, 2009. On October 24, 2008, the Company held an initial closing on the
Follow On Public Offering of 350,994 Units ($3,510,000). The Company held a subsequent closing on December 2, 2008 of 65,510 Units ($654,000, of which $120,000 was debt conversion). A final closing was held on January 16, 2009 for 249,839 Units ($2,499,000, of which $120,000 was debt conversion and approximately $6,000 was in settlement of fees due to two service providers). The total amounts raised in the Follow On Public Offering were $6,663,000, with $6,417,000 in cash and $240,000 in debt conversions and approximately $6,000 in settlement of service provider fees. These amounts were before the deduction of $514,000 paid to the underwriters for commissions and expenses and $520,000 in deferred offering costs.
On January 29, 2009,
the Company filed a registration statement with the SEC with respect to a proposed rights offering to holders of the Company’s common stock of up to 4.2 million shares of the Company’s common stock (the “Rights Offering”). The registration statement, as subsequently amended on March 31, 2009, was declared effective on April 27, 2009 and the Company distributed to each holder of record as of close of business on May 4, 2009, at no charge, 0.375 of a non-transferable subscription right for each share held as of such date (three subscription rights for each eight shares). Each whole subscription right entitled the stockholder to purchase one share of common stock at the purchase price of $5.00 per share, for an
aggregate of 4.2 million shares. Shareholders who exercised their rights in full were also entitled to purchase additional shares pursuant to an over-subscription right to the extent holders did not fully subscribe for their basic subscription rights
.
The Rights Offering expired on June 24, 2009. The Rights Offering was fully subscribed resulting in the Company receiving gross proceeds of $21,000,000, prior to the deduction of $146,000 in offering costs, and distributing all 4.2 million shares of its common stock available under the Rights Offering. (See Note 5E).
On July 29, 2009, the Company filed a registration statement with the SEC with respect to a proposed rights offering to holders of the Company’s common stock of up to 2.0 million shares of the Company’s common stock (the “Second Rights Offering”). On September 15, 2009, the Company filed an amendment to its registration statement to increase the number of shares of common stock offered in the Second Rights Offering to 3.6 million. The Company distributed to each holder of record as of close of business on October 19, 2009, at no charge, 0.23 of a non-transferable subscription right for each share held as of such date (23 subscription rights for every 100 shares). Each whole subscription right entitled the stockholder to purchase one share of common stock
at the purchase price of $5.00 per share, for an aggregate of 3.6 million shares. Shareholders who exercised their rights in full were also entitled to purchase additional shares pursuant to an over-subscription right to the extent holders did not fully subscribe for their basic subscription rights. The Rights Offering expired on November 30, 2009. The Rights Offering was fully subscribed resulting in the Company receiving gross proceeds of $18,000,000, prior to the deduction of $113,000 in offering costs, and distributing all 3.6 million shares of its common stock available under the Second Rights Offering. (See Note 5F).
F-23
Zion Oil & Gas, Inc.
(A Development Stage Company)
Notes to Financial Statements as of December 31, 2010
|
B.
|
Management Presentation and Liquidity (cont’d)
|
On January 28, 2010, the Company filed a registration statement on Form S-3 with the SEC with respect to a shelf offering. The registration statement, as subsequently amended on March 26, 2010, was declared effective on April 16, 2010 (the “Shelf Registration Statement”). Utilizing the Shelf Registration Statement, in May 2010, the Company launched a rights offering to raise up to $50 million (the “Third Rights Offering”). Under the Third Rights Offering, the Company distributed to each holder of record as of the close of business on May 6, 2010, at no charge, 0.5 of a subscription right for each share held as of such date (i.e., one subscription right for each two shares). Each whole subscription right entitled the stockholder to purchase one share of common
stock at the purchase price of $5.00 per share. Shareholders who exercised their rights in full were entitled to purchase additional shares pursuant to an over-subscription right to the extent holders did not fully subscribe for their basic subscription rights. The Third Rights Offering, originally scheduled to terminate on June 30, 2010, was extended to July 15, 2010, whereupon it expired. In total, in connection with the Third Rights Offering, the Company received subscriptions for a total of 2,471,117 shares, resulting in gross proceeds of $12,355,585. After deducting $213,000 in offering costs, the Company received net proceeds of $12,142,585. (See Note 5G).
Utilizing the remaining amount on the Shelf Registration Statement, in October 2010, the Company launched a rights offering to raise approximately $19 million (the “Fourth Rights Offering”). Under the Fourth Rights Offering, the Company distributed to each holder of record as of close of business on September 28, 2010, at no charge, 0.18 of a subscription right for each share held as of such date (i.e., eighteen subscription rights for each one hundred shares). Each whole subscription right entitled the stockholder to purchase one unit (a “Unit”) at the purchase price of $5.00 per Unit, with each Unit consisting of (a) one share of Common Stock, and (b) one warrant to purchase an additional share of the Company’s Common Stock at an exercise price of $4.00 per
share (a “Warrant”). The Fourth Rights Offering was originally scheduled to terminate on November 15, 2010, but was subsequently extended to December 15, 2010, whereupon it expired. In total, in connection with the Fourth Rights Offering, the Company received subscriptions for a total of 3,642,821 Units, resulting in gross proceeds of $18, 214,105. After deducting $266,321, the Company received net proceeds of $17,947,784. (See Note 5H).
In the opinion of management, all adjustments considered necessary for a fair presentation of financial position, results of operations, and changes in financial position have been included. See Note 2C for a discussion of the Company recording an impairment of unproved oil and gas properties following the cessation of operations on the Ma’anit #1 well and the formal relinquishment of the Ma’anit-Joseph License in June 2007 and the recording of another impairment of unproved oil and gas properties following the cessation of operations on the Ma’anit-Rehoboth #2 well in June 2010.
|
C.
|
Basis of Presentation
|
The financial statements for all periods from inception (April 6, 2000) until December 31, 2005 were previously restated to reflect additional expenses related to stock warrants issued to employees and non-employees during the above mentioned period and compensation cost with respect to equity awards provided with new debt issuances and/or debt modification.
The financial statements have been prepared on a going concern basis, which contemplates realization of assets and liquidation of liabilities in the ordinary course of business. Since the Company is in the development stage, it has limited capital resources, no revenue, and a loss from operations. The appropriateness of using the going concern basis is dependent upon the Company’s ability to obtain additional financing or equity capital to finance its current operations and, ultimately, to achieve profitable operations. Management is of the opinion that the equity funds raised by the Company in its Follow On Public Offering, and in its four rights offerings (see Note 1B and Notes 5D, 5E, 5F, 5G and 5H) are sufficient to finance its plan of operations, as described, through December 31
2011. To carry out further planned operations beyond that date, the Company must raise additional funds through either additional equity raises or private financing.
F-24
Zion Oil & Gas, Inc.
(A Development Stage Company)
Notes to Financial Statements as of December 31, 2010
|
A.
|
Financial Statements in United States Dollars
|
The currency of the primary economic environment in which the operations of the Company are conducted is the United States dollar (“dollar”). Therefore, the dollar has been determined to be the Company’s functional currency. Non-dollar transactions and balances have been translated into dollars in accordance with the principles set forth in Accounting Standards Codification (“ASC”) 830 “Foreign Currency Matters”.
Transactions in foreign currency (primarily in New Israeli Shekels – “NIS”) are recorded at the exchange rate as of the transaction date. Monetary assets and liabilities denominated in foreign currency are translated on the basis of the representative rate of exchange at the balance sheet date. Non-monetary assets and liabilities denominated in foreign currency are stated at historical exchange rates. All exchange gains and losses from remeasurement of monetary balance sheet items denominated in non-dollar currencies are reflected in the statement of operations as they arise.
|
B.
|
Cash and Cash Equivalents
|
The Company maintains cash balances at two banks with one bank (FDIC insured) located in the United States and one bank located in Israel. Additional amounts of the Company’s cash are maintained in a money market mutual fund. For purposes of the statement of cash flows, the Company considers all highly liquid investments with a maturity of three months or less to be cash equivalents.
|
C.
|
Oil and Gas Properties and Impairment
|
The Company follows the full-cost method of accounting for oil and gas properties. Accordingly, all costs associated with acquisition, exploration and development of oil and gas reserves, including directly related overhead costs, are capitalized.
All capitalized costs of oil and gas properties, including the estimated future costs to develop proved reserves, are amortized on the unit-of-production method using estimates of proved reserves. Investments in unproved properties and major development projects are not amortized until proved reserves associated with the projects can be determined or until impairment occurs. If the results of an assessment indicate that the properties are impaired, the amount of the impairment is included in loss from continuing operations before income taxes and the adjusted carrying amount of the unproved properties is amortized on the unit-of-production method.
F-25
Zion Oil & Gas, Inc.
(A Development Stage Company)
Notes to Financial Statements as of December 31, 2010
Note 2 - Summary of Significant Accounting Policies (cont’d)
|
C.
|
Oil and Gas Properties and Impairment (cont’d)
|
The Company’s oil and gas property represents an investment in unproved properties and two major development projects on that property. These costs are excluded from the amortized cost pool until proved reserves are found or until it is determined that the costs are impaired. All costs excluded are reviewed at least quarterly to determine if impairment has occurred. The amount of any impairment is charged to expense since a reserve base has not yet been established. Impairment requiring a charge to expense may be indicated through evaluation of drilling results, relinquishing drilling rights or other information. During 2010 and 2007, impairment charges of $22,022,000 and $9,494,000 were recorded. The total net book value of the unproved oil and gas properties under the full
cost method is $25,882,000 at December 31, 2010. Management assessed the recoverability of this asset on a quarterly basis during 2009 and 2010 and recorded one impairment charges on this asset in 2010. However, it is possible that the Company’s determination that the unproved oil and gas properties are not impaired could change in the near term, should either oil prices decrease, drilling costs, completion costs, facility costs or other associated overhead costs increase significantly, or negative testing results related to the commercial viability of the wells.
Abandonment of properties is accounted for as adjustments to capitalized costs. The net capitalized costs are subject to a “ceiling test” which limits such costs to the aggregate of the estimated present value of future net revenues from proved reserves discounted at ten percent based on current economic and operating conditions, plus the lower of cost or fair market value of unproved properties. The recoverability of amounts capitalized for oil and gas properties is dependent upon the identification of economically recoverable reserves, together with obtaining the necessary financing to exploit such reserves and the achievement of profitable operations.
In June 2007, following the analysis of the results of the testing of the Company’s Ma’anit #1 well workover and an evaluation of the mechanical condition of the well, the Company determined that the well
was incapable of producing oil and/or gas in commercial quantities. In order to optimize drilling operations on the Company’s planned Ma’anit-Rehoboth #2 well, the Company ceased operations on the Ma’anit #1 well and, as required by the Petroleum Law, formally relinquished the Ma’anit-Joseph License. As planned, the Company used the Ma’anit #1 wellbore, down to approximately 3,000 meters (9,842 feet), as the upper part of the wellbore for the Ma’anit-Rehoboth
#2 well. This well was directionally drilled from that point to penetrate the middle and the lower Triassic. The Company drilled this well to a depth of 5,460 meters (17,913 feet). In April 2010, following production and other testing, management concluded that commercial quantities of hydrocarbons were not present in the Ma’anit-Rehoboth #2 well. Accordingly, the Company recorded a non-cash impairment charge of $22,022,000 in the quarter ended June 30, 2010 to its unproved oil and gas properties.
Immediately after the relinquishment of the Ma’anit-Joseph License, the Company filed an application with the Petroleum Commissioner for a petroleum exploration license, the Joseph License, covering approximately 83,272 acres of the original Ma’anit-Joseph License including the Ma’anit structure on which the Ma’anit #1 well was drilled, which license was subsequently granted on October 11, 2007. As a result of the abandonment of the Ma’anit #1 well and formal relinquishment of the Ma’anit-Joseph License, the Company recorded in June 2007 an impairment of $9,494,000 to its unproved oil and gas properties.
The Company’s ability to maintain present operations is currently dependent on two petroleum exploration licenses: (a) The Joseph License, in respect of which a well has been drilled and testing is under way (See Note 1A); (b) the Asher-Menashe License, in respect of which drilling operations have been temporarily suspended on the Elijah #3 well pending the further engineering analysis required to check the viability of reentering the Elijah #3 well.
F-26
Zion Oil & Gas, Inc.
(A Development Stage Company)
Notes to Financial Statements as of December 31, 2010
Note 2 - Summary of Significant Accounting Policies (cont’d)
|
C.
|
Oil and Gas Properties and Impairment (cont’d)
|
The Company has no economically recoverable reserves and no amortization base. Excluding the impairment charges discussed above in the aggregate amount of $22,022,000 recorded in the quarter ended June 30, 2010, the Company’s unproved oil and gas properties consist of capitalized exploration costs of
$24,145,000 and $18,513,000 for the years ended December 31, 2010 and 2009, respectively.
(See Note 4).
|
D.
|
Property and Equipment
|
Property and equipment other than oil and gas property and equipment is recorded at cost and depreciated over its estimated useful lives of three to fourteen years. Depreciation charged to expense amounted to $34,000, $22,000, $29,000, and $122,000 for the years ended December 31, 2010, 2009, 2008 and for the period from April 6, 2000 (inception) to December 31, 2010, respectively.
|
E.
|
Assets Held for Severance Benefits
|
Assets held for employee severance benefits represent contributions to severance pay funds and insurance policies that are recorded at their current redemption value.
|
F.
|
Costs Associated with Public and Private Equity Offerings
|
Costs associated with each specific private or public equity offering are accumulated until either the closing of the offering or its abandonment. If the offering is abandoned, the costs are expensed in the period the offering is abandoned. If the offering is completed and funds are raised, the accumulated costs are recorded
as a reduction to the paid-in capital attributable to the equity offering. Capital issuance costs not attributable to any specific offering are charged to expense as incurred. Costs associated with public and private equity offerings charged to additional paid in capital amounted to $479,000, $478,000, $815,000 and $4,242,000 for the years ended December 31, 2010, 2009, 2008 and for the
period April 6, 2000 (inception) to December 31, 2010, respectively.
|
G.
|
Use of Estimates
|
The preparation of the accompanying financial statements in conformity with accounting principles generally accepted in the United States of America requires management to make estimates and assumptions about future events. These estimates and the underlying assumptions affect the amounts of assets and liabilities reported, disclosures about contingent assets and liabilities, and reported amounts of revenues and expenses. Such estimates include the valuation of unproved oil and gas properties, deferred tax assets and legal contingencies. These estimates and assumptions are based on management’s best estimates and judgment. Management evaluates its estimates and assumptions on an ongoing basis using historical experience and other factors, including the current
economic environment, which management believes to be reasonable under the circumstances. We adjust such estimates and assumptions when facts and circumstances dictate. Illiquid credit markets, volatile equity, foreign currency, and energy markets have combined to increase the uncertainty inherent in such estimates and assumptions. As future events and their effects cannot be determined with precision, actual results could differ significantly from these estimates. Changes in those estimates resulting from continuing changes in the economic environment will be reflected in the financial statements in future periods.
F-27
Zion Oil & Gas, Inc.
(A Development Stage Company)
Notes to Financial Statements as of December 31, 2010
Note 2 - Summary of Significant Accounting Policies (cont’d)
|
H.
|
Income Taxes
|
Income taxes are accounted for under the asset and liability method. Deferred tax assets and liabilities are recognized for the future tax consequences attributable to differences between the financial statement carrying amounts of existing assets and liabilities and their respective tax bases and operating loss and tax credit carryforwards. Deferred tax assets and liabilities are measured using enacted tax rates expected to apply to taxable income in the years in which those temporary differences are expected to be recovered or settled (see note 7). The effect on deferred tax assets and liabilities of a change in tax rates is recognized in income in the period that includes the enactment date.
Based on ASC 740-10-25-6, “Income Taxes”, the Company recognizes the effect of income tax positions only if those positions are more likely than not of being sustained. Recognized income tax positions are measured at the largest amount that is greater than 50% likely of being realized. Changes in recognition or measurement are reflected in the period in which the change in judgment occurs. Prior to the adoption of ASC 740-10-25-6 (previously known as FIN 48), the Company recognized the effect of income tax positions only if such positions were probable of being sustained. The Company accounts for interest and penalties related to unrecognized tax benefits, if and when required, as part of income tax expense in the statement of operations.
|
I.
|
Environmental Costs and Loss Contingencies
|
Liabilities for loss contingencies, including environmental remediation costs not within the scope of FASB ASC Subtopic 410-20,
Asset Retirement Obligations and Environmental Obligations – Asset Retirement Obligations
, arising from claims, assessments, litigation, fines, and penalties and other sources, are recorded when probable that a liability has been incurred and the amount of the assessment and/or remediation can be reasonably estimated. Legal costs incurred in connection with loss contingencies are expensed as incurred. Recoveries of environmental remediation costs from third parties that are probable of realization are separately recorded as assets, and are not offset against the related environmental liability.
Accruals for estimated losses from environmental remediation obligations generally are recognized no later than completion of the remedial feasibility study. Such accruals are adjusted as further information develops or circumstances change. Costs of expected future expenditures for environmental remediation obligations are not discounted to their present value.
|
J.
|
Asset Retirement Obligation
|
Obligations for dismantlement, restoration and removal of facilities and tangible equipment at the end of an oil and gas property’s useful life are recorded based on the estimate of the fair value of the liabilities in the period in which the obligation is incurred. This requires the use of management’s estimates with respect to future abandonment costs, inflation, market risk premiums, useful life and cost of capital. The estimate of asset retirement obligations does not give consideration to the value the related assets could have to other parties, although it does take into account estimated residual salvage values. The obligation is recorded if sufficient information about the timing and (or) method of settlement is available to reasonably estimate fair
value. Company management believes that the costs to remediate the drill sites are approximately $50,000.
F-28
Zion Oil & Gas, Inc.
(A Development Stage Company)
Notes to Financial Statements as of December 31, 2010
|
K.
|
Net Loss per Share Data
|
Basic and diluted net loss per common share is presented in conformity with ASC 260-10 “Earnings Per Share”. Diluted net loss per share is the same as basic net loss per share as the inclusion of 4,527,665 and 994,703, common stock equivalents in 2010 and 2009, respectively, would be anti-dilutive.
Due to the new common stock shares that were issued in connection with the Rights Offering during June 2009, the weighted average shares outstanding was adjusted again by a factor of 1.089 which, in turn, adjusted the earnings per share calculations for the bonus element associated with the Rights Offering shares, as prescribed by ASC 260-10, “Earnings Per Share”.
Due to the new common stock shares that were issued in connection with the Second Rights Offering during December 2009, the weighted average shares outstanding was adjusted again by a factor of 1.037 which, in turn, adjusted the earnings per share calculations for the bonus element associated with the Second Rights Offering shares, as prescribed by ASC 260-10, “Earnings Per Share”.
The Third Rights Offering did not consist of any bonus element.
Due to the new common stock shares that were issued in connection with the Fourth Rights Offering during December 2010, the weighted average shares outstanding was adjusted again by a factor of 1.071 which, in turn, adjusted the earnings per share calculations for the bonus element associated with the Fourth Rights Offering shares, as prescribed by ASC 260-10, “Earnings Per Share”.
|
L.
|
Stock Based Compensation
|
The Company implements ASC 718-20-55, “Compensation – Stock Compensation” (“ASC 718-20-55”), which requires measurement of compensation cost for all stock-based awards based upon the fair value on date of grant and recognition of compensation over the service period for awards expected to vest. Under this method, the Company has recognized compensation cost for awards granted beginning January 1, 2006, based on the Black-Scholes option-pricing method.
The value of stock options, as noted, is recognized as compensation expense on a straight-line basis, over the requisite service period of the entire award, net of estimated forfeitures.
|
M.
|
Recently Adopted Accounting Pronouncements
|
During 2010, there were no accounting pronouncements which were issued and which have relevancy to the Company’s business.
F-29
Zion Oil & Gas, Inc.
(A Development Stage Company)
Notes to Financial Statements as of December 31, 2010
Israeli law generally requires payment of severance pay upon dismissal of an employee or upon termination of employment in certain other circumstances. The following principal plans relate to the employees in Israel:
|
|
A.
|
The liability in respect of certain of the Company’s employees is discharged in part by participating in a defined contribution pension plan and making regular deposits with recognized pension funds.
|
|
|
The deposits are based on certain components of the salaries of the said employees. The custody and management of the amounts so deposited are independent of the Company’s control and accordingly such amounts funded (included in expenses on an accrual basis) and related liabilities are not reflected in the balance sheet.
|
|
|
B.
|
The Company’s liability for severance pay for its Israeli employees is calculated pursuant to Israeli severance pay law based on the most recent salary of the employee multiplied by the number of years of employment, as of the balance sheet date. Employees are entitled to one month’s salary for each year of employment, or a portion thereof. Certain senior executives are entitled to receive additional severance pay. The Company’s liability for all of its Israeli employees is partly provided for by monthly deposits in insurance policies and the remainder by an accrual in the financial statements. The value of these policies is recorded as an asset in the Company’s balance sheet.
|
|
|
The deposited funds include profits/loss accumulated up to the balance sheet date. The value of the deposited funds is based on current redemption value of these policies.
|
|
|
C.
|
Withdrawals from the funds may be made only upon termination of employment.
|
|
|
D.
|
As of December 31, 2010 and 2009, the Company has a provision for severance pay of $339,000 and $185,000, respectively, of which all was long-term. As of December 31, 2010 and 2009, the Company has $92,000 and $46,000 respectively, deposited in funds managed by major Israeli financial institutions which are earmarked to cover severance pay liability. Such deposits are not considered to be “plan assets” and are therefore included in other assets.
|
Unproved oil and gas properties, under the full cost method, are comprised as follows
:
|
December 31, 2010
|
December 31, 2009
|
|||||||
|
US$ thousands
|
US$ thousands
|
|||||||
|
Excluded from amortization base:
|
||||||||
|
Drilling operations, completion costs and other related costs (1)
|
20,383 | 20,823 | ||||||
|
Capitalized salary costs
|
883 | 1,003 | ||||||
|
Legal costs, license fees and other preparation costs
|
2,694 | 922 | ||||||
|
Other costs
|
1,922 | 1,011 | ||||||
| 25,882 | 23,759 | |||||||
(1) includes asset retirement costs of $50,000.
F-30
Zion Oil & Gas, Inc.
(A Development Stage Company)
Notes to Financial Statements as of December 31, 2010
Impairment of unproved oil and gas properties comprised as follows:
|
Year ended
December 31
2010
|
Period from April
6, 2000
(inception) to
December 31,
2010
|
|||||||
|
US$ thousands
|
US$ thousands
|
|||||||
|
Drilling operations, completion costs and other related costs
|
20,419 | 28,378 | ||||||
|
Capitalized salary costs
|
620 | 1,303 | ||||||
|
Legal costs and license fees
|
- | 509 | ||||||
|
Other costs
|
983 | 1,326 | ||||||
| 22,022 | 31,516 | |||||||
In the years ended December 31, 2009 and 2008, there were no impairment charges.
|
A.
|
Authorized Common Shares
|
In June 2009, the shareholders of the Company voted to increase the authorized common shares from 30 million to 50 million. In June 2008, the shareholders of the Company approved an increase of the authorized common shares from 20 million to 30 million.
|
B.
|
Private Placement Offerings
|
During 2000, John Brown purchased 2,400,000 shares at the then current par value ($0.001 per share) on his behalf and on behalf of 25 other founding shareholders. Between January 1, 2001 and December 31, 2004, the Company raised $3,125,000 in private placements from the sale (adjusted for the reincorporation merger on July 9, 2003) of 1,830,298 shares of common stock and: (i) warrants with an original expiration date of December 31, 2004 to purchase 275,833 shares of common stock at $1.00 per share; (ii) warrants with an original expiration date of December 31, 2004 to purchase 411,770 shares of common stock at $1.50 per share; and (iii) warrants with an original expiration date of December 31, 2006 to purchase 181,500 shares of common stock at $5.00 per share. The December 31, 2004 warrant expiration
date was extended to January 31, 2005 by which date the warrants were exercised. Between January 1, 2005 and
March 31, 2005, the Company raised $2,140,000 through the sale of 535,000 shares of common stock and warrants to purchase 214,000 shares of the Company’s common stock in a private placement offering. The warrants designated as “E warrants” were exercisable at $5.00 per share through December 31, 2006. Between April 22 and June 10, 2005, the Company raised $1,380,000 through the sale of 276,000 shares of common stock and 55,200 E Warrants. Between June 20, 2005 and October 24, 2005, the Company raised $3,230,000 through the sale of 646,000 shares of common stock.
During December 2005, the Company raised $440,000 from the sale of 80,000 shares of common stock and warrants to purchase 12,500 shares of common stock at $5.50 per share at any time from July 1, 2007 through December 31, 2008, such warrants being designated as “G” warrants.
F-31
Zion Oil & Gas, Inc.
(A Development Stage Company)
Notes to Financial Statements as of December 31, 2010
Note 5 - Stockholders’ Equity (cont’d)
|
B.
|
Private Placement Offerings (cont’d)
|
During 2006, the Company (i) raised $489,000 from the sale of 89,000 shares of common stock and 7,125 G warrants; (ii) issued 62,493 shares of common stock for $291,000 in consideration of services; (iii) issued 175,357 shares of common stock for $877,000 upon the exercise of E warrants; (iv) issued 35,000 shares of common stock for $105,000 upon the exercise of $3.00 warrants; and (v) issued 42,957 shares of common stock for $172,000 upon the exercise of “D” warrants. (See Note 5I).
|
C.
|
Initial Public Offering
|
On December 29, 2006, the Company completed its first closing of the 2006 Public Offering in which it accepted subscriptions in the amount of $3,059,000 in consideration of the planned issuance of 436,907 shares of common stock. Between January 1, 2007 and May 25, 2007, the Company completed additional closings in which it accepted additional subscriptions for 1,369,428 shares of its common stock in the amount of $9,587,000, bringing the total amount raised in the 2006 Public Offering through May 25, 2007 to $12,645,000. The offering terminated on May 25, 2007. (See Note 8G).
|
D.
|
Follow On Public Offering
|
On February 1, 2008, the Company filed the 2008 Registration Statement with the SEC for an offering of a minimum of 325,000 Units, on a "best efforts, all or none" basis, and a maximum of 2,500,000 Units, at $10.00 per Unit for aggregate gross proceeds to the Company of $3,250,000 and $25,000,000. Each Unit offered in the Follow On Public Offering consisted of (i) one share of common stock and (ii) one warrant (the "Unit Warrant") to purchase one share of common stock at a per share exercise price equal to $7.00. (See Note 5G). The Follow On Public Offering was made through Brockington Securities, Inc. and other licensed broker/dealers. The 2008 Registration Statement was declared effective by the SEC on May 14, 2008, whereupon our offering commenced and continued through the scheduled
expiration date of January 9, 2009.
Between October 24, 2008 and December 31, 2008, the Company raised gross proceeds in the Follow On Public Offering of $4,165,000, including $120,000 debt conversion. After deducting for commissions (5%) and expenses (3%) to the underwriter in the amount of $324,000 and the deduction of $491,000 in deferred offering costs (related to legal, accounting, transfer agent and escrow fees and printing and marketing costs), the Company received net proceeds of $3,230,000 in the Follow On Public Offering through December 31, 2008.
In January 2009, the Company raised an additional $2,498,000, including $120,000 debt conversion and approximately $6,000 in settlement of fees due to two service providers. Total gross proceeds raised in the Follow On Public Offering were $6,663,000, including $240,000 of debt conversions made by two senior officers/directors of deferred amounts due to them and approximately $6,000 payments in respect of the total amounts raised, 666,343 units of our securities (641,768 for cash and 24,575 for debt conversions and payments of fees to service providers). Commencing 3
rd
January, 2011 and continuing through March 7th, 2011, the exercise price of the Unit Warrants was reduced to $4 (See Note 10).
F-32
Zion Oil & Gas, Inc.
(A Development Stage Company)
Notes to Financial Statements as of December 31, 2010
Note 5 - Stockholders’ Equity (cont’d)
|
E.
|
Rights Offering
|
On January 29, 2009,
the Company filed a registration statement with the SEC with respect to a proposed rights offering to holders of the Company’s common stock of up to 4.2 million shares of the Company’s common stock. The Company distributed to each holder of record as of close of business on May 4, 2009, at no charge, 0.375 of a subscription right for each share held as of such date (three subscription rights for each eight shares). Each whole subscription right entitled the stockholder to purchase one share of common stock at the purchase price of $5.00 per share, for up to an aggregate of 4.2 million shares. Shareholders who exercised their rights in full were also entitled to purchase additional shares pursuant to an over-subscription
right to the extent holders did not fully subscribe for their basic subscription rights. The rights offering, originally scheduled to expire on June 10, was extended to June 24, 2009.
The rights offering was fully subscribed resulting in the Company distributing all 4.2 million shares of its common stock available. Net proceeds of $20,854,000 from the Rights Offering, after deducting $146,000 in offering costs from the gross proceeds of $21,000,000,
are being applied to the Company’s drilling program and other operations.
Due to the new common stock shares that were issued in connection with the Rights Offering during June 2009, the weighted average shares outstanding in previous periods will be adjusted by a factor of 1.089 which in turn will adjust the earnings per share calculations for the bonus element associated with the Rights Offering, as prescribed by ASC 260-10, “Earnings per Share”.
|
F.
|
Second Rights Offering
|
On July 29, 2009,
the Company filed a registration statement with the SEC with respect to a proposed Second Rights Offering to holders of the Company’s common stock of up to 2 million shares of the Company’s common stock. On September 15, 2009, the Company amended the registration statement to increase the number of shares of common stock that can be purchased in the Second Rights Offering from 2 million shares to 3.6 million shares. The registration statement, as subsequently amended on October 1, 2009, was declared effective on October 9, 2009, and the Company distributed to each holder of record as
of close of business on October 19, 2009, at
no charge, 0.23 of a subscription right for each share held as of such date (twenty-three subscription rights for each one hundred shares). Each whole subscription right entitled the stockholder to purchase one share of common stock at the purchase price of $5.00 per share, for up to an aggregate of 3.6 million shares. Shareholders who exercised their rights in full were also entitled to purchase additional shares pursuant to an over-subscription right to the extent holders did not fully subscribe for their basic subscription rights. The Second Rights Offering terminated on November 30, 2009.
The Second Rights Offering was fully subscribed resulting in the Company distributing all 3.6 million shares of its common stock available. Net proceeds of $17,887,000 from the Second Rights Offering, after deducting $113,000 in offering costs from the gross proceeds of $18,000,000,
are being applied to the Company’s drilling program and other operations.
Due to the new common stock shares that were issued in connection with the Second Rights Offering during December 2009, the weighted average shares outstanding in previous periods will be adjusted by a factor of 1.037 which in turn will adjust the earnings per share calculations for the bonus element associated with the Second Rights Offering, as prescribed by ASC 260-10, “Earnings per Share”.
F-33
Zion Oil & Gas, Inc.
(A Development Stage Company)
Notes to Financial Statements as of December 31, 2010
Note 5 - Stockholders’ Equity (cont’d)
|
G.
|
Third Rights Offering
|
On January 28, 2010,
the Company filed a registration statement on Form S-3 with the SEC with respect to a shelf offering. The registration statement, as subsequently amended on March 26, 2010, was declared effective on April 16, 2010 (the “Shelf Registration Statement”).
Utilizing the Shelf Registration Statement, in May 2010, the Company launched a rights offering to raise up to $50 million (the “Third Rights Offering”). Under the Third Rights Offering, the Company distributed to each holder of record as of the close of business on May 6, 2010, at no charge, 0.5 of a subscription right for each share of common stock held as of such date (i.e. one subscription right for each two shares). Each whole subscription right entitled the stockholder to purchase one share of common stock at the purchase price of $5.00 per share, for up to an aggregate of 10 million shares. Shareholders who exercised their rights in full were also entitled to purchase additional shares pursuant to an over-subscription right to the extent holders did not fully
subscribe for their basic subscription rights. The Third Rights Offering was originally scheduled to terminate on June 30, 2010 but was subsequently extended to July 15, 2010, whereupon it expired.
The Third Rights Offering received subscriptions totaling 2,471,117 shares, resulting in gross proceeds of $12,355,585. After deducting $213,000 in offering costs, the Company received net proceeds of $12,142,585.
The Third Rights Offering did not consist of any bonus element.
|
H.
|
Fourth Rights Offering
|
Utilizing the Shelf Registration Statement, in October 2010, the Company launched a rights offering to raise approximately $19 million (the “Fourth Rights Offering”). Under the Fourth Rights Offering, the Company distributed to each holder of record as of close of business on September 28, 2010, at no charge, 0.18 of a subscription right for each share held as of such date (i.e., eighteen subscription rights for each one hundred shares). Each whole subscription right entitles the stockholder to purchase one unit (a “Unit”) at the purchase price of $5.00 per Unit, with each Unit consisting of (a) one share of Common Stock, and (b) one warrant to purchase an additional share of the Company’s Common Stock at an exercise price of $4.00 per share (a
“Warrant”). The Fourth Rights Offering was scheduled to terminate on November 15, 2010, but was subsequently extended to December 15, 2010, at which time it expired.
The Fourth Rights Offering received subscriptions totaling 3,642,821 Units, resulting in gross proceeds of $18,214,000. After deducting $266,000 in offering costs, the Company received net proceeds of $17,948,000.
Due to the new common stock shares that were issued in connection with the Fourth Rights Offering during December 2010, the weighted average shares outstanding in previous periods will be adjusted by a factor of 1.071 which in turn will adjust the earnings per share calculations for the bonus element associated with the Fourth Rights Offering, as prescribed by ASC 260-10, “Earnings per Share”.
|
I.
|
2005 Stock Option Plan
|
During 2005, a stock option plan (the “Plan”) was adopted by the Company, pursuant to which 1,000,000 shares of common stock are reserved for issuance to officers, directors, employees and consultants. The Plan is administered by the Board of Directors or one or more committees appointed by the board (the “Administrator”).
F-34
Zion Oil & Gas, Inc.
(A Development Stage Company)
Notes to Financial Statements as of December 31, 2010
Note 5 - Stockholders’ Equity (cont’d)
|
I.
|
2005 Stock Option Plan (cont’d)
|
The Plan contemplates the issuance of stock options by the Company both as a private company and as a publicly traded company and is available to residents of the United States, the State of Israel and other jurisdictions as determined by the Administrator. Awards of stock options under the Plan are made pursuant to an agreement between the Company and each grantee. The agreement will, among other provisions, specify the number of shares subject to the option, intended tax qualifications, the exercise price, any vesting provisions and the term of the stock option grant, all of which are determined on behalf of the Company by the Administrator. The Plan will remain in effect for a term of ten years unless terminated or extended according to its provisions.
On July 5, 2006, award agreements under the 2005 Stock Option Plan were entered into as follows: (a) with two directors each for the purchase of 25,000 shares of common stock at an exercise price of $5.00 per share (50,000 shares in the aggregate) through December 31, 2008, subsequently extended to December 31, 2009, at a value of $59,000 in the aggregate (the rights to these options vested on the date the award agreement was signed, and the options became exercisable commencing on July 1, 2007), and were exercised during the quarter ended September 30, 2009 via cashless exercise; (b) with one employee (who resigned effective June 1, 2007) for the purchase of 80,000 shares of common stock at an exercise price of $5.00 per share through December 31, 2010 (of these, options to purchase 26,667 shares of
common stock vested on January 1, 2007 at a value of $65,000 charged to the Company according to the vesting period, with an adjustment recorded at the termination date of June 1, 2007; the remaining non-vested options to purchase 53,333 shares of common stock were cancelled upon the resignation of the officer in accordance with the terms of the award agreement; the vested options were not able to be exercised prior to July 1, 2007); and (c) with one employee for the purchase of 40,000 shares of common stock at an exercise price of
$5.00 per share through December 31, 2010 (these options will vest in four equal tranches of four vesting periods of 10,000 shares each, on the date the award agreement was signed, and on October 1, 2006, on October 1, 2007 and October 1, 2008 at a value of $97,000 that will be charged according to the vesting periods, and the options exercisable commencing July 1,
2007). Although award agreements with respect to these options were signed in July 2006: (a) their issuance was authorized and their terms, including their exercise price, were fixed by resolution of the board of directors taken on October 27, 2005; (b) the commencement of the service period for the options preceded the grant date and (c) the value of the options were initially accounted for during December 2005. Compensation expense was recorded commencing December 2005 based on the fair value of the options at that time.
During November 2008, the expiration date for the awards detailed in (a) above, that were to have expired on December 31, 2008, were extended to December 31, 2009. All other terms of the award were unchanged. An additional expense of approximately $22,000 was recorded as an adjustment to the original expense recognized.
On July 1, 2007, an award agreement under the 2005 Stock Option Plan was entered into with one employee (who resigned effective June 30, 2009) for the purchase of 50,000 shares of common stock at an exercise price of $5.60 per share through December 31, 2012 (these options were to vest in three tranches – 20,000 on June 30, 2008; 15,000 on June 30, 2009 and 15,000 on June 30, 2010, at a value of $126,000 that will be charged according to the vesting periods). Due to the employee’s resignation, an amount of $24,000
was never recognized as a result of the non-vesting of the options. A decrease of $14,000 was recorded as an adjustment during the quarter ended March 31, 2009 as a result of the change
in the expense to be recognized.
F-35
Zion Oil & Gas, Inc.
(A Development Stage Company)
Notes to Financial Statements as of December 31, 2010
Note 5 - Stockholders’ Equity (cont’d)
|
I.
|
2005 Stock Option Plan (cont’d)
|
On December 4, 2007, award agreements under the 2005 Stock Option Plan were entered into as follows: (a) with one employee for the purchase of 40,000 shares of common stock at an exercise price of $0.01 per share through December 3, 2017 at a value of $257,000 (these options vest in four equal tranches of four vesting periods of 10,000 shares each, on January 29, 2008, April 28, 2008, July 27, 2008 and October 25, 2008); (b) with one employee for the purchase of 40,000 shares of common stock at an exercise price of $0.01 per share through December 3, 2017 at a value of $257,000 (the rights to these options vested on the date of the award); and (c) with one employee for the purchase of 3,882 shares of common stock at an exercise price of $0.01 per share through December 3, 2017 at a value of $25,000
(the rights to these options vested on the date of the award).
On January 8, 2009, an award agreement under the 2005 Stock Option Plan was entered into with one employee for the purchase of 40,000 shares of common stock at an exercise price of $0.01 per share through December 3, 2017 at a value of $280,000 (these options vested in four equal tranches of four vesting periods of 10,000 shares each, on March 31, 2009, June 30, 2009, September 30, 2009 and December 31, 2009), which were charged according to the vesting periods. On February 1, 2009, a separate award agreement was entered into with a different employee for the purchase of 50,000 shares of common stock at an exercise price of $7.97 per share through December 31, 2014 (these options were to vest in three tranches – 20,000 on January 31, 2010; 15,000 on January 31, 2011 and 15,000 on January 31,
2012, at a value of $243,000 that was to be charged according to the vesting periods). Due to the employee’s resignation, an amount of $145,800 was never recognized as a result of the non-vesting of the options. A decrease of $47,000 was recorded as an adjustment during the year ended December 31, 2010 as a result of the change in the expense to be recognized.
On June 17, 2009, Zion's Board of Directors agreed to and approved the following fully vested option awards under the 2005 Stock Option Plan: (a) to one director for the purchase of 25,000 shares of common stock at an exercise price of $8.25 per share through June 16, 2012; (b) to Zion staff for the purchase (in aggregate) of 28,000 shares of common stock at an exercise price of $8.25 per share through June 16, 2012; (c) to consultants and service providers of Zion for the purchase (in aggregate) of 59,000 shares of common stock at an exercise price of $8.25 per share through June 16, 2012. The aforementioned June 2009 option grants resulted in the Company recognizing expenses in the amounts of (a) $97,000, (b) $79,000 and (c) $231,000 during June 2009.
In January 2010, the Company’s Board agreed to and approved the following option award grants under the 2005 Stock Option Plan: (a) to one employee for the purchase of 20,000 shares of common stock at an exercise price of $0.01 per share through January 31, 2020 (b) to one employee for the purchase of 40,000 shares of common stock at an exercise price of $0.01 per share through December 3, 2017 (c) to one employee for the purchase of 25,000 shares of common stock at an exercise price of $7.15 per share through December 31, 2014 (d) to one employee for the purchase of 12,000 shares of common stock at an exercise price of $7.15 per share through December 31, 2014. Each of the above grants vest in four equal tranches on March 31, 2010, June 30, 2010, September 30, 2010 and December 31, 2010, and
would have been charged according to the vesting periods on a straight line basis. Due to the employee’s resignation in (c) above, an amount of $17,500 was never recognized as a result of the non-vesting of the options.
F-36
Zion Oil & Gas, Inc.
(A Development Stage Company)
Notes to Financial Statements as of December 31, 2010
Note 5 - Stockholders’ Equity (cont’d)
|
I.
|
2005 Stock Option Plan (cont’d)
|
In January 2010, the Company’s Board agreed to and approved an option award grant under the 2005 Stock Option Plan to one employee pursuant to which such employee is to be awarded, at the end of each quarter, fully vested options exercisable through January 31, 2020 at a per share exercise price of $0.01, to purchase such number of shares of the Company Common Stock as shall equal $12,500 divided by the closing price on the last trading day of the calendar quarter of the Company’s publicly traded share of Common Stock, but in no event at a per share price of less than $5.00. Pursuant thereto, the employee received a first quarter award to purchase 2,022 shares of common stock, a second quarter option award to purchase 2,481 shares of common stock, a third quarter option award to purchase 2,414 shares of common stock and a fourth quarter option award to purchase 2,500 shares of
common stock. The expenses are amortized based on the vesting periods, posting appropriate amounts each quarter.
|
J.
|
Warrants and Options
|
The Company has reserved 1,512,797 shares of common stock as of December 31, 2010 for the exercise of warrants and options to employees and non-employees, of which 894,844 are outstanding. These warrants and options have been excluded from earnings per share calculations because they are anti-dilutive at December 31, 2010 and 2009. These warrants and options could potentially dilute basic earnings per share in future years. The warrants and options exercise prices and expiration dates are as follows:
|
Exercise
|
Number of
|
Expiration
|
Warrants or
|
||||||||
|
price
|
shares
|
Date
|
Options
|
||||||||
|
US$
|
|||||||||||
|
To non-employees
|
8.25 | 58,000 |
June 16, 2012
|
Options
|
|||||||
|
To employees and directors:
|
|||||||||||
| 8.25 | 50,000 |
June 16, 2012
|
Options
|
||||||||
| 7.15 | 30,750 |
December 31, 2014
|
Options
|
||||||||
| 0.01 | 120,000 |
December 3, 2017
|
Options
|
||||||||
| 0.01 | 29,415 |
January 31, 2020
|
Options
|
||||||||
|
To investors:
|
|||||||||||
| 7.00 | 606,679 |
January 31, 2012
|
Warrants
|
||||||||
| 4.00 | 3,642,821 |
December 31, 2012
|
Warrants
|
||||||||
| 4.39 | * | 4,537,665 | |||||||||
* Weighted Average
The warrant and option transactions since April 6, 2000 (inception) are shown in the table below:
|
Number of
|
Weighted Average
|
|||||||
|
Shares
|
exercise price
|
|||||||
|
US$
|
||||||||
|
Granted from April 6, 2000 (inception) to December 31, 2008 to:
|
||||||||
|
Employees, officers and directors as part compensation
|
1,884,818 | 1.76 | ||||||
|
Underwriters (in connection with IPO)
|
46,621 | 8.75 | ||||||
|
Private placement investors and others
|
1,105,492 | 2.84 | ||||||
|
Investors in Follow On Public Offering
|
416,404 | 7.00 | ||||||
|
Expired/canceled
|
(705,684 | ) | 2.61 | |||||
|
Exercised
|
(1,984,077 | ) | 1.59 | |||||
|
Outstanding, December 31, 2008
|
763,574 | 5.81 | ||||||
|
Granted during 2009 to:
|
||||||||
|
Employees, officers and directors as part compensation
|
202,000 | 6.55 | ||||||
|
Investors in Follow On Public Offering
|
249,939 | 7.00 | ||||||
|
Expired/Canceled
|
(40,000 | ) | 5.22 | |||||
|
Exercised
|
(180,810 | ) | 6.62 | |||||
|
Outstanding, December 31, 2009
|
994,703 | 6.14 | ||||||
|
Granted during 2010 to:
|
||||||||
|
Employees, officers, directors and consultants
|
106,415 | 2.49 | ||||||
|
Investors in Fourth Rights Offering
|
3,642,821 | 4.00 | ||||||
|
Expired/Cancelled
|
(161,917 | ) | 6.21 | |||||
|
Exercised
|
(44,357 | ) | 0.08 | |||||
|
Outstanding, December 31, 2010
|
4,537,665 | 4.39 | ||||||
|
Exercisable, December 31, 2010
|
4,537,665 | 4.39 | ||||||
F-37
Zion Oil & Gas, Inc.
(A Development Stage Company)
Notes to Financial Statements as of December 31, 2010
Note 5 - Stockholders’ Equity (cont’d)
|
J.
|
Warrants and Options (cont’d)
|
The aggregate intrinsic value of options exercised during 2010, 2009 and 2008 was approximately $784,000, $557,000, and $313,000, respectively.
The following table summarizes information about stock warrants and options outstanding as of December 31, 2010:
|
Shares underlying outstanding
|
||||||||||||||
|
warrants and options (all fully vested)
|
||||||||||||||
|
Weighted
|
||||||||||||||
|
average
|
||||||||||||||
|
remaining
|
Weighted
|
|||||||||||||
|
Range of
|
Number
|
contractual
|
Average
|
|||||||||||
|
exercise price
|
Outstanding
|
life (years)
|
exercise price
|
|||||||||||
|
US$
|
US$
|
|||||||||||||
| 0.01 | 120,000 | 6.93 | 0.01 | |||||||||||
| 0.01 | 29,415 | 9.09 | 0.01 | |||||||||||
| 7.15 | 30,750 | 4.00 | 7.15 | |||||||||||
| 7.00 | 606,679 | 1.08 | 7.00 | |||||||||||
| 4.00 | 3,642,821 | 2.00 | 4.00 | |||||||||||
| 8.25 | 108,000 | 1.46 | 8.25 | |||||||||||
| 0.01-8.75 | 4,537,665 | 4.39 | ||||||||||||
Granted to employees
The following table sets forth information about the weighted-average fair value of warrants granted to employees and directors during the year, using the Black Scholes option-pricing model and the weighted-average assumptions used for such grants:
|
Period from April 6,
|
||||||||||||
|
For the Year ended December 31,
|
2000 (inception) to
|
|||||||||||
|
2010
|
2009
|
December 31, 2010
|
||||||||||
|
Weighted-average fair value of underlying stock at grant date
|
$ | 6.41 | $ | 7.71 | $3.00 – $8.23 | |||||||
|
Dividend yields
|
- | - | - | |||||||||
|
Expected volatility
|
73.0 – 79.0 | % | 59.0 – 71.0 | % | 28.2% - 79.0 | % | ||||||
|
Risk-free interest rates
|
2.38 – 3.84 | % | 1.79 – 2.47 | % | 1.79% - 5.15 | % | ||||||
|
Expected lives
|
2.19 – 4.88 | 1.5 – 4.81 |
1.5 – 5.31 years
|
|||||||||
|
Weighted-average grant date
fair market value
|
$ | 5.11 | $ | 4.93 | $0.76 - $5.11 | |||||||
Granted to non-employees
The following table sets forth information about the weighted-average fair value of warrants granted to non-employees during the year, using the Black Scholes option-pricing model and the weighted-average assumptions used for such grants:
F-38
Zion Oil & Gas, Inc.
(A Development Stage Company)
Notes to Financial Statements as of December 31, 2010
Note 5 - Stockholders’ Equity (cont’d)
|
J.
|
Warrants and Options (cont’d)
|
|
Period from April 6,
|
||||||||||||
|
For the Year ended December 31,
|
2000 (inception) to
|
|||||||||||
|
2010
|
2009
|
December 31, 2010
|
||||||||||
|
Weighted-average fair value of underlying stock at grant date
|
$ | - | $ | 8.23 | $1.00 – $8.75 | |||||||
|
Dividend yields
|
- | - | - | |||||||||
|
Expected volatility
|
- | 71 | % | 32.2% - 99.8 | % | |||||||
|
Risk-free interest rates
|
- | 1.79 | % | 1.79% - 5.50 | % | |||||||
|
Contractual lives
|
- |
3.00 years
|
0.56 – 3.17 years
|
|||||||||
|
Average grant date fair market value
|
- | $ | 3.91 | $0.68 – $3.91 | ||||||||
The expiration date for 50,000 warrants previously granted to two directors was extended from December 31, 2008 to December 31, 2009 and an expense of $22,000 was recorded as an adjustment to the original expense recognized.
The risk-free interest rate is based on the U.S. Treasury yield curve in effect at the time of grant for periods corresponding with the expected life of the options.
The expected life represents the weighted average period of time that options granted are expected to be outstanding. The expected life of the options granted to employees and directors during 2009 and 2010 is calculated based on the Simplified Method as allowed under Staff Accounting Bulletin No. 110 (“SAB 110”), giving consideration to the contractual term of the options and their vesting schedules, as the Company does not have sufficient historical exercise data at this time. The expected life of the option granted to non-employees equals their contractual term. In the case of an extension of the option life, the calculation was made on the basis of the extended life.
Prior to 2008, due to the lack of sufficient history of the Company’s stock volatility, the Company estimated its own expected stock volatility based on the historic volatility for other oil exploration companies. Beginning in 2008 and continuing through December 31, 2010, the Company’s stock volatility is based on actual trading of the Company’s stock.
|
K.
|
Compensation Cost for Warrant and Option Issuances
|
The following table sets forth information about the compensation cost of warrant and option issuances recognized for employees and directors:
|
Period from
|
||||||||||||||
|
April 6, 2000
|
||||||||||||||
|
For the Year
|
(inception) to
|
|||||||||||||
|
ended December 31
|
December 31
|
|||||||||||||
|
2010
|
2009
|
2008
|
2010
|
|||||||||||
|
US$
|
US$
|
US$
|
US$
|
|||||||||||
| 479,000 | 591,000 | 310,000 | 2,354,000 | |||||||||||
F-39
Zion Oil & Gas, Inc.
(A Development Stage Company)
Notes to Financial Statements as of December 31, 2010
Note 5 - Stockholders’ Equity (cont’d)
|
K.
|
Compensation Cost for Warrant and Option Issuances (cont’d)
|
The following table sets forth information about the compensation cost of warrant and option issuances recognized for non-employees:
|
Period from
|
||||||||||||||
|
April 6, 2000
|
||||||||||||||
|
For the Year
|
(inception) to
|
|||||||||||||
|
ended December 31
|
December 31
|
|||||||||||||
|
2010
|
2009
|
2008
|
2010
|
|||||||||||
|
US$
|
US$
|
US$
|
US$
|
|||||||||||
| - | 231,000 | - | 231,000 | |||||||||||
As of December 31, 2010, there was no unrecognized compensation cost to employees, related to nonvested stock options granted under the Company’s various stock option plans.
|
L.
|
Warrant Descriptions
|
Through December 31, 2010, the Company issued ten different series of warrants to employees, non-employees and investors. The price and the expiration dates are as follows:
|
Period of Grant
|
Exercise
Price
US$
|
Expiration Date
|
||||
|
A Warrants
|
January 2001 – December 2001
|
1.00 |
January 31, 2005
|
|||
|
B Warrants
|
November 2001 – February 2003
|
1.50 |
January 31, 2005
|
|||
|
C Warrants
|
July 2003 – March 2004
|
3.00 |
December 31, 2005
|
|||
|
$3.00 Warrants
|
June 2004 – August 2004
|
3.00 |
December 31, 2006
|
|||
|
D Warrants
|
September 2004 – April 2005
|
4.00 |
December 31, 2006
|
|||
|
E Warrants
|
September 2004 – June 2005
|
5.00 |
December 31, 2006
|
|||
|
F and FF Warrants
|
October 2005
|
5.00 |
* December 31, 2008
|
|||
|
G Warrants
|
December 2005 – January 2006
|
5.50 |
December 31, 2008
|
|||
|
H Warrants
|
December 2006 –May 2007
|
8.75 |
September 26, 2009
|
|||
|
Unit Warrants
|
October 2008 – December 2008
|
7.00 |
January 31, 2012
|
|||
|
Rights Offering Warrants
|
December 2010
|
4.00 |
December 31, 2012
|
|||
* Subsequently extended to December 31, 2009 for some of this class of warrants
F-40
Zion Oil & Gas, Inc.
(A Development Stage Company)
Notes to Financial Statements as of December 31, 2010
|
L.
|
Warrant Descriptions (cont’d)
|
Other than price and date details, all of the warrants, except for the Unit Warrants, were issued on the same conditions, except that the F, FF and G Warrants were not exercisable before July 1, 2007, which date the Company had the right to extend for up to six months (which right was not exercised by the Company), and
H warrants were not exercisable before November 25, 2007, which was six months following the final closing date of the 2006 Public Offering (See Note 5C). The Unit Warrants were issued as a component of a Unit that consisted of one share of common stock and one warrant in the Company’s Follow On Public Offering (See Note 1B and Note 5D). On February 9, 2009, the Unit split into its two
separate components and the warrant became exercisable as of such date. The Rights Offering Warrants were issued as a component of a Unit that consisted of one share of common stock and one warrant in the Company’s Fourth Rights Offering (See Note 5H).
|
M.
|
Gift Shares
|
During the third quarter of 2007, three employees received 1,042 registered shares from one of the executive officers. The related cost of $7,000 was charged to the statement of operations and credited as additional paid in capital.
During the fourth quarter of 2008, sixteen persons who were either employees, vendors or other affiliates of the company received a total of 15,600 shares. Since the gift was being issued from shares that were subject to 144 restrictions, held by one of the executive officers, the shares were transferred with the restrictive legend affixed. Recipients can seek the removal of this restriction on an individual basis as the donor had held the shares in excess of the required time period under Rule 144. The related cost of $101,000 was charged to the statement of operations and credited as additional paid in capital.
During the second quarter of 2009, two persons who are employees of the Company received a total of 400 shares from one of the executive officers. The related value of $4,000 was charged to the statement of operations and credited as additional paid in capital.
At December 31, 2008, deferred officer compensation was $1,487,000. In June 2009, the Board of Directors authorized payment of all amounts previously deferred through May 31, 2009 using proceeds from the Rights Offering and from warrant exercises. (See also Note 8K).
In December 2008 and January 2009, two of the Company’s then senior officers purchased Units in the Follow On Public Offering through the conversion of amounts then owed to them in respect of deferred salaries and other payments in the aggregate amount of $140,000.
At December 2009, deferred officers’ compensation was $477,000, of which $310,000 was paid during January 2010 to two former executive officers (See Note 8K) Most of the officers that have previously deferred payments have agreed to continue to defer a portion of their salaries during 2010.
At December 2010, there were $21,000 deferred officers’ compensation which were fully paid in January of 2011. All other previously deferred balances were paid during 2010.
Richard J. Rinberg
In October 2005 Mr. Rinberg was elected President of the Company and effective November 1, 2005, entered into a two year Retention and Management Agreement with the Company (the “Retention Agreement”). Pursuant to the Retention Agreement, Mr. Rinberg was awarded 200,000 shares of common stock of the Company valued at $500,000 as compensation for his services during the two year period beginning November 1, 2005, subject to restrictions and vesting requirements. The Rinberg Shares were subject to repurchase by the Company at $0.01 per share if Mr. Rinberg had left his position with the Company prior to October 31, 2007. In May 2006, the Company issued the referenced 200,000 shares of common stock to a trust company for the benefit of Mr. Rinberg.
F-41
Zion Oil & Gas, Inc.
(A Development Stage Company)
Notes to Financial Statements as of December 31, 2010
Richard J. Rinberg (cont’d)
In March 2007, Mr. Rinberg was appointed to the position of Chief Executive Officer. Effective November 1, 2007, the Company entered into an employment agreement with Mr. Rinberg (“the Rinberg Employment Agreement”) with an initial expiration term through December 31, 2008, which term is automatically renewed for additional two year terms unless either the Company or Mr. Rinberg gives notice to the other at least 90 days prior to the end of a scheduled term of its election to not renew the agreement. The Rinberg Employment Agreement is currently in effect through December 2012. In connection with the Rinberg Employment Agreement, Mr. Rinberg was granted options to purchase 40,000 shares of the Company’s common stock each year. Accordingly, 40,000
options were granted in January 2009 and another 40,000 options were granted in January 2010. In February 2011, an additional 40,000 options have been granted for the 2011 calendar year, per the terms of the agreement, and are scheduled to vest in equal installments of 10,000 shares per calendar quarter. (See Note 10).
The tax effects of temporary differences that give rise to significant portions of the deferred tax assets and deferred tax liabilities at December 31, 2010 and 2009 are presented below:
|
As of December 31,
|
||||||||
|
2010
|
2009
|
|||||||
|
US$ thousands
|
||||||||
|
Deferred tax assets:
|
||||||||
|
Net operating loss carry forwards
|
26,176 | 15,205 | ||||||
|
Other
|
37 | 63 | ||||||
|
Total gross deferred tax assets
|
26,213 | 15,268 | ||||||
|
Less valuation allowance
|
(18,322 | ) | (8,972 | ) | ||||
|
Net deferred tax assets
|
7,891 | 6,296 | ||||||
|
Deferred tax liabilities:
|
||||||||
|
Property and equipment
|
(1 | ) | (3 | ) | ||||
|
Unproved oil and gas properties
|
(7,890 | ) | (6,293 | ) | ||||
|
Total gross deferred tax liabilities
|
(7,891 | ) | (6,296 | ) | ||||
|
Net deferred tax asset
|
- | - | ||||||
In assessing the likelihood of the realization of deferred tax assets, management considers whether it is more likely than not that some portion or all of the deferred tax assets will not be realized. The ultimate realization of deferred tax assets, including net operating losses, is dependent upon the generation of future taxable income during the periods in which those temporary differences become deductible and tax carry forwards are utilizable.
Management considers the scheduled reversal of deferred tax liabilities, projected future taxable income, and tax planning strategies in making this assessment. In order to fully realize the deferred tax asset, the Company will need to generate future taxable income of approximately $76,989,000 prior to the expiration of some of the net operating loss carry forwards between 2022 and 2030. Based upon the level of historical taxable losses since the Company’s inception, management believes it is more likely than not that the Company will not realize the benefits of these deductible differences and tax carry forwards and thus, full valuation allowances have been recorded at December 31, 2010, 2009 and 2008.
F-42
Zion Oil & Gas, Inc.
(A Development Stage Company)
Notes to Financial Statements as of December 31, 2010
At December 31, 2010, the Company has available federal net operating loss carry forwards of approximately $76,989,000 to reduce future U.S. taxable income. These amounts expire from 2022 to 2030. The Company’s ability to utilize the net operating loss carry forwards prior to 2007 are limited pursuant to the Internal Revenue Code §382 as a result of a prior ownership change. An ownership change occurs when the ownership percentage of 5% or greater stockholders changes by more than 50% over a three-year period. The Company determined that there was an ownership change as of December 31, 2006. The utilization of tax loss carry forwards in the amount of $5,339,000, generated prior to the date of the ownership change, are limited to an amount of $2,584,000 per year, with the remaining
$71,650,000 of tax loss carry forwards not being limited.
Income earned from activities in Israel is subject to regular Israeli tax rates. For Israeli tax purposes, exploration costs on unproved properties are expensed. Tax losses can be carried forward indefinitely. At December 31, 2010, the Company has available net operating loss carry forwards of approximately $39,710,000 to reduce future Israeli taxable income.
Reconciliation between the theoretical tax expense on pre-tax reported income (loss) and the actual income tax expense:
|
For the year ended December 31,
|
||||||||||||
|
2010
|
2009
|
2008
|
||||||||||
|
US$ (thousands)
|
||||||||||||
|
Pre-tax loss as reported
|
(27,658 | ) | (4,424 | ) | (4,018 | ) | ||||||
|
U.S. statutory tax rate
|
34 | % | 34 | % | 34 | % | ||||||
|
Theoretical tax expense
|
(9,404 | ) | (1,504 | ) | (1,366 | ) | ||||||
|
Increase in income tax expense resulting from:
|
||||||||||||
|
Permanent differences
|
169 | 378 | 9 | |||||||||
|
Change in valuation allowance
|
9,235 | 1,126 | 1,357 | |||||||||
|
Income tax expense
|
- | - | - | |||||||||
The Company applies the provisions of FIN 48 (now included in ASC 740). The Company has no material unrecognized tax benefit which would favorably affect the effective income tax rate in future periods and do not believe there will be any significant increases or decreases within the next twelve months. No interest or penalties have been accrued.
The Company has not received final tax assessments since incorporation. In accordance with the US tax regulations, the U.S. federal income tax returns remain subject to examination for the years beginning in 2007.
The Israeli branch has not received final tax assessments since incorporation. In accordance with the Israeli tax regulations, tax returns submitted up to and including the 2006 tax year can be regarded as final.
F-43
Zion Oil & Gas, Inc.
(A Development Stage Company)
Notes to Financial Statements as of December 31, 2010
|
A.
|
Environmental and Asset Retirement Matters
|
The Company is engaged in oil and gas exploration and production and may become subject to certain liabilities as they relate to environmental cleanup of well sites or other environmental restoration procedures as they relate to the drilling of oil and gas wells or the operation thereof.
The Company currently estimates that environmental clean up/restoration of the well sites will be approximately $50,000. Although the timing of such payment is uncertain a provision has been made and is included in the oil and gas properties. Liabilities for expenditures are recorded when environmental assessment and/or remediation is probable and the timing and costs can be reasonably estimated.
|
B.
|
Royalty Commitments
|
The Company is obligated, according to the Petroleum Law, to pay royalties to the Government of Israel on the gross production of oil and gas from the oil and gas properties of the Company located in Israel (excluding those reserves serving to operate the wells and related equipment and facilities). The royalty rate stated in the Petroleum Law is 12.5% of the produced reserves. At December 31, 2010 or 2009, the Company did not have any outstanding obligation with respect to royalty payments, since it is at the “exploration stage” and, to this date, no proved reserves have been found. In April 2010 the Israeli Ministry of Finance established an advisory committee to examine Israel’s fiscal policy regarding its oil and gas resources, including the royalty rate to be paid to the
Government of Israel. In January 2011, the committee issued its final recommendations which included cancellation of currently-existing tax incentives, including the depletion allowance, and imposition of a special levy ranging from 20% to 50%, on oil and gas profits after a return on investment has been achieved. The existing rate of royalties of 12.5% remained unchanged. These recommendations must be voted on by Israel’s Parliament.
|
C.
|
Long-term Incentive Plan
|
The Company may initiate the establishment of a long-term management incentive plan for key employees whereby a 1.5% overriding royalty or equivalent interest in the Asher-Menashe License and Joseph License and such other oil and gas exploration and development rights as may in the future be acquired by the Company would be assigned to key employees. As the plan has not been established as of December 31, 2010, the Company did not have any outstanding obligation in respect of the plan.
|
D.
|
Charitable Foundations
|
The Company has established two charitable foundations, one in Israel and one in Switzerland, for the purpose of supporting charitable projects and other charities in Israel, the United States and internationally. A 3% overriding royalty or equivalent interest in any Israeli oil and gas interests as may now be held or, in the future be acquired, by the Company shall be assigned to each charitable organization (6% overriding interest in the aggregate). At December 31, 2010 or 2009, the Company did not have any outstanding obligation in respect of the charitable foundations, since it is at the “exploration stage” and, to this date, no proved reserves have been found.
F-44
Zion Oil & Gas, Inc.
(A Development Stage Company)
Notes to Financial Statements as of December 31, 2010
Note 8 - Commitments and Contingencies (cont’d)
|
E.
|
Surface Rights of Drilling Operations
|
The surface rights to the drill site from which the Company drilled the Ma’anit #1 and Ma’anit-Rehoboth #2 wells and is currently drilling the Ma’anit-Joseph #3 well, are held under long-term lease by Kibbutz Ma’anit (the “Kibbutz”) with the Israel Lands Authority.
The necessary permission to use the drill site for the Ma’anit-Joseph #3 well to conduct petroleum exploration operations has been granted to the Company by the Kibbutz in consideration for a fee of approximately $50,000 for the period up to October 10, 2010 and $5,000 for each year thereafter.
The Israel Lands Authority has granted formal consent for the use of the surface with regard to the Ma'anit-Joseph #3 well; the expiration date of the consent is August 3, 2012.
The surface rights to the drill site from which the Company drilled the Elijah #3 well are held under long-term lease by Kibbutz Ein Carmel with the Israel Lands Authority. The Necessary permission to enter and use the drill site to conduct petroleum operations on the Elijah #3 well was granted to the Company by Kibbutz En Carmel through July 20, 2015 in consideration for a one-time fee of approximately $145,000.
Permission of the Israel Lands Authority for the use of the surface rights is also required. All consents were obtained.
The Israel Lands Authority has granted formal consent for the use of the surface with regard to the Ma’anit-Joseph #3 well. The expiration date of the consent is August 3, 2012.
|
F.
|
Payments to executives and deferral of compensation
|
Under existing compensation agreements, the Company is committed to pay certain of its executive officers and other employees an aggregate amount of $1,159,000 on an annual basis. During the year ended December 31, 2010, amounts totaling $477,000 of previously deferred compensation was paid to executives and employees. During the year ended December 31, 2009, amounts totaling $1,745,000 of previously deferred compensation were paid. The balance at December 31, 2010 of $21,000 was paid in January 2011.
|
G.
|
Underwriting Agreement
|
Pursuant to an underwriting agreement, the Company agreed to pay to Network 1 Financial Securities, Inc., the underwriter of the Company’s Public Offering (the “Underwriter” or “Network 1”), a financial advisory and investment banking fee for an aggregate amount of $60,000 (“the advisory fee”) pursuant to a two year investment banking/consulting agreement to be entered following and effective upon the closing of the Public Offering in a minimum aggregate amount of $4,000,000 (the “effective date). The advisory fee was due in full upon the effective date. Following the second closing of the 2006 Public Offering on January 29, 2007, this fee was paid in full.
In addition, pursuant to the Underwriting Agreement, the Underwriter was to receive warrants (“H” warrants) to purchase a number of shares of the Company’s common stock in an amount equal to 3% of the number of shares of common stock sold in the 2006 Public Offering by it and other placement agents appointed by it pursuant to the Underwriting Agreement at a price of $8.75 per share (or 125% of the offering price). The H warrants became exercisable on November 25, 2007 and expired on September 26, 2009. Pursuant to this undertaking, the Company issued 46,621 H Warrants (See Note 5G) to purchase shares at a price of $8.75 of the Company’s common stock. These warrants were exercised during February 2009 through a cashless exercise in which 13,211 shares were
issued.
In January 2008, in connection with the filing of the 2008 Registration Statement, the Company entered into an underwriting agreement with Network 1 Financial Securities, Inc. (the “January 2008 Underwriting Agreement”). The January 2008 Underwriting Agreement provided for a two year extension to the existing investment banking/consultant agreement for an additional fee of $60,000, payable upon the closing of the offering in a minimum aggregate amount of $5,000,000.
F-45
Zion Oil & Gas, Inc.
(A Development Stage Company)
Notes to Financial Statements as of December 31, 2010
Note 8 - Commitments and Contingencies (cont’d)
|
G.
|
Underwriting Agreement (cont’d)
|
Under the terms of the January 2008 Underwriting Agreement, the Company was required to, and did, remit an advance payment of $50,000 against the non-accountable expense allowance to be paid to Network 1 in connection with services to be rendered in the course of the Follow On Public Offering. In addition to a 6% underwriting commission and a 3% non-accountable expense allowance, under the January 2008 Underwriting Agreement, Network 1 was entitled to certain underwriters warrants. During March 2008, the board decided to terminate the agreement with Network 1. In April 2008, the January 2008 Underwriting Agreement with Network 1 was terminated in accordance with its terms. Upon the decision to terminate the January 2008 Underwriting Agreement, the advance payment of
$50,000 was recorded as an expense by the Company. On April 2, 2008, a new underwriting agreement, as subsequently amended, (the “April 2008 Underwriting Agreement”) was entered into with Brockington Securities, Inc. (“Brockington”). The April 2008 Underwriting Agreement did not include provisions relating to an investment banking/consultant agreement nor did it contain underwriter’s warrants.
Additionally, the April 2008 Underwriting Agreement provided for a 5% underwriting commission and a 3% non-accountable expense allowance. In connection with the initial and second closings of the Follow On Public Offering that were held on October 24, and December 2, 2008, Brockington received $323,000 from the proceeds of the Follow On Public Offering, of which $202,000 was in respect of the underwriting commission and $121,000 was in respect of expense reimbursement. (See Note 5D). Subsequently, in the final closing of the Follow On Public Offering that was held on January 16, 2009, Brockington received $190,000 from the proceeds, of which $119,000 was in respect of commissions and $71,000 was in respect of expense reimbursement. (See Note 5D).
|
H.
|
Lease Commitments
|
The Company leases approximately 3,600 square feet of office space in Dallas under a lease which expires on October 31, 2011. The monthly rent was $4,000 during the twelve-month period ending October 31, 2008, $4,500 during the twelve-month period ending October 31, 2009, $4,600 for the twelve-month period ending October 31, 2010 and will be $4,700 during the twelve-month period ending October 31, 2011.
During July 2005, the Company entered into a rental agreement for office premises in the industrial area of Caesarea, Israel. The rental was for a six-month period commencing August 1, 2005 with two additional three-month option periods at a monthly rental cost of $3,000. The Company subsequently extended the rental agreement through January 31, 2009, and then exercised the option to extend the lease for two additional periods of six months each (through January 31, 2010). The Company subsequently entered into two additional six-month extensions through April 30, 2011. The monthly rental cost during this extended period was $3,000.
In December 2010, the Company entered into a sublease agreement for the lease of office premises in Caesarea, Northern Industrial Park, Israel. The sublease agreement provides for the rental of 517 square meters (5,565 square feet) (including common areas) in an office building. The sublease term is scheduled to begin on April 3, 2011 and continue through March 31, 2014. Notwithstanding the foregoing, the sublease lease Agreement term is expressly subject to the primary lease agreement that the sub lessor has with the landlord of the premises and such sublease lease Agreement term will expire upon the termination, for whatever reason, of the primary lease. In addition, under the sublease agreement, at the end of the initial 12 months of the sublease term, either the sub lessor or the
Company may, at its sole discretion upon the furnishing to the other of written notice within seven days after the end of the initial 12 month period, terminate the sublease agreement, whereupon the Company will be required to vacate the subleased premises within six months of the giving of such notice. The right to terminate early as described above shall also inure to each of the Company and the sub-lessor at the end of each of the 18
th
and 24
th
month following the commencement of the sublease lease Agreement term. Under the sublease agreement, the Company is authorized to further sublease all or part of the subleased premises to a third party that is pre-approved by the Sub-lessor.
Rent is to be paid on a monthly basis in the base amount of approximately NIS 28,400 per month (approximately $8,000 per month at the exchange rate in effect on the date of this report). The Company is also obligated to pay all cost of living adjustments, as well as its pro-rated portion of all taxes, utilities, insurance and maintenance payments during the sublease term.
In March 2010, the Company leased approximately 500 square feet of office space in State College, Pennsylvania for its President and Chief Operating Officer. The initial lease was for 12 months, expiring February 28, 2011 and the monthly rental amount was $525. In February 2011, the lease was extended by 12 months to the end of February 2012 and the monthly rental amount was increased to $550.
In December of 2009 , the Company entered into a lease agreement for the lease of one Motor Vehicle , for the Caesarea Branch staff member. The lease term is scheduled to continue through December , 2012. The right to terminate in 2011 for either one or all leased is provided with a current 2 month rent pay per Motor Vehicle. In February , 2010 , three more Motor Vehicles were added to the lease agreement within the same contract framework. The aggregate cost for the four Motor Vehicles is approximately $2,900 per month, and linked to the Israeli Consumer Price Index.
F-46
Zion Oil & Gas, Inc.
(A Development Stage Company)
Notes to Financial Statements as of December 31, 2010
Note 8 - Commitments and Contingencies (cont’d)
|
H.
|
Lease Commitments (cont’d)
|
The future minimum lease payments as of December 31, 2010 are as follows:
|
US$ thousands
|
||||
|
2011
|
178 | |||
|
2012
|
132 | |||
|
2013
|
98 | |||
|
2014
|
24 | |||
| 432 | ||||
|
I.
|
Contract with Geophysical Institute of Israel
|
On January 31, 2010, in connection with planned seismic, magnetic and gravimetric surveys on the Issachar-Zebulun permit area, the Company entered into another agreement with GII to acquire necessary data. On May 14, 2010, the Company entered into an amended agreement with GII to obtain additional seismic data in the Company’s Asher Menashe License from the area surrounding the Elijah #3 well. The agreement, as amended, provides for a 64-kilometer program, subject to increase or decrease by the Company, with approximately 32 kilometers to be acquired on the Issachar-Zebulun Permit and another 32 kilometers to be acquired on the Asher Menashe License. The agreement, as amended, provides for the survey to be performed by GII on a per kilometer basis at a rate of NIS 44,000
(approximately $11,430) per kilometer. An initial amount of NIS 150,000 (approximately US $39,000) was paid upon signing of the initial agreement. Additional amounts of (i) NIS 100,000 (approximately US $26,000) and (ii) a prepayment of NIS 1,000,000 (approximately US $260,000) were paid in connection with the signing of the amended agreement, and (iii) an additional payment of NIS 1,334,000 (approximately US $344,000) was paid in the course of the provision of services.
|
J.
|
Drilling Contract
|
On September 12, 2008, the Company entered into a drilling contract with Aladdin Middle East Ltd. pursuant to which Aladdin shipped into Israel its 2,000 horsepower rig for use in the drilling contemplated by the Company’s business plan. The rig arrived in Israel and cleared customs in April 2009 and was used to drill the Ma’anit-Rehoboth #2 well and then the Elijah #3 well. The contract provides for the well to be drilled on a daywork basis with payment to Aladdin at the rate of $28,500 per drilling day, and other scheduled rates for non-operating days. The contract originally provided for mobilization and de-mobilization fees of $675,000 each. The Company paid Aladdin $475,000 on account of mobilization fees, which are included in the well cost. Subsequent amendments provided that the remaining
$200,000 payment was to be offset against the amount paid by the Company for the drilling and no additional cash outlay was due upon mobilization. The contract, as further amended, provided for a demobilization fee of $550,000. As security for these and related fees, the contract, as amended, called for the Company to provide a letter of credit to Aladdin in the amount of $550,000.
However, in April 2009, the parties further amended the contract to eliminate the letter of credit requirement. In exchange, the Company provided Aladdin with a cash advance in the amount of $300,000 that was to be offset against future payments to Aladdin under the contract. The contract was again amended in December 2009 when the Company agreed to the $300,000 April 2009 payment to be applied against demobilization fees and agreed to a further pre-payment for services under the contract advance of $250,000 which the parties agreed would be applied against the remaining $250,000 due against demobilization. Aladdin continues to be bound to reimburse the Company with respect to any demobilization fee it may receive from another operator.
F-47
Zion Oil & Gas, Inc.
(A Development Stage Company)
Notes to Financial Statements as of December 31, 2010
Note 8 - Commitments and Contingencies (cont’d)
|
J.
|
Drilling Contract (cont’d)
|
In May 2010, the contract was further amended. Under the terms of the May 2010 amendment, Aladdin and the Company extended the term of the agreement to cover the drilling of the Company’s planned Ma’anit-Joseph #3 well to a depth of 5,900 meters. In addition, the agreement was further amended in order to transfer to Aladdin the obligation to pay certain taxes that may be owed. Also under the May 2010 amendment, Aladdin agreed to reimburse the Company for certain insurance premiums incurred by the Company. The amendment also memorialized an advance, previously remitted by the Company to Aladdin, in an amount of $750,000 and provided that the amount of the advance would be offset against future Aladdin invoices.
During the year ended December 31, 2010 the Company made payments to Aladdin of $11,232,000 and during the year ended December 31, 2009, $12,300,000 after the deduction of $935,000 for reimbursement of the drill pipe expenditures, $212,000 for reimbursement of expenses paid by the Company on Aladdin’s behalf and $750,000 for reimbursement of a cash advance previously provided by the Company to Aladdin. The Company has also paid $355,000 to Aladdin for corporate taxes due by Aladdin and paid an advance payment of $550,000 for payment of the demobilization fee, which amount is classified as a prepayment. At the conclusion of drilling operations, depending on the circumstances, the Company may recover, by reimbursement or credit, the $550,000 demobilization fee.
|
K.
|
Settlement Agreements
|
On January 6, 2009, the Company and a former Executive Vice President, entered into a settlement agreement (the “Settlement Agreement”) resolving all disputes between them relating to the payment by the Company to such person of amounts in respect of deferred compensation, as well as other related matters. Under the Settlement Agreement, the Company remitted to such person the sum of $43,000 on account of $283,000 in total deferred payment payable to such former executive, with the balance of $240,000 payable on a monthly basis of $10,000 per month, over a two year period through February 2011. Through the year ended December 31, 2010, excluding the initial payment, the Company had paid the outstanding balance. Under the Settlement Agreement, the former executive received certain releases
and access to his pension/life insurance fund accounts under Israeli law. The former executive’s employment, under his personal employment agreement with the Company, expired as of December 31, 2008. At December 31, 2009, a balance of $130,000 remained which was being deferred until January 2010 at the former executive’s request. The amount was subsequently paid in January 2010.
On December 7, 2009, the Company and the former President and Chief Operating Officer entered into an agreement which terminated his employment agreement with the Company (“Resignation Agreement”). Under the Resignation Agreement, the Company agreed to remit to the executive amounts payable to him in respect of deferred compensation, as well as other related matters, in the amount of $180,000, net of deductions and withholdings under applicable law customarily made by the Company, payable between January 1, 2010 and March 1, 2010. Under the agreement, each of the parties furnished to the other general releases.
On July 8, 2010, the Company and its former Chief Financial Officer, entered into an agreement terminating the officer’s employment. Under the agreement, the Company remitted to the former officer amounts payable in respect of deferred compensation in the approximate amount of $20,000. In accordance with the terms of her employment agreement, the Company paid to the former officer all amounts payable under the employment agreement through January 31, 2011, the scheduled expiration date of the former officer’s employment. Under the settlement agreement, former officer furnished to the Company a general release.
|
L.
|
Agreements with Executive Officers
|
(i) On January 21, 2010, the Company and Mr. John Brown, the Chairman of the Company’s board of directors, entered into an Employment Agreement (the “Chairman Agreement”) pursuant to which Mr. Brown serves as the Executive Chairman of the Company’s Board of Directors. The Chairman Agreement was entered into following the scheduled termination on December 31, 2009 of the Chairman of the Board Retention Agreement under which Mr. Brown served as Chairman of the Board since January 1, 2008. Since the Company’s establishment in April of 2000, Mr. Brown has continuously served as Chairman of the Board.
F-48
Zion Oil & Gas, Inc.
(A Development Stage Company)
Notes to Financial Statements as of December 31, 2010
Note 8 - Commitments and Contingencies (cont’d)
|
L.
|
Agreements with Executive Officers (cont’d)
|
The Chairman Agreement has an initial term that extends through December 31, 2012; thereafter, the agreement provides that it is to be renewed automatically for successive two year terms unless either party shall advise the other 90 days before expiration of the initial or renewed term of its intention to not renew the agreement beyond its then scheduled expiration date. Under the agreement, Mr. Brown is paid an annual salary of $165,000, payable monthly Mr. Brown can terminate the employment agreement and the relationship thereunder at any time upon 60 business days' notice. If during the initial term the Company were to terminate the agreement, for any reason other than "Just Cause" (as defined the Chairman Agreement), then the Company is to pay to Mr. Brown the salary then payable under the agreement through
the longer of (i) the scheduled expiration of the initial term as if the agreement had not been so terminated or not renewed or (ii) twelve months, as well as all bonuses and benefits earned and accrued through such date. If the Company were not to renew the term of the agreement after the Initial term or were to terminate the agreement during any renewal term, for any reason other than "Just Cause" (as defined the Agreement), then the Company is to pay to Mr. Brown an amount equal to the
base salary, if any, then payable to him for a period of twelve months as if the Chairman Agreement had not been so terminated or had been renewed. Mr. Brown may also terminate the agreement for "Good Reason" (as defined in the Agreement), whereupon he will be entitled to the same benefits as if the Company had terminated the agreement for any reason other than Just Cause. The Chairman Agreement provides for customary
protections of the Company's confidential information and intellectual property.
The Agreement also provides that in connection with his services during the initial term of the Agreement and subject to the entry into an Option Award Agreement under the Company's 2005 Stock Option Plan, Mr. Brown be awarded options at a per share exercise price of $0.01 to purchase 20,000 shares of the Company's common stock under the Plan, which options would vest at the rate of 5,000 shares at the termination of each calendar 90 day period, beginning March 31, 2010 until such options are vested in full. In the event of an extension of the term of the Chairman Agreement, the Chairman Agreement provides that Mr. Brown be granted additional options to purchase common stock in the Company in amounts of not less than 20,000 shares per term on such terms to be agreed by the parties. On January 21, 2010, the Board
authorized the entry by the Company into an Option Award Agreement pursuant to which Mr. Brown was granted options to purchase 20,000 shares under the Plan on the terms set forth above.
(ii) On January 31, 2010, Inc. the Company and William L. Ottaviani entered into an Employment Agreement (the “Employment Agreement”), which became effective as of January 1, 2010, pursuant to which Mr. Ottaviani serves as the Company’s President and Chief Operating Officer at an annual salary of $250,000, payable monthly. The employment agreement has an initial term which continues through December 31, 2011.
Mr. Ottaviani works out of an office in the vicinity of his residence in State College, Pennsylvania. The Company pays the reasonable expenses incurred by Mr. Ottaviani in connection with such office, including the retention of an office assistant.
The Employment Agreement provides that subject to the entry into an Option Award Agreement, Mr. Ottaviani be awarded under the Company’s 2005 Stock Option Plan, at the end of each calendar quarter beginning with the quarter ended March 31, 2010, fully vested options at a per share exercise price of $0.01 to purchase such number of the Company’s Common Stock, as shall equal $12,500 divided by closing price on the last trading day of the respective calendar quarter of the Company’s publicly traded share of Common Stock, but in no event less than $5.00 per share. Pursuant thereto, between March 31, 2010 and March 15, 2011, Mr. Ottaviani was granted options to purchase 9,415 shares of Common Stock.
Mr. Ottaviani can terminate the employment agreement and the relationship thereunder at any time upon 60 business days' notice. If during the initial term the Company were to terminate the agreement for any reason other than "Just Cause" (as defined the employment agreement), then the Company is to pay to Mr. Ottaviani three months’ salary, as well as all bonuses and benefits earned and accrued through such date. If such termination occurs during a renewal term (assuming the Company renews the agreement after the expiration of the initial term ending on December 31, 2011), Mr. Ottaviani is to receive six months’ salary, as well as all bonuses and benefits earned and accrued through such date. Mr. Ottaviani may also terminate the employment agreement for "Good Reason" (as defined in the employment
agreement), whereupon he will be entitled to the same benefits as if the Company had terminated the agreement for any reason other than Just Cause. The Employment Agreement provides for customary protections of the Company's confidential information and intellectual property.
F-49
Zion Oil & Gas, Inc.
(A Development Stage Company)
Notes to Financial Statements as of December 31, 2010
|
L.
|
Agreements with Executive Officers (cont’d)
|
(iii) On August 10, 2010, the Company entered into a letter agreement with Kent Siegel providing for the employment of Mr. Siegel as the Company's Senior Vice President and Chief Financial Officer, effective July 9, 2010. Mr. Siegel continues to serve on the Company's Board of Directors, a position he has held continuously since November 2003. The letter agreement has a continuous term, as Mr. Siegel is considered an "at will" employee subject to termination at any time, with or without prior notice from the Company.
The letter agreement provides for Mr. Siegel to receive an annual base salary of $100,000. Upon the signing of the letter agreement, Mr. Siegel was paid a one time signing bonus of $10,000. Under his agreement, Mr. Siegel is required to devote 60% of his time, attention and ability to the business of the Company. Under the letter agreement, the Company is to provide Mr. Siegel the right to participate in any medical, dental, vision, disability, and life insurance and 401K benefits normally provided to the Company's employees.
If Mr. Siegel's employment is terminated unilaterally by the Company without cause (as defined in the letter agreement), Mr. Siegel will receive his base salary for a period of one month and all benefits accrued and vested through the date of termination. Additionally, the termination of Mr. Siegel's employment for any reason shall be deemed as his resignation from the Company's Board of Directors.
The Company is currently dependent on Aladdin Middle East to perform its drilling. If for some reason Aladdin decides to quit Israel, then there is no guarantee that the Company will be able to replace them and resume its drilling program without undue and extended delay.
Pursuant to the terms of the employment agreement entered into by the Company and Richard Rinberg as of December 4, 2007, the Company’s Chief Executive Officer and a director, on February 22, 2011, the Board authorized the entry by the Company into an Option Award Agreement pursuant to which Mr. Rinberg was granted options to purchase 40,000 shares under the Plan at a per share exercise price of $0.01. The options vest at the rate of 10,000 shares at the termination of each calendar 90 day period, beginning March 31, 2011 until such options are vested in full. Under the employment agreement with Mr. Rinberg, with respect to each year of employment under the agreement, Mr. Rinberg is entitled to be granted options under the Plan for 40,000 shares of Common Stock.
On January 6, 2011, the Company awarded to its directors, executive officers and service providers options to purchase, in the aggregate, 384,500 shares of the Company’s Common Stock. All stock options were granted in accordance with the terms and conditions of the Company’s 2005 Stock Option Plan. The stock option agreements evidencing the grants under the Plan provide for, among other things, (i) a grant date of January 6, 2011, (ii) an exercise period commencing on January 1, 2012 and continuing through December 31, 2014 and (iii) an exercise price per share of $2.50.
Commencing January 3, 2011 and continuing through March 7, 2011, the Company reduced the exercise price of its outstanding publicly traded Unit Warrants to $4.00 (from the $7.00 exercise price provided by the original terms of the Warrants). Any and all Unit Warrants properly exercised in accordance with the terms of the Unit Warrants prior to such date were accepted by Zion at the reduced exercise price. Commencing March 8, 2011, the $7.00 exercise price included in the original terms of the Warrants was reinstituted. Except for the reduced exercise price of the Warrants prior to the Expiration Time, the terms of the Warrants remained unchanged. As of the expiration date of March 7, 2011, 100,600 Unit Warrants were exercised for total gross proceeds to the Company of $402,400.
F-50
Zion Oil & Gas, Inc.
(A Development Stage Company)
Notes to Financial Statements as of December 31, 2010
On January 31, 2011, the Company and Victor Carrillo entered into a letter agreement providing for the employment (the “Carrillo Employment Agreement”) of Mr. Carrillo as the Company’s executive Vice President. Mr. Carrillo continues to serve on the Company’s board of directors.
The Carrillo Employment Agreement has an initial term of one year which continues through January 31, 2012; thereafter, the agreement provides that it is to be renewed automatically for two additional one year terms unless either party shall advise the other 30 days before expiration of the initial or renewed term of its intention to not renew the agreement beyond its then scheduled expiration date. Under the agreement, Mr. Carrillo is paid an annual salary of $250,000, payable monthly. Mr. Carrillo was paid a sign up bonus of $7,500 and was reimbursed for up to $5,000 in relocation expenses.
Mr. Carrillo can terminate the employment agreement and the relationship thereunder at any time upon notice. If during the term the Company were to terminate the agreement for any reason other than "Just Cause" (as defined the employment agreement), then the Company is to pay to Mr. Carrillo one month’s salary, as well as all benefits earned and accrued through such date. The Carrillo Employment Agreement provides for customary protections of the Company's confidential information and intellectual property.
The Carrillo Employment Agreement provides that subject to the entry into an Option Award Agreement, Mr. Carrillo be awarded under the Company’s 2005 Stock Option Plan, with respect to each year of employment under the Carrillo Employment Agreement, vested options to purchase 10,000 shares of the Company’s Common Stock at a per share exercise price of $0.01 and options to purchase an additional 15,000 shares of Common Stock, vesting equally in each calendar quarter (3,750 shares per quarter), at a pre share exercise price equal to the market price of the Company’s publicly traded stock. In each case the options shall be exercisable through January 31, 2016.
F-51
TABLE OF CONTENTS
Part IItem 1. BusinessItem 1A. Risk FactorsItem 1B. Unresolved Staff CommentsItem 2. PropertiesItem 3. Legal ProceedingsItem 4. Removed and ReservedPart IIItem 5. Market For The Registrant's Common Equity, Related Stockholder Matters and Issuer Purchases Of Equity SecuritiesItem 6 Selected Financial DataItem 7. Management's Discussion and Analysis Of Financial Condition and Results Of OperationsItem 7A. Quantitative and Qualitative Disclosures About Market RiskItem 8. Financial StatementsItem 9. Changes in and Disagreements with Accountants on Accounting and Financial DisclosureItem 9A. Controls and ProceduresItem 9B. Other InformationPart IIIItem 10. Directors, Executive Officers and Corporate GovernanceItem 11. Executive CompensationItem 12. Security Ownership Of Certain Beneficial Owners and Management and Related Stockholder MattersItem 13. Certain Relationships and Related Transactions and Director IndependenceItem 14. Principal Accountant Fees and ServicesPart IVItem 15. Exhibits, Financial Statements SchedulesNote 1 - Nature Of Operations and Basis Of PresentationNote 1 - Nature Of Operations and Basis Of Presentation (cont D)Note 1 - Nature Of Operations and Basis Of Presentation (cont D) B. Management Presentation and Liquidity (cont D)Note 2 - Summary Of Significant Accounting PoliciesNote 2 - Summary Of Significant Accounting Policies (cont D) C. Oil and Gas Properties and Impairment (cont D)Note 2 - Summary Of Significant Accounting Policies (cont D)Note 3 Provision For Severance PayNote 4 - Unproved Oil and Gas Properties, Full Cost MethodNote 4 - Unproved Oil and Gas Properties, Full Cost Method (cont D)Note 5 - Stockholders EquityNote 5 - Stockholders Equity (cont D) B. Private Placement Offerings (cont D)Note 5 - Stockholders Equity (cont D)Note 5 - Stockholders Equity (cont D) I. 2005 Stock Option Plan (cont D)Note 6 - Related Party TransactionsNote 6 - Related Party Transactions (cont D)Note 7 Income TaxesNote 7 Income Taxes (cont D)Note 8 - Commitments and ContingenciesNote 8 - Commitments and Contingencies (cont D)Note 9 Risks and UncertaintiesNote 10 - Subsequent EventsNote 10 - Subsequent Events (cont D)