UNITED STATES
SECURITIES AND EXCHANGE COMMISSION
WASHINGTON, D.C. 20549
_____________________________________
FORM 10-K
_____________________________________
(Mark One)
|
ý
|
ANNUAL REPORT PURSUANT TO SECTION 13 OR 15(d) OF THE SECURITIES EXCHANGE ACT OF 1934
|
For the fiscal year ended July 31, 2018
OR
|
☐
|
TRANSITION REPORT PURSUANT TO SECTION 13 OR 15(d) OF THE SECURITIES EXCHANGE ACT OF 1934
|
For the transition period from to _ to _
Commission File Number: 001-38413
_____________________________________
ZSCALER, INC.
(Exact Name of Registrant as Specified in Its Charter)
_____________________________________
|
Delaware
(State or other jurisdiction of
incorporation or organization)
|
26-1173892
(I.R.S. Employer
Identification Number)
|
|||
|
110 Rose Orchard Way
San Jose, California 95134
(Address of Principal executive offices)
|
||||
Registrant’s telephone number, including area code: (408) 533-0288
Securities registered pursuant to Section 12(b) of the Act:
|
Title of Each Class
|
Name of Each Exchange on Which Registered
|
|
|
Common Stock, $0. 001 Par Value
|
The Nasdaq Global Select Market
|
|
Securities registered pursuant to Section 12(g) of the Act:
None.
___________________________________________________
Indicate by check mark if the registrant is a well-known seasoned issuer, as defined in Rule 405 of the Securities Act of 1933, as amended. Yes ☐ No
ý
Indicate by check mark whether the registrant (1) has filed all reports required to be filed by Section 13 or 15(d) of the Securities Exchange Act of 1934 during the preceding 12 months (or for such shorter period that the registrant was required to file such reports), and (2) has been subject to such filing requirements for the past 90 days.
Yes
ý
No
☐
Indicate by check mark whether the registrant has submitted electronically and posted on its corporate Web site, if any, every Interactive Data File required to be submitted and posted pursuant to Rule 405 of Regulation S-T (§232.405 of this chapter) during the preceding 12 months (or for such shorter period that the registrant was required to submit and post such files)
Yes
ý
No
¨
Indicate by check mark whether the registrant is a large accelerated filer, an accelerated filer, a non-accelerated filer, a smaller reporting company, or an emerging growth company. See the definitions of "large accelerated filer," "accelerated filer," "smaller reporting company" and "emerging growth company" in Rule 12b-2 of the Exchange Act.
|
Large accelerated filer
|
☐
|
Accelerated filer
|
¨
|
||||
|
Non-accelerated filer
|
ý
|
Smaller reporting company
|
¨
|
||||
|
(Do not check if a smaller reporting company)
|
☐
|
Emerging growth company
|
ý
|
||||
If an emerging growth company, indicate by check mark if the registrant has elected not to use the extended transition period for complying with any new or revised financial accounting standards provided pursuant to Section 13(a) of the Exchange Act.
ý
Indicate by check mark whether the registrant is a shell company (as defined in Rule 12b-2 of the Exchange Act).
Yes
¨
No
ý
The aggregate market value of the common stock held by non-affiliates of the registrant, based on the closing price of a share of common stock on March 16, 2018 as reported by the Nasdaq Global Select Market on such date was approximately $1.5 billion. The registrant has elected to use March 16, 2018, which was the initial trading date on the Nasdaq Global Select Market, as the calculation date because on January 31, 2018 (the last business day of the registrant’s most recently completed second fiscal quarter), the registrant was a privately held company. Shares of the registrant’s common stock held by each executive officer, director and holder of 5% or more of the outstanding common stock have been excluded in that such persons may be deemed to be affiliates. This calculation does not reflect a determination that certain persons are affiliates of the registrant for any other purpose. The registrant has no non-voting equity.
As of
August 31, 2018
, the number of shares of registrant’s common stock outstanding was
119,773,132
.
DOCUMENTS INCORPORATED BY REFERENCE
Portions of the registrant’s definitive Proxy Statement relating to its 2018 Annual Meeting of Stockholders are incorporated by reference into Part III of this Form 10-K where indicated. Such Proxy Statement will be filed with the United States Securities and Exchange Commission within 120 days after the end of the fiscal year to which this Annual Report on Form 10-K relates.
ZSCALER, INC.
TABLE OF CONTENTS
|
Page
|
||
|
PART I
|
||
|
Item 1.
|
||
|
Item 1A.
|
||
|
Item 1B.
|
||
|
Item 2.
|
||
|
Item 3.
|
||
|
Item 4.
|
||
|
PART II
|
||
|
Item 5.
|
||
|
Item 6.
|
||
|
Item 7.
|
||
|
Item 7A.
|
||
|
Item 8.
|
||
|
Item 9.
|
||
|
Item 9A.
|
||
|
Item 9B.
|
||
|
PART III
|
||
|
Item 10.
|
||
|
Item 11.
|
||
|
Item 12.
|
||
|
Item 13.
|
||
|
Item 14.
|
||
|
PART IV
|
||
|
Item 15.
|
||
|
Item 16.
|
||
SPECIAL NOTE REGARDING FORWARD-LOOKING STATEMENTS
This Annual Report on Form 10-K contains forward-looking statements within the meaning of the Private Securities Litigation Reform Act of 1995, including but not limited to, statements regarding our financial outlook and market positioning. These forward-looking statements are made as of the date they were first issued and were based on current expectations, estimates, forecasts and projections as well as the beliefs and assumptions of management. The words "believe," "may," "will," "potentially," "estimate," "continue," "anticipate," "intend," "could," "would," "project," "plan," "expect" and similar expressions that convey uncertainty of future events or outcomes are intended to identify forward-looking statements.
These forward-looking statements include, but are not limited to, statements concerning the following:
|
•
|
our future financial performance, including our expectations regarding our revenue, cost of revenue, gross profit or gross margin, operating expenses (including changes in sales and marketing, research and development and general and administrative expenses), and our ability to achieve, and maintain, future profitability;
|
|
•
|
market acceptance of our cloud platform;
|
|
•
|
the effects of increased competition in our markets and our ability to compete effectively;
|
|
•
|
our ability to maintain the security and availability of our cloud platform;
|
|
•
|
our ability to maintain and expand our customer base, including by attracting new customers;
|
|
•
|
our ability to develop new solutions, or enhancements to our existing solutions, and bring them to market in a timely manner;
|
|
•
|
anticipated trends, growth rates and challenges in our business and in the markets in which we operate;
|
|
•
|
our business plan and our ability to effectively manage our growth and associated investments;
|
|
•
|
beliefs and objectives for future operations;
|
|
•
|
our relationships with third parties, including channel partners;
|
|
•
|
our ability to maintain, protect and enhance our intellectual property rights;
|
|
•
|
our ability to successfully defend litigation brought against us;
|
|
•
|
our ability to successfully expand in our existing markets and into new markets;
|
|
•
|
sufficiency of cash to meet cash needs for at least the next 12 months;
|
|
•
|
our ability to comply with laws and regulations that currently apply or become applicable to our business both in the United States and internationally;
|
|
•
|
the attraction and retention of qualified employees and key personnel; and
|
|
•
|
the future trading prices of our common stock.
|
1
These forward-looking statements are subject to a number of risks, uncertainties and assumptions, including those described in "Risk Factors" elsewhere in this Annual Report on Form 10-K. Moreover, we operate in a very competitive and rapidly changing environment, and new risks emerge from time to time. It is not possible for our management to predict all risks, nor can we assess the impact of all factors on our business or the extent to which any factor, or combination of factors, may cause actual results to differ materially from those contained in any forward-looking statements we may make. In light of these risks, uncertainties and assumptions, the forward-looking events and circumstances discussed in this Annual Report on Form 10-K may not occur and actual results could differ materially and adversely from those anticipated or implied in the forward-looking statements and you should not place undue reliance on our forward-looking statements.
The forward-looking statements made in this Annual Report on Form 10-K relate only to events as of the date on which the statements are made. We undertake no obligation to update any forward-looking statements made in this Annual Report on Form 10-K to reflect events or circumstances after the date of this Annual Report on Form 10-K or to reflect new information or the occurrence of unanticipated events, except as required by law.
2
Overview
Zscaler’s mission is to empower organizations to realize the full potential of the cloud and mobility by securely connecting users to applications from any device, anywhere.
We were incorporated in 2007, during the early stages of cloud adoption and mobility, based on a vision that the internet would become the new
corporate network as the cloud becomes the new data center. We predicted that with rapid cloud adoption and increasing workforce mobility, traditional perimeter security approaches would provide inadequate protection for users and data and an increasingly poor user experience. We pioneered a security cloud that represents a fundamental shift in the architectural design and approach to network security.
Enterprise applications are rapidly moving to the cloud to achieve greater IT agility, a faster pace of innovation and lower costs. Organizations are increasingly relying on internet destinations for a range of business activities, adopting new external SaaS applications for critical business functions and moving their internally managed applications to the public cloud, or IaaS. Enterprise users now expect to be able to seamlessly access applications and data, wherever they are hosted, from any device, anywhere in the world. We believe these trends are indicative of the broader digital transformation agenda, as businesses increasingly succeed or fail based on their IT outcomes.
We believe that securing the on-premises corporate network to protect users and data is becoming increasingly irrelevant in a cloud and mobile-first world where organizations depend on the internet, a network they do not control and cannot secure, to access critical applications that power their businesses. We pioneered a new approach to security that connects the right user to the right application, regardless of network. Our cloud platform, which delivers security as a service, eliminates the need for traditional on-premises security appliances that are difficult to maintain and require compromises between security, cost and user experience. Our cloud platform incorporates the security functionality needed to enable users to safely utilize authorized applications and services based on an organization’s policies. Our solution is a purpose-built, multi-tenant, distributed cloud security platform that secures access for users and devices to applications and services, regardless of location.
Before our platform, the corporate data center served as the central hub of IT security, with a physical network perimeter used to separate corporate users, devices and applications from the internet. Today, the network perimeter consists of appliances that have become fundamentally less effective as applications, data, users and devices rapidly move off the corporate network, making the notion of a corporate perimeter obsolete. In a world where more companies are shifting their most critical IT assets to the cloud, cloud-first security is required. Our architecture is vastly different from the traditional “hub-and-spoke” corporate perimeter, where traffic from branch offices is routed to centralized data centers for security scanning and policy enforcement before reaching its destination. In contrast, our security cloud sits between an organization’s users and devices, and the internet, inspecting traffic. Our solutions enable customers to set policies that follow users, so a consistent level of protection is applied no matter where users are located or how they are connected to the internet. We provide all of this security at scale, processing approximately 50 billion internet requests per day. Our platform eliminates the need for organizations to buy and manage a variety of appliances that need to be maintained by a large number of highly skilled security personnel, who are expensive and in increasingly short supply.
3
Our multi-tenant architecture is distributed across over 100 data centers globally, which allows us to secure users across 185 countries. Each day, we block over 100 million threats and perform over 120,000 unique security updates. Our customers benefit from the network effect of our growing cloud because once a new threat is detected, it can be blocked for users across our entire customer base within minutes.
Our customers protect their users by routing their internet traffic through our cloud platform. Some of the largest enterprises and government agencies in the world rely on our solutions to help them accelerate their move to the cloud. We have over
3,250
customers across all major geographies, with an emphasis on larger organizations, and we currently count over
300
of the Forbes Global 2000 as customers. Our customers span every major industry, including airlines and transportation, conglomerates, consumer goods and retail, financial services, healthcare, manufacturing, media and communications, public sector and education, technology and telecommunications services.
We have experienced significant growth, with revenue increasing from $80.3 million in fiscal 2016 to $125.7 million in fiscal 2017 to
$190.2 million
in fiscal
2018
, representing year-over-year revenue growth of 57% and
51%
, respectively. We experienced net losses of
$33.6 million
, $35.5 million and $27.4 million in fiscal 2018, 2017 and 2016, respectively. We expect we will continue to incur net losses for the foreseeable future.
Our Solutions and Platform
Our purpose-built cloud security platform offers two principal services built natively in the cloud.
Zscaler Internet Access
Our Zscaler Internet Access solution, or ZIA, was designed to securely connect users to externally managed applications, including SaaS applications and internet destinations regardless of device, location or network. Our ZIA solution provides inline inspection and firewall access controls across all ports and protocols to protect organizations and users from external threats as well as protecting an organization’s data from leaking out. Policies follow the user to provide identical protection on any device, regardless of location; any policy changes are enforced for users worldwide. Our cloud security platform provides full inline content inspection of webpages to assess and correlate the risk of webpage objects, continuously discovering and blocking sophisticated threats.
Our ZIA solution includes broad functionality, which we categorize by three areas:
Access Control
The access control functionality of our ZIA solution enforces access and usage policies to externally managed applications, including SaaS application and internet destinations. This provides functionality that has traditionally been provided by stand-alone point products.
|
•
|
Cloud Firewall:
Our cloud firewall was designed to protect users by inspecting internet traffic on all ports and protocols, and it offers user level policies, application identification with deep packet inspection and intrusion prevention.
|
|
•
|
URL Filtering:
Our URL filtering capability enables customers to enforce acceptable usage policies and protects organizations from users visiting unauthorized websites or illegally downloading content that can increase liability and impact their brand.
|
|
•
|
Bandwidth Control:
Our
bandwidth control and traffic shaping capabilities ensure that business critical applications are prioritized over non-business critical applications, improving productivity and user experience. By enforcing
|
4
quality of service in the cloud, our platform can optimize “last-mile” utilization of a customer’s network, providing significant value.
|
•
|
DNS Filtering:
Our DNS filtering solution provides a local DNS resolver and enforces acceptable use policies.
|
Threat Prevention
Our second area of functionality, threat prevention, protects users from threats using a range of approaches and techniques. Our robust threat prevention capabilities provide multiple layers of protection to prevent cyberattacks. We provide functionality that has been traditionally been offered by disparate, stand-alone products.
|
•
|
Advanced Threat Protection:
Our advanced protection solution delivers real-time protection from malicious internet content like browser exploits, scripts, zero-pixel iFrames, malware and botnet callbacks. Over 120,000 unique security updates are performed every day to the Zscaler cloud to keep users protected. Once we detect a new threat to a user, we block it for all users. We call this the “cloud security effect.”
|
|
•
|
Cloud Sandbox:
Our cloud sandbox enables enterprises to block zero-day exploits and advanced persistent threats, or APTs, by analyzing unknown files for malicious behavior, and it can scale to every user regardless of location. Our sandbox was designed and built to be multi-tenant and allows customers to determine which traffic should be sent to the cloud sandbox. As an integrated cloud security platform, customers can set policies by users and destinations to prevent patient-zero scenarios by holding, detonating and analyzing suspicious files in the sandbox before being sent to the user.
|
|
•
|
Anti-Virus:
Our anti-virus technology uses a signature database of files and objects on the internet known to be unsafe and runs traffic through multiple anti-virus engines in a single pass.
|
|
•
|
DNS Security:
Our DNS security blocks access to known malicious sites, including command and control sites, and routes suspicious traffic to our threat detection engines for content inspection.
|
Data Protection
Our third area of functionality, data protection, prevents unauthorized sharing or exfiltration of confidential information, reducing our customers’ business and compliance risk.
|
•
|
Data Loss Protection:
Our data loss protection enables enterprises to use standard or custom dictionaries using efficient pattern-matching algorithms to easily scale to all users and traffic, including compressed or encrypted traffic, to prevent, monitor or block unauthorized or sensitive data exfiltration.
|
|
•
|
Cloud Application Control:
Our cloud application control allows enterprises to discover and granularly control user access to known and unknown cloud applications. By doing SSL interception at scale, we provide malware protection, data loss prevention and similar Cloud Access Security Broker, or CASB, functions that can be performed inline, for specific sanctioned applications. Business policies can be defined with granular access control for specified cloud applications, such as the ability to upload or download files or post comments or videos based on different user or group identity. We partner with specific CASB vendors to extend their policy controls and visibility of out-of-band cloud applications.
|
|
•
|
File Type Controls:
Our file type control allows policies to be defined that control which file types are allowed to be downloaded and uploaded based on application, user, location and destination.
|
5
Zscaler Private Access
Our Zscaler Private Access solution, or ZPA, was designed to provide secure access to internally managed applications, either hosted internally in data centers, private or public clouds. Our ZPA solution was designed around four key tenants that fundamentally change the way users access internal applications:
|
•
|
connect users to applications without bringing users on the network;
|
|
•
|
never expose applications to the internet;
|
|
•
|
segment access to applications without relying on traditional approach of network segmentation; and
|
|
•
|
provide remote access over the internet without VPNs.
|
Our ZPA solution enforces a global policy engine that manages access to internally managed applications regardless of location. If access is granted to a user, our ZPA solution connects the user’s device only to the authorized application without exposing the identity or location of the application. Hence applications are not exposed to the internet, further limiting threat exposure. This results in reduced cost and complexity, while offering better security and an improved user experience.
ZPA functionality falls in three major areas:
|
•
|
Secure Application Access:
Our ZPA solution delivers seamless connectivity to internally managed applications and assets whether they are in the cloud, enterprise data center, or both. Administrators can set global policies from a single console, enabling policy-driven access that is agnostic to the network the users are on. By creating seamless access to applications regardless of a user’s network, our ZPA solution subsumes the need for traditional remote access VPNs, SSL VPNs, reverse proxies and other similar products.
|
|
•
|
Application Segmentation:
This fundamentally new architecture provides capabilities that enable user and application level segmentation, a vast improvement over traditional network segmentation. As each user-to-application connection is segmented with microtunnels, each of which is a temporary session between a specific user and a specific application, lateral movement across the network is prevented which significantly reduces security risk. Similar to CASB application discovery reports for internet applications, our ZPA solution provides granular discovery of internally managed applications to aid the creation of segmentation policies. Because our ZPA solution sits on the application layer and is name or domain-based, organizations can quickly and easily identify the internally-managed applications that are running and then easily provision appropriate policies. Microtunnels subsume the need for internal firewalls, which are required for protecting against lateral malware propagation from machine to machine, and traditional network access control functionality since users are granted access only to applications for which they have permission and are not granted full access to the network.
|
|
•
|
Application Protection:
Our ZPA solution initiates and connects together outbound-only links between authenticated users and internally managed applications using microtunnels. Access is provided to users without bringing them onto the corporate network and without exposing applications to the internet. Internally managed applications are not discoverable or identifiable. With no inbound connections and no public IP addresses, there is no inbound attack surface and therefore no threat of DDoS attacks. With our innovative approach, we subsume the need for a next-generation firewall. Similarly, by completely removing the need for an exposed IP address or DNS to the internet, we subsume the functionality of DDoS mitigation systems.
|
6
The primary use cases for our ZPA solution includes:
|
•
|
VPN replacement;
|
|
•
|
providing non-employees with secure access to internal applications;
|
|
•
|
direct-to-cloud access to internally managed applications hosted in public cloud environments, such as Microsoft Azure, Amazon Web Services and Google Cloud Platform; and
|
|
•
|
access to applications following a merger or acquisition by providing named users with access to named applications, without the need to merge networks.
|
Our Technology and Architecture
Zscaler is driven by technology and innovation. We developed a highly scalable, multi-tenant, globally distributed cloud capable of providing inline inspection that offers a full range of enterprise network security services. We designed and built a purpose-built three-tier architecture starting with our core operating system and adding layers of security and networking innovations over time. Our cloud platform is protected by more than 120 issued and pending patents. Our cloud is distributed across more than 100 data centers on five continents and processes approximately 50 billion requests per day from users across 185 countries.
The platform is designed to be resilient, redundant and high-performing. Our platform is built as software modules that run on standard x86 platforms without any dependency on custom hardware. The platform modules are split into the control plane (Zscaler Central Authority), the enforcement plane (Zscaler Enforcement Nodes) and the logging and statistics plane (Zscaler Nanolog Servers) as described below:
|
•
|
Zscaler Central Authority:
The Zscaler Central Authority monitors our entire security cloud and provides a central location for software and database updates, policy and configuration settings and threat intelligence. The collection of Zscaler Central Authority instances together act like the brain of the cloud, and they are geographically distributed for redundancy and performance.
|
|
•
|
Zscaler Enforcement Nodes:
Customer
traffic gets directed to the nearest Zscaler Enforcement Node, where security, management and compliance policies served by the Zscaler Central Authority are enforced. The Zscaler Enforcement Node also incorporates our differentiated authentication and policy distribution mechanism that enables any user to connect to any Zscaler Enforcement Node at any time to ensure full policy enforcement. The Zscaler Enforcement Node utilizes a full proxy architecture and is built to ensure data is not written to disk to maintain the highest level of data security. Data is scanned in RAM only and then erased. Logs are continuously created in memory and forwarded to our logging module.
|
|
•
|
Zscaler Nanolog Servers:
Our Nanolog technology is built into the Zscaler Enforcement Node to perform lossless compression of logs, enabling our platform to collect over 30 terabytes of unique raw log data every day. Logs are transmitted to our Nanolog Servers over secure connections and multicast to multiple servers for redundancy. Our dashboards provide visibility into our customer’s traffic to enable troubleshooting, policy changes and other administrative actions. Our analytics capabilities allow customers to interactively mine billions of transaction logs to generate reports that provide insight on network utilization and traffic. We do not rely on batch reporting; we continuously update our dashboards and reporting and can stream logs to a third-party Security Information and Event Management, or SIEM, service as they arrive. Regardless of where users are located, customers can choose to have logs stored in the United States, the European Union or Switzerland.
|
7
Our platform is a critical integration point positioned in the data path providing secure access to the internet, cloud and internal applications. We complement and interoperate with key technology vendors across major market segments, including SD-WAN, identity and access management, device and endpoint management, as well as SIEM for reporting and analytics. Many of these vendors, like us, were developed in the cloud and together provide a foundation for a modern access and security architecture.
Growth Strategies
The growing use of the internet and the increasing adoption of the cloud and mobility are driving network and application transformation. As a provider of a fully integrated, multi-tenant cloud security solution, we enable our customers to accelerate this secure transformation to the cloud and believe we are uniquely positioned to maximize value as they undertake these transitions. Key elements of our growth strategy include:
|
•
|
Continue to win new customers.
We believe that we have a significant opportunity to expand our customer base, both in the United States and internationally. We have invested significantly in our sales and marketing organization to execute against this opportunity.
|
|
•
|
Expand in existing customers.
We plan to leverage a land-and-expand approach with our existing customers to sell subscriptions to additional users, additional suites that contain more functionality and a la carte services.
|
|
•
|
Leverage channel partners to participate in cloud transformation initiatives.
We have invested in establishing long-standing relationships with global telecommunications service providers and are expanding our network of global system integrators and regional telecommunications service providers.
|
|
•
|
Expansion and innovation of services.
We continue to invest in research and development to add new and differentiated solutions to our existing product portfolio and improve the overall reliability, availability and scalability of our cloud security platform.
|
|
•
|
Expansion into additional market segments.
We are targeting the expansion of our immediate addressable market, emphasizing U.S. federal government agencies in the near- to medium-term as well as additional international markets such as Japan and the Asia Pacific region.
|
|
•
|
Extend our platform to third-party developers.
We intend to open our cloud security platform to third-party developers and vendors to offer new functionality and solutions that may target specific use cases, verticals and niche requirements.
|
Our Customers
We sell to enterprises of all sizes. As of July 31, 2018, we had over
3,250
customers, including over
300
of the Forbes Global 2000. Many of our customers include major global enterprises that send virtually all of their internet traffic through our cloud security platform. Our customers operate in a variety of industries, including airlines and transportation, conglomerates consumer goods and retail, financial services, health care, manufacturing, media and communications, public sector and education, technology and telecommunications services. Approximately
55%
of our revenue in fiscal 2018, 54% of our revenue in fiscal 2017 and 56% of our revenue in fiscal 2016 was from customers outside the United States. No customer contributed more than 10% of our revenue in fiscal 2018, fiscal 2017 or fiscal 2016.
8
Sales and Marketing
Although we have a channel sales model, we use a joint sales approach in which our sales force develops relationships directly with our customers, and together with our channel account teams, works with our channel partners on account penetration, account coordination, sales and overall market development. Our customer care and success teams maintain high-touch relationships with our customers to deploy and manage our cloud platform, identify, analyze and resolve performance issues and respond to security threats. We believe customer service touchpoints are opportunities to further develop our relationship with our customers and potentially generate incremental revenue through the addition of new users and services.
Our channel partners consist of global telecommunications service provider, system integrator and value-added reseller partners, and we leverage their relationships to expand our reach, improve procurement and accelerate customer fulfillment.
We enter into agreements with our channel partners in the ordinary course of business. The contracts typically have a one-year term and renew automatically, subject to cancellation by either party upon 90 days’ notice. These agreements contain standard commercial terms and conditions, including payment terms, billing frequency, warranties and indemnification. Our channel partners generally place purchase orders with us after receiving orders from customers. We generally maintain privity of contract with customers through end user subscription agreements.
We expect to continue investing in our channel partners as we provide them with education, training and programs, including supporting their independent sales of our solutions. We believe that such investment, and investments in our sales force, will lead to significant expansion in our customer base, which will materially impact our business and results of operations.
Our marketing strategy is focused on platform and brand awareness, which drives our opportunity pipeline and customer demand. This strategy is account-based, enabling us to pursue targeted marketing activities across both digital and non-digital channels. We anticipate increasing our marketing team headcount and are investing in programs designed to elevate our brand in the market and engage new enterprise accounts. We also participate in a number of cloud and security industry events. In addition, we have a deeply integrated ecosystem of channel partners, with whom we engage in joint marketing activities.
Data Center Operations
We operate our services across more than 100 data centers around the world, which are built to be highly resilient, have multiple levels of redundancy and provide failover to other data centers in our network. Our data centers are co-located within top-tier internet interconnection hubs that have direct connectivity, known as peering, to major telecommunication service providers, SaaS providers, public cloud providers, internet content providers and popular internet destinations. A number of our data centers are also located with our service provider partners. Our platform has received ISO 27001 certification since 2014.
Research and Development
Our research and development organization is responsible for the design, architecture, operation and quality of our cloud platform. In addition to improving on our features, functionality and scalability, this organization works closely with our cloud operations team to ensure that our platform is reliable, available and scalable. ThreatLabZ, our internal team of security experts, researchers and network engineers, analyzes the global threat landscape, works to eliminate threats across our cloud platform and reports on emerging security issues.
Research and development expense was
$39.4 million
, $33.6 million and $20.9 million for fiscal
2018
,
2017
and 2016, respectively. Our research and development leadership team is based in San Jose, California, and we also maintain research and development centers in India and Canada.
9
Competition
The market for security solutions is defined by changing technologies, an evolving threat landscape and complex enterprise needs. Our competitors and potential competitors include legacy on-premises appliance vendors across a number of categories:
|
•
|
independent IT security vendors, such as Check Point Software Technologies Ltd., Fortinet, Inc., Palo Alto Networks, Inc. and Symantec Corporation, which offer a broad mix of network and endpoint security products;
|
|
•
|
large networking vendors, such as Cisco Systems, Inc. and Juniper Networks, Inc., which offer security appliances and incorporate security capabilities in their networking products;
|
|
•
|
companies such as FireEye, Inc., Forcepoint Inc. (previously, Websense, Inc.), F5 Networks, Inc. and Pulse Secure, LLC with point solutions that compete with some of the features of our cloud platform, such as proxy, firewall, sandboxing and advanced threat protection, data loss prevention, encryption, load balancing and VPN; and
|
|
•
|
other providers of IT security services that offer, or may leverage related technologies to introduce, products that compete with or are alternatives to our cloud platform.
|
The principal competitive factors in the markets in which we operate include:
|
•
|
delivering security from the cloud regardless of location of the user;
|
|
•
|
platform features, effectiveness and extensibility;
|
|
•
|
platform reliability, availability and scalability;
|
|
•
|
rapid development and delivery of new capabilities and services;
|
|
•
|
ability to integrate with other participants in the security and networking ecosystem;
|
|
•
|
price, total cost of ownership and network cost savings;
|
|
•
|
brand awareness, reputation and trust in the provider’s services;
|
|
•
|
strength of sales, marketing and channel partner relationships; and
|
|
•
|
quality of customer support.
|
We believe we are positioned favorably against our competitors based on these factors. Our cloud platform integrates many of the point products offered by our competitors and potential competitors, which is a key differentiator. However, many of our competitors have substantially greater financial, technical and other resources, greater brand recognition, larger sales forces and marketing budgets, broader distribution networks, more diverse product and services offerings and larger and more mature intellectual property portfolios. They may be able to leverage these resources to gain business in a manner that discourages users from purchasing our services, including through selling at zero or negative margins, offering concessions, product bundling or maintaining closed technology platforms. Further, many organizations have invested substantial personnel and financial resources to design and operate their appliance-based network security architecture, and may not be willing or ready to abandon those historical investments. As our market grows and rapidly changes, we expect it will continue to attract new companies, including smaller emerging companies, which could introduce new products and services. In addition, we may expand into new markets and encounter additional competitors in such markets.
10
Intellectual Property
Our success depends in part upon our ability to protect and use our core technology and intellectual property rights. We rely on a combination of patents, copyrights, trademarks, trade secret laws, contractual provisions and confidentiality procedures to protect our intellectual property rights. As of July 31, 2018, we had over 120 total issued and pending patents, including in excess of 70 issued patents, in the United States and other countries. Our issued patents expire between 2028 and 2036 and cover various aspects of our cloud platform. In addition, we have registered “Zscaler” as a trademark in the United States and other jurisdictions, and we have registered other trademarks and filed other trademark applications in the United States. We are also the registered holder of a variety of domestic and international domain names that include “Zscaler” and similar variations. In addition to the protection provided by our intellectual property rights, we enter into confidentiality and invention assignment or similar agreements with our employees, consultants and contractors. We further control the use of our proprietary technology and intellectual property rights through provisions in our subscription and license agreements. Despite our efforts to protect our trade secrets and proprietary rights through intellectual property rights, licenses and confidentiality agreements, unauthorized parties may still copy or otherwise obtain and use our software and technology. In addition to our internally developed technology, we also license software, including open source software, from third parties that we integrate into or bundle with our cloud platform.
Our industry is characterized by the existence of a large number of patents and frequent claims and related litigation based on allegations of patent infringement or other violations of intellectual property rights. We believe that competitors will try to develop products and services that are similar to ours and that may infringe our intellectual property rights. Our competitors or other third-parties may also claim that our platform infringes their intellectual property rights. In particular, leading companies in our industry have extensive patent portfolios. From time to time, third parties, including certain of these leading companies and non-practicing entities, have in the past and may in the future assert claims of infringement, misappropriation and other violations of intellectual property rights against us or our customers or channel partners, with whom our license or other agreements may obligate us to indemnify against these claims. Successful claims of infringement by a third-party could prevent us from offering certain services or features, require us to develop alternate, non-infringing technology, which could require significant time and during which we could be unable to continue to offer our affected subscriptions or services, require us to obtain a license, which may not be available on reasonable terms or at all, or force us to pay substantial damages, royalties or other fees. As we face increasing competition and gain an increasingly higher profile, including as a result of becoming a public company, the possibility of intellectual property rights claims against us grows. We cannot assure you that we do not currently infringe, or that we will not in the future infringe, upon any third-party patents or other proprietary rights. See “Risk Factors-Claims by others that we infringe their proprietary technology or other rights, or other lawsuits asserted against us, could result in significant costs and substantially harm our business, financial condition, results of operations and prospects” for additional information.
Employees
We had approximately 1,050 employees worldwide as of July 31, 2018. None of our employees in the United States is represented by a labor organization or is a party to any collective bargaining arrangement. In certain countries in which we operate, we are subject to, and comply with, local labor law requirements which may automatically make our employees subject to industry-wide collective bargaining agreements. We may be required to comply with the terms of these collective bargaining agreements.
11
Corporate Information
We were incorporated in the state of Delaware in September 2007 as SafeChannel, Inc., and in August 2008, we changed our name to Zscaler, Inc. Our principal executive offices are located at 110 Rose Orchard Way, San Jose, CA 985134, and our telephone number is (408) 533-0288. Our website address is www.zscaler.com. Information contained on, or that can be accessed through, our website does not constitute part of this Annual Report on Form 10-K.
Available Information
Our Annual Report on Form 10-K, Quarterly Reports on Form 10-Q, Current Reports on Form 8-K, proxy statement, and all amendments to these filings, are available free of charge from our investor relations website (
https://ir.zscaler.com/financial-information/sec-filings
) as soon as reasonably practicable following our filing with or furnishing to the SEC of any of these reports.
The SEC’s website (https://
www.sec.gov
) contains reports, proxy and information statements, and other information regarding issuers that file electronically with the SEC.
Zscaler investors and others should note that we announce material information to the public about our company, products and services and other issues through a variety of means, including our website (https://www.zscaler.com/), our investor relations website (https://ir.zscaler.com), our blogs (https://www.zscaler.com/blogs), press releases, SEC filings, public conference calls, and social media, in order to achieve broad, non-exclusionary distribution of information to the public. We encourage our investors and others to review the information we make public in these locations as such information could be deemed to be material information. Please note that this list may be updated from time to time.
The contents of any website referred to in this Form 10-K are not intended to be incorporated into this Annual Report on Form 10-K or in any other report or document we file.
12
Risk Factors
A description of the risks and uncertainties associated with our business is set forth below. You should carefully consider the risks and uncertainties described below, as well as the other information in this Annual Report on Form 10-K, including our consolidated financial statements and the related notes and "Management’s Discussion and Analysis of Financial Condition and Results of Operations." The occurrence of any of the events or developments described below, or of additional risks and uncertainties not presently known to us or that we currently deem immaterial, could materially and adversely affect our business, results of operations, financial condition and growth prospects. In such an event, the market price of our common stock could decline and you could lose all or part of your investment.
Risks Related to Our Business
We have a history of losses and may not be able to achieve or sustain profitability in the future.
We have incurred net losses in all periods since our inception, and we expect we will continue to incur net losses for the foreseeable future. We experienced net losses of
$33.6 million
, $35.5 million and $27.4 million for fiscal 2018, 2017 and 2016, respectively. As of
July 31, 2018
we had an accumulated deficit of
$196.1 million
. Because the market for our cloud platform is rapidly evolving and cloud security solutions have not yet reached widespread adoption, it is difficult for us to predict our future results of operations. We expect our operating expenses to increase significantly over the next several years as we continue to hire additional personnel, particularly in sales and marketing, expand our operations and infrastructure, both domestically and internationally, and continue to develop our platform. In addition to the expected costs to grow our business, we also expect to incur significant additional legal, accounting and other expenses as a newly public company. If we fail to increase our revenue to offset the increases in our operating expenses, we may not achieve or sustain profitability in the future.
If organizations do not adopt our cloud platform, our ability to grow our business and operating results may be adversely affected.
Cloud technologies are still evolving, and it is difficult to predict customer demand and adoption rates for our solutions or cloud-based offerings generally. We believe that our cloud platform offers superior protection to our customers, who are becoming increasingly dependent on the internet as they move their applications and data to the cloud. We also believe that our cloud platform represents a major shift from on-premises appliance-based security solutions. However, traditional on-premises security appliances are entrenched in the infrastructure of many of our potential customers, particularly large enterprises, because of their prior investment in and the familiarity of their IT personnel with on-premises appliance-based solutions. As a result, our sales process often involves extensive efforts to educate our customers on the benefits and capabilities of our cloud platform, particularly as we continue to pursue customer relationships with large organizations. Even with these efforts, we cannot predict market acceptance of our cloud platform, or the development of competing products or services based on other technologies. If we fail to achieve market acceptance of our cloud platform or are unable to keep pace with industry changes, our ability to grow our business and our operating results will be materially and adversely affected.
13
If we are unable to attract new customers, our future results of operations could be harmed.
To increase our revenue and achieve and maintain profitability, we must add new customers. To do so, we must successfully convince IT decision makers that, as they adopt SaaS applications and the public cloud, security delivered through the cloud provides significant advantages over legacy on-premises appliance-based security products. Additionally, many of our customers broadly deploy our products, which requires a significant commitment of resources. These factors significantly impact our ability to add new customers and increase the time, resources and sophistication required to do so. In addition, numerous other factors, many of which are out of our control, may now or in the future impact our ability to add new customers, including potential customers’ commitments to legacy IT security vendors and products, real or perceived switching costs, our failure to expand, retain and motivate our sales and marketing personnel, our failure to develop or expand relationships with our channel partners or to attract new channel partners, failure by us to help our customers to successfully deploy our cloud platform, negative media or industry or financial analyst commentary regarding us or our solutions, litigation and deteriorating general economic conditions. If our efforts to attract new customers are not successful, our revenue and rate of revenue growth may decline, we may not achieve profitability and our future results of operations could be materially harmed.
If our customers do not renew their subscriptions for our services and add additional users and services to their subscriptions, our future results of operations could be harmed.
In order for us to maintain or improve our results of operations, it is important that our customers renew their subscriptions for our services when existing contract terms expire and that we expand our commercial relationships with our existing customers. Our customers have no obligation to renew their subscriptions for our services after the expiration of their contractual subscription period, which is typically one to three years, and in the normal course of business, some customers have elected not to renew. In addition, in certain cases, customers may cancel their subscriptions without cause either at any time or upon advance written notice (typically ranging from 30 days to 60 days), typically subject to an early termination penalty for unused services. In addition, our customers may renew for fewer users, renew for shorter contract lengths or switch to a lower-cost suite. If our customers do not renew their subscription services, we could incur impairment losses related to our deferred contract acquisition costs. It is difficult to accurately predict long-term customer retention because of our varied customer base and given the length of our subscription contracts. Our customer retention and expansion may decline or fluctuate as a result of a number of factors, including our customers’ satisfaction with our services, our prices and pricing plans, our customers’ spending levels, decreases in the number of users to which our customers deploy our solutions, mergers and acquisitions involving our customers, competition and deteriorating general economic conditions.
Our future success also depends in part on the rate at which our current customers add additional users or services to their subscriptions, which is driven by a number of factors, including customer satisfaction with our services, customer security and networking issues and requirements, general economic conditions and customer reaction to the price per additional user or of additional services. If our efforts to expand our relationship with our existing customers are not successful, our business may materially suffer.
14
We face intense and increasing competition and could lose market share to our competitors, which could adversely affect our business, financial condition and results of operations.
The market for network security solutions is intensely competitive and characterized by rapid changes in technology, customer requirements, industry standards and frequent introductions of new and improvements of existing products and services. Our business model of delivering security through the cloud rather than legacy on-premises appliances is still relatively new and has not yet gained widespread market traction. Moreover, we compete with many established network and security vendors who are aggressively competing against us with their legacy appliance-based solutions and are also seeking to introduce cloud-based services that have functionality similar to our cloud platform. We expect competition to increase as other established and emerging companies enter the security solutions market, in particular with respect to cloud-based security solutions, as customer requirements evolve and as new products, services and technologies are introduced. If we are unable to anticipate or effectively react to these competitive challenges, our competitive position could weaken, and we could experience a decline in revenue or our growth rate that could materially and adversely affect our business and results of operations.
Our competitors and potential competitors include:
|
•
|
independent IT security vendors, such as Check Point Software Technologies Ltd., Fortinet, Inc., Palo Alto Networks, Inc. and Symantec Corporation, which offer a broad mix of network and endpoint security products;
|
|
•
|
large networking vendors, such as Cisco Systems, Inc. and Juniper Networks, Inc., which offer security appliances and incorporate security capabilities in their networking products;
|
|
•
|
companies such as FireEye, Inc., Forcepoint Inc. (previously, Websense, Inc.), F5 Networks, Inc. and Pulse Secure, LLC with point solutions that compete with some of the features of our cloud platform, such as proxy, firewall, sandboxing and advanced threat protection, data loss prevention, encryption, load balancing and virtual private network vendors; and
|
|
•
|
other providers of IT security services that offer, or may leverage related technologies to introduce, products that compete with or are alternatives to our cloud platform.
|
Many of our existing competitors have, and some of our potential competitors could have, substantial competitive advantages such as:
|
•
|
greater name recognition, longer operating histories and larger customer bases;
|
|
•
|
larger sales and marketing budgets and resources;
|
|
•
|
broader distribution and established relationships with channel partners and customers;
|
|
•
|
greater customer support resources;
|
|
•
|
greater resources to make acquisitions and enter into strategic partnerships;
|
|
•
|
lower labor and research and development costs;
|
|
•
|
larger and more mature intellectual property rights portfolios; and
|
|
•
|
substantially greater financial, technical and other resources.
|
Our competitors may be successful in convincing IT decision makers that legacy appliance-based security products are sufficient to meet their security needs and provide security performance that competes with our cloud platform. Accordingly, these IT decision makers may continue allocating their information technology budgets to legacy appliance-based products and may not adopt our cloud platform. Further, many organizations have invested substantial personnel and financial resources to
15
design and operate their appliance-based networks and have established deep relationships with appliance vendors. As a result, these organizations may prefer to purchase from their existing suppliers rather than add or switch to a new supplier.
Our larger competitors have substantially broader and more diverse product and services offerings, which may allow them to leverage their relationships based on other products or incorporate functionality into existing products to gain business in a manner that discourages users from purchasing our services, including through selling at zero or negative margins, offering concessions, bundling products or maintaining closed technology platforms. Many competitors that specialize in providing protection from a single type of security threat may be able to deliver these targeted security products to the market more quickly than we can or to convince organizations that these limited products meet their needs.
Conditions in our market could change rapidly and significantly as a result of technological advancements, partnering or acquisitions by our competitors or continuing market consolidation. New start-up companies that innovate and large competitors that are making significant investments in research and development may invent similar or superior products, services and technologies that compete with our cloud platform. In addition, large companies with substantial communications infrastructure, such as global telecommunications services provider partners or public cloud providers, could choose to enter the security solutions market. Some of our current or potential competitors have made or could make acquisitions of businesses or establish cooperative relationships that may allow them to offer more directly competitive and comprehensive solutions than were previously offered and adapt more quickly to new technologies and customer needs. These competitive pressures in our market or our failure to compete effectively may result in price reductions, fewer orders, reduced revenue and gross margins, increased net losses and loss of market share. Any failure to meet and address these factors could materially harm our business and operating results.
We have experienced rapid revenue and other growth in recent periods, which may not be indicative of our future performance.
We have experienced rapid growth in revenue, operations and employee headcount in recent periods. In addition, the number of customers, users and internet traffic on our cloud platform has increased rapidly in recent years. You should not consider our recent growth in these areas as indicative of our future performance. While we expect to continue to expand our operations and to increase our headcount significantly in the future, both domestically and internationally, our growth may not be sustainable. In particular, our recent revenue growth rates may decline in the future and may not be sufficient to achieve and sustain profitability, as we also expect our costs to increase in future periods. We believe that historical comparisons of our revenue may not be meaningful and should not be relied upon as an indication of future performance. Accordingly, you should not rely on our revenue and other growth for any prior quarter or fiscal year as an indication of our future revenue or revenue growth.
If we fail to effectively manage our growth, we may be unable to execute our business plan, maintain high levels of service, adequately address competitive challenges or maintain our corporate culture, and our business, financial condition and results of operations would be harmed.
Our growth has placed, and future growth will continue to place, a significant strain on our management and our administrative, operational and financial infrastructure. Our success will depend in part on our ability to manage this growth effectively, which will require that we continue to improve our administrative, operational, financial and management systems and controls by, among other things:
|
•
|
effectively attracting, training and integrating a large number of new employees, particularly members of our sales and management teams;
|
|
•
|
further improving our key business applications, processes and IT infrastructure, including our data centers, to support our business needs;
|
16
|
•
|
enhancing our information and communication systems to ensure that our employees and offices around the world are well coordinated and can effectively communicate with each other and our growing base of channel partners, customers and users; and
|
|
•
|
appropriately documenting and testing our IT systems and business processes.
|
These and other improvements in our systems and controls will require significant capital expenditures and the allocation of valuable management and employee resources. If we fail to implement these improvements effectively, our ability to manage our expected growth, ensure uninterrupted operation of our cloud platform and key business systems and comply with the rules and regulations applicable to public companies could be impaired, the quality of our platform and services could suffer and we may not be able to adequately address competitive challenges.
In addition, we believe that our corporate culture has been a contributor to our success, which we believe fosters innovation, teamwork and an emphasis on customer-focused results. We also believe that our culture creates an environment that drives and perpetuates our strategy and cost-effective distribution approach. As we grow and develop the infrastructure of a public company, we may find it difficult to maintain our corporate culture. Any failure to preserve our culture could harm our future success, including our ability to retain and recruit personnel, innovate and operate effectively and execute on our business strategy. If we experience any of these effects in connection with future growth, it could materially impair our ability to attract new customers, retain existing customers and expand their use of our platform, all of which would materially and adversely affect our business, financial condition and results of operations.
Our relatively limited operating history makes it difficult to evaluate our current business and prospects and may increase the risk that we will not be successful.
Our relatively limited operating history makes it difficult to evaluate our current business and prospects and plan for our future growth. We were incorporated in 2007, with much of our growth occurring in recent years. As a result, our business model has not been fully proven, which subjects us to a number of uncertainties, including our ability to plan for and model future growth. While we have continued to develop our solutions to incorporate multiple security and compliance applications into a single purpose-built, multi-tenant, distributed cloud security platform, we have encountered and will continue to encounter risks and uncertainties frequently experienced by rapidly growing companies in developing markets, including our ability to achieve broad market acceptance of our cloud platform, attract additional customers, grow partnerships, withstand increasing competition and manage increasing expenses as we continue to grow our business. If our assumptions regarding these risks and uncertainties are incorrect or change in response to changes in the market for network security solutions, our operating and financial results could differ materially from our expectations and our business could suffer.
Our operating results may fluctuate significantly, which could make our future results difficult to predict and could cause our operating results to fall below expectations.
Our operating results may fluctuate from quarter to quarter as a result of a number of factors, many of which are outside of our control and may be difficult to predict. Some of the factors that may cause our results of operations to fluctuate from quarter to quarter include:
|
•
|
broad market acceptance and the level of demand for our cloud platform;
|
|
•
|
our ability to attract new customers, particularly large enterprises;
|
|
•
|
our ability to retain customers and expand their usage of our platform, particularly our largest customers;
|
|
•
|
our ability to successfully expand internationally and penetrate key markets;
|
|
•
|
the effectiveness of our sales and marketing programs;
|
17
|
•
|
the length of our sales cycle, including the timing of renewals;
|
|
•
|
technological changes and the timing and success of new service introductions by us or our competitors or any other change in the competitive landscape of our market;
|
|
•
|
increases in and timing of operating expenses that we may incur to grow and expand our operations and to remain competitive;
|
|
•
|
pricing pressure as a result of competition or otherwise;
|
|
•
|
seasonal buying patterns for IT spending;
|
|
•
|
the quality and level of our execution of our business strategy and operating plan;
|
|
•
|
adverse litigation judgments, settlements or other litigation-related costs;
|
|
•
|
changes in the legislative or regulatory environment;
|
|
•
|
the impact and costs related to the acquisition of businesses, talent, technologies or intellectual property rights; and
|
|
•
|
general economic conditions in either domestic or international markets, including geopolitical uncertainty and instability.
|
Any one or more of the factors above may result in significant fluctuations in our results of operations. We also intend to continue to invest significantly to grow our business in the near future rather than optimizing for profitability or cash flows. In addition, we generally experience seasonality in terms of when we enter into agreements with customers. We typically enter into a higher percentage of agreements with new customers, as well as renewal agreements with existing customers, in the second and fourth quarters of our fiscal year. This seasonality is reflected to a much lesser extent, and sometimes is not immediately apparent, in revenue, due to the fact that we recognize subscription revenue ratably over the term of the subscription, which is generally one to three years. We expect that seasonality will continue to affect our operating results in the future and may reduce our ability to predict cash flow and optimize the timing of our operating expenses.
The variability and unpredictability of our quarterly results of operations or other operating metrics could result in our failure to meet our expectations or those of industry or financial analysts. If we fail to meet or exceed such expectations for these or any other reasons, the market price of our common stock could fall substantially, and we could face costly lawsuits, including securities class action suits.
If the delivery of our services to our customers is interrupted or delayed for any reason, our business could suffer.
Any interruption or delay in the delivery of our services will negatively impact our customers. Our solutions are deployed via the internet, and our customers’ internet traffic is routed through our cloud platform. Our customers depend on the continuous availability of our cloud platform to access the internet, and our services are designed to operate without interruption in accordance with our service level commitments. If our entire platform were to fail, customers and users could lose access to the internet until such disruption is resolved or customers deploy disaster recovery options that allow them to bypass our cloud platform to access the internet. The adverse effects of any service interruptions on our reputation and financial condition may be disproportionately heightened due to the nature of our business and the fact that our customers expect continuous and uninterrupted internet access and have a low tolerance for interruptions of any duration. While we do not consider them to have been material, we have experienced, and may in the future experience, service disruptions and other performance problems due to a variety of factors.
18
The following factors, many of which are beyond our control, can affect the delivery and availability of our services and the performance of our cloud:
|
•
|
the development and maintenance of the infrastructure of the internet;
|
|
•
|
the performance and availability of third-party telecommunications services with the necessary speed, data capacity and security for providing reliable internet access and services;
|
|
•
|
decisions by the owners and operators of the data centers where our cloud infrastructure is deployed or by global telecommunications service provider partners who provide us with network bandwidth to terminate our contracts, discontinue services to us, shut down operations or facilities, increase prices, change service levels, limit bandwidth, declare bankruptcy or prioritize the traffic of other parties;
|
|
•
|
the occurrence of earthquakes, floods, fires, power loss, system failures, physical or electronic break-ins, acts of war or terrorism, human error or interference (including by disgruntled employees, former employees or contractors) and other catastrophic events;
|
|
•
|
cyberattacks, including denial of service attacks, targeted at us, our data centers, our global telecommunications service provider partners or the infrastructure of the internet;
|
|
•
|
failure by us to maintain and update our cloud infrastructure to meet our traffic capacity requirements;
|
|
•
|
errors, defects or performance problems in our software, including third-party software incorporated in our software, which we use to operate our cloud platform;
|
|
•
|
improper classification of websites by our vendors who provide us with lists of malicious websites;
|
|
•
|
improper deployment or configuration of our services;
|
|
•
|
the failure of our redundancy systems, in the event of a service disruption at one of our data centers, to provide failover to other data centers in our data center network; and
|
|
•
|
the failure of our disaster recovery and business continuity arrangements.
|
The occurrence of any of these factors, or if we are unable to efficiently and cost-effectively fix such errors or other problems that may be identified, could damage our reputation, negatively impact our relationship with our customers or otherwise materially harm our business, results of operations and financial condition.
In addition, we provide our services through a cloud-based inline proxy, and some governments, third-party products, websites or services may block proxy-based traffic under certain circumstances. For example, vendors may attempt to block traffic from our cloud platform or blacklist our IP addresses because they cannot identify the source of the proxy-based traffic. Our competitors may use this as an excuse to block traffic from their solutions or blacklist our IP addresses, which may result in our customers’ traffic being blocked from our platform. If our customers experience significant instances of traffic blockages, they will experience reduced functionality or other inefficiencies, which would reduce customer satisfaction with our services and likelihood of renewal.
The actual or perceived failure of our cloud platform to block malware or prevent a security breach could harm our reputation and adversely impact our business, financial condition and results of operations.
Our cloud platform may fail to detect or prevent security breaches for any number of reasons. Our cloud platform is complex and may contain performance issues that are not detected until after its deployment. We also provide frequent solution updates and fundamental enhancements, which increase the possibility of errors, and our reporting, tracking, monitoring and quality
19
assurance procedures may not be sufficient to ensure we detect any such defects in a timely manner. The performance of our cloud platform can be negatively impacted by our failure to enhance, expand or update our cloud platform, errors or defects in our software, improper classification of websites by our vendors who provide us with lists of malicious websites, improper deployment or configuration of our services and many other factors.
In addition, because the techniques used by computer hackers to access or sabotage networks change frequently and generally are not recognized until launched against a target, there is a risk that a cyber threat could emerge that our services are unable to detect or prevent until after some of our customers are impacted. Moreover, as our services are adopted by an increasing number of enterprises, it is possible that the individuals and organizations behind cyber threats will focus on finding ways to defeat our services. If this happens, our cloud platform could be targeted by attacks specifically designed to disrupt our business and create the perception that our cloud platform is not capable of providing superior security, which, in turn, could have a serious impact on our reputation as a provider of security solutions. Further, if a high profile security breach occurs with respect to another cloud services provider, our customers and potential customers may lose trust in cloud solutions generally, and with respect to security in particular, which could materially and adversely impact our ability to retain existing customers or attract new customers.
Increasingly, companies are subject to a wide variety of attacks on their networks and systems, including traditional computer hackers, malicious code (such as viruses and worms), distributed denial-of-service attacks, sophisticated attacks conducted or sponsored by nation-states, advanced persistent threat intrusions, ransomware, and theft or misuse of intellectual property or business or personal data, including by disgruntled employees, former employees or contractors. No security solution, including our cloud platform, can address all possible security threats or block all methods of penetrating a network or otherwise perpetrating a security incident. Our customers must rely on complex network and security infrastructures, which include products and services from multiple vendors, to secure their networks. If any of our customers becomes infected with malware or experiences a security breach, they could be disappointed with our services, regardless of whether our services are intended to block the attack or would have blocked the attack if the customer had properly configured our cloud platform. Additionally, if any enterprises that are publicly known to use our services are the subject of a cyberattack that becomes publicized, our current or potential customers may look to our competitors for alternatives to our services.
From time to time, industry or financial analysts and research firms test our solutions against other security products. Our services may fail to detect or prevent threats in any particular test for a number of reasons, including misconfiguration. To the extent potential customers, industry or financial analysts or testing firms believe that the occurrence of a failure to detect or prevent any particular threat is a flaw or indicates that our services do not provide significant value, our reputation and business could be materially harmed.
Any real or perceived flaws in our cloud platform or any real or perceived security breaches of our customers could result in:
|
•
|
a loss of existing or potential customers or channel partners;
|
|
•
|
delayed or lost sales and harm to our financial condition and results of operations;
|
|
•
|
a delay in attaining, or the failure to attain, market acceptance;
|
|
•
|
the expenditure of significant financial resources in efforts to analyze, correct, eliminate, remediate or work around errors or defects, to address and eliminate vulnerabilities and to address any applicable legal or contractual obligations relating to any actual or perceived security breach;
|
|
•
|
negative publicity and damage to our reputation and brand; and
|
|
•
|
legal claims and demands (including for stolen assets or information, repair of system damages, and compensation
|
20
to customers and business partners), litigation, regulatory inquiries or investigations and other liability.
Any of the above results could materially and adversely affect our business, financial condition and results of operations.
If our global network of data centers which deliver our services was damaged or otherwise failed to meet the requirement of our business, our ability to provide services to our customers and maintain the performance of our cloud platform could be negatively impacted, which could cause our business to suffer.
We currently host our cloud platform and serve our customers from a global network of over 100 data centers. While we have electronic access to the components and infrastructure of our cloud platform that are hosted by third parties, we do not control the operation of these facilities. Consequently, we may be subject to service disruptions as well as failures to provide adequate support for reasons that are outside of our direct control. Our data centers are vulnerable to damage or interruption from a variety of sources, including earthquakes, floods, fires, power loss, system failures, computer viruses, physical or electronic break-ins, human error or interference (including by disgruntled employees, former employees or contractors), and other catastrophic events. Our data centers may also be subject to local administrative actions, changes to legal or permitting requirements and litigation to stop, limit or delay operations. Despite precautions taken at these facilities, such as disaster recovery and business continuity arrangements, the occurrence of a natural disaster or an act of terrorism, a decision to close the facilities without adequate notice or other unanticipated problems at these facilities could result in interruptions or delays in our services, impede our ability to scale our operations or have other adverse impacts upon our business. In addition, if we do not accurately plan for our infrastructure capacity requirements and we experience significant strains on our data center capacity, we may experience delays and additional expenses in arranging new data centers, and our customers could experience performance degradation or service outages that may subject us to financial liabilities, result in customer losses and materially harm our business.
Our business and growth depend in part on the success of our relationships with our channel partners.
We currently derive most of our revenue from sales through our channel partner network, and we expect for the foreseeable future most of our future revenue growth will also be driven through this network. Not only does our joint sales approach require additional investment to grow and train our sales force, but we believe that continued growth in our business is dependent upon identifying, developing and maintaining strategic relationships with our existing and potential channel partners, including global systems integrators and regional telecommunications service providers that will in turn drive substantial revenue and provide additional value-added services to our customers. Our agreements with our channel partners are generally non-exclusive, meaning our channel partners may offer customers the products of several different companies, including products that compete with our cloud platform. In general, our channel partners may also cease marketing or reselling our platform with limited or no notice and without penalty. If our channel partners do not effectively market and sell subscriptions to our cloud platform, choose to promote our competitors’ products or fail to meet the needs of our customers, our ability to grow our business and sell subscriptions to our cloud platform may be adversely affected. For example, sales through our top five channel partners and their affiliates, in aggregate, represented
42%
, 47% and 46% of our revenue for fiscal
2018
, 2017 and 2016, respectively. In addition, our channel partner structure could subject us to lawsuits or reputational harm if, for example, a channel partner misrepresents the functionality of our cloud platform to customers or violates applicable laws or our corporate policies. Our ability to achieve revenue growth in the future will depend in large part on our success in maintaining successful relationships with our channel partners, identifying additional channel partners and training our channel partners to independently sell and deploy our platform. If we are unable to maintain our relationships with our existing channel partners or develop successful relationships with new channel partners or if our channel partners fail to perform, our business, financial position and results of operations could be materially and adversely affected.
21
If we are not able to maintain and enhance our brand, our business and results of operations may be adversely affected.
We believe that maintaining and enhancing our reputation as a provider of high-quality security solutions is critical to our relationship with our existing customers and channel partners and our ability to attract new customers and channel partners. The successful promotion of our brand will depend on a number of factors, including our marketing efforts, our ability to continue to develop high-quality features and solutions for our cloud platform and our ability to successfully differentiate our platform from competitive products and services. Our brand promotion activities may not be successful or yield increased revenue. In addition, independent industry or financial analysts often provide reviews of our platform, as well as products and services of our competitors, and perception of our platform in the marketplace may be significantly influenced by these reviews. If these reviews are negative, or less positive as compared to those of our competitors’ products and services, our brand may be adversely affected. Additionally, the performance of our channel partners may affect our brand and reputation if customers do not have a positive experience with our channel partners’ services. The promotion of our brand requires us to make substantial expenditures, and we anticipate that the expenditures will increase as our market becomes more competitive, we expand into new markets and more sales are generated through our channel partners. To the extent that these activities yield increased revenue, this revenue may not offset the increased expenses we incur. If we do not successfully maintain and enhance our brand, our business may not grow, we may have reduced pricing power relative to competitors and we could lose customers or fail to attract potential customers, all of which would materially and adversely affect our business, results of operations and financial condition.
If we do not effectively expand and train our sales force, we may be unable to add new customers or increase sales to our existing customers, and our business will be adversely affected.
Although we have a channel sales model, our sales representatives typically engage in direct interaction with our prospective customers. Therefore, we continue to be substantially dependent on our sales force to obtain new customers. Increasing our customer base and achieving broader market acceptance of our cloud platform will depend, to a significant extent, on our ability to expand and further invest in our sales and marketing operations and activities. There is significant competition for sales personnel with the advanced sales skills and technical knowledge we need. We believe that selling a cloud-based security solution requires particularly talented sales personnel with the ability to communicate the transformative potential of our cloud platform. Our ability to achieve significant growth in revenue in the future will depend, in large part, on our success in recruiting, training and retaining sufficient numbers of these talented sales personnel in both the U.S. and international markets. In particular, in the near term, we expect to expand our sales and marketing organization significantly. New hires require significant training and may take significant time before they achieve full productivity. As a result, our new hires and planned hires may not become as productive as we would like, and we may be unable to hire or retain sufficient numbers of qualified individuals in the future. As a result of our rapid growth, a large percentage of our sales and marketing team is new to our company and selling our solutions, and therefore this team may be less effective than our more seasoned employees. Furthermore, hiring sales personnel in new countries, or expanding our existing presence, requires upfront and ongoing expenditures that we may not recover if the sales personnel fail to achieve full productivity. We cannot predict whether, or to what extent, our sales will increase as we expand our sales force or how long it will take for sales personnel to become productive. If we are unable to hire and train a sufficient number of effective sales personnel, or the sales personnel we hire are not successful in obtaining new customers or increasing sales to our existing customer base, our business and future growth prospects will be materially and adversely affected.
Our sales cycles can be long and unpredictable, and our sales efforts require considerable time and expense.
The timing of our sales and related revenue recognition is difficult to predict because of the length and unpredictability of the sales cycle for our cloud platform, particularly with respect to large organizations. Our sales efforts typically involve educating our prospective customers about the uses, benefits and the value proposition of our cloud platform. Customers often view the subscription to our cloud platform as a significant strategic decision and, as a result, frequently require considerable time to evaluate, test and qualify our platform prior to entering into or expanding a relationship with us. Large enterprises and government entities in particular often undertake a significant evaluation process that further lengthens the sales cycle.
22
Our sales force develops relationships directly with our customers, and together with our channel account teams, works with our channel partners on account penetration, account coordination, sales and overall market development. We spend substantial time and resources on our sales efforts without any assurance that our efforts will produce a sale. Platform purchases are frequently subject to budget constraints, multiple approvals and unanticipated administrative, processing and other delays. As a result, it is difficult to predict whether and when a sale will be completed and when revenue from a sale will be recognized.
Sales to larger customers involve risks that may not be present, or that are present to a lesser extent, with sales to smaller customers, which can act as a disincentive to our sales team to pursue these larger customers. These risks include:
|
•
|
competition from companies that traditionally target larger enterprises and that may have pre-existing relationships or purchase commitments from such customers;
|
|
•
|
increased purchasing power and leverage held by larger customers in negotiating contractual arrangements with us;
|
|
•
|
more stringent requirements in our support obligations; and
|
|
•
|
longer sales cycles and the associated risk that substantial time and resources may be spent on a potential customer that elects not to purchase our solutions.
|
The failure of our efforts to secure sales after investing resources in a lengthy sales process could materially and adversely affect our business and operating results.
If we fail to develop or introduce new enhancements to our cloud platform on a timely basis, our ability to attract and retain customers, remain competitive and grow our business could be impaired.
The industry in which we compete is characterized by rapid technological change, frequent introductions of new products and services, evolving industry standards and changing regulations, as well as changing customer needs, requirements and preferences. Our ability to attract new customers and increase revenue from existing customers will depend in significant part on our ability to anticipate and respond effectively to these changes on a timely basis and continue to introduce enhancements to our cloud platform. The success of our cloud platform depends on our continued investment in our research and development organization to increase the reliability, availability and scalability of our existing solutions. The success of any enhancement depends on several factors, including the timely completion and market acceptance of the enhancement. Any new service that we develop might not be introduced in a timely or cost-effective manner and might not achieve the broad market acceptance necessary to generate significant revenue. If new technologies emerge that deliver competitive products and services at lower prices, more efficiently, more conveniently or more securely, these technologies could adversely impact our ability to compete effectively. Any delay or failure in the introduction of enhancements could materially harm our business, results of operations and financial condition.
Because we recognize revenue from subscriptions for our services over the term of the subscription, downturns or upturns in new business may not be immediately reflected in our operating results and may be difficult to discern.
We generally recognize revenue from customers ratably over the terms of their subscription, which are typically one to three years. As a result, a substantial portion of the revenue we report in each period is attributable to the recognition of deferred revenue relating to agreements that we entered into during previous periods. Consequently, any increase or decline in new sales or renewals in any one period may not be immediately reflected in our revenue for that period. Any such change, however, may affect our revenue in future periods. Additionally, subscriptions that are invoiced annually in advance or multi-year in advance contribute significantly to our short-term and long-term deferred revenue in comparison to our invoices issued quarterly and monthly in advance, which will also affect our financial position in any given period. Accordingly, the effect of downturns or upturns in new sales and potential changes in our rate of renewals may not be fully reflected in our results of operations until future periods. We may also be unable to reduce our cost structure in line with a significant deterioration in sales or renewals.
23
Our subscription model also makes it difficult for us to rapidly increase our revenue through additional sales in any period, as revenue from new customers must be recognized over the applicable subscription term.
If our cloud platform or internal networks, systems or data are or are perceived to have been breached, our solution may be perceived as insecure, our reputation may be damaged and our financial results may be negatively impacted.
It is virtually impossible for us to entirely mitigate the risk of breaches of our cloud platform or other security incidents affecting our internal systems, networks or data. In addition, the functionality of our platform may be disrupted by third parties, including disgruntled employees, former employees or contractors. The security measures we use internally and have integrated into our cloud platform, which are designed to detect unauthorized activity and prevent or minimize security breaches, may not function as expected or may not be sufficient to protect against certain attacks. Companies are subject to a wide variety of attacks on their networks and systems, and techniques used to sabotage or to obtain unauthorized access to networks in which data is stored or through which data is transmitted change frequently and generally are not recognized until launched against a target. As a result, we may be unable to anticipate these techniques or implement adequate measures to prevent an electronic intrusion into our customers through our cloud platform or to prevent breaches and other security incidents affecting our cloud platform, internal networks, systems or data. Actual or perceived security breaches of our cloud platform could result in actual or perceived breaches of our customers’ networks and systems, which, in turn, could lead to litigation, governmental audits and investigations and significant legal fees, and could damage our relationships with our existing customers and have a negative impact on our ability to attract and retain new customers.
Our internal systems are exposed to the same cybersecurity risks and consequences of a breach as our customers and other enterprises. However, since our business is focused on providing reliable security services to our customers, we believe that an actual or perceived breach of, or security incident affecting, our internal networks, systems or data, could be especially detrimental to our reputation, customer confidence in our solution and our business.
If our cloud platform does not interoperate with our customers’ network and security infrastructure or with third-party products, websites or services, our cloud platform may become less competitive and our results of operations may be harmed.
Our cloud platform must interoperate with our customers’ existing network and security infrastructure. These complex systems are developed, delivered and maintained by the customer and a myriad of vendors and service providers. As a result, the components of our customers’ infrastructure have different specifications, rapidly evolve, utilize multiple protocol standards, include multiple versions and generations of products and may be highly customized. We must be able to interoperate and provide our security services to customers with highly complex and customized networks, which requires careful planning and execution between our customers, our customer support teams and our channel partners. Further, when new or updated elements of our customers’ infrastructure or new industry standards or protocols, such as HTTP/2, are introduced, we may have to update or enhance our cloud platform to allow us to continue to provide service to customers. Our competitors or other vendors may refuse to work with us to allow their products to interoperate with our solutions, which could make it difficult for our cloud platform to function properly in customer networks that include these third-party products.
We may not deliver or maintain interoperability quickly or cost-effectively, or at all. These efforts require capital investment and engineering resources. If we fail to maintain compatibility of our cloud platform with our customers’ network and security infrastructures, our customers may not be able to fully utilize our solutions, and we may, among other consequences, lose or fail to increase our market share and experience reduced demand for our services, which would materially harm our business, operating results and financial condition.
24
We provide service level commitments under our customer contracts. If we fail to meet these contractual commitments, we could be obligated to provide credits for future service and our business could suffer.
Our customer agreements contain service level commitments, which contain specifications regarding the availability and performance of our cloud platform. Any failure of or disruption to our infrastructure could impact the performance of our platform and the availability of services to customers. If we are unable to meet our stated service level commitments or if we suffer extended periods of poor performance or unavailability of our platform, we may be contractually obligated to provide affected customers with service credits for future subscriptions, and, in certain cases, refunds. To date, there has not been a material failure to meet our service level commitments, and we do not currently have any material liabilities accrued on our balance sheet for such commitments. Our revenue, other results of operations and financial condition could be harmed if we suffer performance issues or downtime that exceeds the service level commitments under our agreements with our customers.
Our ability to maintain customer satisfaction depends in part on the quality of our customer support, including the quality of the support provided on our behalf by certain channel partners. Failure to maintain high-quality customer support could have an adverse effect on our business, financial condition and results of operations.
If we do not provide superior support to our customers, our ability to renew subscriptions, increase the number of users and sell additional services to customers will be adversely affected. We believe that successfully delivering our cloud solution requires a particularly high level of customer support and engagement. We or our channel partners must successfully assist our customers in deploying our cloud platform, resolving performance issues, addressing interoperability challenges with a customer’s existing network and security infrastructure and responding to security threats and cyberattacks. Many enterprises, particularly large organizations, have very complex networks and require high levels of focused support, including premium support offerings, to fully realize the benefits of our cloud platform. Any failure by us to maintain the expected level of support could reduce customer satisfaction and hurt our customer retention, particularly with respect to our large enterprise customers. Additionally, if our channel partners do not provide support to the satisfaction of our customers, we may be required to provide this level of support to those customers, which would require us to hire additional personnel and to invest in additional resources. We may not be able to hire such resources fast enough to keep up with demand, particularly if the sales of our platform exceed our internal forecasts. To the extent that we or our channel partners are unsuccessful in hiring, training and retaining adequate support resources, our ability and the ability of our channel partners to provide adequate and timely support to our customers will be negatively impacted, and our customers’ satisfaction with our cloud platform could be adversely affected. We currently rely in part on contractors provided by third-party service providers internationally to provide support services to our customers, and we expect to expand our international customer service support team to other countries. Any failure to properly train or oversee such contractors could result in a poor customer experience and an adverse impact on our reputation and ability to renew subscriptions or engage new customers. Furthermore, as we sell our solutions internationally, our support organization faces additional challenges, including those associated with delivering support, training and documentation in languages other than English. Any failure to maintain high-quality customer support, or a market perception that we do not maintain high-quality support, could materially harm our reputation, adversely affect our ability to sell our solutions to existing and prospective customers and could harm our business, financial condition and results of operations.
We rely on our key technical, sales and management personnel to grow our business, and the loss of one or more key employees or the inability to attract and retain qualified personnel could harm our business.
Our future success is substantially dependent on our ability to attract, retain and motivate the members of our management team and other key employees throughout our organization. In particular, we are highly dependent on the services of Jay Chaudhry, our president, chief executive officer and chairman of our board of directors, who is critical to our future vision and strategic direction. We rely on our leadership team in the areas of operations, security, marketing, sales, support and general and administrative functions, and on individual contributors on our research and development team. Although we have entered into employment agreements with our key personnel, these agreements have no specific duration and constitute at-will employment.
25
We do not maintain key person life insurance policies on any of our employees. The loss of one or more of our executive officers or key employees could seriously harm our business. For example, William Welch resigned as our chief operating officer in May 2018. If we are unable to effectively replace him or manage his responsibilities on an interim basis, particularly with respect to our sales activities, our business and results of operations could be materially and adversely affected.
To execute our growth plan, we must attract and retain highly qualified personnel. Competition for these personnel in the San Francisco Bay Area, where our headquarters are located, and in other locations where we maintain offices, is intense, especially for experienced sales professionals and for engineers experienced in designing and developing cloud applications and security software. We have from time to time experienced, and we expect to continue to experience, difficulty in hiring and retaining employees with appropriate qualifications. For example, in recent years, recruiting, hiring and retaining employees with expertise in the cybersecurity industry has become increasingly difficult as the demand for cybersecurity professionals has increased as a result of the recent cybersecurity attacks on global corporations and governments. Many of the companies with which we compete for experienced personnel have greater resources than we have. In addition, job candidates and existing employees often consider the value of the equity awards they receive in connection with their employment. Volatility or lack of performance in our stock price may also affect our ability to attract and retain our key employees. Also, many of our employees have become, or will soon become, vested in a substantial amount of equity awards, which may give them a substantial amount of personal wealth. This may make it more difficult for us to retain and motivate these employees, and this wealth could affect their decision about whether or not they continue to work for us. Any failure to successfully attract, integrate or retain qualified personnel to fulfill our current or future needs could materially and adversely affect our business, operating results and financial condition.
Our business is subject to the risks of earthquakes, fire, floods and other natural catastrophic events, and to interruption by man-made problems such as power disruptions, computer viruses, data security breaches or terrorism.
Our corporate headquarters are located in the San Francisco Bay Area, a region known for seismic activity. A significant natural disaster, such as an earthquake, fire or a flood, occurring at our headquarters, at one of our other facilities or where a key channel partner or data center is located could adversely affect our business, results of operations and financial condition. Further, if a natural disaster or man-made problem were to affect our component suppliers or other third-party providers, this could materially and adversely affect our ability to provide services in a timely or cost-effective manner. In addition, natural disasters and acts of terrorism could cause disruptions in our or our customers’ businesses, national economies or the world economy as a whole. In addition, computer malware, viruses and computer hacking, fraudulent use attempts and phishing attacks have become more prevalent in our industry, and our internal systems may be victimized by such attacks. Although we maintain incident management and disaster response plans, in the event of a major disruption caused by a natural disaster or man-made problem, we may be unable to continue our operations and may endure system interruptions, reputational harm, delays in our development activities, lengthy interruptions in service, breaches of data security and loss of critical data. Though it is difficult to determine what, if any, harm may directly result from any specific interruption or attack, any failure to maintain performance, reliability, security and availability of our platform to the satisfaction of our users may materially harm our reputation and our ability to retain existing customers and attract new customers.
We incorporate technology from third parties into our cloud platform, and our inability to obtain or maintain rights to the technology could harm our business.
We license software and other technology from third parties that we incorporate into or integrate with, our cloud platform. We cannot be certain that our licensors are not infringing the intellectual property rights of third parties or that our licensors have sufficient rights to the licensed intellectual property in all jurisdictions in which we may sell our services. In addition, many licenses are non-exclusive, and therefore our competitors may have access to the same technology licensed to us. Some of our agreements with our licensors may be terminated for convenience by them, or otherwise provide for a limited term. If we are unable to continue to license any of this technology for any reason, our ability to develop and sell our services containing such
26
technology could be harmed. Similarly, if we are unable to license necessary technology from third parties now or in the future, we may be forced to acquire or develop alternative technology, which we may be unable to do in a commercially feasible manner or at all, and we may be required to use alternative technology of lower quality or performance standards. This could limit and delay our ability to offer new or competitive products and services and increase our costs of production. As a result, our business and results of operations could be significantly harmed. Additionally, as part of our longer-term strategy, we plan to open our cloud security platform to third-party developers and applications to further extend its functionality. We cannot be certain that such efforts to grow our business will be successful.
Some of our technology incorporates "open source" software, and we license some of our software through open source projects, which could negatively affect our ability to sell our platform and subject us to possible litigation.
Our solutions incorporate software licensed by third parties under open source licenses, including open source software included in software we receive from third-party commercial software vendors. Use of open source software may entail greater risks than use of third-party commercial software, as open source licensors generally do not provide support, updates or warranties or other contractual protections regarding infringement claims or the quality of the code. In addition, the wide availability of open source software used in our solutions could expose us to security vulnerabilities. Furthermore, the terms of many open source licenses have not been interpreted by U.S. courts, and there is a risk that such licenses could be construed in a manner that imposes unanticipated conditions or restrictions on our ability to market or commercialize our solutions. As a result, we could be subject to lawsuits by parties claiming ownership of what we believe to be open source software. Litigation could be costly for us to defend, have a negative effect on our results of operations and financial condition or require us to devote additional research and development resources to change our solutions. In addition, by the terms of some open source licenses, under certain conditions we could be required to release the source code of our proprietary software, and to make our proprietary software available under open source licenses, including authorizing further modification and redistribution. In the event that portions of our proprietary software are determined to be subject to such requirements by an open source license, we could be required to publicly release the affected portions of our source code, re-engineer all or a portion of our platform or otherwise be limited in the licensing of our services, each of which provide an advantage to our competitors or other entrants to the market, create security vulnerabilities in our solutions and could reduce or eliminate the value of our services. Further, if we are held to have breached or otherwise failed to comply with the terms of an open source software license, we could be required to release certain of our proprietary source code under open source licenses, pay monetary damages, seek licenses from third parties to continue offering our services on terms that are not economically feasible or be subject to injunctions that could require us to discontinue the sale of our services if re-engineering could not be accomplished on a timely basis. Many of the risks associated with use of open source software cannot be eliminated and could negatively affect our business. Moreover, we cannot assure you that our processes for controlling our use of open source software in our platform will be effective.
Responding to any infringement or noncompliance claim by an open source vendor, regardless of its validity, or discovering open source software code in our platform could harm our business, operating results and financial condition, by, among other things:
|
•
|
resulting in time-consuming and costly litigation;
|
|
•
|
diverting management’s time and attention from developing our business;
|
|
•
|
requiring us to pay monetary damages or enter into royalty and licensing agreements that we would not normally find acceptable;
|
|
•
|
causing delays in the deployment of our platform or service offerings to our customers;
|
|
•
|
requiring us to stop offering certain services on or features of our platform;
|
|
•
|
requiring us to redesign certain components of our platform using alternative non-infringing or non-open source
|
27
technology, which could require significant effort and expense;
|
•
|
requiring us to disclose our software source code and the detailed program commands for our software; and
|
|
•
|
requiring us to satisfy indemnification obligations to our customers.
|
We rely on third parties for certain essential financial and operational services, and a failure or disruption in these services could materially and adversely affect our ability to manage our business effectively.
We rely on third parties to provide many essential financial and operational services to support our business. Many of these vendors are less established and have shorter operating histories than traditional software vendors. Moreover, these vendors provide their services to us via a cloud-based model instead of software that is installed on our premises. As a result, we depend upon these vendors to provide us with services that are always available and are free of errors or defects that could cause disruptions in our business processes. Any failure by these vendors to do so, or any disruption in our ability to access the internet, would materially and adversely affect our ability to manage our operations.
We rely on a limited number of suppliers for certain components of the equipment we use to operate our cloud platform, and any disruption in the availability of these components could delay our ability to expand or increase the capacity of our global data center network or replace defective equipment in our existing data centers.
We rely on a limited number of suppliers for several components of the equipment we use to operate our cloud platform and provide services to our customers. Our reliance on these suppliers exposes us to risks, including reduced control over production costs and constraints based on the then current availability, terms and pricing of these components. For example, we generally purchase these components on a purchase order basis, and do not have long-term contracts guaranteeing supply. In addition, the technology industry has experienced component shortages and delivery delays in the past, and we may experience shortages or delays, including as a result of natural disasters, increased demand in the industry or if our suppliers do not have sufficient rights to supply the components in all jurisdictions in which we may host our services. If our supply of certain components is disrupted or delayed, there can be no assurance that additional supplies or components can serve as adequate replacements for the existing components or that supplies will be available on terms that are favorable to us, if at all. Any disruption or delay in the supply of our components may delay opening new data centers, delay increasing capacity or replacing defective equipment at existing data centers or cause other constraints on our operations that could damage our channel partner or customer relationships.
Claims by others that we infringe their proprietary technology or other rights, such as the lawsuits filed by Symantec Corporation, or other lawsuits asserted against us, could result in significant costs and substantially harm our business, financial condition, results of operations and prospects.
A number of companies in our industry hold a large number of patents and also protect their copyright, trade secret and other intellectual property rights, and companies in the networking and security industry frequently enter into litigation based on allegations of patent infringement or other violations of intellectual property rights. In addition, patent holding companies seek to monetize patents they previously developed, have purchased or otherwise obtained. Many companies, including our competitors, may now, and in the future, have significantly larger and more mature patent, copyright, trademark and trade secret portfolios than we have, which they may use to assert claims of infringement, misappropriation and other violations of intellectual property rights against us. In addition, future litigation may involve non-practicing entities or other patent owners who have no relevant product offerings or revenue and against whom our own patents may therefore provide little or no deterrence or protection. As we face increasing competition and gain an increasingly higher profile, including as a result of becoming a public company, the possibility of intellectual property rights claims against us grows. Third parties have asserted in the past and may in the future assert claims of infringement of intellectual property rights against us and these claims, even without merit, could harm our business, including by increasing our costs, reducing our revenue, creating customer concerns that result in delayed or reduced
28
sales, distracting our management from the running of our business and requiring us to cease use of important intellectual property. In addition, because patent applications can take years to issue and are often afforded confidentiality for some period of time, there may currently be pending applications, unknown to us, that later result in issued patents that could cover one or more of our services. Moreover, in a patent infringement claim against us, we may assert, as a defense, that we do not infringe the relevant patent claims, that the patent is invalid or both. The strength of our defenses will depend on the patents asserted, the interpretation of these patents, and our ability to invalidate the asserted patents. However, we could be unsuccessful in advancing non-infringement and/or invalidity arguments in our defense. In the United States, issued patents enjoy a presumption of validity, and the party challenging the validity of a patent claim must present clear and convincing evidence of invalidity, which is a high burden of proof. Conversely, the patent owner need only prove infringement by a preponderance of the evidence, which is a lower burden of proof. Furthermore, because of the substantial amount of discovery required in connection with patent and other intellectual property rights litigation, there is a risk that some of our confidential information could be compromised by the discovery process.
For example, we are currently involved in legal proceedings with Symantec and Finjan. For additional details, see Part I, Item 3 - Legal Proceedings. We are vigorously defending ourselves against these claims; however, we cannot assure you that we will be successful in defending against these lawsuits or any future allegations of infringement. We are unable to predict the likelihood of success in defending against these infringement claims. If we are not successful, we could be required to pay substantial damages for past and future sales and/or licensing of our services, enjoined from making, using, selling or otherwise offering our services if a license or other right to continue selling our services is not made available to us, and required to pay substantial ongoing royalties and comply with unfavorable terms even if such a license is made available to us. Any of these outcomes could result in a material adverse effect on our business. Even if we were to prevail, these lawsuits, and any other third-party infringement claims, could be costly and time-consuming, divert the attention of our management and key personnel from our business operations, deter channel partners from selling or licensing our services and dissuade potential customers from purchasing our services, which would also materially harm our business. In addition, any public announcements of the results of any proceedings in these or other third-party infringement claims could be negatively perceived by industry or financial analysts and investors and could cause our stock price to experience volatility or decline. The expense of litigation and the timing of this expense from period to period are difficult to estimate, subject to change and could adversely affect our results of operations.
As the number of products and competitors in our market increases and overlaps occur, claims of infringement, misappropriation and other violations of intellectual property rights may increase. Our insurance may not cover intellectual property rights infringement claims. Third parties have in the past and may in the future also assert infringement claims against our customers or channel partners, with whom our agreements may obligate us to indemnify against these claims. In addition, to the extent we hire personnel from competitors, we may be subject to allegations that such employees have divulged proprietary or other confidential information to us.
In the event that we fail to successfully defend ourselves against an infringement claim, a successful claimant could secure a judgment or otherwise require payment of legal fees, settlement payments, ongoing royalties or other costs or damages; or we may agree to a settlement that prevents us from offering certain services or features; or we may be required to obtain a license, which may not be available on reasonable terms, or at all, to use the relevant technology. If we are prevented from using certain technology or intellectual property, we may be required to develop alternative, non-infringing technology, which could require significant time, during which we could be unable to continue to offer our affected services or features, effort and expense and may ultimately not be successful.
From time to time, the U.S. Supreme Court, other U.S. federal courts and the U.S. Patent and Trademark Appeals Board, and their foreign counterparts, have made and may continue to make changes to the interpretation of patent laws in their respective jurisdictions. We cannot predict future changes to the interpretation of existing patent laws or whether U.S. or foreign legislative bodies will amend such laws in the future. Any changes may lead to uncertainties or increased costs and risks surrounding the outcome of third-party infringement claims brought against us and the actual or enhanced damages, including treble damages,
29
that may be awarded in connection with any such current or future claims and could have a material adverse effect on our business and financial condition.
Any of these events could materially and adversely harm our business, financial condition and results of operations.
We may become involved in other litigation that may materially adversely affect us.
From time to time, we may become involved in various legal proceedings relating to matters incidental to the ordinary course of our business, including patent, commercial, product liability, employment, class action, whistleblower and other litigation and claims, and governmental and other regulatory investigations and proceedings. Such matters can be time-consuming, divert management’s attention and resources, cause us to incur significant expenses or liability and/or require us to change our business practices. In addition, the expense of litigation and the timing of this expense from period to period are difficult to estimate, subject to change and could adversely affect our results of operations. Because of the potential risks, expenses and uncertainties of litigation, we may, from time to time, settle disputes, even where we have meritorious claims or defenses, by agreeing to settlement agreements. Because litigation is inherently unpredictable, we cannot assure you that the results of any of these actions will not have a material adverse effect on our business, financial condition, results of operations and prospects.
The success of our business depends in part on our ability to protect and enforce our intellectual property rights.
We believe our intellectual property is an essential asset of our business, and our success and ability to compete depend in part upon protection of our intellectual property rights. We rely on a combination of patent, copyright, trademark and trade secret laws, as well as confidentiality procedures and contractual provisions, to establish and protect our intellectual property rights, all of which provide only limited protection. The efforts we have taken to protect our intellectual property rights may not be sufficient or effective, and our patents, trademarks and copyrights may be held invalid or unenforceable. Moreover, we cannot assure you that any patents will be issued with respect to our currently pending patent applications in a manner that gives us adequate defensive protection or competitive advantages, or that any patents issued to us will not be challenged, invalidated or circumvented. We have filed for patents in the United States and in certain non-U.S. jurisdictions, but such protections may not be available in all countries in which we operate or in which we seek to enforce our intellectual property rights, or may be difficult to enforce in practice. For example, many foreign countries have compulsory licensing laws under which a patent owner must grant licenses to third parties. In addition, many countries limit the enforceability of patents against certain third parties, including government agencies or government contractors. In these countries, patents may provide limited or no benefit. Moreover, we may need to expend additional resources to defend our intellectual property rights in these countries, and our inability to do so could impair our business or adversely affect our international expansion. Our currently issued patents and any patents that may be issued in the future with respect to pending or future patent applications may not provide sufficiently broad protection or they may not prove to be enforceable in actions against alleged infringers. Additionally, the U.S. Patent and Trademark Office and various foreign governmental patent agencies require compliance with a number of procedural, documentary, fee payment and other similar provisions during the patent application process and to maintain issued patents. There are situations in which noncompliance can result in abandonment or lapse of the patent or patent application, resulting in partial or complete loss of patent rights in the relevant jurisdiction. If this occurs, it could materially harm our business, operating results, financial condition and prospects.
We may not be effective in policing unauthorized use of our intellectual property rights, and even if we do detect violations, litigation may be necessary to enforce our intellectual property rights. In addition, our intellectual property may be stolen, including by cybercrimes, and we may not be able to identify the perpetrators or prevent the exploitation of our intellectual property by our competitors or others. Protecting against the unauthorized use of our intellectual property rights, technology and other proprietary rights is expensive and difficult, particularly outside of the United States. Any enforcement efforts we undertake, including litigation, could be time-consuming and expensive and could divert management’s attention, either of which could harm our business, operating results and financial condition. Further, attempts to enforce our rights against third parties
30
could also provoke these third parties to assert their own intellectual property or other rights against us, or result in a holding that invalidates or narrows the scope of our rights, in whole or in part. The inability to adequately protect and enforce our intellectual property and other proprietary rights could seriously harm our business, operating results, financial condition and prospects. Even if we are able to secure our intellectual property rights, we cannot assure you that such rights will provide us with competitive advantages or distinguish our services from those of our competitors or that our competitors will not independently develop similar technology, duplicate any of our technology, or design around our patents.
Our business depends, in part, on sales to government organizations, and significant changes in the contracting or fiscal policies of such government organizations could have an adverse effect on our business and operating results.
We derive a portion of our revenue from contracts with government organizations, and we believe the success and growth of our business will in part depend on our successful procurement of additional public sector customers. However, demand from government organizations is often unpredictable, and we cannot assure you that we will be able to maintain or grow our revenue from the public sector. Sales to government entities are subject to substantial risks, including the following:
|
•
|
selling to government agencies can be highly competitive, expensive and time-consuming, often requiring significant upfront time and expense without any assurance that such efforts will generate a sale;
|
|
•
|
U.S. or other government certification requirements applicable to our cloud platform, including the Federal Risk and Authorization Management Program, are often difficult and costly to obtain and maintain and failure to do so will restrict our ability to sell to government customers;
|
|
•
|
government demand and payment for our services may be impacted by public sector budgetary cycles and funding authorizations; and
|
|
•
|
governments routinely investigate and audit government contractors’ administrative processes and any unfavorable audit could result in fines, civil or criminal liability, further investigations, damage to our reputation and debarment from further government business.
|
The occurrence of any of the foregoing could cause governments and governmental agencies to delay or refrain from purchasing our solutions in the future or otherwise have an adverse effect on our business and operating results.
Failure to comply with laws and regulations applicable to our business could subject us to fines and penalties and could also cause us to lose customers in the public sector or negatively impact our ability to contract with the public sector.
Our business is subject to regulation by various federal, state, local and foreign governmental agencies, including agencies responsible for monitoring and enforcing privacy and data protection laws and regulations, employment and labor laws, workplace safety, product safety, environmental laws, consumer protection laws, anti-bribery laws, import and export controls, federal securities laws and tax laws and regulations. In certain jurisdictions, these regulatory requirements may be more stringent than in the United States. These laws and regulations impose added costs on our business. Noncompliance with applicable regulations or requirements could subject us to:
|
•
|
investigations, enforcement actions and sanctions;
|
|
•
|
mandatory changes to our cloud platform;
|
|
•
|
disgorgement of profits, fines and damages;
|
|
•
|
civil and criminal penalties or injunctions;
|
|
•
|
claims for damages by our customers or channel partners;
|
31
|
•
|
termination of contracts;
|
|
•
|
loss of intellectual property rights; and
|
|
•
|
temporary or permanent debarment from sales to government organizations.
|
If any governmental sanctions are imposed, or if we do not prevail in any possible civil or criminal litigation, our business, operating results and financial condition could be adversely affected. In addition, responding to any action will likely result in a significant diversion of management’s attention and resources and an increase in professional fees. Enforcement actions and sanctions could materially harm our business, operating results and financial condition.
We endeavor to properly classify employees as exempt versus non-exempt under applicable law. Although there are no pending or threatened material claims or investigations against us asserting that some employees are improperly classified as exempt, the possibility exists that some of our current or former employees could have been incorrectly classified as exempt employees.
In addition, we must comply with laws and regulations relating to the formation, administration and performance of contracts with the public sector, including U.S. federal, state and local governmental organizations, which affect how we and our channel partners do business with governmental agencies. Selling our solutions to the U.S. government, whether directly or through channel partners, also subjects us to certain regulatory and contractual requirements. Failure to comply with these requirements by either us or our channel partners could subject us to investigations, fines and other penalties, which could have an adverse effect on our business, operating results, financial condition and prospects. As an example, the U.S. Department of Justice, or DOJ, and the General Services Administration, or GSA, have in the past pursued claims against and financial settlements with IT vendors under the False Claims Act and other statutes related to pricing and discount practices and compliance with certain provisions of GSA contracts for sales to the federal government. The DOJ and GSA continue to actively pursue such claims. Violations of certain regulatory and contractual requirements could also result in us being suspended or debarred from future government contracting. Any of these outcomes could have a material adverse effect on our revenue, operating results, financial condition and prospects.
These laws and regulations impose added costs on our business, and failure to comply with these or other applicable regulations and requirements could lead to claims for damages from our channel partners or customers, penalties, termination of contracts, loss of exclusive rights in our intellectual property and temporary suspension or permanent debarment from government contracting. Any such damages, penalties, disruptions or limitations in our ability to do business with the public sector could have a material adverse effect on our business and operating results.
If we were not able to satisfy data protection, security, privacy and other government- and industry-specific requirements or regulations, our business, results of operations and financial condition could be harmed.
Personal privacy, data protection, information security and other telecommunications regulations are significant issues in the United States, Europe and in other jurisdictions where we offer our solutions. The regulatory framework for privacy and security matters is rapidly evolving and is likely to remain uncertain for the foreseeable future. Our handling of data is subject to a variety of laws and regulations, including regulation by various government agencies.
The U.S. federal government, and various state and foreign governments, have adopted or proposed limitations on the collection, distribution, use and storage of personally identifiable information of individuals. Laws and regulations outside the United States, and particularly in Europe, often are more restrictive than those in the United States. Such laws and regulations may require companies to implement privacy and security policies, permit customers to access, correct and delete personal information stored or maintained by such companies, inform individuals of security breaches that affect their personal information, and, in some cases, obtain individuals’ consent to use personally identifiable information for certain purposes. In addition, some foreign governments require that any personally identifiable information collected in a country not be disseminated
32
outside of that country. We also may find it necessary or desirable to join industry or other self-regulatory bodies or other information security or data protection-related organizations that require compliance with their rules pertaining to information security and data protection. We also may be bound by additional, more stringent contractual obligations relating to our collection, use and disclosure of personal, financial and other data.
We also expect that there will continue to be new proposed laws, regulations and industry standards concerning privacy, data protection, information security and telecommunications services in the United States, the European Union and other jurisdictions in which we operate or may operate, and we cannot yet determine the impact such future laws, regulations and standards may have on our business. For example, the European Commission recently adopted the General Data Protection Regulation, effective in May 2018, that supersedes former EU data protection legislation, imposes more stringent EU data protection requirements and provides for greater penalties for noncompliance. In addition, changes in laws or regulations that adversely affect the use of the internet, including laws impacting net neutrality, could impact our business. Similarly, California recently adopted the California Consumer Privacy Act of 2018, which will take effect in in January 2020 and seeks to provide California consumers with increased privacy rights and protections for their personal information. Further, China and Russia, countries in which we offer our solutions, recently enacted legislation prohibiting certain technologies, and it is not clear how broadly such prohibitions will be interpreted or applied in relation to our business. We expect that existing laws, regulations and standards may be interpreted in new manners in the future. Future laws, regulations, standards and other obligations, and changes in the interpretation of existing laws, regulations, standards and other obligations could require us to modify our solutions, restrict our business operations, increase our costs and impair our ability to maintain and grow our customer base and increase our revenue.
Although we work to comply with applicable laws and regulations, industry standards, contractual obligations and other legal obligations, those laws, regulations, standards and obligations are evolving and may be modified, interpreted and applied in an inconsistent manner from one jurisdiction to another, and may conflict with one another. In addition, they may conflict with other requirements or legal obligations that apply to our business or the security features and services that our customers expect from our solutions. As such, we cannot assure ongoing compliance with all such laws, regulations, standards and obligations. Any failure or perceived failure by us to comply with applicable laws, regulations, standards or obligations, or any actual or suspected security incident, whether or not resulting in unauthorized access to, or acquisition, release or transfer of personally identifiable information or other data, may result in governmental enforcement actions and prosecutions, private litigation, fines and penalties or adverse publicity, and could cause our customers to lose trust in us, which could have an adverse effect on our reputation and business. Any inability to adequately address privacy and security concerns, even if unfounded, or comply with applicable laws, regulations, standards and obligations, could result in additional cost and liability to us, damage our reputation, inhibit sales, and materially and adversely affect our business and operating results.
We are subject to anti-corruption, anti-bribery and similar laws, and noncompliance with such laws can subject us to criminal penalties or significant fines and harm our business and reputation.
We are subject to the U.S. Foreign Corrupt Practices Act of 1977, the UK Bribery Act 2010 and other anti-corruption, anti-bribery, anti-money laundering and similar laws in the United States and other countries in which we conduct activities. Anti-corruption and anti-bribery laws, which have been enforced aggressively and are interpreted broadly, prohibit companies and their employees and agents from promising, authorizing, making or offering improper payments or other benefits to government officials and others in the private sector. We leverage third parties, including channel partners, to sell subscriptions to our platform and conduct our business abroad. We and these third-party intermediaries may have direct or indirect interactions with officials and employees of government agencies or state-owned or affiliated entities and we may be held liable for the corrupt or other illegal activities of these third-party business partners and intermediaries, our employees, representatives, contractors, channel partners and agents, even if we do not explicitly authorize such activities. While we have policies and procedures to address compliance with such laws, we cannot assure you that all of our employees and agents will not take actions in violation of our policies and applicable law, for which we may be ultimately held responsible. As we increase our international sales and business,
33
our risks under these laws may increase. Noncompliance with these laws could subject us to investigations, severe criminal or civil sanctions, settlements, prosecution, loss of export privileges, suspension or debarment from U.S. government contracts, other enforcement actions, disgorgement of profits, significant fines, damages, other civil and criminal penalties or injunctions, whistleblower complaints, adverse media coverage and other consequences. Any investigations, actions or sanctions could materially harm our reputation, business, results of operations and financial condition.
We are subject to governmental export and import controls that could impair our ability to compete in international markets and subject us to liability if we are not in full compliance with applicable laws.
Our business activities are subject to various restrictions under U.S. export and similar laws and regulations, including the U.S. Department of Commerce’s Export Administration Regulations and various economic and trade sanctions regulations administered by the U.S. Treasury Department’s Office of Foreign Assets Control. The U.S. export control laws and U.S. economic sanctions laws include restrictions or prohibitions on the sale or supply of certain products and services to U.S. embargoed or sanctioned countries, governments, persons and entities. In addition, various countries regulate the import of certain technology and have enacted or could enact laws that could limit our ability to provide our services and operate our cloud platform or could limit our customers’ ability to access or use our services in those countries.
Although we take precautions to prevent our services from being provided in violation of such laws, our services may have been in the past, and could in the future be, provided inadvertently in violation of such laws, despite the precautions we take. If we fail to comply with these laws and regulations, we and certain of our employees could be subject to civil or criminal penalties, including the possible loss of export privileges and fines. We may also be materially and adversely affected through penalties, reputational harm, loss of access to certain markets, or otherwise. Obtaining the necessary authorizations, including any required license, for a particular transaction may be time-consuming, is not guaranteed and may result in the delay or loss of sales opportunities. In addition, changes in our platform, or changes in export, sanctions and import laws, could delay the introduction and sale of subscriptions to our platform in international markets, prevent users in certain countries from accessing our services or, in some cases, prevent the provision of our services to certain countries, governments, persons or entities altogether. Any change in export or import regulations, economic sanctions or related laws, shift in the enforcement or scope of existing regulations or change in the countries, governments, persons or technologies targeted by such regulations could decrease our ability to sell subscriptions to our platform to existing customers or potential new customers with international operations. Any decrease in our ability to sell subscriptions to our platform could materially and adversely affect our business, results of operations and financial condition.
Our international operations expose us to significant risks, and failure to manage those risks could materially and adversely impact our business.
Historically, we have derived a significant portion of our revenue from outside the United States. We derived approximately
55%
, 54% and 56% of our revenue from our international customers in fiscal 2018, 2017 and 2016, respectively. As of July 31, 2018, approximately
53%
of our full-time employees were located outside of the United States. We are continuing to adapt to and develop strategies to address international markets and our growth strategy includes expansion into target geographies, such as Japan and the Asia-Pacific region, but there is no guarantee that such efforts will be successful. We expect that our international activities will continue to grow in the future, as we continue to pursue opportunities in international markets. These international operations will require significant management attention and financial resources and are subject to substantial risks, including:
|
•
|
political, economic and social uncertainty;
|
|
•
|
unexpected costs for the localization of our services, including translation into foreign languages and adaptation for local practices and regulatory requirements;
|
|
•
|
greater difficulty in enforcing contracts and accounts receivable collection, and longer collection periods;
|
34
|
•
|
reduced or uncertain protection for intellectual property rights in some countries;
|
|
•
|
greater risk of unexpected changes in regulatory practices, trade barriers (such as tariffs, quotas, duties or other trade restrictions) and tax laws and treaties; for example, the recent tariffs imposed by the United States on goods imported from various countries, and corresponding tariffs from other countries in response, may increase the costs of providing our services;
|
|
•
|
greater risk of a failure of foreign employees, partners, distributors and resellers to comply with both U.S. and foreign laws, including antitrust regulations, anti-bribery laws, export and import control laws, and any applicable trade regulations ensuring fair trade practices;
|
|
•
|
requirements to comply with foreign privacy, data protection and information security laws and regulations and the risks and costs of noncompliance;
|
|
•
|
increased expenses incurred in establishing and maintaining office space and equipment for our international operations;
|
|
•
|
greater difficulty in identifying, attracting and retaining local qualified personnel, and the costs and expenses associated with such activities;
|
|
•
|
differing employment practices and labor relations issues;
|
|
•
|
difficulties in managing and staffing international offices and increased travel, infrastructure and legal compliance costs associated with multiple international locations; and
|
|
•
|
fluctuations in exchange rates between the U.S. dollar and foreign currencies in markets where we do business, including the British Pound, Indian Rupee and Euro, and related impact on sales cycles.
|
As we continue to develop and grow our business globally, our success will depend, in large part, on our ability to anticipate and effectively manage these risks. The expansion of our existing international operations and entry into additional international markets will require significant management attention and financial resources. Our failure to successfully manage our international operations and the associated risks could limit the future growth of our business.
Our failure to raise additional capital necessary to expand our operations and invest in new solutions could reduce our ability to compete and could harm our business.
We expect that our existing cash, cash equivalents and short-term investments will be sufficient to meet our anticipated cash needs for working capital and capital expenditures for at least the next 12 months. We may, however, need to raise additional funds in the future to fund our operating expenses, make capital purchases and acquire or invest in business or technology, and we may not be able to obtain those funds on favorable terms, or at all. If we raise additional equity financing, our stockholders may experience significant dilution of their ownership interests and the per share value of our common stock could decline. Furthermore, if we engage in debt financing, the holders of debt would have priority over the holders of our common stock, and we may be required to accept terms that restrict our ability to incur additional indebtedness or our ability to pay any dividends on our common stock, though we do not intend to pay dividends in the foreseeable future. We may also be required to take other actions, any of which could harm our business and operating results. If we are unable to obtain adequate financing, or financing on terms satisfactory to us, when we require it, our ability to continue to support our business growth and to respond to business challenges could be significantly limited, and our business, operating results, financial condition and prospects could be materially and adversely affected.
35
Adverse economic conditions or reduced IT security spending may adversely impact our revenue and profitability.
Our operations and performance depend in part on worldwide economic conditions and the impact these conditions have on levels of spending on IT networking and security solutions. Our business depends on the overall demand for these solutions and on the economic health and general willingness of our current and prospective customers to purchase our security services. Weak economic conditions, or a reduction in IT security spending, could materially and adversely affect our business, operating results and financial condition in a number of ways, including by reducing sales, lengthening sales cycles and lowering prices for our services.
We believe our long-term value as a company will be greater if we focus on growth, which may negatively impact our profitability in the near term.
Part of our business strategy is to primarily focus on our long-term growth. As a result, our profitability may be lower in the near term than it would be if our strategy were to maximize short-term profitability. Significant expenditures on sales and marketing efforts, and expenditures on growing our cloud platform and expanding our research and development, each of which we intend to continue to invest in, may not ultimately grow our business or cause long-term profitability. If we are ultimately unable to achieve profitability at the level anticipated by industry or financial analysts and our stockholders, our stock price may decline.
If we fail to maintain an effective system of internal controls, our ability to produce timely and accurate financial statements or comply with applicable regulations could be impaired.
As a public company, we are subject to the reporting requirements of the Securities Exchange Act of 1934, as amended, or the Exchange Act, the Sarbanes-Oxley Act of 2002, or the Sarbanes-Oxley Act, and the rules and regulations of The Nasdaq Global Select Market, or Nasdaq. The requirements of these rules and regulations will increase our legal, accounting and financial compliance costs; make some activities more difficult, time-consuming and costly; and place significant strain on our personnel, systems and resources.
The Sarbanes-Oxley Act requires, among other things, that we maintain effective disclosure controls and procedures and internal control over financial reporting. We are continuing to develop and refine our disclosure controls, internal controls over financial reporting and other procedures that are designed to ensure information required to be disclosed by us in the reports that we will file with the U.S. Securities and Exchange Commission, or SEC, is recorded, processed, summarized and reported within the time periods specified in SEC rules and forms, and information required to be disclosed in reports under the Exchange Act is accumulated and communicated to our principal executive and financial officers.
Our current controls and any new controls we develop may become inadequate because of changes in conditions in our business. Further, weaknesses in our internal controls may be discovered in the future. Any failure to develop or maintain effective controls, or any difficulties encountered in their implementation or improvement, could harm our operating results or cause us to fail to meet our reporting obligations and may result in a restatement of our financial statements for prior periods. Any failure to implement and maintain effective internal controls also could adversely affect the results of periodic management evaluations and annual independent registered public accounting firm attestation reports regarding the effectiveness of our internal control over financial reporting that we are required to include in our periodic reports we will file with the SEC under Section 404 of the Sarbanes-Oxley Act. Ineffective disclosure controls and procedures and internal control over financial reporting could also cause investors to lose confidence in our reported financial and other information, which would likely have a negative effect on the market price of our common stock.
In order to maintain and improve the effectiveness of our disclosure controls and procedures and internal controls over financial reporting, we have expended and anticipate we will continue to expend significant resources, including accounting-related costs, and provide significant management oversight. Any failure to maintain the adequacy of our internal controls, or
36
consequent inability to produce accurate financial statements on a timely basis, could increase our operating costs and could materially impair our ability to operate our business. If our internal controls are perceived as inadequate or we are unable to produce timely or accurate financial statements, investors may lose confidence in our operating results and our stock price could decline. In addition, if we are unable to continue to meet these requirements, we may not be able to remain listed on Nasdaq.
Our independent registered public accounting firm is not required to attest to the effectiveness of our internal control over financial reporting until after we are no longer an emerging growth company. At such time, our independent registered public accounting firm may issue a report that is adverse in the event it is not satisfied with the level at which our controls are documented, designed or operating. Any failure to maintain effective disclosure controls and internal control over financial reporting could have a material and adverse effect on our business and operating results and could cause a decline in the price of our stock.
We are exposed to fluctuations in currency exchange rates, which could negatively affect our operating results.
The vast majority of our sales contracts are denominated in U.S. dollars, and therefore, substantially all of our revenue is not subject to foreign currency risk. However, a strengthening of the U.S. dollar could increase the real cost of our solutions to our customers outside of the United States, which could adversely affect our financial condition and operating results. In addition, an increasing portion of our operating expenses is incurred outside the United States, is denominated in foreign currencies, such as the British Pound, Indian Rupee and Euro, and is subject to fluctuations due to changes in foreign currency exchange rates. If we become more exposed to currency fluctuations and are not able to successfully hedge against the risks associated with currency fluctuations, our operating results could be materially and adversely affected.
U.S. federal income tax reform could adversely affect us.
On December 22, 2017, President Trump signed into law legislation commonly referred to as the Tax Cuts and Jobs Act of 2017, or the Tax Act, which significantly reforms the Internal Revenue Code of 1986, as amended, or the Internal Revenue Code. The Tax Act, among other things, includes changes to U.S. federal tax rates, imposes significant additional limitations on the deductibility of interest and the use of net operating losses generated in tax years beginning after December 31, 2017, allows for the expensing of capital expenditures, and puts into effect the migration from a "worldwide" system of taxation to a modified territorial system. We expect to complete our assessment of the impacts of the Tax Act including the remeasurement of our deferred taxes, the one-time mandatory transition tax, and the policy decision regarding whether to record deferred taxes associated with Global Intangible Low-Taxed Income (“GILTI”) within the measurement period provided by Staff Accounting Bulletin No. 118,
Income Tax Accounting Implications of the Tax Cuts and Jobs Act
("SAB 118"). Our assessment of the impact of the Tax Act may differ from our provisional assessment during the measurement period due to, among other things, further refinement in our calculations, changes in interpretations and assumptions we have made, or guidance that may be issued.
Taxing authorities may successfully assert that we should have collected or in the future should collect sales and use, value added or similar taxes, and we could be subject to liability with respect to past or future sales, which could adversely affect our operating results.
We do not collect sales and use, value added or similar taxes in all jurisdictions in which we have sales because we have been advised that such taxes are not applicable to our services in certain jurisdictions. Sales and use, value added and similar tax laws and rates vary greatly by jurisdiction. Certain jurisdictions in which we do not collect such taxes may assert that such taxes are applicable, which could result in tax assessments, penalties and interest, to us or our customers for the past amounts, and we may be required to collect such taxes in the future. If we are unsuccessful in collecting such taxes from our customers, we could be held liable for such costs, which may materially and adversely affect our operating results.
37
Our corporate structure and intercompany arrangements are subject to the tax laws of various jurisdictions, and we could be obligated to pay additional taxes, which would harm our results of operations.
We are expanding our international operations and staff to support our business in international markets. Our corporate structure and associated transfer pricing policies contemplate the business flows and future growth into the international markets, and consider the functions, risks and assets of the various entities involved in the intercompany transactions. The amount of taxes we pay in different jurisdictions may depend on the application of the tax laws of the various jurisdictions, including the United States, to our international business activities, changes in tax rates, new or revised tax laws or interpretations of existing tax laws and policies, and our ability to operate our business in a manner consistent with our corporate structure and intercompany arrangements. The taxing authorities of the jurisdictions in which we operate may challenge our methodologies for pricing intercompany transactions pursuant to the intercompany arrangements or disagree with our determinations as to the income and expenses attributable to specific jurisdictions. If such a challenge or disagreement were to occur, and our position was not sustained, we could be required to pay additional taxes, interest and penalties, which could result in one-time tax charges, higher effective tax rates, reduced cash flows and lower overall profitability of our operations. Our financial statements could fail to reflect adequate reserves to cover such a contingency.
Our ability to use our net operating loss carryforwards and certain other tax attributes may be limited.
As of July 31, 2018, we had net operating loss carryforwards for U.S. federal income tax purposes and state income tax purposes of
$173.6 million
and
$62.4 million
, respectively, available to offset future taxable income. If not utilized, the federal net operating loss carryforwards will begin to expire in
2027
and the state net operating loss carryforwards will begin to expire in
2024
. We also have federal and state research and development tax credit carryforwards of approximately $4.5 million and $4.2 million, respectively. If not utilized, the federal credit carryforwards will begin expiring at different periods beginning in 2033. The state credit will carry forward indefinitely. Realization of these net operating losses and research tax credit carryforwards depends on future income, and there is a risk that our existing carryforwards could expire unused and be unavailable to offset future income tax liabilities, which could materially and adversely affect our results of operations.
In addition, under Sections 382 and 383 of the Internal Revenue Code, if a corporation undergoes an "ownership change," generally defined as a greater than 50% change (by value) in its equity ownership over a three-year period, the corporation’s ability to use its pre-change net operating loss and research and development carryforwards and other pre-change tax attributes, such as research tax credits, to offset its post-change income may be limited. Although, we did not experience an ownership change in connection with the IPO, we may experience ownership changes in the future as a result of subsequent shifts in our stock ownership. As a result, if we earn net taxable income, our ability to use our pre-change net operating loss carryforwards and other pre-change tax attributes to offset U.S. federal taxable income may be subject to limitations, which could potentially result in increased future tax liability to us.
Further, the Tax Act imposes an 80% limitation on the use of net operating losses that were generated in tax years beginning after December 31, 2017. This new limitation on the use of net operating losses creates the risk that net operating losses generated in the future could expire unused and be unavailable to offset future income tax liabilities.
Future acquisitions, strategic investments, partnerships or alliances could be difficult to identify and integrate, divert the attention of key management personnel, disrupt our business, dilute stockholder value and adversely affect our operating results, financial condition and prospects.
Our business strategy has included and may, from time to time, include acquiring other complementary solutions, technologies or businesses. In order to expand our security offerings and features, we also may enter into relationships with other businesses, which could involve preferred or exclusive licenses, additional channels of distribution or investments in other companies. Negotiating these transactions can be time-consuming, difficult and costly, and our ability to close these transactions may be subject to third-party approvals, such as government regulatory approvals, which are beyond our control. Consequently,
38
we cannot assure you that these transactions, once undertaken and announced, will close.
These kinds of acquisitions or investments may result in unforeseen operating difficulties and expenditures. In particular, we may encounter difficulties assimilating or integrating the businesses, technologies, products and services, personnel or operations of companies that we may acquire, particularly if the key personnel of an acquired business choose not to work for us. We may have difficulty retaining the customers of any acquired business or using or continuing the development of the acquired technologies. Acquisitions may also disrupt our ongoing business, divert our resources and require significant management attention that would otherwise be available for development of our business. We may not successfully evaluate or utilize the acquired technology or personnel, or accurately forecast the financial impact of an acquisition transaction, including accounting charges. Any acquisition or investment could expose us to unknown liabilities. Moreover, we cannot assure you that the anticipated benefits of any acquisition or investment would be realized or that we would not be exposed to unknown liabilities. In connection with these types of transactions, we may:
|
•
|
issue additional equity securities that would dilute our stockholders;
|
|
•
|
use cash that we may need in the future to operate our business;
|
|
•
|
incur debt on terms unfavorable to us or that we are unable to repay;
|
|
•
|
incur large charges or substantial liabilities;
|
|
•
|
encounter difficulties integrating diverse business cultures; and
|
|
•
|
become subject to adverse tax consequences, substantial depreciation or deferred compensation charges.
|
These challenges related to acquisitions or investments could adversely affect our business, operating results, financial condition and prospects.
If our estimates or judgments relating to our critical accounting policies prove to be incorrect or financial reporting standards or interpretations change, our results of operations could be adversely affected.
The preparation of financial statements in conformity with U.S. GAAP requires management to make estimates and assumptions that affect the amounts reported in our consolidated financial statements and accompanying notes. We base our estimates on historical experience and on various other assumptions that we believe to be reasonable under the circumstances, as provided in the section titled "Management’s Discussion and Analysis of Financial Condition and Results of Operations." The results of these estimates form the basis for making judgments about the carrying values of assets, liabilities and equity, and the amount of revenue and expenses that are not readily apparent from other sources. Significant assumptions and estimates used in preparing our consolidated financial statements include those related to determination of revenue recognition, deferred revenue and deferred contract acquisition costs, specifically related to our adoption of the new revenue recognition standard; allowance for doubtful accounts; valuation of common stock options; useful lives of property and equipment; the period of benefit generated from our deferred contract acquisition costs; loss contingencies related to litigation; and valuation of deferred tax assets. Our results of operations may be adversely affected if our assumptions change or if actual circumstances differ from those in our assumptions, which could cause our results of operations to fall below the expectations of industry or financial analysts and investors, resulting in a decline in the trading price of our common stock.
Additionally, we regularly monitor our compliance with applicable financial reporting standards and review new pronouncements and drafts thereof that are relevant to us. As a result of new standards, changes to existing standards and changes in their interpretation, we might be required to change our accounting policies, alter our operational policies and implement new or enhance existing systems so that they reflect new or amended financial reporting standards, or we may be required to restate our published financial statements. Such changes to existing standards or changes in their interpretation may have an adverse
39
effect on our reputation, business, financial position and profit, or cause an adverse deviation from our revenue and operating profit target, which may negatively impact our financial results.
Risks Related to the Ownership of Our Common Stock
The concentration of our stock ownership with insiders will likely limit your ability to influence corporate matters, including the ability to influence the outcome of director elections and other matters requiring stockholder approval.
As of July 31, 2018, our executive officers, directors, current 5% or greater stockholders and affiliated entities together beneficially owned approximately 60% of our common stock outstanding with Jay Chaudhry, our president, chief executive officer and chairman of our board of directors, and his affiliates beneficially owning approximately 22.4% of our common stock. As a result, these stockholders, acting together, will have control over most matters that require approval by our stockholders, including the election of directors and approval of significant corporate transactions. Corporate action might be taken even if other stockholders oppose them. This concentration of ownership might also have the effect of delaying or preventing a change of control of us that other stockholders may view as beneficial.
The issuance of additional stock in connection with financings, acquisitions, investments, our stock incentive plans or otherwise will dilute all other stockholders.
Our amended and restated certificate of incorporation authorizes us to issue up to one billion shares of common stock and up to two hundred million shares of preferred stock with such rights and preferences as may be determined by our board of directors. Subject to compliance with applicable rules and regulations, we may issue shares of common stock or securities convertible into shares of our common stock from time to time in connection with a financing, acquisition, investment, our stock incentive plans or otherwise. Any such issuance could result in substantial dilution to our existing stockholders and cause the market price of our common stock to decline.
Certain provisions in our charter documents and under Delaware law could make an acquisition of our company more difficult, limit attempts by our stockholders to replace or remove members of our board of directors or current management and may adversely affect the market price of our common stock.
Our amended and restated certificate of incorporation and amended and restated bylaws contain provisions that could delay or prevent a change in control of our company. These provisions could also make it difficult for stockholders to elect directors that are not nominated by the current members of our board of directors or take other corporate actions, including effecting changes in our management. These provisions include:
|
•
|
a classified board of directors with three-year staggered terms, which could delay the ability of stockholders to change the membership of a majority of our board of directors;
|
|
•
|
the ability of our board of directors to issue shares of preferred stock and to determine the price and other terms of those shares, including preferences and voting rights, without stockholder approval, which could be used to significantly dilute the ownership of a hostile acquirer;
|
|
•
|
the exclusive right of our board of directors to elect a director to fill a vacancy created by the expansion of our board of directors or the resignation, death or removal of a director, which prevents stockholders from being able to fill vacancies on our board of directors;
|
|
•
|
a prohibition on stockholder action by written consent, which forces stockholder action to be taken at an annual or special meeting of our stockholders;
|
|
•
|
the requirement that a special meeting of stockholders may be called only by the chairperson of our board of
|
40
directors, chief executive officer or president (in the absence of a chief executive officer) or a majority vote of our board of directors, which could delay the ability of our stockholders to force consideration of a proposal or to take action, including the removal of directors;
|
•
|
the requirement for the affirmative vote of holders of at least 66 2⁄3% of the voting power of all of the then outstanding shares of the voting stock, voting together as a single class, to amend the provisions of our amended and restated certificate of incorporation relating to the issuance of preferred stock and management of our business or our amended and restated bylaws, which may inhibit the ability of an acquirer to affect such amendments to facilitate an unsolicited takeover attempt;
|
|
•
|
the ability of our board of directors, by majority vote, to amend our amended and restated bylaws, which may allow our board of directors to take additional actions to prevent an unsolicited takeover and inhibit the ability of an acquirer to amend our amended and restated bylaws to facilitate an unsolicited takeover attempt; and
|
|
•
|
advance notice procedures with which stockholders must comply to nominate candidates to our board of directors or to propose matters to be acted upon at a stockholders’ meeting, which may discourage or deter a potential acquirer from conducting a solicitation of proxies to elect the acquirer’s own slate of directors or otherwise attempting to obtain control of us.
|
These provisions may prohibit large stockholders, in particular those owning 15% or more of our outstanding voting stock, from merging or combining with us for a certain period of time.
The market price of our common stock may be volatile, and you could lose all or part of your investment.
There was no public market for our common stock prior to the IPO. The market price of our common stock following the IPO has fluctuated substantially and may fluctuate significantly in the future in response to a number of factors, including those described in this "Risk Factors" section, many of which are beyond our control and may not be related to our operating performance. These fluctuations could cause you to lose all or part of your investment in our common stock. Factors that could cause fluctuations in the market price of our common stock include the following:
|
•
|
actual or anticipated changes or fluctuations in our operating results;
|
|
•
|
the financial projections we may provide to the public, any changes in these projections or our failure to meet these projections;
|
|
•
|
announcements by us or our competitors of new products or new or terminated significant contracts, commercial relationships or capital commitments;
|
|
•
|
industry or financial analyst or investor reaction to our press releases, other public announcements and filings with the SEC;
|
|
•
|
rumors and market speculation involving us or other companies in our industry;
|
|
•
|
price and volume fluctuations in the overall stock market from time to time;
|
|
•
|
volume fluctuations in the trading of our common stock from time to time;
|
|
•
|
changes in operating performance and stock market valuations of other technology companies generally, or those in our industry in particular;
|
|
•
|
the expiration of market stand-off or contractual lock-up agreements and sales of shares of our common stock by us or our stockholders;
|
41
|
•
|
failure of industry or financial analysts to maintain coverage of us, changes in financial estimates by any analysts who follow our company, or our failure to meet these estimates or the expectations of investors;
|
|
•
|
actual or anticipated developments in our business or our competitors’ businesses or the competitive landscape generally;
|
|
•
|
litigation involving us, our industry or both, or investigations by regulators into our operations or those of our competitors;
|
|
•
|
developments or disputes concerning our intellectual property rights or our solutions, or third-party proprietary rights;
|
|
•
|
announced or completed acquisitions of businesses or technologies by us or our competitors;
|
|
•
|
new laws or regulations or new interpretations of existing laws or regulations applicable to our business;
|
|
•
|
any major changes in our management or our board of directors, particularly with respect to Mr. Chaudhry;
|
|
•
|
general economic conditions and slow or negative growth of our markets; and
|
|
•
|
other events or factors, including those resulting from war, incidents of terrorism or responses to these events.
|
In addition, the stock market in general, and the market for technology companies in particular, has experienced extreme price and volume fluctuations that have often been unrelated or disproportionate to the operating performance of those companies. Broad market and industry factors may seriously affect the market price of our common stock, regardless of our actual operating performance. In addition, in the past, following periods of volatility in the overall market and the market prices of a particular company’s securities, securities class action litigation has often been instituted against that company. Securities litigation, if instituted against us, could result in substantial costs and divert our management’s attention and resources from our business. This could have an adverse effect on our business, operating results and financial condition.
Sales of substantial amounts of our common stock in the public markets, or the perception that they might occur, could reduce the price that our common stock might otherwise attain and may dilute your voting power and your ownership interest in us.
Sales of a substantial number of shares of our common stock in the public market, particularly sales by our directors, executive officers and significant stockholders, or the perception that these sales could occur, could adversely affect the market price of our common stock and may make it more difficult for you to sell your common stock at a time and price that you deem appropriate.
In addition, certain holders of our common stock are entitled to rights with respect to registration of their shares under the Securities Act pursuant to our amended and restated investors’ rights agreement. If these holders of our common stock, by exercising their registration rights, sell a large number of shares, they could adversely affect the market price for our common stock.
We may also issue our shares of common stock or securities convertible into shares of our common stock from time to time in connection with a financing, acquisition, investments or otherwise. Any such issuance could result in substantial dilution to our existing stockholders and cause the market price of our common stock to decline.
42
We do not intend to pay dividends in the foreseeable future. As a result, your ability to achieve a return on your investment will depend on appreciation in the price of our common stock.
We have never declared or paid any cash dividends on our common stock. We currently intend to retain all available funds and any future earnings for use in the operation of our business and do not anticipate paying any dividends on our common stock in the foreseeable future. Any determination to pay dividends in the future will be at the discretion of our board of directors. Accordingly, investors must rely on sales of their common stock after price appreciation, which may never occur, as the only way to realize any future gains on their investments.
If industry or financial analysts issue inaccurate or unfavorable research regarding our common stock, our stock price and trading volume could decline.
The trading market for our common stock is influenced by the research and reports that industry or financial analysts publish about us or our business. We do not control these analysts or the content and opinions included in their reports. As a new public company, we may be slow to attract research coverage and the analysts who publish information about our common stock will have had relatively little experience with our company, which could affect their ability to accurately forecast our results and make it more likely that we fail to meet their estimates. If any of the analysts who cover us issues an inaccurate or unfavorable opinion regarding our stock price, our stock price would likely decline. In addition, the stock prices of many companies in the technology industry have declined significantly after those companies have failed to meet, or significantly exceed, the financial guidance publicly announced by the companies or the expectations of analysts. If our financial results fail to meet, or significantly exceed, our announced guidance or the expectations of analysts or public investors, analysts could downgrade our common stock or publish unfavorable research about us. If one or more of these analysts cease coverage of our company or fail to publish reports on us regularly, our visibility in the financial markets could decrease, which in turn could cause our stock price or trading volume to decline.
Our amended and restated certificate of incorporation provides that the Court of Chancery of the State of Delaware and the federal district courts of the United States are the exclusive forums for substantially all disputes between us and our stockholders, which could limit our stockholders’ ability to obtain a favorable judicial forum for disputes with us or our directors, officers or employees.
Our amended and restated certificate of incorporation provides that the Court of Chancery of the State of Delaware is the exclusive forum for:
|
•
|
any derivative action or proceeding brought on our behalf;
|
|
•
|
any action asserting a breach of fiduciary duty;
|
|
•
|
any action asserting a claim against us arising under the Delaware General Corporation Law, our amended and restated certificate of incorporation or our amended and restated bylaws;
|
|
•
|
any action to interpret, apply, enforce or determine the validity of our amended and restated certificate of incorporation or our amended and restated bylaws; and
|
|
•
|
any action asserting a claim against us that is governed by the internal-affairs doctrine.
|
Our amended and restated certificate of incorporation further provides that the federal district courts of the United States are the exclusive forum for resolving any complaint asserting a cause of action arising under the Securities Act.
These exclusive-forum provisions may limit a stockholder’s ability to bring a claim in a judicial forum that it finds favorable for disputes with us or our directors, officers or other employees, which may discourage lawsuits against us and our directors,
43
officers and other employees. If a court were to find either exclusive-forum provision in our amended and restated certificate of incorporation to be inapplicable or unenforceable in an action, we may incur additional costs associated with resolving the dispute in other jurisdictions, which could seriously harm our business.
We are an "emerging growth company" and we cannot be certain if the reduced disclosure requirements applicable to emerging growth companies will make our common stock less attractive to investors.
For so long as we remain an "emerging growth company" as defined in the JOBS Act, we may take advantage of certain exemptions from various requirements that are applicable to public companies that are not "emerging growth companies," including, but not limited to, not being required to comply with the auditor attestation requirements of Section 404 of the Sarbanes-Oxley Act, reduced disclosure obligations regarding executive compensation in our periodic reports and proxy statements, and exemptions from the requirements of holding a nonbinding advisory vote on executive compensation and stockholder approval of any golden parachute payments not previously approved. We may take advantage of these exemptions until we are no longer an emerging growth company. We would cease to be an emerging growth company upon the earliest to occur of: (i) the first fiscal year following the fifth anniversary of our IPO; (ii) the first fiscal year after our annual gross revenue is $1.07 billion or more; (iii) the date on which we have, during the previous three-year period, issued more than $1.0 billion in non-convertible debt securities; or (iv) as of the end of any fiscal year in which the market value of our common stock held by non-affiliates exceeded $700.0 million as of the end of the second quarter of that fiscal year. We cannot predict if investors will find our common stock less attractive because we may rely on these exemptions. If some investors find our common stock less attractive as a result, there may be a less active trading market for our common stock and our stock price may be more volatile.
The requirements of being a public company may strain our resources, divert management’s attention and affect our ability to attract and retain qualified board members.
As a public company, we are subject to the reporting and corporate governance requirements of the Exchange Act, the listing requirements of Nasdaq and other applicable securities rules and regulations, including the Sarbanes-Oxley Act and the Dodd-Frank Wall Street Reform and Consumer Protection Act. Compliance with these rules and regulations will increase our legal and financial compliance costs, make some activities more difficult, time-consuming or costly and increase demand on our systems and resources, particularly after we are no longer an "emerging growth company" as defined in the JOBS Act. Among other things, the Exchange Act requires that we file annual, quarterly and current reports with respect to our business and results of operations and maintain effective disclosure controls and procedures and internal control over financial reporting. In order to improve our disclosure controls and procedures and internal control over financial reporting to meet this standard, significant resources and management oversight may be required. As a result, management’s attention may be diverted from other business concerns, which could harm our business, financial condition, results of operations and prospects. Although we have hired additional personnel to help comply with these requirements, we may need to further expand our legal and finance departments in the future, which will increase our costs and expenses.
In addition, changing laws, regulations and standards relating to corporate governance and public disclosure are creating uncertainty for public companies, increasing legal and financial compliance costs and making some activities more time-consuming. These laws, regulations and standards are subject to varying interpretations, in many cases due to their lack of specificity, and, as a result, their application in practice may evolve over time as new guidance is provided by regulatory and governing bodies. This could result in continuing uncertainty regarding compliance matters and higher costs necessitated by ongoing revisions to disclosure and governance practices. We intend to invest resources to comply with evolving laws, regulations and standards, and this investment may result in increased general and administrative expense and a diversion of management’s time and attention from revenue-generating activities to compliance activities. If our efforts to comply with new laws, regulations and standards differ from the activities intended by regulatory or governing bodies, regulatory authorities may initiate legal proceedings against us and our business and prospects may be harmed. As a result of disclosure of information in the filings required of a public company, our business and financial condition will become more visible, which may result in threatened or
44
actual litigation, including by competitors and other third parties. If such claims are successful, our business, financial condition, results of operations and prospects could be materially harmed, and even if the claims do not result in litigation or are resolved in our favor, these claims, and the time and resources necessary to resolve them, could divert the resources of our management and materially harm our business, financial condition, results of operations and prospects.
In addition, as a result of our disclosure obligations as a public company, we will have reduced strategic flexibility and will be under pressure to focus on short-term results, which may materially and adversely affect our ability to achieve long-term profitability.
45
None.
Our corporate headquarters are located in San Jose, California, where we currently lease approximately 56,000 square feet of space under lease agreements that expire in 2021. We also maintain offices in Atlanta, Georgia; Austin, Texas; New York, New York; Raleigh, North Carolina; Reno, Nevada; and Reston, Virginia, as well as multiple locations internationally, including in Australia, Canada, France, Germany, India, Japan, The Netherlands, Singapore and the United Kingdom. We lease all of our facilities and do not own any real property. We expect to add facilities as we grow our employee base and expand geographically.
We believe that our facilities are adequate to meet our needs for the immediate future and that, should it be needed, suitable additional space will be available to accommodate expansion of our operations.
The information called for by this Item is incorporated herein by reference to Item 8. "Financial Statements and Supplementary Data," Note 5, "Commitments and Contingencies" included elsewhere in this Annual Report on Form 10-K.
Not applicable.
46
Item 5.
Markets Registrant's Common Equity, Related Stockholder Matters and Issuer Purchases of Equity Securities
Market Information for Common Stock
Our common stock began trading publicly on The Nasdaq Global Select Market under the ticker symbol "ZS" on March 16, 2018. Prior to that time, there was no public market for our common stock. The following table sets forth, for the periods indicated, the high and low sale prices of our common stock as reported on the NASDAQ Global Select Market since our initial public offering, or IPO.
|
Year Ended July 31, 2018
|
High
|
Low
|
||||||
|
Third fiscal quarter ended April 30, 2018 (from March 16, 2018)
|
$
|
34.83
|
|
$
|
26.06
|
|
||
|
Fourth fiscal quarter ended July 31, 2018
|
$
|
43.98
|
|
$
|
24.76
|
|
||
Holders of Record
As of July 31, 2018, we had
616
holders of record of our common stock reported on The NASDAQ. The actual number of stockholders is greater than this number of record holders and includes stockholders who are beneficial owners but whose shares are held in street name by brokers and other nominees. We are unable to estimate the total number of stockholders represented by these record holders.
Dividend Policy
We have never declared or paid cash dividends on our common stock. We currently intend to retain all available funds and any future earnings for use in the operation of our business and do not anticipate paying any dividends in the foreseeable future. Any future determination to declare dividends will be made at the discretion of our board of directors, subject to applicable laws, and will depend on our financial condition, operating results, capital requirements, general business conditions and other factors that our board of directors may deem relevant.
Securities Authorized for Issuance under Equity Compensation Plans
The information required by this item with respect to our equity compensation plans is incorporated by reference to our Proxy Statement for the 2018 Annual Meeting of Stockholders to be filed with the Securities and Exchange Commission within 120 days of the fiscal year ended
July 31, 2018
.
Recent Sales of Unregistered Equity Securities and Use of Proceeds
(a) Sale of Unregistered Equity Securities
We had no unregistered sales of our securities in fiscal 2018 not previously reported.
(b) Use of Proceeds from Public Offering of Common Stock
On March 15, 2018, the SEC declared our registration statement on Form S-1 (File No. 333-223072) for our IPO effective. There have been no material changes in the planned use of proceeds from our IPO as described in our final prospectus filed with the SEC on March 16, 2018.
47
Issuer Purchases of Equity Securities
The table below provides information with respect to repurchases of shares of our common stock during the three months ended July 31, 2018:
|
Period
|
Total Number of Shares Purchased
|
Average Price Paid per Share
|
|||||
|
May 1 to May 31, 2018
(*)
|
238,869
|
|
$
|
3.02
|
|
||
|
June 1 to June 30, 2018
(*)
|
—
|
|
$
|
—
|
|
||
|
July 1 to July 31, 2018
(*)
|
—
|
|
$
|
—
|
|
||
_____
(*)
Under certain stock option grant agreements between us and our employees, in the event an employee's service with us terminates, we have the right to repurchase shares of common stock that were acquired by such employee pursuant to the exercise of stock options that have not yet vested as of such employee's termination date. Pursuant to these agreements, we may repurchase all or any unvested shares at the lower of (i) the fair market value of such shares (as determined under our 2007 Stock Plan) on the date of repurchase, or (ii) the price equal to the employee's exercise price for such shares. The shares set forth above were repurchased pursuant to this right of repurchase.
Stock Performance Graph
This performance graph shall not be deemed "soliciting material" or to be "filed" with the SEC for purposes of Section 18 of the Securities Exchange Act of 1934, as amended (the "Exchange Act"), or otherwise subject to the liabilities under that Section, and shall not be deemed to be incorporated by reference into any filing of Zscaler, Inc. under the Securities Act or the Exchange Act.
We have presented below the cumulative total return to our stockholders between March 16, 2018 (the date our common stock commenced trading on the NASDAQ) through July 31, 2018 in comparison to the Standard & Poor's 500 Index and Standard & Poor Information Technology Index. All values assume a $100 initial investment and data for the Standard & Poor's 500 Index and Standard & Poor Information Technology Index assume reinvestment of dividends. The comparisons are based on historical data and are not indicative of, nor intended to forecast, the future performance of our common stock.
48
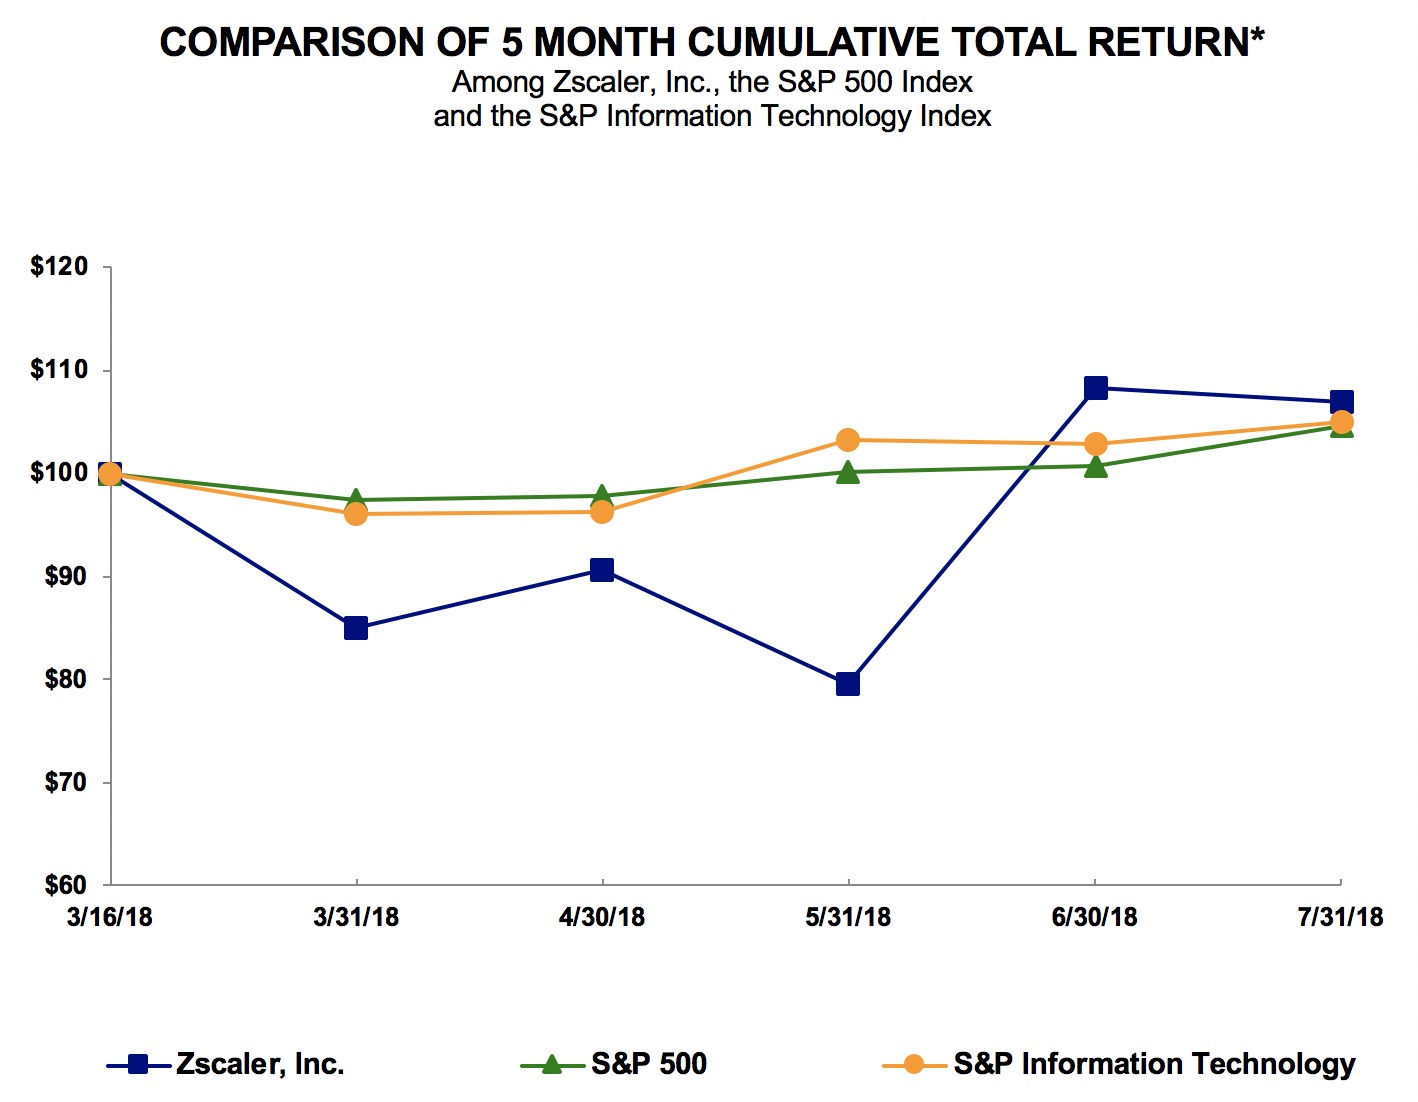
|
Company/Index
|
March 16,
2018
(*)
|
March 31,
2018
|
April 30,
2018
|
May 31,
2018
|
June 30,
2018
|
July 31,
2018
|
||||||||||||||||||
|
Zscaler
|
$
|
100.00
|
|
$
|
85.06
|
|
$
|
90.58
|
|
$
|
79.58
|
|
$
|
108.33
|
|
$
|
107.00
|
|
||||||
|
S&P 500 Index
|
$
|
100.00
|
|
$
|
97.46
|
|
$
|
97.83
|
|
$
|
100.19
|
|
$
|
100.81
|
|
$
|
104.56
|
|
||||||
|
S&P 500 Information Technology Index
|
$
|
100.00
|
|
$
|
96.10
|
|
$
|
96.18
|
|
$
|
103.27
|
|
$
|
102.91
|
|
$
|
105.06
|
|
||||||
_____
(*)
Base period.
49
Item 6.
Selected Financial Data
The selected consolidated statements of operations data presented below for fiscal
2018
,
2017
,
2016
and 2015 and the consolidated balance sheet data as of
July 31, 2018
,
2017
,
2016
and 2015 are derived from our audited consolidated financial statements that are included elsewhere in this Annual Report on Form 10-K. Our historical results are not necessarily indicative of the results that may be expected in the future. The selected consolidated financial data and other data set forth below should be read in conjunction with the section entitled "Management’s Discussion and Analysis of Financial Condition and Results of Operations" and our consolidated financial statements and related notes included elsewhere in this Annual Report on Form 10-K.
|
Year Ended July 31,
|
|||||||||||||||
|
2018
|
2017
|
2016
|
2015
|
||||||||||||
|
(in thousands, except per share data)
|
|||||||||||||||
|
Consolidated Statements of Operations Data:
|
|||||||||||||||
|
Revenue
|
$
|
190,174
|
|
$
|
125,717
|
|
$
|
80,325
|
|
$
|
53,707
|
|
|||
|
Cost of revenue
(1)
|
37,875
|
|
27,472
|
|
20,127
|
|
14,431
|
|
|||||||
|
Gross profit
|
152,299
|
|
98,245
|
|
60,198
|
|
39,276
|
|
|||||||
|
Operating expenses:
|
|||||||||||||||
|
Sales and marketing
(1)
|
116,409
|
|
79,236
|
|
56,702
|
|
32,191
|
|
|||||||
|
Research and development
(1)
|
39,379
|
|
33,561
|
|
20,940
|
|
15,034
|
|
|||||||
|
General and administrative
(1) (2)
|
31,135
|
|
20,521
|
|
9,399
|
|
4,469
|
|
|||||||
|
Total operating expenses
|
186,923
|
|
133,318
|
|
87,041
|
|
51,694
|
|
|||||||
|
Loss from operations
|
(34,624
|
)
|
(35,073
|
)
|
(26,843
|
)
|
(12,418
|
)
|
|||||||
|
Interest income, net
|
2,236
|
|
597
|
|
289
|
|
162
|
|
|||||||
|
Other income (expense), net
|
79
|
|
(107
|
)
|
(416
|
)
|
(343
|
)
|
|||||||
|
Loss before income taxes
|
(32,309
|
)
|
(34,583
|
)
|
(26,970
|
)
|
(12,599
|
)
|
|||||||
|
Provision for income taxes
|
1,337
|
|
877
|
|
468
|
|
233
|
|
|||||||
|
Net loss
|
$
|
(33,646
|
)
|
$
|
(35,460
|
)
|
$
|
(27,438
|
)
|
$
|
(12,832
|
)
|
|||
|
Accretion of Series C and D redeemable convertible preferred stock
|
(6,332
|
)
|
(9,570
|
)
|
(8,648
|
)
|
(147
|
)
|
|||||||
|
Net loss attributable to common stockholders
|
$
|
(39,978
|
)
|
$
|
(45,030
|
)
|
$
|
(36,086
|
)
|
$
|
(12,979
|
)
|
|||
|
Net loss per share attributable to common stockholders, basic and diluted
(3)
|
$
|
(0.63
|
)
|
$
|
(1.54
|
)
|
$
|
(1.36
|
)
|
$
|
(0.55
|
)
|
|||
|
Weighted-average shares used in computing net loss per share attributable to common stockholders, basic and diluted
(3)
|
63,881
|
|
29,221
|
|
26,521
|
|
23,519
|
|
|||||||
_____
(1)
Includes stock-based compensation expense as follows:
|
Year Ended July 31,
|
|||||||||||||||
|
2018
|
2017
|
2016
|
2015
|
||||||||||||
|
(in thousands)
|
|||||||||||||||
|
Cost of revenue
|
$
|
757
|
|
$
|
348
|
|
$
|
189
|
|
$
|
116
|
|
|||
|
Sales and marketing
|
5,044
|
|
2,794
|
|
1,574
|
|
611
|
|
|||||||
|
Research and development
|
3,045
|
|
5,574
|
|
1,025
|
|
648
|
|
|||||||
|
General and administrative
|
2,378
|
|
1,203
|
|
829
|
|
186
|
|
|||||||
|
Total stock-based compensation expense
|
$
|
11,224
|
|
$
|
9,919
|
|
$
|
3,617
|
|
$
|
1,561
|
|
|||
50
(2)
Includes litigation-related expenses
as follows:
|
Year Ended July 31,
|
|||||||||||||||
|
2018
|
2017
|
2016
|
2015
|
||||||||||||
|
(in thousands)
|
|||||||||||||||
|
Litigation-related expenses
|
$
|
8,039
|
|
$
|
5,827
|
|
$
|
—
|
|
$
|
—
|
|
|||
(3)
See Note 10 to our consolidated financial statements elsewhere in this Annual Report on Form 10-K for an explanation of the method used to calculate our basic and diluted net loss per share attributable to common stockholders and the weighted-average number of shares used in the computation of the per share amounts.
|
July 31,
|
|||||||||||||||
|
2018
|
2017
|
2016
|
2015
|
||||||||||||
|
(in thousands)
|
|||||||||||||||
|
Consolidated Balance Sheet Data:
|
|||||||||||||||
|
Cash and cash equivalents
|
$
|
135,579
|
|
$
|
87,978
|
|
$
|
92,842
|
|
$
|
83,842
|
|
|||
|
Short-term investments
|
$
|
162,960
|
|
$
|
—
|
|
$
|
—
|
|
$
|
—
|
|
|||
|
Working capital
(*)
|
$
|
204,332
|
|
$
|
22,450
|
|
$
|
49,157
|
|
$
|
50,625
|
|
|||
|
Total assets
|
$
|
447,781
|
|
$
|
182,902
|
|
$
|
153,518
|
|
$
|
116,620
|
|
|||
|
Deferred revenue, current and noncurrent
|
$
|
164,023
|
|
$
|
96,619
|
|
$
|
65,913
|
|
$
|
49,780
|
|
|||
|
Redeemable convertible preferred stock
|
$
|
—
|
|
$
|
200,977
|
|
$
|
191,407
|
|
$
|
157,802
|
|
|||
|
Accumulated deficit
|
$
|
(196,100
|
)
|
$
|
(162,016
|
)
|
$
|
(126,556
|
)
|
$
|
(109,442
|
)
|
|||
|
Total stockholders’ equity (deficit)
|
$
|
240,236
|
|
$
|
(151,142
|
)
|
$
|
(124,740
|
)
|
$
|
(105,656
|
)
|
|||
_____
(*)
Working capital is defined as current assets less current liabilities.
Non-GAAP Financial Measures and Key Business Metrics
The following table shows certain non-GAAP financial measures. A reconciliation for each non-GAAP measure is contained in the "Non-GAAP Financial Measures" section of Item 7 "Management's Discussion and Analysis of Financial Condition and Results of Operations" of this Annual Report on Form 10-K.
51
|
Year Ended July 31,
|
|||||||||||||||
|
2018
|
2017
|
2016
|
2015
|
||||||||||||
|
(in thousands)
|
|||||||||||||||
|
Gross profit
|
$
|
152,299
|
|
$
|
98,245
|
|
$
|
60,198
|
|
$
|
39,276
|
|
|||
|
Non-GAAP gross profit
|
$
|
153,056
|
|
$
|
98,593
|
|
$
|
60,387
|
|
$
|
39,392
|
|
|||
|
Gross margin
|
80
|
%
|
78
|
%
|
75
|
%
|
73
|
%
|
|||||||
|
Non-GAAP gross margin
|
80
|
%
|
78
|
%
|
75
|
%
|
73
|
%
|
|||||||
|
Loss from operations
|
$
|
(34,624
|
)
|
$
|
(35,073
|
)
|
$
|
(26,843
|
)
|
$
|
(12,418
|
)
|
|||
|
Non-GAAP loss from operations
|
$
|
(15,361
|
)
|
$
|
(19,327
|
)
|
$
|
(23,226
|
)
|
$
|
(10,857
|
)
|
|||
|
Operating margin
|
(18
|
)%
|
(28
|
)%
|
(33
|
)%
|
(23
|
)%
|
|||||||
|
Non-GAAP operating margin
|
(8
|
)%
|
(15
|
)%
|
(29
|
)%
|
(20
|
)%
|
|||||||
|
Net cash provided by (used in) operating activities
|
$
|
17,307
|
|
$
|
(6,019
|
)
|
$
|
(11,916
|
)
|
$
|
(3,279
|
)
|
|||
|
Net cash used in investing activities
|
$
|
(178,103
|
)
|
$
|
(8,342
|
)
|
$
|
(6,647
|
)
|
$
|
(595
|
)
|
|||
|
Net cash provided by financing activities
|
$
|
208,397
|
|
$
|
9,497
|
|
$
|
27,563
|
|
$
|
85,615
|
|
|||
|
Free cash flow
|
$
|
2,137
|
|
$
|
(14,193
|
)
|
$
|
(18,163
|
)
|
$
|
(9,984
|
)
|
|||
|
Net cash provided by (used in) operating activities as a percentage of revenue
|
9
|
%
|
(5
|
)%
|
(15
|
)%
|
(6
|
)%
|
|||||||
|
Free cash flow margin
|
1
|
%
|
(11
|
)%
|
(23
|
)%
|
(19
|
)%
|
|||||||
52
Item 7.
Management’s Discussion and Analysis of Financial Condition and Results of Operations
The following discussion and analysis of our financial condition and results of operations should be read in conjunction with our consolidated financial statements and related notes included elsewhere in this Annual Report on Form 10-K. As discussed in the section titled "Special Note Regarding Forward-Looking Statements," the following discussion contains forward-looking statements that involve risks and uncertainties. Our actual results could differ materially from those discussed below. Factors that could cause or contribute to such difference include, but are not limited to, those identified below and those discussed in the section titled "Risk Factors" and elsewhere in this Annual Report on Form 10-K. Our fiscal year ends
July 31,
and our fiscal quarters end on
October 31,
January 31,
April 30 and July 31. Our fiscal years ended
July 31, 2018
,
July 31, 2017
and
July 31, 2016
are referred to as fiscal
2018
, fiscal
2017
and fiscal
2016
, respectively.
Overview
Zscaler was incorporated in 2007, during the early stages of cloud adoption and mobility, based on a vision that the internet would become the new corporate network as the cloud becomes the new data center. We predicted that with rapid cloud adoption and increasing workforce mobility, traditional perimeter security approaches would provide inadequate protection for users and data and an increasingly poor user experience. We pioneered a security cloud that represents a fundamental shift in the architectural design and approach to network security.
We generate revenue primarily from sales of subscriptions to access our cloud platform, together with related support services. We also generate an immaterial amount of revenue from professional and other services, which consist primarily of fees associated with mapping, implementation, network design and training. Our subscription pricing is calculated on a per-user basis. We recognize subscription and support revenue ratably over the life of the contract, which is generally one to three years. As of
July 31, 2018
, we had expanded our operations to over
3,250
customers across every major industry, with users in
185
countries. Government agencies and some of the largest enterprises in the world rely on us to help them transform to the cloud, including more than
300
of the Forbes Global 2000.
We operate our business as one reportable segment. Our revenue has experienced significant growth in recent periods. For fiscal
2018
,
2017
and
2016
, our revenue was
$190.2 million
,
$125.7 million
and
$80.3 million
, respectively, representing year-over-year growth rate of
51%
and
57%
, respectively. However, we have incurred net losses in all periods since our inception. For fiscal
2018
,
2017
and
2016
, our net loss was
$33.6 million
,
$35.5 million
and
$27.4 million
, respectively. We expect we will continue to incur net losses for the foreseeable future, as we continue investing in our sales and marketing organization to take advantage of our market opportunity, continue to invest in research and development efforts to enhance the functionality of our cloud platform, continue to incur additional compliance and other related costs as we operate as a public company, and deal with ongoing legal matters and related accruals, certain of which are described in further detail in Note 5 to our consolidated financial statements included elsewhere in this Annual Report on Form 10-K.
Initial Public Offering
In March 2018, we completed our IPO of common stock, in which we sold
13,800,000
shares. The shares were sold at an IPO price of
$16.00
per share for net proceeds of
$205.3 million
, after deducting underwriters' discounts and commissions of
$15.5 million
. In connection with the IPO, we incurred offering costs of
$6.5 million
which were recorded within stockholders’ equity (deficit) as a reduction of the net proceeds received from the IPO. Immediately prior to the closing of the IPO, all our outstanding shares of convertible preferred stock were automatically converted into
72,500,750
shares of common stock on a
one
-to-one basis.
53
Certain Factors Affecting Our Performance
Increased Internet Traffic and Adoption of Cloud-Based Software and Security
The adoption of cloud applications and infrastructure, explosion of internet traffic volumes and shift to mobile-first computing generally, and the pace at which enterprises adopt the internet as their corporate network in particular, impact our ability to drive market adoption of our cloud platform. We believe that most enterprises are in the early stages of a broad transformation to the cloud. Organizations are increasingly relying on the internet to operate their businesses, deploying new SaaS applications and migrating internally managed line-of-business applications to the cloud. However, the growing dependence on the internet has increased exposure to malicious or compromised websites, and sophisticated hackers are exploiting the gaps left by legacy network security appliances. To securely access the internet and transform their networks, organizations must also make fundamental changes in their network and security architectures. We believe that most organizations have yet to fully make these investments. Since we enable organizations to securely transform to the cloud, we believe that the imperative for organizations to securely move to the cloud will increase demand for our cloud platform and broaden our customer base.
New Customer Acquisition
We believe that our ability to increase the number of customers on our cloud platform is an indicator of our market penetration and our future business opportunities. As of
July 31, 2018
,
2017
and
2016
, we had over
3,250
customers, over 2,800 customers and over 2,450 customers, respectively, across all major geographies. As of
July 31, 2018
, we had over
300
of the Forbes Global 2000 as customers. Our ability to continue to grow this number will increase our future opportunities for renewals and follow-on sales. We believe that we have significant room to capture additional market share and intend to continue to invest significantly in sales and marketing to engage our prospective customers, increase brand awareness, further leverage our channel partnerships and drive adoption of our solution.
Follow-On Sales
We typically expand our relationship with our customers over time. While most of our new customers route all of their internet-bound web traffic through our cloud platform, some of our customers initially use our services for specific users or specific security functionality. We leverage our land-and-expand model with the goal of generating incremental revenue, often within the term of the initial subscription, by increasing sales to our existing customers in one of three ways:
|
•
|
expanding deployment of our cloud platform to cover additional users;
|
|
•
|
upgrading to a more advanced Business, Transformation or Secure Transformation suite; and
|
|
•
|
selling a ZPA subscription to a ZIA customer, a ZIA subscription to a ZPA customer, or other features on an a la carte basis.
|
These purchases increase the Annual Recurring Revenue ("ARR") attributable to our customers over time. To establish ARR for a customer, we use the total amount of each order booked to compute the annual recurring value of revenue that we would recognize if the customer continues to renew all contractual subscriptions. For example, a contract for $3.0 million with a contractual term of three years would have ARR of $1.0 million as long as our customer uses our cloud platform.
Investing in Business Growth
Since our founding, we have invested significantly in growing our business. We intend to continue to invest in our research and development organization and our development efforts to offer new solutions on our platform and to continue dedicating resources to update and upgrade our existing solutions. In addition, we expect our general and administrative expenses to increase in absolute dollars in the foreseeable future, as we continue to operate as a public company and deal with ongoing
54
legal matters and related accruals, certain of which are described in further detail in Note 5 to our consolidated financial statements included elsewhere in this Annual Report on Form 10-K.
We also intend to continue to invest significantly in sales and marketing to grow and train our sales force, broaden our brand awareness and expand and deepen our channel partner relationships. While these planned investments will increase our operating expenses in the short term, we believe that over the long term these investments will help us to expand our customer base and grow our business. We also are investing in programs to increase recognition of our brand and solutions, including joint marketing activities with our channel partners and strategic partners.
While we expect our operating expenses to increase in absolute dollars in the foreseeable future, as a result of these activities, we will balance these investments in future growth with a continued focus on managing our results of operations and investing judiciously. In the long term we anticipate that these investments will positively impact our business and results of operations.
Key Business Metrics and Other Financial Measures
We review a number of operating and financial metrics, including the following key metrics, to measure our performance, identify trends, formulate business plans and make strategic decisions.
Dollar-Based Net Retention Rate
We believe that dollar-based net retention rate is a key metric to measure the long-term value of our customer relationships because it is driven by our ability to retain and expand the recurring revenue generated from our existing customers. Our dollar-based net retention rate compares the recurring revenue from a set of customers against the same metric for the prior 12-month period on a trailing basis. Because our customers have repeat buying patterns and the average term of our contracts is more than 12 months, we measure this metric over a set of customers who were with us as of the last day of the same reporting period in the prior fiscal year. Our dollar-based net retention rate includes customer attrition. We have not experienced a material increase in customer attrition rates in recent periods.
We calculate our dollar-based net retention rate as follows:
|
•
|
Denominator: To calculate our dollar-based net retention rate as of the end of a reporting period, we first establish the ARR, from all active subscriptions as of the last day of the same reporting period in the prior fiscal year. This effectively represents recurring dollars that we expect in the next 12-month period from the cohort of customers that existed on the last day of the same reporting period in the prior fiscal year.
|
|
•
|
Numerator: We measure the ARR for that same cohort of customers representing all subscriptions based on confirmed customer orders booked by us as of the end of the reporting period.
|
Dollar-based net retention rate is obtained by dividing the numerator by the denominator. Our dollar-based net retention rate may fluctuate due to a number of factors, including the performance of our cloud platform, the timing and the rate of ARR expansion of our existing customers, potential changes in our rate of renewals and other risk factors described in this Annual Report on Form 10-K.
|
Trailing 12 Months Ended July 31,
|
|||||
|
2018
|
2017
|
2016
|
|||
|
Dollar-based net retention rate
|
117%
|
115%
|
115%
|
||
Non-GAAP Financial Measures
In addition to our results determined in accordance with U.S. GAAP, we believe the following non-GAAP measures are useful in evaluating our operating performance. We use the following non-GAAP financial information to evaluate our ongoing operations and for internal planning and forecasting purposes. We believe that non-GAAP financial information, when taken
55
collectively, may be helpful to investors because it provides consistency and comparability with past financial performance. However, non-GAAP financial information is presented for supplemental informational purposes only, has limitations as an analytical tool and should not be considered in isolation or as a substitute for financial information presented in accordance with U.S. GAAP. In particular, free cash flow is not a substitute for cash used in operating activities. Additionally, the utility of free cash flow as a measure of our liquidity is further limited as it does not represent the total increase or decrease in our cash balance for a given period. In addition, other companies, including companies in our industry, may calculate similarly-titled non-GAAP measures differently or may use other measures to evaluate their performance, all of which could reduce the usefulness of our non-GAAP financial measures as tools for comparison. A reconciliation is provided below for each non-GAAP financial measure to the most directly comparable financial measure stated in accordance with U.S. GAAP. Investors are encouraged to review the related GAAP financial measures and the reconciliation of these non-GAAP financial measures to their most directly comparable GAAP financial measures, and not to rely on any single financial measure to evaluate our business.
Non-GAAP Gross Profit and Non-GAAP Gross Margin
We define non-GAAP gross profit as GAAP gross profit excluding stock-based compensation expense. We define non-GAAP gross margin as non-GAAP gross profit as a percentage of revenue.
|
Year Ended July 31,
|
|||||||||||
|
2018
|
2017
|
2016
|
|||||||||
|
(in thousands)
|
|||||||||||
|
Gross profit
|
$
|
152,299
|
|
$
|
98,245
|
|
$
|
60,198
|
|
||
|
Add: Stock-based compensation expense included in cost of revenue
|
757
|
|
348
|
|
189
|
|
|||||
|
Non-GAAP gross profit
|
$
|
153,056
|
|
$
|
98,593
|
|
$
|
60,387
|
|
||
|
Gross margin
|
80
|
%
|
78
|
%
|
75
|
%
|
|||||
|
Non-GAAP gross margin
|
80
|
%
|
78
|
%
|
75
|
%
|
|||||
Non-GAAP Loss from Operations and Non-GAAP Operating Margin
We define non-GAAP loss from operations as GAAP loss from operations excluding stock-based compensation expense and certain litigation-related expenses. We define non-GAAP operating margin as non-GAAP loss from operations as a percentage of revenue. These excluded litigation-related expenses are professional fees and related costs incurred by us in defending against significant claims that we deem not to be in the ordinary course of our business and, if applicable, accruals related to estimated losses in connection with these claims. There are many uncertainties and potential outcomes associated with any litigation, including the expense of litigation, timing of such expenses, court rulings, unforeseen developments, complications and delays, each of which may affect our results of operations from period to period, as well as the unknown magnitude of the potential loss relating to any lawsuit, all of which are inherently subject to change, difficult to estimate and could adversely affect our results of operations.
|
Year Ended July 31,
|
|||||||||||
|
2018
|
2017
|
2016
|
|||||||||
|
(in thousands)
|
|||||||||||
|
Loss from operations
|
$
|
(34,624
|
)
|
$
|
(35,073
|
)
|
$
|
(26,843
|
)
|
||
|
Add: Stock-based compensation expense
|
11,224
|
|
9,919
|
|
3,617
|
|
|||||
|
Add: Litigation-related expenses
|
8,039
|
|
5,827
|
|
—
|
|
|||||
|
Non-GAAP loss from operations
|
$
|
(15,361
|
)
|
$
|
(19,327
|
)
|
$
|
(23,226
|
)
|
||
|
Operating margin
|
(18
|
)%
|
(28
|
)%
|
(33
|
)%
|
|||||
|
Non-GAAP operating margin
|
(8
|
)%
|
(15
|
)%
|
(29
|
)%
|
|||||
56
Free Cash Flow and Free Cash Flow Margin
Free cash flow is a non-GAAP financial measure that we calculate as net cash used in operating activities less purchases of property and equipment and capitalized internal-use software. Free cash flow margin is calculated as free cash flow divided by revenue. We believe that free cash flow and free cash flow margin are useful indicators of liquidity that provide information to management and investors about the amount of cash generated from our operations that, after the investments in property and equipment and capitalized internal-use software, can be used for strategic initiatives, including investing in our business, and strengthening our financial position.
Free cash flow includes the cyclical impact of inflows and outflows resulting from contributions to our employee stock purchase plan for which the purchase period of approximately six months ends in each of our second and fourth fiscal quarter. As of July 31, 2018, the employee contributions to our employee stock purchase plan was $4.6 million, which will be reclassified to stockholders' equity (deficit) upon issuance of the shares during our second quarter of fiscal 2019.
|
Year Ended July 31,
|
|||||||||||
|
2018
|
2017
|
2016
|
|||||||||
|
(in thousands)
|
|||||||||||
|
Net cash provided by (used in) operating activities
|
$
|
17,307
|
|
$
|
(6,019
|
)
|
$
|
(11,916
|
)
|
||
|
Less: Purchases of property and equipment
|
(13,397
|
)
|
(7,783
|
)
|
(5,402
|
)
|
|||||
|
Less: Capitalized internal-use software
|
(1,773
|
)
|
(391
|
)
|
(845
|
)
|
|||||
|
Free cash flow
|
$
|
2,137
|
|
$
|
(14,193
|
)
|
$
|
(18,163
|
)
|
||
|
As a percentage of revenue:
|
|||||||||||
|
Net cash provided by (used in) operating activities
|
9
|
%
|
(5
|
)%
|
(15
|
)%
|
|||||
|
Less: Purchases of property and equipment
|
(7
|
)
|
(6
|
)
|
(7
|
)
|
|||||
|
Less: Capitalized internal-use software
|
(1
|
)
|
—
|
|
(1
|
)
|
|||||
|
Free cash flow margin
|
1
|
%
|
(11
|
)%
|
(23
|
)%
|
|||||
Calculated Billings
Calculated billings is a non-GAAP financial measure that we believe is a key metric to measure our periodic performance. Calculated billings represents our total revenue plus the change in deferred revenue in a period. Calculated billings in any particular period aims to reflect amounts invoiced for subscriptions to access our cloud platform, together with related support services related to our new and existing customers. We typically invoice our customers annually in advance, and to a lesser extent quarterly in advance, monthly in advance or multi-year in advance. Calculated billings increased
$101.2 million
, or
65%
, in fiscal
2018
over fiscal
2017
, and
$60.0 million
, or
62%
, in fiscal
2017
over fiscal
2016
. As calculated billings continues to grow in absolute terms, we expect our calculated billings growth rate to trend down over time. We also expect that calculated billings will be affected by seasonality in terms of when we enter into agreements with customers; and the mix of billings in each reporting period as we typically invoice customers annually in advance, and to a lesser extent quarterly in advance, monthly in advance or multi-year in advance.
|
Year Ended July 31,
|
|||||||||||
|
2018
|
2017
|
2016
|
|||||||||
|
(in thousands)
|
|||||||||||
|
Revenue
|
$
|
190,174
|
|
$
|
125,717
|
|
$
|
80,325
|
|
||
|
Add: Total deferred revenue, end of period
|
164,023
|
|
96,619
|
|
65,913
|
|
|||||
|
Less: Total deferred revenue, beginning of period
|
(96,619
|
)
|
(65,913
|
)
|
(49,780
|
)
|
|||||
|
Calculated billings
|
$
|
257,578
|
|
$
|
156,423
|
|
$
|
96,458
|
|
||
57
Components of Results of Operations
Revenue
We generate revenue primarily from sales of subscriptions to access our cloud platform, together with related support services. These subscription and related support services accounted for approximately
99%
of our revenue for fiscal
2018
,
2017
and
2016
. Our contracts with our customers do not at any time provide the customer with the right to take possession of the software that runs our cloud platform. Our customers may also purchase professional services, such as mapping, implementation, network design and training. Professional services account for an immaterial portion of our revenue.
We generate revenue from contracts with typical durations ranging from one to three years. We typically invoice our customers annually in advance, and to a lesser extent quarterly in advance, monthly in advance or multi-year in advance. We recognize revenue ratably over the life of the contract. Amounts that have been invoiced are recorded in deferred revenue, or they are recorded in revenue if the revenue recognition criteria have been met. Subscriptions that are invoiced annually in advance or multi-year in advance represent a significant portion of our short-term and long-term deferred revenue in comparison to invoices issued quarterly in advance or monthly in advance. Accordingly, we cannot predict the mix of invoicing schedules in any given period.
We generally experience seasonality in terms of when we enter into agreements with our customers. We typically enter into a higher percentage of agreements with new customers, as well as renewal agreements with existing customers, in our second and fourth fiscal quarters. However, because we recognize revenue ratably over the terms of our subscription contracts, a substantial portion of the revenue that we report in each period is attributable to the recognition of deferred revenue relating to agreements that we entered into during previous periods. Consequently, increases or decreases in new sales or renewals in any one period may not be immediately reflected as revenue for that period. Accordingly, the effect of downturns in sales and market acceptance of our platform, and potential changes in our rate of renewals, may not be fully reflected in our results of operations until future periods.
Cost of Revenue
Cost of revenue includes expenses related to operating our cloud platform in data centers, depreciation of our data center equipment, related overhead costs and the amortization of our capitalized internal-use software. Cost of revenue also includes employee-related costs, including salaries, bonuses, stock-based compensation expense and employee benefit costs associated with our customer support and cloud operations organizations. Cost of revenue also includes overhead costs for facilities, IT, and amortization and depreciation expense.
As our customers expand and increase the use of our cloud platform driven by additional applications and connected devices, our cost of revenue will increase due to higher bandwidth and data center expenses. However, we expect to continue to benefit from economies of scale as our customers increase the use of our cloud platform. We intend to continue to invest additional resources in our cloud platform and our customer support organizations as we grow our business. The level and timing of investment in these areas could affect our cost of revenue in the future.
Gross Profit and Gross Margin
Gross profit, or revenue less cost of revenue, and gross margin, or gross profit as a percentage of revenue, have been and will continue to be affected by various factors, including the timing of our acquisition of new customers and our renewals of and follow-on sales to existing customers, the average sales price of our services, mix of services offered in our solutions, the data center and bandwidth costs associated with operating our cloud platform, the extent to which we expand our customer support and cloud operations organizations and the extent to which we can increase the efficiency of our technology, infrastructure and data centers through technological improvements. We expect our gross profit to increase in absolute dollars and gross margin
58
to remain relatively unchanged over the long-term, although our gross margin could fluctuate from period to period depending on the interplay of all of the above factors.
Operating Expenses
Our operating expenses consist of sales and marketing, research and development and general and administrative expenses. Personnel costs are the most significant component of operating expenses and consist of salaries, benefits, bonuses, stock-based compensation expense and, with respect to sales and marketing expenses, sales commissions that are recognized as expenses. Operating expenses also include overhead costs for facilities, IT and depreciation expense.
Sales and Marketing
Sales and marketing expenses consist primarily of employee compensation and related expenses, including salaries, bonuses and benefits for our sales and marketing employees, sales commissions that are recognized as expenses over the period of benefit, stock-based compensation expense, marketing programs, travel and entertainment expenses, expenses for conferences and events and allocated overhead costs. We capitalize our sales commissions and associated payroll taxes and recognize them as expenses over the estimated period of benefit. The amount recognized in our sales and marketing expenses reflects the amortization of cost previously deferred as attributable to each period presented in this Annual Report on Form 10-K, as described below under "Critical Accounting Policies and Estimates." We intend to continue to make significant investments in our sales and marketing organization to drive additional revenue, further penetrate the market and expand our global customer base. As a result, we expect our sales and marketing expenses to continue to increase in absolute dollars and to be our largest operating expense category for the foreseeable future. In particular, we will continue to invest in growing and training our sales force, broadening our brand awareness and expanding and deepening our channel partner relationships. However, we expect our sales and marketing expenses to decrease as a percentage of our revenue over the long term, although our sales and marketing expenses may fluctuate as a percentage of our revenue from period to period due to the timing and extent of these expenses.
Research and Development
Our research and development expenses support our efforts to add new features to our existing offerings and to ensure the reliability, availability and scalability of our solutions. Our cloud platform is software-driven, and our research and development teams employ software engineers in the design, and the related development, testing, certification and support, of these solutions. Accordingly, a majority of our research and development expenses result from employee-related costs, including salaries, bonuses and benefits, stock-based compensation expense and costs associated with technology tools used by our engineers. We expect our research and development expenses to continue to increase in absolute dollars for the foreseeable future, as we continue to invest in research and development efforts to enhance the functionality of our cloud platform, improve the reliability, availability and scalability of our platform and access new customer markets. However, we expect our research and development expenses to decrease as a percentage of our revenue over the long term, although our research and development expenses may fluctuate as a percentage of our revenue from period to period due to the timing and extent of these expenses.
General and Administrative
General and administrative expenses consist primarily of employee-related costs, including salaries and bonuses, stock-based compensation expense and employee benefit costs for our finance, legal, human resources and administrative personnel, as well as professional fees for external legal services (including certain litigation-related expenses), accounting and other related consulting services. These litigation-related expenses include professional fees and related costs incurred by us in defending significant claims that we deem not to be in the ordinary course of our business and, if applicable, accruals related to estimated losses in connection with these claims. We expect our general and administrative expenses to increase in absolute dollars for the foreseeable future, as we continue to incur compliance costs and other related costs necessary to operate as a public company, and due to ongoing legal matters and related accruals, certain of which are described in further detail in Note 5 to our consolidated
59
financial statements included elsewhere in this Annual Report on Form 10-K. However, we expect our general and administrative expenses to decrease as a percentage of our revenue over the long term, although our general and administrative expenses may fluctuate as a percentage of our revenue from period to period due to the timing and extent of these expenses. In particular, litigation-related expenses related to significant litigation claims may result in significant fluctuations from period to period as they are inherently subject to change and difficult to estimate.
Interest Income, net
Interest income consist primarily of income earned on our cash equivalents and short-term investments and interest earned on outstanding notes receivable extended to certain current and former employees who early exercised their stock options. For more information on these notes receivable, refer to Note 8 to our consolidated financial statements included elsewhere in this Annual Report on Form 10-K.
Other Income (Expense), net
Other income (expense), net
consists primarily of foreign currency transaction gains and losses.
Provision for Income Taxes
Provision for income taxes consists primarily of income taxes in certain foreign jurisdictions in which we conduct business, as well as state income taxes in the United States. We have not recorded any U.S. federal income tax expense. We have recorded deferred tax assets for which we provide a full valuation allowance, which includes net operating loss carryforwards and tax credits. We expect to maintain this full valuation allowance for the foreseeable future as it is more likely than not that some or all of those deferred tax assets may not be realized based on our history of losses.
60
Results of Operations
The following tables set forth our results of operations for the periods presented in dollars and as a percentage of our revenue:
|
Year Ended July 31,
|
|||||||||||
|
2018
|
2017
|
2016
|
|||||||||
|
(in thousands)
|
|||||||||||
|
Revenue
|
$
|
190,174
|
|
$
|
125,717
|
|
$
|
80,325
|
|
||
|
Cost of revenue
(1)
|
37,875
|
|
27,472
|
|
20,127
|
|
|||||
|
Gross profit
|
152,299
|
|
98,245
|
|
60,198
|
|
|||||
|
Operating expenses:
|
|||||||||||
|
Sales and marketing
(1)
|
116,409
|
|
79,236
|
|
56,702
|
|
|||||
|
Research and development
(1)
|
39,379
|
|
33,561
|
|
20,940
|
|
|||||
|
General and administrative
(1) (2)
|
31,135
|
|
20,521
|
|
9,399
|
|
|||||
|
Total operating expenses
|
186,923
|
|
133,318
|
|
87,041
|
|
|||||
|
Loss from operations
|
(34,624
|
)
|
(35,073
|
)
|
(26,843
|
)
|
|||||
|
Interest income, net
|
2,236
|
|
597
|
|
289
|
|
|||||
|
Other income (expense), net
|
79
|
|
(107
|
)
|
(416
|
)
|
|||||
|
Loss before income taxes
|
(32,309
|
)
|
(34,583
|
)
|
(26,970
|
)
|
|||||
|
Provision for income taxes
|
1,337
|
|
877
|
|
468
|
|
|||||
|
Net loss
|
$
|
(33,646
|
)
|
$
|
(35,460
|
)
|
$
|
(27,438
|
)
|
||
_____
(1)
Includes stock-based compensation expense as follows:
|
Year Ended July 31,
|
|||||||||||
|
2018
|
2017
|
2016
|
|||||||||
|
(in thousands)
|
|||||||||||
|
Cost of revenue
|
$
|
757
|
|
$
|
348
|
|
$
|
189
|
|
||
|
Sales and marketing
|
5,044
|
|
2,794
|
|
1,574
|
|
|||||
|
Research and development
|
3,045
|
|
5,574
|
|
1,025
|
|
|||||
|
General and administrative
|
2,378
|
|
1,203
|
|
829
|
|
|||||
|
Total stock-based compensation expense
|
$
|
11,224
|
|
$
|
9,919
|
|
$
|
3,617
|
|
||
(2)
Includes litigation-related expenses
as follows:
|
Year Ended July 31,
|
|||||||||||
|
2018
|
2017
|
2016
|
|||||||||
|
(in thousands)
|
|||||||||||
|
Litigation-related expenses
|
$
|
8,039
|
|
$
|
5,827
|
|
$
|
—
|
|
||
61
|
Year Ended July 31,
|
|||||
|
2018
|
2017
|
2016
|
|||
|
Revenue
|
100%
|
100%
|
100%
|
||
|
Cost of revenue
|
20
|
22
|
25
|
||
|
Gross margin
|
80
|
78
|
75
|
||
|
Operating expenses
|
|||||
|
Sales and marketing
|
61
|
63
|
70
|
||
|
Research and development
|
21
|
27
|
26
|
||
|
General and administrative
|
16
|
16
|
12
|
||
|
Total operating expenses
|
98
|
106
|
108
|
||
|
Operating margin
|
(18)
|
(28)
|
(33)
|
||
|
Interest income, net
|
1
|
—
|
—
|
||
|
Other income (expense), net
|
—
|
—
|
(1)
|
||
|
Loss before income taxes
|
(17)
|
(28)
|
(34)
|
||
|
Provision for income taxes
|
1
|
—
|
—
|
||
|
Net loss
|
(18)%
|
(28)%
|
(34)%
|
||
Comparison of Fiscal
2018
and
2017
Revenue
|
Year Ended July 31,
|
Change
|
|||||||||||||
|
2018
|
2017
|
$
|
%
|
|||||||||||
|
(in thousands)
|
||||||||||||||
|
Revenue
|
$
|
190,174
|
|
$
|
125,717
|
|
$
|
64,457
|
|
51
|
%
|
|||
Revenue
increased
by
$64.5 million
, or
51%
, in fiscal
2018
, compared to fiscal
2017
. The increase in revenue was partially attributable to the addition of new customers, which contributed
$20.2 million
, as we increased our customer base by
16%
from
July 31, 2017
to
July 31, 2018
. The remainder of the increase in revenue was attributable to an increase in users and sales of additional subscriptions to existing customers as reflected by our dollar-based net retention rate of
117%
for the trailing 12 months ended
July 31, 2018
.
Cost of Revenue and Gross Margin
|
Year Ended July 31,
|
Change
|
|||||||||||||
|
2018
|
2017
|
$
|
%
|
|||||||||||
|
(in thousands)
|
||||||||||||||
|
Cost of revenue
|
$
|
37,875
|
|
$
|
27,472
|
|
$
|
10,403
|
|
38
|
%
|
|||
|
Gross margin
|
80
|
%
|
78
|
%
|
|
|
|
|
||||||
Cost of revenue
increased
by
$10.4 million
, or
38%
, in fiscal
2018
, compared to fiscal
2017
. The overall increase in cost of revenue was driven by expanded use of our cloud platform by existing and new customers. The increase in cost of revenue was primarily due to an increase of
$4.9 million
for data center and equipment related costs for hosting and operating our cloud platform for our expanded customer base and an increase in employee-related costs of
$3.0 million
, inclusive of an increase of
$0.4 million
in stock-based compensation expense, driven by a
38%
increase in headcount in our customer support and cloud operations organizations from
July 31, 2017
to
July 31, 2018
. The remainder of the increase was primarily attributable to increased expenses of
$1.0 million
for facility and IT costs,
$0.7 million
in depreciation and amortization expense and
$0.4 million
related to third-party consulting services.
62
Gross margin
increased
from
78%
during fiscal
2017
to
80%
during fiscal
2018
. The increase in gross margin was driven by an increase in revenue and was also due in part to the increased efficiency of our technology, infrastructure and data centers enabled by technological improvements, even as our customers expanded their use of our cloud platform.
Operating Expenses
Sales and Marketing Expenses
|
Year Ended July 31,
|
Change
|
|||||||||||||
|
2018
|
2017
|
$
|
%
|
|||||||||||
|
(in thousands)
|
||||||||||||||
|
Sales and marketing
|
$
|
116,409
|
|
$
|
79,236
|
|
$
|
37,173
|
|
47
|
%
|
|||
Sales and marketing expenses increased by
$37.2 million
, or
47%
, for fiscal
2018
, compared to fiscal
2017
. The increase was primarily driven by
$24.1 million
in increased employee-related costs, inclusive of an increase of
$2.2 million
in stock-based compensation expense, driven by a
16%
increase in headcount in our sales and marketing organization from
July 31, 2017
to
July 31, 2018
, and by an increase of
$5.4 million
in sales commissions expense. The remainder of the increase was primarily attributable to increased expenses of
$4.5 million
in marketing and advertising expenses and increased expenses of
$2.4 million
for facility and IT costs.
Research and Development Expenses
|
Year Ended July 31,
|
Change
|
|||||||||||||
|
2018
|
2017
|
$
|
%
|
|||||||||||
|
(in thousands)
|
||||||||||||||
|
Research and development
|
$
|
39,379
|
|
$
|
33,561
|
|
$
|
5,818
|
|
17
|
%
|
|||
Research and development expenses increased by
$5.8 million
, or
17%
, for fiscal
2018
, compared to fiscal
2017
as we continued to develop and enhance the functionality of our cloud platform. In fiscal
2017
, research and development expenses included
$4.4 million
in stock-based compensation expense, recognized during our fiscal quarter ended January 31, 2017, associated with a one-time secondary stock purchase transaction executed between certain of our employees and certain of our affiliated stockholders, including entities controlled by Jay Chaudhry, our president, chief executive officer and chairman of the board of directors, and Lane Bess, a member of our board of directors. Refer to Note 13 to our consolidated financial statements for further information. Excluding this transaction, the increase in research and development expenses was primarily driven by
$9.6 million
in increased employee-related costs, inclusive of an increase of
$1.9 million
in stock-based compensation expense, driven by a
22%
increase in headcount from
July 31, 2017
to
July 31, 2018
, and by an increase of
$0.7 million
in professional services. These expense increases were partially offset by decreased expenses of
$1.3 million
as a result of higher capitalized internal-use software development costs.
General and Administrative Expenses
|
Year Ended July 31,
|
Change
|
|||||||||||||
|
2018
|
2017
|
$
|
%
|
|||||||||||
|
(in thousands)
|
||||||||||||||
|
General and administrative
|
$
|
31,135
|
|
$
|
20,521
|
|
$
|
10,614
|
|
52
|
%
|
|||
General and administrative expenses
increased
by
$10.6 million
, or
52%
, for fiscal
2018
, compared to fiscal
2017
. The increase was primarily driven by
$6.1 million
in employee-related costs, inclusive of an increase of
$1.2 million
in stock-based
63
compensation expense, driven by a
45%
increase in headcount from
July 31, 2017
to
July 31, 2018
, as we transitioned to being a public company. The remainder of the increase was primarily driven by
$3.4 million
in increased legal expenses related to ongoing legal matters and related accruals and
$0.6 million
for third-party accounting and consulting services.
Interest Income, net
|
Year Ended July 31,
|
Change
|
|||||||||||||
|
2018
|
2017
|
$
|
%
|
|||||||||||
|
(in thousands)
|
||||||||||||||
|
Interest income, net
|
$
|
2,236
|
|
$
|
597
|
|
$
|
1,639
|
|
275
|
%
|
|||
Interest income, net
increased
by
$1.6 million
, or
275%
, for fiscal
2018
, compared to fiscal
2017
. The increase was primarily driven by increased interest income earned from our investments in cash equivalents and short-term investments, as a result of additional cash received from our IPO.
Other Income (Expense), net
|
Year Ended July 31,
|
Change
|
|||||||||||||
|
2018
|
2017
|
$
|
%
|
|||||||||||
|
(in thousands)
|
||||||||||||||
|
Other income (expense), net
|
$
|
79
|
|
$
|
(107
|
)
|
$
|
186
|
|
174
|
%
|
|||
Other income (expense), net
increased
by
$0.2 million
, or
174%
, for fiscal
2018
, compared to fiscal
2017
. The increase was primarily driven by fluctuations in foreign currency transaction gains and losses for fiscal 2018, compared to fiscal 2017.
Provision for Income Taxes
|
Year Ended July 31,
|
Change
|
|||||||||||||
|
2018
|
2017
|
$
|
%
|
|||||||||||
|
(in thousands)
|
||||||||||||||
|
Provision for income taxes
|
$
|
1,337
|
|
$
|
877
|
|
$
|
460
|
|
52
|
%
|
|||
Our provision for income taxes
increased
by
$0.5 million
, or
52%
, for fiscal
2018
, compared to fiscal
2017
, primarily related to income taxes in the foreign jurisdictions in which we operate. Our effective tax rate of (4.1%) and (2.5%) in fiscal 2018 and 2017, respectively, differs from the applicable U.S. statutory federal income tax rate due to an increase in the valuation allowance against our U.S. federal and state deferred tax assets, as well as the benefit of our foreign income being taxed at different rates than the U.S. statutory rate.
On December 22, 2017, the Tax Cuts and Jobs Act of 2017, or the Tax Act, was enacted. The Tax Act contains several key tax provisions that affect us, including, but not limited to, reducing the U.S. federal corporate tax rate, imposing a one-time mandatory transition tax on previously untaxed foreign earnings and changing rules related to the use of net operating loss carryforwards created in tax years beginning after December 31, 2017. We expect to complete our assessment of the impacts of the Tax Act including the remeasurement of our deferred taxes, the one-time mandatory transition tax, and the policy decision regarding whether to record deferred taxes associated with Global Intangible Low-Taxed Income (“GILTI”) within the measurement period provided by Staff Accounting Bulletin No. 118,
Income Tax Accounting Implications of the Tax Cuts and Jobs Act
("SAB 118"). Our assessment of the impact of the Tax Act may differ from our provisional assessment during the measurement period due to, among other things, further refinement in our calculations, changes in interpretations and assumptions we have made, or guidance that may be issued.
64
While we believe our current valuation allowance is sufficient, we assess the need for an adjustment to the valuation allowance on a quarterly basis. The assessment is based on our estimates of future sources of taxable income for the jurisdictions in which we operate and the periods over which our deferred tax assets will be realizable. In the event we determine that we will be able to realize all or part of our net deferred tax assets in the future, the valuation allowance will be reversed in the period in which we make such determination. The release of a valuation allowance against deferred tax assets may cause greater volatility in the effective tax rate in the periods in which it is reversed.
Comparison of the Fiscal
2017
and
2016
Revenue
|
Year Ended July 31,
|
Change
|
|||||||||||||
|
2017
|
2016
|
$
|
%
|
|||||||||||
|
(in thousands)
|
||||||||||||||
|
Revenue
|
$
|
125,717
|
|
$
|
80,325
|
|
$
|
45,392
|
|
57
|
%
|
|||
Revenue
increased
by
$45.4 million
, or
57%
, for fiscal 2017, compared to fiscal 2016. The increase in revenue was partially due to the addition of new customers, which contributed $15.6 million, as we increased our customer base by 14% from July 31, 2016 to July 31, 2017. The remainder of the increase in revenue was attributable to an increase in users and sales of additional subscriptions to existing customers as reflected by our dollar-based net retention rate of 115% for the trailing 12 months ended July 31, 2017.
Cost of Revenue and Gross Margin
|
Year Ended July 31,
|
Change
|
|||||||||||||
|
2017
|
2016
|
$
|
%
|
|||||||||||
|
(in thousands)
|
||||||||||||||
|
Cost of revenue
|
$
|
27,472
|
|
$
|
20,127
|
|
$
|
7,345
|
|
36
|
%
|
|||
|
Gross margin
|
78
|
%
|
75
|
%
|
||||||||||
Cost of revenue
increased
by
$7.3 million
, or
36%
, for fiscal 2017, compared to fiscal 2016. The increase in cost of revenue was driven by expanded use of our cloud platform by existing and new customers, which resulted in increased data center costs. It was also due to an increase in employee-related expenses of $3.1 million, which was driven by a 37% increase in headcount in our customer support and cloud operations organizations from July 31, 2016 to July 31, 2017. The increase in cost of revenue was also attributable to a $1.8 million increase in depreciation and amortization expense and a $1.4 million increase in data center colocation expense related to hosting and operating our cloud platform.
Gross margin
increased
from
75%
during fiscal 2016 to
78%
during fiscal 2017. The increase in gross margin was driven by an increase in revenue and was also due in part to the increased efficiency of our technology, infrastructure and data centers enabled by technological improvements, even as our customers expanded their use of our cloud platform.
65
Operating Expenses
Sales and Marketing Expenses
|
Year Ended July 31,
|
Change
|
|||||||||||||
|
2017
|
2016
|
$
|
%
|
|||||||||||
|
(in thousands)
|
||||||||||||||
|
Sales and marketing
|
$
|
79,236
|
|
$
|
56,702
|
|
$
|
22,534
|
|
40
|
%
|
|||
Sales and marketing expenses
increased
by
$22.5 million
, or
40%
, for fiscal 2017, compared to fiscal 2016. The increase was primarily driven by $17.2 million in increased employee-related costs due to a 41% increase in headcount in our sales and marketing organization from July 31, 2016 to July 31, 2017 and includes a $2.3 million increase in sales commissions expense. The remainder of the increase was primarily attributable to increased expenses of $2.3 million for training, conferences, advertising and overhead costs and $2.2 million in travel and entertainment.
Research and Development Expenses
|
Year Ended July 31,
|
Change
|
|||||||||||||
|
2017
|
2016
|
$
|
%
|
|||||||||||
|
(in thousands)
|
||||||||||||||
|
Research and development
|
$
|
33,561
|
|
$
|
20,940
|
|
$
|
12,621
|
|
60
|
%
|
|||
Research and development expenses
increased
by
$12.6 million
, or
60%
, for fiscal 2017, compared to fiscal 2016 as we continued to develop and enhance the functionality of our cloud platform. The increase was primarily driven by a 31% increase in research and development headcount from July 31, 2016 to July 31, 2017, which resulted in additional expenses of $10.4 million in employee-related costs, including an increase of $4.4 million in stock-based compensation expense, recognized during our fiscal quarter ended January 31, 2017, associated with a one-time secondary stock purchase transaction that was executed among certain of our employees and certain of our affiliated stockholders, including entities controlled by Jay Chaudhry, our president, chief executive officer and chairman of the board of directors, and Lane Bess, a member of our board of directors. See Note 13 to our consolidated financial statements for further information for more information regarding this transaction. The remainder of the increase was primarily attributable to other expenses that increased as we expanded our research and development efforts.
General and Administrative Expenses
|
Year Ended July 31,
|
Change
|
|||||||||||||
|
2017
|
2016
|
$
|
%
|
|||||||||||
|
(in thousands)
|
||||||||||||||
|
General and administrative
|
$
|
20,521
|
|
$
|
9,399
|
|
$
|
11,122
|
|
118
|
%
|
|||
General and administrative expenses
increased
by
$11.1 million
, or
118%
, for fiscal 2017, compared to fiscal 2016. The increase was primarily driven by $4.4 million in increased employee-related costs, including an increase of $3.1 million in salaries, bonus and benefits driven by increased headcount as we prepare to operate as a public company and an increase of $0.4 million in stock-based compensation expense. Additionally, our legal expenses increased by $5.5 million due to ongoing legal matters and related accruals, including $2.5 million related to our ongoing legal proceeding with Finjan, as further discussed in Note 5 to our consolidated financial statements included elsewhere in this Annual Report on Form 10-K. The remainder of the increase was primarily due to increased expenses of $1.3 million for third-party accounting and consulting services.
66
Interest Income, net
|
Year Ended July 31,
|
Change
|
|||||||||||||
|
2017
|
2016
|
$
|
%
|
|||||||||||
|
(in thousands)
|
||||||||||||||
|
Interest income, net
|
$
|
597
|
|
$
|
289
|
|
$
|
308
|
|
107
|
%
|
|||
Interest income, net
increased
by
$0.31 million
, or
107%
, for fiscal 2017, compared to fiscal 2016. The increase was primarily driven by increased interest income earned from our investments in money market funds for fiscal 2017, compared to fiscal 2016.
Other Income (Expense), net
|
Year Ended July 31,
|
Change
|
|||||||||||||
|
2017
|
2016
|
$
|
%
|
|||||||||||
|
(in thousands)
|
||||||||||||||
|
Other income (expense), net
|
$
|
(107
|
)
|
$
|
(416
|
)
|
$
|
309
|
|
74
|
%
|
|||
Other income (expense), net
increased
by
$0.3 million
, or
74%
, for fiscal 2017, compared to fiscal 2016. The increase was primarily driven by fluctuations in foreign currency transaction gains and losses for fiscal 2017, compared to fiscal 2016.
Provision for Income Taxes
|
Year Ended July 31,
|
Change
|
|||||||||||||
|
2017
|
2016
|
$
|
%
|
|||||||||||
|
(in thousands)
|
||||||||||||||
|
Provision for income taxes
|
$
|
877
|
|
$
|
468
|
|
$
|
409
|
|
87
|
%
|
|||
We recorded a provision for income taxes of
$0.9 million
and
$0.5 million
in fiscal 2017 and 2016, respectively.
Our effective tax rate of (2.5%) and (1.7%) in fiscal 2017 and 2016, respectively, differs from the U.S. statutory federal income tax rate of 34% due to an increase in the valuation allowance against our U.S. federal and state deferred tax assets, as well as the benefit of our foreign income being taxed at different rates than the U.S. statutory rate. Our provision for income taxes increased by $0.4 million, or 87%, for fiscal 2017, compared to fiscal 2016, primarily related to income taxes in foreign tax jurisdictions in relation to income from foreign operations.
As of July 1, 2017, we had an immaterial amount of net deferred tax assets, which was mainly comprised of U.S. federal and state net operating loss carryovers. Our U.S. federal and state deferred tax assets are subject to a full valuation allowance to reflect uncertainties about whether we will be able to utilize the deferred tax assets before they expire.
67
Quarterly Results of Operations and Other Data
The following sets forth selected unaudited quarterly consolidated statements of operations data for each of the eight quarters in the period ended
July 31, 2018
.
The unaudited quarterly statements of operations data set forth below have been prepared on the same basis as our audited consolidated financial statements and, in the opinion of management, reflect all adjustments, consisting only of normal recurring adjustments, that are necessary for the fair statement of such data. The following quarterly financial data should be read in conjunction with our consolidated financial statements and the related notes included elsewhere in this Annual Report on Form 10-K. Our historical results are not necessarily indicative of the results that may be expected in the future, and the results for any quarter are not necessarily indicative of results to be expected for a full year or any other period.
|
Three Months Ended
|
|||||||||||||||||||||||||||||||
|
Oct. 31
|
Jan. 31
|
Apr. 30
|
Jul. 31
|
Oct. 31
|
Jan. 31
|
Apr. 30
|
Jul. 31
|
||||||||||||||||||||||||
|
2016
|
2017
|
2017
|
2017
|
2017
|
2018
|
2018
|
2018
|
||||||||||||||||||||||||
|
(in thousands)
|
|||||||||||||||||||||||||||||||
|
Revenue
|
$
|
26,782
|
|
$
|
29,427
|
|
$
|
32,964
|
|
$
|
36,544
|
|
$
|
39,861
|
|
$
|
44,976
|
|
$
|
49,163
|
|
$
|
56,174
|
|
|||||||
|
Cost of revenue
(1)
|
5,926
|
|
6,515
|
|
6,997
|
|
8,034
|
|
8,271
|
|
8,679
|
|
9,424
|
|
11,501
|
||||||||||||||||
|
Gross profit
|
20,856
|
|
22,912
|
|
25,967
|
|
28,510
|
|
31,590
|
|
36,297
|
|
39,739
|
|
44,673
|
||||||||||||||||
|
Operating expenses:
|
|||||||||||||||||||||||||||||||
|
Sales and marketing
(1)
|
17,116
|
|
17,796
|
|
20,689
|
|
23,635
|
|
26,928
|
|
27,110
|
|
29,892
|
|
32,479
|
||||||||||||||||
|
Research and development
(1)
|
6,141
|
|
11,033
|
|
7,778
|
|
8,609
|
|
8,809
|
|
9,183
|
|
9,907
|
|
11,480
|
||||||||||||||||
|
General and administrative
(1) (2)
|
2,753
|
|
3,387
|
|
5,061
|
|
9,320
|
|
7,130
|
|
6,403
|
|
8,964
|
|
8,638
|
||||||||||||||||
|
Total operating expenses
|
26,010
|
|
32,216
|
|
33,528
|
|
41,564
|
|
42,867
|
|
42,696
|
|
48,763
|
|
52,597
|
||||||||||||||||
|
Loss from operations
|
(5,154
|
)
|
(9,304
|
)
|
(7,561
|
)
|
(13,054
|
)
|
(11,277
|
)
|
(6,399
|
)
|
(9,024
|
)
|
(7,924)
|
||||||||||||||||
|
Interest income, net
|
125
|
|
130
|
|
152
|
|
190
|
|
195
|
|
213
|
|
596
|
|
1,232
|
||||||||||||||||
|
Other income (expense), net
|
(12
|
)
|
(47
|
)
|
31
|
|
(79
|
)
|
(27
|
)
|
28
|
|
14
|
|
64
|
||||||||||||||||
|
Loss before income taxes
|
(5,041
|
)
|
(9,221
|
)
|
(7,378
|
)
|
(12,943
|
)
|
(11,109
|
)
|
(6,158
|
)
|
(8,414
|
)
|
(6,628
|
)
|
|||||||||||||||
|
Provision for income taxes
|
200
|
|
167
|
|
184
|
|
326
|
|
289
|
|
357
|
|
357
|
|
334
|
||||||||||||||||
|
Net loss
|
$
|
(5,241
|
)
|
$
|
(9,388
|
)
|
$
|
(7,562
|
)
|
$
|
(13,269
|
)
|
$
|
(11,398
|
)
|
$
|
(6,515
|
)
|
$
|
(8,771
|
)
|
$
|
(6,962
|
)
|
|||||||
|
Accretion of Series C and D redeemable convertible preferred stock
|
(2,344
|
)
|
(2,389
|
)
|
(2,355
|
)
|
(2,482
|
)
|
(2,530
|
)
|
(2,579
|
)
|
(1,223
|
)
|
—
|
|
|||||||||||||||
|
Net loss attributable to common stockholders
|
$
|
(7,585
|
)
|
$
|
(11,777
|
)
|
$
|
(9,917
|
)
|
$
|
(15,751
|
)
|
$
|
(13,928
|
)
|
$
|
(9,094
|
)
|
$
|
(9,994
|
)
|
$
|
(6,962
|
)
|
|||||||
|
Net loss per share attributable to common stockholders, basic and diluted
|
$
|
(0.27
|
)
|
$
|
(0.41
|
)
|
$
|
(0.34
|
)
|
$
|
(0.52
|
)
|
$
|
(0.45
|
)
|
$
|
(0.29
|
)
|
$
|
(0.14
|
)
|
$
|
(0.06
|
)
|
|||||||
_____
(1)
Includes stock-based compensation expense as follows:
68
|
Three Months Ended
|
|||||||||||||||||||||||||||||||
|
Oct. 31
|
Jan. 31
|
Apr. 30
|
Jul. 31
|
Oct. 31
|
Jan. 31
|
Apr. 30
|
Jul. 31
|
||||||||||||||||||||||||
|
2016
|
2017
|
2017
|
2017
|
2017
|
2018
|
2018
|
2018
|
||||||||||||||||||||||||
|
(in thousands)
|
|||||||||||||||||||||||||||||||
|
Cost of revenue
|
$
|
51
|
|
$
|
88
|
|
$
|
106
|
|
$
|
103
|
|
$
|
109
|
|
$
|
126
|
|
$
|
199
|
|
$
|
323
|
|
|||||||
|
Sales and marketing
|
515
|
|
721
|
|
762
|
|
796
|
|
785
|
|
985
|
|
1,493
|
|
1,781
|
|
|||||||||||||||
|
Research and development
|
274
|
|
4,651
|
|
306
|
|
343
|
|
398
|
|
494
|
|
960
|
|
1,193
|
|
|||||||||||||||
|
General and administrative
|
184
|
|
266
|
|
412
|
|
341
|
|
441
|
|
459
|
|
657
|
|
821
|
|
|||||||||||||||
|
Total stock-based compensation expense
|
$
|
1,024
|
|
$
|
5,726
|
|
$
|
1,586
|
|
$
|
1,583
|
|
$
|
1,733
|
|
$
|
2,064
|
|
$
|
3,309
|
|
$
|
4,118
|
|
|||||||
(2)
Includes litigation-related expenses
as follows:
|
Three Months Ended
|
|||||||||||||||||||||||||||||||
|
Oct. 31
|
Jan. 31
|
Apr. 30
|
Jul. 31
|
Oct. 31
|
Jan. 31
|
Apr. 30
|
Jul. 31
|
||||||||||||||||||||||||
|
2016
|
2017
|
2017
|
2017
|
2017
|
2018
|
2018
|
2018
|
||||||||||||||||||||||||
|
(in thousands)
|
|||||||||||||||||||||||||||||||
|
Litigation-related expenses
|
$
|
42
|
|
$
|
478
|
|
$
|
1,006
|
|
$
|
4,301
|
|
$
|
2,146
|
|
$
|
1,630
|
|
$
|
2,836
|
|
$
|
1,427
|
|
|||||||
Consolidated Statements of Operations as a Percentage of Revenue
|
Three Months Ended
|
|||||||||||||||||||||||
|
Oct. 31
|
Jan. 31
|
Apr. 30
|
Jul. 31
|
Oct. 31
|
Jan. 31
|
Apr. 30
|
Jul. 31
|
||||||||||||||||
|
2016
|
2017
|
2017
|
2017
|
2017
|
2018
|
2018
|
2018
|
||||||||||||||||
|
Revenue
|
100
|
%
|
100
|
%
|
100
|
%
|
100
|
%
|
100
|
%
|
100
|
%
|
100
|
%
|
100
|
%
|
|||||||
|
Cost of revenue
|
22
|
|
22
|
|
21
|
|
22
|
|
21
|
|
19
|
|
19
|
|
20
|
|
|||||||
|
Gross profit
|
78
|
|
78
|
|
79
|
|
78
|
|
79
|
|
81
|
|
81
|
|
80
|
|
|||||||
|
Operating expenses:
|
|||||||||||||||||||||||
|
Sales and marketing
|
64
|
|
61
|
|
63
|
|
65
|
|
67
|
|
60
|
|
61
|
|
58
|
|
|||||||
|
Research and development
|
23
|
|
37
|
|
24
|
|
23
|
|
22
|
|
21
|
|
20
|
|
21
|
|
|||||||
|
General and administrative
|
10
|
|
12
|
|
15
|
|
26
|
|
18
|
|
14
|
|
18
|
|
15
|
|
|||||||
|
Total operating expenses
|
97
|
|
110
|
|
102
|
|
114
|
|
107
|
|
95
|
|
99
|
|
94
|
|
|||||||
|
Loss from operations
|
(19
|
)
|
(32
|
)
|
(23
|
)
|
(36
|
)
|
(28
|
)
|
(14
|
)
|
(18
|
)
|
(14
|
)
|
|||||||
|
Interest income, net
|
—
|
|
—
|
|
1
|
|
—
|
|
—
|
|
—
|
|
1
|
|
2
|
|
|||||||
|
Other income (expense), net
|
—
|
|
1
|
|
—
|
|
—
|
|
—
|
|
—
|
|
—
|
|
—
|
|
|||||||
|
Loss before income taxes
|
(19
|
)
|
(31
|
)
|
(22
|
)
|
(36
|
)
|
(28
|
)
|
(14
|
)
|
(17
|
)
|
(12
|
)
|
|||||||
|
Provision for (benefit from) income taxes
|
1
|
|
1
|
|
1
|
|
—
|
|
1
|
|
—
|
|
1
|
|
—
|
|
|||||||
|
Net loss
|
(20
|
)%
|
(32
|
)%
|
(23
|
)%
|
(36
|
)%
|
(29
|
)%
|
(14
|
)%
|
(18
|
)%
|
(12
|
)%
|
|||||||
Liquidity and Capital Resources
As of
July 31, 2018
, our principal sources of liquidity were cash, cash equivalents and short-term investments totaling
$298.5 million
, which were held for working capital purposes. Our cash equivalents and investments consist of highly liquid investments in money market funds, U.S. treasury securities, U.S. government agency securities and corporate debt securities.
In March 2018, upon completion of our IPO, we received net proceeds of
$205.3 million
, net of underwriters' discounts and commissions of
$15.5 million
. In connection with the IPO, we incurred offering costs of
$6.5 million
which were recorded into stockholders' equity (deficit) as a reduction of the net proceeds received from the IPO. Previously, we have financed our operations principally through private placements of our equity securities, as well as payments received from customers using our cloud platform and services.
69
We have generated significant operating losses from our operations, as reflected in our accumulated deficit of
$196.1 million
as of
July 31, 2018
, and negative cash flows from operations in past years. We expect to continue to incur operating losses and generate negative cash flows from operations in future periods due to expected investments to grow our business.
We believe that our existing cash, cash equivalents and short-term investments will be sufficient to fund our operating and capital needs for at least the next 12 months from the issuance of our financial statements. Our assessment of the period of time through which our financial resources will be adequate to support our operations is a forward-looking statement and involves risks and uncertainties. Our actual results could vary as a result of, and our future capital requirements, both near-term and long-term, will depend on, many factors, including our growth rate, the timing and extent of spending to support our research and development efforts, the expansion of sales and marketing and international operating activities, the timing of new introductions of solutions or features, and the continuing market acceptance of our services. We have and may in the future enter into arrangements to acquire or invest in complementary businesses, services and technologies, including intellectual property rights. We have based this estimate on assumptions that may prove to be wrong, and we could use our available capital resources sooner than we currently expect. We may be required to seek additional equity or debt financing. In the event that additional financing is required from outside sources, we may not be able to raise it on terms acceptable to us or at all. If we are unable to raise additional capital when desired, or if we cannot expand our operations or otherwise capitalize on our business opportunities because we lack sufficient capital, our business, operating results and financial condition would be adversely affected.
We typically invoice our customers annually in advance, and to a lesser extent quarterly in advance, monthly in advance or multi-year in advance. Therefore, a substantial source of our cash is from such prepayments, which are included on our consolidated balance sheets as a contract liability. Deferred revenue consists of the unearned portion of billed fees for our subscriptions, which is subsequently recognized as revenue in accordance with our revenue recognition policy. As of
July 31, 2018
, we had deferred revenue of
$164.0 million
, of which
$140.7 million
was recorded as a current liability and is expected to be recorded as revenue in the next 12 months, provided all other revenue recognition criteria have been met. Subscriptions that are invoiced annually in advance or multi-year in advance contribute significantly to our short-term and long-term deferred revenue in comparison to our invoices issued quarterly in advance or monthly in advance. Accordingly, we cannot predict the mix of invoicing schedules in any given period.
The following table summarizes our cash flows for the periods presented:
|
Year Ended July 31,
|
|||||||||||
|
2018
|
2017
|
2016
|
|||||||||
|
(in thousands)
|
|||||||||||
|
Net cash provided by (used in) operating activities
|
$
|
17,307
|
|
$
|
(6,019
|
)
|
$
|
(11,916
|
)
|
||
|
Net cash used in investing activities
|
$
|
(178,103
|
)
|
$
|
(8,342
|
)
|
$
|
(6,647
|
)
|
||
|
Net cash provided by financing activities
|
$
|
208,397
|
|
$
|
9,497
|
|
$
|
27,563
|
|
||
Operating Activities
Net cash
provided by
operating activities during fiscal
2018
was
$17.3 million
, which resulted from a
net loss
of
$33.6 million
, adjusted for non-cash charges of
$32.5 million
and net cash
inflows
of
$18.4 million
from changes in operating assets and liabilities. Non-cash charges primarily consisted of
$8.0 million
for depreciation and amortization expense,
$13.2 million
for amortization of deferred contract acquisition costs and
$11.2 million
for stock-based compensation expense. The net cash
inflows
from changes in operating assets and liabilities was primarily the result of a
$67.4 million
increase in deferred revenue from advance invoicing in accordance with our subscription contracts and an aggregate
$13.9 million
increase in accrued compensation and accrued expenses and other liabilities. These cash
inflows
were partially offset by cash
outflows
resulting from a
$34.4 million
increase in deferred contract acquisition costs, as our sales commission payments increased due to the addition of new customers and expansion of our existing customer subscriptions, a
$22.6 million
increase in accounts receivable
70
due to timing on collections, a
$5.1 million
increase in prepaid expenses and other assets, as we support our business growth, and a
$0.8 million
decrease in accounts payable.
Net cash
used in
operating activities during fiscal
2017
was
$6.0 million
, which resulted from a
net loss
of
$35.5 million
, adjusted for non-cash charges of
$25.1 million
and net cash
inflows
of
$4.3 million
from changes in operating assets and liabilities. Non-cash charges primarily consisted of
$6.8 million
for depreciation and amortization expense,
$8.5 million
for amortization of deferred contract acquisition costs and
$9.9 million
for stock-based compensation expense. The net cash
inflows
from changes in operating assets and liabilities was primarily the result of a
$30.7 million
increase in deferred revenue from advance invoicing in accordance with our subscription contracts and an aggregate
$12.9 million
increase in accounts payable, accrued compensation and accrued expenses and other liabilities. These cash inflows were partially offset by cash outflows resulting from a
$22.0 million
increase in deferred contract acquisition costs, as our sales commission payments increased due to the addition of new customers and expansion of our existing customer subscriptions, a
$14.6 million
increase in accounts receivable due to increased billings from our growing customer base which resulted in an overall increased accounts receivable balance and a
$2.7 million
increase in prepaid expenses and other assets.
Net cash
used in
operating activities during fiscal
2016
was
$11.9 million
, which resulted from a net loss of
$27.4 million
, adjusted for non-cash charges of
$13.9 million
, and net cash inflow of
$1.6 million
from changes in operating assets and liabilities. Non-cash charges primarily consisted of
$4.9 million
for depreciation and amortization expense,
$5.5 million
for amortization of deferred contract acquisition costs and
$3.6 million
for stock-based compensation expense. The net cash inflow from changes in operating assets and liabilities was primarily the result of a
$16.1 million
increase in deferred revenue from advance invoicing in accordance with our subscription contracts and an aggregate
$5.2 million
increase in accounts payable, accrued compensation and accrued expenses and other liabilities. The cash inflows were partially offset by cash outflows resulting from a
$13.5 million
increase in deferred contract acquisition costs, as our sales commission payments increased due to addition of new customers and expansion of our existing customer subscriptions, and a
$6.2 million
increase in accounts receivable, as a result of increased billings from our growing customer base which resulted in an overall increased accounts receivable balance.
Investing Activities
Net cash
used in
investing activities during fiscal
2018
of
$178.1 million
was primarily attributable to the purchases of short-term investments of
$163.4 million
and
investments in capital expenditures of
$15.2 million
to support our cloud platform, additional office space and headcount. These activities were partially offset by proceeds from the maturities of short-term investments of
$0.4 million
.
Net cash
used in
investing activities during fiscal
2017
and
2016
of
$8.3 million
and
$6.6 million
, respectively, resulted primarily from investments in capital expenditures to support our cloud platform, additional office space and headcount.
71
Financing Activities
Net cash
provided by
financing activities of
$208.4 million
during fiscal
2018
was primarily attributable to
$205.3 million
in proceeds from the completion of our IPO (net of underwriters’ discounts and commissions of
$15.5 million
),
$5.3 million
in proceeds from repayments of notes receivable for the exercise of stock options,
$5.0 million
in proceeds from the exercise of stock options and
$0.9 million
in proceeds from early exercised stock options. These proceeds were partially offset by
$3.8 million
in payments for repurchases of common stock related to early exercised stock options and
$4.3 million
in payments for offering costs related to our IPO.
Net cash
provided by
financing activities of
$9.5 million
during fiscal
2017
was primarily due to
$4.7 million
in proceeds from the early exercise of stock options,
$3.0 million
in proceeds from the exercise of stock options and
$1.9 million
in proceeds from repayments of notes receivable for early exercised stock options.
Net cash
provided by
financing activities of
$27.6 million
during fiscal
2016
was primarily due to
$25.0 million
of proceeds from the issuance of Series D redeemable convertible preferred stock.
Contractual Obligations and Commitments
The following table summarizes our contractual obligations as
July 31, 2018
:
|
Payments Due by Period
|
|||||||||||||||||||
|
Total
|
Less Than 1 Year
|
1 to 3
Years
|
3 to 5
Years
|
More Than
5 Years
|
|||||||||||||||
|
(in thousands)
|
|||||||||||||||||||
|
Operating leases
|
$
|
6,706
|
|
$
|
2,834
|
|
$
|
3,872
|
|
$
|
—
|
|
$
|
—
|
|
||||
|
Data center contracts
|
11,522
|
|
6,280
|
|
5,063
|
|
179
|
|
—
|
|
|||||||||
|
Non-cancelable purchase obligations
|
10,548
|
|
8,947
|
|
1,601
|
|
—
|
|
—
|
|
|||||||||
|
Total contractual obligations
|
$
|
28,776
|
|
$
|
18,061
|
|
$
|
10,536
|
|
$
|
179
|
|
$
|
—
|
|
||||
The contractual commitment amounts in the table above are associated with agreements that are enforceable and legally binding. Obligations under contracts that we can cancel without a significant penalty are not included in the table above. Purchase orders issued in the ordinary course of business are not included in the table above, as our purchase orders represent authorizations to purchase rather than binding agreements.
Off-Balance Sheet Arrangements
As of
July 31, 2018
, we did not have any relationships with unconsolidated organizations or financial partnerships, such as structured finance or special purpose entities, which would have been established for the purpose of facilitating off-balance sheet arrangements or other contractually narrow or limited purposes.
Critical Accounting Policies and Estimates
Our financial statements are prepared in accordance with U.S. GAAP. The preparation of these financial statements requires us to make estimates and assumptions that affect the reported amounts of assets, liabilities, revenue and expenses, as well as related disclosures. We evaluate our estimates and assumptions on an ongoing basis. Our estimates are based on historical experience and various other assumptions that we believe to be reasonable under the circumstances. Our actual results could differ from these estimates.
The critical accounting estimates, assumptions and judgments that we believe have the most significant impact on our consolidated financial statements are described below.
72
Revenue Recognition
We have adopted Accounting Standards Codification ("ASC") Topic 606,
Revenue From Contracts With Customers
("ASC 606"), effective as of August 1, 2017, using the full retrospective transition method. Under this method, we are presenting the consolidated financial statements for fiscal 2016, as if ASC 606 had been effective for that period as well.
In accordance with ASC 606, revenue is recognized when a customer obtains control of promised services. The amount of revenue recognized reflects the consideration that we expect to be entitled to receive in exchange for these services. To achieve the core principle of this standard, we apply the following five steps:
1) Identify the contract with a customer
We consider the terms and conditions of the contracts and our customary business practices in identifying our contracts under ASC 606. We determine we have a contract with a customer when the contract is approved, we can identify each party’s rights regarding the services to be transferred, we can identify the payment terms for the services, we have determined the customer to have the ability and intent to pay, and the contract has commercial substance. We apply judgment in determining the customer’s ability and intent to pay, which is based on a variety of factors, including the customer’s historical payment experience or, in the case of a new customer, credit and financial information pertaining to the customer.
2) Identify the performance obligations in the contract
Performance obligations promised in a contract are identified based on the services that will be transferred to the customer that are both capable of being distinct, whereby the customer can benefit from the service either on its own or together with other resources that are readily available from third parties or from us, and are distinct in the context of the contract, whereby the transfer of the services is separately identifiable from other promises in the contract. Our performance obligations consist of (i) our subscription and support services and (ii) professional and other services.
3) Determine the transaction price
The transaction price is determined based on the consideration to which we expect to be entitled in exchange for transferring services to the customer. Variable consideration is included in the transaction price if, in our judgment, it is probable that a significant future reversal of cumulative revenue under the contract will not occur. None of our contracts contain a significant financing component.
4) Allocate the transaction price to performance obligations in the contract
If the contract contains a single performance obligation, the entire transaction price is allocated to the single performance obligation. Contracts that contain multiple performance obligations require an allocation of the transaction price to each performance obligation based on a relative standalone selling price, or SSP.
5) Recognize revenue when or as we satisfy a performance obligation
Revenue is recognized at the time the related performance obligation is satisfied by transferring the promised service to a customer. Revenue is recognized when control of the services is transferred to our customers, in an amount that reflects the consideration that we expect to receive in exchange for those services. We generate all our revenue from contracts with customers.
73
Subscription and Support Revenue
We generate revenue primarily from sales of subscriptions to access our cloud platform, together with related support services to our customers. Arrangements with customers do not provide the customer with the right to take possession of our software operating our cloud platform at any time. Instead, customers are granted continuous access to our cloud platform over the contractual period. A time-elapsed output method is used to measure progress because we transfer control evenly over the contractual period. Accordingly, the fixed consideration related to subscription and support revenue is generally recognized on a straight-line basis over the contract term beginning on the date that our service is made available to the customer.
The typical subscription and support term is one to three years. Most of our contracts are non-cancelable over the contractual term. Customers typically have the right to terminate their contracts for cause if we fail to perform in accordance with the contractual terms. Some of our customers have the option to purchase additional subscription and support services at a stated price. These options generally do not provide a material right as they are priced at our SSP.
Professional and Other Services Revenue
Professional and other services revenue consists of fees associated with providing deployment advisory services that educate and assist our customers on the best use of our solutions, as well as advise customers on best practices as they deploy our solution. These services are distinct from subscription and support services. Professional services do not result in significant customization of the subscription service. Revenue from professional services provided on a time and materials basis is recognized as the services are performed. Total professional and other services revenue has historically been insignificant.
Contracts with Multiple Performance Obligations
Most of our contracts with customers contain multiple promised services consisting of (i) our subscription and support services and (ii) professional and other services that are distinct and accounted for separately. The transaction price is allocated to the separate performance obligations on a relative SSP basis. We determine SSP based on our overall pricing objectives, taking into consideration the type of subscription and support services and professional and other services, the geographical region of the customer and the number of users.
Variable Consideration
Revenue from sales is recorded at the net sales price, which is the transaction price, and includes estimates of variable consideration. The amount of variable consideration that is included in the transaction price is constrained, and is included in the net sales price only to the extent that it is probable that a significant reversal in the amount of the cumulative revenue will not occur when the uncertainty is resolved.
If our services do not meet certain service level commitments, our customers are entitled to receive service credits, and in certain cases, refunds, each representing a form of variable consideration. We have not historically experienced any significant incidents affecting the defined levels of reliability and performance as required by our subscription contracts. Accordingly, any estimated refunds related to these agreements in the consolidated financial statements were not material during the periods presented.
We provide rebates and other credits within our contracts with certain customers which are estimated based on the most likely amounts expected to be earned or claimed on the related sales transaction. Overall, the transaction price is reduced to reflect our estimate of the amount of consideration to which we are entitled based on the terms of the contract. Estimated rebates and other credits were not material during the periods presented.
74
Contract Balances
Contract liabilities consist of deferred revenue and include payments received in advance of performance under the contract. Such amounts are recognized as revenue over the contractual period.
We receive payments from customers based upon contractual billing schedules; accounts receivable are recorded when the right to consideration becomes unconditional. Payment terms on invoiced amounts are typically 30 days. Contract assets include amounts related to our contractual right to consideration for both completed and partially completed performance obligations that may not have been invoiced and such amounts have been insignificant to date.
Costs to Obtain and Fulfill a Contract
We capitalize sales commissions and associated payroll taxes paid to internal sales personnel that are incremental to the acquisition of channel partner and direct customer contracts. These costs are recorded as deferred contract acquisition costs on the consolidated balance sheets. We determine whether costs should be deferred based on our sales compensation plans, if the commissions are in fact incremental and would not have occurred absent the customer contract.
Sales commissions for renewal of a contract are not considered commensurate with the commissions paid for the acquisition of the initial contract given the substantive difference in commission rates in proportion to their respective contract values. Commissions paid upon the initial acquisition of a contract are amortized over an estimated period of benefit of five years while commissions paid for renewal contracts are amortized over the contractual term of the renewals. Amortization is recognized on a straight-line basis commensurate with the pattern of revenue recognition. We determine the period of benefit for commissions paid for the acquisition of the initial contract by taking into consideration the expected subscription term and expected renewals of our customer contracts, the duration of our relationships with customers, customer retention data, our technology development life cycle and other factors. Management exercises judgment to determine the period of benefit to amortize contract acquisition costs by considering factors such as expected renewals of customer contracts, duration of customer relationships and our technology development life cycle. Although we believe that the historical assumptions and estimates we have made are reasonable and appropriate, different assumptions and estimates could materially impact our reported financial results. Amortization of deferred contract acquisition costs is included in sales and marketing expense in the consolidated statements of operations. We periodically review these deferred costs to determine whether events or changes in circumstances have occurred that could impact the period of benefit of these deferred contract acquisition costs.
Stock-Based Compensation
Stock-based compensation expense for common stock options granted to employees and non-employees is recognized based on the fair value of the awards granted, determined using the Black-Scholes option pricing model and a single option award approach. Stock‐based compensation expense is recognized as expense over the requisite service period, generally four years. Unvested options issued to non-employees are remeasured at fair market value at the end of each reporting period.
Stock-based compensation expense related to purchase rights issued under the 2018 Employee Stock Purchase Plan ("ESPP") is based on the Black-Scholes option pricing model fair value of the estimated number of awards as of the beginning of the offering period. Stock-based compensation expense is recognized following the straight-line attribution method over the offering period.
Prior to the IPO, the fair value of our common stock for financial reporting purposes was determined considering numerous objective and subjective factors and required judgment to determine the fair value of common stock as of each grant date. Subsequent to the IPO, we determine the fair value using the market closing price of our common stock on the date of grant.
75
Prior to fiscal 2018, we recognized stock-based compensation expense, net of estimated forfeitures. We used historical data to estimate pre-vesting forfeitures and recorded stock-based compensation expense only for those grants that were expected to vest. On August 1, 2017, we adopted Accounting Standard Update ("ASU") No. 2016-09, Compensation—Stock Compensation: Improvements to Employee Share-Based Payment Accounting ("ASU 2016-09"), which simplifies several aspects of the accounting for employee share-based payment transactions. In accordance with ASU 2016-09, we have elected to account for forfeitures as they occur instead of estimating the number of awards expected to be forfeited and adjusting the estimate when it is no longer probable that the employee will fulfill the service condition. We adopted this provision in our first quarter of fiscal 2018 which resulted in a cumulative-effect adjustment to accumulated deficit of
$0.4 million
, net of tax, as of the date of adoption. Additionally, upon adoption of ASU 2016-09, on a modified retrospective basis, the previously unrecognized excess tax benefits of
$0.9 million
as of
July 31, 2017
were recorded as an increase to our U.S. federal and state deferred tax assets, which was fully offset by our valuation allowance. Prospectively, all excess tax benefits and deficiencies will be recognized in the income statement as a component of our income tax expense or benefit. Further, we will present excess tax benefits as an operating activity in the consolidated statements of cash flows on a prospective basis. The net excess tax benefits related to equity awards was not material for fiscal
2018
.
We also assess the impact of recording stock-based compensation expense when certain of our affiliated stockholders purchase shares from our employees in excess of fair value of such shares. We recognize any such excess value as stock-based compensation expense in our consolidated statements of operations. During fiscal 2017, we recorded $4.4 million in stock-based compensation expense from a one-time secondary stock purchase transaction that was executed among certain of our employees and certain of our affiliated stockholders, including entities controlled by Jay Chaudhry, our president, chief executive officer and chairman of the board of directors, and Lane Bess, a member of our board of directors. Stock-based compensation expense related to non-employee stock options was immaterial to our consolidated statements of operations for the periods presented.
Our use of the Black-Scholes option pricing model to estimate the fair value of stock options requires the input of highly subjective assumptions. The assumptions used to determine the fair value of the option awards represent management’s best estimates. These estimates involve inherent uncertainties and the application of management’s judgment.
These assumptions and estimates are as follows:
|
•
|
Fair Value of Common Stock.
Prior to our IPO, t
he fair value of the common stock underlying our stock options was determined by our board of directors, after considering contemporaneous third-party valuations and input from management.
Our board of directors considered this independent valuations and other factors, including, but not limited to, expected operating and financial performance, our stage of development, current business conditions and projections, history and the timing of the introduction of new services, our financial condition and market performance of comparable publicly traded companies to establish the fair value of our common stock at the time of grant of the option.
The valuations of our common stock were determined in accordance with the guidelines outlined in the American Institute of Certified Public Accountants Practice Aid,
Valuation of Privately-Held-Company Equity Securities Issued as Compensation.
After the IPO, we used the publicly quoted price as reported on The Nasdaq Global Select Market as the fair value of our common stock.
|
|
•
|
Expected Term.
The expected term represents the period that our stock-based awards are expected to be outstanding. The expected term assumptions were determined based on the vesting terms, exercise terms and contractual lives of the options. The expected term was estimated using the simplified method allowed under SEC guidance.
|
|
•
|
Volatility.
Since we do not have sufficient trading history of our common stock, the expected volatility is determined primarily based on the historical stock volatilities of our comparable
publicly-traded companies.
Comparable companies consist of public companies in our industry, which are similar in size, stage of life cycle and financial leverage.
|
76
|
•
|
Risk-Free Interest Rate.
We base the risk-free interest rate used in the Black-Scholes option pricing model on the implied yield available on U.S. Treasury zero-coupon issues with a remaining term equivalent to that of the options for each expected term.
|
|
•
|
Dividend Yield.
The expected dividend assumption is based on our current expectations about our anticipated dividend policy. As we have no history of paying any dividends, we used an expected dividend yield of zero.
|
We estimated the fair value of employee stock options using the Black-Scholes option pricing model with the following assumptions:
|
Year Ended July 31,
|
|||||
|
2018
|
2017
|
2016
|
|||
|
Expected term (in years)
|
4.6 - 5.1
|
4.6
|
4.6
|
||
|
Expected stock price volatility
|
40.3% - 42.3%
|
41.4% - 43.3%
|
43.6% - 45.2%
|
||
|
Risk-free interest rate
|
1.7% - 2.8%
|
1.1% - 2.0%
|
1.1% - 1.6%
|
||
|
Dividend yield
|
0.0%
|
0.0%
|
0.0%
|
||
The fair value of the purchase rights granted under the ESPP was estimated on the date of grant using the Black-Scholes option pricing model with the following assumptions:
|
Year Ended July 31, 2018
|
|
|
Expected term (in years)
|
0.5 - 2.3
|
|
Expected stock price volatility
|
30.7% - 53.2%
|
|
Risk-free interest rate
|
2.0% - 2.6%
|
|
Dividend yield
|
0.0%
|
Income Taxes
We are subject to federal, state and local taxes in the United States as well as in other tax jurisdictions or countries in which we conduct business. Earnings generated by our non-U.S. activities are related to applicable transfer pricing requirements under local country income tax laws. We account for uncertain tax positions based on those positions taken or expected to be taken in a tax return. We determine if the amount of available support indicates that it is more likely than not that the tax position will be sustained on audit, including resolution of any related appeals or litigation processes. We then measure the tax benefit as the largest amount that is more than 50% likely to be realized upon settlement.
We have a full valuation allowance for our net deferred tax assets generated from our U.S. operations. We will continue to assess the need for such valuation allowance on our deferred tax assets by evaluating both positive and negative evidence that may exist. Any adjustment to the deferred tax asset valuation allowance would be recorded in the periods in which the adjustment is determined to be required.
On December 22, 2017, the Tax Cuts and Jobs Act of 2017, or the Tax Act, was enacted. The Tax Act contains several key tax provisions that affect us, including, but not limited to, reducing the U.S. federal corporate tax rate, imposing a one-time mandatory repatriation tax on previously untaxed foreign earnings, and changing rules related to the use of net operating loss carryforwards created in tax years beginning after December 31, 2017. We expect to complete our assessment of the impacts of the Tax Act including the remeasurement of our deferred taxes, the one-time mandatory transition tax, and the policy decision regarding whether to record deferred taxes associated with GILTI within the measurement period provided by SAB 118. Our assessment of the impact of the Tax Act may differ from our provisional assessment during the measurement
77
period due to, among other things, further refinement in our calculations, changes in interpretations and assumptions we have made, or guidance that may be issued.
We currently maintain a full valuation allowance recorded against our U.S. federal deferred tax assets. As such, the remeasurement of our deferred tax assets was offset by the change in our valuation allowance which resulted in no income tax expense or benefit. Because of our full valuation allowance and current year losses, there is no tax expense associated with the one-time mandatory transition tax.
JOBS Act Extended Transition Period
We are an emerging growth company, as defined in the JOBS Act. Under the JOBS Act, emerging growth companies can delay adopting new or revised accounting standards issued subsequent to the enactment of the Act until such time as those standards apply to private companies. We have irrevocably elected not to avail ourselves of this exemption from new or revised accounting standards and, therefore, we will be subject to the same new or revised accounting standards as other public companies that are not emerging growth companies.
Recently Issued Accounting Pronouncements
Refer to Note 1. Business and Summary of Significant Accounting Policies to our consolidated financial statements included elsewhere in this
Annual Report on Form 10-K
for more information regarding recently issued accounting pronouncements.
We have operations in the United States and internationally, and we are exposed to market risk in the ordinary course of our business.
Interest Rate Risk
As of
July 31, 2018
, we had cash, cash equivalents and short-term investments totaling
$298.5 million
, which were held for working capital purposes. Our cash equivalents and investments consist of highly liquid investments in money market funds, U.S. treasury securities, U.S. government agency securities and corporate debt securities.
The primary objectives of our investment activities are the preservation of capital, the fulfillment of liquidity needs and the fiduciary control of cash and investments.
We do not enter into investments for trading or speculative purposes.
The carrying amount of our cash equivalents reasonably approximates fair value, due to the short maturities of these instruments. Our investments are exposed to market risk due to a fluctuation in interest rates, which may affect our interest income and the fair market value of our investments. As
July 31, 2018
,
the effect of a hypothetical 100 basis points change in interest rates would have changed the fair value of our investments in available-for-sale securities by
$1.3 million
. Fluctuations in the fair value of our investments in available-for-sale securities caused by a change in interest rates (gains or losses on the carrying amount) are recorded in other comprehensive loss, and are realized only if we sell the underlying securities prior to maturity.
Foreign Currency Risk
The vast majority of our sales contracts are denominated in U.S. dollars, with a small number of contracts denominated in foreign currencies. A portion of our operating expenses are incurred outside the United States, denominated in foreign currencies and subject to fluctuations due to changes in foreign currency exchange rates, particularly changes in the British Pound, Indian Rupee and Euro. Additionally, fluctuations in foreign currency exchange rates may cause us to recognize transaction gains and losses in our consolidated statements of operations.
The effect of a hypothetical 10% change in foreign currency exchange rates applicable to our business would not have a material impact on our historical consolidated financial statements for fiscal
2018
,
2017
and
2016
.
As the impact of foreign currency exchange rates has not been material to our historical operating results, we
78
have not entered into derivative or hedging transactions, but we may do so in the future if our exposure to foreign currency becomes more significant.
79
Index to Consolidated Financial Statements
|
Page
|
|
80
REPORT OF INDEPENDENT REGISTERED PUBLIC ACCOUNTING FIRM
To the Board of Directors and Stockholders of Zscaler, Inc.
Opinion on the Financial Statements
We have audited the accompanying consolidated
balance sheets of Zscaler, Inc. and its subsidiaries as of July 31, 2018 and 2017, and the related consolidated statements of operations, of comprehensive loss, of redeemable convertible preferred stock and stockholders’ equity (deficit), and of cash flows for each of the three years in the period ended July 31, 2018, including the related notes (collectively referred to as the "consolidated
financial statements"). In our opinion, the consolidated financial statements present fairly, in all material respects, the financial position of the Company
as of July 31, 2018
and 2017, and the results of their operations and their cash flows for each of the three years in the period ended July 31, 2018
in conformity with accounting principles generally accepted in the United States of America.
Basis for Opinion
These consolidated
financial statements are the responsibility of the Company’s management. Our responsibility is to express an opinion on the Company’s consolidated financial statements based on our audits. We are a public accounting firm registered with the Public Company Accounting Oversight Board (United States) ("PCAOB") and are required to be independent with respect to the Company in accordance with the U.S. federal securities laws and the applicable rules and regulations of the Securities and Exchange Commission and the PCAOB.
We conducted our audits of these consolidated
financial statements in accordance with the standards of the PCAOB. Those standards require that we plan and perform the audit to obtain reasonable assurance about whether the consolidated financial statements are free of material misstatement, whether due to error or fraud.
Our audits included performing procedures to assess the risks of material misstatement of the consolidated
financial statements, whether due to error or fraud, and performing procedures that respond to those risks. Such procedures included examining, on a test basis, evidence regarding the amounts and disclosures in the consolidated
financial statements. Our audits also included evaluating the accounting principles used and significant estimates made by management, as well as evaluating the overall presentation of the consolidated
financial statements. We believe that our audits provide a reasonable basis for our opinion.
|
/s/
|
PricewaterhouseCoopers LLP
|
|
San Jose, California
|
|
|
September 13, 2018
|
|
|
We have served as the Company's auditor since 2015.
|
|
81
ZSCALER, INC.
(in thousands, except per share data)
|
July 31,
|
|||||||
|
2018
|
2017
|
||||||
|
Assets
|
|||||||
|
Current assets:
|
|||||||
|
Cash and cash equivalents
|
$
|
135,579
|
|
$
|
87,978
|
|
|
|
Short-term investments
|
162,960
|
|
—
|
|
|||
|
Accounts receivable, net
|
61,611
|
|
39,052
|
|
|||
|
Deferred contract acquisition costs
|
16,136
|
|
10,469
|
|
|||
|
Prepaid expenses and other current assets
|
10,878
|
|
5,410
|
|
|||
|
Total current assets
|
387,164
|
|
142,909
|
|
|||
|
Property and equipment, net
|
19,765
|
|
13,139
|
|
|||
|
Deferred contract acquisition costs, noncurrent
|
39,774
|
|
24,193
|
|
|||
|
Other noncurrent assets
|
1,078
|
|
2,661
|
|
|||
|
Total assets
|
$
|
447,781
|
|
$
|
182,902
|
|
|
|
Liabilities, Redeemable Convertible Preferred Stock and Stockholders’ Equity (Deficit)
|
|||||||
|
Current liabilities:
|
|||||||
|
Accounts payable
|
$
|
4,895
|
|
$
|
3,763
|
|
|
|
Accrued expenses and other current liabilities
|
12,313
|
|
11,648
|
|
|||
|
Accrued compensation
|
23,393
|
|
11,608
|
|
|||
|
Liability for early exercised stock options
|
1,561
|
|
7,972
|
|
|||
|
Deferred revenue
|
140,670
|
|
85,468
|
|
|||
|
Total current liabilities
|
182,832
|
|
120,459
|
|
|||
|
Deferred revenue, noncurrent
|
23,353
|
|
11,151
|
|
|||
|
Other noncurrent liabilities
|
1,360
|
|
1,457
|
|
|||
|
Total liabilities
|
207,545
|
|
133,067
|
|
|||
|
Commitments and contingencies (Note 5)
|
|
|
|||||
|
Redeemable Convertible Preferred Stock
|
|||||||
|
Redeemable convertible preferred stock; $0.001 par value; no shares and 73,100 shares authorized as of July 31, 2018 and 2017, respectively; no shares and 72,501 shares issued and outstanding as of July 31, 2018 and 2017, respectively; aggregate liquidation preference of $0 and $201,376 as of July 31, 2018 and 2017, respectively
|
—
|
|
200,977
|
|
|||
|
Stockholders’ Equity (Deficit)
|
|||||||
|
Preferred stock; $0.001 par value; 200,000 and 73,100 shares authorized as of July 31, 2018 and 2017, respectively; no shares issued and outstanding as of July 31, 2018 and 2017
|
—
|
|
—
|
|
|||
|
Common stock; $0.001 par value; 1,000,000 and 130,000 shares authorized as of July 31, 2018 and 2017, respectively; 119,764 and 32,359 shares issued and outstanding as of July 31, 2018 and 2017, respectively
|
119
|
|
18
|
|
|||
|
Additional paid-in capital
|
438,392
|
|
18,734
|
|
|||
|
Notes receivable from stockholders
|
(2,051
|
)
|
(7,878
|
)
|
|||
|
Accumulated other comprehensive loss
|
(124
|
)
|
—
|
|
|||
|
Accumulated deficit
|
(196,100
|
)
|
(162,016
|
)
|
|||
|
Total stockholders’ equity (deficit)
|
240,236
|
|
(151,142
|
)
|
|||
|
Total liabilities, redeemable convertible preferred stock and stockholders’ equity (deficit)
|
$
|
447,781
|
|
$
|
182,902
|
|
|
The accompanying notes are an integral part of these consolidated financial statements.
82
ZSCALER, INC.
Consolidated Statements of Operations
(in thousands, except per share data)
|
Year Ended July 31,
|
||||||||||||
|
2018
|
2017
|
2016
|
||||||||||
|
Revenue
|
$
|
190,174
|
|
$
|
125,717
|
|
$
|
80,325
|
|
|||
|
Cost of revenue
|
37,875
|
|
27,472
|
|
20,127
|
|
||||||
|
Gross profit
|
152,299
|
|
98,245
|
|
60,198
|
|
||||||
|
Operating expenses:
|
||||||||||||
|
Sales and marketing
|
116,409
|
|
79,236
|
|
56,702
|
|
||||||
|
Research and development
|
39,379
|
|
33,561
|
|
20,940
|
|
||||||
|
General and administrative
|
31,135
|
|
20,521
|
|
9,399
|
|
||||||
|
Total operating expenses
|
186,923
|
|
133,318
|
|
87,041
|
|
||||||
|
Loss from operations
|
(34,624
|
)
|
(35,073
|
)
|
(26,843
|
)
|
||||||
|
Interest income, net
|
2,236
|
|
597
|
|
289
|
|
||||||
|
Other income (expense), net
|
79
|
|
(107
|
)
|
(416
|
)
|
||||||
|
Loss before income taxes
|
(32,309
|
)
|
(34,583
|
)
|
(26,970
|
)
|
||||||
|
Provision for income taxes
|
1,337
|
|
877
|
|
468
|
|
||||||
|
Net loss
|
$
|
(33,646
|
)
|
$
|
(35,460
|
)
|
$
|
(27,438
|
)
|
|||
|
Accretion of Series C and D redeemable convertible preferred stock
|
(6,332
|
)
|
(9,570
|
)
|
(8,648
|
)
|
||||||
|
Net loss attributable to common stockholders
|
$
|
(39,978
|
)
|
$
|
(45,030
|
)
|
$
|
(36,086
|
)
|
|||
|
Net loss per share attributable to common stockholders, basic and diluted
|
$
|
(0.63
|
)
|
$
|
(1.54
|
)
|
$
|
(1.36
|
)
|
|||
|
Weighted-average shares used in computing net loss per share attributable to common stockholders, basic and diluted
|
63,881
|
|
29,221
|
|
26,521
|
|
||||||
The accompanying notes are an integral part of these consolidated financial statements.
83
ZSCALER, INC.
Consolidated Statements of Comprehensive Loss
(in thousands)
|
Year Ended July 31,
|
||||||||||||
|
2018
|
2017
|
2016
|
||||||||||
|
Net loss
|
$
|
(33,646
|
)
|
$
|
(35,460
|
)
|
$
|
(27,438
|
)
|
|||
|
Other comprehensive loss, net of tax:
|
||||||||||||
|
Unrealized net losses on available-for-sale securities
|
(124
|
)
|
—
|
|
—
|
|
||||||
|
Other comprehensive loss
|
(124
|
)
|
—
|
|
—
|
|
||||||
|
Comprehensive loss
|
$
|
(33,770
|
)
|
$
|
(35,460
|
)
|
$
|
(27,438
|
)
|
|||
The accompanying notes are an integral part of these consolidated financial statements.
84
ZSCALER, INC.
Consolidated Statements of Redeemable Convertible Preferred Stock and Stockholders’ Equity (Deficit)
(in thousands)
|
Redeemable
Convertible Preferred Stock |
Common Stock
|
Additional
Paid-In Capital |
Notes
Receivable From Stockholders |
Accumulated Other Comprehensive Loss
|
Accumulated
Deficit |
Total
Stockholders’ Equity
(Deficit)
|
||||||||||||||||||||||||||||
|
Shares
|
Amount
|
Shares
|
Amount
|
|||||||||||||||||||||||||||||||
|
Balance as of July 31, 2015
|
69,712
|
|
$
|
157,802
|
|
29,474
|
|
$
|
13
|
|
$
|
12,895
|
|
$
|
(9,122
|
)
|
$
|
—
|
|
$
|
(99,118
|
)
|
$
|
(95,332
|
)
|
|||||||||
|
Issuance of preferred stock, net of issuance costs of $43
|
2,789
|
|
24,957
|
|
—
|
|
—
|
|
—
|
|
—
|
|
—
|
|
—
|
|
—
|
|
||||||||||||||||
|
Accretion of Series C and D redeemable convertible preferred stock
|
—
|
|
8,648
|
|
—
|
|
—
|
|
(8,648
|
)
|
—
|
|
—
|
|
—
|
|
(8,648
|
)
|
||||||||||||||||
|
Issuance of common stock upon exercise of stock options
|
—
|
|
—
|
|
848
|
|
1
|
|
990
|
|
—
|
|
—
|
|
—
|
|
991
|
|
||||||||||||||||
|
Issuance of common stock related to early exercised stock options
|
—
|
|
—
|
|
1,260
|
|
—
|
|
—
|
|
—
|
|
—
|
|
—
|
|
—
|
|
||||||||||||||||
|
Repurchases of unvested common stock
|
—
|
|
—
|
|
(1,251
|
)
|
—
|
|
—
|
|
2,931
|
|
—
|
|
—
|
|
2,931
|
|
||||||||||||||||
|
Repayments of notes receivable from stockholders
|
—
|
|
—
|
|
—
|
|
—
|
|
—
|
|
833
|
|
—
|
|
—
|
|
833
|
|
||||||||||||||||
|
Additions to notes receivable related to early exercised stock options
|
—
|
|
—
|
|
—
|
|
—
|
|
—
|
|
(4,556
|
)
|
—
|
|
—
|
|
(4,556
|
)
|
||||||||||||||||
|
Vesting of early exercised stock options
|
—
|
|
—
|
|
—
|
|
2
|
|
2,860
|
|
—
|
|
—
|
|
—
|
|
2,862
|
|
||||||||||||||||
|
Stock-based compensation
|
—
|
|
—
|
|
—
|
|
—
|
|
3,617
|
|
—
|
|
—
|
|
—
|
|
3,617
|
|
||||||||||||||||
|
Net loss
|
—
|
|
—
|
|
—
|
|
—
|
|
—
|
|
—
|
|
—
|
|
(27,438
|
)
|
(27,438
|
)
|
||||||||||||||||
|
Balance as of July 31, 2016
|
72,501
|
|
191,407
|
|
30,331
|
|
16
|
|
11,714
|
|
(9,914
|
)
|
—
|
|
(126,556
|
)
|
(124,740
|
)
|
||||||||||||||||
|
Accretion of Series C and D redeemable convertible preferred stock
|
—
|
|
9,570
|
|
—
|
|
—
|
|
(9,570
|
)
|
—
|
|
—
|
|
—
|
|
(9,570
|
)
|
||||||||||||||||
|
Issuance of common stock upon exercise of stock options
|
—
|
|
—
|
|
1,347
|
|
1
|
|
2,970
|
|
—
|
|
—
|
|
—
|
|
2,971
|
|
||||||||||||||||
|
Issuance of common stock related to early exercised stock options
|
—
|
|
—
|
|
781
|
|
—
|
|
—
|
|
—
|
|
—
|
|
—
|
|
—
|
|
||||||||||||||||
|
Repurchases of unvested common stock
|
—
|
|
—
|
|
(100
|
)
|
—
|
|
—
|
|
263
|
|
—
|
|
—
|
|
263
|
|
||||||||||||||||
|
Repayments of notes receivable from stockholders
|
—
|
|
—
|
|
—
|
|
—
|
|
—
|
|
1,856
|
|
—
|
|
—
|
|
1,856
|
|
||||||||||||||||
|
Additions to notes receivable related to early exercised stock options
|
—
|
|
—
|
|
—
|
|
—
|
|
—
|
|
(83
|
)
|
—
|
|
—
|
|
(83
|
)
|
||||||||||||||||
|
Vesting of early exercised stock options
|
—
|
|
—
|
|
—
|
|
1
|
|
3,701
|
|
—
|
|
—
|
|
—
|
|
3,702
|
|
||||||||||||||||
|
Stock-based compensation
|
—
|
|
—
|
|
—
|
|
—
|
|
9,919
|
|
—
|
|
—
|
|
—
|
|
9,919
|
|
||||||||||||||||
|
Net loss
|
—
|
|
—
|
|
—
|
|
—
|
|
—
|
|
—
|
|
—
|
|
(35,460
|
)
|
(35,460
|
)
|
||||||||||||||||
|
Balance as of July 31, 2017
|
72,501
|
|
200,977
|
|
32,359
|
|
18
|
|
18,734
|
|
(7,878
|
)
|
—
|
|
(162,016
|
)
|
(151,142
|
)
|
||||||||||||||||
|
Cumulative effect of accounting change
|
—
|
|
—
|
|
—
|
|
—
|
|
438
|
|
—
|
|
—
|
|
(438
|
)
|
—
|
|
||||||||||||||||
|
Accretion of Series C and D redeemable convertible preferred stock
|
—
|
|
6,332
|
|
—
|
|
—
|
|
(6,332
|
)
|
—
|
|
—
|
|
—
|
|
(6,332
|
)
|
||||||||||||||||
|
Issuance of common stock upon exercise of stock options
|
—
|
|
—
|
|
1,712
|
|
2
|
|
4,983
|
|
—
|
|
—
|
|
—
|
|
4,985
|
|
||||||||||||||||
|
Issuance of common stock related to early exercised stock options
|
—
|
|
—
|
|
180
|
|
—
|
|
—
|
|
—
|
|
—
|
|
—
|
|
—
|
|
||||||||||||||||
|
Repurchases of unvested common stock
|
—
|
|
—
|
|
(788
|
)
|
—
|
|
—
|
|
214
|
|
—
|
|
—
|
|
214
|
|
||||||||||||||||
|
Repayments of notes receivable from stockholders
|
—
|
|
—
|
|
—
|
|
—
|
|
—
|
|
5,346
|
|
—
|
|
—
|
|
5,346
|
|
||||||||||||||||
|
Accrued interest on notes receivable from stockholders, net of repayments
|
—
|
|
—
|
|
—
|
|
—
|
|
—
|
|
267
|
|
—
|
|
—
|
|
267
|
|
||||||||||||||||
|
Vesting of early exercised stock options
|
—
|
|
—
|
|
—
|
|
12
|
|
3,243
|
|
—
|
|
—
|
|
—
|
|
3,255
|
|
||||||||||||||||
|
Issuance of common stock upon initial public offering, net of underwriting discounts of $15,456 and issuance costs of $6,464
|
—
|
|
—
|
|
13,800
|
|
14
|
|
198,866
|
|
—
|
|
—
|
|
—
|
|
198,880
|
|
||||||||||||||||
|
Conversion of redeemable convertible preferred stock to common stock upon initial public offering
|
(72,501
|
)
|
(207,309
|
)
|
72,501
|
|
73
|
|
207,236
|
|
—
|
|
—
|
|
—
|
|
207,309
|
|
||||||||||||||||
|
Stock-based compensation
|
—
|
|
—
|
|
—
|
|
—
|
|
11,224
|
|
—
|
|
—
|
|
—
|
|
11,224
|
|
||||||||||||||||
|
Other comprehensive loss
|
—
|
|
—
|
|
—
|
|
—
|
|
—
|
|
—
|
|
(124
|
)
|
—
|
|
(124
|
)
|
||||||||||||||||
|
Net loss
|
—
|
|
—
|
|
—
|
|
—
|
|
—
|
|
—
|
|
—
|
|
(33,646
|
)
|
(33,646
|
)
|
||||||||||||||||
|
Balance as of July 31, 2018
|
—
|
|
$
|
—
|
|
119,764
|
|
$
|
119
|
|
$
|
438,392
|
|
$
|
(2,051
|
)
|
$
|
(124
|
)
|
$
|
(196,100
|
)
|
$
|
240,236
|
|
|||||||||
The accompanying notes are an integral part of these consolidated financial statements.
85
ZSCALER, INC.
(in thousands)
|
Year Ended July 31,
|
|||||||||||
|
|
2018
|
2017
|
2016
|
||||||||
|
Cash Flows From Operating Activities
|
|||||||||||
|
Net loss
|
$
|
(33,646
|
)
|
$
|
(35,460
|
)
|
$
|
(27,438
|
)
|
||
|
Adjustments to reconcile net loss to cash provided by (used in) operating activities:
|
|||||||||||
|
Depreciation and amortization expense
|
7,988
|
|
6,840
|
|
4,872
|
|
|||||
|
Amortization of deferred contract acquisition costs
|
13,181
|
|
8,474
|
|
5,515
|
|
|||||
|
Stock-based compensation expense
|
11,224
|
|
9,919
|
|
3,617
|
|
|||||
|
Other
|
130
|
|
(89
|
)
|
(59
|
)
|
|||||
|
Changes in operating assets and liabilities:
|
|||||||||||
|
Accounts receivable
|
(22,559
|
)
|
(14,563
|
)
|
(6,188
|
)
|
|||||
|
Deferred contract acquisition costs
|
(34,429
|
)
|
(21,999
|
)
|
(13,502
|
)
|
|||||
|
Prepaid expenses and other assets
|
(5,068
|
)
|
(2,718
|
)
|
(115
|
)
|
|||||
|
Accounts payable
|
(779
|
)
|
2,249
|
|
563
|
|
|||||
|
Accrued expenses and other liabilities
|
2,076
|
|
5,376
|
|
2,085
|
|
|||||
|
Accrued compensation
|
11,785
|
|
5,246
|
|
2,601
|
|
|||||
|
Deferred revenue
|
67,404
|
|
30,706
|
|
16,133
|
|
|||||
|
Net cash provided by (used in) operating activities
|
17,307
|
|
(6,019
|
)
|
(11,916
|
)
|
|||||
|
Cash Flows From Investing Activities
|
|||||||||||
|
Purchases of property and equipment
|
(13,397
|
)
|
(7,783
|
)
|
(5,402
|
)
|
|||||
|
Capitalized internal-use software
|
(1,773
|
)
|
(391
|
)
|
(845
|
)
|
|||||
|
Change in restricted cash
|
—
|
|
(168
|
)
|
(400
|
)
|
|||||
|
Purchases of short-term investments
|
(163,366
|
)
|
—
|
|
—
|
|
|||||
|
Other
|
433
|
|
—
|
|
—
|
|
|||||
|
Net cash used in investing activities
|
(178,103
|
)
|
(8,342
|
)
|
(6,647
|
)
|
|||||
|
Cash Flows From Financing Activities
|
|||||||||||
|
Proceeds from initial public offering, net of underwriting discounts and commissions
|
205,344
|
|
—
|
|
—
|
|
|||||
|
Payments of costs related to initial public offering
|
(4,336
|
)
|
(31
|
)
|
—
|
|
|||||
|
Proceeds from issuance of preferred stock, net of issuance costs
|
—
|
|
—
|
|
24,957
|
|
|||||
|
Proceeds from issuance of common stock upon exercise of stock options
|
4,985
|
|
2,971
|
|
991
|
|
|||||
|
Proceeds from issuance of common stock related to early exercised stock options
|
869
|
|
4,701
|
|
782
|
|
|||||
|
Repurchases of unvested common stock
|
(3,811
|
)
|
—
|
|
—
|
|
|||||
|
Repayments of notes receivable from stockholders
|
5,346
|
|
1,856
|
|
833
|
|
|||||
|
Net cash provided by financing activities
|
208,397
|
|
9,497
|
|
27,563
|
|
|||||
|
Net increase (decrease) in cash and cash equivalents
|
47,601
|
|
(4,864
|
)
|
9,000
|
|
|||||
|
Cash and cash equivalents, beginning of period
|
87,978
|
|
92,842
|
|
83,842
|
|
|||||
|
Cash and cash equivalents, end of period
|
$
|
135,579
|
|
$
|
87,978
|
|
$
|
92,842
|
|
||
|
Supplemental Disclosure of Cash Flow Information:
|
|||||||||||
|
Cash paid for income taxes
|
$
|
870
|
|
$
|
385
|
|
$
|
319
|
|
||
|
Supplemental Disclosure of Noncash Investing and Financing Activities:
|
|||||||||||
|
Conversion of redeemable convertible preferred stock to common stock
|
$
|
207,309
|
|
$
|
—
|
|
$
|
—
|
|
||
|
Net change in purchases of equipment, accrued but not paid
|
$
|
(537
|
)
|
$
|
746
|
|
$
|
142
|
|
||
|
Accretion of Series C and D redeemable convertible preferred stock
|
$
|
6,332
|
|
$
|
9,570
|
|
$
|
8,648
|
|
||
|
Issuance of notes receivable related to early exercised stock options
|
$
|
—
|
|
$
|
—
|
|
$
|
4,373
|
|
||
|
Repurchases of unvested common stock
|
$
|
214
|
|
$
|
263
|
|
$
|
2,931
|
|
||
|
Vesting of early exercised common stock options
|
$
|
3,255
|
|
$
|
3,702
|
|
$
|
2,862
|
|
||
|
Net change in deferred offering costs, accrued but not paid
|
$
|
940
|
|
$
|
1,157
|
|
$
|
—
|
|
||
|
Capitalized leasehold improvements paid directly by landlord
|
$
|
—
|
|
$
|
—
|
|
$
|
1,491
|
|
||
The accompanying notes are an integral part of these consolidated financial statements.
86
ZSCALER, INC.
Notes to Consolidated Financial Statements
Business
Zscaler, Inc. ("Zscaler," the "Company," "we," "us," or "our") is a cloud security company that developed a platform incorporating core security functionalities needed to enable users to safely utilize authorized applications and services based on an organization’s policies. Our solution is a purpose-built, multi-tenant, distributed cloud security platform that secures access for users and devices to applications and services, regardless of location. We deliver our solutions using a software-as-a-service ("SaaS") business model and sell subscriptions to customers to access our cloud platform, together with related support services. We were incorporated in Delaware in September 2007 and conduct business worldwide, with presence in North America, Europe and Asia. Our headquarters are located in San Jose, California.
Reverse Stock Split
In March 2018, our board of directors approved an amendment to the Company’s amended and restated certificate of incorporation effecting a 2-for-3 reverse stock split of the Company’s issued and outstanding shares of common stock and convertible preferred stock. The reverse stock split was effected on March 1, 2018. The par value of the common stock and the convertible preferred stock was not adjusted as a result of the reverse stock split. All issued and outstanding share and per share amounts included in the accompanying consolidated financial statements have been adjusted to reflect this reverse stock split for all periods presented.
Initial Public Offering
In March 2018, we completed our initial public offering ("IPO") of common stock, in which we sold
13,800,000
shares. The shares were sold at an IPO price of
$16.00
per share for net proceeds of
$205.3 million
, after deducting underwriters' discounts and commissions of
$15.5 million
. In connection with the IPO, we incurred offering costs of
$6.5 million
which were recorded within stockholders’ equity (deficit) as a reduction of the net proceeds received from the IPO. Immediately prior to the closing of the IPO, all our outstanding shares of convertible preferred stock were automatically converted into
72,500,750
shares of common stock on a
one
-to-one basis.
Fiscal Year
Our fiscal year ends on July 31. References to fiscal
2018
, for example, refer to our fiscal year ended
July 31, 2018
.
Principles of Consolidation
The accompanying consolidated financial statements include the accounts of the Company and its wholly owned subsidiaries and have been prepared in conformity with accounting principles generally accepted in the United States ("U.S. GAAP"). All intercompany balances and transactions have been eliminated in consolidation.
Use of Estimates
The preparation of consolidated financial statements in conformity with U.S. GAAP requires management to make estimates, judgments and assumptions that affect the amounts reported and disclosed in the financial statements and accompanying notes. Such estimates include, but are not limited to, the determination of revenue recognition, deferred revenue, deferred contract acquisition costs, the period of benefit generated from our deferred contract acquisition costs, allowance for doubtful accounts,
87
valuation of common stock options and stock-based awards, useful lives of property and equipment, loss contingencies related to litigation and valuation of deferred tax assets. Management determines these estimates and assumptions on historical experience and on various other assumptions that are believed to be reasonable. Actual results could differ significantly from these estimates, and such differences may be material to the consolidated financial statements.
Foreign Currency
The functional currency of our foreign subsidiaries is the U.S. dollar. Accordingly, monetary assets and liabilities of our foreign subsidiaries are re-measured into U.S. dollars at the exchange rates in effect at the reporting date, non-monetary assets and liabilities are re-measured at historical rates, revenue and expenses are re-measured at average exchange rates in effect during each reporting period. Foreign currency transaction gains and losses are recorded in other income (expense), net in the consolidated statements of operations. We recognized re-measurement losses of
$0.1
million,
$0.1
million and
$0.3
million for fiscal
2018
,
2017
and
2016
, respectively.
JOBS Act Extended Transition Period
We are an emerging growth company ("EGC") as defined in the Jumpstart Our Business Startups Act of 2012 ("JOBS Act"). An EGC may take advantage of specified reduced reporting requirements that are otherwise applicable generally to public companies, including, but not limited to, delayed adoption of new or revised accounting pronouncements applicable to public companies until such pronouncements are made applicable to private companies, not being required to comply with the auditor attestation requirements of Section 404 of the Sarbanes-Oxley Act of 2002 ("Sarbanes-Oxley Act"), reduced disclosure obligations regarding executive compensation in our periodic reports and proxy statements, and exemptions from the requirements of holding a nonbinding advisory vote on executive compensation and stockholder approval of any golden parachute payments not previously approved.
We have irrevocably elected not to avail ourselves of the extended transition periods available under the JOBS Act for complying with new and revised accounting standards and, therefore, we will be subject to the same new or revised accounting standards as other public companies that are not emerging growth companies, but we intend to take advantage of the other exemptions discussed above.
We may take advantage of the extended transition period until we are no longer an EGC. We would cease to be an EGC upon the earliest to occur of: (i) the first fiscal year following the fifth anniversary of our IPO; (ii) the first fiscal year after our annual gross revenue is
$1.07 billion
or more; (iii) the date on which we have, during the previous three-year period, issued more than
$1.0 billion
in non-convertible debt securities; or (iv) as of the end of any fiscal year in which the market value of our common stock held by non-affiliates exceeded
$700.0 million
as of the end of the second quarter of that fiscal year.
Concentration of Risks
We generate revenue primarily from sale of subscriptions to access our cloud platform, together with related support services. Our sales team, along with our channel partner network of global telecommunications service providers, system integrators and value-added resellers (collectively "channel partners"), sells our services worldwide to organizations of all sizes. Due to the nature of our services and the terms and conditions of our contracts with our channel partners, our business could be affected unfavorably if we are not able to continue our relationships with them.
Our financial instruments that are exposed to concentrations of credit risk consist primarily of cash, cash equivalents, short-term investments and accounts receivable. Although we deposit our cash with multiple financial institutions, the deposits, at times, may exceed federally insured limits. Cash equivalents and short-term investments consist of highly liquid investments in money market funds, U.S. treasury, U.S. agency securities and corporate debt securities, which are invested through financial institutions in the United States.
88
We grant credit to our customers in the normal course of business. We monitor the financial condition of our customers to reduce credit risk.
The following table summarizes the concentration of 10% or more of the total balance of accounts receivable, net:
|
July 31,
|
|||||
|
2018
|
2017
|
||||
|
Channel partner A
|
13
|
%
|
*
|
|
|
|
Channel partner B
|
13
|
%
|
*
|
|
|
|
Channel partner C
|
*
|
|
17
|
%
|
|
|
Channel partner D
|
*
|
|
10
|
%
|
|
|
Channel partner E
|
*
|
|
15
|
%
|
|
_____________
* Represents less than 10%.
No single customer accounted for 10% or more of revenue in fiscal
2018
,
2017
and
2016
.
Segment Information
We operate as
one
reportable and operating segment. Our chief operating decision maker is our chief executive officer, who reviews financial information presented on a consolidated basis for purposes of making operating decisions, assessing financial performance and allocating resources.
Revenue Recognition
We have adopted Accounting Standards Codification ("ASC") Topic 606, Revenue From Contracts With Customers ("ASC 606"), effective as of August 1, 2017, using the full retrospective transition method. Under this method, we are presenting the consolidated financial statements for fiscal 2016, as if ASC 606 had been effective for that period as well.
In accordance with ASC 606, revenue is recognized when a customer obtains control of promised services. The amount of revenue recognized reflects the consideration that we expect to be entitled to receive in exchange for these services. To achieve the core principle of this standard, we apply the following five steps:
1) Identify the contract with a customer
We consider the terms and conditions of the contracts and our customary business practices in identifying our contracts under ASC 606. We determine we have a contract with a customer when the contract is approved, we can identify each party’s rights regarding the services to be transferred, we can identify the payment terms for the services, we have determined the customer has the ability and intent to pay and the contract has commercial substance. We apply judgment in determining the customer’s ability and intent to pay, which is based on a variety of factors, including the customer’s historical payment experience or, in the case of a new customer, credit and financial information pertaining to the customer.
2) Identify the performance obligations in the contract
Performance obligations promised in a contract are identified based on the services that will be transferred to the customer that are both capable of being distinct, whereby the customer can benefit from the service either on its own or together with other resources that are readily available from third parties or from us, and are distinct in the context of the contract, whereby the transfer of the services is separately identifiable from other promises in the contract. Our performance obligations consist of (i) our subscription and support services and (ii) professional and other services.
89
3) Determine the transaction price
The transaction price is determined based on the consideration to which we expect to be entitled in exchange for transferring services to the customer. Variable consideration is included in the transaction price if, in our judgment, it is probable that a significant future reversal of cumulative revenue under the contract will not occur. None of our contracts contain a significant financing component.
4) Allocate the transaction price to performance obligations in the contract
If the contract contains a single performance obligation, the entire transaction price is allocated to the single performance obligation. Contracts that contain multiple performance obligations require an allocation of the transaction price to each performance obligation based on a relative standalone selling price ("SSP").
5) Recognize revenue when or as we satisfy a performance obligation
Revenue is recognized at the time the related performance obligation is satisfied by transferring the promised service to a customer. Revenue is recognized when control of the services is transferred to our customers, in an amount that reflects the consideration that we expect to receive in exchange for those services. We generate all our revenue from contracts with customers.
Subscription and Support Revenue
We generate revenue primarily from sales of subscriptions to access our cloud platform, together with related support services to our customers. Arrangements with customers do not provide the customer with the right to take possession of our software operating our cloud platform at any time. Instead, customers are granted continuous access to our cloud platform over the contractual period. A time-elapsed output method is used to measure progress because we transfer control evenly over the contractual period. Accordingly, the fixed consideration related to subscription and support revenue is generally recognized on a straight-line basis over the contract term beginning on the date that our service is made available to the customer.
The typical subscription and support term is
one
to
three
years. Most of our contracts are non-cancelable over the contractual term. Customers typically have the right to terminate their contracts for cause if we fail to perform in accordance with the contractual terms. Some of our customers have the option to purchase additional subscription and support services at a stated price. These options generally do not provide a material right as they are priced at our SSP.
Professional and Other Services Revenue
Professional and other services revenue consists of fees associated with providing deployment advisory services that educate and assist our customers on the best use of our solutions, as well as advise customers on best practices as they deploy our solution. These services are distinct from subscription and support services. Professional services do not result in significant customization of the subscription service. Revenue from professional services provided on a time and materials basis is recognized as the services are performed. Total professional and other services revenue has historically not been material.
Contracts with Multiple Performance Obligations
Most of our contracts with customers contain multiple promised services consisting of: (i) our subscription and support services and (ii) professional and other services that are distinct and accounted for separately. The transaction price is allocated to the separate performance obligations on a relative SSP basis. We determine SSP based on our overall pricing objectives, taking into consideration the type of subscription and support services and professional and other services, the geographical region of the customer and the number of users.
90
Variable Consideration
Revenue from sales is recorded at the net sales price, which is the transaction price, and includes estimates of variable consideration. The amount of variable consideration that is included in the transaction price is constrained and is included in the net sales price only to the extent that it is probable that a significant reversal in the amount of the cumulative revenue will not occur when the uncertainty is resolved.
If our services do not meet certain service level commitments, our customers are entitled to receive service credits, and in certain cases, refunds, each representing a form of variable consideration. We have historically not experienced any significant incidents affecting the defined levels of reliability and performance as required by our subscription contracts. Accordingly, estimated refunds related to these agreements were not material to the periods presented.
We provide rebates and other credits within our contracts with certain customers, which are estimated based on the value expected to be earned or claimed on the related sales transaction. Overall, the transaction price is reduced to reflect our estimate of the amount of consideration to which we are entitled based on the terms of the contract. Estimated rebates and other credits were not material during the periods presented.
Disaggregation of Revenue
Subscription and support revenue is recognized over time and accounted for approximately
99%
of our revenue in fiscal
2018
,
2017
and
2016
.
The following table summarizes the revenue by region based on the shipping address of customers who have contracted to use our cloud platform:
|
Year Ended July 31,
|
||||||||||||||||||||
|
2018
|
2017
|
2016
|
||||||||||||||||||
|
Amount
|
% Revenue
|
Amount
|
% Revenue
|
Amount
|
% Revenue
|
|||||||||||||||
|
(in thousands, except for percentage data)
|
||||||||||||||||||||
|
United States
|
$
|
86,123
|
|
45
|
%
|
$
|
57,990
|
|
46
|
%
|
$
|
35,794
|
|
44
|
%
|
|||||
|
Europe, Middle East
and Africa
(*)
|
84,828
|
|
45
|
|
56,857
|
|
45
|
|
37,403
|
|
47
|
|
||||||||
|
Asia Pacific
|
14,465
|
|
8
|
|
9,853
|
|
8
|
|
5,779
|
|
7
|
|
||||||||
|
Other
|
4,758
|
|
2
|
|
1,017
|
|
1
|
|
1,349
|
|
2
|
|
||||||||
|
Total
|
$
|
190,174
|
|
100
|
%
|
$
|
125,717
|
|
100
|
%
|
$
|
80,325
|
|
100
|
%
|
|||||
_____
(*)
Revenue from the United Kingdom represented
11%
,
13%
and
12%
of the total revenue for fiscal 2018, 2017 and 2016, respectively.
91
The following table summarizes the revenue from contracts by type of customer:
|
Year Ended July 31,
|
||||||||||||||||||||
|
2018
|
2017
|
2016
|
||||||||||||||||||
|
Amount
|
% Revenue
|
Amount
|
% Revenue
|
Amount
|
% Revenue
|
|||||||||||||||
|
(in thousands, except for percentage data)
|
||||||||||||||||||||
|
Channel partners
|
$
|
175,798
|
|
92
|
%
|
$
|
110,900
|
|
88
|
%
|
$
|
67,472
|
|
84
|
%
|
|||||
|
Direct customers
|
14,376
|
|
8
|
|
14,817
|
|
12
|
|
12,853
|
|
16
|
|
||||||||
|
Total
|
$
|
190,174
|
|
100
|
%
|
$
|
125,717
|
|
100
|
%
|
$
|
80,325
|
|
100
|
%
|
|||||
Contract Balances
Contract liabilities consist of deferred revenue and include payments received in advance of performance under the contract. Such amounts are recognized as revenue over the contractual period. In fiscal
2018
,
2017
and
2016
we recognized revenue of
$85.3
million,
$58.5
million and
$40.7
million, respectively, that was included in the corresponding contract liability balance at the beginning of the related fiscal year.
We receive payments from customers based upon contractual billing schedules; accounts receivable are recorded when the right to consideration becomes unconditional. Payment terms on invoiced amounts are typically
30
days but it may be up to
90
days for some of our channel partners. Contract assets include amounts related to our contractual right to consideration for both completed and partially completed performance obligations that may not have been invoiced and such amounts have historically not been material.
Remaining Performance Obligations
The typical subscription and support term is
one
to
three
years. Most of our subscription and support contracts are non-cancelable over the contractual term. However, customers typically have the right to terminate their contracts for cause, if we fail to perform. As of
July 31, 2018
, the aggregate amount of the transaction price allocated to remaining performance obligations was
$397.9
million. We expect to recognize
53%
of the transaction price over the next
12
months and
96%
of the transaction price over the next
three
years, with the remainder recognized thereafter.
Costs to Obtain and Fulfill a Contract
We capitalize sales commission and associated payroll taxes paid to internal sales personnel that are incremental to the acquisition of channel partner and direct customer contracts. These costs are recorded as deferred contract acquisition costs in the consolidated balance sheets. We determine whether costs should be deferred based on our sales compensation plans, if the commissions are in fact incremental and would not have occurred absent the customer contract.
Sales commissions for renewal of a contract are not considered commensurate with the commissions paid for the acquisition of the initial contract given the substantive difference in commission rates in proportion to their respective contract values. Commissions paid upon the initial acquisition of a contract are amortized over an estimated period of benefit of
five
years while commissions paid for renewal contracts are amortized over the contractual term of the renewals. Amortization of deferred contract acquisition costs is recognized on a straight-line basis commensurate with the pattern of revenue recognition and included in sales and marketing expense in the consolidated statements of operations. We determine the period of benefit for commissions paid for the acquisition of the initial contract by taking into consideration the expected subscription term and expected renewals of our customer contracts, the duration of our relationships with our customers, customer retention data, our technology development lifecycle and other factors. We periodically review the carrying amount of deferred contract acquisition costs to
92
determine whether events or changes in circumstances have occurred that could impact the period of benefit of these deferred costs. We did not recognize any impairment losses of deferred contract acquisition costs during the periods presented.
The following table summarizes the activity of the deferred contract acquisition costs:
|
Year Ended July 31,
|
|||||||||||
|
2018
|
2017
|
2016
|
|||||||||
|
(in thousands)
|
|||||||||||
|
Beginning balance
|
$
|
34,662
|
|
$
|
21,137
|
|
$
|
13,150
|
|
||
|
Capitalization of contract acquisition costs
|
34,429
|
|
21,999
|
|
13,502
|
|
|||||
|
Amortization of deferred contract acquisition costs
|
(13,181
|
)
|
(8,474
|
)
|
(5,515
|
)
|
|||||
|
Ending balance
|
$
|
55,910
|
|
$
|
34,662
|
|
$
|
21,137
|
|
||
|
Deferred contract acquisition costs
|
$
|
16,136
|
|
$
|
10,469
|
|
$
|
6,743
|
|
||
|
Deferred contract acquisition costs, noncurrent
|
39,774
|
|
24,193
|
|
14,394
|
|
|||||
|
Total deferred contract acquisition costs
|
$
|
55,910
|
|
$
|
34,662
|
|
$
|
21,137
|
|
||
Sales commissions accrued but not paid at
July 31, 2018
and
2017
, totaled $
10.0
million and $
5.4
million, respectively, which are included within accrued compensation in the consolidated balance sheets.
Accounts Receivable and Allowance
Accounts receivable are recorded at the invoiced amount and are non-interest bearing. Accounts receivable are stated at their net realizable value, net of an allowance for doubtful accounts. We have a well-established collections history from our customers. Credit is extended to customers based on an evaluation of their financial condition and other factors. In determining the necessary allowance for doubtful accounts, management considers the current aging and financial condition of our customers, the amount of receivables in dispute and current payment patterns. The allowance for doubtful accounts has historically not been material. There were no material write-offs recognized in the periods presented. Accordingly, the movements in the allowance for doubtful accounts were not material for any of the periods presented. We do not have any off-balance-sheet credit exposure related to our customers.
Cash Equivalents and Short-Term Investments
We classify all highly liquid investments purchased with an original maturity of 90 days or less from the date of purchase as cash equivalents and all highly liquid investments with original maturities beyond 90 days at the time of purchase as short-term investments. Our cash equivalents and short-term investments consist of highly liquid investments in money market funds, U.S. treasury securities, U.S. government agency securities and corporate debt securities.
We classify our investments as available-for-sale investments and present them within current assets since these investments represent funds available for current operations and we have the ability and intent, if necessary, to liquidate any of these investments in order to meet our liquidity needs within the next 12 months. Our investments are carried at fair value, with unrealized gains and losses, net of tax, reported in accumulated other comprehensive loss within stockholders’ equity (deficit).
93
Our investments are reviewed periodically to determine whether a decline in a security’s fair value below the amortized cost basis is other-than-temporary. If the cost of an individual investment exceeds its fair value, we consider available quantitative and qualitative factors such as the length of time and extent to which the market value has been less than the cost, the financial condition and near-term prospects of the issuer and our intent to sell, or whether it is more likely than not we will be required to sell the investment before recovery of the investment’s amortized cost basis. If we believe that a decline in fair value is determined to be other-than-temporary, we write down these investments to fair value. There were
no
impairments recognized on our investments during the periods presented.
Interest income, amortization of premiums and discounts, realized gains and losses and declines in fair value judged to be other-than-temporary on our available-for-sale securities are included in interest income, net in the consolidated statements of operations. We use the specific identification method to determine the cost in calculating realized gains and losses upon the sale of these investments.
Fair Value of Financial Instruments
Our financial instruments consist of cash equivalents, short-term investments, accounts receivable, accounts payable and accrued liabilities. Cash equivalents and short-term investments are recorded at fair value. Accounts receivable, accounts payable and accrued liabilities are stated at their carrying value, which approximates fair value due to the short-time to the expected receipt or payment date. Assets recorded at fair value on a recurring basis in the consolidated balance sheets, consisting of cash equivalents and short-term investments, are categorized in accordance with the fair value hierarchy based upon the level of judgment associated with the inputs used to measure their fair values.
Restricted Cash
We maintained restricted cash of
$0.6 million
as of
July 31, 2018
and
2017
through a letter of credit. The letter of credit was established according to the requirements under certain lease agreements.
Property and Equipment
Property and equipment, net are stated at historical cost net of accumulated depreciation. Property and equipment, excluding leasehold improvements, are depreciated using the straight-line method over the estimated useful lives of the respective assets, generally ranging from
two
to
five
years. Leasehold improvements are amortized using the straight-line method over the shorter of the estimated useful lives of the respective assets or the lease term. Expenditures for maintenance and repairs are expensed as incurred and significant improvements and betterments that substantially enhance the life of an asset are capitalized.
Capitalized Internal-Use Software Development Costs
We capitalize certain development costs related to our cloud security platform during the application development stage. Costs related to preliminary project activities are analogous to research and development activities and are expensed as incurred. The preliminary stage includes such activities as conceptual formulation of alternatives, evaluation of alternatives, determination of existence of needed technology and final selection of alternatives. Once the application development stage is reached, internal and external costs are capitalized until the software is substantially complete and ready for its intended use. Capitalized costs are recorded as part of property and equipment, net. Maintenance and training costs are expensed as incurred. Capitalized internal-use software is amortized on a straight-line basis over its estimated useful life, which is generally
three
years, and is recorded as cost of revenue in the consolidated statements of operations. We capitalized costs associated with the development of software for internal-use of
$1.8 million
,
$0.4 million
and
$0.8 million
in fiscal
2018
,
2017
and
2016
, respectively. We recognized amortization expense of capitalized internal-use software of
$0.9 million
,
$1.2 million
and
$1.0 million
in fiscal
2018
,
2017
and
2016
, respectively.
94
Impairment of Long-Lived Assets
We review our long-lived assets, comprised primarily of our property and equipment, for impairment whenever events or changes in circumstances indicate that their carrying amounts may not be recoverable. We measure the recoverability of these assets by comparing the carrying amounts to the future undiscounted cash flows these assets are expected to generate. If the total of the future undiscounted cash flows are less than the carrying amount of an asset, we record an impairment charge for the amount by which the carrying amount of the asset exceeds the fair value. Impairment losses on long-lived assets were not material during the periods presented.
Deferred Offering Costs
Deferred offering costs consisted of fees and expenses incurred in connection with the anticipated sale of our common stock in an IPO, including legal, accounting, printing and other IPO-related costs. As of
July 31, 2017
, we had capitalized deferred offering costs of
$1.2 million
and were included in other noncurrent assets. Upon completion of our IPO, deferred offering costs totaling
$6.5 million
were reclassified into stockholders' equity (deficit) as a reduction of the net proceeds received from the IPO.
Leases
We lease our facilities under operating lease agreements and recognize related rent expense on a straight-line basis over the term of the lease. Some of our lease agreements contain rent holidays, scheduled rent increases, lease incentives and renewal options. Rent holidays and scheduled rent increases are included in the determination of rent expense to be recorded over the lease term. Lease incentives are recognized as a reduction of rent expense on a straight-line basis over the term of the lease. Renewals are not assumed in the determination of the lease term unless they are deemed to be reasonably assured at the inception of the lease. We begin recognizing rent expense on the date that we obtain the legal right to use and control of the leased space. As part of our lease agreement at our headquarters, we obtained
$1.5 million
in leasehold improvement incentives from the landlord in fiscal 2016. As the incentives were paid directly to third parties by our landlord, they were recorded as a noncash investing activity in the consolidated statements of cash flows.
Stock-Based Compensation
Stock-based compensation expense for common stock options granted to employees and non-employees is recognized based on the fair value of the awards granted, determined using the Black-Scholes option pricing model and a single option award approach. Stock‐based compensation expense is recognized as expense over the requisite service period, generally
four
years. Unvested options issued to non-employees are remeasured at fair market value at the end of each reporting period.
Stock-based compensation expense related to purchase rights granted under the employee stock purchase plan is based on the Black-Scholes option pricing model fair value of the number of awards estimated as of the beginning of the offering period. Stock-based compensation expense is recognized following the straight-line attribution method over the offering period.
Prior to the IPO, the fair value of our common stock for financial reporting purposes was determined considering numerous objective and subjective factors and required judgment to determine the fair value of common stock as of each grant date. Subsequent to the IPO, we determine the fair value using the market closing price of our common stock on the date of grant.
Prior to fiscal 2018, we recognized stock-based compensation expense, net of estimated forfeitures. We used historical data to estimate pre-vesting forfeitures and recorded stock-based compensation expense only for those grants that were expected to vest. On August 1, 2017, we adopted Accounting Standard Update ("ASU") No. 2016-09,
Compensation—Stock Compensation: Improvements to Employee Share-Based Payment Accounting
("ASU 2016-09"), which simplifies several aspects of the accounting for employee share-based payment transactions. In accordance with ASU 2016-09, we have elected to account for forfeitures as they occur instead of estimating the number of awards expected to be forfeited and adjusting the estimate when
95
it is no longer probable that the employee will fulfill the service condition. We adopted this provision in our first quarter of fiscal 2018 and recorded a cumulative-effect adjustment to accumulated deficit of
$0.4 million
, net of tax, as of the date of adoption. Additionally, upon adoption of ASU 2016-09, on a modified retrospective basis, the previously unrecognized excess tax benefits of
$0.9 million
as of
July 31, 2017
were recorded as an increase of U.S. federal and state deferred tax assets, which was substantially offset by our valuation allowance. Prospectively, all excess tax benefits and deficiencies will be recognized in the income statement as a component of our income tax expense or benefit. Further, we will present excess tax benefits as an operating activity in the consolidated statements of cash flows on a prospective basis. The net excess tax benefits related to equity awards was not material in fiscal
2018
.
Research and Development
Our research and development expenses support our efforts to add new features to our existing offerings and to ensure the reliability, availability and scalability of our solutions. Our cloud platform is software-driven, and our research and development teams employ software engineers in the design and the related development, testing, certification and support of our solutions. Accordingly, the majority of our research and development expenses result from employee-related costs, including salaries, bonuses and benefits and costs associated with technology tools used by our engineers.
Advertising Expenses
Advertising expenses are charged to sales and marketing expense in the consolidated statements of operations as incurred. We recognized advertising expense of
$3.4 million
,
$1.8 million
and
$1.8 million
in fiscal
2018
,
2017
and
2016
, respectively.
Warranties and Indemnification
Our cloud platform is generally warranted to be free of defects under normal use and to perform substantially in accordance with the subscription agreement. Additionally, our contracts generally include provisions for indemnifying customers and channel partners against liabilities if our services infringe or misappropriate a third party’s intellectual property rights. Costs and liabilities incurred as a result of warranties and indemnification obligations were not material during the periods presented.
Legal Contingencies
We may be subject to legal proceedings and litigation arising from time to time. We record a liability when we believe that it is both probable that a loss has been incurred and the amount can be reasonably estimated. We expect to periodically evaluate developments in our legal matters that could affect the amount of liability that we accrue, if any, and adjust, as appropriate. Until the final resolution of any such matter for which we may be required to record a liability, there may be a loss exposure in excess of the liability recorded and such amount could be significant. We expense legal fees as incurred.
Income Taxes
We account for income taxes using the asset and liability method. Deferred income taxes are recognized by applying the enacted statutory tax rates applicable to future years to differences between the carrying amounts of existing assets and liabilities and their respective tax bases and net operating loss and tax credit carryforwards. The effect on deferred tax assets and liabilities of a change in tax rates is recognized in the period that includes the enactment date. The measurement of deferred tax assets is reduced, if necessary, by a valuation allowance to amounts that are more likely than not to be realized.
We recognize tax benefits from uncertain tax positions only if we believe that it is more likely than not that the tax position will be sustained on examination by the taxing authorities based on the technical merits of the position. The tax benefits recognized in the financial statements from such positions are then measured based on the largest benefit that has a greater than 50% likelihood of being realized upon settlement.
96
On December 22, 2017, the Tax Cuts and Jobs Act of 2017, or the Tax Act, was enacted. The Tax Act contains several key tax provisions that affect us, including, but not limited to, reducing the U.S. federal corporate tax rate, imposing a one-time mandatory repatriation tax on previously untaxed foreign earnings, and changing rules related to the use of net operating loss carryforwards created in tax years beginning after December 31, 2017. We expect to complete our assessment of the impacts of the Tax Act including the remeasurement of our deferred taxes, the one-time mandatory transition tax, and the policy decision regarding whether to record deferred taxes associated with Global Intangible Low-Taxed Income (“GILTI”) within the measurement period provided by Staff Accounting Bulletin No. 118,
Income Tax Accounting Implications of the Tax Cuts and Jobs Act
("SAB 118"). Our assessment of the impact of the Tax Act may differ from our provisional assessment during the measurement period due to, among other things, further refinement in our calculations, changes in interpretations and assumptions we have made, or guidance that may be issued.
Comprehensive Loss
Our other comprehensive loss consists of unrealized gains and losses on our available-for-sale investments. We did not have reclassifications from comprehensive loss to the consolidated statements of operations for the periods presented.
Net Loss Per Share Attributable to Common Stockholders
Prior to the IPO, basic and diluted net loss per share attributable to common stockholders is presented in conformity with the two-class method required for participating securities. We consider all series of our convertible preferred stock to be participating securities. Under the two-class method, the net loss attributable to common stockholders is not allocated to the convertible preferred stock as the holders of our convertible preferred stock do not have a contractual obligation to share in our losses. Under the two-class method, net income is attributed to common stockholders and participating securities based on their participation rights.
Under the two-class method, basic net loss per share attributable to common stockholders is computed by dividing the net loss attributable to common stockholders by the weighted-average number of shares of common stock outstanding during the period. Net loss attributable to common stockholders is calculated by adjusting the net loss for the accretion of redeemable convertible preferred stock outstanding during the period.
Diluted earnings per share attributable to common stockholders adjusts basic earnings per share for all potentially dilutive common stock equivalents outstanding during the period. Potentially dilutive securities consist of convertible preferred stock, stock options, shares subject to repurchase from early exercised stock options and estimated shares to be issued under the employee stock purchase plan. Since we have reported net losses for all periods presented, we have excluded all potentially dilutive securities from the calculation of the diluted net loss per share attributable to common stockholders as their effect is antidilutive and accordingly, basic and diluted net loss per share attributable to common stockholders is the same for all periods presented.
Upon closing of the IPO, all shares of convertible preferred stock then outstanding were automatically converted into an equivalent number of shares of common stock on a
one
-to-one basis and their carrying amount reclassified into stockholders’ equity (deficit). As of
July 31, 2018
, we did not have shares of preferred stock issued and outstanding.
Recently Adopted Accounting Pronouncements
In March 2016, the Financial Accounting Standard Board ("FASB") issued ASU 2016-09. This ASU simplifies various aspects related to how share-based payments are accounted for and presented in the financial statements, including income taxes, forfeitures, and statutory tax withholding requirements. For public business entities, it is effective for annual periods beginning after December 15, 2016, and interim periods therein. Early adoption is permitted. We adopted ASU 2016-09 as of August 1, 2017, resulting in the impact discussed above, under the caption "Stock-Based Compensation." The adoption of this standard
97
did not have a material impact to our consolidated financial statements.
In January 2017, FASB issued ASU No. 2017-01,
Business Combinations (Topic 805): Clarifying the Definition of a Business
. The amendment was issued to clarify the definition of a business with the objective of adding guidance to assist entities with evaluating whether transactions should be accounted for as acquisitions of assets or businesses. The amendments in this ASU provide a screen to determine when a set (inputs and processes that produce an output) is not a business. The screen requires that when substantially all of the fair value of the gross assets acquired is concentrated in a single identifiable asset or a group of similar identifiable assets, the set is not a business. For public business entities, it is effective for fiscal years beginning after December 15, 2017. We adopted this standard as of August 1, 2018; however, we are currently evaluating the impact it will have
on our consolidated financial statements in relation to transactions entered after its adoption.
In May 2017, the FASB issued ASU No. 2017-09,
Compensation—Stock Compensation (Topic 718): Scope of Modification Accounting
, which provides clarity in applying the guidance in Topic 718 around modifications of share-based payment awards. For public business entities, it is effective for fiscal years beginning after December 15, 2017, and interim periods within those fiscal years. We adopted this standard as of August 1, 2018 and do not expect it to have a material impact to our consolidated financial statements.
In August 2016, the FASB issued ASU No. 2016-15,
Statement of Cash Flows (Topic 230): Classification of Certain Cash Receipts and Cash Payments
.
The new standard will make eight targeted changes to how cash receipts and cash payments are presented and classified in the statement of cash flows with the purpose of
decreasing the diversity in practice in how certain cash receipts and payments are classified in the statement of cash flows. For public business entities, it is effective for fiscal years beginning after December 15, 2017, and interim periods within those fiscal years. We adopted this standard as of August 1, 2018 and do not expect it to have a material impact to our consolidated financial statements.
In November 2016, the FASB issued ASU No. 2016-18,
Statement of Cash Flows (Topic 230): Restricted Cash
, which updates the classification of restricted cash in the statement of cash flows. For public business entities, it is effective for fiscal years beginning after December 15, 2017, and interim periods therein. We adopted this standard as of August 1, 2018 and do not expect it to have a material impact to our consolidated financial statements.
Recently Issued Accounting Pronouncements Not Yet Adopted
In February 2016, the FASB issued ASU No. 2016-02,
Leases
(Topic 842) ("ASU 2016-02"). The main difference between previous guidance and ASU 2016-02 is the recognition of lease assets and lease liabilities by lessees for those leases classified as operating leases under previous accounting guidance. ASU 2016-02 retains the distinction between finance leases and operating leases. The classification criteria for distinguishing between finance leases and operating leases are substantially similar to the previous leases guidance. In transition, lessees and lessors are required to recognize and measure leases at the beginning of the earliest period presented using a modified retrospective approach. For public business entities, it is effective for annual periods beginning after December 15, 2018, and interim periods therein. Early adoption is permitted. We are currently evaluating the potential impact of this standard on our consolidated financial statements.
In June 2016, the FASB issued ASU No. 2016-13,
Financial Instruments-Credit Losses (Topic 326): Measurement of Credit Losses on Financial Instruments
. This ASU amends guidance on reporting credit losses for assets held at amortized cost basis and available-for-sale debt securities to require that credit losses on available-for-sale debt securities be presented as an allowance rather than as a write-down. The measurement of credit losses for newly recognized financial assets and subsequent changes in the allowance for credit losses are recorded in the statements of operations. For public business entities, it is effective for fiscal years beginning after December 15, 2019, including interim periods within those fiscal years. Early adoption is permitted. We are currently evaluating the potential impact of this standard on our consolidated financial statements.
98
In June 2018, the FASB issued ASU No. 2018-07,
Compensation—Stock Compensation (Topic 718): Improvements to Nonemployee Share-Based Payment Accounting
, which simplifies the accounting for equity awards granted to nonemployees. For public business entities, it is effective for fiscal years beginning after December 15, 2018, and interim periods therein. Early adoption is permitted. We are currently evaluating the potential impact of this standard on our consolidated financial statements.
Cash equivalents and short-term investments consisted of the following as of
July 31, 2018
:
|
Amortized
Cost |
Unrealized
Gains |
Unrealized
Losses |
Fair Value |
||||||||||||
|
(in thousands)
|
|||||||||||||||
|
Cash equivalents:
|
|||||||||||||||
|
Money market funds
|
$
|
74,408
|
|
$
|
—
|
|
$
|
—
|
|
$
|
74,408
|
|
|||
|
U.S. treasury securities
|
17,488
|
|
—
|
|
—
|
|
17,488
|
|
|||||||
|
U.S. government agency securities
|
1,999
|
|
—
|
|
—
|
|
1,999
|
|
|||||||
|
Corporate debt securities
|
11,010
|
|
—
|
|
(1
|
)
|
11,009
|
|
|||||||
|
Total cash equivalents
|
$
|
104,905
|
|
$
|
—
|
|
$
|
(1
|
)
|
$
|
104,904
|
|
|||
|
Short-term investments:
|
|||||||||||||||
|
U.S. treasury securities
|
$
|
55,768
|
|
$
|
—
|
|
$
|
(17
|
)
|
$
|
55,751
|
|
|||
|
U.S. government agency securities
|
17,953
|
|
—
|
|
(19
|
)
|
17,934
|
|
|||||||
|
Corporate debt securities
|
89,362
|
|
1
|
|
(88
|
)
|
89,275
|
|
|||||||
|
Total short-term investments
|
$
|
163,083
|
|
$
|
1
|
|
$
|
(124
|
)
|
$
|
162,960
|
|
|||
|
Total cash equivalents and short-term investments
|
$
|
267,988
|
|
$
|
1
|
|
$
|
(125
|
)
|
$
|
267,864
|
|
|||
Cash equivalents consisted of the following as of
July 31, 2017
:
|
Amortized
Cost |
Unrealized
Gains |
Unrealized
Losses |
Fair Value |
||||||||||||
|
(in thousands)
|
|||||||||||||||
|
Cash equivalents:
|
|||||||||||||||
|
Money market funds
|
$
|
72,441
|
|
$
|
—
|
|
$
|
—
|
|
$
|
72,441
|
|
|||
We did not have investments classified as short-term investments as of
July 31, 2017
.
The amortized cost and fair value of our short-term investments based on their stated maturities consisted of the following as of
July 31, 2018
:
|
Amortized
Cost
|
Fair Value
|
||||||
|
(in thousands)
|
|||||||
|
Due within one year
|
$
|
116,897
|
|
$
|
116,843
|
|
|
|
Due between one and two years
|
46,186
|
|
46,117
|
|
|||
|
Total short-term investments
|
$
|
163,083
|
|
$
|
162,960
|
|
|
99
Short-term investments that were in an unrealized loss position consisted of the following as of
July 31, 2018
:
|
Less than 12 Months
|
Greater than 12 Months
|
Total
|
|||||||||||||||||||||
|
Fair
Value |
Unrealized
Losses |
Fair
Value |
Unrealized
Losses |
Fair
Value |
Unrealized
Losses |
||||||||||||||||||
|
(in thousands)
|
|||||||||||||||||||||||
|
U.S. treasury securities
|
$
|
55,750
|
|
$
|
(17
|
)
|
$
|
—
|
|
$
|
—
|
|
$
|
55,750
|
|
$
|
(17
|
)
|
|||||
|
U.S. government agency securities
|
17,934
|
|
(19
|
)
|
—
|
|
—
|
|
17,934
|
|
(19
|
)
|
|||||||||||
|
Corporate debt securities
|
83,332
|
|
(88
|
)
|
—
|
|
—
|
|
83,332
|
|
(88
|
)
|
|||||||||||
|
Total investments in a loss position
|
$
|
157,016
|
|
$
|
(124
|
)
|
$
|
—
|
|
$
|
—
|
|
$
|
157,016
|
|
$
|
(124
|
)
|
|||||
We review the individual securities that have unrealized losses in our short-term investment portfolio on a regular basis to evaluate whether or not any security has experienced an other-than-temporary decline in fair value. We evaluate, among others, whether we have the intention to sell any of these investments and whether it is not more likely than not that we will be required to sell any of them before recovery of the amortized cost basis. Based on this evaluation, we determined that there were no other-than-temporary impairments associated with our short-term investments as of
July 31, 2018
.
Fair value is defined as the exchange price that would be received from sale of an asset or paid to transfer a liability in the principal or most advantageous market for the asset or liability in an orderly transaction between market participants on the measurement date. We measure our financial assets and liabilities at fair value at each reporting period using a fair value hierarchy which requires us to maximize the use of observable inputs and minimize the use of unobservable inputs when measuring fair value. A financial instrument’s classification within the fair value hierarchy is based upon the lowest level of input that is significant to the fair value measurement. Three levels of inputs may be used to measure fair value:
|
•
|
Level I - Observable inputs are unadjusted quoted prices in active markets for identical assets or liabilities;
|
|
•
|
Level II - Observable inputs are quoted prices for similar assets and liabilities in active markets or inputs other than quoted prices that are observable for the assets or liabilities, either directly or indirectly through market corroboration, for substantially the full term of the financial instruments; and
|
|
•
|
Level III - Unobservable inputs that are supported by little or no market activity and that are significant to the fair value of the assets or liabilities. These inputs are based on our own assumptions used to measure assets and liabilities at fair value and require significant management judgment or estimation.
|
Our money market funds are classified within Level I due to the highly liquid nature of these assets and have quoted prices in active markets.
Certain of our investments in available-for-sale securities (i.e., U.S. treasury securities, U.S. government agency securities and corporate securities) are classified within Level II. The fair value of these securities is priced by using inputs based on non-binding market consensus prices that are primarily corroborated by observable market data or quoted market prices for similar instruments.
100
Assets that are measured at fair value on a recurring basis consisted of the following as of
July 31, 2018
:
|
Level I
|
Level II
|
Level III
|
|||||||||||||
|
Total
|
Quoted Prices
in Active
Markets for
Identical Assets
|
Significant
Other
Observable
Inputs
|
Significant
Unobservable
Inputs
|
||||||||||||
|
(in thousands)
|
|||||||||||||||
|
Cash equivalents:
|
|||||||||||||||
|
Money market funds
|
$
|
74,408
|
|
$
|
74,408
|
|
$
|
—
|
|
$
|
—
|
|
|||
|
U.S. treasury securities
|
17,488
|
|
—
|
|
17,488
|
|
—
|
|
|||||||
|
U.S. government agency securities
|
1,999
|
|
—
|
|
1,999
|
|
—
|
|
|||||||
|
Corporate debt securities
|
11,009
|
|
—
|
|
11,009
|
|
—
|
|
|||||||
|
Total cash equivalents
|
$
|
104,904
|
|
$
|
74,408
|
|
$
|
30,496
|
|
$
|
—
|
|
|||
|
Short-term investments:
|
|||||||||||||||
|
U.S. treasury securities
|
$
|
55,751
|
|
$
|
—
|
|
$
|
55,751
|
|
$
|
—
|
|
|||
|
U.S. government agency securities
|
17,934
|
|
—
|
|
17,934
|
|
—
|
|
|||||||
|
Corporate debt securities
|
89,275
|
|
—
|
|
89,275
|
|
—
|
|
|||||||
|
Total short-term investments
|
$
|
162,960
|
|
$
|
—
|
|
$
|
162,960
|
|
$
|
—
|
|
|||
Assets that are measured at fair value on a recurring basis consisted of the following as of
July 31, 2017
:
|
Level I
|
Level II
|
Level III
|
|||||||||||||
|
Total
|
Quoted Prices
in Active
Markets for
Identical Assets
|
Significant
Other
Observable
Inputs
|
Significant
Unobservable
Inputs
|
||||||||||||
|
(in thousands)
|
|||||||||||||||
|
Cash equivalents:
|
|||||||||||||||
|
Money market funds
|
$
|
72,441
|
|
$
|
72,441
|
|
$
|
—
|
|
$
|
—
|
|
|||
We did not have transfers between levels of the fair value hierarchy of assets measured at fair value during the periods presented.
101
Property and equipment consisted of the following:
|
July 31,
|
|||||||||
|
Estimated Useful Life
|
2018
|
2017
|
|||||||
|
(in thousands)
|
|||||||||
|
Hosting equipment
|
2-3 years
|
$
|
30,743
|
|
$
|
20,241
|
|
||
|
Computers and equipment
|
3-5 years
|
2,335
|
|
1,539
|
|
||||
|
Purchased software
|
3 years
|
1,324
|
|
1,257
|
|
||||
|
Capitalized internal-use software
|
3 years
|
6,163
|
|
4,390
|
|
||||
|
Furniture and fixtures
|
5 years
|
1,478
|
|
1,035
|
|
||||
|
Leasehold improvements
|
Shorter of useful life or lease term
|
2,123
|
|
1,981
|
|
||||
|
Property and equipment, gross
|
44,166
|
|
30,443
|
|
|||||
|
Less: Accumulated depreciation and amortization
|
(24,401
|
)
|
(17,304
|
)
|
|||||
|
Total property and equipment, net
|
$
|
19,765
|
|
$
|
13,139
|
|
|||
We recognized depreciation and amortization expense on property and equipment of
$8.0 million
,
$6.8 million
and
$4.9
million in fiscal
2018
,
2017
and
2016
, respectively.
Operating Leases
We lease our office space under various operating lease agreements expiring at various dates through
April 2021
. Certain of these lease agreements have escalating rent payments. We recognize rent expense under such agreements on a straight-line basis over the lease term. The difference between the rent paid and the straight-line rent expense is recorded as deferred rent, which current portion is included within accrued expenses and other current liabilities and noncurrent portion is included within other noncurrent liabilities in the consolidated balance sheets. We recognized rent expense of
$2.5 million
,
$1.7 million
and
$1.4 million
in fiscal
2018
,
2017
and
2016
, respectively.
Future minimum payments under non-cancelable operating leases consisted of the following as of
July 31, 2018
:
|
Operating
Leases |
|||
|
(in thousands)
|
|||
|
Year ending July 31,
|
|||
|
2019
|
$
|
2,834
|
|
|
2020
|
2,274
|
|
|
|
2021
|
1,598
|
|
|
|
Total
|
$
|
6,706
|
|
Data Center Contract Commitments
We enter into long-term non-cancelable agreements with providers in various countries to purchase data center capacity, such as bandwidth and colocation space, for our cloud platform. We recognized bandwidth and colocation costs of
$9.4 million
,
$6.9 million
and
$5.6 million
for fiscal
2018
,
2017
and
2016
, respectively.
102
Future minimum payments under non-cancelable data center contracts consisted of the following as of
July 31, 2018
:
|
Data Center
Contracts |
|||
|
(in thousands)
|
|||
|
Year ending July 31,
|
|||
|
2019
|
$
|
6,280
|
|
|
2020
|
3,763
|
|
|
|
2021
|
1,300
|
|
|
|
2022
|
179
|
|
|
|
Total
|
$
|
11,522
|
|
Non-cancelable Purchase Obligations
In the normal course of business, we enter into non-cancelable purchase commitments with various parties to purchase products and services such as technology licenses, equipment, software subscriptions, corporate events and outsourced services. As of
July 31, 2018
and
2017
, we had outstanding non-cancelable purchase obligations with a term of 12 months or longer of
$3.1 million
and
$2.2 million
, respectively.
Legal Matters
Symantec Litigation
We are currently involved in legal proceedings with Symantec. On December 12, 2016, Symantec filed a complaint, which we refer to as Symantec Case 1, in the U.S. District Court for the District of Delaware alleging that "Zscaler’s cloud security platform" infringes U.S. Patent Nos. 6,279,113, 7,203,959 ("’959 patent"), 7,246,227 ("’227 patent"), 7,392,543, 7,735,116, 8,181,036 and 8,661,498. The complaint seeks compensatory damages, an injunction, enhanced damages and attorney fees. On August 2, 2017, the court granted our motion to transfer Symantec Case 1 from the District of Delaware to the Northern District of California. On March 23, 2018, the Northern District of California court granted our motion to dismiss the asserted claims of the ’959 and ’227 patents as invalid based on unpatentable subject matter.
On April 18, 2017, Symantec filed a second complaint, which we refer to as Symantec Case 2, in the U.S. District Court for the District of Delaware alleging that "Zscaler’s cloud security platform" infringes U.S. Patent Nos. 6,285,658, 7,360,249, 7,587,488, 8,316,429, 8,316,446, 8,402,540 and 9,525,696. The complaint seeks compensatory damages, an injunction, enhanced damages and attorney fees.
On June 22, 2017, Symantec filed a notice of voluntary dismissal of its complaint in Symantec Case 2 along with a new complaint alleging infringement of the same patents and adding Symantec Limited as a plaintiff and alleging willful infringement of the ’429 and ’446 patents. On July 31, 2017, the court granted our motion to transfer Symantec Case 2 from the District of Delaware to the Northern District of California. On May 21, 2018, Symantec filed an amended complaint adding allegations of willful infringement of all of the asserted patents in Symantec Case 2.
We have also received letters from Symantec alleging that our "cloud security platform" infringes U.S. Patent Nos. 7,031,327, 7,496,661, 7,543,036 and 7,624,110.
We believe that our technology does not infringe Symantec’s asserted patents and that these patents are invalid.
Should Symantec prevail with its infringement allegations, we could be required to pay substantial damages for past and future sales and/or licensing of our services, enjoined from making, using, selling or otherwise disposing of our services if a license or other right to continue selling our services is not made available to us, and required to pay substantial ongoing royalties and comply with unfavorable terms if such a license is made available to us. Any of these outcomes could result in a material adverse effect on our business. Even if we were to prevail, this litigation could be costly and time-consuming, divert the attention
103
of our management and key personnel from our business operations, deter distributors from selling or licensing our services, and dissuade potential customers from purchasing our services, which would also materially harm our business. The expense of litigation and the timing of this expense from period to period are difficult to estimate, subject to change and could adversely affect our results of operations. In addition, any public announcements of the results of any proceedings in Symantec Case 1 or Case 2 could be negatively perceived by industry or financial analysts and investors, and could cause our stock price to experience volatility or decline.
We have not recorded a liability with respect to Symantec Case 1 or Case 2 based on our determination that a loss in either case is not probable under the applicable accounting standards.
We are vigorously defending Symantec Case 1 and Case 2. We are unable to predict the likelihood of success of Symantec’s infringement claims.
Finjan Litigation
We are currently involved in legal proceedings with Finjan. On December 5, 2017, Finjan filed a complaint, in the U.S. District Court for the Northern District of California alleging that Zscaler’s "Internet Access Bundles," "Private Access Bundle," "Zscaler Enforcement Node," "Secure Web Gateway," "Cloud Firewall," "Cloud Sandbox" and "Cloud Architecture products and services" infringe U.S. Patent Nos. 6,804,780, 7,647,633, 8,677,494 and 7,975,305. The complaint seeks compensatory damages, an injunction, enhanced damages and attorney fees.
We believe our technology does not infringe Finjan’s asserted patents and that Finjan’s patents are invalid.
Should Finjan prevail with its infringement allegations, we could be required to pay substantial damages for past and future sales and/or licensing of our services, enjoined from making, using, selling or otherwise disposing of our services if a license or other right to continue selling our services is not made available to us, and required to pay substantial ongoing royalties and comply with unfavorable terms if such a license is made available to us. Any of these outcomes could result in a material adverse effect on our business. Even if we were to prevail, this litigation could be costly and time-consuming, divert the attention of our management and key personnel from our business operations, deter distributors from selling or licensing our services, and dissuade potential customers from purchasing our services, which would also materially harm our business. The expense of litigation and the timing of this expense from period to period are difficult to estimate, subject to change and could adversely affect our results of operations. In addition, any public announcements of the results of any proceedings in this matter could be negatively perceived by industry or financial analysts and investors, and could cause our stock price to experience volatility or decline.
While the range of potential loss resulting from the lawsuit cannot be reasonably estimated, we have accrued a total liability of
$3.2 million
as of
July 31, 2018
related to past negotiations with Finjan of which we recorded
$0.7 million
in fiscal
2018
and
$2.5 million
in fiscal 2017.
We are vigorously defending this lawsuit. Given the early stage in the litigation, we are unable to predict the likelihood of success of Finjan’s infringement claims.
Other Litigation and Claims
In addition, from time to time we are a party to various litigation matters and subject to claims that arise in the ordinary course of business, including patent, commercial, product liability, employment, class action, whistleblower and other litigation and claims, as well as governmental and other regulatory investigations and proceedings. In addition, third parties may from time to time assert claims against us in the form of letters and other communications. Except as otherwise described above, there is no pending or threatened legal proceeding to which we are a party that, in our opinion, is likely to have a material adverse effect on our future financial results or operations; however, the results of litigation and claims are inherently unpredictable. Regardless of the outcome, litigation can have an adverse impact on us because of defense and settlement costs, diversion of management resources and other factors. The expense of litigation and the timing of this expense from period to period are difficult to estimate, subject to change and could adversely affect our results of operations.
104
In March 2018, upon completion of our IPO, all shares of convertible preferred stock then outstanding, totaling
72,500,750
shares, were automatically converted into an equivalent number of shares of common stock on a
one
-to-one basis. Additionally, the carrying amount of the redeemable convertible preferred stock of
$207.3 million
, inclusive of accretion of Series C and D redeemable convertible preferred stock of
$24.7 million
, was reclassified to stockholders’ equity (deficit). In connection with the IPO, we filed an Amended and Restated Certificate of Incorporation which authorizes the issuance of
200,000,000
shares of undesignated preferred stock with a par value of
$0.001
with rights and preferences, including voting rights, designated from time to time by our board of directors. We did not have shares of convertible preferred stock issued and outstanding as of
July 31, 2018
.
Convertible preferred stock consisted of the following as of July 31, 2017:
|
Shares
Authorized
|
Issued and
Outstanding
|
Carrying
Value
|
Liquidation
Preference
|
Issue Price
per Share
|
|||||||||||||
|
(in thousands, except per share data)
|
|||||||||||||||||
|
Series A
|
28,000
|
|
28,000
|
|
$
|
5,000
|
|
$
|
5,000
|
|
$
|
0.18
|
|
||||
|
Series B
|
25,000
|
|
24,856
|
|
30,095
|
|
30,200
|
|
$
|
1.22
|
|
||||||
|
Series C
|
7,500
|
|
7,375
|
|
37,897
|
|
37,980
|
|
$
|
5.15
|
|
||||||
|
Series D
|
12,600
|
|
12,270
|
|
127,985
|
|
128,196
|
|
$
|
8.97
|
|
||||||
|
Total
|
73,100
|
|
72,501
|
|
$
|
200,977
|
|
$
|
201,376
|
|
|||||||
In September 2015, we amended our Amended and Restated Certificate of Incorporation and increased the number of Series D preferred stock authorized for sale and issuance to
12,492,749
shares. We also amended our Series D preferred stock purchase agreement to permit the sale of an additional
2,788,560
shares of Series D redeemable convertible preferred stock at
$8.9652
per share for total gross proceeds of
$25.0 million
.
The holders of our convertible preferred stock had various rights, preferences and privileges, which are summarized as follows:
Conversion Rights
Each share of our preferred stock was convertible, at the option of its holder, into the number of fully paid and non-assessable shares of common stock, which results from dividing the applicable original issue price per share by the applicable conversion price per share on the date that the share certificate is surrendered for conversion. As of July 31, 2017, the conversion prices per share for all shares of preferred stock were equal to the original issue prices, and the rate at which each share would convert into common stock was
one
-for-one. As discussed above, upon completion of our IPO, all our outstanding shares of convertible preferred stock were automatically converted to common stock.
Dividend Rights
Each holder of the Series A, B, C and D convertible preferred stock was entitled to receive, out of any funds legally available, noncumulative dividends at the rate of
$0.0142875
,
$0.0972
,
$0.412305
and
$0.71721
per share, respectively, per annum, payable in preference and priority to any payment of any dividends on common stock when and if declared by our board of directors. The right to receive dividends on shares of preferred stock was not cumulative. No dividends were declared through the date our convertible preferred stock was automatically converted to common stock upon completion of our IPO.
105
Liquidation Rights
In the event of any liquidation, dissolution or winding up of the Company, holders of Series A, B, C and D convertible preferred stock were entitled to receive, in preference to holders of the common stock, an amount per share equal to the greater of (a) the sum of the liquidation preference, which was
$0.178575
for a Series A share,
$1.215
for a Series B share,
$5.14965
for a Series C share and
$8.9652
plus
8%
compounded annually from the initial issuance date for a Series D share, plus all declared but unpaid dividends or (b) the amount that would be received on such share of redeemable convertible preferred stock if such share were converted to a share of common stock immediately prior to such liquidation event. All remaining assets would then be distributed pro rata to holders of common stock. A liquidation event was deemed to be outside of our control.
Voting Rights
The holders of Series A, B, C and D convertible preferred stock were entitled to the number of votes equal to the number of shares of common stock into which such preferred stock was convertible. The holders of the preferred stock were entitled to vote on all matters on which the common stockholders are entitled to vote. So long as at least
1,333,333
shares (as adjusted for recapitalization) of each of the Series A, B, C and D convertible preferred stock remained outstanding, the holders of each of the Series A, B, C and D convertible preferred stock, voting as a separate class, were entitled to select one member of our board of directors.
Redemption Rights
Series C redeemable convertible preferred stock was redeemable at any time after the sixth anniversary of the initial issuance of the Series D redeemable convertible preferred stock. Series D redeemable convertible preferred stock was redeemable at any time after its sixth anniversary. The redemption price per share for Series C was equal to its original issue price of
$5.14965
plus all declared and unpaid dividends. The redemption price per share for Series D was equal to the original issue price of
$8.9652
plus
8%
per annum, compounded annually, from the issuance date through its redemption date. As the redemption of Series C and D was not solely within our control and was contingent only on the passage of time, we considered probable that the instruments would become redeemable. Accordingly, both Series C and D redeemable convertible preferred stock were accreted to their redemption prices utilizing the effective interest method through their automatic conversion to common stock upon completion of our IPO. While Series A, B, C and D convertible preferred stock did not have mandatory redemption provisions, they were contingently redeemable upon a deemed liquidation event.
We recognized accretion to the redemption price of Series C and D redeemable convertible preferred stock of
$6.3 million
,
$9.6 million
and
$8.6 million
in fiscal
2018
,
2017
and
2016
, respectively. Accretion was recognized as a reduction of additional paid-in capital with a corresponding increase to the carrying amount of Series C and D redeemable convertible preferred stock, which is presented within redeemable convertible preferred stock in the consolidated balance sheets. As described above, upon completion of our IPO, the accretion rights of Series C and D redeemable convertible preferred stock were terminated and their carrying amount of
$207.3 million
, inclusive of cumulative accretion of
$24.7 million
, was reclassified to stockholders' equity (deficit).
Classification of Convertible Preferred Stock
The redemption provisions of the Series C and Series D redeemable convertible preferred stock were considered provisions that were not solely within our control. Also, the deemed liquidation preference provisions of the Series A, B, C and D convertible preferred stock were considered contingent redemption provisions that were not solely within our control. Accordingly, our convertible preferred stock had been presented outside of permanent equity in the mezzanine section of the consolidated balance sheet as of July 31, 2017.
106
In March 2018, upon completion of our IPO, we sold
13,800,000
shares. The shares were sold at an IPO price of
$16.00
per share for net proceeds of
$205.3 million
, after deducting underwriters' discounts and commissions of
$15.5 million
. In connection with our IPO, we incurred offering costs of
$6.5 million
which were recorded within stockholders’ equity (deficit) as a reduction of the net proceeds received from the IPO.
In connection with the IPO, we filed an Amended and Restated Certificate of Incorporation which authorizes the issuance of
1,000,000,000
shares of common stock with a par value of
$0.001
. Our common stock is not redeemable and common stockholders are entitled to
one
vote for each share of common stock held.
Common Stock Reserved for Future Issuance
The following table summarizes our shares of common stock reserved for future issuance:
|
July 31, 2018
|
||
|
(in thousands)
|
||
|
Equity awards outstanding:
|
||
|
Stock options
|
16,175
|
|
|
Unvested restricted stock units
|
209
|
|
|
Purchase rights committed under the employee stock purchase plan
|
2,044
|
|
|
Equity awards available for future grants:
|
||
|
Equity incentive plans
|
13,471
|
|
|
Employee stock purchase plan
|
156
|
|
|
Total reserved shares of common stock for future issuance
|
32,055
|
|
Equity Incentive Plans
In March 2018, we adopted the Fiscal Year 2018 Equity Incentive Plan (the "2018 Plan"). In September 2007, we adopted the 2007 Stock Plan (the "2007 Plan"). Equity incentive awards granted under the 2018 Plan and 2007 Plan, collectively referred to as the "Plans," may be either incentive RSUs, restricted stock, stock options, nonstatutory stock options, stock appreciation rights, performance units and performance shares to our employees, directors, officers and consultants.
The Plans allow for the grant of restricted stock units ("RSUs") to employees at the current fair value of our common stock. Generally, RSUs are subject to a
four
-year vesting period, with
25%
of the shares vesting one year from the date of grant and quarterly thereafter over the remaining vesting term.
Under the Plans, the exercise price of a stock option grant must be not less than 100% of the fair market value of the common stock on the date of grant. Generally, stock options vest over
four
years with
25%
of the option shares vesting
one year
from the date of grant and monthly thereafter over the remaining vesting term. Stock options granted under the 2018 Plan and 2007 Plan are exercisable over a maximum term of
ten
years and
seven
years, respectively, from the date of grant. Stock options that are forfeited or canceled shall become available for future grant or sale under the 2018 Plan.
A total of
12,700,000
shares of common stock were initially authorized for issuance under the 2018 Plan. Our compensation committee administers the 2018 Plan. The number of shares of common stock available for issuance under the 2018 Plan also includes an annual increase on the first day of each fiscal year beginning on August 1, 2018, equal to the least of: (i)
12,700,000
107
shares of common stock, (ii)
5%
of the outstanding shares of our common stock as of the last day of the immediately preceding fiscal year, or (iii) such other number of shares determined by our board of directors.
In March 2018, in connection with our IPO, the 2007 Plan was terminated along with its remaining balance of shares of common stock available for grant. With the establishment of the 2018 Plan, we no longer grant stock-based awards under the 2007 Plan and any shares underlying stock options that expire or terminate or are forfeited or repurchased by us under the 2007 Plan will be automatically transferred to the 2018 Plan.
The activity of stock options consisted of the following:
|
Shares
Available For Grant |
Outstanding
Stock Options |
Weighted-Average
Exercise Price |
Weighted-Average
Remaining Contractual Term (in years) |
Aggregate
Intrinsic Value |
|||||||||
|
(in thousands, except per share data)
|
|||||||||||||
|
Balance as of July 31, 2017
|
739
|
|
15,058
|
|
$4.50
|
5.6
|
$
|
56,717
|
|
||||
|
Increase in 2007 Plan authorized shares
|
3,333
|
|
|||||||||||
|
Increase in 2018 Plan authorized shares
|
12,700
|
|
|||||||||||
|
Shares terminated under 2007 Plan
|
(870
|
)
|
|||||||||||
|
RSU activity, net
|
(209
|
)
|
|||||||||||
|
Stock options granted
|
(5,021
|
)
|
5,021
|
|
$10.02
|
||||||||
|
Stock options exercised
|
—
|
|
(1,892
|
)
|
$3.09
|
$
|
16,688
|
|
|||||
|
Repurchases of unvested shares
|
787
|
|
—
|
|
$5.11
|
||||||||
|
Stock options canceled, forfeited, expired
|
2,012
|
|
(2,012
|
)
|
$5.90
|
||||||||
|
Balance as of July 31, 2018
|
13,471
|
|
16,175
|
|
$6.20
|
5.1
|
$
|
470,860
|
|
||||
|
Exercisable and expected to vest as of July 31, 2017
|
5,907
|
|
$3.67
|
4.9
|
$
|
27,135
|
|
||||||
|
Exercisable and expected to vest as of July 31, 2018
|
5,499
|
|
$3.97
|
4.0
|
$
|
172,317
|
|
||||||
The aggregate intrinsic value of the options exercised represents the difference between the estimated fair value of our common stock on the date of exercise and their exercise price. The total intrinsic value of options exercised was
$16.7 million
,
$4.5 million
and
$3.0 million
for fiscal
2018
,
2017
and
2016
, respectively.
The weighted-average grant-date fair value per share of awards granted was
$3.77
,
$2.10
and
$1.68
for fiscal
2018
,
2017
and
2016
, respectively.
We estimated the fair value of employee stock options using the Black-Scholes option pricing model with the following assumptions:
|
Year Ended July 31,
|
|||||
|
2018
|
2017
|
2016
|
|||
|
Expected term (in years)
|
4.6 - 5.1
|
4.6
|
4.6
|
||
|
Expected stock price volatility
|
40.3% - 42.3%
|
41.4% - 43.3%
|
43.6% - 45.2%
|
||
|
Risk-free interest rate
|
1.7% - 2.8%
|
1.1% - 2.0%
|
1.1% - 1.6%
|
||
|
Dividend yield
|
0.0%
|
0.0%
|
0.0%
|
||
108
The activity of RSUs consisted of the following:
|
Number of Shares
|
Weighted-Average Grant Date Fair Value
per Share
|
Aggregate
Intrinsic Value
|
||||||
|
(in thousands, except per share data)
|
||||||||
|
Balance as of July 31, 2017
|
—
|
|
—
|
$
|
—
|
|
||
|
Granted
|
210
|
|
$26.26
|
|||||
|
Vested
|
—
|
|
—
|
$
|
—
|
|
||
|
Canceled, forfeited
|
(1
|
)
|
$26.26
|
|||||
|
Balance as of July 31, 2018
|
209
|
|
$26.26
|
$
|
7,394
|
|
||
Early Exercised Stock Options
The 2007 Plan allowed for the early exercise of stock options for certain individuals as determined by our board of directors. The consideration received for an early exercised stock option is considered to be a deposit of the exercise price and the related proceed is initially recorded as a liability in the consolidated balance and reclassified to additional paid-in capital as the awards vest. Upon an employee’s termination, we have the option to repurchase unvested shares at a price per share equal to the lesser of the fair market value of the shares at the time of the repurchase or the original purchase price. In fiscal 2018, 2017 and 2016, we issued
179,861
shares,
781,320
shares and
1,260,000
shares of common stock for aggregate proceeds of
$0.9 million
,
$4.7 million
and
$5.2 million
, respectively, related to early exercised stock options. As of July 31, 2018 and 2017, the number of shares of common stock subject to repurchase was
422,528
shares and
1,887,638
shares with an aggregate exercise price of
$1.6 million
and
$8.0 million
, respectively.
Notes Receivable from Stockholders
We entered into notes receivable agreements with certain of our current and former executives and employees in connection with the exercise of their stock options. During fiscal 2016 and 2015, we issued
1,076,666
shares and
2,733,333
shares of common stock for an aggregate exercise price of
$4.4 million
and
$6.6 million
, respectively, related to the exercise of unvested stock options via notes receivable. We did not issue notes receivable during fiscal 2018 and 2017. These notes bear interest at rates ranging from
1.15%
to
2.85%
per annum and are due in December 2018, subject to acceleration upon the occurrence of certain events. As these notes are collateralized by the underlying common stock as well as the borrowers’ personal assets, they are considered full recourse. The related principal amount and accrued interest are presented as a reduction of stockholder's equity (deficit) until the notes are settled. As of July 31, 2018 and 2017, the carrying amount of the outstanding notes receivable, inclusive of accrued interest, was
$2.1 million
and
$7.9 million
, respectively. As of July 31, 2018 and 2017, the balance of accrued interest under these notes was
$0.1 million
and
$0.4 million
, respectively. In fiscal 2018, we repurchased a total of
787,479
unvested shares of common stock from certain employees upon termination of their employment services. The total repurchase price was
$4.0 million
, or
$5.11
per share, of which
$3.8 million
was paid in cash and
$0.2 million
was settled through the cancellation of the related note receivable. In fiscal 2018, certain borrowers repaid the outstanding principal amount and interest accrued under their loans, totaling
$5.7 million
.
Employee Stock Purchase Plan
In March 2018, we adopted the Fiscal Year 2018 Employee Stock Purchase Plan ("ESPP"), which became effective upon completion of the IPO. A total of
2,200,000
shares of common stock were initially authorized for issuance under the ESPP. The number of shares of common stock available for sale under the ESPP also includes an annual increase on the first day of each fiscal year beginning on August 1, 2018, equal to the least of: (i)
2,200,000
shares of common stock, (ii)
1%
of the outstanding
109
shares of our common stock as of the last day of the immediately preceding fiscal year, or (iii) such other number of shares determined by the administrator. Our compensation committee administers the ESPP.
The ESPP provides for consecutive offering periods that will typically have a duration of approximately
24
months in length and is comprised of
four
purchase periods of approximately
six
months in length. The offering periods are scheduled to start on the first trading day on or after
June 15
and
December 15
of each year. The first offering period commenced on
March 16, 2018
and is scheduled to end on the first trading day on or after
June 15, 2020
. As of
July 31, 2018
, no shares of common stock have been issued under the ESPP.
The ESPP provides eligible employees with an opportunity to purchase shares of our common stock through payroll deductions of up to
15%
of their eligible compensation. A participant may purchase a maximum of
3,000
shares of common stock during a purchase period. Amounts deducted and accumulated by the participant are used to purchase shares of our common stock at the end of each six-month purchase period. The purchase price of the shares shall be
85%
of the lower of the fair market value of our common stock on (i) the first trading day of the applicable offering period and (ii) the last trading day of each purchase period in the related offering period. If the fair market value of the common stock on any purchase date within an offering period is lower than the stock price as of the beginning of the offering period, the offering period will immediately reset after the purchase of shares on such purchase date and participants will be automatically re-enrolled in a new offering period. Participants may end their participation at any time during an offering period and will be paid their accrued contributions that have not yet been used to purchase shares of common stock. Participation ends automatically upon termination of employment.
The fair value of the purchase rights granted under the ESPP was estimated on the date of grant using the Black-Scholes option pricing model with the following assumptions:
|
Year Ended July 31, 2018
|
|
|
Expected term (in years)
|
0.5 - 2.3
|
|
Expected stock price volatility
|
30.7% - 53.2%
|
|
Risk-free interest rate
|
2.0% - 2.6%
|
|
Dividend yield
|
0.0%
|
Stock-based Compensation Expense
Prior to fiscal 2018, we recognized stock-based compensation expense, net of estimated forfeitures. Beginning with our first quarter of fiscal 2018, upon adoption of ASU 2016-09, as further discussed in Note 1 to these consolidated financial statements, we elected to account for forfeitures of awards as incurred instead of estimating the number of awards expected to be forfeited. The adoption of this standard did not have a material impact to our consolidated financial statements.
The components of stock-based compensation expense recognized in the consolidated statements of operations consisted of the following:
|
Year Ended July 31,
|
|||||||||||
|
2018
|
2017
|
2016
|
|||||||||
|
(in thousands)
|
|||||||||||
|
Cost of revenue
|
$
|
757
|
|
$
|
348
|
|
$
|
189
|
|
||
|
Sales and marketing
|
5,044
|
|
2,794
|
|
1,574
|
|
|||||
|
Research and development
|
3,045
|
|
5,574
|
|
1,025
|
|
|||||
|
General and administrative
|
2,378
|
|
1,203
|
|
829
|
|
|||||
|
Total stock-based compensation expense
|
$
|
11,224
|
|
$
|
9,919
|
|
$
|
3,617
|
|
||
110
As of
July 31, 2018
, the unrecognized stock-based compensation cost related to stock options, ESPP and RSUs was
$27.0 million
,
$8.9 million
and
$5.3 million
, respectively, which we expect to amortize over a weighted-average period of
2.9 years
,
1.2 years
and
3.9 years
, respectively.
On December 22, 2017, the Tax Cuts and Jobs Act of 2017, or the Tax Act, was enacted. The Tax Act contains several key tax provisions that affect us, including, but not limited to, reducing the U.S. federal corporate tax rate from 34% to 21% for tax years beginning after December 31, 2017, imposing a one-time mandatory transition tax on previously untaxed foreign earnings, and changing rules related to uses and limitations of net operating loss carryforwards created in tax years beginning after December 31, 2017. On December 22, 2017, the SAB 118, which provides guidance on accounting for the Tax Act’s impact and allows registrants to record provisional amounts during a measurement period not to extend beyond one year of the enactment date.
We currently maintain a full valuation allowance recorded against our U.S. federal deferred tax assets. As such, the provisional
$19.7 million
remeasurement of our deferred tax assets was offset by the change in our valuation allowance which resulted in no income tax expense or benefit. Because of our full valuation allowance and current year losses, there is no tax expense associated with the provisional
$1.0 million
of the one-time mandatory transition tax. We are still in the process of analyzing the impacts of the GILTI provision which may impact our effective tax rate in future years.
We expect to complete our assessment of the impacts of the Tax Act including the remeasurement of our deferred taxes, the one-time mandatory transition tax, and the policy decision regarding whether to record deferred taxes associated with GILTI within the measurement period provided by SAB 118. Our assessment of the impact of the Tax Act may differ from our provisional assessment during the measurement period due to, among other things, further refinement in our calculations, changes in interpretations and assumptions we have made, or guidance that may be issued.
The following table sets forth the geographical breakdown of the income (loss) before the provision for income taxes:
|
Year Ended July 31,
|
|||||||||||
|
2018
|
2017
|
2016
|
|||||||||
|
(in thousands)
|
|||||||||||
|
Domestic
|
$
|
(36,455
|
)
|
$
|
(36,874
|
)
|
$
|
(28,227
|
)
|
||
|
International
|
4,146
|
|
2,291
|
|
1,257
|
|
|||||
|
Loss before income taxes
|
$
|
(32,309
|
)
|
$
|
(34,583
|
)
|
$
|
(26,970
|
)
|
||
111
The following table sets forth the components of the provision for income taxes:
|
Year Ended July 31,
|
|||||||||||
|
2018
|
2017
|
2016
|
|||||||||
|
Current:
|
(in thousands)
|
||||||||||
|
Federal
|
$
|
—
|
|
$
|
—
|
|
$
|
—
|
|
||
|
State
|
(2
|
)
|
31
|
|
16
|
|
|||||
|
Foreign
|
1,480
|
|
874
|
|
452
|
|
|||||
|
Total current tax expense
|
1,478
|
|
905
|
|
468
|
|
|||||
|
Deferred:
|
|||||||||||
|
Federal
|
—
|
|
—
|
|
—
|
|
|||||
|
State
|
—
|
|
—
|
|
—
|
|
|||||
|
Foreign
|
(141
|
)
|
(28
|
)
|
—
|
|
|||||
|
Total deferred tax expense
|
(141
|
)
|
(28
|
)
|
—
|
|
|||||
|
Total provision for income taxes
|
$
|
1,337
|
|
$
|
877
|
|
$
|
468
|
|
||
The following table presents the reconciliation of the statutory federal income tax rate to our effective tax rate:
|
Year Ended July 31,
|
||||||||
|
2018
|
2017
|
2016
|
||||||
|
Tax at federal statutory rate
|
21.0
|
%
|
34.0
|
%
|
34.0
|
%
|
||
|
State taxes
|
—
|
|
1.5
|
|
1.8
|
|
||
|
Impact of foreign rate differential
|
0.3
|
|
(1.7
|
)
|
0.1
|
|
||
|
Meals and entertainment
|
(1.3
|
)
|
(0.5
|
)
|
(0.5
|
)
|
||
|
Stock-based compensation
|
(3.8
|
)
|
(2.8
|
)
|
(4.1
|
)
|
||
|
Impact of U.S. tax reform
|
(58.6
|
)
|
—
|
|
—
|
|
||
|
Provision to return adjustments
|
2.8
|
|
(0.3
|
)
|
—
|
|
||
|
U.S. tax credits
|
3.7
|
|
—
|
|
—
|
|
||
|
Change in valuation allowance
|
33.5
|
|
(32.4
|
)
|
(32.5
|
)
|
||
|
Other
|
(1.7
|
)
|
(0.3
|
)
|
(0.5
|
)
|
||
|
Effective tax rate
|
(4.1
|
)%
|
(2.5
|
)%
|
(1.7
|
)%
|
||
Our estimated effective tax rate for the periods presented differs from the U.S. statutory rate primarily due to the benefit of a portion of our earnings being taxed at rates lower than the U.S. statutory rate, offset by the impact of the valuation allowance we maintain against our U.S. federal and state deferred tax assets. The impact of the Tax Act includes the effect of remeasuring our deferred tax assets and liabilities at 21% plus the effects of the one-time mandatory transition tax.
112
The following table presents the tax effects of temporary differences that give rise to significant portions of our deferred tax assets and liabilities:
|
July 31,
|
|||||||
|
2018
|
2017
|
||||||
|
(in thousands)
|
|||||||
|
Deferred tax assets:
|
|||||||
|
Net operating losses carryovers
|
$
|
41,794
|
|
$
|
54,130
|
|
|
|
Accruals and reserves
|
2,863
|
|
2,807
|
|
|||
|
Deferred revenue
|
6,071
|
|
5,436
|
|
|||
|
Tax credits carryovers
|
6,118
|
|
—
|
|
|||
|
Stock-based compensation
|
784
|
|
571
|
|
|||
|
Property and equipment
|
303
|
|
339
|
|
|||
|
Other
|
347
|
|
569
|
|
|||
|
Gross deferred tax assets
|
58,280
|
|
63,852
|
|
|||
|
Less: Valuation allowance
|
(45,578
|
)
|
(51,493
|
)
|
|||
|
Total deferred tax assets
|
12,702
|
|
12,359
|
|
|||
|
Deferred tax liabilities:
|
|||||||
|
Deferred contract acquisition costs
|
(12,561
|
)
|
(12,331
|
)
|
|||
|
Total deferred tax liabilities
|
(12,561
|
)
|
(12,331
|
)
|
|||
|
Net deferred tax assets
|
$
|
141
|
|
$
|
28
|
|
|
As a result of certain realization requirements of ASC Topic 718, Compensation-Stock compensation, the table of deferred tax assets and liabilities does not include certain deferred tax assets as of July 31, 2017, that arose directly from tax deductions related to stock-based compensation which was in excess of the amount recognized for financial reporting. Additional paid-in capital will be increased by
$0.9 million
if and when such deferred tax assets are ultimately realized. As a result of the adoption of ASU 2016-09, as further discussed in Note 1 to these consolidated financial statements, in fiscal 2018 we recognized a U.S. federal and state deferred tax asset for this previously unrecognized excess tax benefits, which was offset by our U.S. federal and state valuation allowance.
A deferred tax liability has not been recognized on the excess of the amount for financial reporting over the tax basis of investments in foreign subsidiaries that are indefinitely reinvested outside the U.S.
Income taxes are generally incurred upon a repatriation of assets, a sale, or a liquidation of the subsidiary.
The excess of the amount for financial reporting over the tax basis in the investments in foreign subsidiaries, as well as the unrecognized deferred tax liability, are not material for the periods presented.
113
The following table presents the change in the valuation allowance:
|
Year Ended July 31,
|
|||||||||||
|
2018
|
2017
|
2016
|
|||||||||
|
(in thousands)
|
|||||||||||
|
Balance as of the beginning of the period
|
$
|
51,493
|
|
$
|
40,299
|
|
$
|
31,483
|
|
||
|
Change during the period
|
(5,915
|
)
|
11,194
|
|
8,816
|
|
|||||
|
Balance as of the end of the period
|
$
|
45,578
|
|
$
|
51,493
|
|
$
|
40,299
|
|
||
The realization of deferred tax assets is dependent upon the generation of sufficient taxable income of the appropriate character in future periods. We regularly assess the ability to realize our deferred tax assets and establish a valuation allowance if it is more-likely-than-not that some portion of the deferred tax assets will not be realized. We weigh all available positive and negative evidence, including our earnings history and results of recent operations, scheduled reversals of deferred tax liabilities, projected future taxable income, and tax planning strategies. Due to the weight of objectively verifiable negative evidence, including our history of losses, we believe that it is more likely than not that our U.S. federal and, state deferred tax assets will not be realized as of
July 31, 2018
and
2017
, and as such, we have maintained a full valuation allowance against such deferred tax assets.
The amount of the deferred tax asset considered realizable, however, could be adjusted if estimates of future taxable income during the carryforward period are reduced or increased or if objective negative evidence in the form of cumulative losses is no longer present and additional weight may be given to subjective evidence such as our projections for growth. In the event we determine that we will be able to realize all or part of our net deferred tax assets in the future, the valuation allowance against deferred tax assets will be reversed in the period in which we make such determination. The release of a valuation allowance against deferred tax assets may cause greater volatility in the effective tax rate in the periods in which the valuation allowance is released. The valuation allowance against our U.S. federal and state deferred tax assets decreased by
$5.9 million
, increased by
$11.2 million
and increased by
$8.8 million
in fiscal 2018, 2017, and 2016, respectively. The decrease in the valuation allowance in fiscal 2018 was primarily related to the change in the federal statutory rate, while the increase in the valuation allowance in fiscal 2017 and 2016, respectively, was related to tax losses for which insufficient positive evidence exists to support their realizability.
As of
July 31, 2018
and
2017
, we have net operating loss carryforwards for U.S. federal income tax purposes of
$173.6 million
and
$150.0 million
, respectively, which are available to offset future federal taxable income. The net operating losses for federal purposes will begin expiring in
2027
. As of
July 31, 2018
and
2017
, we have net operating loss carryforwards for state income tax purposes of
$62.4 million
and
$68.3 million
, respectively. The net operating losses for state purposes will begin expiring at different periods beginning in
2024
.
As of July 31, 2018, w
e had federal and California research and development tax credit carryforwards of approximately
$4.5 million
and
$4.2 million
, respectively. If not utilized, the federal credit carryforwards will begin expiring at different periods beginning in
2033
. The California credit will carryforward indefinitely.
Federal and state tax laws impose restrictions on the utilization of net operating loss and research and development credit carryforwards in the event of a change in ownership of the Company as defined by the Internal Revenue Code, Sections 382 and 383. Under Section 382 and 383 of the Code, substantial changes in our ownership and the ownership of acquired companies may limit the amount of net operating loss and research and development credit carryforwards that are available to offset taxable income. The annual limitation would not automatically result in the loss of net operating loss or research and development credit carryforwards but may limit the amount available in any given future period.
114
We are subject to income taxes in the U.S. and various foreign jurisdictions. As of July 31, 2018, there are no significant tax jurisdictions under examination; however, all years are open for examination and may become subject to examination in the future. Significant judgment is required in evaluating our tax positions and determining our for income tax expense for the fiscal year. During the ordinary course of business, there are transactions and calculations for which the ultimate tax determination is uncertain. Our estimate of the potential outcome of any tax position is subject to management’s assessment of relevant risks, facts and circumstances existing at that time. These unrecognized tax benefits are established when we believe that certain positions might be challenged despite of belief that our tax return positions are fully supportable. We recognize interest and penalties associated with our unrecognized tax benefits as a component of our income tax expense. For the periods presented, we did not have material interest or penalties associated with the unrecognized tax benefits in the consolidated financial statements.
We had
$2.6 million
of gross unrecognized tax benefits as of
July 31, 2018
. If
recognized, these would affect our effective tax rate. However, the gross unrecognized tax benefits relate to income tax positions which, if recognized, would be in the form of carryforward deferred tax asset that would be offset by a valuation allowance. As of July 31, 2018, we do not believe that our estimates, as otherwise provided for, on such tax positions will significantly increase or decrease within the next twelve months.
The changes in our gross unrecognized tax benefits for fiscal 2018 consisted of the following:
|
Amount
|
|||
|
(in thousands)
|
|||
|
Balance as of July 31, 2017
|
$
|
—
|
|
|
Gross increase for tax positions of prior fiscal years
|
1,746
|
|
|
|
Gross increase for tax positions of current fiscal year
|
876
|
|
|
|
Balance as of July 31, 2018
|
$
|
2,622
|
|
Basic and diluted net loss per share attributable to common stockholders is presented in conformity with the two-class method required for participating securities. We consider all series of our convertible preferred stock to be participating securities. Under the two-class method, the net loss attributable to common stockholders is not allocated to the convertible preferred stock as the holders of our convertible preferred stock do not have a contractual obligation to share in our losses. In March 2018, upon completion of our IPO, all shares of convertible preferred stock then outstanding, were automatically converted into an equivalent number of shares of common stock on a
one
-to-one basis. As of
July 31, 2018
, we did not have shares of convertible preferred stock issued and outstanding.
Basic net loss per share attributable to common stockholders is computed by dividing the net loss by the weighted-average number of shares of common stock outstanding during the period, less shares subject to repurchase. The diluted net loss per share attributable to common stockholders is computed by giving effect to all potential dilutive common stock equivalents outstanding for the period. For purposes of this calculation, our convertible preferred stock, stock options, early exercised stock options, RSUs and purchase rights granted under the ESPP are considered to be potential common stock equivalents.
Since we have reported net losses for all periods presented, we have excluded all potentially dilutive securities from the calculation of the diluted net loss per share attributable to common stockholders as their effect is antidilutive and accordingly, basic and diluted net loss per share attributable to common stockholders is the same for all periods presented.
115
The following table sets forth the computation of basic and diluted net loss per share attributable to common stockholders:
|
Year Ended July 31,
|
|||||||||||
|
2018
|
2017
|
2016
|
|||||||||
|
(in thousands, except per share data)
|
|||||||||||
|
Net loss
|
$
|
(33,646
|
)
|
$
|
(35,460
|
)
|
$
|
(27,438
|
)
|
||
|
Accretion of Series C and D redeemable convertible preferred stock
|
(6,332
|
)
|
(9,570
|
)
|
(8,648
|
)
|
|||||
|
Net loss attributable to common stockholders
|
$
|
(39,978
|
)
|
$
|
(45,030
|
)
|
$
|
(36,086
|
)
|
||
|
Weighted-average shares used in computing net loss per share attributable to common stockholders, basic and diluted
|
63,881
|
|
29,221
|
|
26,521
|
|
|||||
|
Net loss per share attributable to common stockholders, basic and diluted
|
$
|
(0.63
|
)
|
$
|
(1.54
|
)
|
$
|
(1.36
|
)
|
||
The following table summarizes the outstanding potentially dilutive securities that were excluded from the computation of diluted net loss per share attributable to common stockholders because the impact of including them would have been antidilutive:
|
July 31,
|
||||||||
|
2018
|
2017
|
2016
|
||||||
|
(in thousands)
|
||||||||
|
Convertible preferred stock
|
—
|
|
72,501
|
|
72,501
|
|
||
|
Outstanding stock options
|
16,175
|
|
15,058
|
|
9,376
|
|
||
|
Shares subject to repurchase from early exercised stock options
|
423
|
|
1,888
|
|
2,367
|
|
||
|
Purchase rights committed under the ESPP
|
2,044
|
|
—
|
|
—
|
|
||
|
Unvested RSUs
|
209
|
|
—
|
|
—
|
|
||
|
Total
|
18,851
|
|
89,447
|
|
84,244
|
|
||
Our chief operating decision maker ("CODM") is our chief executive officer. We derive our revenue primarily from sales of subscription services to our cloud platform and related support services. Our CODM reviews financial information presented on a consolidated basis for the purposes of allocating resources and evaluating financial performance. Accordingly, we determined that we operate as
one
operating segment.
Our long-lived assets are composed of property and equipment, net, and are summarized by geographic area as follows:
|
July 31,
|
|||||||
|
2018
|
2017
|
||||||
|
(in thousands)
|
|||||||
|
United States
|
$
|
14,742
|
|
$
|
9,372
|
|
|
|
Rest of the world
|
5,023
|
|
3,767
|
|
|||
|
Total property and equipment, net
|
$
|
19,765
|
|
$
|
13,139
|
|
|
Refer to Note 1 of these consolidated financial statements for information on revenue by geography.
116
We have a defined-contribution plan intended to qualify under Section 401 of the Internal Revenue Code (the "401(k) Plan"). We contracted with a third-party provider to act as a custodian and trustee, and to process and maintain the records of participant data. Substantially all the expenses incurred for administrating the 401(k) Plan are paid by us, which have not been material to the periods presented. We have not made any matching contributions to date.
In
November 2016
, we recorded
$4.4 million
of stock-based compensation expense within research and development expense in the consolidated statements of operations associated with a one-time secondary stock purchase transaction which was executed among certain of our employees and certain of our affiliated stockholders, including entities controlled by Jay Chaudhry, our president, chief executive officer and chairman of our board of directors, and Lane Bess, a member of our board of directors. We assessed the impact of this transaction as holders of economic interest in our Company acquired shares from our employees at a price in excess of fair value of such shares. Accordingly, we recognized such excess value as stock-based compensation expense.
We have entered into notes receivable agreements with certain of our current and former executives and employees in connection with the exercise of their stock options. Refer to Note 8 of these consolidated financial statements for further information.
In August 2018, we acquired certain artificial intelligence and machine learning technology and the development team of security startup TrustPath Inc. The acquisition extends our ability to derive intelligence from the billions of transactions we process daily, to identify anomalous traffic, build user behavior profiles and detect sophisticated targeted attacks as they emerge. The total purchase consideration was not material to our consolidated financial statements. We are currently evaluating the accounting impact of this transaction as it relates to our adoption of ASU 2017-01.
117
None.
Evaluation of Disclosure Controls and Procedures
We maintain “disclosure controls and procedures,” as defined in Rule 13a–15(e) and Rule 15d–15(e) under the Exchange Act that are designed to ensure that information required to be disclosed by a company in the reports that it files or submits under the Exchange Act is recorded, processed, summarized and reported, within the time periods specified in the SEC’s rules and forms. Disclosure controls and procedures include, without limitation, controls and procedures designed to ensure that information required to be disclosed by a company in the reports that it files or submits under the Exchange Act is accumulated and communicated to our management, including our principal executive and principal financial officers, as appropriate to allow timely decisions regarding required disclosure.
Our management, with the participation of our Chief Executive Officer and our Chief Financial Officer, has evaluated the effectiveness of our disclosure controls and procedures as of
July 31, 2018
. Based on such evaluation, our Chief Executive Officer and Chief Financial Officer have concluded that, as of such date, our disclosure controls and procedures were effective at the reasonable assurance level.
Management's Report on Internal Control Over Financial Reporting
This Annual Report on Form 10-K does not include a report of management's assessment regarding internal control over financial reporting or an attestation report of our independent registered public accounting firm due to a transition period established by the rules of SEC for newly public companies.
Changes in Internal Control Over Financial Reporting
There was no change in our internal control over financial reporting identified in connection with the evaluation required by Rule 13a-15(d) and 15d-15(d) of the Exchange Act
that occurred during the fiscal quarter ended
July 31, 2018
that has materially affected, or is reasonably likely to materially affect, our internal control over financial reporting.
Inherent Limitations on Effectiveness of Controls
Our management, including our Chief Executive Officer and Chief Financial Officer, believes that our disclosure controls and procedures and internal control over financial reporting are designed to provide reasonable assurance of achieving their objectives and are effective at the reasonable assurance level. However, our management does not expect that our disclosure controls and procedures or our internal control over financial reporting will prevent or detect all errors and all fraud. A control system, no matter how well conceived and operated, can provide only reasonable, not absolute, assurance that the objectives of the control system are met. Further, the design of a control system must reflect the fact that there are resource constraints, and the benefits of controls must be considered relative to their costs. Because of the inherent limitations in all control systems, no evaluation of controls can provide absolute assurance that all control issues and instances of fraud, if any, have been detected. These inherent limitations include the realities that judgments in decision making can be faulty, and that breakdowns can occur because of a simple error or mistake. Additionally, controls can be circumvented by the individual acts of some persons, by collusion of two or more people or by management override of the controls. The design of any system of controls also is based in part upon certain assumptions about the likelihood of future events, and there can be no assurance that any design will succeed in achieving its stated goals under all potential future conditions; over time, controls may become inadequate because of changes in conditions, or the degree of compliance with policies or procedures may deteriorate. Because of the inherent limitations in a cost–effective control system, misstatements due to error or fraud may occur and not be detected.
118
None.
The information required by this Item (other than the information set forth in the next paragraph) will be included in our definitive proxy statement for our 2018 annual meeting of stockholders (the "2018 Proxy Statement"), which will be filed with the SEC within 120 days after the end of our fiscal year ended
July 31, 2018
, and is incorporated herein by reference.
We have adopted a code of business conduct and ethics (the "Code of Conduct") that applies to all of our employees, executive officers and directors. The full text of the Code of Conduct is available on our website at ir.zscaler.com. The nominating and corporate governance committee of our board of directors is responsible for overseeing the Code of Conduct and must approve any waivers of the Code of Conduct for employees, executive officers and directors. We expect that any amendments to the Code of Conduct, or any waivers of its requirements, will be disclosed on our website, as required by applicable law or the listing standards of The Nasdaq Global Market.
T
he information required by this item is incorporated herein by reference to our 2018 Proxy Statement.
T
he information required by this item is incorporated herein by reference to our 2018 Proxy Statement.
T
he information required by this item is incorporated herein by reference to our 2018 Proxy Statement.
T
he information required by this item is incorporated herein by reference to our 2018 Proxy Statement.
119
(a)(1) Financial Statements
See Index to Financial Statements in Item 8 of this Annual Report on Form 10-K.
(a)(2) Financial Statement Schedule
All financial statement schedules have been omitted as the information is not required under the related instructions or is not applicable or because the information required is already included in the financial statements or the notes to those financial statements.
(a)(3) Exhibits
We have filed the exhibits listed on the accompanying Exhibit Index, which is incorporated herein by reference.
120
None.
121
SIGNATURES
Pursuant to the requirements of Section 13 or 15(d) of the Securities Exchange Act of 1934, the Registrant has duly caused this report to be signed on its behalf by the undersigned, thereunto duly authorized.
|
Zscaler, Inc.
|
||
|
Date: September 13, 2018
|
/s/
|
Remo Canessa
|
|
Remo Canessa
|
||
|
Chief Financial Officer
|
||
122
|
Incorporated by Reference
|
|||||||
|
Exhibit
Number
|
Exhibit Description
|
Form
|
File No.
|
Exhibit
|
Filing Date
|
Filed Herewith
|
|
|
3.1
|
10-Q
|
001-38413
|
3.1
|
June 7, 2018
|
|||
|
3.2
|
10-Q
|
001-38413
|
3.2
|
June 7, 2018
|
|||
|
4.1
|
S-1
|
333-223072
|
4.1
|
February 16, 2018
|
|||
|
4.2
|
S-1
|
333-223072
|
4.2
|
February 16, 2018
|
|||
|
10.1
|
S-1
|
333-223072
|
10.1
|
February 16, 2018
|
|||
|
10.2+
|
S-1/A
|
333-223072
|
10.2
|
March 5, 2018
|
|||
|
10.3+
|
S-1/A
|
333-223072
|
10.3
|
March 13, 2018
|
|||
|
10.4+
|
S-1/A
|
333-223072
|
10.4
|
March 5, 2018
|
|||
|
10.5+
|
S-1
|
333-223072
|
10.5
|
February 16, 2018
|
|||
|
10.6+
|
S-1
|
333-223072
|
10.6
|
February 16, 2018
|
|||
|
10.7+
|
S-1
|
333-223072
|
10.7
|
February 16, 2018
|
|||
|
10.8+
|
S-1
|
333-223072
|
10.8
|
February 16, 2018
|
|||
|
10.9+
|
S-1
|
333-223072
|
10.9
|
February 16, 2018
|
|||
|
10.10+
|
S-1
|
333-223072
|
10.10
|
February 16, 2018
|
|||
|
10.11+
|
S-1
|
333-223072
|
10.11
|
February 16, 2018
|
|||
|
10.12+
|
S-1
|
333-223072
|
10.12
|
February 16, 2018
|
|||
|
10.13+
|
S-1
|
333-223072
|
10.14
|
February 16, 2018
|
|||
|
10.14+
|
S-1
|
333-223072
|
10.15
|
February 16, 2018
|
|||
|
10.15+
|
S-1
|
333-223072
|
10.16
|
February 16, 2018
|
|||
|
10.16+
|
S-1
|
333-223072
|
10.17
|
February 16, 2018
|
|||
|
10.17
|
S-1
|
333-223072
|
10.18
|
February 16, 2018
|
|||
|
10.18
|
S-1
|
333-223072
|
10.19
|
February 16, 2018
|
|||
|
21.1
|
X
|
||||||
|
23.1
|
X
|
||||||
|
24.1
|
X
|
||||||
|
31.1
|
X
|
||||||
|
31.2
|
X
|
||||||
|
32.1*
|
X
|
||||||
|
101.INS
|
XBRL Instance Document
|
X
|
|||||
|
101.SCH
|
XBRL Taxonomy Extension Schema Document
|
X
|
|||||
|
101.CAL
|
XBRL Taxonomy Extension Calculation Linkbase Document
|
X
|
|||||
123
|
101.DEF
|
XBRL Taxonomy Extension Definition Linkbase Document
|
X
|
|||||
|
101.LAB
|
XBRL Taxonomy Extension Label Linkbase Document
|
X
|
|||||
|
101.PRE
|
XBRL Taxonomy Extension Presentation Linkbase Document
|
X
|
|||||
_______________________________________
+ Indicates management contract or compensatory plan or arrangement.
* The certifications furnished in Exhibit 32.1 hereto are deemed to accompany this Annual Report on Form 10-K and will not be deemed “filed” for purposes of Section 18 of the Securities Exchange Act of 1934, as amended, except to the extent that the registrant specifically incorporates it by reference.
124
POWER OF ATTORNEY
KNOW ALL PERSONS BY THESE PRESENTS, that each person whose signature appears below hereby constitutes and appoints Jagtar S. Chaudhry and Remo Canessa, and each of them, as his or her true and lawful attorney-in-fact and agent with full power of substitution, for him or her in any and all capacities, to sign any and all amendments to this report, and to file the same, with exhibits thereto and other documents in connection therewith, with the Securities and Exchange Commission, granting unto said attorney-in-fact, proxy, and agent full power and authority to do and perform each and every act and thing requisite and necessary to be done in connection therewith, as fully for all intents and purposes as he or she might or could do in person, hereby ratifying and confirming all that said attorney-in-fact, proxy and agent, or his substitute, may lawfully do or cause to be done by virtue hereof.
Pursuant to the requirements of the Securities Exchange Act of 1934, this report has been signed by the following persons on behalf of the registrant and in the capacities and on the dates indicated.
|
Signature
|
Title
|
Date
|
||
|
/s/ Jagtar S. Chaudhry
|
President, Chief Executive Officer and Chairman of the Board of Directors (Principal Executive Officer)
|
September 13, 2018
|
||
|
Jagtar S. Chaudhry
|
||||
|
/s/ Remo Canessa
|
Chief Financial Officer
(Principal Accounting and Financial Officer)
|
September 13, 2018
|
||
|
Remo Canessa
|
||||
|
/s/ Lane Bess
|
Director
|
September 13, 2018
|
||
|
Lane Bess
|
||||
|
/s/ Karen Blasing
|
Director
|
September 13, 2018
|
||
|
Karen Blasing
|
||||
|
/s/ Andrew Brown
|
Director
|
September 13, 2018
|
||
|
Andrew Brown
|
||||
|
/s/ Scott Darling
|
Director
|
September 13, 2018
|
||
|
Scott Darling
|
||||
|
/s/ Charles Giancarlo
|
Director
|
September 13, 2018
|
||
|
Charles Giancarlo
|
||||
|
/s/ Nehal Raj
|
Director
|
September 13, 2018
|
||
|
Nehal Raj
|
||||
|
/s/ Amit Sinha
|
Director
|
September 13, 2018
|
||
|
Amit Sinha
|
||||
125
TABLE OF CONTENTS
Part IItem 1. BusinessItem 1A. Risk FactorsItem 1B. Unresolved Staff CommentsItem 2. PropertiesItem 3. Legal ProceedingsItem 4. Mine Safety DisclosuresPart IIItem 5. Markets Registrant's Common Equity, Related Stockholder Matters and Issuer Purchases Of Equity SecuritiesItem 6. Selected Financial DataItem 7. Management S Discussion and Analysis Of Financial Condition and Results Of OperationsItem 7A. Quantitative and Qualitative Disclosures About Market RiskItem 8. Financial Statements and Supplementary DataNote 1. Business and Summary Of Significant Accounting PoliciesNote 2. Cash Equivalents and Short-term InvestmentsNote 3. Fair Value MeasurementsNote 4. Property and EquipmentNote 5. Commitments and ContingenciesNote 6. Convertible Preferred StockNote 7. Common StockNote 8. Stock-based CompensationNote 9. Income TaxesNote 10. Net Loss Per Share Attributable To Common StockholdersNote 11. Segment and Geographic InformationNote 12. 401(k) PlanNote 13. Related Party TransactionsNote 14. Subsequent EventsItem 9. Changes in and Disagreements with Accountants on Accounting and Financial DisclosureItem 9A. Controls and ProceduresItem 9B. Other InformationPart IIIItem 10. Directors, Executive Officers and Corporate GovernanceItem 11. Executive CompensationItem 12. Security Ownership Of Certain Beneficial Owners and Management and Related Stockholder MattersItem 13. Certain Relationships and Related Transactions, and Director IndependenceItem 14. Principal Accountant Fees and ServicesPart IVItem 15. Exhibits, Financial Statement ScheduleItem 16. Form 10-k Summary