ZOETIS INC.
10-Ks and 10-Qs
|
|
|
|
|
|
|
|
|
|
|
|
|
|
|
|
|
|
|
|
|
|
|
|
|
|
|
|
|
|
|
|
|
|
|
|
|
|
|
|
|
|
|
|
UNITED STATES
SECURITIES AND EXCHANGE COMMISSION
Washington, D.C. 20549
FORM 10-K
(Mark One)
|
x
|
ANNUAL REPORT PURSUANT TO SECTION 13 OR 15(d) OF THE SECURITIES EXCHANGE ACT OF 1934
|
|
|
For the fiscal year ended December 31, 2014
|
||
|
or
|
||
|
o
|
TRANSITION REPORT PURSUANT TO SECTION 13 OR 15(d) OF THE SECURITIES EXCHANGE ACT OF 1934
|
|
|
For the transition period from __________ to __________
|
||
Commission File Number: 001-35797
|
Zoetis Inc.
|
|
(Exact name of registrant as specified in its charter)
|
|
Delaware
|
46-0696167
|
|
|
(State or other jurisdiction of
|
(I.R.S. Employer Identification No.)
|
|
|
incorporation or organization)
|
||
|
100 Campus Drive, Florham Park, New Jersey
|
07932
|
|
|
(Address of principal executive offices)
|
(Zip Code)
|
|
|
(973) 822-7000
|
|
(Registrant’s telephone number, including area code)
|
Securities registered pursuant to Section 12(b) of the Act:
|
Title of each class
|
Name of each exchange on which registered
|
||
|
Common Stock, $0.01 par value per share
|
New York Stock Exchange
|
||
Securities registered pursuant to Section 12(g) of the Act: None
Indicate by check mark if the registrant is a well-known seasoned issuer, as defined in Rule 405 of Securities Act. Yes
x
No
¨
Indicate by check mark if the registrant is not required to file reports pursuant to Section 13 or Section 15(d) of the Act. Yes
¨
No
x
Indicate by check mark whether the registrant (1) has filed all reports required to be filed by Section 13 or 15(d) of the Securities Exchange Act of 1934 during the preceding 12 months (or for such shorter period that the registrant was required to file such reports), and (2) has been subject to such filing requirements for the past 90 days. Yes
x
No
¨
Indicate by check mark whether the registrant has submitted electronically and posted on its corporate Website, if any, every Interactive Data File required to be submitted and posted pursuant to Rule 405 of Regulation S-T (§232.405 of this chapter) during the preceding 12 months (or for such shorter period that the registrant was required to submit and post such files). Yes
x
No
¨
Indicate by check mark if disclosure of delinquent filers pursuant to Item 405 of Regulation S-K (§229.405 of this chapter) is not contained herein, and will not be contained, to the best of the registrant’s knowledge, in definitive proxy or information statements incorporated by reference in Part III of this Form 10-K or any amendment to this Form 10-K.
¨
Indicate by check mark whether the registrant is a large accelerated filer, an accelerated filer, a non-accelerated filer, or a smaller reporting company. See the definitions of “large accelerated filer,” “accelerated filer” and “smaller reporting company” in Rule 12b-2 of the Exchange Act. (Check one):
|
Large accelerated filer
x
|
Accelerated filer
¨
|
Non-accelerated filer
¨
|
Smaller reporting company
¨
|
|||
Indicate by check mark whether the registrant is a shell company (as defined in Rule 12b-2 of the Act). Yes
¨
No
x
The aggregate market value of the voting stock held by nonaffiliates of the registrant as of June 29, 2014, the last business day of the registrant's most recently completed second fiscal quarter, was $
16,224 million
. The registrant has no non-voting common stock.
The number of shares outstanding of the registrant's common stock as of
February 23, 2015
was
500,787,817
shares.
DOCUMENTS INCORPORATED BY REFERENCE:
Portions of the registrant’s Proxy Statement for the 2015 Annual Meeting of Shareholders to be held on May 1, 2015 (hereinafter referred to as the “2015 Proxy Statement”) are incorporated into Parts II and III of this Form 10-K.
TABLE OF CONTENTS
|
Page
|
||||
|
Item 1.
|
||||
|
Item 1A.
|
||||
|
Item 1B.
|
||||
|
Item 2.
|
||||
|
Item 3.
|
||||
|
Item 4.
|
||||
|
Item 5.
|
||||
|
Item 6.
|
||||
|
Item 7.
|
||||
|
Item 7A.
|
||||
|
Item 8.
|
||||
|
Item 9.
|
||||
|
Item 9A.
|
||||
|
Item 9B.
|
||||
|
Item 10.
|
||||
|
Item 11.
|
||||
|
Item 12.
|
||||
|
Item 13.
|
||||
|
Item 14.
|
||||
|
Item 15.
|
||||
PART I
Item 1. Business.
Overview
Zoetis Inc. is a global leader in the discovery, development, manufacture and commercialization of animal health medicines and vaccines, with a focus on both livestock and companion animals. We market a diverse range of products across four regions: the United States, Europe/Africa/Middle East, Canada/Latin America and Asia/Pacific; eight core species: the livestock species of cattle, swine, poultry, sheep and fish, and the companion animal species of dogs, cats and horses; and five major product categories: anti-infectives, vaccines, parasiticides, medicated feed additives and other pharmaceutical products. For more than 60 years, as a business unit of Pfizer Inc. (Pfizer), and now as an independent public company, we have been committed to enhancing the health of animals and bringing solutions to our customers who raise and care for them.
We were incorporated in Delaware in July 2012. The address of our principal executive offices is 100 Campus Drive, Florham Park, New Jersey 07932. Unless the context requires otherwise, references to “Zoetis,” “the company,” “we,” “us” or “our” in this Annual Report on Form 10-K for the fiscal year ended December 31, 2014 (2014 Annual Report) refer to Zoetis Inc., a Delaware corporation, and its subsidiaries. In addition, unless the context requires otherwise, references to “Pfizer” in this 2014 Annual Report refer to Pfizer Inc., a Delaware corporation, and its subsidiaries. Unless the context requires otherwise, statements relating to our history, for periods prior to the initial public offering (IPO), describe the history of Pfizer’s animal health business unit, although it is important to note that the net assets, operations and cash flows of Zoetis are not the same as the historical net assets, operations and cash flows of Pfizer's animal health operating segment.
On February 1, 2013, our Class A common stock began trading on the New York Stock Exchange (NYSE) under the symbol “ZTS.” On February 6, 2013, an IPO of our Class A common stock was completed, which represented approximately 19.8% of our total outstanding shares. Prior to and in connection with the IPO, we completed a $3.65 billion senior notes offering (senior notes offering) and Pfizer transferred to us substantially all of the assets and liabilities of their animal health business. We did not receive any of the proceeds from the IPO. We paid an amount of cash equal to substantially all of the net proceeds that we received in the senior notes offering to Pfizer prior to the completion of the IPO. In addition, immediately prior to the completion of the IPO, we and Pfizer entered into certain agreements that provide a framework for our ongoing relationship with Pfizer. On June 24, 2013, an exchange offer was completed whereby Pfizer shareholders exchanged a portion of Pfizer common stock for Zoetis common stock, resulting in the full separation of Zoetis and the disposal of Pfizer's entire ownership and voting interest in Zoetis. We refer to the transactions to separate our business from Pfizer, as described here and elsewhere in this 2014 Annual Report, as the “Separation.” For additional information, see Notes to Consolidated and Combined Financial Statements—
Note 2. The Separation, Adjustments Associated with the Separation, Senior Notes Offering, Initial Public Offering and Exchange Offer.
Operating Segments
The animal health medicines and vaccines market is characterized by meaningful differences in customer needs across different regions. This is due to a variety of factors, including:
|
•
|
economic differences, such as standards of living in developed markets as compared to emerging markets;
|
|
•
|
cultural differences, such as dietary preferences for different animal proteins, pet ownership preferences and pet care standards;
|
|
•
|
epidemiological differences, such as the prevalence of certain bacterial and viral strains and disease dynamics;
|
|
•
|
treatment differences, such as utilization of different types of medicines and vaccines, as well as the pace of adoption of new technologies;
|
|
•
|
environmental differences, such as seasonality, climate and the availability of arable land and fresh water; and
|
|
•
|
regulatory differences, such as standards for product approval and manufacturing.
|
As a result of these differences, among other things, we organize and operate our business in four segments: the United States, Europe/Africa/Middle East, Canada/Latin America and Asia/Pacific. Within each of these operating segments, we offer a diversified product portfolio for both livestock and companion animal customers so that we can capitalize on local trends and customer needs. Our operating segments are:
|
•
|
United States
with revenue of $
2,059 million
, or
43%
of total revenue for the year ended
December 31, 2014
.
|
|
•
|
Europe/Africa/Middle East
with revenue of $
1,141 million
, or
24%
of total revenue for the year ended
December 31, 2014
. Key developed markets in this segment include the United Kingdom, France and Germany. Key emerging markets in this segment include South Africa, Russia and Turkey.
|
|
•
|
Canada/Latin America
with revenue of $
815 million
, or
17%
of total revenue for the year ended
December 31, 2014
. The developed market in this segment is Canada. Key emerging markets in this segment include Brazil and Mexico.
|
|
•
|
Asia/Pacific
with revenue of $
720 million
, or
15%
of total revenue for the year ended
December 31, 2014
. Key developed markets in this segment include Australia, Japan and New Zealand. Key emerging markets in this segment include China, India and Thailand.
|
In addition, our Client Supply Services (CSS) organization provides contract manufacturing services to third parties and represented 1% of our total revenue for the year ended
December 31, 2014
.
1
|
Our
2014
reported revenue for the U.S. and top ten non-U.S. markets, based on total revenue, is as follows:
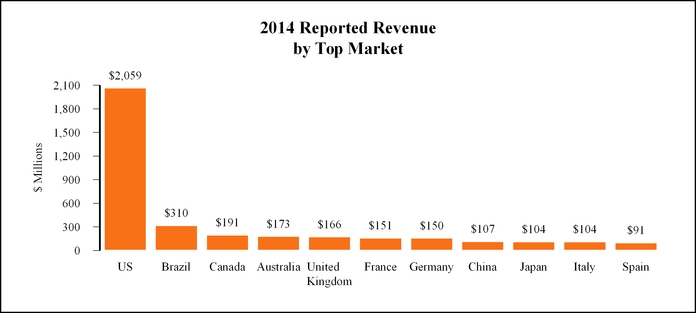
|
US
|
Brazil
|
Canada
|
Australia
|
UK
|
France
|
Germany
|
China
|
Japan
|
Italy
|
Spain
|
|
|
Livestock
|
56%
|
84%
|
63%
|
61%
|
55%
|
65%
|
58%
|
84%
|
56%
|
60%
|
79%
|
|
Companion Animal
|
44%
|
16%
|
37%
|
39%
|
45%
|
35%
|
42%
|
16%
|
44%
|
40%
|
21%
|
% of 2014 reported revenue
For additional information regarding our performance in each of these operating segments and the impact of foreign exchange rates, see
Management's Discussion and Analysis of Financial Condition and Results of Operations
and Notes to Consolidated and Combined Financial Statements—
Note 18A. Segment, Geographic and Other Revenue Information—Segment Information.
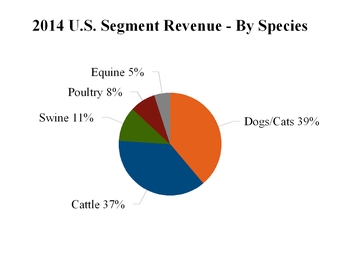
Our
2014
reported revenue for each segment, by species and top countries, is as follows:
2
|
2014 EuAfME Segment Revenue

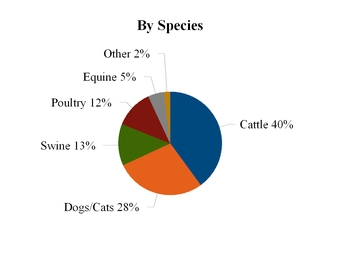
*Includes Russia and Commonwealth of Independent States, Africa, Turkey and Egypt, the Middle East, Iran and Caucasus, and Israel.
**Includes key markets such as Netherlands, Poland and Ireland.
2014 CLAR Segment Revenue


*Includes key markets such as Chile, Colombia and Peru.
2014 APAC Segment Revenue
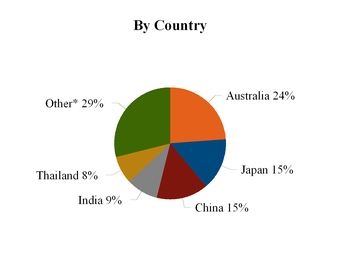
*Includes markets such as Korea, New Zealand and Taiwan.
3
|
Products
Over the course of our history, we have focused on developing a diverse portfolio of animal health products, including medicines and vaccines, complemented by diagnostics and genetics. We refer to a single product in all brands, or its dosage forms for all species, as a product line. We have more than 300 comprehensive product lines for both livestock and companion animals across each of our major product categories.
Our livestock products primarily help prevent or treat diseases and conditions to enable the cost-effective production of safe, high-quality animal protein. Human population growth and increasing standards of living are important long-term growth drivers for our livestock products in three major ways. First, population growth and increasing standards of living drive increased demand for improved nutrition, particularly animal protein. Second, population growth leads to increased natural resource constraints driving a need for enhanced productivity. Finally, as standards of living improve, there is increased focus on food quality and safety. Livestock products represented approximately
65%
of our revenue for the year ended
December 31, 2014
.
Our companion animal products help extend and improve the quality of life for pets; increase convenience and compliance for pet owners; and help veterinarians improve the quality of their care and the efficiency of their businesses. Growth in the companion animal medicines and vaccines sector is driven by economic development, related increases in disposable income and increases in pet ownership and spending on pet care. Companion animals are also living longer, receiving increased medical treatment and benefiting from advances in animal health medicines and vaccines. Companion animal products represented approximately
34%
of our revenue for the year ended
December 31, 2014
.
In addition, our Client Supply Services (CSS) organization provides contract manufacturing services to third parties and represented 1% of our total revenue for the year ended
December 31, 2014
.
Our major product categories are:
|
•
|
anti-infectives
: products that prevent, kill or slow the growth of bacteria, fungi or protozoa;
|
|
•
|
vaccines
: biological preparations that help prevent diseases of the respiratory, gastrointestinal and reproductive tracts or induce a specific immune response;
|
|
•
|
parasiticides
: products that prevent or eliminate external and internal parasites such as fleas, ticks and worms;
|
|
•
|
medicated feed additives
: products added to animal feed that provide medicines to livestock; and
|
|
•
|
other pharmaceutical products
: pain and sedation, oncology, antiemetic, allergy and dermatology; and reproductive products.
|
Our remaining revenue is derived from other product categories, such as nutritionals and agribusiness, as well as products and services in complementary areas, including diagnostics, genetics, biodevices and services.
As part of our growth strategy, through our research and development (R&D) group, we focus on the discovery and development of new chemical and biological entities, as well as product lifecycle development. Historically, a substantial portion of our products and revenue has been the result of product lifecycle development where we actively work to broaden the value of existing products by developing claims in additional species, more convenient formulations and combinations, and by expanding usage into more countries. For example, the first product in our ceftiofur line was an anti-infective approved for treating bovine respiratory disease (BRD) in cattle that was administered via intramuscular injection. Through follow-on studies and reformulations, we have expanded the product line into additional cattle claims and administration routes, as well as other species and regions. The ceftiofur product line currently includes the brands Excede, Excenel RTU, Excenel RTU EZ, Excenel, Naxcel and Spectramast.
Examples of our first-in-class and/or best-in-class products that we have launched in the past ten years and products that we believe may represent platforms for future product lifecycle development include:
|
•
|
Improvac/Improvest/Vivax, a protein product that works like an immunization, is currently the only product that provides a safe and effective alternative to physical castration to manage unpleasant aromas that can occur when cooking pork; launched in Australia and New Zealand in 2004, in Brazil in 2007, in certain European countries beginning in 2008, and in the United States in 2011;
|
|
•
|
Convenia, the first single-injection anti-infective for common bacterial skin infections in cats and dogs, launched in 2006;
|
|
•
|
Cerenia®, the first and only product on the market to prevent vomiting due to motion sickness in dogs, was first launched in Europe in 2006, followed by the United States in 2007;
|
|
•
|
Palladia, the first drug to be approved by the FDA for treating cancer in dogs, launched in 2009;
|
|
•
|
Inforce
TM
3, the first and only respiratory vaccine for cattle that prevents respiratory disease caused by bovine respiratory syncytial virus (BRSV) while also aiding in the prevention of infectious bovine rhinotracheitis (IBR) and parainfluenza
3
(PI
3
), launched in 2010;
|
|
•
|
Fostera® PCV MH was introduced in November 2013 and developed to help protect pigs from PCVAD and enzootic pneumonia caused by M. hyo. Unlike other combination vaccines that require field mixing, the one-bottle formulation of Fostera PCV MH allows the convenience of a one-dose program or the flexibility of a two-dose program; and
|
|
•
|
Apoquel, the first Janus kinase inhibitor for use in veterinary medicine, was approved for the control of pruritus associated with allergic dermatitis and the control of atopic dermatitis in dogs at least 12 months of age. We launched Apoquel in the United States, United Kingdom, Austria and Germany in January 2014 and expect other market launches to follow.
|
We pursue the development of new vaccines for emerging infectious diseases, with an operating philosophy of “first to know and fast to market.” Examples of the successful execution of this strategy include the first equine vaccine for West Nile virus in the United States and European Union; the first swine vaccine for pandemic H1N1 influenza virus in the United States; the first fully licensed vaccine to help reduce disease caused by the
4
|
Georgia 08 variant of infectious bronchitis virus (IBV) in poultry; and a conditionally licensed vaccine to help fight porcine epidemic diarrhea virus (PEDv) in the United States.
In
2014
, our top selling product line, the ceftiofur line, contributed approximately
8%
of our revenue. The ceftiofur line and our next two top selling products, Revolution and Draxxin, contributed approximately
21%
of our revenue. Our top ten product lines contributed
39%
of our revenue. Our product lines and products that represented approximately 1% or more of our revenue in
2014
, which comprise 59% of our total revenue, are as follows:
Livestock products
|
Product line / product
|
Description
|
Primary species
|
||
|
Anti-infectives
|
||||
|
Ceftiofur injectable line
|
Broad-spectrum cephalosporin antibiotic active against gram-positive and gram-negative bacteria, including ß-lactamase-producing strains, with some formulations producing a single course of therapy in one injection
|
Cattle, sheep, swine
|
||
|
Draxxin
|
Single-dose low-volume antibiotic for the treatment and prevention of bovine and swine respiratory disease, infectious bovine keratoconjunctivitis and bovine foot rot
|
Cattle, swine
|
||
|
Spectramast
|
Treatment of subclinical or clinical mastitis in dry or lactating dairy cattle, delivered via intramammary infusion; same active ingredient as the ceftiofur line
|
Cattle
|
||
|
Terramycin line
|
Antibiotic for the treatment of susceptible infections
|
Cattle, poultry, sheep, swine
|
||
|
Vaccines
|
||||
|
Bovi-shield
®
line
|
Aids in preventing diseases, including infectious bovine rhinotracheitis (IBR), bovine viral diarrhea (BVD) Types 1 and 2, parainfluenza
3
(PI
3
), bovine respiratory syncytial virus (BRSV), and leptospirosis caused by
Leptospira borgpetersenii
,
L.canicola, L grippotyphosa, L. hardjo,L. icterohaemorrhagiae, and L. pamona
, depending on formulation
|
Cattle
|
||
|
Improvac / Improvest / Vivax
|
Reduces boar taint, as an alternative to surgical castration
|
Swine
|
||
|
Rispoval
®
line
|
Aids in preventing three key viruses involved in cattle pneumonia-BRSV, PI
3
and BVD-as well as other respiratory diseases, depending on formulation
|
Cattle
|
||
|
Suvaxyn
®
PCV / Fostera™ PCV
|
Aids in preventing viremia and helps control lymphoid depletion caused by porcine circovirus
|
Swine
|
||
|
Parasiticides
|
||||
|
Cydectin
|
Injectable or pour-on endectocide to treat and control internal and external cattle parasites, including gastrointestinal roundworms, lungworms, cattle grubs, mites and lice
|
Cattle, sheep
|
||
|
Dectomax
|
Injectable or pour-on endectocide, characterized by extended duration of activity, for the treatment and control of internal and external parasite infections
|
Cattle, swine
|
||
|
Medicated Feed Additives
|
||||
|
Aureomycin
|
Provides livestock producers control, treatment and convenience against a wide range of respiratory, enteric and reproductive diseases
|
Cattle, poultry, sheep, swine
|
||
|
BMD
|
Aids in preventing and controlling enteritis; and increases rate of weight gain and improves feed efficiency in poultry and swine
|
Poultry, swine
|
||
|
Lasalocid line
|
Controls coccidiosis in poultry (Avatec) and cattle (Bovatec) and for increased rate of weight gain and improved feed efficiency in cattle
|
Poultry, cattle
|
||
|
Lincomycin line
|
Controls necrotic enteritis; treatment of dysentery (bloody scours), control of ileitis, treatment/reduction in severity of mycoplasmal pneumonia, increases weight gain in swine
|
Swine, poultry
|
||
|
Other
|
||||
|
Embrex
®
devices
|
Devices for enhancing hatchery operations' efficiency through
in ovo
detection and vaccination
|
Poultry
|
||
|
Lutalyse
|
For estrus control or in the induction of parturition or abortion
|
Cattle, swine
|
||
|
Orbeseal / Teatseal
|
Non-antibiotic intramammary infusion that prevents new intramammary infections in dairy cattle
|
Cattle
|
||
5
|
Companion animal products
|
Product line / product
|
Description
|
Primary species
|
||
|
Anti-infectives
|
||||
|
Clavamox / Synulox
|
A broad-spectrum antibiotic and the first and only potentiated penicillin approved for use in dogs and cats
|
Cats, dogs
|
||
|
Convenia
|
Anti-infective for the treatment of common bacterial skin infections that provides a course of treatment in a single injection
|
Cats, dogs
|
||
|
Vaccines
|
||||
|
Vanguard
®
L4 (4-way Lepto)
|
Compatible with the Vanguard line and helps protect against leptospirosis caused by
Leptospira canicola
,
L. grippotyphosa
,
L. icterohaemorrhagiae
and
L. pomona
|
Dogs
|
||
|
Vanguard line
|
Aids in preventing canine distemper caused by canine distemper virus, infectious canine hepatitis caused by canine adenovirus type 1, respiratory disease caused by canine adenovirus type 2, canine parainfluenza caused by canine parainfluenza virus and canine parvoviral enteritis caused by canine parvovirus
|
Dogs
|
||
|
Parasiticides
|
||||
|
Revolution / Stronghold
|
An antiparasitic for protection against fleas, heartworm disease and ear mites in cats and dogs; canine sarcoptic mites and American dog tick and roundworms and hookworms for cats
|
Cats, dogs
|
||
|
ProHeart
|
Prevents heartworm infestation; also for treatment of existing larval and adult hookworm infections
|
Dogs
|
||
|
Other
|
||||
|
Cerenia
|
A medication that prevents and treats acute vomiting in dogs, treats acute vomiting in cats and prevents vomiting due to motion sickness in dogs
|
Cats, dogs
|
||
|
Rimadyl
|
For the relief of pain and inflammation associated with osteoarthritis and for the control of postoperative pain associated with soft tissue and orthopedic surgeries
|
Dogs
|
||
International Operations
We directly market our products in approximately 70 countries across North America, Europe, Africa, Asia, Australia and South America, and our products are sold in more than 120 countries. Operations outside the United States accounted for
57%
of our total revenue for the year ended
December 31, 2014
. Through our efforts to establish an early and direct presence in many emerging markets, such as Brazil, China and India, emerging markets contributed
24%
of our revenue for the year ended
December 31, 2014
.
Our international businesses are subject, in varying degrees, to a number of risks inherent in carrying on business in other countries. These include, among other things, currency fluctuations, capital and exchange control regulations, expropriation and other restrictive government actions. See
Item 1A. Risk Factors— Risks related to our international operations
.
Sales and Marketing
Our sales organization includes sales representatives and technical and veterinary operations specialists. In markets where we do not have a direct commercial presence, we generally contract with distributors that provide logistics and sales and marketing support for our products.
Our sales representatives visit our customers, including veterinarians and livestock producers, to provide information and to promote and sell our products and services. Our technical and veterinary operations specialists,
who generally have advanced veterinary medicine degrees,
provide scientific consulting focused on disease management and herd management, training and education on diverse topics, including responsible product use. These direct relationships with customers allow us to understand the needs of our customers. Additionally, our sales representatives and technical and veterinary operations specialists partner with customers to provide training and support in areas of disease awareness and treatment protocols, including through the use of our products. As a result of these relationships, our sales and consulting visits are typically longer, more meaningful and provide us with better access to customer decision makers as compared to human health. As of
December 31, 2014
, our sales organization consisted of approximately
3,600
employees.
Our livestock and companion animal products are primarily available by prescription through a veterinarian. On a more limited basis, in certain markets, we sell certain products through local agricultural and farming retail outlets, pharmacies and pet stores. We also market our products by advertising to veterinarians, livestock producers and pet owners.
Customers
We sell our livestock products directly to a diverse set of livestock producers, including beef and dairy farmers as well as pork and poultry operations, and to veterinarians, third-party veterinary distributors and retail outlets that typically then sell the products to livestock producers. We primarily sell our companion animal products to veterinarians or to third-party veterinary distributors that typically then sell our products to veterinarians, and in each case veterinarians then typically sell our products to pet owners. Our two largest customers, both distributors, represented approximately 11% and 6%, respectively, of our revenue for the year ended
December 31, 2014
, and no other customer represented more than 4% of our revenue for the same period.
6
|
Research and Development
Our R&D operations are comprised of a dedicated veterinary medicine R&D organization, research alliances and other operations focused on the development or registration of our products. We spent $
396 million
in
2014
, $
399 million
in
2013
and $
409 million
in
2012
on R&D.
Our R&D efforts are comprised of more than 400 programs and reflect our commitment to better solutions. We create new insights for preventing and treating disease, and maximizing healthy performance, that result in the development of new platforms of knowledge which become the basis for continuous innovation. Leveraging internal discoveries, complemented by diverse external research collaborations, results in the delivery of novel vaccine, pharmaceutical and biopharmaceutical products to help our customers face their toughest challenges. While the development of new chemical and biological entities through new product R&D plays a critical role in our growth strategies, the majority of our R&D investment (including regulatory functions) is focused on product lifecycle development. A commitment to continuous innovation, based on customer need, ensures we actively work to broaden the value of existing products by developing claims in additional species, more convenient formulations and combinations, and by expanding usage into more countries. We also create opportunities to optimize solutions through our extensive capabilities in diagnostics and genetics research, ensuring we can help our customers diagnose, prevent and treat a variety of conditions.
We prioritize our R&D spending on an annual basis with the goal of aligning our of research and business objectives, and do not disaggregate our R&D operations by research stage or by therapeutic area for purposes of managing our business. We make our strategic investments in R&D based on four criteria: strategic fit and importance to our current portfolio; technical feasibility of development and manufacture; return on investment; and the needs of customers and the market. A centralized portfolio management function links development plans with financial systems to build a comprehensive view of the status of project progression and spend without a focus on spending by research stage or by therapeutic area. This comprehensive view facilitates our ability to set targets for project timing and goals for investment efficiency. The allocation of our R&D investment between product lifecycle and new product development, in addition to our ability to leverage the discoveries of our existing R&D and other industries, supports a cost-effective, efficient, sustainable and relatively predictable R&D process.
Prior to the IPO, we entered into an R&D collaboration and license agreement with Pfizer pursuant to which we will maintain access to Pfizer's proprietary compound library and database to develop new products, subject to certain restrictions. See
Item 13. Certain Relationships and Related Transactions, and Director Independence—Relationship with Pfizer—Research and development collaboration and license agreement
.
In addition, we regularly enter into R&D collaboration agreements and external alliances with other parties.
As of
December 31, 2014
, we employed approximately
1,100
employees in our global R&D operations. Our R&D headquarters is located in Kalamazoo, Michigan. We have R&D operations co-located with manufacturing sites in Melbourne, Australia; Louvain-la-Neuve, Belgium; Campinas, Brazil; Guarulhos, Brazil; Olot, Spain; Charles City, Iowa, United States and Lincoln, Nebraska, United States. We co-locate R&D operations with manufacturing sites to facilitate the efficient transfer of production processes from our laboratories to manufacturing. In addition, we maintain R&D operations in Zaventem, Belgium; São Paulo, Brazil; Beijing, China; Mumbai, India; and College Park, Maryland, United States and Durham, North Carolina, United States. We own each of these R&D facilities, with the exception of our Mumbai, India facility, which we lease from Pfizer. See
Item 13. Certain Relationships and Related Transactions, and Director Independence—Relationship with Pfizer—Mumbai, India interim lease agreement
. Each site is designed to meet the regulatory requirements for working with chemical or infectious disease agents.
Many of our research programs involve external partnerships, often with funding from a non-governmental organization or a government grant. We are generally responsible for providing technical direction and supplemental direct and indirect expertise in, as well as investment for, such external partnerships. Depending on the nature of the agreement, we may act as the commercialization partner for discoveries that originate during the period of collaborative research, or we may own or have exclusive rights to any intellectual property that enables the development of proprietary products or models.
Manufacturing and Supply Chain
Our products are manufactured at both sites operated by us and sites operated by third-party contract manufacturing organizations, which we refer to as CMOs. We have a global manufacturing network of
27
sites, which utilizes centralized oversight of a system of 13 “anchor” and 14 “satellite” manufacturing sites to maximize cost efficiencies.
7
|
Our global manufacturing network is comprised of the following sites:
|
Anchor Sites
|
Satellite Sites
|
|||||
|
Site
|
Location
|
Site
|
Location
|
|||
|
Catania
|
Italy
|
Campinas
|
Brazil
|
|||
|
Charles City
|
Iowa, U.S.
|
Durham
|
North Carolina, U.S.
|
|||
|
Chicago Heights
|
Illinois, U.S.
|
Eagle Grove
|
Iowa, U.S.
|
|||
|
Guarulhos
(1)
|
Brazil
|
Hsinchu
(4)
|
Taiwan
|
|||
|
Haridwar
|
India
|
Laurinburg
|
North Carolina, U.S.
|
|||
|
Jilin
(2)
|
China
|
Longmont
|
Colorado, U.S.
|
|||
|
Kalamazoo
(3)
|
Michigan, U.S.
|
Medolla
|
Italy
|
|||
|
Lincoln
|
Nebraska, U.S.
|
Salisbury
|
Maryland, U.S.
|
|||
|
Louvain-la-Neuve
|
Belgium
|
San Diego
|
California, U.S.
|
|||
|
Melbourne
|
Australia
|
Shenzhou
|
China
|
|||
|
Olot
|
Spain
|
Van Buren
|
Arkansas, U.S.
|
|||
|
Suzhou
|
China
|
Wellington
|
New Zealand
|
|||
|
Willow Island
|
West Virginia, U.S.
|
White Hall
|
Illinois, U.S.
|
|||
|
Yantai
|
China
|
|||||
|
(1)
|
This site is owned by us and leased back to Pfizer, pursuant to an arrangement by which Pfizer operates the manufacturing operations at the site for a period of time. See
Item 13.
Certain Relationships and Related Transactions, and Director Independence—Relationship with Pfizer—Brazil lease agreements.
|
|
(2)
|
This site is operated by the China joint venture, Jilin Zoetis Guoyuan Animal Health Company, Ltd.
|
|
(3)
|
Prior to the Separation, Pfizer's manufacturing site in Kalamazoo manufactured both human health and animal health products. Since the Separation, we own the portions of this site that predominantly manufacture animal health products and Pfizer owns the portions of this site that predominantly manufacture human health products.
|
|
(4)
|
This site is operated by the Taiwan joint venture, Zoetis Biotech Manufacturing Limited.
|
We own all of these sites, with the exception of our facilities in Melbourne, Australia; Medolla, Italy; Van Buren, Arkansas, United States; and San Diego, California, United States, which are leased sites.
In addition to our global manufacturing network and our CMOs, Pfizer continues to manufacture products for us at
11
Pfizer sites located in 11 countries pursuant to a master manufacturing and supply agreement. Included in these
11
Pfizer sites is our facility in Guarulhos, Brazil, where Pfizer will continue its manufacturing operations for a period of time. See
Item 13.
Certain Relationships and Related Transactions, and Director Independence—Relationship with Pfizer—Master manufacturing and supply agreements.
Our global manufacturing and supply chain is supported by a network of CMOs. As of
December 31, 2014
, this network was comprised of approximately
200
CMOs, including those centrally managed as well as local CMOs.
We select CMOs based on several factors: (i) their ability to reliably supply products or materials that meet our quality standards at an optimized cost; (ii) their access to niche products and technologies; (iii) capacity; and (iv) financial efficiency analyses. Our regional and global manufacturing teams seek to ensure that all of the CMOs we use adhere to our standards of manufacturing quality and are regularly audited.
We purchase certain raw materials necessary for the commercial production of our products from a variety of third-party suppliers. We utilize logistics service providers as a part of our global supply chain, primarily for shipping and logistics support.
We intend to continue our efficiency improvement programs in our manufacturing and supply chain organization, including Six Sigma and Lean capabilities, which are processes intended to improve manufacturing efficiency. We have strong globally managed and coordinated quality control and quality assurance programs in place at our global manufacturing network sites, and we regularly inspect and audit our global manufacturing network and CMO sites. We are currently conducting a review of our global manufacturing and supply network to improve efficiency.
Competition
Although our business is the largest based on revenue in the animal health medicines and vaccines industry, we face competition in the regions in which we compete. Principal drivers of competition vary depending on the particular region, species, product category and individual product, and include new product development, quality, price, service and promotion to veterinary professionals, pet owners and livestock producers.
Our primary competitors include animal health medicines and vaccines companies such as Merck Animal Health, the animal health division of Merck & Co., Inc. (formerly known as Intervet/Schering-Plough); Merial, the animal health division of Sanofi S.A.; Elanco, the animal health division of Eli Lilly and Company; Bayer Animal Health, the animal health division of Bayer AG; and Boehringer Ingelheim Animal Health, the animal health division of Boehringer Ingelheim GmbH. In addition, we compete with hundreds of other producers of animal health products throughout the world.
The level of competition from generic products varies from market to market. For example, the level of generic competition is higher in Europe and certain emerging markets than in the United States. Unlike in the human health market, there is no large, well-capitalized company focused on generic animal health products that exists as a global competitor in the industry. The reasons for this include the relatively smaller average market
8
|
size of each product opportunity, the importance of direct distribution and education to veterinarians and livestock producers and the primarily self-pay nature of the business. In addition, companion animal health products are often directly prescribed and dispensed by veterinarians.
Our livestock products tend to experience lower generic competition than our companion animal products for several reasons:
|
•
|
livestock producers tend to be loyal to medicines and vaccines that have been demonstrated to be efficacious because medicines and vaccines are a small portion of a livestock producer's total production costs and ineffective medicines and vaccines could result in the loss of animals, causing disproportionate harm to such producer's investment;
|
|
•
|
livestock producers value the technical assistance provided through our veterinary operations' support of our products and field force; and
|
|
•
|
the importance of reliable supply.
|
The importance of quality and safety concerns to pet owners, veterinarians and livestock producers also contributes to animal health brand loyalty. As a result, we believe that significant brand loyalty to products often continues after the loss of patent-based and regulatory exclusivity.
Intellectual Property
Our technology, brands and other intellectual property are important elements of our business. We rely on patent, trademark, copyright and trade secret laws, as well as regulatory exclusivity periods and non-disclosure agreements to protect our intellectual property rights. Our policy is to vigorously protect, enforce and defend our rights to our intellectual property, as appropriate.
Our product portfolio enjoys the protection of approximately 4,800 granted patents and 2,000 pending patent applications, filed in more than 60 countries, with concentration in our major market countries as well as other countries with strong patent systems, such as Australia, Brazil, Canada, Europe, Japan and the United States. Many of the patents and patent applications in our portfolio are the result of our own and Pfizer's work, while other patents and patent applications in our portfolio were at least partially developed by, and are licensed to us by, third parties.
Patents for individual products extend for varying periods depending on the date of the patent filing or grant and the legal term of patents in the countries where such patents are obtained. Several patents cover the ceftiofur product line, including formulation and use patents that begin expiring in the United States in 2015, with others extending until 2024. Draxxin and Convenia are covered by patents in the United States with terms that expire in 2021 and 2023, respectively. The compound patent on doramectin, which is the active ingredient in Dectomax, an antiparasitic, expired in all regions; however, process patents and the injectable formulation patent for this product do not expire in the United States until 2020 and 2016, respectively. The compound patent on selamectin, which is the active ingredient in Revolution, a parasiticide, expired during 2014; however, we have process and formulation patents covering this product expiring in 2018 and 2019, respectively.
Additionally, many of our vaccine products are based on proprietary master seeds and proprietary or patented adjuvant formulations. We actively seek to protect our proprietary information, including our trade secrets and proprietary know-how, including by seeking to require our employees, consultants, advisors and partners to enter into confidentiality agreements and other arrangements upon the commencement of their employment or engagement.
In order to facilitate the Separation and allow Pfizer and our operations to continue with minimal interruption, Pfizer has licensed to us the right to use certain intellectual property rights in the animal health field. We license to Pfizer the right to use certain of our trademarks and substantially all of our other intellectual property rights in the human health field and all other fields outside of animal health. In addition, Pfizer granted us a transitional license to use certain of Pfizer's trademarks and we granted Pfizer a transitional license to use certain of our trademarks for a period of time following the completion of the IPO.
We seek to file and maintain trademarks around the world based on commercial activities in most regions where we have, or desire to have, a business presence for a particular product or service. We currently maintain more than 10,000 trademark applications and registrations in major regions, identifying goods and services dedicated to the care of livestock and companion animals.
Regulatory
The sale of animal health products is governed by the laws and regulations specific to each country in which we sell our products. To maintain compliance with these regulatory requirements, we have established processes, systems and dedicated resources with end-to-end involvement from product concept to launch and maintenance in the market. Our regulatory function actively seeks to engage in dialogue with various global agencies regarding their policies that relate to animal health products. In the majority of our markets, the relevant animal health authority is separate from those governing human medicinal products.
United States
United States Food and Drug Administration (FDA).
The regulatory body that is responsible for the regulation of animal health pharmaceuticals in the United States is the Center for Veterinary Medicine (CVM), housed within the FDA. All manufacturers of animal health pharmaceuticals must show their products to be safe, effective and produced by a consistent method of manufacture as defined under the Federal Food, Drug and Cosmetic Act. The FDA's basis for approving a drug application is documented in a Freedom of Information Summary. Post-approval monitoring of products is required by law, with reports being provided to the CVM's Surveillance and Compliance group. Reports of product quality defects, adverse events or unexpected results are produced in accordance with the law. Additionally, we are required to submit all new information for a product, regardless of the source.
United States Department of Agriculture (USDA).
The regulatory body in the United States for veterinary vaccines is the USDA. The USDA's Center for Veterinary Biologics is responsible for the regulation of animal health vaccines, including immunotherapeutics. All manufacturers of animal health biologicals must show their products to be pure, safe, effective and produced by a consistent method of manufacture as defined under
9
|
the Virus Serum Toxin Act. Post-approval monitoring of products is required. Reports of product quality defects, adverse events or unexpected results are produced in accordance with the agency requirements.
Environmental Protection Agency (EPA).
The main regulatory body in the United States for veterinary pesticides is the EPA. The EPA's Office of Pesticide Programs is responsible for the regulation of pesticide products applied to animals. All manufacturers of animal health pesticides must show their products will not cause “unreasonable adverse effects to man or the environment” as stated in the Federal Insecticide, Fungicide, and Rodenticide Act. Within the United States, pesticide products that are approved by the EPA must also be approved by individual state pesticide authorities before distribution in that state. Post-approval monitoring of products is required, with reports provided to the EPA and some state regulatory agencies.
In addition, the U.S. Foreign Corrupt Practices Act (FCPA) prohibits U.S. corporations and their representatives from offering, promising, authorizing or making payments to any foreign government official, government staff member, political party or political candidate in an attempt to obtain or retain business abroad. The scope of the FCPA includes interactions with certain healthcare professionals in many countries. Other countries have enacted similar anti-corruption laws and/or regulations.
Outside the United States
European Union (EU).
The European Medicines Agency (EMA) is the centralized regulatory agency of the EU, located in London. The agency is responsible for the scientific evaluation of medicines developed by healthcare companies seeking centralized approval for use in the EU. The agency has a veterinary review section distinct from the medical review section. The Committee for Veterinary Medicinal Products (CVMP) is responsible for scientific and technical review of the submissions for innovative pharmaceuticals, biopharmaceuticals and vaccines. After the CVMP issues a positive opinion on the approvability of a product, the EU commission reviews the opinion and, if they agree with the CVMP, they grant the product market authorization. Once granted by the European Commission, a centralized marketing authorization is valid in all EU and European Economic Area-European Free Trade Association states. Products can also be registered in the EU via a decentralized route under the supervision of the Co-ordination Group for Mutual Recognition and Decentralized Procedures - Veterinary (CMDv). This co-ordination group is composed of one representative per member state from each national regulatory agency, including Norway, Iceland and Liechtenstein. The CMDv reviews submissions of pharmaceuticals and vaccines for authorization of a veterinary product in two or more member states in accordance with the mutual recognition or the decentralized procedure. A series of Regulations, Directives, Guidelines and EU Pharmacopeia Monographs provide the requirements for product approval in the EU. In general, these requirements are similar to those in the United States, requiring demonstrated evidence of, safety, efficacy, and quality/consistency of manufacturing processes.
Brazil.
The Ministry of Agriculture, Livestock Production and Supply (MAPA) is the regulatory body in Brazil that is responsible for the regulation and control of pharmaceuticals, biologicals and medicated feed additives for animal use. MAPA's regulatory activities are conducted through the Secretary of Agricultural Defense and its Livestock Products Inspection Department. In addition, regulatory activities are conducted at a local level through the Federal Agriculture Superintendence. These activities include the inspection and licensing of both manufacturing and commercial establishments for veterinary products, as well as the submission, review and approval of pharmaceuticals, biologicals and medicated feed additives. MAPA is one of the most active regulatory agencies in Latin America, having permanent seats at several international animal health forums, such as Codex Alimentarius, World Organization for Animal Health and Committee of Veterinary Medicines for the Americas. MAPA was also invited to be a Latin American representative at meetings of the International Cooperation on Harmonisation of Technical Requirements for Registration of Veterinary Medicinal Products (VICH). Several normative instructions issued by MAPA have set regulatory trends in Latin America.
Australia.
The Australian Pesticides and Veterinary Medicines Authority (APVMA) is an Australian government statutory authority established in 1993 to centralize the registration of all agricultural and veterinary products into the Australian marketplace. Previously each State and Territory government had its own system of registration. The APVMA assesses applications from companies and individuals seeking registration so they can supply their product to the marketplace. Applications undergo rigorous assessment using the expertise of the APVMA's scientific staff and drawing on the technical knowledge of other relevant scientific organizations, Commonwealth government departments and state agriculture departments. If the product works as intended and the scientific data confirms that when used as directed on the product label it will have no harmful or unintended effects on people, animals, the environment or international trade, the APVMA will register the product. As well as registering new agricultural and veterinary products, the APVMA reviews older products that have been on the market for a substantial period of time to ensure they still do the job users expect and are safe to use. The APVMA also reviews registered products when particular concerns are raised about their safety and effectiveness. The review of a product may result in confirmation of its registration, or it may see registration continue with some changes to the way the product can be used. In some cases the review may result in the registration of a product being cancelled and the product taken off the market.
Rest of world.
Country-specific regulatory laws have provisions that include requirements for certain labeling, safety, efficacy and manufacturers' quality control procedures (to assure the consistency of the products), as well as company records and reports. With the exception of the EU, most other countries' regulatory agencies will generally refer to the FDA, USDA, EU and other international animal health entities, including the World Organization for Animal Health, Codex Alimentarius, in establishing standards and regulations for veterinary pharmaceuticals and vaccines.
Global policy and guidance
Joint FAO/WHO Expert Committee on Food Additives.
The Joint FAO/WHO Expert Committee on Food Additives is an international expert scientific committee that is administered jointly by the Food and Agriculture Organization of the United Nations (FAO) and the World Health Organization (WHO). They provide a risk assessment/safety evaluation of residues of veterinary drugs in animal products, exposure and residue definition and maximum residue limit proposals for veterinary drugs. We work with them to establish acceptable safe levels of residual product in food-producing animals after treatment. This in turn enables the calculation of appropriate withdrawal times for our products prior to an animal entering the food chain.
Advertising and promotion review.
Promotion of prescription animal health products is controlled by regulations in many countries. These rules generally restrict advertising and promotion to those claims and uses that have been reviewed and endorsed by the applicable agency. We conduct a review of promotion materials for compliance with the local and regional requirements in the markets where we sell animal health products.
10
|
Food Safety Inspection Service/generally recognized as safe.
The FDA is authorized to determine the safety of substances (including “generally recognized as safe” substances, food additives and color additives), as well as prescribing safe conditions of use. However, although the FDA has the responsibility for determining the safety of substances, the Food Safety and Inspection Service, the public health agency in the USDA, still retains, under the tenets of the Federal Meat Inspection Act and the Poultry Products Inspection Act and their implementing regulations, the authority to determine that new substances and new uses of previously approved substances are suitable for use in meat and poultry products.
International Cooperation on Harmonisation of Technical Requirements for Registration of Veterinary Medicinal Products (VICH).
VICH is a trilateral (EU-Japan-USA) program aimed at harmonizing technical requirements for veterinary product registration. The objectives of the VICH are as follows:
|
•
|
Establish and implement harmonized technical requirements for the registration of veterinary medicinal products in the VICH regions, which meet high quality, safety and efficacy standards and minimize the use of test animals and costs of product development.
|
|
•
|
Provide a basis for wider international harmonization of registration requirements.
|
|
•
|
Monitor and maintain existing VICH guidelines, taking particular note of the ICH work program and, where necessary, update these VICH guidelines.
|
|
•
|
Ensure efficient processes for maintaining and monitoring consistent interpretation of data requirements following the implementation of VICH guidelines.
|
|
•
|
By means of a constructive dialogue between regulatory authorities and industry, provide technical guidance enabling response to significant emerging global issues and science that impact on regulatory requirements within the VICH regions.
|
Employees
As of
December 31, 2014
, we had more than
10,000
employees worldwide, which included approximately
4,150
employees in the United States and approximately
5,850
in other jurisdictions. Some of these employees are members of unions, works councils, trade associations or are otherwise subject to collective bargaining agreements, including approximately
50
union employees in the United States.
Environmental, Health and Safety
We are subject to various federal, state, local and foreign environmental, health and safety laws and regulations. These laws and regulations govern matters such as the emission and discharge of hazardous materials into the ground, air or water; the generation, use, storage, handling, treatment, packaging, transportation, exposure to, and disposal of hazardous and biological materials, including recordkeeping, reporting and registration requirements; and the health and safety of our employees. Due to our operations, these laws and regulations also require us to obtain, and comply with, permits, registrations or other authorizations issued by governmental authorities. These authorities can modify or revoke our permits, registrations or other authorizations and can enforce compliance through fines and injunctions.
Certain environmental laws, such as the U.S. Comprehensive Environmental Response, Compensation and Liability Act of 1980, as amended (CERCLA), impose joint and several liability, without regard to fault, for cleanup costs on persons who disposed of or released hazardous substances into the environment, including at third-party sites or offsite disposal locations, or that currently own or operate (or formerly owned or operated) sites where such a release occurred. In addition to clean-up actions brought by federal, state, local and foreign governmental entities, private parties could raise personal injury or other claims against us due to the presence of, or exposure to, hazardous materials on, from or otherwise relating to such a property.
We have made, and intend to continue to make, necessary expenditures for compliance with applicable environmental, health and safety laws and regulations. We are also a party to proceedings in which the primary relief sought is the cost of past and/or future remediation, or remedial measures to mitigate or remediate pollution. In connection with such proceedings, and otherwise, we are investigating and cleaning up environmental contamination from past industrial activity at certain sites, or financing other parties' completion of such activities. As a result, we incurred capital and operational expenditures in
2014
for environmental compliance purposes and for the clean-up of certain past industrial activities as follows:
|
•
|
environmental-related capital expenditures - $1 million; and
|
|
•
|
other environmental-related expenditures - $10 million.
|
However, we may not have identified all of the potential environmental liabilities relating to our current and former properties, or those liabilities associated with off-site disposal locations. Such liability could materially adversely affect our operating results and financial condition. Furthermore, regulatory agencies are showing increasing concern over the impact of animal health products and livestock operations on the environment. This increased regulatory scrutiny may necessitate that additional time and resources be spent to address these concerns in both new and existing products.
In connection with past acquisitions and divestitures, we have undertaken certain indemnification obligations that require us, or may require us in the future, to conduct or finance environmental cleanups at sites that we no longer own or operate. We have also entered into indemnification agreements in which we are being indemnified for various environmental cleanups; however, such indemnities are limited in both time and scope and may be further limited in the presence of new information, or may not be available at all.
While we cannot predict with certainty our future capital expenditures or operating costs for environmental compliance or remediation of contaminated sites, we have no reason to believe that they will have a material adverse effect on our operating results or financial condition.
11
|
Available Information
The company's Internet website address is www.zoetis.com. On our website, the company makes available, free of charge, its annual, quarterly and current reports, including amendments to such reports, as soon as reasonably practicable after the company electronically files such material with, or furnishes such material to, the Securities and Exchange Commission (SEC).
Also available on our website is information relating to corporate governance at Zoetis and our Board of Directors, including as follows: our Corporate Governance Principles; Director Qualification Standards; Zoetis Policies on Business Conduct (for all of our employees, including our Chief Executive Officer, Chief Financial Officer and Principal Accounting Officer); Code of Business Conduct and Ethics for our Directors; Board Committees and Committee Charters; and ways to communicate by email with our Directors. We will provide any of the foregoing information without charge upon written request to our Corporate Secretary, Zoetis Inc., 100 Campus Drive, Florham Park, New Jersey 07932. Information relating to shareholder services is also available on our website.
We use our website (www.zoetis.com) as a means of disclosing material non-public information and for complying with our disclosure obligations under Regulation Fair Disclosure promulgated by the SEC. These disclosures are included on our website (www.zoetis.com) in the “Investors” and “News & Media” sections. Accordingly, investors should monitor these portions of our website (www. zoetis.com), in addition to following our press releases, SEC filings and public conference calls and webcasts.
The information contained on our website does not constitute, and shall not be deemed to constitute, a part of this
2014
Annual Report, or any other report we file with, or furnish to, the SEC. Our references to the URLs for websites are intended to be inactive textual references only.
Item 1A. Risk Factors.
In addition to the other information in this 2014 Annual Report, any of the factors described below could materially adversely affect our operating results, financial condition and liquidity, which could cause the trading price of our securities to decline.
This report contains “forward-looking” statements within the meaning of the Private Securities Litigation Reform Act of 1995. Forward-looking statements reflect our current views with respect to, among other things, future events and performance. We generally identify forward-looking statements by words such as “anticipate,” “estimate,” “could,” “expect,” “intend,” “project,” “plan,” “predict,” “believe,” “seek,” “continue,” “outlook,” “may,” “might,” “will,” “should,” “can have,” “likely” or the negative version of these words or comparable words or by using future dates in connection with any discussion of future performance, actions or events. Forward-looking statements are based on beliefs and assumptions made by management using currently available information. These statements are not guarantees of future performance, actions or events.
In particular, forward-looking statements include statements relating to our indebtedness, our ability to make interest and principal payments on our indebtedness, our ability to satisfy the covenants contained in our indebtedness, the redemption of the notes, expectations regarding indebtedness, the repurchase of shares, future use of cash and dividend payments, future actions, business plans or prospects, prospective products, product approvals or products under development, R&D costs, timing and likelihood of success, future operating or financial performance, future results of current and anticipated products and services, strategies, sales efforts, expenses, production efficiencies, production margins, interest rates, foreign exchange rates, growth in emerging markets, the outcome of contingencies, such as legal proceedings, our agreements with Pfizer, the expected timing and content of regulatory actions, government regulation and financial results. Forward-looking statements are subject to risks and uncertainties, many of which are beyond our control, and are potentially inaccurate assumptions. However, there may also be other risks that we are unable to predict at this time. If one or more of these risks or uncertainties materialize, or if management's underlying beliefs and assumptions prove to be incorrect, actual results may differ materially from those contemplated by a forward-looking statement. You should not put undue reliance on forward-looking statements. Forward-looking statements speak only as of the date on which they are made.
We undertake no obligation to publicly update forward-looking statements, whether as a result of new information, future events or otherwise, except as required by law or by the rules and regulations of the SEC. You are advised, however, to consult any further disclosures we make on related subjects in our Form 10-Q and 8-K reports and our other filings with the SEC. We note these factors for investors as permitted by the Private Securities Litigation Reform Act of 1995. You should understand that it is not possible to predict or identify all such factors. Consequently, you should not consider the following to be a complete discussion of all potential risks or uncertainties.
Risks related to our business and industry
Restrictions and bans on the use of antibacterials in food-producing animals may become more prevalent.
The issue of the potential transfer of increased antibacterials resistance in bacteria from food-producing animals to human pathogens, and the causality of that transfer, continue to be the subject of global scientific and regulatory discussion. Antibacterials refer to small molecules that can be used to treat or prevent bacterial infections and are a sub-categorization of the products that make up our anti-infectives and medicated feed additives portfolios. In some countries, this issue has led to government restrictions and bans on the use of specific antibacterials in some food-producing animals, regardless of the route of administration (in feed or injectable). These restrictions are more prevalent in countries where animal protein is plentiful and governments are willing to take action even when there is scientific uncertainty. Our total revenue attributable to antibacterials for livestock was approximately
$1.3 billion
for the year ended
December 31, 2014
.
In December 2013, the FDA announced final guidance establishing procedures for the voluntary phase out in the United States over a three year period of the use of medically important antibacterials in animal feed for growth promotion in food production animals (medically important antibacterials include classes that are prescribed in animal and human health). The guidance provides for continued use of antibacterials in food producing animals for treatment, control and under certain circumstances for prevention of disease, all under the supervision of a veterinarian. Our total revenue attributable to medicated feed additives was approximately
$479 million
for the year ended
December 31, 2014
. The FDA indicated that they took this action to help preserve the efficacy of medically important antibacterials to treat infections in humans. Zoetis supports the FDA's
12
|
efforts to voluntarily phase-out growth promotion indications for medically important antibiotics in food producing animals and will comply with procedures outlined in the December 2013 FDA guidance.
In addition, in October 2014, the French Parliament passed a law that,
inter-alia
, prohibits rebates and discounts on antibiotics and requires the reporting of antibiotics sold to and agreements entered into with certain animal healthcare providers (including veterinarians, veterinary schools, pharmacists and students). The Parliament indicated that the law is in response to a government initiative aimed at fighting antimicrobial resistance in animals and reducing the use of certain categories of antibiotics by 25% (compared to 2013) by December 31, 2016.
We cannot predict whether antibacterials resistance concerns will result in additional restrictions or bans, expanded regulations or public pressure to discontinue or reduce use of antibacterials in food-producing animals, which could materially adversely affect our operating results and financial condition.
Perceived adverse effects on human health linked to the consumption of food derived from animals that utilize our products could cause a decline in the sales of such products.
Our livestock business depends heavily on a healthy and growing livestock industry. If the public perceives a risk to human health from the consumption of the food derived from animals that utilize our products, there may be a decline in the production of such food products and, in turn, demand for our products. For example, livestock producers may experience decreased demand for their products or reputational harm as a result of evolving consumer views of animal rights, nutrition and health-related or other concerns. Any reputational harm to the livestock industry may also extend to companies in related industries, including our company. Adverse consumer views related to the use of one or more of our products in livestock also may result in a decrease in the use of such products and could have a material adverse effect on our operating results and financial condition.
Increased regulation or decreased governmental financial support relating to the raising, processing or consumption of food-producing animals could reduce demand for our livestock products.
Companies in the livestock industries are subject to extensive and increasingly stringent regulations. If livestock producers are adversely affected by new regulations or changes to existing regulations, they may reduce herd sizes or become less profitable and, as a result, they may reduce their use of our products, which may materially adversely affect our operating results and financial condition. Furthermore, adverse regulations related, directly or indirectly, to the use of one or more of our products may injure livestock producers' market position. More stringent regulation of the livestock industry or our products could have a material adverse effect on our operating results and financial condition. Also, many food-producing companies, including livestock producers, benefit from governmental subsidies, and if such subsidies were to be reduced or eliminated, these companies may become less profitable and, as a result, may reduce their use of our products.
An outbreak of infectious disease carried by animals could negatively affect the sale and production of our products.
Sales of our livestock products could be materially adversely affected by the outbreak of disease carried by animals, such as avian influenza, foot-and-mouth disease or bovine spongiform encephalopathy (otherwise known as BSE or mad cow disease) or porcine epidemic diarrhea virus (otherwise known as PEDv), which could lead to the widespread death or precautionary destruction of animals as well as the reduced consumption and demand for animal protein. In addition, outbreaks of disease carried by animals may reduce regional or global sales of particular animal-derived food products or result in reduced exports of such products, either due to heightened export restrictions or import prohibitions, which may reduce demand for our products due to reduced herd or flock sizes. For example, the outbreaks of PEDv that have seriously impacted swine herds in Asia since 2012 and the United States since 2013 spread to additional markets in 2014, including Canada, Mexico, Japan, Taiwan, Spain and Portugal. The continued spread of PEDv in the United States, Asia, Europe and neighboring countries could impact the size of swine herds and the demand for our swine products in these markets. In addition, in 2012, the USDA and the World Animal Health Organization announced that individual cases of BSE had been identified in California and Brazil. These announcements caused certain countries to implement additional inspections of, or suspend the importation of, U.S. and Brazilian beef. While the restrictions that were implemented as a result of these cases of BSE have not significantly affected demand for our products, the discovery of additional cases of BSE may result in additional restrictions related to, or reduced demand for, animal protein, which may have a material adverse effect on our operating results and financial condition. Also, the outbreak of any highly contagious disease near our main production sites could require us to immediately halt production of our products at such sites or force us to incur substantial expenses in procuring raw materials or products elsewhere.
Consolidation of our customers could negatively affect the pricing of our products.
Veterinarians and livestock producers are our primary customers. In recent years, there has been a trend towards the concentration of veterinarians in large clinics and hospitals. In addition, livestock producers, particularly swine and poultry producers, have seen recent consolidation in their industries. If these trends towards consolidation continue, these customers could attempt to improve their profitability by leveraging their buying power to obtain favorable pricing. The resulting decrease in our prices could have a material adverse effect on our operating results and financial condition.
Our business may be negatively affected by weather conditions and the availability of natural resources.
The animal health industry and demand for many of our animal health products in a particular region are affected by weather conditions, as usage of our products follows varying weather patterns and weather-related pressures from pests, such as ticks. As a result, we may experience regional and seasonal fluctuations in our results of operations.
In addition, veterinary hospitals and practitioners depend on visits from and access to animals under their care. Veterinarians’ patient volume and ability to operate could be adversely affected if they experience prolonged snow, ice or other weather conditions, particularly in regions not accustomed to sustained inclement weather. Furthermore, livestock producers depend on the availability of natural resources, including large supplies of fresh water. Their animals' health and their ability to operate could be adversely affected if they experience a shortage of fresh water due to human population growth or floods, droughts or other weather conditions. In the event of adverse weather conditions or a shortage of fresh water, veterinarians or livestock producers may purchase less of our products.
13
|
For example, the widespread drought that impacted the United States in 2011, 2012 and in some regions in 2013 was considered the worst in many years, impacting both the supply of corn and the availability of grazing pasture and resulting in a reduction in the total cow herd in 2013. A decrease in harvested corn may result in higher corn prices, which may impact the profitability of livestock producers of cattle, pork and poultry. Higher corn prices may contribute to reductions in herd or flock sizes that may result in reduced spending on animal health products. Reduced availability of grazing pasture may also force cattle producers to cull their herds. Fewer heads of cattle would result in reduced demand for our products. A prolonged drought could have a material adverse effect on our operating results and financial condition.
Our business is subject to risk based on global economic conditions.
Macroeconomic, business and financial disruptions could have a material adverse effect on our operating results, financial condition and liquidity. Certain of our customers and suppliers could be affected directly by an economic downturn and could face credit issues or cash flow problems that could give rise to payment delays, increased credit risk, bankruptcies and other financial hardships that could decrease the demand for our products or hinder our ability to collect amounts due from customers. For example, the economic downturns experienced in many markets across the globe have had an impact on certain of our customers and, as a result, on our operating results in those affected markets. If one or more of our large customers, including distributors discontinue their relationship with us as a result of economic conditions or otherwise, our operating results and financial condition may be materially adversely affected. In addition, economic concerns may cause some pet owners to forgo or defer visits to veterinary practices or could reduce their willingness to treat pet health conditions or even to continue to own a pet. Furthermore, our exposure to credit and collectability risk is higher in certain international markets and our ability to mitigate such risks may be limited. While we have procedures to monitor and limit exposure to credit and collectability risk, there can be no assurances such procedures will effectively limit such risk and avoid losses.
Our business is subject to risk based on customer exposure to rising costs and reduced customer income.
Feed, fuel and transportation and other key costs for livestock producers may increase or animal protein prices or sales may decrease. Either of these trends could cause deterioration in the financial condition of our livestock product customers, potentially inhibiting their ability to purchase our products or pay us for products delivered. Our livestock product customers may offset rising costs by reducing spending on our products, including by switching to lower-cost alternatives to our products. In addition, concerns about the financial resources of pet owners also could cause veterinarians to alter their treatment recommendations in favor of lower-cost alternatives to our products. These shifts could result in a decrease in sales of our companion animal products, especially in developed countries where there is a higher rate of pet ownership.
Changes in distribution channels for companion animal products could negatively impact our market share, margins and distribution of our products.
In most markets, companion animal owners typically purchase their animal health products directly from veterinarians. Companion animal owners increasingly have the option to purchase animal health products from sources other than veterinarians, such as Internet-based retailers, “big-box” retail stores or other over-the-counter distribution channels. This trend has been demonstrated by the significant shift away from the veterinarian distribution channel in the sale of flea and tick products in recent years. Companion animal owners also could decrease their reliance on, and visits to, veterinarians as they rely more on Internet-based animal health information. Because we market our companion animal prescription products through the veterinarian distribution channel, any decrease in visits to veterinarians by companion animal owners could reduce our market share for such products and materially adversely affect our operating results and financial condition. In addition, companion animal owners may substitute human health products for animal health products if human health products are deemed to be lower-cost alternatives.
Legislation has also been proposed in the United States, and may be proposed in the United States or abroad in the future, that could impact the distribution channels for our companion animal products. For example, such legislation may require veterinarians to provide pet owners with written prescriptions and disclosure that the pet owner may fill prescriptions through a third party, which may further reduce the number of pet owners who purchase their animal health products directly from veterinarians. Such requirements may lead to increased use of generic alternatives to our products or the increased substitution of our products with other animal health products or human health products if such other products are deemed to be lower-cost alternatives. Many states already have regulations requiring veterinarians to provide prescriptions to pet owners upon request and the American Veterinary Medical Association has long-standing policies in place to encourage this practice.
Over time, these and other competitive conditions may increase our reliance on Internet-based retailers, “big-box” retail stores or other over-the-counter distribution channels to sell our companion animal products. We may be unable to sustain our current margins and we may not be adequately prepared or able to distribute our products if an increased portion of our sales is through these channels. Any of these events could materially adversely affect our operating results and financial condition.
The animal health industry is highly competitive.
The animal health industry is highly competitive. We believe many of our competitors are conducting R&D activities in areas served by our products and in areas in which we are developing products. Our competitors include the animal health businesses of large pharmaceutical companies and specialty animal health businesses. There are several new start-up companies working in the animal health area. These competitors may have access to greater financial, marketing, technical and other resources. As a result, they may be able to devote more resources to developing, manufacturing, marketing and selling their products, initiating or withstanding substantial price competition or more readily taking advantage of acquisitions or other opportunities. In addition to competition from established market participants, new entrants to the animal health medicines and vaccines industry could substantially reduce our market share or render our products obsolete.
To the extent that any of our competitors are more successful with respect to any key competitive factor or we are forced to reduce, or are unable to raise, the price of any of our products in order to remain competitive, our operating results and financial condition could be materially adversely affected. Competitive pressure could arise from, among other things, safety and efficacy concerns, limited demand growth or a significant number of additional competitive products being introduced into a particular market, price reductions by competitors, the ability of competitors to capitalize on their economies of scale, the ability of competitors to produce or otherwise procure animal health products at lower costs than us and the ability of competitors to access more or newer technology than us.
14
|
Generic products may be viewed as more cost-effective than our products.
We face competition from products produced by other companies, including generic alternatives to our products. We depend on patents and data exclusivity periods to provide us with exclusive marketing rights for some of our products. Our patent protection for these products extends for varying periods in accordance with the dates of filing or grant and the legal life of patents in countries in which patents are granted. The protection afforded by our patents, which varies from country to country, is limited by the following in the applicable country: the scope and applicable terms of our patents and the availability and enforcement of legal remedies. As a result, we may face competition from lower-priced generic alternatives to many of our products. Generic competitors are becoming more aggressive in terms of launching at risk before our patent rights expire, and their pricing, and generic products are an increasing percentage of overall animal health sales in certain regions. In addition, private label products may compete with our products. If animal health customers increase their use of new or existing generic or private label products, our operating results and financial condition could be materially adversely affected. We estimate that approximately
80%
of our revenue in 2014 was derived from products that are either unpatented (i.e., never patented or off-patent) or covered by our patents that, while providing a competitive advantage, may not provide market exclusivity. Over the next several years, several of our products' patents will expire. For example, our compound patent on selamectin, the active ingredient in Revolution and Stronghold, expired in several countries in January 2014, which could lead to the launch of generic counterparts, if generic manufacturers are able to successfully design-around our formulation and process patents.
We may not successfully acquire and integrate other businesses, license rights to technologies or products, form and manage alliances or divest businesses.
We may pursue acquisitions, technology licensing arrangements, strategic alliances or divestitures of some of our businesses as part of our business strategy. We may not complete these transactions in a timely manner, on a cost-effective basis or at all. In addition, we may be subject to regulatory constraints or limitations or other unforeseen factors that prevent us from realizing the expected benefits. Even if we are successful in making an acquisition, the products and technologies that are acquired may not be successful or may require significantly greater resources and investments than originally anticipated. We may be unable to integrate acquisitions successfully into our existing business, and we may be unable to achieve expected gross margin improvements or efficiencies. We also could incur or assume significant debt and unknown or contingent liabilities. Our reported results of operations could be negatively affected by acquisition or disposition-related charges, amortization of expenses related to intangibles and charges for impairment of long-term assets. We may be subject to litigation in connection with, or as a result of, acquisitions, dispositions, licenses or other alliances, including claims from terminated employees, customers or third parties, and we may be liable for future or existing litigation and claims related to the acquired business, disposition, license or other alliance because either we are not indemnified for such claims or the indemnification is insufficient. These effects could cause us to incur significant expenses and could materially adversely affect our operating results and financial condition.
We may not successfully implement our business strategies or achieve expected gross margin improvements.
We are pursuing, and will continue to pursue, strategic initiatives that management considers critical to our long-term success, including, but not limited to, increasing sales in emerging markets, operational revenue growth through new product development and value-added product lifecycle development; improving operational efficiency through manufacturing efficiency improvement and other programs; using cash flow from operations to service or reduce debt; and expanding our complementary products and services. In addition to base revenue growth, we also have historically grown our business through Pfizer's acquisitions of large pharmaceutical companies that had animal health businesses, including the Fort Dodge Animal Health (FDAH) business of Wyeth and the Alpharma Animal Health business of King Pharmaceuticals, Inc. However, as a result of the Separation, we are no longer able to benefit from Pfizer's acquisition activity. We also have acquired or partnered with a number of smaller animal health businesses, and we intend to continue to do so in the future. There are significant risks involved with the execution of these initiatives, including significant business, economic and competitive uncertainties, many of which are outside of our control. Accordingly, we cannot predict whether we will succeed in implementing these strategic initiatives. It could take several years to realize the anticipated benefits from these initiatives, if any benefits are achieved at all. We may be unable to achieve expected gross margin improvements on our products and technologies, including those acquired and those developed internally. Additionally, our business strategy may change from time to time, which could delay our ability to implement initiatives that we believe are important to our business.
Our business could be affected adversely by labor disputes, strikes or work stoppages.
Some of our employees are members of unions, works councils, trade associations or are otherwise subject to collective bargaining agreements in certain jurisdictions, including the United States. As a result, we are subject to the risk of labor disputes, strikes, work stoppages and other labor-relations matters. We may be unable to negotiate new collective bargaining agreements on similar or more favorable terms and may experience work stoppages or other labor problems in the future at our sites. These risks may be increased by the Separation because we are no longer able to benefit from Pfizer's prior relationships and negotiations relating to such agreements. We could experience a disruption of our operations or higher ongoing labor costs, which could have a material adverse effect on our operating results and financial condition, potentially resulting in canceled orders by customers, unanticipated inventory accumulation or shortages and reduced revenue and net income. In addition, labor problems at our suppliers or CMOs could have a material adverse effect on our operating results and financial condition.
Loss of our executive officers could disrupt our operations.
We depend on the efforts of our executive officers. Our executive officers are not currently, and are not expected to be, subject to non-compete provisions. In addition, we have not entered into employment agreements with our executive officers. Any unplanned turnover or our failure to develop an adequate succession plan for one or more of our executive officer positions could deplete our institutional knowledge base and erode our competitive advantage. The loss or limited availability of the services of one or more of our executive officers, or our inability to recruit and retain qualified executive officers in the future, could, at least temporarily, have a material adverse effect on our operating results and financial condition.
15
|
We may be required to write down goodwill or identifiable intangible assets.
Under accounting principles generally accepted in the United States of America (U.S. GAAP), if we determine goodwill or identifiable intangible assets are impaired, we will be required to write down these assets and record a non-cash impairment charge. As of December 31, 2014, we had goodwill of $
976 million
and identifiable intangible assets, less accumulated amortization, of $
727 million
. Identifiable intangible assets consist primarily of developed technology rights, brands, trademarks, license agreements, patents and in-process R&D.
Determining whether an impairment exists and the amount of the potential impairment involves quantitative data and qualitative criteria that are based on estimates and assumptions requiring significant management judgment. Future events or new information may change management's valuation of an intangible asset in a short amount of time. The timing and amount of impairment charges recorded in our consolidated and combined statements of income and write-downs recorded in our consolidated balance sheets could vary if management's conclusions change. Any impairment of goodwill or identifiable intangible assets could have a material adverse effect on our operating results and financial position.
Our historical combined financial data is not necessarily representative of the results we would have achieved as an independent company and may not be a reliable indicator of our future results.
Our historical combined financial data for the periods prior to the IPO (the years ended December 31, 2010, 2011 and 2012, and the period ended January 31, 2013) included in this 2014 Annual Report does not reflect the financial condition, results of operations or cash flows we would have achieved as an independent company during the periods presented or those we will achieve in the future. This is primarily the result of the following factors:
|
•
|
our historical combined financial data does not reflect the Separation;
|
|
•
|
our historical combined financial data reflects expense allocations for certain support functions that are provided on a centralized basis within Pfizer, such as expenses for business technology, facilities, legal, finance, human resources, business development, public affairs and procurement, as well as certain manufacturing and supply costs incurred by manufacturing sites that are shared with other Pfizer business units that may be higher or lower than the comparable expenses we would have actually incurred, or will incur, as an independent company;
|
|
•
|
our cost of debt and our capital structure is different from that reflected in our historical combined financial statements;
|
|
•
|
significant increases may occur in our cost structure as a result of our being an independent public company, including costs related to public company reporting, investor relations and compliance with the Sarbanes-Oxley Act of 2002 (Sarbanes-Oxley Act); and
|
|
•
|
loss of economies of scale as a result of our no longer being a part of Pfizer.
|
Our financial condition and future results of operations will be materially different from amounts reflected in our historical combined financial statements included in this 2014 Annual Report for the periods prior to the IPO. As a result of the Separation, it may be difficult for investors to compare our future results to historical results or to evaluate our relative performance or trends in our business.
As an independent public company, we are required to expend additional time and resources to comply with rules and regulations that did not previously apply to us, and failure to comply with such rules may lead investors to lose confidence in our financial data.
As an independent public company, we are subject to the reporting requirements of the Securities Exchange Act of 1934, as amended (the Exchange Act), the Sarbanes-Oxley Act, the Dodd-Frank Wall Street Reform and Consumer Protection Act, or the Dodd-Frank Act, and regulations of the NYSE. Such requirements have increased our legal, accounting and financial compliance costs, have made some activities more difficult, time-consuming and costly and require additional resources. We are devoting significant resources to address these public company-associated requirements, including compliance programs and investor relations, as well as our financial reporting obligations. Complying with these rules and regulations has increased and will increase our legal and financial compliance costs and makes some activities more time-consuming and costly.
In particular, as a public company, our management is required to conduct an annual evaluation of our internal controls over financial reporting and include a report of management on our internal controls in our Annual Reports on Form 10-K. In addition, we are required to have our independent registered public accounting firm attest to the effectiveness of our internal controls over financial reporting pursuant to Auditing Standard No. 5 beginning with this 2014 Annual Report. If we are unable to conclude that we have effective internal controls over financial reporting, or if our registered public accounting firm is unable to provide us with an attestation and an unqualified report as to the effectiveness of our internal controls over financial reporting, investors could lose confidence in the reliability of our financial statements, which could result in a decrease in the value of our securities.
Risks related to research and development
Our R&D, acquisition and licensing efforts may fail to generate new products and product lifecycle developments.
Our future success depends on both our existing product portfolio and our pipeline of new products, including new products that we may develop through joint ventures and products that we are able to obtain through license or acquisition. We commit substantial effort, funds and other resources to R&D, both through our own dedicated resources and through collaborations with third parties.
We may be unable to determine with accuracy when or whether any of our products now under development will be approved or launched, or we may be unable to develop, license or otherwise acquire product candidates or products. In addition, we cannot predict whether any products, once launched, will be commercially successful or will achieve sales and revenue that are consistent with our expectations. The animal health industry is subject to regional and local trends and regulations and, as a result, products that are successful in some of our markets may not achieve similar success when introduced into new markets. Furthermore, the timing and cost of our R&D may increase, and our R&D may become less predictable. For example, changes in regulations applicable to our industry may make it more time-consuming and/or costly to research, develop and register products.
16
|
Products in the animal health industry are sometimes derived from molecules and compounds discovered or developed as part of human health research. In addition to the R&D collaboration and license agreement with Pfizer, we expect to enter into other collaboration or licensing arrangements with third parties to provide us with access to compounds and other technology for purposes of our business. Such agreements are typically complex and require time to negotiate and implement. If we enter into these arrangements, we may not be able to maintain these relationships or establish new ones in the future on acceptable terms or at all. In addition, any collaboration that we enter into may not be successful, and the success may depend on the efforts and actions of our collaborators, which we may not be able to control. If we are unable to access human health-generated molecules and compounds to conduct R&D on cost-effective terms, our ability to develop some types of new products could be limited.
Advances in veterinary medical practices and animal health technologies could negatively affect the market for our products.
The market for our products could be impacted negatively by the introduction and/or broad market acceptance of newly-developed or alternative products that address the diseases and conditions for which we sell products, including “green” or “holistic” health products or specially bred disease-resistant animals. In addition, technological breakthroughs by others may obviate our technology and reduce or eliminate the market for our products. Introduction or acceptance of such products or technologies could materially adversely affect our operating results and financial condition.
Our R&D relies on evaluations in animals, which may become subject to bans or additional regulations.
As an animal health medicines and vaccines business, the evaluation of our existing and new products in animals is required to register our products. Animal testing in certain industries has been the subject of controversy and adverse publicity. Some organizations and individuals have attempted to ban animal testing or encourage the adoption of additional regulations applicable to animal testing. To the extent that the activities of such organizations and individuals are successful, our R&D, and by extension our operating results and financial condition, could be materially adversely affected. In addition, negative publicity about us or our industry could harm our reputation.
Risks related to manufacturing
Manufacturing problems and capacity imbalances may cause product launch delays, inventory shortages, recalls or unanticipated costs.
In order to sell our products, we must be able to produce and ship our products in sufficient quantities. We have a global manufacturing network consisting of
27
manufacturing sites located in
10
countries. In addition,
11
Pfizer sites located in
11
countries manufacture certain of our products for us. Included in these Pfizer sites is our facility in Guarulhos, Brazil, where Pfizer will continue its manufacturing operations for a period of time. These Pfizer sites consist of sites operated by Pfizer that, immediately prior to the Separation, predominantly manufactured human health products. We also employ a network of approximately
200
CMOs. Many of our products involve complex manufacturing processes and are sole-sourced from certain manufacturing sites.
Minor deviations in our manufacturing or logistical processes, such as temperature excursions or improper package sealing, could result in delays, inventory shortages, unanticipated costs, product recalls, product liability and/or regulatory action. In addition, a number of factors could cause production interruptions, including:
|
•
|
the failure of us or any of our vendors or suppliers, including logistical service providers, to comply with applicable regulations and quality assurance guidelines;
|
|
•
|
construction delays;
|
|
•
|
equipment malfunctions;
|
|
•
|
shortages of materials;
|
|
•
|
labor problems;
|
|
•
|
natural disasters;
|
|
•
|
power outages;
|
|
•
|
criminal and terrorist activities;
|
|
•
|
changes in manufacturing production sites and limits to manufacturing capacity due to regulatory requirements, changes in types of products produced, shipping distributions or physical limitations; and
|
|
•
|
the outbreak of any highly contagious diseases near our production sites.
|
These interruptions could result in launch delays, inventory shortages, recalls, unanticipated costs or issues with our agreements under which we supply third parties, which may adversely affect our operating results. For example, our manufacturing site in Medolla, Italy was damaged in an earthquake in May 2012, which resulted in production interruptions at that site.
Our manufacturing network may be unable to meet the demand for our products or we may have excess capacity if demand for our products changes. The unpredictability of a product's regulatory or commercial success or failure, the lead time necessary to construct highly technical and complex manufacturing sites, and shifting customer demand (including as a result of market conditions or entry of branded or generic competition) increase the potential for capacity imbalances. In addition, construction of sites is expensive, and our ability to recover costs will depend on the market acceptance and success of the products produced at the new sites, which is uncertain.
17
|
We rely on third parties to provide us with materials and services and are subject to increased labor and material costs.
The materials used to manufacture our products may be subject to availability constraints and price volatility caused by changes in demand, weather conditions, supply conditions, government regulations, economic climate and other factors. In addition, labor costs may be subject to volatility caused by the supply of labor, governmental regulations, economic climate and other factors. Increases in the demand for, availability or the price of, materials used to manufacture our products and increases in labor costs could increase the costs to manufacture our products. We may not be able to pass all or a material portion of any higher material or labor costs on to our customers, which could materially adversely affect our operating results and financial condition.
In addition, certain third-party suppliers are the sole source of certain materials necessary for production of our products. We may be unable to meet demand for certain of our products if any of our third-party suppliers cease or interrupt operations, fail to renew contracts with us or otherwise fail to meet their obligations to us.
Risks related to legal matters and regulation
We may incur substantial costs and receive adverse outcomes in litigation and other legal matters.
Our operating results, financial condition and liquidity could be materially adversely affected by unfavorable results in pending or future litigation matters. These matters include, among other things, allegations of violation of United States and foreign competition laws, labor laws, consumer protection laws, and environmental laws and regulations, as well as claims or litigations relating to product liability, intellectual property, securities, breach of contract and tort. In addition, changes in the interpretations of laws and regulations to which we are subject, or in legal standards in one or more of the jurisdictions in which we operate, could increase our exposure to liability. For example, in the United States, attempts have been made to allow damages for emotional distress and pain and suffering in connection with the loss of, or injury to, a companion animal. If such attempts were successful, our exposure with respect to product liability claims could increase materially.
Litigation matters, regardless of their merits or their ultimate outcomes, are costly, divert management's attention and may materially adversely affect our reputation and demand for our products. We cannot predict with certainty the eventual outcome of pending or future litigation matters. An adverse outcome of litigation or legal matters could result in our being responsible for significant damages. Any of these negative effects resulting from litigation matters could materially adversely affect our operating results and financial condition.
The misuse or off-label use of our products may harm our reputation or result in financial or other damages.
Our products have been approved for use under specific circumstances for the treatment of certain diseases and conditions in specific species. There may be increased risk of product liability if veterinarians, livestock producers, pet owners or others attempt to use our products off-label, including the use of our products in species (including humans) for which they have not been approved. For example, Ketamine, the active pharmaceutical ingredient in our Ketaset product (a nonnarcotic agent for anesthetic use in cats), is commonly abused by humans as a hallucinogen. Furthermore, the use of our products for indications other than those indications for which our products have been approved may not be effective, which could harm our reputation and lead to an increased risk of litigation. If we are deemed by a governmental or regulatory agency to have engaged in the promotion of any of our products for off-label use, such agency could request that we modify our training or promotional materials and practices and we could be subject to significant fines and penalties, and the imposition of these sanctions could also affect our reputation and position within the industry. Any of these events could materially adversely affect our operating results and financial condition.
The illegal distribution and sale by third parties of counterfeit or illegally compounded versions of our products or of stolen, diverted or relabeled products could have a negative impact on our reputation and business.
Third parties may illegally distribute and sell counterfeit or illegally compounded versions of our products that do not meet the exacting standards of our development, manufacturing and distribution processes. Counterfeit or illegally compounded medicines pose a significant risk to animal health and safety because of the conditions under which they are manufactured and the lack of regulation of their contents. Counterfeit or illegally compounded products are frequently unsafe or ineffective and can be potentially life-threatening to animals. Our reputation and business could suffer harm as a result of counterfeit or illegally compounded products sold under our brand name. In addition, products stolen or unlawfully diverted from inventory, warehouses, plants or while in transit, which are not properly stored or which have been repackaged or relabeled and which are sold through unauthorized channels, could adversely impact animal health and safety, our reputation and our business. Public loss of confidence in the integrity of vaccines and/or pharmaceutical products as a result of counterfeiting, illegally compounding or theft could have a material adverse effect on our product sales, business and results of operations.
Animal health products are subject to unanticipated safety, quality, or efficacy concerns, which may harm our reputation.
Unanticipated safety, quality, or efficacy concerns can arise with respect to animal health products, whether or not scientifically or clinically supported, leading to product recalls, withdrawals or suspended or declining sales, as well as product liability and other claims. For example, as a result of safety concerns related to our product, PregSure BVD, in 2010, we voluntarily suspended sales of the product and withdrew the marketing authorization in the EU and, in 2011, we suspended sales and withdrew the marketing authorization for the product in New Zealand. Also, in May 2013, we were advised that the European Commission started a procedure regarding the EU marketing authorization for Suvaxyn PCV, a vaccine against porcine circovirus type 2 in swine. The initiation of the procedure followed a recall of two batches of Suvaxyn PCV as a result of higher than expected adverse reactions, reported mainly in Spain. In June 2013, we completed a root cause investigation of the higher than expected adverse reactions in these two batches, and subsequently submitted to the EMA a proposed variation to describe specific adjustments to the manufacturing process to help minimize the risk of future reactive batches. In October 2013, the EMA’s Committee on Medicinal Products for Veterinary Use adopted a positive opinion as to the proposed variation and concurrently adopted an opinion concluding that no action was required at that time with regard to the EU marketing authorization for Suvaxyn PCV. Both opinions were transmitted to the European Commission according to the applicable procedure and the Commission officially advised us in January 2014 that it had adopted those positive opinions and concluded the procedure begun in May 2013 by maintaining the marketing authorization for Suvaxyn PCV in effect.
18
|
Regulatory actions based on these types of safety, quality or efficacy concerns could impact all or a significant portion of a product’s sales and could, depending on the circumstances, materially adversely affect our operating results.
In addition, since we depend on positive perceptions of the safety, quality and efficacy of our products, and animal health products generally, by our customers, veterinarians and end-users, any concerns as to the safety, qualify or efficacy of our products, whether actual or perceived, may harm our reputation. These concerns and the related harm to our reputation could materially adversely affect our operating results and financial condition, regardless of whether such reports are accurate.
Our business is subject to substantial regulation.
As a global company, we are subject to various state, federal and international laws and regulations, including regulations relating to the development, quality assurance, manufacturing, importation, distribution, marketing and sale of our products. In addition, our manufacturing facilities are subject to periodic inspections by regulatory agencies. An inspection may report conditions or practices that indicate possible violations of regulatory requirements. Our failure to comply with these regulatory requirements, allegations of such non-compliance or the discovery of previously unknown problems with a product or manufacturer could result in, among other things, inspection observation notices, warning letters or similar regulatory correspondence, fines, a partial or total shutdown of production in one or more of our facilities while an alleged violation is remediated, withdrawals or suspensions of current products from the market, and civil or criminal prosecution, as well as decreased sales as a result of negative publicity and product liability claims. Any one of these consequences could materially adversely affect our operating results and financial condition.
In addition, we will not be able to market new products unless and until we have obtained all required regulatory approvals in each jurisdiction where we propose to market those products. Even after a product reaches market, it may be subject to re-review and may lose its approvals. In connection with the Separation, we will likely change the location of the manufacture of certain of our products and, because of these changes, may be required to obtain new regulatory approvals. Our failure to obtain approvals, delays in the approval process, or our failure to maintain approvals in any jurisdiction, may prevent us from selling products in that jurisdiction until approval or reapproval is obtained, if ever.
Furthermore, we cannot predict the nature of future laws, regulations, or changes in tax laws, challenges brought against our incentive tax rulings, and tariffs, nor can we determine the effect that additional laws or regulations or changes in existing laws or regulations could have on our business when and if promulgated, or the impact of changes in the interpretation of these laws and regulations, or of disparate federal, state, local and foreign regulatory schemes. Changes to such laws or regulations may include, among other things, changes to taxation requirements, such as tax-rate changes and changes affecting the taxation by the United States of income earned outside the United States.
Changes in applicable federal, state, local and foreign laws and regulations could have a material adverse effect on our operating results and financial condition. For example, regulatory agencies have recently increased their focus on the potential for vaccines to induce immunity anomalies. Absent a clear understanding of these anomalies, regulatory scrutiny of vaccines may become stricter. Additional scrutiny or regulation of our vaccine products could materially adversely affect our operating results and financial condition.
We are subject to complex environmental, health and safety laws and regulations.
We are subject to various federal, state, local and foreign environmental, health and safety laws and regulations. These laws and regulations govern matters such as the emission and discharge of hazardous materials into the ground, air or water; the generation, use, storage, handling, treatment, packaging, transportation, exposure to, and disposal of hazardous and biological materials, including recordkeeping, reporting and registration requirements; and the health and safety of our employees. Due to our operations, these laws and regulations also require us to obtain, and comply with, permits, registrations or other authorizations issued by governmental authorities. These authorities can modify or revoke our permits, registrations or other authorizations and can enforce compliance through fines and injunctions.
Given the nature of our business, we have incurred, are currently incurring and may in the future incur, liabilities under CERCLA or under other federal, state, local and foreign environmental cleanup laws, with respect to our current or former sites, adjacent or nearby third-party sites, or offsite disposal locations. See
Item 1. Business—Environmental, Health and Safety
. The costs associated with future cleanup activities that we may be required to conduct or finance could be material. Additionally, we may become liable to third parties for damages, including personal injury and property damage, resulting from the disposal or release of hazardous materials into the environment. Such liability could materially adversely affect our operating results and financial condition. Furthermore, regulatory agencies are showing increasing concern over the impact of animal health products and livestock operations on the environment. This increased regulatory scrutiny may necessitate that additional time and resources be spent to address these concerns in both new and existing products.
Our failure to comply with the environmental, health and safety laws and regulations to which we are subject, including any permits issued thereunder, may result in environmental remediation costs, loss of permits, fines, penalties or other adverse governmental or private actions, including regulatory or judicial orders enjoining or curtailing operations or requiring corrective measures, installation of pollution control equipment or remedial measures. We could also be held liable for any and all consequences arising out of human exposure to hazardous materials or environmental damage. Environmental laws and regulations are complex, change frequently, have tended to become more stringent and stringently enforced over time and may be subject to new interpretation. We cannot assure you that our costs of complying with current and future environmental, health and safety laws, and our liabilities arising from past or future releases of, or exposure to, hazardous materials will not materially adversely affect our business, results of operations or financial condition.
Risks related to our international operations
A significant portion of our operations are conducted in foreign jurisdictions and are subject to the economic, political, legal and business environments of the countries in which we do business.
Our international operations could be limited or disrupted by any of the following:
|
•
|
volatility in the international financial markets;
|
19
|
|
•
|
compliance with governmental controls;
|
|
•
|
difficulties enforcing contractual and intellectual property rights;
|
|
•
|
parallel trade in our products (importation of our products from European Union countries where our products are sold at lower prices into European Union countries where the products are sold at higher prices);
|
|
•
|
compliance with a wide variety of laws and regulations, such as the FCPA and similar non-U.S. laws and regulations;
|
|
•
|
compliance with foreign labor laws;
|
|
•
|
burdens to comply with multiple and potentially conflicting foreign laws and regulations, including those relating to environmental, health and safety requirements;
|
|
•
|
changes in laws, regulations, government controls or enforcement practices with respect to our business and the businesses of our customers;
|
|
•
|
political and social instability, including crime, civil disturbance, terrorist activities and armed conflicts;
|
|
•
|
trade restrictions and restrictions on direct investments by foreign entities, including restrictions administered by the OFAC and the European Union, in relation to our products or the products of farmers and other customers (e.g., restrictions on the importation of agricultural products from the European Union to Russia)
;
|
|
•
|
changes in tax laws, challenges brought against our incentive tax rulings, and tariffs;
|
|
•
|
imposition of antidumping and countervailing duties or other trade-related sanctions;
|
|
•
|
costs and difficulties in staffing, managing and monitoring international operations; and
|
|
•
|
longer payment cycles and increased exposure to counterparty risk.
|
In addition, international transactions may involve increased financial and legal risks due to differing legal systems and customs. Compliance with these requirements may prohibit the import or export of certain products and technologies or may require us to obtain a license before importing or exporting certain products or technology. A failure to comply with any of these laws, regulations or requirements could result in civil or criminal legal proceedings, monetary or non-monetary penalties, or both, disruptions to our business, limitations on our ability to import and export products and services, and damage to our reputation. In addition, variations in the pricing of our products between jurisdictions may result in the unauthorized importation or unauthorized re-importation of our products between jurisdictions and may also result in the imposition of antidumping and countervailing duties or other trade-related sanctions. While the impact of these factors is difficult to predict, any of them could materially adversely affect our operating results and financial condition. Changes in any of these laws, regulations or requirements, or the political environment in a particular country, may affect our ability to engage in business transactions in certain markets, including investment, procurement and repatriation of earnings.
Foreign exchange rate fluctuations and potential currency controls affect our results of operations, as reported in our financial statements.
We conduct operations in many areas of the world, involving transactions denominated in a variety of currencies. In 2014, we generated approximately
53%
of our revenue in currencies other than the U.S. dollar, principally the euro, Australian dollar and Brazilian real. We are subject to currency exchange rate risk to the extent that our costs are denominated in currencies other than those in which we earn revenue. In addition, because our financial statements are reported in U.S. dollars, changes in currency exchange rates between the U.S. dollar and other currencies have had, and will continue to have, an impact on our results of operations.
For example, on February 13, 2013, the Venezuelan government devalued its currency from a rate of 4.3 to 6.3 Venezuelan bolivars per U.S. dollar. We incurred a foreign currency loss of $9 million immediately on the devaluation as a result of remeasuring the local assets and liabilities, which is included in
Other (income)/deductions—net
for the year ended December 31, 2013.
Our Venezuelan subsidiary's functional currency is the U.S. dollar because of the hyperinflationary status of the Venezuelan economy. In the first quarter of 2014, the Venezuelan government expanded its exchange mechanisms, resulting in three official rates of exchange for the Venezuelan bolivar. As of December 31, 2014, the Venezuelan bolivar to U.S. dollar exchange rates were the CENCOEX rate of 6.3; the SICAD I rate of 12.0; and the SICAD II rate of 49.99. We continue to use the CENCOEX rate of 6.3 to report our Venezuela financial position, results of operations and cash flows.
We may experience adverse impacts to earnings as our revenue, costs and expenses may be translated into U.S. dollars at lower rates. These impacts are not expected to be significant to our financial condition or results of operations. As of November 30, 2014, we had net monetary assets denominated in local currency of $56 million in Venezuela and other consolidated entities had receivables from our Venezuela business of $37 million. For the year ended November 30, 2014, our revenue from the Venezuelan market was approximately $77 million. These amounts may grow in the future.
On February 10, 2015, the Venezuelan government announced that they would continue to operate with a three-tier exchange rate system and that the primary rate of 6.3 bolivars to the dollar would remain in place for imports that are deemed essential. A new free-floating rate (SIMADI) will replace the existing third-tier rate (SICAD II). We cannot predict whether there will be further devaluation of the Venezuelan bolivar or whether our use of the 6.3 rate will continue to be supported by evolving facts and circumstances. Further, other potential actions by the Venezuelan government in response to economic uncertainties could impact the recoverability of our investment in Venezuela, which could result in an impairment charge and, under extreme circumstances, could impact our ability to continue to operate in the country in the same manner as we have historically.
20
|
We also face risks arising from currency devaluations and the imposition of cash repatriation restrictions and exchange controls. Currency devaluations result in a diminished value of funds denominated in the currency of the country instituting the devaluation. Cash repatriation restrictions and exchange controls may limit our ability to convert foreign currencies into U.S. dollars or to remit dividends and other payments by our foreign subsidiaries or businesses located in or conducted within a country imposing restrictions or controls. While we currently have no need, and do not intend, to repatriate or convert cash held in countries that have significant restrictions or controls in place, should we need to do so to fund our operations, we may be unable to repatriate or convert such cash, or be unable to do so without incurring substantial costs. We currently have substantial operations in countries that have cash repatriation restrictions or exchange controls in place, including China and Venezuela, and, if we were to need to repatriate or convert such cash, these controls and restrictions may have a material adverse effect on our operating results and financial condition.
We may not be able to realize the expected benefits of our investments in emerging markets.
We have been taking steps to increase our presence in emerging markets, including by expanding our manufacturing presence, sales organization and product offerings in these markets. Failure to continue to maintain and expand our business in emerging markets could also materially adversely affect our operating results and financial condition.
Some countries within emerging markets may be especially vulnerable to periods of local, regional or global economic, political or social instability or crisis. For example, our sales in certain emerging markets have suffered from extended periods of disruption due to natural disasters. Furthermore, we have also experienced lower than expected sales in certain emerging markets due to local, regional and global restrictions on banking and commercial activities in those countries. In addition, certain emerging markets have currencies that fluctuate substantially, which may impact our financial performance. For example, in the past, our revenue in certain emerging markets in Latin America have been adversely impacted by currency fluctuations and devaluations. For all these and other reasons, sales within emerging markets carry significant risks.
Risks related to tax matters
The Company could be subject to changes in its tax rates, the adoption of new U.S. or foreign tax legislation or exposure to additional tax liabilities.
The multinational nature of our business subjects us to taxation in the U.S and numerous foreign jurisdictions. Due to economic and political conditions, tax rates in various jurisdictions may be subject to significant change. The company’s future effective tax rates could be affected by changes in the mix of earnings in countries with differing statutory tax rates, changes in the valuation of deferred tax assets and liabilities, or changes in tax laws or their interpretation.
For example, the European Commission has opened formal investigations to examine whether decisions by the tax authorities in certain European countries, including Belgium, comply with European Union rules on state aid. The outcome of the European Commission’s investigations could require changes to existing tax rulings that, in turn, could have an impact on the company’s taxes. In addition, our effective tax rate is subject to potential risks that various taxing authorities may challenge the pricing of our cross-border arrangements and subject us to additional tax, adversely impacting our effective tax rate and our tax liability. The company is also subject to the examination of its tax returns and other tax matters by the Internal Revenue Service and other tax authorities and governmental bodies. The company regularly assesses the likelihood of an adverse outcome resulting from these examinations to determine the adequacy of its provision for taxes. There can be no assurance as to the outcome of these examinations. If the company’s effective tax rates were to increase, particularly in the United States or other material foreign jurisdictions, or if the ultimate determination of the company’s taxes owed is for an amount in excess of amounts previously accrued, the company’s operating results, cash flows, and financial condition could be adversely affected.
Risks related to intellectual property
The actual or purported intellectual property rights of third parties may negatively affect our business.
A third party may sue us or otherwise make a claim, alleging infringement or other violation of the third-party's patents, trademarks, trade dress, copyrights, trade secrets, domain names or other intellectual property rights. If we do not prevail in this type of litigation, we may be required to:
|
•
|
pay monetary damages;
|
|
•
|
obtain a license in order to continue manufacturing or marketing the affected products, which may not be available on commercially reasonable terms, or at all; or
|
|
•
|
stop activities, including any commercial activities, relating to the affected products, which could include a recall of the affected products and/or a cessation of sales in the future.
|
The costs of defending an intellectual property claim could be substantial and could materially adversely affect our operating results and financial condition, even if we successfully defend such claims. The intellectual property positions of animal health medicines and vaccines businesses frequently involve complex legal and factual questions, and an issued patent does not guarantee us the right to practice the patented technology or develop, manufacture or commercialize the patented product. We cannot be certain that a competitor or other third party does not have or will not obtain rights to intellectual property that may prevent us from manufacturing, developing or marketing certain of our products, regardless of whether we believe such intellectual property rights are valid and enforceable or we believe we would be otherwise able to develop a more commercially successful product, which may harm our operating results and financial condition.
If our intellectual property rights are challenged or circumvented, competitors may be able to take advantage of our research and development efforts.
Our long-term success largely depends on our ability to market technologically competitive products. We rely and expect to continue to rely on a combination of intellectual property, including patent, trademark, trade dress, copyright, trade secret, data protection, and domain name protection laws, as well as confidentiality and license agreements with our employees and others, to protect our intellectual property and proprietary rights. If
21
|
we fail to obtain and maintain adequate intellectual property protection, we may not be able to prevent third parties from using our proprietary technologies or from marketing products that are very similar or identical to ours. Our currently pending or future patent applications may not result in issued patents, or be approved on a timely basis, or at all. Similarly, any term extensions that we seek may not be approved on a timely basis, if at all. In addition, our issued patents may not contain claims sufficiently broad to protect us against third parties with similar technologies or products or provide us with any competitive advantage, including exclusivity in a particular product area. The scope of our patent claims also may vary between countries, as individual countries have their own patent laws. For example, some countries only permit the issuance of patents covering a novel chemical compound itself, and its first use, and thus further methods of use for the same compound, may not be patentable. We may be subject to challenges by third parties regarding our intellectual property, including claims regarding validity, enforceability, scope and effective term. The validity, enforceability, scope and effective term of patents can be highly uncertain and often involve complex legal and factual questions and proceedings. Our ability to enforce our patents also depends on the laws of individual countries and each country's practice with respect to enforcement of intellectual property rights. In addition, if we are unable to maintain our existing license agreements or other agreements pursuant to which third parties grant us rights to intellectual property, including because such agreements expire or are terminated, our operating results and financial condition could be materially adversely affected.
In addition, patent law reform in the United States and other countries may also weaken our ability to enforce our patent rights, or make such enforcement financially unattractive. For instance, in September 2011, the United States enacted the America Invents Act, which will permit enhanced third-party actions for challenging patents and will implement a first-to-invent system. In April 2012, Australia enacted the Intellectual Property Laws Amendment (Raising the Bar) Act, which provides higher standards for obtaining patents. Similarly, in 2012, Argentina enacted new regulations regarding the patentability of formulations, methods and processes which raises the standards for such patents. In September 2013, the Brazilian Patent Office challenged the validity and term of the so-called “mailbox patents” of pharmaceutical and veterinary companies which were filed in the interim period before Brazil fully implemented the Trade-Related Aspects of Intellectual Property Right (TRIPS) Agreement's patentability standards. The action of the Brazilian Patent Office potentially could shorten the duration or invalidate some of our patents. We have filed an appeal, but the decision will not be known for several years. These reforms could result in increased costs to protect our intellectual property or limit our ability to patent our products in these jurisdictions.
Additionally, certain foreign governments have indicated that compulsory licenses to patents may be granted in the case of national emergencies, which could diminish or eliminate sales and profits from those regions and materially adversely affect our operating results and financial condition.
Likewise, in the United States and other countries, we currently hold issued trademark registrations and have trademark applications pending, any of which may be the subject of a governmental or third-party objection, which could prevent the maintenance or issuance of the same and thus create the potential need to rebrand or re-label a product. As our products mature, our reliance on our trademarks to differentiate us from our competitors increases and as a result, if we are unable to prevent third parties from adopting, registering or using trademarks and trade dress that infringe, dilute or otherwise violate our trademark rights, our business could be materially adversely affected.
Many of our vaccine products and other products are based on or incorporate proprietary information, including proprietary master seeds and proprietary or patented adjuvant formulations. We actively seek to protect our proprietary information, including our trade secrets and proprietary know-how, by requiring our employees, consultants, other advisors and other third parties to execute proprietary information and confidentiality agreements upon the commencement of their employment, engagement or other relationship. Despite these efforts and precautions, we may be unable to prevent a third party from copying or otherwise obtaining and using our trade secrets or our other intellectual property without authorization and legal remedies may not adequately compensate us for the damages caused by such unauthorized use. Further, others may independently and lawfully develop substantially similar or identical products that circumvent our intellectual property by means of alternative designs or processes or otherwise.
The misappropriation and infringement of our intellectual property, particularly in foreign countries where the laws may not protect our proprietary rights as fully as in the United States, may occur even when we take steps to prevent it. We are currently, and expect to be in the future, party to patent lawsuits and other intellectual property rights claims that are expensive and time consuming, and if resolved adversely, could have a significant impact on our business and financial condition. In the future, we may not be able to enforce intellectual property that relates to our products for various reasons, including licensor restrictions and other restrictions imposed by third parties, or the cost of enforcing our intellectual property may outweigh the value of doing so; either of which could have a material adverse impact on our business and financial condition.
Risks related to information technology
We depend on sophisticated information technology and infrastructure.
We rely on the efficient and uninterrupted operation of complex information technology systems to manage our operations, to process, transmit and store electronic and financial information, and to comply with regulatory, legal and tax requirements. We also depend on our information technology infrastructure for digital marketing activities and for electronic communications among our personnel, customers and suppliers around the world. System failures or outages could compromise our ability to perform these functions in a timely manner, which could harm our ability to conduct business, hurt our relationships with our customers, or delay our financial reporting. Such failures could materially adversely affect our operating results and financial condition.
In addition, we depend on third parties and applications on virtualized (cloud) infrastructure to operate and support our information systems. These third parties include large established vendors, as well as many small, privately owned companies. Failure by these providers to adequately support our operations or a change in control or insolvency of these providers could have an adverse effect on our business, which in turn may materially adversely affect our operating results and financial condition.
In connection with the IPO and the Separation, we have substantially changed a number of our business processes, including our financial reporting and supply chain processes. In order to support the new business processes under the terms of our transitional services agreement with Pfizer, we have made significant configuration and data changes within some of our information technology systems. If our information and processes are not sufficient to support our business and financial reporting functions, or if we fail to properly implement our new business processes, our financial
22
|
reporting may be delayed or inaccurate and our operations may be adversely affected and, as a result, our operating results and financial condition may be materially adversely affected.
In addition, we are implementing new business systems to support our operations, including an enterprise resource planning (ERP) system to better integrate our manufacturing, financial, commercial and business operations. There is risk associated with ensuring that the milestones, timelines and budget associated with these new systems stay on track. Transitioning to new systems, integrating new systems into current systems or any disruptions or malfunctions (including from circumstances beyond our control) affecting our information systems could cause critical information upon which we rely to be delayed, unreliable, corrupted, insufficient or inaccessible. Any of these potential issues, individually or in aggregation, could have a material adverse effect on our operating results and financial condition.
Even if we are able to implement these systems successfully, all information systems, despite implementation of security measures, are vulnerable to disability, failures or unauthorized access. If our information systems were to fail or be breached, such failure or breach could materially adversely affect our ability to perform critical business functions and sensitive and confidential data could be compromised.
We may experience difficulties with the implementation of our enterprise resource planning system, which could disrupt our business and adversely affect our results of operations and financial condition.
We are engaged in a multi-year implementation of an ERP. The ERP is designed to accurately maintain our books and records and provide information important to the operation of our business to our management team. The implementation of the ERP will require significant investment of human and financial resources. In implementing the ERP, we may experience significant delays, increased costs and other difficulties. While we have invested significant resources in planning, project management and training, additional and significant implementation issues may arise. Any significant disruption or deficiency in the design and implementation of the ERP could adversely affect our ability to process orders, ship product, send invoices and track payments, fulfill contractual obligations or otherwise operate our business. Any of these consequences could have an adverse effect on our results of operations and financial condition.
We may be unable to successfully manage our online ordering sites.
In many markets around the world, such as the United States and Brazil, we provide online ordering sites to customers, often relying on third parties to host and support the application. The operation of our online business depends on our ability to maintain the efficient and uninterrupted operation of our online order-taking and fulfillment operations. Risks associated with our online business include: disruptions in telephone service or power outages; failures of the information systems that support our website, including inadequate system capacity, computer viruses, human error, changes in programming, security breaches, system upgrades or migration of these services to new systems; reliance on third parties for computer hardware and software as well as delivery of merchandise to our customers; rapid technology changes; credit card fraud; natural disasters or adverse weather conditions; power and network outages; changes in applicable federal and state regulations; liability for online content; and consumer privacy concerns. Problems in any one or more of these areas could have a material adverse effect on our operating results and financial condition and could damage our reputation.
We may be unable to adequately protect our information technology systems from cyber-attacks, which could result in the disclosure of confidential information, damage our reputation, and subject us to significant financial and legal exposure.
Our reputation as a global leader in animal health and our reliance on complex information systems make us inherently vulnerable to malicious cyber intrusion and attack. Cyber-attacks
are increasing in their frequency, sophistication and intensity, and have become increasingly difficult to detect. Cyber-attacks could include wrongful conduct by hostile foreign governments, industrial espionage, the deployment of harmful malware, denial-of-service, and other means to threaten data confidentiality, integrity and availability. A successful cyber-attack could cause serious negative consequences for our company, including the disruption of operations, the misappropriation of confidential business information and trade secrets, and the disclosure of corporate strategic plans. Like other global companies, we have experienced threats to our data and information technology systems. To date, those threats have not had a material impact on our business operations or financial condition. However, although we devote resources to protect our information technology systems, we expect cyber-attacks to continue, and there can be no assurance that our efforts will prevent information security breaches that would result in business, legal or reputational harm to us, or would have a material adverse effect on our operating results and financial condition.
We may be unable to adequately protect our customers' privacy or we may fail to comply with privacy laws.
The protection of customer, employee and company data is critical and the regulatory environment surrounding information security, storage, use, processing, disclosure and privacy is demanding, with the frequent imposition of new and changing requirements. In addition, our customers expect that we will adequately protect their personal information. Any actual or perceived significant breakdown, intrusion, interruption, cyber-attack or corruption of customer, employee or company data or our failure to comply with federal, state, local and foreign privacy laws could result in lost sales, remediation costs, legal liability including severe penalties, regulatory action and reputational harm.
Despite our considerable efforts and investments in technology to secure our computer network, security could be compromised, confidential information could be misappropriated or system disruptions could occur. Failure to comply with the security requirements or rectify a security issue may result in fines and the imposition of restrictions on our ability to accept payment by credit or debit cards. In addition, the payment card industry (PCI) is controlled by a limited number of vendors that have the ability to impose changes in PCI's fee structure and operational requirements on us without negotiation. Such changes in fees and operational requirements may result in our failure to comply with PCI security standards, as well as significant unanticipated expenses. Such failures could materially adversely affect our operating results and financial condition.
We have substantial indebtedness.
We have a significant amount of indebtedness, which could materially adversely affect our operating results, financial condition and liquidity. As of December 31, 2014, we had approximately $3.6 billion of total unsecured indebtedness outstanding. In addition, we have entered into an agreement
23
|
for a five-year revolving credit facility and a commercial paper program each with a capacity of up to $1.0 billion. While we currently do not have any amounts drawn under the credit facility nor any commercial paper issued under the commercial paper program, we may incur indebtedness under these arrangements in the future.
We may incur substantial additional debt from time to time to finance working capital, capital expenditures, investments or acquisitions, or for other purposes. If we do so, the risks related to our high level of debt could intensify. Specifically, our high level of debt could have important consequences, including:
|
•
|
making it more difficult for us to satisfy our obligations with respect to our debt;
|
|
•
|
limiting our ability to obtain additional financing to fund future working capital, capital expenditures, business development or other general corporate requirements, including dividends;
|
|
•
|
increasing our vulnerability to general adverse economic and industry conditions;
|
|
•
|
exposing us to the risk of increased interest rates as certain of our borrowings are and may in the future be at variable rates of interest;
|
|
•
|
limiting our flexibility in planning for and reacting to changes in the animal health industry;
|
|
•
|
placing us at a competitive disadvantage to other, less leveraged competitors;
|
|
•
|
impacting our effective tax rate; and
|
|
•
|
increasing our cost of borrowing.
|
In addition, the instruments governing our indebtedness contain restrictive covenants that will limit our ability to engage in activities that may be in our long-term best interest. For example, our credit facility contains a financial covenant requiring us to not exceed a maximum total leverage ratio and covenants that, among other things, limit or restrict our and our subsidiaries' ability, subject to certain exceptions, to incur liens, merge, consolidate or sell, transfer or lease assets, transact with affiliates and incur priority indebtedness. Our failure to comply with such covenants could result in an event of default which, if not cured or waived, could result in the acceleration of all our debt.
We may not be able to generate sufficient cash to service all of our indebtedness and may be forced to take other actions to satisfy our obligations under our indebtedness, which may not be successful.
Our ability to make scheduled payments on or refinance our debt obligations depends on our financial condition and operating performance, which are subject to prevailing economic and competitive conditions and to certain financial, business, legislative, regulatory and other factors beyond our control. We may be unable to maintain a level of cash flows from operating activities sufficient to permit us to pay the principal and interest on our indebtedness.
If our cash flows and capital resources are insufficient to fund our debt service obligations, we could face substantial liquidity problems and could be forced to reduce or delay investments and capital expenditures, or to dispose of material assets or operations, alter our dividend policy, seek additional debt or equity capital or restructure or refinance our indebtedness. We may not be able to effect any such alternative measures on commercially reasonable terms or at all and, even if successful, those alternative actions may not allow us to meet our scheduled debt service obligations. The instruments that will govern our indebtedness may restrict our ability to dispose of assets and may restrict the use of proceeds from those dispositions and may also restrict our ability to raise debt or equity capital to be used to repay other indebtedness when it becomes due. We may not be able to consummate those dispositions or to obtain proceeds in an amount sufficient to meet any debt service obligations when due.
In addition, we conduct our operations through our subsidiaries. Accordingly, repayment of our indebtedness will depend on the generation of cash flow by our subsidiaries, including certain international subsidiaries, and their ability to make such cash available to us, by dividend, debt repayment or otherwise. Our subsidiaries may not have any obligation to pay amounts due on our indebtedness or to make funds available for that purpose. Our subsidiaries may not be able to, or may not be permitted to, make distributions to enable us to make payments in respect of our indebtedness. Each subsidiary is a distinct legal entity, and under certain circumstances, legal, tax and contractual restrictions may limit our ability to obtain cash from our subsidiaries. In the event that we do not receive distributions from our subsidiaries, we may be unable to make required principal and interest payments on our indebtedness.
Our inability to generate sufficient cash flows to satisfy our debt obligations, or to refinance our indebtedness on commercially reasonable terms or at all, may materially adversely affect our operating results, financial condition and liquidity and our ability to satisfy our obligations under our indebtedness or pay dividends on our common stock.
We may not have the funds necessary to finance the change of control offer required by the indenture governing our senior notes.
Upon the occurrence of a change of control of us and a downgrade below investment grade by Moody's Investor Services, Inc. and Standard & Poor's Rating Services, we will be required to offer to repurchase all of our outstanding senior notes. We did not receive any proceeds from the sale of the $1.0 billion aggregate principal amount of the Pfizer-owned notes and we paid an amount of cash equal to substantially all of the net proceeds that we received in the senior notes offering to Pfizer prior to the completion of the IPO. As a result of these and other factors, we may not have sufficient funds available to finance a change of control offer.
Our credit ratings may not reflect all risks of an investment in our senior notes.
The credit ratings assigned to our senior notes are limited in scope, and do not address all material risks relating to an investment in our senior notes, but rather reflect only the view of each rating agency at the time the rating is issued. There can be no assurance that such credit ratings will remain in effect for any given period of time or that a rating will not be lowered, suspended or withdrawn entirely by the applicable rating agencies, if, in such rating agency's judgment, circumstances so warrant. Credit ratings are not a recommendation to buy, sell or hold any security. Each agency's rating should be evaluated independently of any other agency's rating. Actual or anticipated changes or downgrades in our credit ratings, including any
24
|
announcement that our ratings are under further review for a downgrade, could affect the market prices of our securities and increase our borrowing costs.
Risks related to our relationship with Pfizer
We may not achieve some or all of the expected benefits of the Separation.
We may not be able to achieve the full strategic and financial benefits expected to result from the Separation, or such benefits may be delayed or not occur at all. These expected benefits include the following:
|
•
|
improving strategic and operational flexibility, increasing management focus and streamlining decision-making by providing the flexibility to implement our strategic plan and to respond more effectively to different customer needs and the changing economic environment;
|
|
•
|
allowing us to adopt the capital structure, investment policy and dividend policy best suited to our financial profile and business needs, without competing for capital with Pfizer's other businesses;
|
|
•
|
creating an independent equity structure that will facilitate our ability to effect future acquisitions utilizing our common stock; and
|
|
•
|
facilitating incentive compensation arrangements for employees more directly tied to the performance of our business, and enhancing employee hiring and retention by, among other things, improving the alignment of management and employee incentives with performance and growth objectives of our business.
|
We may not achieve the anticipated benefits of the Separation for a variety of reasons, which could adversely affect our operating results and financial condition.
Pfizer may compete with us.
Pfizer is not restricted from competing with us in the animal health business, including as a result of acquiring a company that operates an animal health business. Due to the significant resources of Pfizer, including financial resources, name recognition and know-how resulting from the previous management of our business, Pfizer could have a significant competitive advantage over us should it decide to engage in the type of business we conduct, which may cause our operating results and financial condition to be materially adversely affected.
Certain of our directors may have actual or potential conflicts of interest because of their positions with Pfizer.
Certain of our directors are employed by Pfizer or may own Pfizer common stock, options to purchase Pfizer common stock or other Pfizer equity awards. Certain of these holdings may be individually significant to these directors as compared with such director's total assets. These directors' positions at Pfizer and the ownership of any Pfizer equity or equity awards may create, or may create the appearance of, conflicts of interest when these directors are faced with decisions that could have different implications for Pfizer than for us.
To preserve the tax-free treatment to Pfizer and/or its stockholders of the Exchange Offer and certain related transactions, we may not be able to engage in certain transactions.
To preserve the tax-free treatment to Pfizer and/or its stockholders of the Exchange Offer and certain related transactions, under the tax matters agreement, we are restricted from taking any action that prevents such transactions from being tax-free for U.S. federal, state, local and foreign income tax purposes. These restrictions may limit our ability to pursue certain strategic transactions or engage in other transactions, including taking certain actions with respect to our 3.250% Senior Notes due 2023 and using our common stock to make acquisitions in connection with equity capital market transactions that might increase the value of our business. See
Item 13.
Certain Relationships and Related Transactions, and Director Independence
—
Relationship with Pfizer
—
Tax matters agreement.
We may not be able to fully realize the expected benefits of our R&D agreement with Pfizer.
Prior to the Separation, as a business unit of Pfizer, we had the ability to leverage Pfizer's proprietary compound library and database to identify, research and develop compounds suitable as new product candidates for the animal health field. As part of the Separation, we entered into an R&D collaboration and license agreement with Pfizer, which is referred to as the “R&D agreement.” Pursuant to the R&D agreement, subject to certain restrictions, we have continued access to Pfizer's compound library and database for a period of seven years from the date of the IPO and have, subject to Pfizer's approval, the possibility to exclusively license compounds from Pfizer that we develop under the R&D agreement.
While the R&D agreement is intended to supplement our post-Separation R&D capabilities, certain terms of the R&D agreement may limit our ability to achieve this expected benefit, including:
|
•
|
Pfizer will retain ownership of, and license to us, the intellectual property that we develop under the R&D agreement. In many circumstances, the intellectual property we license from Pfizer will be non-exclusive as to Pfizer and third parties.
|
|
•
|
We are not assured access to Pfizer's newest programs.
|
|
•
|
Pfizer can prevent us from progressing pre-development compounds and, under certain circumstances, Pfizer may terminate our rights to a development stage compound by paying us the fair market value for such compound.
|
|
•
|
The R&D agreement may be terminated before the expiration of the seven year term in certain circumstances, including if we acquire an interest in, or assets of, a human pharmaceutical business, enter into a definitive agreement relating to, or undergo, a change of control or if Pfizer acquires, or is acquired by, an animal health business.
|
Each of the foregoing terms and Pfizer's other rights under the R&D agreement and related licenses (if any), could limit our ability to realize the expected benefits of the R&D agreement. If we fail to achieve the expected benefits of the R&D agreement, it may be more difficult, time-consuming or expensive for us to develop and commercialize certain new products.
25
|
For a summary description of the terms of the R&D collaboration and license agreement, see
Item 13.
Certain Relationships and Related Transactions, and Director Independence— Relationship with Pfizer—Research and development collaboration and license agreement.
Pfizer's rights as licensor under the patent and know-how license could limit our ability to develop and commercialize certain products.
Under the patent and know-how license agreement (Pfizer as licensor) (the Patent and Know-How License Agreement), Pfizer licenses to us certain of its intellectual property. If we fail to comply with our obligations under this license agreement and Pfizer exercises its right to terminate it, our ability to continue to research, develop and commercialize products incorporating that intellectual property will be limited. In addition, in circumstances where Pfizer has an interest in the licensed intellectual property in connection with its human health development programs, our rights to use the licensed intellectual property are restricted and/or, in limited instances, subject to Pfizer's right to terminate such license at will. These limitations and termination rights may make it more difficult, time-consuming or expensive for us to develop and commercialize certain new products, or may result in our products being later to market than those of our competitors.
For a summary description of the terms of the patent and know-how license (Pfizer as licensor), see
Item 13.
Certain Relationships and Related Transactions, and Director Independence—Relationship with Pfizer—Intellectual property license agreements.
We are dependent on Pfizer to prosecute, maintain and enforce certain intellectual property.
Under the Patent and Know-How License Agreement, Pfizer is responsible for filing, prosecuting and maintaining patents that Pfizer licenses to us. In the animal health field, Pfizer has the first right, and in some cases the sole right, to enforce such licensed patents, and in the human health field, subject to certain exceptions, Pfizer has the sole right to enforce the licensed patents. If Pfizer fails to fulfill its obligations or chooses to not enforce the licensed patents under this agreement, we may not be able to prevent competitors from making, using and selling competitive products, which could have an adverse effect on our business.
We have incurred and will continue to incur significant charges in connection with the Separation and incremental costs as an independent public company.
Prior to the Separation, Pfizer performed or supported many important corporate functions for our company. Our combined financial statements reflect charges for these services on an allocation basis. Following the Separation, many of these services are governed by our transitional services agreement with Pfizer. Under the transitional services agreement we are able to use these Pfizer services for a fixed term established on a service-by-service basis. However, we generally have the right to terminate a service earlier if we give notice to Pfizer. Partial reduction in the provision of any service requires Pfizer's consent. In addition, either party is able to terminate the agreement due to a material breach of the other party, upon prior written notice, subject to limited cure periods.
We pay Pfizer mutually agreed-upon fees for these services, based on Pfizer's costs of providing the services. During the two years following the IPO, the markup for these services was 0% and, for the remainder of the term of the agreement, Pfizer may introduce a markup of 7%. For the services that Pfizer continues to provide to Zoetis under this agreement, a 7% markup will apply for the remainder of 2015. We believe this markup is consistent with arm's length pricing for the services provided. However, since our transitional services agreement was negotiated in the context of a parent-subsidiary relationship, the terms of the agreement, including the fees charged for the services, may be higher or lower than those that would be agreed to by parties bargaining at arm's length for similar services and may be higher or lower than the costs reflected in the allocations in our historical financial statements. Third-party costs are passed through to us at Pfizer's or its affiliates' cost. In addition, while these services are being provided to us by Pfizer, our operational flexibility to modify or implement changes with respect to such services or the amounts we pay for them is limited.
We may not be able to replace these services or enter into appropriate third-party agreements on terms and conditions, including cost, comparable to those that we receive from Pfizer under our transitional services agreement. Additionally, after the agreement terminates, we may be unable to sustain the services at the same levels or obtain the same benefits as when we were receiving such services and benefits from Pfizer. When we begin to operate these functions separately, if we do not have our own adequate systems and business functions in place, or are unable to obtain them from other providers, we may not be able to operate our business effectively or at comparable costs, and our profitability may decline.
If there is a later determination that the Exchange Offer or certain related transactions are taxable for U.S. federal income tax purposes because the facts, assumptions, representations or undertakings underlying the IRS private letter ruling and/or any tax opinion are incorrect or for any other reason, we could incur significant liabilities.
Pfizer has received a private letter ruling from the IRS substantially to the effect that, among other things, the Exchange Offer will qualify as a transaction that is tax-free for U.S. federal income tax purposes under Sections 355 and 368(a)(1)(D) of the U.S. Internal Revenue Code of 1986 (the Code). Completion by Pfizer of the Exchange Offer was conditioned on, among other things, the continuing application of Pfizer's private letter ruling from the IRS and the receipt of an opinion of tax counsel, to the effect that, among other things, the Exchange Offer will qualify as a transaction that is tax-free for U.S. federal income tax purposes under Sections 355 and 368(a)(1)(D) of the Code. The ruling and the opinion rely on certain facts, assumptions, representations and undertakings from Pfizer and us regarding the past and future conduct of the companies' respective businesses and other matters. If any of these facts, assumptions, representations or undertakings are incorrect or not otherwise satisfied, Pfizer and its stockholders may not be able to rely on the ruling or the opinion of tax counsel and could be subject to significant tax liabilities. Notwithstanding the private letter ruling and opinion of tax counsel, the IRS could determine on audit that the Exchange Offer or certain related transactions are taxable if it determines that any of these facts, assumptions, representations or undertakings are not correct or have been violated or if it disagrees with the conclusions in the opinion that are not covered by the private letter ruling, or for other reasons, including as a result of certain significant changes in the stock ownership of Pfizer or us after the Exchange Offer. If the Exchange Offer or certain related transactions are determined to be taxable for U.S. federal income tax purposes, we could incur significant liabilities under applicable law or under the tax matters agreement.
26
|
Risks related to our common stock
The price of our common stock may fluctuate substantially, and you could lose all or part of your investment in Zoetis common stock as a result.
Our common stock has a limited trading history and there may be wide fluctuations in the market value of our common stock as a result of many factors. From our IPO through December 31, 2014, the sales price of our common stock as reported by the NYSE has ranged from a low sales price of $28.14 on April 15, 2014 to a high sales price of $45.24 on December 1, 2014. Some factors that may cause the market price of our common stock to fluctuate, in addition to the other risks mentioned in this section and in our 2014 Annual Report, are:
|
•
|
our operating performance and the performance of our competitors;
|
|
•
|
our or our competitors' press releases, other public announcements and filings with the SEC regarding new products or services, enhancements, significant contracts, acquisitions or strategic investments;
|
|
•
|
changes in earnings estimates or recommendations by securities analysts, if any, who cover our common stock;
|
|
•
|
changes in our investor base;
|
|
•
|
failures to meet external expectations or management guidance;
|
|
•
|
fluctuations in our financial results or the financial results of companies perceived to be similar to us;
|
|
•
|
changes in our capital structure or dividend policy, including as a result of the Exchange Offer, future issuances of securities, sales of large blocks of common stock by our stockholders or the incurrence of additional debt;
|
|
•
|
reputational issues;
|
|
•
|
changes in general economic and market conditions in any of the regions in which we conduct our business;
|
|
•
|
the arrival or departure of key personnel;
|
|
•
|
the actions of speculators and financial arbitrageurs (such as hedge funds) during and after the Exchange Offer;
|
|
•
|
changes in applicable laws, rules or regulations and other dynamics; and
|
|
•
|
other developments or changes affecting us, our industry or our competitors.
|
In addition, if the market for stocks in our industry or industries related to our industry, or the stock market in general, experiences a loss of investor confidence, the trading price of our common stock could decline for reasons unrelated to our business, financial condition and results of operations. If any of the foregoing occurs, it could cause our stock price to fall and may expose us to lawsuits that, even if unsuccessful, could be costly to defend and a distraction to management.
While we currently intend to pay a quarterly cash dividend to our common stockholders, we may change our dividend policy at any time.
On December 17, 2014, our Board of Directors declared the 2015 first quarter dividend of $0.083 per share to be paid on March 3, 2015 to holders of record on January 22, 2015; and on February 27, 2015, our Board of Directors declared the 2015 second quarter dividend of $0.083 per share to be paid on June 2, 2015, to holders of record on April 9, 2015. Although we currently intend to pay a quarterly cash dividend to our common stockholders, we have no obligation to do so, and our dividend policy may change at any time without notice to our stockholders. Returns on stockholders' investments will primarily depend on the appreciation, if any, in the price of our common stock. We anticipate that we will retain most of our future earnings, if any, for use in the development and expansion of our business, repayment of indebtedness and for general corporate purposes. The declaration and payment of dividends is at the discretion of our Board of Directors in accordance with applicable law after taking into account various factors, including our financial condition, operating results, current and anticipated cash needs, cash flows available in the United States, impact on our effective tax rate, indebtedness, legal requirements and other factors that our Board of Directors deems relevant.
Provisions in our amended and restated certificate of incorporation, amended and restated by-laws, shareholder rights plan and Delaware law may prevent or delay an acquisition of us, which could decrease the trading price of our common stock.
Our amended and restated certificate of incorporation, which we refer to as “our certificate of incorporation,” our amended and restated by-laws, which we refer to as “our by-laws,” and our shareholder rights plan contain provisions that are intended to deter coercive takeover practices and inadequate takeover bids and to encourage prospective acquirers to negotiate with our Board of Directors rather than to attempt a hostile takeover. These provisions include:
|
•
|
a Board of Directors that is divided into three classes with staggered terms;
|
|
•
|
rules regarding how our stockholders may present proposals or nominate directors for election at stockholder meetings;
|
|
•
|
the right of our Board of Directors to issue preferred stock without stockholder approval; and
|
|
•
|
limitations on the right of stockholders to remove directors.
|
In addition, Delaware law also imposes some restrictions on mergers and other business combinations between us and any holder of 15% or more of our outstanding common stock. These provisions apply even if the offer may be considered beneficial by some stockholders and could delay or prevent an acquisition that our Board of Directors determines is not in our and our stockholders' best interests.
27
|
Item 1B. Unresolved Staff Comments.
None.
Item 2. Properties.
We have 136 owned and leased properties, amounting to approximately 10.3 million square feet, around the world for sales and marketing, customer service, regulatory compliance, R&D, manufacturing and distribution, and administrative support functions. In many locations, operations are co-located to achieve synergies and operational efficiencies. Our largest R&D facility is our owned U.S. research and development site located in Kalamazoo, Michigan, which represents approximately 1.5 million square feet. None of our other non-manufacturing sites are more than 0.2 million square feet. The largest manufacturing site in our global manufacturing network is our manufacturing site located in Kalamazoo, Michigan, which represents approximately 0.6 million square feet. No other site in our global manufacturing network is more than 0.6 million square feet. In addition, our global manufacturing network will continue to be supplemented by approximately 200 CMOs.
Our corporate headquarters are located at 100 Campus Drive, Florham Park, New Jersey 07932 and our operations extend internationally to more than 60 countries. Under the transitional services agreement we entered into with Pfizer, Pfizer granted us continued access to certain of its premises occupied by our employees prior to the IPO. We currently lease space from Pfizer in 15 different locations globally, mainly in Europe.
We believe that our existing properties, as supplemented by sites operated by CMOs, including Pfizer, and access to Pfizer facilities provided under the transitional services agreement are adequate for our current requirements and for our operations in the foreseeable future.
Item 3. Legal Proceedings.
We are from time to time subject to claims and litigation arising in the ordinary course of business. These claims and litigation may include, among other things, allegations of violation of U.S. and foreign competition law, labor laws, consumer protection laws, and environmental laws and regulations, as well as claims or litigation relating to product liability, intellectual property, securities, breach of contract and tort. We operate in multiple jurisdictions and, as a result, a claim in one jurisdiction may lead to claims or regulatory penalties in other jurisdictions. We intend to defend vigorously against any pending or future claims and litigation.
At this time, in the opinion of management, the likelihood is remote that the impact of such proceedings, either individually or in the aggregate, would have a material adverse effect on our consolidated and combined results of operations, financial condition or cash flows. However, one or more unfavorable outcomes in any claim or litigation against us could have a material adverse effect for the period in which they are resolved. In addition, regardless of their merits or their ultimate outcomes, such matters are costly, divert management's attention and may materially adversely affect our reputation, even if resolved in our favor.
Certain legal proceedings in which we are involved are discussed in Notes to Consolidated and Combined Financial Statements—
Note 17. Commitments and Contingencies
.
Item 4. Mine Safety Disclosures.
Not applicable.
PART II
|
Item 5.
|
Market for Registrant’s Common Equity, Related Stockholder Matters and Issuer Purchases of Equity Securities.
|
On January 31, 2013, our registration statement on Form S-1 (File No. 333-183254) was declared effective for the IPO, pursuant to which we registered the offering and sale of 99,015,000 shares of our Class A common stock, including 12,915,000 additional shares pursuant to the underwriters' option to purchase additional shares. The IPO was completed on February 6, 2013, at a public offering price of $26.00 per share for an aggregate gross offering price of approximately $2.57 billion.
Instead of selling shares of our Class A common stock directly to the underwriters for cash in the IPO, Pfizer first exchanged the shares of our Class A common stock to be sold in the IPO with certain of the underwriters, which we refer to, in such role, as the “debt-for-equity exchange parties,” for outstanding indebtedness of Pfizer held by the debt-for-equity exchange parties. The debt-for-equity exchange parties then sold shares to the underwriters for cash. This debt-for-equity exchange occurred on the settlement date of the IPO immediately prior to the settlement of the debt-for-equity exchange parties' sale of the shares to the underwriters.
We did not receive any proceeds from the sale of shares of our common stock by the debt-for-equity exchange parties, including any shares sold by the debt-for-equity exchange parties in connection with the exercise of the underwriters' option to purchase additional shares.
On June 24, 2013, an exchange offer was completed, whereby Pfizer shareholders exchanged a portion of Pfizer common stock for Zoetis common stock, resulting in the full separation of Zoetis and the disposal of Pfizer's entire ownership and voting interest in Zoetis and the conversion of all outstanding shares of Class B common stock to shares of our Class A common stock, which we now refer to as our common stock. There are no shares of Class B outstanding.
Shares of our common stock are traded on the NYSE (symbol ZTS).
The following table sets forth the high and low sales price of our common stock for each quarter presented below.
|
High
|
Low
|
|
|
2013
|
||
|
First Quarter (beginning February 1, 2013)
|
$35.42
|
$30.47
|
|
Second Quarter
|
$34.74
|
$29.40
|
|
Third Quarter
|
$32.90
|
$28.81
|
|
Fourth Quarter
|
$33.34
|
$30.76
|
|
2014
|
||
|
First Quarter
|
$32.73
|
$28.77
|
|
Second Quarter
|
$33.05
|
$28.14
|
|
Third Quarter
|
$37.31
|
$31.67
|
|
Fourth Quarter
|
$45.24
|
$34.16
|
As of
February 23, 2015
, there were
500,787,817
shares of our common stock outstanding, held by 2,165 shareholders of record. Information about 5% beneficial owners of our common stock is incorporated by reference from the discussion under the heading
Ownership of Our Common Stock
in our 2015 Proxy Statement.
Additional information relating to our common stock is included in this Annual Report on Form 10-K in Notes to Consolidated and Combined Financial Statements—
Note 15. Stockholders’ Equity
.
Purchases of Equity Securities by the Issuer
On November 18, 2014, we announced that our Board of Directors authorized the repurchase of up to $500 million of our outstanding common stock. This program does not have a stated expiration date. Purchases of Zoetis shares may be made at the discretion of management, depending on market conditions and business needs. We repurchase shares pursuant to Rules 10b5-1 and 10b-18 under the Securities Exchange Act of 1934, as amended, through repurchase agreements established with several brokers. No share repurchases were made under this program during the year ended December 31, 2014.
29
|
Issuer purchases of equity securities for the three months ended December 31, 2014 were as follows:
|
Issuer Purchases of Equity Securities
|
||||
|
Total Number of Shares Purchased
(a)
|
Average Price Paid Per Share
|
Total Number of Shares Purchased as Part of Publicly Announced Programs
|
Approximate Dollar Value of Shares that May Yet Be Purchased Under Plans or Programs
|
|
|
October 1 - October 31, 2014
|
296
|
$36.45
|
—
|
$500,000,000
|
|
November 1 - November 30, 2014
|
184
|
$38.60
|
—
|
500,000,000
|
|
December 1 - December 31, 2014
|
471
|
$38.28
|
—
|
500,000,000
|
|
Total
|
951
|
$37.77
|
—
|
$500,000,000
|
(a)
The company repurchased 951 shares during the three-month period ended December 31, 2014, that were not part of the publicly announced share repurchase authorization. These shares were purchased from employees to satisfy tax withholding requirements on the vesting of restricted shares from equity-based awards.
Dividend Policy, Declaration and Payment
During the years ended December 31, 2014 and 2013, we paid the following quarterly cash dividends per share on our common stock:
|
2014
|
2013
|
|
|
First Quarter
|
$0.072
|
$0.065
|
|
Second Quarter
|
$0.072
|
$0.065
|
|
Third Quarter
|
$0.072
|
$0.065
|
|
Fourth Quarter
|
$0.072
|
$0.065
|
We expect to pay quarterly cash dividends to holders of our common stock, subject to the approval of our Board of Directors. On December 17, 2014, our Board of Directors declared the 2015 first quarter dividend of
$0.083
per share to be paid on March 3, 2015, to holders of record on January 22, 2015. On February 27, 2015, our Board of Directors declared the 2015 second quarter dividend of $0.083 per share to be paid on June 2, 2015, to holders of record on April 9, 2015.
The declaration and payment of dividends to holders of our common stock will be at the discretion of our Board of Directors in accordance with applicable law after taking into account various factors, including our financial condition, operating results, current and anticipated cash needs, cash flows available in the United States, impact on our effective tax rate, indebtedness, legal requirements and other factors that our Board of Directors deems relevant. In addition, the instruments governing our indebtedness may limit our ability to pay dividends. Therefore, no assurance is given that we will pay any dividends to our common stockholders or as to the amount of any such dividends if our Board of Directors determines to do so.
Because we are a holding company, our ability to pay cash dividends on our common stock will depend on the receipt of dividends or other distributions from certain of our subsidiaries.
Stock Performance Graph
(1)
The graph below compares the cumulative total shareholder return on an investment in our common stock, the S&P 500 Index and the S&P 500 Pharmaceuticals Index for the period from our initial public offering through the year ended December 31, 2014. The shareholder return shown on the graph is not necessarily indicative of future performance, and we do not make or endorse any predictions as to future shareholder returns.
The graph assumes the investment of $100 on February 1, 2013, in our common stock, the S&P 500 Index and the S&P 500 Pharmaceuticals Index and assumes dividends, if any, are reinvested.
30
|
COMPARISON OF CUMULATIVE TOTAL RETURN
Among Zoetis Inc., the S&P 500 Index and the S&P 500 Pharmaceuticals Index
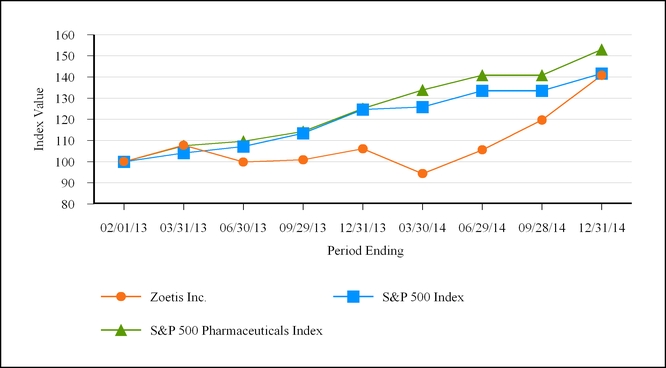
|
February 1, 2013
|
March 31, 2013
|
June 30, 2013
|
September 29, 2013
|
December 31, 2013
|
March 30, 2014
|
June 29, 2014
|
September 28, 2014
|
December 31, 2014
|
|
|
Zoetis Inc.
|
$100
|
$107.71
|
$99.81
|
$100.87
|
$106.07
|
$94.35
|
$105.56
|
$119.67
|
$140.84
|
|
S&P 500
|
$100
|
$104.11
|
$107.14
|
$113.44
|
$124.61
|
$125.86
|
$133.55
|
$135.72
|
$141.67
|
|
S&P 500 Pharmaceuticals Index
|
$100
|
$107.48
|
$109.67
|
$114.24
|
$125.16
|
$133.85
|
$140.83
|
$145.82
|
$152.97
|
(1)
This section is not “soliciting material,” is not deemed “filed” with the SEC and is not to be incorporated by reference in any filing of Zoetis under the Securities Act of 1933, as amended, or the Exchange Act whether made before or after the date hereof and irrespective of any general incorporation language contained in any such filing.
Item 6. Selected Financial Data.
The following table sets forth our selected historical consolidated and combined financial data for the periods indicated.
The selected historical consolidated and combined statements of income data for the years ended December 31, 2014, 2013 and 2012 and the selected historical consolidated balance sheet data as of December 31, 2014 and 2013 presented below have been derived from our audited consolidated and combined financial statements included in
Item 8. Financial Statements and Supplementary Data
. The selected historical combined balance sheet data as of December 31, 2012, December 31, 2011 and December 31, 2010, presented below has been derived from our audited combined financial statements not included in this 2014 Annual Report. The revenue data for the years ended December 31, 2011 and 2010 is derived from our audited combined financial statements not included in this 2014 Annual Report.
Our consolidated and combined financial statements for the periods prior to the IPO include expense allocations for certain support functions that were provided on a centralized basis within Pfizer, such as expenses for business technology, facilities, legal, finance, human resources, and, to a lesser extent, business development, public affairs and procurement, among others, as well as certain manufacturing and supply costs incurred by manufacturing sites that were shared with other Pfizer business units, Pfizer’s global external supply group and Pfizer’s global logistics and support group. Pfizer does not routinely allocate these costs to any of its business units. These allocations were based on either a specific identification basis or, when specific identification is not practicable, proportional cost allocation methods (e.g., using third-party sales, headcount, animal health identified manufacturing costs, etc.), depending on the nature of the services and/or costs.
The financial statements included in this 2014 Annual Report may not be indicative of our future performance and do not necessarily reflect what our financial position and results of operations would have been had we operated as an independent public company during the periods presented prior to the IPO.
You should read the selected historical consolidated and combined financial data set forth below in conjunction with
Item 7.
Management’s Discussion and Analysis of Financial Condition and Results of Operations
and our consolidated and combined financial statements and notes thereto included in
Item 8. Financial Statements and Supplementary Data
.
31
|
|
Year Ended December 31,
(a)
|
||||||||||||||||||||
|
(MILLIONS, EXCEPT PER SHARE AMOUNTS)
|
2014
|
|
2013
|
|
2012
|
|
2011
|
|
2010
|
|
||||||||||
|
Statement of income data:
|
||||||||||||||||||||
|
Revenue
|
$
|
4,785
|
|
$
|
4,561
|
|
$
|
4,336
|
|
$
|
4,233
|
|
$
|
3,582
|
|
|||||
|
Net income attributable to Zoetis
|
583
|
|
504
|
|
436
|
|
245
|
|
110
|
|
||||||||||
|
Balance sheet data:
|
||||||||||||||||||||
|
Total assets
|
$
|
6,607
|
|
$
|
6,558
|
|
$
|
6,262
|
|
$
|
5,711
|
|
$
|
5,284
|
|
|||||
|
Long-term obligations
(b)
|
3,643
|
|
3,642
|
|
509
|
|
575
|
|
673
|
|
||||||||||
|
Other data (unaudited):
|
||||||||||||||||||||
|
Adjusted net income
(c)
|
$
|
790
|
|
$
|
709
|
|
$
|
539
|
|
$
|
503
|
|
$
|
275
|
|
|||||
|
Earnings per share attributable to Zoetis Inc. stockholders
(d)
:
|
||||||||||||||||||||
|
Basic
|
$
|
1.16
|
|
$
|
1.01
|
|
$
|
0.87
|
|
$
|
0.49
|
|
$
|
0.22
|
|
|||||
|
Diluted
|
$
|
1.16
|
|
$
|
1.01
|
|
$
|
0.87
|
|
$
|
0.49
|
|
$
|
0.22
|
|
|||||
|
Weighted average shares outstanding (in thousands):
|
||||||||||||||||||||
|
Basic
|
501,055
|
|
500,002
|
|
500,000
|
|
500,000
|
|
500,000
|
|
||||||||||
|
Diluted
|
502,025
|
|
500,317
|
|
500,000
|
|
500,000
|
|
500,000
|
|
||||||||||
Certain amounts may reflect rounding adjustments.
|
(a)
|
Starting in 2011, includes the King Animal Health (KAH), business acquired as part of Pfizer's acquisition of King Pharmaceuticals, Inc., commencing on the acquisition date of January 31, 2011. See
Item 7. Management's Discussion and Analysis of Financial Condition and Results of Operations—Comparability of historical results and our relationship with Pfizer—Recent significant acquisitions and government-mandated divestitures
.
|
|
(b)
|
In 2010 through 2012, primarily includes an allocation of Pfizer debt that was issued to partially finance the acquisition of Wyeth (including FDAH) in 2009. The debt has been allocated on a pro-rata basis using the deemed acquisition cost of FDAH as a percentage of the total acquisition cost of Wyeth.
|
|
(c)
|
Adjusted net income (a non-GAAP financial measure) is defined as reported net income attributable to Zoetis excluding purchase accounting adjustments, acquisition-related costs and certain significant items. Management uses adjusted net income, among other factors, to set performance goals and to measure the performance of the overall company, as described in
Item 7.
Management’s Discussion and Analysis of Financial Condition and Results of Operations—Adjusted net income
. We believe that investors’ understanding of our performance is enhanced by disclosing this performance measure. Reconciliations of U.S. GAAP reported net income attributable to Zoetis to non-GAAP adjusted net income for the years ended December 31, 2014, 2013 and 2012 are provided in
Item 7.
Management’s Discussion and Analysis of Financial Condition and Results of Operations—Adjusted net income
. The adjusted net income measure is not, and should not be viewed as, a substitute for U.S. GAAP reported net income attributable to Zoetis.
|
|
(d)
|
The weighted average shares outstanding for both basic and diluted earnings per share for the years ended December 31, 2012, 2011 and 2010 was calculated using
500
million shares of common stock outstanding, which was the number of Zoetis Inc. shares outstanding at the time of the IPO, which was completed on February 6, 2013.
|
32
|
Item 7. Management’s Discussion and Analysis of Financial Condition and Results of Operations.
Introduction
Our management’s discussion and analysis of financial condition and results of operations (MD&A) is provided to assist readers in understanding our performance, as reflected in the results of our operations, our financial condition and our cash flows. This MD&A should be read in conjunction with our consolidated and combined financial statements and notes to consolidated and combined financial statements included in
Item 8. Financial Statements and Supplementary Data
. The discussion in this MD&A contains a description of our historical performance for periods in which we operated as a business unit of Pfizer, as well as forward-looking statements that involve substantial risks and uncertainties. Our future results could differ materially from historical performance and from those anticipated in the forward-looking statements as a result of various factors such as those discussed in
Item 1A. Risk Factors
, and in the
Forward-looking statements and factors that may affect future results
and
Comparability of historical results and our relationship with Pfizer
sections of this MD&A.
This MD&A is organized as follows:
|
Section
|
Description
|
Page
|
|
Overview of our business
|
A general description of our business and the industry in which we operate. For more information regarding our business and the animal health industry, see
Item 1. Business.
|
|
|
Our operating environment
|
Information regarding the animal health industry and factors that affect our company.
|
|
|
Our growth strategies
|
An explanation of our growth strategies.
|
|
|
Components of revenue and costs and expenses
|
An explanation of the components of our consolidated and combined statements of income.
|
|
|
Comparability of historical results and our relationship with Pfizer
|
Information about the limitations of the predictive value of the consolidated and combined financial statements.
|
|
|
Significant accounting policies and application of critical accounting estimates
|
Accounting policies and estimates that we consider important to understanding our consolidated and combined financial statements.
|
|
|
Analysis of the consolidated and combined statements of income
|
Consists of the following for all periods presented:
|
|
|
•
Revenue
: An analysis of our revenue in total, by operating segment and by species.
|
||
|
•
Costs and expenses
: A discussion about the drivers of our costs and expenses.
|
||
|
•
Operating segment results
: A discussion of our revenue by operating segment and species and items impacting our earnings before income tax.
|
||
|
Adjusted net income
|
A discussion of adjusted net income, an alternative view of performance used by management. Adjusted net income is a non-GAAP financial measure.
|
|
|
Our financial guidance for 2015
|
A discussion of our 2015 financial guidance.
|
|
|
Analysis of the consolidated and combined statements of comprehensive income
|
An analysis of the components of comprehensive income for all periods presented.
|
|
|
Analysis of the consolidated balance sheets
|
A discussion of changes in certain balance sheet accounts for balance sheets presented.
|
|
|
Analysis of the consolidated and combined statements of cash flows
|
An analysis of the drivers of our operating, investing and financing cash flows for all periods presented.
|
|
|
Analysis of financial condition, liquidity and capital resources
|
An analysis of our ability to meet our short-term and long-term financing needs.
|
|
|
New accounting standards
|
Accounting standards that we have recently adopted.
|
|
|
Forward-looking statements and factors that may affect future results
|
A description of the risks and uncertainties that could cause actual results to differ materially from those discussed in forward-looking statements presented in this MD&A and elsewhere in this 2014 Annual Report. Such forward-looking statements are based on management's current expectations about future events, which are inherently susceptible to uncertainty and changes in circumstances.
|
|
Overview of our business
We are a global leader in the discovery, development, manufacture and commercialization of animal health medicines and vaccines, with a focus on both livestock and companion animals. For more than 60 years, as a business unit of Pfizer and now as an independent public company, we have been committed to enhancing the health of animals and bringing solutions to our customers who raise and care for them.
The animal health medicines and vaccines industry is characterized by meaningful differences in customer needs across different regions. As a result of these differences, among other things, we manage our operations through four geographic operating segments. Within each of these operating segments, we offer a diversified product portfolio for both livestock and companion animal customers in order to capitalize on local and regional trends and customer needs. Our four operating segments are the United States (U.S.), Europe/Africa/Middle East (EuAfME), Canada/Latin America
33
|
(CLAR) and Asia/Pacific (APAC). See Notes to Consolidated and Combined Financial Statements—
Note 18. Segment, Geographic and Other Revenue Information
.
We directly market our products to livestock producers and veterinarians located in approximately 70 countries across North America, Europe, Africa, Asia, Australia and South America, and are a market leader in nearly all of the major regions in which we operate. Through our efforts to establish an early and direct presence in many emerging markets, such as Brazil, China and India, we believe we are the largest animal health medicines and vaccines business as measured by revenue across emerging markets as a whole. Emerging markets contributed
24%
of our revenue for the year ended
December 31, 2014
. In markets where we do not have a direct commercial presence, we generally contract with distributors that provide logistics and sales and marketing support for our products.
We believe our investments in the industry’s largest sales organization, including our extensive network of technical and veterinary operations specialists, our high-quality manufacturing and reliability of supply, and our long track record of developing products that meet customer needs, has led to enduring and valued relationships with our customers. Our R&D efforts enable us to deliver innovative products to address unmet needs and evolve our product lines so they remain relevant for our customers. Additionally, our management team’s focus on improving operational and cost efficiencies increases the likelihood of achieving our core growth strategies and enhancing long-term value for our shareholders.
A summary of our 2014 performance compared to the comparable 2013 and 2012 periods follows:
|
Years Ended December 31,
|
% Change
|
||||||||||||||||
|
(MILLIONS OF DOLLARS)
|
2014
|
|
2013
|
|
2012
|
|
14/13
|
|
13/12
|
||||||||
|
Revenue
|
$
|
4,785
|
|
$
|
4,561
|
|
$
|
4,336
|
|
5
|
|
5
|
|||||
|
Net income attributable to Zoetis
|
583
|
|
504
|
|
436
|
|
16
|
|
16
|
||||||||
|
Adjusted net income
(a)
|
790
|
|
709
|
|
539
|
|
11
|
|
32
|
||||||||
|
(a)
|
Adjusted net income is a non-GAAP financial measure. See the
Adjusted net income
section of this MD&A for more information.
|
Our operating environment
Industry
The animal health industry, which focuses on both livestock and companion animals, is a growing industry that impacts billions of people worldwide. The primary livestock species for the production of animal protein are cattle (both beef and dairy), swine, poultry, sheep and fish. Livestock health and production are essential to meeting the growing demand for animal protein of a global population. Factors influencing growth in demand for livestock medicines and vaccines include:
|
•
|
human population growth and increasing standards of living, particularly in many emerging markets;
|
|
•
|
increasing demand for improved nutrition, particularly animal protein;
|
|
•
|
natural resource constraints, such as scarcity of arable land, fresh water and increased competition for cultivated land, resulting in fewer resources that will be available to meet this increased demand for animal protein; and
|
|
•
|
increased focus on food safety.
|
The primary companion animal species are dogs, cats and horses. Health professionals indicate that companion animals improve the physical and emotional well-being of pet owners. Factors influencing growth in demand for companion animal medicines and vaccines include:
|
•
|
economic development and related increases in disposable income, particularly in many emerging markets;
|
|
•
|
increasing pet ownership; and
|
|
•
|
companion animals living longer, increasing medical treatment of companion animals and advances in companion animal medicines and vaccines.
|
Product development initiatives
Our future success depends on both our existing product portfolio and our pipeline of new products, including new products that we may develop through joint ventures and products that we are able to obtain through license or acquisition. We believe we are an industry leader in animal health R&D, with a track record of generating new products and product lifecycle developments. The majority of our R&D programs focus on product lifecycle development, which is defined as R&D programs that leverage existing animal health products by adding new species or claims, achieving approvals in new markets or creating new combinations and reformulations.
Perceptions of product quality, safety and reliability
We believe that animal health medicines and vaccines customers value high-quality manufacturing and reliability of supply. The importance of quality and safety concerns to pet owners, veterinarians and livestock producers also contributes to animal health brand loyalty, which we believe often continues after the loss of patent-based and regulatory exclusivity. We depend on positive perceptions of the safety and quality of our products, and animal health products generally, by our customers, veterinarians and end-users.
34
|
The issue of the potential transfer of increased antibacterial resistance in bacteria from food-producing animals to human pathogens, and the causality of that transfer, are the subject of global scientific and regulatory discussion. Antibacterials refer to small molecules that can be used to treat or prevent bacterial infections and are a sub-categorization of the products that make up our anti-infectives and medicated feed additives portfolios. In some countries, this issue has led to government restrictions and bans on the use of specific antibacterials in some food-producing animals, regardless of the route of administration (topical, oral, intramuscular/subcutaneous injections, or intravenous). These restrictions are more prevalent in countries where animal protein is plentiful and governments are willing to take restrictive actions even when there is scientific uncertainty. Our total revenue attributable to antibacterials for livestock was approximately
$1.3 billion
for the year ended
December 31, 2014
.
In December 2013, the FDA announced final guidance establishing procedures for the voluntary phase out in the United States over a three year period of the use of medically important antibacterials in animal feed for growth promotion in food production animals (medically important antibacterials include classes that are prescribed in animal and human health). The guidance provides for continued use of antibacterials in food producing animals for treatment, control and under certain circumstances for prevention of disease, all under the supervision of a veterinarian. We believe the impact of this FDA guidance on our financial performance will not be significant based on the overall diversity and breadth of our product portfolio of medicines, vaccines and diagnostics serving eight core species.
In addition, in October 2014, the French Parliament passed a law that,
inter-alia
, prohibits rebates and discounts on antibiotics and requires the reporting of antibiotics sold to and agreements entered into with certain animal healthcare providers (including veterinarians, veterinary schools, pharmacists and students). The Parliament indicated that the law is in response to a government initiative aimed at fighting antimicrobial resistance in animals and reducing the use of certain categories of antibiotics by 25% (compared to 2013) by December 31, 2016.
We cannot predict whether antibacterials resistance concerns will result in additional restrictions or bans, expanded regulations or public pressure to discontinue or reduce use of antibacterials in food-producing animals, which could materially adversely affect our operating results and financial condition.
The overall economic environment
In addition to industry-specific factors, we, like other businesses, face challenges related to global economic conditions. Growth in both the livestock and companion animal sectors is driven by overall economic development and related growth, particularly in many emerging markets. In recent years, certain of our customers and suppliers have been affected directly by economic downturns, which decreased the demand for our products and, in some cases, hindered our ability to collect amounts due from customers.
The cost of medicines and vaccines to our livestock producer customers is small relative to other production costs, including feed, and the use of these products is intended to improve livestock producers’ economic outcomes. As a result, demand for our products has historically been more stable than demand for other production inputs. Similarly, industry sources have reported that pet owners indicated a preference for reducing spending on other aspects of their lifestyle, including entertainment, clothing and household goods, before reducing spending on pet care. While these factors have mitigated the impact of recent downturns in the global economy, further economic challenges could increase cost sensitivity among our customers, which may result in reduced demand for our products, which could have a material adverse effect on our operating results and financial condition.
Competition
The animal health industry is competitive. Although our business is the largest by revenue in the animal health medicines and vaccines industry, we face competition in the regions in which we operate. Principal methods of competition vary depending on the particular region, species, product category or individual product. Some of these methods include new product development, quality, price, service and promotion to veterinary professionals, pet owners and livestock producers. Our competitors include the animal health businesses of large pharmaceutical companies and specialty animal health businesses. In addition to competition from established market participants, there could be new entrants to the animal health medicines and vaccines industry in the future. In certain markets, we also compete with companies that produce generic products, but the level of competition from generic products varies from market to market. For example, the level of generic competition is higher in Europe and certain emerging markets than in the United States.
Weather conditions and the availability of natural resources
The animal health industry and demand for many of our animal health products in a particular region are affected by weather conditions, as usage of our products follows varying weather patterns and weather-related pressures from pests, such as ticks. As a result, we may experience regional and seasonal fluctuations in our results of operations.
In addition, veterinary hospitals and practitioners depend on visits from and access to the animals under their care. Veterinarians’ patient volume and ability to operate could be adversely affected if they experience prolonged snow, ice or other severe weather conditions, particularly in regions not accustomed to sustained inclement weather. Furthermore, livestock producers depend on the availability of natural resources, including large supplies of fresh water. Their animals’ health and their ability to operate could be adversely affected if they experience a shortage of fresh water due to human population growth or floods, droughts or other weather conditions. In the event of adverse weather conditions or a shortage of fresh water, veterinarians and livestock producers may purchase less of our products.
For example, drought conditions could negatively impact, among other things, the supply of corn and the availability of grazing pastures. A decrease in harvested corn results in higher corn prices, which could negatively impact the profitability of livestock producers of cattle, pork and poultry. Higher corn prices and reduced availability of grazing pastures contribute to reductions in herd or flock sizes that in turn result in less spending on animal health products. As such, a prolonged drought could have a material adverse impact on our operating results and financial condition. Factors influencing the magnitude and timing of effects of a drought on our performance include, but may not be limited to, weather patterns and herd management decisions. The widespread drought which impacted parts of the United States during 2011, 2012, and 2013 was considered the worst in many years and affected our performance in the U.S. market in 2012 and in the first half of 2013.
35
|
Disease outbreaks
Sales of our livestock products could be adversely affected by the outbreak of disease carried by animals. Outbreaks of disease may reduce regional or global sales of particular animal-derived food products or result in reduced exports of such products, either due to heightened export restrictions or import prohibitions, which may reduce demand for our products. Also, the outbreak of any highly contagious disease near our main production sites could require us to immediately halt production of our products at such sites or force us to incur substantial expenses in procuring raw materials or products elsewhere. Alternatively, sales of products that treat specific disease outbreaks may increase.
For example, since the second quarter of 2013 some producers in the United States have experienced an outbreak of the porcine epidemic diarrhea virus (PEDv). PEDv has existed in parts of Asia for many years. It is important to note that the virus, which affects piglets, does not create a food safety issue. We are committed to supporting pork producers in understanding and controlling PEDv and we are partnering with the key stakeholders, including various academic institutions such as the University of Minnesota and Iowa State University. In September 2014, the U.S. Department of Agriculture (USDA) granted us a conditional license for a vaccine to help fight PEDv. In order to receive the conditional license, we had to demonstrate the safety of the vaccine in a field study and provide a reasonable expectation of the vaccine’s efficacy. We began supplying the vaccine to veterinarians and pig farmers in September 2014, and we are working to complete the efficacy and potency studies necessary to obtain full licensure in the United States from the USDA. Since first reported in the United States in 2013, PEDv has spread and has now been reported in at least 33 U.S. states, as well as in Canada, Mexico and parts of South America. According to recent reports, during 2014 the outbreak impacted up to 50% of the sows in the United States, and up to one-third of the sows in Mexico. Furthermore, during the first half of 2014, active cases of PEDv were reported in several new markets in Asia, including Japan, South Korea and Taiwan, and in the second half of 2014, active cases of the disease were confirmed in Spain and Portugal. Although many of the farms that were previously infected have since returned to normal production, the virus continues to pose a threat to the swine industry. We currently believe the impact of PEDv on our 2015 revenue will not be significant. However, we are closely monitoring the evolution of this on-going outbreak and its impact on the swine industry and on our 2015 revenue.
In addition, beginning in 2013, there have been several reported cases of the H7N9 avian influenza virus in China. In late March 2013, the Chinese government reported the first case of the H7N9 avian influenza virus. Since that time, approximately 450 cases have been detected. We are closely monitoring the developments as this situation unfolds and currently believe the impact on our 2015 global revenue will not be significant. While China continues to represent a growth opportunity for us, sales in China represented approximately 2% of our total revenue in 2014 and the majority was generated by our swine business.
Foreign exchange rates
Significant portions of our revenue and costs are exposed to changes in foreign exchange rates. Our products are sold in more than 120 countries and, as a result, our revenue is influenced by changes in foreign exchange rates. In
2014
, approximately
53%
of our revenue was denominated in foreign currencies. We seek to manage our foreign exchange risk, in part, through operational means, including managing same-currency revenue in relation to same-currency costs and same-currency assets in relation to same-currency liabilities. As we operate in multiple foreign currencies, including the euro, the Brazilian real, the Australian dollar and other currencies, changes in those currencies relative to the U.S. dollar will impact our revenue, cost of goods and expenses, and consequently, net income. Exchange rate fluctuations may also have an impact beyond our reported financial results and directly impact operations. These fluctuations may affect the ability to buy and sell our goods and services between markets impacted by significant exchange rate variances. In
2014
, approximately
47%
of our total revenue was in U.S. dollars. Our year-over-year revenue growth was unfavorably impacted by
2
percentage points from changes in foreign currency values relative to the U.S. dollar.
On February 13, 2013, the Venezuelan government devalued its currency from a rate of 4.3 to 6.3 Venezuelan bolivars per U.S. dollar. We incurred a foreign currency loss of $9 million immediately on the devaluation as a result of remeasuring the local assets and liabilities, which is included in
Other (income)/deductions—net
for the year ended December 31, 2013.
Our Venezuelan subsidiary's functional currency is the U.S. dollar because of the hyperinflationary status of the Venezuelan economy. In the first quarter of 2014, the Venezuelan government expanded its exchange mechanisms, resulting in three official rates of exchange for the Venezuelan bolivar. As of December 31, 2014, the Venezuelan bolivar to U.S. dollar exchange rates were the CENCOEX rate of 6.3; the SICAD I rate of 12.0; and the SICAD II rate of 49.99. We continue to use the CENCOEX rate of 6.3 to report our Venezuela financial position, results of operations and cash flows.
We may experience adverse impacts to earnings as our revenue, costs and expenses may be translated into U.S. dollars at lower rates. These impacts are not expected to be significant to our financial condition or results of operations. As of November 30, 2014, we had net monetary assets denominated in local currency of $56 million in Venezuela and other consolidated entities had receivables from our Venezuela business of $37 million. For the year ended November 30, 2014, our revenue from the Venezuelan market was approximately $77 million. These amounts may grow in the future.
On February 10, 2015, the Venezuelan government announced that they would continue to operate with a three-tier exchange rate system and that the primary rate of 6.3 bolivars to the dollar would remain in place for imports that are deemed essential. A new free-floating rate (SIMADI) will replace the existing third-tier rate (SICAD II). We cannot predict whether there will be further devaluation of the Venezuelan bolivar or whether our use of the 6.3 rate will continue to be supported by evolving facts and circumstances. Further, other potential actions by the Venezuelan government in response to economic uncertainties could impact the recoverability of our investment in Venezuela, which could result in an impairment charge and, under extreme circumstances, could impact our ability to continue to operate in the country in the same manner as we have historically.
Certain Regulatory Matters
Our manufacturing facilities are subject to periodic inspections by regulatory agencies. An inspector may report conditions or practices that indicate possible violations of regulatory requirements. The FDA provides notice of these observations in a Form 483. In January 2015, the FDA conducted inspections at three of our manufacturing facilities, after which the FDA issued Form 483s to the company in connection with two of these inspections. We responded to the FDA and are in the process of addressing the observations in the Form 483s. We cannot give any assurances that the FDA will be satisfied with our responses to their Form 483 observations or as to the expected date of resolution of observations included in the Form
36
|
483s. In October 2014, we received a letter from the USDA’s Center for Veterinary Biologicals (CVB) requesting that we meet with the CVB to discuss compliance issues at certain of our U.S. sites that manufacture biological products. We have met with the CVB to discuss the CVB’s specific concerns and to present a plan for certain corrective and preventive actions. We are implementing that plan. We cannot give any assurances that the USDA will be satisfied with the progress of our corrective and preventive actions and not take further regulatory action affecting our USDA establishment license.
Our growth strategies
We seek to enhance the health of animals and to bring solutions to our customers who raise and care for them. We have a global presence in both developed and emerging markets and we intend to grow our business by pursuing the following core strategies:
|
•
|
leverage our direct local presence and strong customer relationships
—Through our direct selling commercial model, we can deepen our understanding of our customers’ businesses and can encourage the adoption of more sophisticated animal health products;
|
|
•
|
further penetrate emerging markets
—We seek to maximize our presence where economic development is driving increased demand for animal protein and increased demand for and spending on companion animals;
|
|
•
|
pursue new product research and development and value-added product lifecycle development
to extend our product portfolio
—New product R&D and product lifecycle development enable us to deliver innovative products to address unmet needs and evolve our product lines so they remain relevant for our customers. We seek to leverage our strong direct presence in many regions and cost-effectively develop new products;
|
|
•
|
remain the partner of choice
for access to new products and technologies
—We seek to continue to support cutting-edge research and secure the right to develop and commercialize new products and technologies;
|
|
•
|
continue to provide high-quality products
and improve manufacturing production margins
—We believe our manufacturing and supply chain provides us with a global platform for continued expansion, including in emerging markets, and that our quality and reliability differentiate us from our competitors; and
|
|
•
|
expand into complementary businesses
to become a more complete, trusted partner in providing solutions
—We believe we have the potential to generate incremental and complementary revenue, in the areas of diagnostics, genetics, devices, dairy data management, e-learning and professional consulting, which could also enhance the loyalty of our customer base and may lead to increased product sales.
|
Components of revenue and costs and expenses
Our revenue, costs and expenses are reported for the year ended December 31 for each year presented, except for operations outside the United States, for which the financial information is included in our consolidated and combined financial statements for the fiscal year ended November 30 for each year presented.
Revenue
Our revenue is primarily derived from our diversified product portfolio of medicines and vaccines used to treat and protect livestock and companion animals. Generally, our products are promoted to veterinarians and livestock producers by our sales organization which includes sales representatives and technical and veterinary operations specialists, and then sold directly by us or through distributors. The depth of our product portfolio enables us to address the varying needs of customers in different species and geographies. In
2014
, our top selling product line, the ceftiofur line, contributed approximately
8%
of our revenue. The ceftiofur line and our next two top selling products, Revolution and Draxxin, contributed approximately
21%
of our revenue. Our top ten selling product lines contributed approximately
39%
of our revenue. For additional information regarding our products, including descriptions of our product lines that each represented approximately 1% or more of our revenue in
2014
, see
Item 1. Business—Products
.
Costs and expenses
Costs of sales
consist primarily of cost of materials, facilities and other infrastructure used to manufacture our medicine and vaccine products and royalty expenses associated with the intellectual property of our products, when relevant.
Selling, general and administrative (SG&A)
expenses consist of, among other things, the internal and external costs of marketing, promotion, advertising and shipping and handling as well as certain costs related to business technology, facilities, legal, finance, human resources, business development, public affairs and procurement.
Research and development (R&D)
expenses consist primarily of project costs specific to new product R&D and product lifecycle development, overhead costs associated with R&D operations and investments that support local market clinical trials for approved indications and expenses related to regulatory approvals for our products. We do not disaggregate R&D expenses by research stage or by therapeutic area for purposes of managing our business.
Amortization of intangible assets
consists primarily of the amortization expense for identifiable finite-life intangible assets that have been acquired through business combinations. These assets consist of, but are not limited to, developed technology, brands and trademarks.
Restructuring charges and certain acquisition-related costs
consist of all restructuring charges (those associated with acquisition activity and those associated with cost reduction/productivity initiatives), as well as costs associated with acquiring and integrating businesses. Restructuring charges are associated with employees, assets and activities that will not continue in the company. Acquisition-related costs are associated with acquiring and integrating acquired businesses, such as the King Animal Health (KAH) business in 2011 and the Fort Dodge Animal Health (FDAH) business acquired as part of Pfizer's acquisition of Wyeth in 2009, and may include transaction costs and expenditures for consulting and the integration of systems and processes.
Other (income)/deductions—net
consist primarily of various items including net (gains)/losses on asset disposals, royalty-related income, foreign exchange translation (gains)/losses and certain asset impairment charges.
37
|
Comparability of historical results and our relationship with Pfizer
During the periods prior to the IPO covered by the combined financial statements in this
2014
Annual Report, we operated solely as a business unit of Pfizer. The related combined financial statements have been derived from the consolidated financial statements and accounting records of Pfizer and include allocations for direct costs and indirect costs attributable to the operations of the animal health business of Pfizer. These combined financial statements do not purport to reflect what the results of operations, comprehensive income/(loss), financial position, equity or cash flows would have been had we operated as an independent public company during the periods presented. In addition, the historical combined financial statements may not be reflective of what our results of operations, comprehensive income/(loss), financial position, equity or cash flows might be in the future as an independent public company.
For a detailed description of the basis of presentation and an understanding of the limitations of the predictive value of the historical combined financial statements, see Notes to Consolidated and Combined Financial Statements—
Note 3. Basis of Presentation.
Our historical expenses are not necessarily indicative of the expenses we may incur in the future as an independent public company. With respect to support functions, for example, for the periods prior to the IPO, our historical combined financial statements include expense allocations for certain support functions that were provided on a centralized basis within Pfizer, such as expenses for business technology, facilities, legal, finance, human resources, and, to a lesser extent, business development, public affairs and procurement, among others. As part of the Separation, pursuant to agreements with Pfizer, Pfizer provides us with some of the services related to these functions on a transitional basis in exchange for agreed-upon fees, and we are incurring other costs to replace the services and resources that will not be provided by Pfizer. As an independent public company, our total costs related to such support functions may differ from the costs that were historically allocated to us from Pfizer.
We have also incurred certain nonrecurring costs related to becoming an independent public company, including new branding (which includes changes to the manufacturing process for required new packaging), the creation of standalone systems and infrastructure, the accelerated vesting of certain Pfizer equity awards and associated cash payment related thereto, site separation and certain legal registration and patent assignment costs.
Some of our products are manufactured at sites that were retained by Pfizer or that are operated by Pfizer under a sale-leaseback arrangement. In 2013, pursuant to the master manufacturing and supply agreement with Pfizer, we began purchasing these products from Pfizer. Under the master manufacturing and supply agreement, our supply price is Pfizer's costs plus a percentage markup. Subject to limited exceptions, during the two years following the completion of the IPO (from February 6, 2013, through February 5, 2015), the markup was 0% and, for the remainder of the term of the agreement, the markup will be 15%. The cost of each Pfizer-supplied product is subject to annual review. The historical combined statements of income for the periods prior to the IPO include allocations of certain manufacturing and supply costs incurred by the manufacturing sites that would not have been charged to us under the master manufacturing and supply agreement with Pfizer had such agreement been in effect in the periods presented, such as operating variances, as well as purchase price and volume variances under a certain threshold. The costs allocated in the historical combined statements of income are higher than the amounts that would have been charged by Pfizer under the master manufacturing and supply agreement, had it been in effect during the periods presented, by approximately $10 million for the year ended December 31, 2012. In connection with the IPO, we and Pfizer have entered into certain agreements that will provide a framework for our ongoing relationship with Pfizer. See Notes to Consolidated and Combined Financial Statements—
Note 19B. Transactions and Agreements with Pfizer—Agreements with Pfizer.
Following the IPO, the equity awards previously granted to our employees by Pfizer continued to vest, and service with Zoetis counted as service with Pfizer for equity award purposes. On June 24, 2013, Pfizer completed the Exchange Offer whereby Pfizer disposed of all shares of Zoetis common stock owned by Pfizer. Pfizer accelerated the vesting of, and in some cases the settlement of, on a pro-rata basis, outstanding Pfizer restricted stock units (RSUs), Total Shareholder Return Units (TSRUs) and Performance Share Awards (PSAs) previously granted to our employees, subject, in each case, to the requirements of Section 409A of the U.S. Internal Revenue Code, the terms of the 2004 Pfizer Stock Plan and the applicable award agreements and any outstanding deferral elections. In addition, unvested Pfizer stock options previously granted to our employees accelerated in full, and our employees generally have the ability to exercise the stock options until the earlier of (i) June 23, 2016 (three years from Pfizer's completion of the Exchange Offer), (ii) termination of their employment from Zoetis or (iii) the expiration date of the stock option. Zoetis employees who held Pfizer stock options and were retirement eligible as of June 24, 2013, will have the full term of the stock option to exercise.
The accelerated vesting of the outstanding Pfizer stock options, and the settlement, on a pro-rata basis, of other Pfizer equity awards, resulted in the recognition of additional expense for the year ended December 31, 2013, of $
9 million
, which is included in stock-based compensation. The unvested portion of Pfizer RSUs, TSRUs and PSAs were forfeited as of the completion of the Exchange Offer. In the
third quarter
of 2013, Zoetis made a cash payment of approximately $
20 million
to certain non-executive Zoetis employees, based on the value of the employees' forfeited Pfizer RSUs, TSRUs and PSAs (as applicable). This amount is included in the consolidated statement of income as additional compensation expense for the year ended December 31, 2013. Members of the Zoetis Executive Team did not receive a cash payment for any forfeited Pfizer RSUs, TSRUs and PSAs, but instead, in the third quarter of 2013, were granted Zoetis RSUs which were equivalent in value and vest on the same date as their forfeited Pfizer RSUs, TSRUs and PSAs.
Public company expenses
As a result of the IPO, we became subject to the reporting requirements of the Exchange Act and the Sarbanes-Oxley Act. We have established additional procedures and practices as an independent public company. As a result, we are incurring additional costs, including, but not limited to, internal audit, investor relations, stock administration and regulatory compliance costs.
Recent significant acquisitions and government-mandated divestitures
The assets, liabilities, operating results and cash flows of acquired businesses are included in our results commencing from their respective acquisition dates.
On November 17, 2014, we announced that we had entered into an agreement to purchase animal health assets of Abbott for a purchase price of $255 million. On February 10, 2015, after satisfying all customary closing conditions, including clearance under the Hart-Scott-Rodino Antitrust Improvements Act, we completed the purchase of certain assets of Abbott Animal Health. The purchase price includes a $230 million cash payment
38
|
on the date of closing and a contingent payment of $25 million to be paid within one year of closing if certain product supply conditions are met. Abbott Animal Health is a companion animal health business focused on the veterinary surgical suite. The final allocation of the purchase price amongst assets, liabilities and goodwill is subject to final valuation.
Delays in establishing new operating subsidiaries
Due to local regulatory and operational requirements in certain non-U.S. jurisdictions, the transfer to us of certain assets and liabilities of Pfizer's animal health business had not yet legally occurred as of the IPO date. These assets and liabilities were not material to our consolidated financial statements, individually or in the aggregate. As of December 31, 2013, all expected subsidiaries had been established and the related assets and liabilities had transferred.
Agreements with Pfizer
On February 6, 2013, we entered into a transitional services agreement with Pfizer whereby Pfizer agreed to provide us with various corporate support services. This agreement has a service commencement date of January 1, 2013, in the United States and December 1, 2012 for our international locations. In addition, on October 1, 2012, we entered into a master manufacturing and supply agreement with Pfizer on October 1, 2012, whereby we and Pfizer agreed to manufacture and supply products to each other commencing January 1, 2013. See Notes to Consolidated and Combined Financial Statements—
Note 19B. Transactions and Agreements with Pfizer—Agreements with Pfizer
for more information related to these and other agreements, including the related costs.
Significant accounting policies and application of critical accounting estimates
In presenting our financial statements in conformity with U.S. GAAP, we are required to make estimates and assumptions that affect the reported amounts of assets, liabilities, revenue, costs and expenses and related disclosures. For a description of our significant accounting policies, see Notes to Consolidated and Combined Financial Statements—
Note 4. Significant Accounting Policies
.
We believe that the following accounting policies are critical to an understanding of our consolidated and combined financial statements as they require the application of the most difficult, subjective and complex judgments and, therefore, could have the greatest impact on our financial statements: (i) fair value; (ii) revenue; (iii) asset impairment reviews; and (iv) contingencies.
Below are some of our more critical accounting estimates. See also Notes to Consolidated and Combined Financial Statements—
Note 4. Significant Accounting Policies— Estimates and Assumptions
for a discussion about the risks associated with estimates and assumptions.
Fair value
For a discussion about the application of fair value to our long-term debt and financial instruments, see Notes to Consolidated and Combined Financial Statements—
Note 9
.
Financial Instruments
.
For a discussion about the application of fair value to our asset impairment reviews, see
Asset impairment reviews
below
.
Revenue
Our gross product revenue is subject to deductions that are generally estimated and recorded in the same period that the revenue is recognized and primarily represents sales returns and revenue incentives. For example:
|
•
|
for sales returns, we perform calculations in each market that incorporate the following, as appropriate: local returns policies and practices; returns as a percentage of revenue; an understanding of the reasons for past returns; estimated shelf life by product; an estimate of the amount of time between shipment and return or lag time; and any other factors that could impact the estimate of future returns, product recalls, discontinuation of products or a changing competitive environment; and
|
|
•
|
for revenue incentives, we use our historical experience with similar incentives programs to estimate the impact of such programs on revenue.
|
If any of our ratios, factors, assessments, experiences or judgments are not indicative or accurate predictors of our future experience, our results could be materially affected. Although the amounts recorded for these revenue deductions are heavily dependent on estimates and assumptions, historically our adjustments to actual results have not been material. The sensitivity of our estimates can vary by program, type of customer and geographic location.
Amounts recorded for revenue deductions can result from a complex series of judgments about future events and uncertainties and can rely heavily on estimates and assumptions. For further information about the risks associated with estimates and assumptions, see Notes to Consolidated and Combined Financial Statements—
Note 4. Significant Accounting Policies—Estimates and Assumptions
.
Asset impairment reviews
We review all of our long-lived assets for impairment indicators throughout the year and we perform detailed testing whenever impairment indicators are present. In addition, we perform impairment testing for goodwill and indefinite-lived assets at least annually. When necessary, we record charges for impairments of long-lived assets for the amount by which the fair value is less than the carrying value of these assets.
Our impairment review processes are described below and in Notes to Consolidated and Combined Financial Statements—
Note 4. Significant Accounting Policies—Amortization of Intangible Assets, Depreciation and Certain Long-Lived Assets
and, for deferred tax assets, in
Note 4. Significant Accounting Policies—Deferred Tax Assets and Liabilities and Income Tax Contingencies
.
Examples of events or circumstances that may be indicative of impairment include:
39
|
|
•
|
a significant adverse change in the extent or manner in which an asset is used. For example, restrictions imposed by the regulatory authorities could affect our ability to manufacture or sell a product.
|
|
•
|
a projection or forecast that demonstrates losses or reduced profits associated with an asset. This could result, for example, from the introduction of a competitor’s product that results in a significant loss of market share or the inability to achieve the previously projected revenue growth, or from the lack of acceptance of a product by customers.
|
Our impairment reviews of most of our long-lived assets depend heavily on the determination of fair value, as defined by U.S. GAAP, and these judgments can materially impact our results of operations. A single estimate of fair value can result from a complex series of judgments about future events and uncertainties and can rely heavily on estimates and assumptions. For information about the risks associated with estimates and assumptions, see Notes to Consolidated and Combined Financial Statements—
Note 4. Significant Accounting Policies—Estimates and Assumptions
.
Intangible assets other than goodwill
We test indefinite-lived intangible assets for impairment at least annually, or more frequently if impairment indicators exist, by first assessing qualitative factors to determine whether it is more likely than not that the fair value of the indefinite-lived intangible asset is less than its carrying amount. If we conclude it is more likely than not that the fair value is less than the carrying amount, a quantitative test that compares the fair value of the indefinite-lived intangible asset with its carrying value is performed. If the fair value is less than the carrying amount, an impairment loss is recognized.
As a result of our overall intangible asset impairment review, we recognized a number of impairments of identifiable intangible assets other than goodwill.
We recorded the following identifiable intangible asset impairment charges in
Restructuring charges and certain acquisition-related costs
and
Other (income)/deductions—net
, as applicable:
|
•
|
In 2014, the intangible asset impairment charges reflect (i) approximately $6 million of acquired in-process research and development (IPR&D) assets related to a pharmaceutical product for dogs acquired with the FDAH acquisition in 2009, as a result of the termination of the development program due to a re-assessment of economic viability; and (ii) approximately $1 million related to finite-lived developed technology rights and IPR&D due to negative market conditions and the re-assessment of economic viability.
|
|
•
|
In 2013, the intangible asset impairment charges reflect (i) approximately $2 million of finite-lived developed technology rights due to a re-assessment of economic viability; (ii) approximately $2 million of finite-lived developed technology rights and IPR&D as a result of exiting a combined manufacturing and R&D facility; and (iii) approximately $2 million related to acquired IPR&D as a result of the termination of certain development programs due to a re-assessment of their economic viability.
|
|
•
|
In 2012, the intangible asset impairment charges reflect: (i) approximately $2 million of finite-lived companion animal developed technology rights; (ii) approximately $1 million of finite-lived trademarks related to genetic testing services; and (iii) approximately $2 million of finite-lived patents related to poultry technology. The intangible asset impairment charges for 2012 reflect, among other things, loss of revenue as a result of negative market conditions and, with respect to the poultry technology, a re-assessment of economic viability.
|
When we are required to determine the fair value of intangible assets other than goodwill, we use an income approach, specifically the multi-period excess earnings method, also known as the discounted cash flow method. We start with a forecast of all the expected net cash flows associated with the asset, which includes the application of a terminal value for indefinite-lived assets, and then we apply an asset-specific discount rate to arrive at a net present value amount. Some of the more significant estimates and assumptions inherent in this approach include: the amount and timing of the projected net cash flows, which includes the expected impact of competitive, legal and/or regulatory forces on the projections, the impact of technological risk associated with IPR&D assets, as well as the selection of a long-term growth rate; the discount rate, which seeks to reflect the risks inherent in the projected cash flows; foreign currency fluctuations; and the tax rate, which seeks to incorporate the geographic diversity of the projected cash flows.
While all identifiable intangible assets can be impacted by events and thus lead to impairment, in general, identifiable intangible assets that are at the highest risk of impairment include IPR&D assets (approximately $
2 million
as of December 31, 2014). IPR&D assets are higher-risk assets because R&D is an inherently risky activity.
For a description of our accounting policy, see Notes to Consolidated and Combined Financial Statements—
Note 4. Significant Accounting Policies—Amortization of Intangible Assets, Depreciation and Certain Long-Lived Assets
.
Goodwill
Goodwill represents the excess of the consideration transferred over the fair value of net assets of businesses purchased and is assigned to reporting units. We test goodwill for impairment on at least an annual basis, or more frequently if impairment indicators exist, either by assessing qualitative factors to determine whether it is more likely than not that the fair value of a reporting unit is less than its carrying amount or by performing a quantitative assessment.
Factors considered in the qualitative assessment include general macroeconomic conditions, conditions specific to the industry and market, cost factors which could have a significant effect on earnings or cash flows, the overall financial performance of the reporting unit, and whether there have been sustained declines in our share price. Additionally, we evaluate the extent to which the fair value exceeded the carrying value of the reporting unit at the date of the last quantitative assessment performed.
When performing a quantitative assessment to test for goodwill impairment we utilize the income approach, which is forward-looking, and relies primarily on internal forecasts. Within the income approach, the method that we use is the discounted cash flow method. We start with a forecast of all the expected net cash flows associated with the reporting unit, which includes the application of a terminal value, and then apply a reporting unit-
40
|
specific discount rate to arrive at a net present value. Some of the more significant estimates and assumptions inherent in this approach include: the amount and timing of the projected net cash flows, which includes the expected impact of technological risk and competitive, legal and/or regulatory forces on the projections, as well as the selection of a long-term growth rate; the discount rate, which seeks to reflect the various risks inherent in the projected cash flows; and the tax rate, which seeks to incorporate the geographic diversity of the projected cash flows.
In 2014, we quantitatively assessed, as of September 28, 2014, the fair value of each of our reporting units using the income approach. The fair value of each reporting unit was found to exceed its respective carrying value, therefore no impairments were recorded.
In 2013, we qualitatively assessed, as of September 29, 2013, whether it is more likely than not that the respective fair values of our reporting units are less than their carrying amounts, including goodwill. Based on that assessment, we determined that this condition did not exist for all reporting units and performing a quantitative fair value test for our reporting units was not necessary. As a result, we did not believe that the risk of goodwill impairment for any of our reporting units was significant at that time.
For all of our reporting units, there are a number of future events and factors that may impact future results and that could potentially have an impact on the outcome of subsequent goodwill impairment testing. For a list of these factors, see
Forward-looking statements and information that may affect future results.
For a description of our accounting policy, see Notes to Consolidated and Combined Financial Statements—
Note 4. Significant Accounting Policies—Amortization of Intangible Assets, Depreciation and Certain Long-Lived Assets
.
Contingencies
For a discussion about income tax contingencies, see Notes to Consolidated and Combined Financial Statements—
Note 8D. Tax Matters—Tax Contingencies
.
For a discussion about legal contingencies, guarantees and indemnifications, see Notes to Consolidated and Combined Financial Statement—
Note 17. Commitments and Contingencies
.
The following discussion and analysis of our consolidated and combined statements of income should be read along with our consolidated and combined financial statements, and the notes thereto. For more information on the carve-out basis of presentation for the periods prior to the IPO, see Notes to Consolidated and Combined Financial Statements—
Note 3. Basis of Presentation
.
|
Year Ended December 31,
|
% Change
|
|||||||||||||||||
|
(MILLIONS OF DOLLARS)
|
2014
|
|
2013
|
|
2012
|
|
14/13
|
|
13/12
|
|
||||||||
|
Revenue
|
$
|
4,785
|
|
$
|
4,561
|
|
$
|
4,336
|
|
5
|
|
5
|
|
|||||
|
Costs and expenses:
|
||||||||||||||||||
|
Cost of sales
(a)
|
1,717
|
|
1,669
|
|
1,563
|
|
3
|
|
7
|
|
||||||||
|
% of revenue
|
36
|
%
|
37
|
%
|
36
|
%
|
||||||||||||
|
Selling, general and administrative expenses
(a)
|
1,643
|
|
1,613
|
|
1,470
|
|
2
|
|
10
|
|
||||||||
|
% of revenue
|
34
|
%
|
35
|
%
|
34
|
%
|
||||||||||||
|
Research and development expenses
(a)
|
396
|
|
399
|
|
409
|
|
(1
|
)
|
(2
|
)
|
||||||||
|
% of revenue
|
8
|
%
|
9
|
%
|
9
|
%
|
||||||||||||
|
Amortization of intangible assets
|
60
|
|
60
|
|
64
|
|
—
|
|
(6
|
)
|
||||||||
|
Restructuring charges and certain acquisition-related costs
|
25
|
|
26
|
|
135
|
|
(4
|
)
|
(81
|
)
|
||||||||
|
Interest expense, net of capitalized interest
|
117
|
|
113
|
|
31
|
|
4
|
|
*
|
|
||||||||
|
Other (income)/deductions—net
|
7
|
|
(9
|
)
|
(46
|
)
|
*
|
|
(80
|
)
|
||||||||
|
Income before provision for taxes on income
|
820
|
|
690
|
|
710
|
|
19
|
|
(3
|
)
|
||||||||
|
% of revenue
|
17
|
%
|
15
|
%
|
16
|
%
|
||||||||||||
|
Provision for taxes on income
|
233
|
|
187
|
|
274
|
|
25
|
|
(32
|
)
|
||||||||
|
Effective tax rate
|
28.4
|
%
|
27.1
|
%
|
38.6
|
%
|
||||||||||||
|
Net income before allocation to noncontrolling interests
|
587
|
|
503
|
|
436
|
|
17
|
|
15
|
|
||||||||
|
Less: Net income attributable to noncontrolling interests
|
4
|
|
(1
|
)
|
—
|
|
*
|
|
*
|
|
||||||||
|
Net income attributable to Zoetis
|
$
|
583
|
|
$
|
504
|
|
$
|
436
|
|
16
|
|
16
|
|
|||||
|
% of revenue
|
12
|
%
|
11
|
%
|
10
|
%
|
||||||||||||
* Calculation not meaningful.
Certain amounts and percentages may reflect rounding adjustments.
|
(a)
|
Exclusive of amortization of intangible assets, except as disclosed in Notes to Consolidated and Combined Financial Statements—
Note 4. Significant Accounting Policies—Amortization of Intangible Assets, Depreciation and Certain Long-Lived Assets
.
|
41
|
Revenue
Total revenue by operating segment was as follows:
|
Year Ended December 31,
|
% Change
|
||||||||||||||||
|
(MILLIONS OF DOLLARS)
|
2014
|
|
2013
|
|
2012
|
|
14/13
|
|
13/12
|
||||||||
|
U.S.
|
$
|
2,059
|
|
$
|
1,902
|
|
$
|
1,776
|
|
8
|
|
7
|
|||||
|
EuAfME
|
1,141
|
|
1,115
|
|
1,068
|
|
2
|
|
4
|
||||||||
|
CLAR
|
815
|
|
778
|
|
769
|
|
5
|
|
1
|
||||||||
|
APAC
|
720
|
|
713
|
|
695
|
|
1
|
|
3
|
||||||||
|
Contract Manufacturing
|
50
|
|
53
|
|
28
|
|
(6
|
)
|
89
|
||||||||
|
Total
|
$
|
4,785
|
|
$
|
4,561
|
|
$
|
4,336
|
|
5
|
|
5
|
|||||
Certain amounts and percentages may reflect rounding adjustments.
On a global basis, the mix of revenue between livestock and companion animal products was as follows:
|
Year Ended December 31,
|
% Change
|
||||||||||||||||
|
(MILLIONS OF DOLLARS)
|
2014
|
|
2013
|
|
2012
|
|
14/13
|
|
13/12
|
||||||||
|
Livestock
|
$
|
3,103
|
|
$
|
2,916
|
|
$
|
2,795
|
|
6
|
|
4
|
|||||
|
Companion animal
|
1,632
|
|
1,592
|
|
1,513
|
|
3
|
|
5
|
||||||||
|
Contract Manufacturing
|
50
|
|
53
|
|
28
|
|
(6
|
)
|
89
|
||||||||
|
Total
|
$
|
4,785
|
|
$
|
4,561
|
|
$
|
4,336
|
|
5
|
|
5
|
|||||
Certain amounts and percentages may reflect rounding adjustments.
2014 vs. 2013
Total revenue increased $
224 million
, or
5%
, in
2014
compared to
2013
, with growth across all operating segments, due to higher operational revenue of $
320 million
, or
7
%, comprised of 5% volume increases and 2% price increases. Operational revenue growth was driven by increased revenue in the U.S. and good performance in emerging markets, particularly Venezuela, Brazil, and China. Total livestock sales increased
9%
operationally, driven by strong sales of our cattle, swine and poultry portfolios. Growth in sales of cattle products were driven by increased sales of our premium anti-infective products, while sales of swine products were tempered by the effect of PEDv. Total companion animal sales increased
4%
operationally, driven by the introduction of Apoquel
®
in the United States, the UK, and Germany, as well as strong performance in Latin American countries due to price and volume increases in high inflationary markets and the continued increase in medicalization rates. Partially offsetting the increase in operational revenue was the
unfavorable
impact of foreign exchange, which decreased revenue by approximately $
96 million
, or
2
%, driven by the depreciation of certain international currencies, particularly the Brazilian real and Argentine peso.
2013 vs. 2012
Total revenue increased $
225 million
, or
5%
, in
2013
compared to
2012
, with growth across all operating segments, due to higher operational revenue of $
288 million
, or
7
%, comprised of 5% volume and 2% price. Operational revenue growth was driven by increased revenue in the United States and good performance in emerging markets, particularly Brazil, China and Russia. Total livestock sales increased
6%
operationally, driven by strong sales of our swine, poultry and cattle portfolios. Growth in sales of swine products were primarily driven by new product launches, while poultry performance was driven by sales of our medicated feed additive products, which were in rotation for much of the year. Total companion animal sales increased
6%
operationally, driven by the successful implementation of marketing and promotional strategies. Partially offsetting the increase in operational revenue was the unfavorable impact of foreign exchange, which decreased revenue by approximately $
63 million
, or
2
%, driven by the depreciation of certain international currencies, particularly the Brazilian real and Japanese yen.
Costs and Expenses
Cost of sales
|
Year Ended December 31,
|
% Change
|
|||||||||||||||
|
(MILLIONS OF DOLLARS)
|
2014
|
|
2013
|
|
2012
|
|
14/13
|
13/12
|
||||||||
|
Cost of sales
(a)
|
$
|
1,717
|
|
$
|
1,669
|
|
$
|
1,563
|
|
3
|
7
|
|||||
|
% of revenue
|
36
|
%
|
37
|
%
|
36
|
%
|
||||||||||
Certain amounts and percentages may reflect rounding adjustments.
|
(a)
|
Allocation of corporate enabling functions were: $3 million in 2013 and $1 million in 2012.
|
2014 vs. 2013
Cost of sales
increased
$
48 million
, or
3%
, in
2014
compared with
2013
, primarily as a result of::
|
•
|
an increase in sales volume;
|
|
•
|
incremental global manufacturing and supply spending associated with the build-up of our operations in 2013, which is now impacting our 2014 cost of sales; and
|
|
•
|
an increase in inventory obsolescence, scrap and other charges,
|
42
|
partially offset by:
|
•
|
favorable foreign exchange.
|
2013 vs. 2012
Cost of sales
increased
$
106 million
, or
7%
, in
2013
compared with
2012
, primarily as a result of:
|
•
|
revenue growth and product and geographic mix;
|
|
•
|
additional costs of $21 million related to becoming an independent public company, including expense of $2 million due to the accelerated vesting of certain Pfizer equity awards and associated cash payments, as a result of the Separation;
|
|
•
|
a $19 million charge associated with the write-offs of inventory and intercompany accounts that were transferred to us as part of the Separation from Pfizer;
|
|
•
|
higher costs associated with certain manufacturing agreements related to government-mandated divestitures from prior acquisitions; and
|
|
•
|
unfavorable foreign exchange,
|
partially offset by:
|
•
|
operational efficiencies; and
|
|
•
|
lower employee benefit costs due to the termination of the defined benefit pension plan for U.S. employees.
|
Selling, general and administrative expenses
|
Year Ended December 31,
|
% Change
|
|||||||||||||||
|
(MILLIONS OF DOLLARS)
|
2014
|
|
2013
|
|
2012
|
|
14/13
|
13/12
|
||||||||
|
Selling, general and administrative expenses
(a)
|
$
|
1,643
|
|
$
|
1,613
|
|
$
|
1,470
|
|
2
|
10
|
|||||
|
% of revenue
|
34
|
%
|
35
|
%
|
34
|
%
|
||||||||||
Certain amounts and percentages may reflect rounding adjustments.
|
(a)
|
Allocation of corporate enabling functions were: $24 million in 2013 and $254 million in 2012.
|
2014 vs. 2013
SG&A expenses increased by $
30 million
, or
2%
, in
2014
compared with
2013
, primarily as a result of:
|
•
|
increased field selling and distribution expenses in certain regions due to higher sales and increased costs associated with delivering our products to customers; and
|
|
•
|
additional costs due to the build-up of our supply chain and logistics organization and enabling functions and related costs post-separation from Pfizer,
|
partially offset by:
|
•
|
a reduction in the amount of additional costs related to becoming an independent public company, including the nonrecurrence of additional costs in 2013 due to the accelerated vesting of stock options and associated expenses related to certain Pfizer equity awards as a result of the Separation;
|
|
•
|
favorable foreign exchange; and
|
|
•
|
lower direct marketing spending.
|
2013 vs. 2012
SG&A expenses
increased
by $
143 million
, or
10%
, in
2013
compared with
2012
, primarily as a result of:
|
•
|
additional costs of $177 million related to becoming an independent public company, including expense of $25 million due to the accelerated vesting of certain Pfizer equity awards and associated cash payments, as a result of the Separation;
|
|
•
|
a $5 million charge associated with the write-offs of intercompany accounts that were transferred to us as part of the Separation from Pfizer; and
|
|
•
|
increased distribution expenses due to higher sales and increased temperature-controlled supply chain
costs in certain regions,
|
partially offset by:
|
•
|
lower employee benefit costs due to the termination of the defined benefit pension plan for U.S. employees;
|
|
•
|
lower bad debt expense associated with improved accounts receivable collection experience; and
|
|
•
|
favorable foreign exchange.
|
43
|
Research and development expenses
|
Year Ended December 31,
|
% Change
|
|||||||||||||||||
|
(MILLIONS OF DOLLARS)
|
2014
|
|
2013
|
|
2012
|
|
14/13
|
|
13/12
|
|
||||||||
|
Research and development expenses
(a)
|
$
|
396
|
|
$
|
399
|
|
$
|
409
|
|
(1
|
)
|
(2
|
)
|
|||||
|
% of revenue
|
8
|
%
|
9
|
%
|
9
|
%
|
||||||||||||
Certain amounts and percentages may reflect rounding adjustments.
|
(a)
|
Allocation of corporate enabling functions were $55 million in 2012.
|
2014 vs. 2013
R&D expenses
decreased
by $
3 million
, or
1%
, in
2014
compared with
2013
, primarily as a result of:
|
•
|
the nonrecurrence of additional costs in 2013 due to the accelerated vesting of stock options and associated expenses related to certain Pfizer equity awards as a result of the Separation;
|
|
•
|
savings associated with the closure of two R&D sites; and
|
|
•
|
favorable foreign exchange,
|
partially offset by:
|
•
|
higher salary-related expenses.
|
2013 vs. 2012
R&D expenses
decreased
$
10 million
, or
2%
, in
2013
compared with
2012
, primarily as a result of:
|
•
|
the non-recurrence of depreciation expense incurred in 2012 related to the closing of an R&D facility in the UK; and
|
|
•
|
lower employee benefit costs due to the termination of the defined benefit pension plan for U.S. employees,
|
partially offset by:
|
•
|
incremental costs of $7 million related to becoming an independent public company, including expense of $4 million due to the accelerated vesting of certain Pfizer equity awards and associated cash payments, as a result of the Separation; and
|
|
•
|
an increase in the volume of R&D activities.
|
Amortization of intangible assets
|
Year Ended December 31,
|
% Change
|
||||||||||||||||
|
(MILLIONS OF DOLLARS)
|
2014
|
|
2013
|
|
2012
|
|
14/13
|
13/12
|
|
||||||||
|
Amortization of intangible assets
|
$
|
60
|
|
$
|
60
|
|
$
|
64
|
|
—
|
(6
|
)
|
|||||
Certain amounts and percentages may reflect rounding adjustments.
2014 vs. 2013
Amortization of intangible assets was flat in
2014
compared with
2013
.
2013 vs. 2012
Amortization of intangible assets
decreased
$
4 million
, or
6%
, in
2013
compared with
2012
, which reflects the impact of certain intangible assets reaching the end of their respective useful lives.
Restructuring charges and certain acquisition-related costs
|
Year Ended December 31,
|
% Change
|
|||||||||||||||||
|
(MILLIONS OF DOLLARS)
|
2014
|
|
2013
|
|
2012
|
|
14/13
|
|
13/12
|
|
||||||||
|
Restructuring charges and certain acquisition-related costs
(a)
|
$
|
25
|
|
$
|
26
|
|
$
|
135
|
|
(4
|
)
|
(81
|
)
|
|||||
Certain amounts and percentages may reflect rounding adjustments.
|
(a)
|
Allocation of
Restructuring charges and certain acquisition-related costs
were $57 million in 2012.
|
During the year ended December 31, 2014, we recorded restructuring charges of
$12 million
related to employee severance costs in EuAfME and
$6 million
related to employee severance costs in our global manufacturing operations, as a result of initiatives to reduce costs and better align our organizational structure. We may incur additional restructuring costs in 2015 as we finalize plans and programs aimed at improving operational and cost efficiencies.
In the fourth quarter of 2012, when we were a business unit of Pfizer, we announced a restructuring plan related to our operations in Europe. In connection with these actions, we recorded a pre-tax charge of
$27 million
to recognize employee termination costs. As a result of becoming a standalone public company (no longer being a majority-owned subsidiary of Pfizer) and related economic consideration, we revisited this
44
|
restructuring action and decided to no longer implement this restructuring plan. As such, we reversed the existing reserve of
$27 million
in the second quarter of 2013.
Our acquisition-related costs primarily related to restructuring charges for employees, assets and activities that will not continue in the future, as well as integration costs. The majority of these net restructuring charges are related to termination costs, but we also exited a number of distributor and other contracts and performed certain facility rationalization efforts. Our integration costs are generally comprised of consulting costs related to the integration of systems and processes, as well as product transfer costs.
For additional information regarding restructuring charges and acquisition-related costs, see Notes to Consolidated and Combined Financial Statements—
Note 6. Restructuring Charges and Other Costs Associated with Acquisitions and Cost-Reduction/Productivity Initiatives
.
2014 vs. 2013
Restructuring charges and certain acquisition-related costs
decreased
by $
1 million
in
2014
compared with
2013
, primarily as a result of:
|
•
|
a decrease in asset impairment charges due to the exiting of one of our manufacturing facilities in 2013; and
|
|
•
|
a decrease in integration costs related to the KAH and FDAH acquisitions,
|
partially offset by:
|
•
|
an increase in employee termination costs primarily due to a reversal in 2013 related to a previously established termination reserve that was reversed in the second quarter of 2013 related to our operations in Europe.
|
2013 vs. 2012
Restructuring charges and certain acquisition-related costs
decreased
$
109 million
, or
81%
, in 2013 compared with 2012, primarily as a result of:
|
•
|
a $27 million decrease in employee termination costs related to the reversal of a previously established termination reserve related to our operations in Europe;
|
|
•
|
a decrease in integration and restructuring costs related to the KAH and FDAH acquisitions; and
|
|
•
|
the non-recurrence of allocated charges from Pfizer,
|
partially offset by:
|
•
|
asset impairment charges of approximately $17 million related to one of our manufacturing facilities in the United States; and
|
|
•
|
employee termination costs of $2 million, exit costs of $4 million, and accelerated depreciation of $5 million as a result of exiting certain manufacturing and research facilities.
|
Interest expense, net of capitalized interest
|
Year Ended December 31,
|
% Change
|
|||||||||||||||
|
(MILLIONS OF DOLLARS)
|
2014
|
|
2013
|
|
2012
|
|
14/13
|
13/12
|
||||||||
|
Interest expense, net of capitalized interest
|
$
|
117
|
|
$
|
113
|
|
$
|
31
|
|
4
|
*
|
|||||
* Calculation not meaningful.
Certain amounts and percentages may reflect rounding adjustments.
2014 vs. 2013
Interest expense, net of capitalized interest,
increased
by $
4 million
, or
4%
, in
2014
compared with
2013
, primarily related to an additional month of interest expense in 2014 associated with our senior notes which were issued on January 28, 2013. This increase was partially offset by the nonrecurrence of allocated debt and related allocated interest expense from Pfizer. Interest expense related to allocated debt was $2 million for 2013.
2013 vs. 2012
Interest expense, net of capitalized interest,
increased
by $
82
million in
2013
compared with
2012
, primarily due to the issuance of our senior notes on January 28, 2013.
Other (income)/deductions—net
|
Year Ended December 31,
|
% Change
|
|||||||||||||||
|
(MILLIONS OF DOLLARS)
|
2014
|
|
2013
|
|
2012
|
|
14/13
|
13/12
|
||||||||
|
Other (income)/deductions—net
|
$
|
7
|
|
$
|
(9
|
)
|
$
|
(46
|
)
|
*
|
*
|
|||||
* Calculation not meaningful.
Certain amounts and percentages may reflect rounding adjustments.
2014 vs. 2013
The change in
Other (income)/deductions—net
reflects
an unfavorable
impact of $
16 million
on income attributable to Zoetis in
2014
compared with
2013
, primarily as a result of:
45
|
|
•
|
a charge associated with a commercial settlement and recall in Mexico of $13 million, partially offset by the related insurance recovery of $1 million;
|
|
•
|
higher foreign currency losses of $8 million, primarily driven by costs related to hedging and exposures to certain emerging market currencies, as well as losses related to the depreciation of the Argentine peso in the first quarter of 2014;
|
|
•
|
an impairment charge related to IPR&D assets acquired with the FDAH acquisition in 2009, as a result of the termination of the development program due to a re-assessment of economic viability; and
|
|
•
|
a pension plan settlement charge related to the divestiture of a manufacturing facility,
|
partially offset by:
|
•
|
an insurance recovery of litigation related charges.
|
2013 vs. 2012
The change in
Other (income)/deductions—net
reflects
an unfavorable
impact of $
37 million
on income attributable to Zoetis in
2013
compared with
2012
, primarily as a result of:
|
•
|
the non-recurrence of income recognized in 2012 from a favorable legal settlement of $14 million and the non-recurrence of a favorable change in estimate for an environmental-related reserve of $7 million in 2012;
|
|
•
|
foreign currency loss of $9 million related to the Venezuela currency devaluation in February 2013; and
|
|
•
|
other foreign currency losses primarily related to Argentina,
|
partially offset by:
|
•
|
a net gain on the government-mandated sale of certain product rights in Brazil that were acquired with the FDAH acquisition in 2009; and
|
|
•
|
lower asset impairment charges of identifiable intangible assets of approximately $4 million.
|
Provision for taxes on income
|
Year Ended December 31,
|
% Change
|
||||||||||||||||
|
(MILLIONS OF DOLLARS)
|
2014
|
|
2013
|
|
2012
|
|
14/13
|
13/12
|
|
||||||||
|
Provision for taxes on income
|
$
|
233
|
|
$
|
187
|
|
$
|
274
|
|
25
|
(32
|
)
|
|||||
|
Effective tax rate
|
28.4
|
%
|
27.1
|
%
|
38.6
|
%
|
|||||||||||
Certain amounts and percentages may reflect rounding adjustments.
As of the Separation date, we operate under a standalone legal entity structure and the income tax provision in the consolidated statements of income has been calculated accordingly. For the periods prior to the Separation, the income tax provision in the combined statements of income has been calculated as if Zoetis filed a separate tax return and includes tax costs and benefits, such as uncertain tax positions, repatriation decisions and audit settlements, among others.
The impact of the incentive tax rulings in Belgium, effective December 1, 2012 through 2017, and Singapore, effective October 29, 2012 through 2016, continue to be a component of the 2014 effective tax in rate. These incentive tax rulings may be extended for another 5 and 6 years, respectively, if certain requirements are met.
On December 19, 2014, the President of the United States signed into law the Tax Increase Prevention Act of 2014 (the 2014 Act), which extended the U.S. Research and Development Tax Credit for tax year 2014, as well as other provisions. Given the enactment date of the 2014 Act, the impact of the 2014 U.S. Research and Development Tax Credit is included in the 2014 effective tax rate.
During the third quarter of 2012, Pfizer reached a settlement with the U.S. Internal Revenue Service (IRS) with respect to the audits of the Pfizer Inc. tax returns for the years 2006 through 2008. The settlement resulted in an income tax benefit to Zoetis of approximately $29.3 million, representing tax and interest.
For more information, see Notes to Consolidated and Combined Financial Statements—
Note 8A. Tax Matters—Taxes on Income
.
2014 vs. 2013
The difference in the effective tax rate in
2014
compared with
2013
is primarily due to the following components:
|
•
|
the change in the jurisdictional mix of earnings, which includes the impact of the location of earnings as well as repatriation costs. The jurisdictional mix of earnings can vary as a result of repatriation decisions and as a result of operating fluctuations in the normal course of business, the impact of non-deductible items and the extent and location of other income and expense items, such as restructuring charges/(benefits), asset impairments and gains and losses on asset divestitures;
|
|
•
|
changes in valuation allowances and resolution of other tax items;
|
|
•
|
the tax cost related to changes in uncertain tax positions, see Notes to Consolidated and Combined Financial Statements—
Note 8D. Tax Matters
—
Tax Contingencies
; and
|
|
•
|
an $8 million discrete tax expense during the first quarter of 2014 related to an intercompany inventory adjustment.
|
46
|
2013 vs. 2012
The lower effective tax rate in
2013
compared with
2012
is primarily due to:
|
•
|
the change in the jurisdictional mix of earnings, which includes the impact of the location of earnings as well as repatriation costs. The jurisdictional mix of earnings can vary as a result of repatriation decisions and as a result of operating fluctuations in the normal course of business, the impact of non-deductible items and the extent and location of other income and expense items, such as restructuring charges/(benefits), asset impairments and gains and losses on asset divestitures;
|
|
•
|
incentive tax rulings in Belgium, effective December 1, 2012 through 2017, and Singapore, effective October 29, 2012 through 2016. These incentive tax rulings may be extended for another 5 and 6 years, respectively, if certain requirements are met; and
|
|
•
|
a $2 million discrete income tax benefit during the first quarter of 2013 related to the 2012 U.S. Research and Development Tax Credit which was retroactively extended on January 3, 2013,
|
partially offset by:
|
•
|
the tax cost related to changes in uncertain tax positions, see Notes to Consolidated and Combined Financial Statements—
Note 8D. Tax Matters
—
Tax Contingencies
.
|
Operating Segment Results
In the first quarter of 2014, we realigned our segment reporting with respect to our Client Supply Services (CSS) organization, which provides contract manufacturing services to third parties, to reflect how our chief operating decision maker currently evaluates our financial results. The revenue and earnings associated with CSS are now reported within
Other business activities
, separate from our four reportable segments. In 2013 and 2012, CSS results were reported in the EuAfME segment. The current presentation of segments is more reflective of our commercial business since CSS operates differently from our commercial operations within the geographic segments. CSS revenue for 2013 was $53 million (livestock - $15 million; companion animal - $38 million). CSS revenue for 2012 was $28 million (livestock - $11 million; companion animal - $17 million). CSS earnings (loss) for 2013 and 2012 were $8 million and $(1) million, respectively. We have revised our segment results presented herein to reflect this new segment structure, including for the comparable 2013 and 2012 periods.
We believe that it is important to not only understand overall revenue and earnings growth, but also “operational growth.” Operational growth is defined as revenue or earnings growth excluding the impact of foreign exchange.
On a global basis, the mix of revenue between livestock and companion animal products was as follows:
|
% Change
|
|||||||||||||||||||||||||
|
14/13
|
13/12
|
||||||||||||||||||||||||
|
Related to
|
Related to
|
||||||||||||||||||||||||
|
Year Ended December 31,
|
Foreign
|
|
Foreign
|
|
|||||||||||||||||||||
|
(MILLIONS OF DOLLARS)
|
2014
|
|
2013
|
|
2012
|
|
Total
|
|
Exchange
|
|
Operational
|
|
Total
|
Exchange
|
|
Operational
|
|||||||||
|
U.S.
|
|||||||||||||||||||||||||
|
Livestock
|
$
|
1,163
|
|
$
|
1,034
|
|
$
|
966
|
|
12
|
|
—
|
|
12
|
|
7
|
—
|
|
7
|
||||||
|
Companion animal
|
896
|
|
868
|
|
810
|
|
3
|
|
—
|
|
3
|
|
7
|
—
|
|
7
|
|||||||||
|
2,059
|
|
1,902
|
|
1,776
|
|
8
|
|
—
|
|
8
|
|
7
|
—
|
|
7
|
||||||||||
|
EuAfME
|
|||||||||||||||||||||||||
|
Livestock
|
772
|
|
762
|
|
729
|
|
1
|
|
(1
|
)
|
2
|
|
5
|
1
|
|
4
|
|||||||||
|
Companion animal
|
369
|
|
353
|
|
339
|
|
5
|
|
1
|
|
4
|
|
4
|
1
|
|
3
|
|||||||||
|
1,141
|
|
1,115
|
|
1,068
|
|
2
|
|
—
|
|
2
|
|
4
|
1
|
|
3
|
||||||||||
|
CLAR
|
|||||||||||||||||||||||||
|
Livestock
|
633
|
|
605
|
|
603
|
|
5
|
|
(8
|
)
|
13
|
|
—
|
(6
|
)
|
6
|
|||||||||
|
Companion animal
|
182
|
|
173
|
|
166
|
|
5
|
|
(8
|
)
|
13
|
|
4
|
(5
|
)
|
9
|
|||||||||
|
815
|
|
778
|
|
769
|
|
5
|
|
(8
|
)
|
13
|
|
1
|
(5
|
)
|
6
|
||||||||||
|
APAC
|
|||||||||||||||||||||||||
|
Livestock
|
535
|
|
515
|
|
497
|
|
4
|
|
(4
|
)
|
8
|
|
4
|
(4
|
)
|
8
|
|||||||||
|
Companion animal
|
185
|
|
198
|
|
198
|
|
(7
|
)
|
(5
|
)
|
(2
|
)
|
—
|
(7
|
)
|
7
|
|||||||||
|
720
|
|
713
|
|
695
|
|
1
|
|
(4
|
)
|
5
|
|
3
|
(4
|
)
|
7
|
||||||||||
|
Total
|
|||||||||||||||||||||||||
|
Livestock
|
3,103
|
|
2,916
|
|
2,795
|
|
6
|
|
(3
|
)
|
9
|
|
4
|
(2
|
)
|
6
|
|||||||||
|
Companion animal
|
1,632
|
|
1,592
|
|
1,513
|
|
3
|
|
(1
|
)
|
4
|
|
5
|
(1
|
)
|
6
|
|||||||||
|
Contract manufacturing
|
50
|
|
53
|
|
28
|
|
(6
|
)
|
(1
|
)
|
(5
|
)
|
89
|
3
|
|
86
|
|||||||||
|
$
|
4,785
|
|
$
|
4,561
|
|
$
|
4,336
|
|
5
|
|
(2
|
)
|
7
|
|
5
|
(2
|
)
|
7
|
|||||||
Certain amounts and percentages may reflect rounding adjustments.
47
|
Earnings by segment and the operational and foreign exchange changes versus the comparable prior year period were as follows:
|
% Change
|
|||||||||||||||||||||
|
14/13
|
13/12
|
||||||||||||||||||||
|
Related to
|
Related to
|
||||||||||||||||||||
|
Year Ended December 31,
|
Foreign
|
|
Foreign
|
|
|||||||||||||||||
|
(MILLIONS OF DOLLARS)
|
2014
|
|
2013
|
|
2012
|
|
Total
|
|
Exchange
|
|
Operational
|
Total
|
|
Exchange
|
|
Operational
|
|||||
|
U.S.
|
$
|
1,176
|
|
$
|
1,045
|
|
$
|
921
|
|
13
|
|
—
|
|
13
|
13
|
|
—
|
|
13
|
||
|
EuAfME
|
437
|
|
412
|
|
376
|
|
6
|
|
(1
|
)
|
7
|
10
|
|
2
|
|
8
|
|||||
|
CLAR
|
310
|
|
266
|
|
253
|
|
17
|
|
—
|
|
17
|
5
|
|
(11
|
)
|
16
|
|||||
|
APAC
|
278
|
|
271
|
|
236
|
|
3
|
|
(6
|
)
|
9
|
15
|
|
(3
|
)
|
18
|
|||||
|
Total reportable segments
|
2,201
|
|
1,994
|
|
1,786
|
|
10
|
|
(2
|
)
|
12
|
12
|
|
(1
|
)
|
13
|
|||||
|
Other business activities
|
(314
|
)
|
(312
|
)
|
(276
|
)
|
1
|
|
13
|
|
|||||||||||
|
Reconciling Items:
|
|||||||||||||||||||||
|
Corporate
|
(571
|
)
|
(567
|
)
|
(506
|
)
|
1
|
|
12
|
|
|||||||||||
|
Purchase accounting adjustments
|
(51
|
)
|
(48
|
)
|
(52
|
)
|
6
|
|
(8
|
)
|
|||||||||||
|
Acquisition-related costs
|
(8
|
)
|
(22
|
)
|
(53
|
)
|
(64
|
)
|
(58
|
)
|
|||||||||||
|
Certain significant items
|
(205
|
)
|
(240
|
)
|
(96
|
)
|
(15
|
)
|
*
|
|
|||||||||||
|
Other unallocated
|
(232
|
)
|
(115
|
)
|
(93
|
)
|
*
|
|
24
|
|
|||||||||||
|
Income before income taxes
|
$
|
820
|
|
$
|
690
|
|
$
|
710
|
|
19
|
|
(3
|
)
|
||||||||
* Calculation not meaningful.
Certain amounts and percentages may reflect rounding adjustments.
2014 vs. 2013
U.S. operating segment
U.S. segment revenue
increased
by $
157 million
, or
8
%, in
2014
compared with
2013
, of which approximately $
129 million
resulted from
growth
in livestock products and approximately $
28 million
resulted from
growth
in companion animal products.
|
•
|
Livestock revenue growth was driven by increased sales across the cattle, swine, and poultry portfolios. Strong growth in sales of cattle products was primarily due to higher demand for our premium products as a result of improved market conditions, driven by higher cattle prices and lower costs of feed, compared with 2013. Growth in swine products was due to the successful launch of new products, tempered by the impact of PEDv on the number of treatable animals. Sales of poultry products benefited from new vaccines and growth in medicated feed additives.
|
|
•
|
Companion animal revenue growth was driven by the introduction of Apoquel
®
as well as sales growth in other key brands. Results were partially offset by competitive pressures in our vaccine and pain portfolios and were tempered by competition in our parasiticides portfolio.
|
U.S. segment earnings
increased
by $
131 million
, or
13
%, in
2014
compared with
2013
, due to strong revenue growth and improved gross margin due to the benefit of higher prices and favorable product mix. Segment earnings growth also benefited from limited growth in operating expenses.
EuAfME operating segment
EuAfME segment revenue
increased
by $
26 million
, or
2
%, in
2014
compared with
2013
. Operational revenue growth was $
28 million
, or
2
%, of which approximately $
15 million
resulted from
growth
in livestock products and $
13 million
resulted from
growth
in companion animal products.
|
•
|
Livestock revenue growth was primarily driven by higher sales in the cattle portfolio, particularly in emerging markets, driven by strong performance of our anti-infectives portfolio and the introduction of new products. Additionally, sales in the poultry portfolio increased due to strong performance in our vaccine portfolio and improved market conditions in several Middle Eastern markets.
|
|
•
|
Companion animal revenue growth was favorably impacted by the successful launch of Apoquel
®
in Germany and the UK.
|
Additionally, segment revenue was un
favorably
impacted by foreign exchange, which decreased revenue by approximately $
2 million
.
EuAfME segment earnings
increased
by $
25 million
, or
6
%, in
2014
compared with
2013
. Operational earnings growth was $
27 million
, or
7
%, primarily driven by revenue growth and improved gross margin due to the benefit of favorable mix and higher prices.
CLAR operating segment
CLAR segment revenue
increased
by $
37 million
, or
5
%, in
2014
compared with
2013
. Operational revenue growth was $
103 million
, or
13
%, of which approximately $
80 million
resulted from
growth
in livestock products and $
23 million
resulted from
growth
in companion animal product sales.
|
•
|
Livestock revenue growth was primarily driven by increased sales in the cattle and swine portfolios, particularly in Venezuela, Brazil and Canada. Livestock sales were also favorably impacted by price increases in high inflationary markets such as Venezuela and Argentina.
|
48
|
|
•
|
Companion animal growth was favorably impacted by increased sales in Venezuela and Brazil, as well as higher prices in Argentina and Canada.
|
Additionally, segment revenue was
unfavorably
impacted by foreign exchange, which decreased revenue by approximately $
66 million
, or
8
%.
CLAR segment earnings
increased
by $
44 million
, or
17
%, in
2014
compared with
2013
, primarily due to revenue growth and higher gross margin, as well as the unfavorable impact of the Venezuela currency devaluation in the prior year. Operational earnings growth was $
45 million
, or
17
%, in
2014
compared to
2013
.
APAC operating segment
APAC segment revenue
increased
by $
7 million
, or
1
%, in
2014
compared with
2013
. Operational revenue growth was $
35 million
, or
5
%, of which approximately $
39 million
resulted from
growth
in livestock products and approximately $
4 million
resulted from
declines
in companion animal products.
|
•
|
Livestock revenue growth was primarily driven by increased sales in the swine portfolio in China. Additionally, there was growth in sales of cattle products in China and Australia.
|
|
•
|
The decrease in companion animal revenue was primarily due to a decrease in sales in Japan due to an inventory buyback related to the termination of a distributor agreement and unfavorable market conditions. Results were partially offset by an increase in equine product sales in Australia and an increase in small animal product sales in China.
|
Additionally, segment revenue was
unfavorably
impacted by foreign exchange, which decreased revenue by approximately $
28 million
, or
4
%.
APAC segment earnings
increased
by $
7 million
, or
3
%, in
2014
compared with
2013
. Operational earnings growth was $
25 million
, or
9
%, in 2013 compared to 2012, primarily due to increased revenue.
2013 vs. 2012
U.S. operating segment
U.S. segment revenue
increased
by $
126 million
, or
7
%, in
2013
compared with
2012
, of which approximately $
68 million
resulted from
growth
in livestock products and approximately $
58 million
resulted from
growth
in companion animal products.
|
•
|
Livestock revenue growth was achieved in all species. The growth in swine products was due to continued customer acceptance of new products and the successful execution of marketing programs developed for and focused on specific brands, therapeutic categories or customer segments. Growth in sales of poultry products was due to growth in medicated feed additives, and growth in sales of cattle products was driven by improved market conditions in the second half of 2013.
|
|
•
|
Companion animal revenue growth was driven by solid growth in small animal products reflecting the benefit of realigning our field force in late 2012 to more effectively cover our customer base, the positive outcomes of new cross-portfolio pricing programs, and price increases. Growth was slightly offset by a decline in the sales of equine products reflecting a continuing contraction of the market.
|
U.S. segment earnings
increased
by $
124 million
, or
13
%, in
2013
compared with
2012
, due to strong revenue growth and improved gross margin due to the benefit of higher prices and favorable product mix. Segment earnings growth also benefited from limited growth in operating expenses.
EuAfME operating segment
EuAfME segment revenue
increased
by $
47 million
, or
4
%, in
2013
compared with
2012
. Operational revenue growth was $
37 million
, or
3
%, of which approximately $
28 million
resulted from
growth
in livestock products and approximately $
9 million
resulted from
growth
in companion animal products.
|
•
|
Livestock revenue growth was primarily driven by emerging markets, particularly Russia. Additionally, growth in swine products was favorably impacted by the launch of a new swine vaccine (that prevents porcine circovirus type 2) across many markets in the region, particularly in Germany and Russia. This growth was partially offset by continuing challenging market conditions throughout Western Europe affecting the cattle portfolio.
|
|
•
|
Companion animal revenue growth was favorably impacted by increased sales of products that are related to certain third-party manufacturing agreements. Additionally, sales in the UK and France increased due to the benefit of increased promotional programs. Results were partially offset by continuing adverse macroeconomic conditions throughout Western Europe.
|
Additionally, segment revenue was
favorably
impacted by foreign exchange, which increased revenue by approximately $
10 million
, or
1
%.
EuAfME segment earnings
increased
by $
36 million
, or
10
%, in
2013
compared with
2012
. Operational earnings growth was $
32 million
, or
8
%, primarily driven by revenue growth and increased operating efficiencies.
CLAR operating segment
CLAR segment revenue
increased
by $
9 million
, or
1
%, in
2013
compared with
2012
. Operational revenue growth was $
49 million
, or
6
%, of which approximately $
35 million
resulted from
growth
in livestock products and approximately $
14 million
resulted from
growth
in companion animal product sales.
49
|
|
•
|
Livestock revenue growth was primarily driven by increased sales in the poultry and cattle portfolios. Growth in sales of poultry products was primarily driven by higher sales of medicated feed additives in Brazil. Increased cattle product sales were primarily due to growth in Mexico, Canada and Venezuela. This growth was partially offset by challenging market conditions affecting the cattle market in Brazil, where sales were relatively flat primarily due to increased local competition and drought conditions in certain areas of the country.
|
|
•
|
Companion animal growth was favorably impacted by an increasing companion animal market in Brazil and marketing programs in Brazil and Mexico. Gains were partially offset by lower sales of equine products as a result of a reduced number of horses in Canada.
|
Additionally, segment revenue was
unfavorably
impacted by foreign exchange, which decreased revenue by approximately $
40 million
, or
5
%.
CLAR segment earnings
increased
by $
13 million
, or
5
%, in
2013
compared with
2012
. Operational earnings growth was $
40 million
, or
16
%, primarily driven by revenue growth and favorable product mix. The unfavorable foreign exchange impact was driven by the depreciation of the Brazilian real as well as the devaluation of the Venezuela bolivar which occurred in the first quarter of 2013.
APAC operating segment
APAC segment revenue
increased
by $
18 million
, or
3
%, in
2013
compared with
2012
. Operational revenue growth was $
52 million
, or
7
%, of which approximately $
38 million
resulted from
growth
in livestock products and approximately $
14 million
resulted from
growth
in companion animal products.
|
•
|
Livestock revenue growth was driven primarily by increased sales in emerging markets across swine, poultry and cattle. Growth in sales of swine products was driven by higher demand and market penetration in China, as well as good performance in Japan which benefited from recently launched vaccines. Growth in the poultry and cattle portfolios was primarily driven by increased sales in India. Results were tempered by flat growth in Australia and New Zealand due to the impact of prolonged drought conditions on cattle and sheep herd sizes.
|
|
•
|
Companion animal revenue growth was primarily due to the successful launch of new products in Japan. Results were partially offset by declines in equine product sales in Australia due to increased competition.
|
Additionally, segment revenue was
unfavorably
impacted by foreign exchange, which decreased revenue by approximately $
34 million
, or
4
%.
APAC segment earnings
increased
by $
35 million
, or
15
%, in
2013
compared with
2012
. Operational earnings growth was $
42 million
, or
18
%, primarily due to increased revenue and lower operating expenses, partially offset by the unfavorable impact of geographic and product mix.
Other business activities
Other business activities includes our CSS contract manufacturing results, as well as expenses associated with our dedicated veterinary medicine R&D organization, research alliances, U.S. regulatory affairs and other operations focused on the development of our products. Other R&D-related costs associated with non-U.S. market and regulatory activities are generally included in the respective regional segment.
2014 vs. 2013
Other business activities net loss
increased
by $
2 million
, or
1
%, in
2014
compared with
2013
. The increase is driven primarily by higher salary-related expenses in our veterinary medicine R&D organization, partially offset by favorable results in our CSS contract manufacturing business.
2013 vs. 2012
Other business activities net loss
increased
by $
36 million
, or
13
%, in
2013
compared with
2012
, reflecting approximately $38 million in comparable R&D expenses in 2012 that were reported in
Corporate
in 2012, but were reported in
Other business activities
beginning in 2013, partially offset by favorable results in our CSS contract manufacturing business.
Reconciling items
Reconciling items include certain costs are not allocated to our operating segments results, such as costs associated with the following:
|
•
|
Corporate,
which includes costs associated with business technology, facilities, legal, finance, human resources, business development, public affairs and procurement, among others. These costs also include compensation costs and other miscellaneous operating expenses not charged to our operating segments, as well as interest income and expense;
|
|
•
|
Certain transactions and events such as (i)
Purchase accounting adjustments
, which includes expenses associated with the amortization of fair value adjustments to inventory, intangible assets and property, plant and equipment; (ii)
Acquisition-related activities
, which includes costs for restructuring and integration; and (iii)
Certain significant items
, which includes non-acquisition-related restructuring charges, certain asset impairment charges and costs associated with cost reduction/productivity initiatives; and
|
|
•
|
Other unallocated
, which includes certain overhead expenses associated with our global manufacturing operations not charged to our operating segments. Effective January 1, 2014,
Other unallocated
also includes certain costs associated with business technology and finance that specifically support our global manufacturing operations. These costs were previously reported in
Corporate
. Also, beginning in the first quarter of 2014, certain supply chain and global logistics costs that were previously reported in the four reportable segments are reported in
Other unallocated
. This presentation better reflects how we measure the performance of the global manufacturing organization.
|
50
|
2014 vs. 2013
Corporate expenses increased by
$4 million
, or
1%
, in 2014 compared with 2013. In 2014 we had additional costs associated with the build-up of our enabling functions post-separation from Pfizer, as well as higher interest expense, net of capitalized interest, of $4 million primarily related to an additional month of interest expense in 2014 associated with our senior notes which were issued on January 28, 2013. These increases were offset by a decrease in certain inventory-related costs not charged to our operating segments, a reduction in share-based payment expenses as a result of our separation from Pfizer, and a decrease in certain business technology and finance costs that were reported in
Corporate
in 2013, but are reported in
Other unallocated
beginning in the first quarter of 2014.
Other unallocated expenses increased by $
117 million
in 2014 compared with 2013, primarily due to a build-up of our supply chain and logistics organization. In addition, a portion of these costs were reported in the four reportable segments in 2013, but are reported in
Other unallocated
beginning in the first quarter of 2014. The increase is also attributable to the addition of certain business technology and finance costs that were reported in
Corporate
in 2013, but are reported in
Other unallocated
beginning in the first quarter of 2014.
See Notes to Consolidated and Combined Financial Statements—
Note 18. Segment, Geographic and Other Revenue Information
for further information.
2013 vs. 2012
Corporate expenses increased by $
61 million
, or
12
%, in 2013 compared with 2012, due to additional costs related to becoming an independent public company, including interest expense related to the issuance of our senior notes on January 28, 2013, partially offset by R&D-related expenses that are now presented in Other business activities.
Other unallocated expenses increased by $
22 million
, or
24%
, in 2013 compared with 2012, due primarily to the build-up of our supply chain and logistics organization.
See Notes to Consolidated and Combined Financial Statements—
Note 18. Segment, Geographic and Other Revenue Information
for further information.
Adjusted net income
General description of adjusted net income (a non-GAAP financial measure)
Adjusted net income is an alternative view of performance used by management, and we believe that investors’ understanding of our performance is enhanced by disclosing this performance measure. We report adjusted net income to portray the results of our major operations, the discovery, development, manufacture and commercialization of our products, prior to considering certain income statement elements. We have defined adjusted net income as net income attributable to Zoetis before the impact of purchase accounting adjustments, acquisition-related costs and certain significant items. The adjusted net income measure is not, and should not be viewed as, a substitute for U.S. GAAP reported net income attributable to Zoetis.
The adjusted net income measure is an important internal measurement for us. We measure our overall performance on this basis in conjunction with other performance metrics. The following are examples of how the adjusted net income measure is utilized:
|
•
|
senior management receives a monthly analysis of our operating results that is prepared on an adjusted net income basis;
|
|
•
|
our annual budgets are prepared on an adjusted net income basis; and
|
|
•
|
other goal setting and performance measurements.
|
Despite the importance of this measure to management in goal setting and performance measurement, adjusted net income is a non-GAAP financial measure that has no standardized meaning prescribed by U.S. GAAP and, therefore, has limits in its usefulness to investors. Because of its non-standardized definition, adjusted net income, unlike U.S. GAAP net income, may not be comparable to the calculation of similar measures of other companies. Adjusted net income is presented to permit investors to more fully understand how management assesses performance.
We also recognize that, as an internal measure of performance, the adjusted net income measure has limitations, and we do not restrict our performance management process solely to this metric. A limitation of the adjusted net income measure is that it provides a view of our operations without including all events during a period, such as the effects of an acquisition or amortization of purchased intangibles, and does not provide a comparable view of our performance to other companies. We also use other specifically tailored tools designed to achieve the highest levels of performance.
Purchase accounting adjustments
Adjusted net income is calculated prior to considering certain significant purchase accounting impacts that result from business combinations and net asset acquisitions. These impacts, primarily associated with the Pharmacia Animal Health business (acquired in 2003), FDAH (acquired in 2009) and KAH (acquired in 2011), include amortization related to the increase in fair value of the acquired finite-lived intangible assets and depreciation related to the increase/decrease to fair value of the acquired fixed assets. Therefore, the adjusted net income measure includes the revenue earned upon the sale of the acquired products without considering the aforementioned significant charges.
While certain purchase accounting adjustments can occur through 20 or more years, this presentation provides an alternative view of our performance that is used by management to internally assess business performance. We believe the elimination of amortization attributable to acquired intangible assets provides management and investors an alternative view of our business results by providing a degree of parity to internally developed intangible assets for which R&D costs previously have been expensed.
51
|
A completely accurate comparison of internally developed intangible assets and acquired intangible assets cannot be achieved through adjusted net income. These components of adjusted net income are derived solely from the impact of the items listed above. We have not factored in the impact of any other differences in experience that might have occurred if we had discovered and developed those intangible assets on our own, and this approach does not intend to be representative of the results that would have occurred in those circumstances. For example, our R&D costs in total, and in the periods presented, may have been different; our speed to commercialization and resulting revenue, if any, may have been different; or our costs to manufacture may have been different. In addition, our marketing efforts may have been received differently by our customers. As such, in total, there can be no assurance that our adjusted net income amounts would have been the same as presented had we discovered and developed the acquired intangible assets.
Acquisition-related costs
Adjusted net income is calculated prior to considering transaction, integration, restructuring and additional depreciation costs associated with significant business combinations or net-asset acquisitions because these costs are unique to each transaction and represent costs that were incurred to restructure and integrate certain businesses as a result of the acquisition decision. We have made no adjustments for the resulting synergies.
We believe that viewing income prior to considering these charges provides investors with a useful additional perspective because the significant costs incurred in a business combination result primarily from the need to eliminate duplicate assets, activities or employees––a natural result of acquiring a fully integrated set of activities. For this reason, we believe that the costs incurred to convert disparate systems, to close duplicative facilities or to eliminate duplicate positions (for example, in the context of a business combination) can be viewed differently from those costs incurred in the ordinary course of business.
The integration and restructuring costs associated with a business combination may occur over several years, with the more significant impacts ending within three years of the transaction. Because of the need for certain external approvals for some actions, the span of time needed to achieve certain restructuring and integration activities can be lengthy. For example, due to the regulated nature of the animal health medicines and vaccines business, the closure of excess facilities can take several years, as all manufacturing changes are subject to extensive validation and testing and must be approved by the FDA and/or other regulatory authorities.
Certain significant items
Adjusted net income is calculated prior to considering certain significant items. Certain significant items represent substantive, unusual items that are evaluated on an individual basis. Such evaluation considers both the quantitative and the qualitative aspect of their unusual nature. Unusual, in this context, may represent items that are not part of our ongoing business; items that, either as a result of their nature or size, we would not expect to occur as part of our normal business on a regular basis; items that would be nonrecurring; or items that relate to products that we no longer sell. While not all-inclusive, examples of items that could be included as certain significant items would be costs related to becoming an independent public company, a major non-acquisition-related restructuring charge and associated implementation costs for a program that is specific in nature with a defined term, such as those related to our non-acquisition-related cost-reduction and productivity initiatives; amounts related to disposals of products or facilities that do not qualify as discontinued operations as defined by U.S. GAAP; certain intangible asset impairments; adjustments related to the resolution of certain tax positions; the impact of adopting certain significant, event-driven tax legislation; or charges related to legal matters. See Notes to Consolidated and Combined Financial Statements—
Note 17. Commitments and Contingencies
. Our normal, ongoing defense costs or settlements of and accruals on legal matters made in the normal course of our business would not be considered certain significant items.
Reconciliation
A reconciliation of net income attributable to Zoetis, as reported under U.S. GAAP, to adjusted net income follows:
|
Year Ended December 31,
|
% Change
|
|||||||||||||||||
|
(MILLIONS OF DOLLARS)
|
2014
|
2013
|
2012
|
14/13
|
|
13/12
|
|
|||||||||||
|
GAAP Reported net income attributable to Zoetis
|
$
|
583
|
|
$
|
504
|
|
$
|
436
|
|
16
|
|
16
|
|
|||||
|
Purchase accounting adjustments—net of tax
|
34
|
|
32
|
|
35
|
|
6
|
|
(9
|
)
|
||||||||
|
Acquisition-related costs—net of tax
|
5
|
|
14
|
|
34
|
|
(64
|
)
|
(59
|
)
|
||||||||
|
Certain significant items—net of tax
|
168
|
|
159
|
|
34
|
|
6
|
|
*
|
|
||||||||
|
Non-GAAP adjusted net income
(a)(b)
|
$
|
790
|
|
$
|
709
|
|
$
|
539
|
|
11
|
|
32
|
|
|||||
* Calculation not meaningful.
Certain amounts and percentages may reflect rounding adjustments.
|
(a)
|
The effective tax rate on adjusted pretax income is
26.8%
,
29.2%
and
40.8%
for full year 2014, 2013 and 2012, respectively. The lower effective tax rate in 2014 compared to 2013 is primarily due to changes in the jurisdictional mix of earnings, which includes the impact of the location of earnings as well as repatriation costs, changes in valuation allowances and resolution of other tax items. In addition, we recognized an $8 million discrete tax expense during the first quarter of 2014 related to an intercompany inventory adjustment. The
lower
effective tax rate in 2013 compared to 2012 is primarily due to incentive tax rulings in Belgium, effective December 1, 2012, and Singapore, effective October 29, 2012, as well as changes in the jurisdictional mix of earnings, which includes the impact of the location of earnings as well as repatriation costs. In addition, we recognized a $2 million discrete income tax benefit during the first quarter of 2013 related to the 2012 U.S. Research and Development Tax Credit which was retroactively extended on January 3, 2013.
|
|
(b)
|
The impact of the incentive tax rulings in Belgium, effective December 1, 2012 through 2017, and Singapore, effective October 29, 2012 through 2016, continue to be a component of the 2014 effective tax in rate, as well as the 2014 U.S. Research and Development Tax Credit which was extended on December 19, 2014.
|
52
|
The following table provides a reconciliation of reported diluted earnings per share (EPS), as reported under U.S. GAAP, and non-GAAP adjusted diluted EPS:
|
Year Ended December 31,
|
% Change
|
|||||||||||||||||
|
2014
|
2013
|
2012
|
14/13
|
|
13/12
|
|
||||||||||||
|
Earnings per share—diluted
(a)(b)
:
|
||||||||||||||||||
|
GAAP Reported net income attributable to Zoetis
|
$
|
1.16
|
|
$
|
1.01
|
|
$
|
0.87
|
|
15
|
|
16
|
|
|||||
|
Purchase accounting adjustments—net of tax
|
0.07
|
|
0.06
|
|
0.07
|
|
17
|
|
(14
|
)
|
||||||||
|
Acquisition-related costs—net of tax
|
0.01
|
|
0.03
|
|
0.07
|
|
(67
|
)
|
(57
|
)
|
||||||||
|
Certain significant items—net of tax
|
0.33
|
|
0.32
|
|
0.07
|
|
3
|
|
*
|
|
||||||||
|
Non-GAAP adjusted net income
|
$
|
1.57
|
|
$
|
1.42
|
|
$
|
1.08
|
|
11
|
|
31
|
|
|||||
* Calculation not meaningful.
Certain amounts and percentages may reflect rounding adjustments.
|
(a)
|
The weighted-average shares outstanding for diluted earnings per share for the period prior to the IPO was calculated using an aggregate of 500 million shares of common stock outstanding, which was the number of Zoetis Inc. shares outstanding immediately prior to the IPO. For the years ended
December 31, 2014
and 2013, diluted earnings per share was computed using the weighted-average common shares outstanding during the period plus the common stock equivalents related to stock options, RSUs and DSUs.
|
|
(b)
|
EPS amounts may not add due to rounding.
|
Adjusted net income includes the following charges for each of the periods presented:
|
Year Ended December 31,
|
||||||||||||
|
(MILLIONS OF DOLLARS)
|
2014
|
|
2013
|
|
2012
|
|
||||||
|
Interest expense, net of capitalized interest
|
$
|
117
|
|
$
|
113
|
|
$
|
31
|
|
|||
|
Interest income
|
6
|
|
3
|
|
1
|
|
||||||
|
Taxes
|
290
|
|
292
|
|
372
|
|
||||||
|
Depreciation
|
131
|
|
138
|
|
119
|
|
||||||
|
Amortization
|
17
|
|
17
|
|
18
|
|
||||||
53
|
Adjusted net income, as shown above, excludes the following items:
|
Year Ended December 31,
|
||||||||||||
|
(MILLIONS OF DOLLARS)
|
2014
|
|
2013
|
|
2012
|
|
||||||
|
Purchase accounting adjustments:
|
||||||||||||
|
Amortization and depreciation
(a)
|
$
|
47
|
|
$
|
46
|
|
$
|
48
|
|
|||
|
Cost of sales
(b)
|
4
|
|
2
|
|
4
|
|
||||||
|
Total purchase accounting adjustments—pretax
|
51
|
|
48
|
|
52
|
|
||||||
|
Income taxes
(c)
|
17
|
|
16
|
|
17
|
|
||||||
|
Total purchase accounting adjustments—net of tax
|
34
|
|
32
|
|
35
|
|
||||||
|
Acquisition-related costs
(d)
:
|
||||||||||||
|
Integration costs
(e)
|
8
|
|
22
|
|
47
|
|
||||||
|
Restructuring charges
(e)
|
—
|
|
—
|
|
(4
|
)
|
||||||
|
Additional depreciation—asset restructuring
(f)
|
—
|
|
—
|
|
10
|
|
||||||
|
Total acquisition-related costs—pretax
|
8
|
|
22
|
|
53
|
|
||||||
|
Income taxes
(c)
|
3
|
|
8
|
|
19
|
|
||||||
|
Total acquisition-related costs—net of tax
|
5
|
|
14
|
|
34
|
|
||||||
|
Certain significant items
(g)
:
|
||||||||||||
|
Restructuring charges (benefits)
(h)
|
17
|
|
(20
|
)
|
92
|
|
||||||
|
Implementation costs and additional depreciation--asset restructuring
(f)
|
1
|
|
8
|
|
23
|
|
||||||
|
Certain asset impairment charges
(i)
|
6
|
|
20
|
|
—
|
|
||||||
|
Net gains on sale of assets
(j)
|
(5
|
)
|
(6
|
)
|
—
|
|
||||||
|
Stand-up costs
(k)
|
168
|
|
206
|
|
—
|
|
||||||
|
Inventory and intercompany account write-offs
(l)
|
—
|
|
24
|
|
—
|
|
||||||
|
Other
(m)
|
18
|
|
8
|
|
(19
|
)
|
||||||
|
Total certain significant items—pretax
|
205
|
|
240
|
|
96
|
|
||||||
|
Income taxes
(c)
|
37
|
|
81
|
|
62
|
|
||||||
|
Total certain significant items—net of tax
|
168
|
|
159
|
|
34
|
|
||||||
|
Total purchase accounting adjustments, acquisition-related costs, and certain significant items—net of tax
|
$
|
207
|
|
$
|
205
|
|
$
|
103
|
|
|||
Certain amounts may reflect rounding adjustments.
|
(a)
|
Amortization and depreciation expense related to purchase accounting adjustments with respect to identifiable intangible assets and property, plant and equipment were distributed as follows in 2014, 2013 and 2012, respectively: $45 million, $46 million and $49 million included in
Amortization of intangible assets;
$0 million, $1 million income and $1 million income included in
Selling, general and administrative expenses;
and
$2 million, $1 million and $0 million included in
Research and development expenses.
|
|
(b)
|
Depreciation expense included in
Cost of sales.
|
|
(c)
|
Included in
Provision for taxes on income
.
|
|
(d)
|
Acquisition-related costs were distributed as follows in 2014, 2013 and 2012, respectively: $0 million, $0 million and $9 million included in
Cost of sales
; $0 million, $0 million and $1 million included in
Selling, general and administrative expenses;
and
$8 million, $22 million and $43 million included in
Restructuring charges and certain acquisition-related costs.
|
|
(e)
|
Included in
Restructuring charges and certain acquisition-related costs.
See Notes to Consolidated and Combined Financial Statements
—Note 6. Restructuring Charges and Other Costs Associated with Acquisitions and Cost-Reduction/Productivity Initiatives
for more information.
|
|
(f)
|
Amounts primarily relate to our cost-reduction/productivity initiatives and other asset restructuring. See Notes to Consolidated and Combined Financial Statements—
Note 6.
Restructuring Charges and Other Costs Associated with Acquisitions and Cost-Reduction/Productivity Initiatives
.
|
|
(g)
|
Certain significant items were distributed as follows in 2014, 2013 and 2012, respectively: $33 million, $42 million and $1 million included in
Cost of sales
; $136 million, $188 million and $18 million included in
Selling, general and administrative expenses
; $1 million, $7 million and $10 million included in
Research and development expenses
; $17 million, $4 million and $92 million, included in
Restructuring charges and certain acquisition-related costs
; and $18 million, $1 million income and $25 million income included in
Other (income)/deductions—net.
|
|
(h)
|
Represents restructuring charges incurred for our cost-reduction/productivity initiatives. The restructuring charges in 2014 primarily represent employee severance costs in Europe and our global manufacturing operations. The restructuring benefit in the year ended December 31, 2013, is primarily due to a $27 million decrease in employee termination expenses related to the reversal of a previously established termination reserve related to our operations in Europe. Included in
Restructuring charges and certain acquisition-related costs
. See Notes to Consolidated and Combined Financial Statements—
Note 6.
Restructuring Charges and Other Costs Associated with Acquisitions and Cost-Reduction/Productivity Initiatives
for more information.
|
|
(i)
|
In 2014, amounts primarily represent an impairment charge related to an IPR&D project acquired with the FDAH acquisition in 2009 and were included in
Other (income)/deductions—net
.
In 2013, amounts primarily relate to restructuring initiatives in 2013 and were included in
Restructuring charges and certain acquisition-related costs
. See Notes to Consolidated and Combined Financial Statements—
Note 6.
Restructuring Charges and Other Costs Associated with Acquisitions and Cost-Reduction/Productivity Initiatives
and
Note 7. Other (Income)/Deductions—Net
for more information
.
|
|
(j)
|
In 2014, primarily represents the Zoetis portion of a net gain on the sale of land by our Taiwan joint venture and the net gain on the government-mandated sale of certain product rights in Argentina that were acquired with the FDAH acquisition in 2009. In 2013, represents the net gain on the government-mandated sale of certain product rights in Brazil in 2013 that were acquired with the FDAH acquisition in 2009. Included in
Other (income)/deductions—net
. See Notes to Consolidated and Combined Financial Statements—
Note 7. Other (Income)/Deductions—Net
for more information.
|
54
|
|
(k)
|
Certain non-recurring costs related to becoming an independent public company, such as new branding (including changes to the manufacturing process for required new packaging), the creation of standalone systems and infrastructure, site separation, accelerated vesting and associated cash payment related to certain Pfizer equity awards, and certain legal registration and patent assignment costs which were distributed as follows in 2014 and 2013, respectively: $32 million and $21 million included in
Cost of sales
; $131 million and $177 million included in
Selling, general and administrative expenses
, $0 million and $7 million included in
Research and development expenses,
and $5 million and $1 million included in
Other (income)/deductions—net.
|
|
(l)
|
Amounts relate to write-offs of inventory and intercompany accounts that were transferred to us as part of the Separation from Pfizer and were distributed as follows: $19 million included in
Cost of sales
and $5 million included in
Selling, general and administrative expenses
. Because these expenses relate primarily to the periods prior to our initial public offering, we do not consider them to be reflective of our current operations and we have therefore, excluded them from our Adjusted earnings non-GAAP measure. Although fully written off in the current period, all of the adjustments relate back several years.
|
|
(m)
|
For 2014, primarily includes a charge associated with a commercial settlement in Mexico ($13 million), partially offset by the insurance recovery ($1 million income), charges due to unusual investor-related activities ($5 million), a pension plan settlement charge related to the divestiture of a manufacturing plant ($4 million), and an insurance recovery of other litigation related charge ($2 million income). For 2013, primarily relates to litigation-related charges ($5 million) and charges related to transitional manufacturing purchase agreements associated with divestitures ($1 million). For 2012, primarily relates to income related to a favorable legal settlement for an intellectual property matter ($14 million) and income due to a change in estimate related to transitional manufacturing purchase agreements associated with divestitures ($4 million). See Notes to Consolidated and Combined Financial Statements—
Note 7. Other (Income)/Deductions—Net
for more information
.
|
Our financial guidance for 2015
Our 2015 financial guidance is summarized below:
|
Selected Line Items
|
||
|
Revenue
|
$4,800 to $4,900 million
|
|
|
Operational growth
(a)
|
6.5% to 8.5%
|
|
|
Adjusted cost of sales as a percentage of revenue
(b)
|
35.5% to 36.0%
|
|
|
Adjusted SG&A expenses
(b)
|
$1,420 to $1,470 million
|
|
|
Adjusted R&D expenses
(b)
|
$385 to $405 million
|
|
|
Adjusted interest expense and other (income)/deductions
(b)
|
Approximately $110 million
|
|
|
Effective tax rate on adjusted income
(b)
|
Approximately 29%
|
|
|
Adjusted diluted EPS
(b)
|
$1.61 to $1.68
|
|
|
Adjusted net income
(b)
|
$810 to $845 million
|
|
|
Operational growth
(a)
|
11% to 16%
|
|
|
Certain significant items
(c)
and acquisition-related costs
|
$140 to $160 million
|
|
|
Reported diluted EPS
|
$1.32 to $1.39
|
|
|
(a)
|
Growth excluding the impact of foreign exchange.
|
|
(b)
|
For an understanding of adjusted net income and its components, see the
Adjusted net income
section of this MD&A.
|
|
(c)
|
Includes certain nonrecurring costs related to becoming an independent public company, such as new branding (including changes to the manufacturing process for required new packaging), the creation of standalone systems and infrastructure, site separation and certain legal registration and patent assignment costs.
|
Full year 2015 guidance reflects current exchange rates and other factors.
A reconciliation of 2015 adjusted net income and adjusted diluted EPS guidance to 2015 reported net income attributable to Zoetis and reported diluted EPS attributable to Zoetis common shareholders guidance follows:
|
Full Year 2015 Guidance
|
||||
|
(MILLION OF DOLLARS, EXCEPT PER SHARE AMOUNTS)
|
Net Income
|
Diluted EPS
|
||
|
Adjusted net income/diluted EPS
(a)
guidance
|
~$810 - $845
|
~$1.61 - $1.68
|
||
|
Purchase accounting adjustments
|
~(35)
|
~(0.07)
|
||
|
Certain significant items
(b)
and acquisition-related costs
|
~(105 - 120)
|
~(0.21 - 0.24)
|
||
|
Reported net income attributable to Zoetis Inc./diluted EPS guidance
|
~$665 - $700
|
~$1.32 - $1.39
|
||
|
(a)
|
For an understanding of adjusted net income, see the
Adjusted net income
section of this MD&A.
|
|
(b)
|
Includes certain nonrecurring costs related to becoming an independent public company, such as new branding (including changes to the manufacturing process for required new packaging), the creation of standalone systems and infrastructure, site separation and certain legal registration and patent assignment costs.
|
Our 2015 financial guidance is subject to a number of factors and uncertainties—as described in the
Forward-looking information and factors that may affect future results
,
Our operating environment
and
Our growth strategies
of this MD&A and in
Part I
,
Item 1A
. Risk Factors
.
Analysis of the consolidated and combined statements of comprehensive income
Substantially all changes in other comprehensive income for the periods presented are related to foreign currency translation adjustments. These changes result from the strengthening or weakening of the U.S. dollar as compared to the currencies in the countries in which we do business. The gains and losses associated with these changes are deferred on the balance sheet in
Accumulated other comprehensive loss
until realized.
55
|
December 31, 2014
vs.
December 31, 2013
For a discussion about the changes in
Cash and cash equivalents
,
Short-term borrowing, including current portion of allocated long term debt
, and
Long-term debt
, see "Analysis of financial condition, liquidity and capital resources" below.
Accounts receivable, less allowance for doubtful accounts
decreased primarily as a result of the timing of customer collections, the settlement of receivables from Pfizer, and the impact of foreign exchange. These decreases were partially offset by higher net sales. See Notes to Consolidated and Combined Financial Statements—
Note 19. Transactions and Agreements with Pfizer.
Inventories
decreased primarily due to the impact of foreign exchange. The decrease was partially offset by increases related to certain production transfers and to support increased commercial demand of selected products. See Notes to Consolidated and Combined Financial Statements—
Note 10. Inventories.
The net changes in
Current deferred tax assets
,
Noncurrent deferred tax assets
,
Noncurrent deferred tax liabilities
and
Other taxes payable
primarily reflect adjustments to the accrual for the income tax provision for the year ended December 31, 2014. See Notes to Consolidated and Combined Financial Statements—
Note 8. Tax Matters.
Property, plant and equipment, less accumulated depreciation
increased primarily as a result of capital spending in excess of depreciation expense.
Identifiable intangible assets, less accumulated amortization
decreased primarily as a result of amortization expense, the impact of foreign exchange and an IPR&D impairment charge, partially offset by the acquisition of certain product registration and application rights from Pfizer. See Notes to Consolidated and Combined Financial Statements—
Note 12. Goodwill and Other Intangible Assets
and
Note 19. Transactions and Agreements with Pfizer.
Accounts payable
decreased as a result of the timing of payments, the settlement of payables with Pfizer, and the impact of foreign exchange.
Dividends payable
increased due to the increase in the dividend rate, which was declared on December 17, 2014.
Accrued Expenses
decreased primarily due to lower accrued expenses associated with the Separation from Pfizer and lower accrued milestone payments. See Notes to Consolidated and Combined Financial Statements—
Note 19. Transactions and Agreements with Pfizer.
Accrued Compensation and related items
increased primarily due to increases in sales-related bonus accruals
.
Other current liabilities
decreased reflecting a reduction in deferred revenue and legal reserves.
Long-term debt
reflects the senior notes offering. See Notes to Consolidated and Combined Financial Statements—
Note 2C. The Separation, Adjustments Associated with the Separation, Senior Notes Offering, Initial Public Offering and Exchange Offer: Senior Notes Offering
and
Note 9A. Financial Instruments: Debt.
Other noncurrent liabilities
increased primarily as a result of an increase in net pension obligations and higher deferred income. See Notes to Consolidated and Combined Financial Statements—
Note 13A. Benefit Plans—International Pension Plans.
For an analysis of the changes in
Total Equity
, see the Consolidated and Combined Statements of Equity.
|
Year Ended December 31,
|
% Change
|
||||||||||||||||
|
(MILLIONS OF DOLLARS)
|
2014
|
|
2013
|
|
2012
|
|
14/13
|
|
13/12
|
||||||||
|
Cash provided by/(used in):
|
|||||||||||||||||
|
Operating activities
|
$
|
626
|
|
$
|
681
|
|
$
|
454
|
|
(8
|
)
|
50
|
|||||
|
Investing activities
|
(187
|
)
|
(179
|
)
|
(135
|
)
|
4
|
|
33
|
||||||||
|
Financing activities
|
(154
|
)
|
(200
|
)
|
(78
|
)
|
(23
|
)
|
*
|
||||||||
|
Effect of exchange-rate changes on cash and cash equivalents
|
(13
|
)
|
(9
|
)
|
(3
|
)
|
44
|
|
*
|
||||||||
|
Net increase in cash and cash equivalents
|
$
|
272
|
|
$
|
293
|
|
$
|
238
|
|
(7
|
)
|
23
|
|||||
* Calculation not meaningful.
Operating activities
2014
vs.
2013
Net cash
provided by
operating activities was $
626 million
in
2014
compared with $
681 million
in
2013
. The decrease in operating cash flows was primarily attributable to the timing of receipts and payments in the ordinary course of business, the settlement of payables with Pfizer, and a decrease in other liabilities. This decrease was partially offset by higher income before allocation to noncontrolling interests, as adjusted for depreciation and amortization.
56
|
2013
vs.
2012
Net cash
provided by
operating activities was $
681 million
in
2013
compared with $
454 million
in
2012
, and was primarily attributable to income before allocation to non-controlling interests, as adjusted for depreciation and amortization. The net change in operating assets and liabilities, net of acquisitions and divestitures and transfers with Pfizer, was primarily driven by an increase in other liabilities, reflecting higher accrued interest on long-term debt and higher accrued compensation, partially offset by higher inventory levels. In addition, net cash provided by operating activities was impacted by the timing and of receipts and payments in the ordinary course of business.
Investing activities
2014
vs.
2013
Net cash
used in
investing activities was $
187 million
in
2014
compared with $
179 million
in
2013
. The increase in investing cash flows was primarily due to a 2014 milestone payment related to previously acquired intangible assets.
2013
vs.
2012
Net cash
used in
investing activities was $
179 million
in
2013
compared with $
135 million
in
2012
, primarily due to increased capital investment in property, plant and equipment.
Financing activities
2014
vs.
2013
Net cash
used in
financing activities was $
154 million
in
2014
compared with $
200 million
in
2013
. The net cash used in financing activities for 2014 was due primarily to the payment of dividends. The net cash used in financing activities for 2013 was primarily attributable to the net transfers to Pfizer as a result of the Separation.
2013
vs.
2012
Net cash
used in
financing activities was $
200 million
in
2013
compared with $
78 million
in
2012
. The increase in net cash used in financing activities was primarily attributable to the net transfers to Pfizer as a result of the IPO and an increase in cash dividends paid, partially offset by, net proceeds from long-term and short-term borrowings.
Analysis of financial condition, liquidity and capital resources
While we believe our cash and cash equivalents on hand, our operating cash flows and our existing financing arrangements will be sufficient to support our future cash needs, this may be subject to the environment in which we operate. Risks to our meeting future funding requirements include global economic conditions described in the following paragraph.
As global financial markets continue their slow and sometimes uneven recovery from the 2008/2009 recession, additional macroeconomic, business and financial volatility may persist. As markets change, we will continue to monitor our liquidity position, but there can be no assurance that a challenging economic environment or an economic downturn will not impact our liquidity or our ability to obtain future financing.
Selected measures of liquidity and capital resources
Certain relevant measures of our liquidity and capital resources follow:
|
December 31,
|
|
December 31,
|
|
||||
|
(MILLIONS OF DOLLARS)
|
2014
|
|
2013
|
|
|||
|
Cash and cash equivalents
(a)
|
$
|
882
|
|
$
|
610
|
|
|
|
Accounts receivable, net
(b)
|
980
|
|
1,138
|
|
|||
|
Short-term borrowings
|
7
|
|
15
|
|
|||
|
Long-term debt
(c)
|
3,643
|
|
3,642
|
|
|||
|
Working capital
|
2,379
|
|
1,942
|
|
|||
|
Ratio of current assets to current liabilities
|
3.19:1
|
|
2.37:1
|
|
|||
|
(a)
|
Prior to our IPO, we participated in Pfizer's centralized cash management system, and generally all of our excess cash was transferred to Pfizer on a daily basis. Cash disbursements for operations and/or investing activities were funded, as needed, by Pfizer.
|
|
(b)
|
Accounts receivable are usually collected over a period of 60 to 90 days
.
For the year ended
December 31, 2014
, compared to the year ended December 31, 2013, the number of days that accounts receivables are outstanding remained approximately the same. We regularly monitor our accounts receivable for collectability, particularly in markets where economic conditions remain uncertain. We believe that our allowance for doubtful accounts is appropriate. Our assessment is based on such factors as past due aging, historical and expected collection patterns, the financial condition of our customers, the robust nature of our credit and collection practices and the economic environment.
|
|
(c)
|
Primarily consists of
$3.65 billion
aggregate principal amount of our senior notes, with an original issue discount of
$10 million
. The senior notes are comprised of
$400 million
aggregate principal amount of our
1.150%
senior notes due 2016,
$750 million
aggregate principal amount of our
1.875%
senior notes due 2018,
$1.35 billion
aggregate principal amount of our
3.250%
Senior Notes due 2023 and
$1.15 billion
aggregate principal amount of our
4.700%
senior notes due 2043.
|
For additional information about the sources and uses of our funds, see the "Analysis of the consolidated balance sheets" and "Analysis of the consolidated and combined statements of cash flows" sections of this MD&A.
57
|
Credit facility and other lines of credit
In December 2012, we entered into a revolving credit agreement with a syndicate of banks providing for a five-year
$1.0 billion
senior unsecured revolving credit facility, which became effective in February 2013 upon the completion of the IPO and which expires in December 2017. Subject to certain conditions, we have the right to increase the credit facility to up to
$1.5 billion
. The credit facility contains a financial covenant requiring us to not exceed a maximum total leverage ratio (the ratio of consolidated net debt as of the end of the period to consolidated Earnings Before Interest, Income Taxes, Depreciation and Amortization (EBITDA) for such period) of
4.35:1
for fiscal year 2013,
3.95:1
for fiscal year 2014,
3.50:1
for fiscal year 2015 and
3.00:1
thereafter. The credit facility also contains a financial covenant requiring that we maintain a minimum interest coverage ratio (the ratio of EBITDA at the end of the period to interest expense for such period) of
3.50:1
. In addition, the credit facility contains other customary covenants. We were in compliance with all financial covenants as of
December 31, 2014
. There were
no
borrowings outstanding as of both
December 31, 2014
and 2013.
We have additional lines of credit and other credit arrangements with a group of banks and other financial intermediaries for general corporate purposes. We maintain cash and cash equivalent balances in excess of our outstanding short-term borrowings. As of
December 31, 2014
, we had access to
$74 million
of lines of credit which expire at various times through 2016. As of
December 31, 2014
, we had
$7 million
of short-term borrowings outstanding and $
3 million
of long-term borrowings outstanding related to these facilities. As of
December 31, 2013
, we had
$15 million
of short-term borrowings outstanding and $
2 million
of long-term borrowings outstanding related to these facilities.
Domestic and international short-term funds
Many of our operations are conducted outside the United States. The amount of funds held in the U.S. will fluctuate due to the timing of receipts and payments in the ordinary course of business and due to other reasons, such as business development activities. As part of our ongoing liquidity assessments, we regularly monitor the mix of U.S. and international cash flows (both inflows and outflows). Repatriation of overseas funds can result in additional United States, federal, state and local income tax payments. We record U.S. deferred tax liabilities for certain unremitted earnings, but when amounts earned overseas are expected to be indefinitely reinvested outside the United States, no accrual for U.S. taxes is provided.
Global economic conditions
The challenging economic environment has not had, nor do we anticipate that it will have, a significant impact on our liquidity. Due to our operating cash flows, financial assets, access to capital markets and available lines of credit and revolving credit agreements, we continue to believe that we have the ability to meet our liquidity needs for the foreseeable future. As markets change, we continue to monitor our liquidity position. There can be no assurance that a challenging economic environment or a further economic downturn would not impact our ability to obtain financing in the future.
Contractual obligations
Payments due under contractual obligations as of December 31, 2014, are set forth below:
|
2016-
|
|
2018-
|
|
There-
|
|
|||||||||||||||
|
(MILLIONS OF DOLLARS)
|
Total
|
|
2015
|
|
2017
|
|
2019
|
|
after
|
|
||||||||||
|
Long-term debt, including current portion and interest obligations
(a)
|
$
|
5,574
|
|
$
|
117
|
|
$
|
627
|
|
$
|
947
|
|
$
|
3,883
|
|
|||||
|
Other long-term liabilities reflected on our consolidated and combined
|
||||||||||||||||||||
|
balance sheets under U.S. GAAP
(b)
|
47
|
|
4
|
|
8
|
|
9
|
|
26
|
|
||||||||||
|
Operating lease commitments
|
104
|
|
27
|
|
40
|
|
20
|
|
17
|
|
||||||||||
|
Purchase obligations and other
(c)
|
81
|
|
34
|
|
25
|
|
10
|
|
12
|
|
||||||||||
|
Benefit plans - continuing service credit obligations
(d)
|
30
|
|
4
|
|
8
|
|
8
|
|
10
|
|
||||||||||
|
Uncertain tax positions
(e)
|
—
|
|
—
|
|
—
|
|
—
|
|
—
|
|
||||||||||
Certain amounts may reflect rounding adjustments.
|
(a)
|
Long-term debt consists of senior notes and other notes. Our calculations of expected interest payments incorporate only current period assumptions for interest rates, foreign currency translation rates and Zoetis hedging strategies. See Notes to Consolidated and Combined Financial Statements—
|
|
(b)
|
Includes expected payments to Pfizer related to the transfer of certain product registration and application rights associated with our operations in Indonesia, expected payments related to our unfunded U.S. supplemental (non-qualified) savings plans, deferred compensation and expected payments relating to our future benefit payments net of plan assets (included in the determination of the projected benefit obligation) for pension plans that are dedicated to Zoetis employees and those transferred to us from Pfizer in 2014 and 2013. Excludes the pension obligation associated with a defined benefit plan in the Philippines that Pfizer will transfer to us in 2015 as described in the applicable local separation agreement or employee matters agreement. See Notes to Consolidated and Combined Financial Statements—
Note 13. Benefit Plans
and
Note 19B. Transactions and Agreements with Pfizer—Agreements with Pfizer—Employee matters agreement.
Excludes approximately $160 million of noncurrent liabilities related to legal and environmental accruals, employee termination and exit costs, deferred income and other accruals, most of which do not represent contractual obligations. See Notes to Consolidated and Combined Financial Statements—
Note 6
.
Restructuring Charges and Other Costs Associated with Acquisitions and Cost-Reduction/Productivity Initiatives
and
Note 17
.
Commitments and Contingencies
.
|
|
(c)
|
Includes agreements to purchase goods and services that are enforceable and legally binding and includes amounts relating to advertising, information technology services and employee benefit administration services.
|
|
(d)
|
Includes the cost of service credit continuation for certain Zoetis employees in the Pfizer U.S. qualified defined benefit pension and U.S. retiree medical plans, in accordance with the employee matters agreement. See Notes to Consolidated and Combined Financial Statements—
Note 13. Benefit Plans.
|
|
(e)
|
Except for amounts reflected in
Income taxes payable
, we are unable to predict the timing of tax settlements, as tax audits can involve complex issues and the resolution of those issues may span multiple years, particularly if subject to negotiation or litigation.
|
The table above excludes amounts for potential milestone payments unless the payments are deemed reasonably likely to occur. Payments under these agreements generally become due and payable only upon the achievement of certain development, regulatory and/or commercialization milestones, which may span several years and/or which may never occur. Our contractual obligations in the table above are not necessarily indicative of our contractual obligations in the future.
58
|
Debt
On January 28, 2013, we issued
$3.65 billion
aggregate principal amount of our senior notes in a private placement, with an original issue discount of
$10 million
. The senior notes are comprised of
$400 million
aggregate principal amount of our
1.150%
senior notes due 2016,
$750 million
aggregate principal amount of our
1.875%
senior notes due 2018,
$1.35 billion
aggregate principal amount of our
3.250%
senior notes due 2023 and
$1.15 billion
aggregate principal amount of our
4.700%
senior notes due 2043.
We sold
$2.65 billion
aggregate principal amount of our senior notes through the initial purchasers in the senior notes offering and Pfizer transferred
$1.0 billion
aggregate principal amount of our senior notes to certain of the initial purchasers, who sold such senior notes through the initial purchasers in the senior notes offering. We paid an amount of cash equal to substantially all of the net proceeds that we received in the senior notes offering to Pfizer prior to the completion of the IPO.
The senior notes are governed by an indenture and supplemental indenture (collectively, the indenture) between us and Deutsche Bank Trust Company Americas, as trustee. The indenture contains certain covenants, including limitations on our and certain of our subsidiaries' ability to incur liens or engage in sale leaseback transactions. The indenture also contains restrictions on our ability to consolidate, merge or sell substantially all of our assets. In addition, the indenture contains other customary terms, including certain events of default, upon the occurrence of which the senior notes may be declared immediately due and payable.
Pursuant to the indenture, we are able to redeem the senior notes of any series, in whole or in part, at any time by paying a “make whole” premium, plus accrued and unpaid interest to, but excluding, the date of redemption. Pursuant to our tax matters agreement with Pfizer, we will not be permitted to redeem the 2023 notes pursuant to this optional redemption provision, except under limited circumstances. Upon the occurrence of a change of control of us and a downgrade of the senior notes below an investment grade rating by each of Moody's Investors Service, Inc. and Standard & Poor's Ratings Services, we are, in certain circumstances, required to make an offer to repurchase all of the outstanding senior notes at a price equal to
101%
of the aggregate principal amount of the senior notes together with accrued and unpaid interest to, but excluding, the date of repurchase.
In connection with the senior notes offering, we entered into a registration rights agreement (the Registration Rights Agreement) with the representatives of the initial purchasers of the senior notes. Pursuant to the terms of the Registration Rights Agreement, we were obligated, among other things, to use our commercially reasonable efforts to file a registration statement with the SEC enabling holders of the senior notes to exchange the privately placed notes for publicly registered notes with substantially the same terms. We filed the registration statement with the SEC on September 13, 2013, the SEC declared the registration statement effective on September 24, 2013, and the exchange offer was completed on October 31, 2013.
The components of our long-term debt follow:
|
Description
|
Principal Amount
|
Interest Rate
|
Terms
|
|
Lines of credit
|
$3 million
|
6.400%
|
Due 2016-2018
|
|
2016 Senior Note
|
$400 million
|
1.150%
|
Interest due semi annually, not subject to amortization, aggregate principal due on February 1, 2016
|
|
2018 Senior Note
|
$750 million
|
1.875%
|
Interest due semi annually, not subject to amortization, aggregate principal due on February 1, 2018
|
|
2023 Senior Note
|
$1,350 million
|
3.250%
|
Interest due semi annually, not subject to amortization, aggregate principal due on February 1, 2023
|
|
2043 Senior Note
|
$1,150 million
|
4.700%
|
Interest due semi annually, not subject to amortization, aggregate principal due on February 1, 2043
|
Credit Ratings
Two major corporate debt-rating organizations, Moody's and S&P, assign ratings to our short-term and long-term debt. A security rating is not a recommendation to buy, sell or hold securities and the rating is subject to revision or withdrawal at any time by the rating organization. Each rating should be evaluated independently of any other rating.
The following table provides the current ratings assigned by these rating agencies to our commercial paper and senior unsecured non-credit-enhanced long-term debt:
|
Commercial
|
||||||||
|
Paper
|
Long-term Debt
|
Date of
|
||||||
|
Name of Rating Agency
|
Rating
|
Rating
|
Outlook
|
Last Action
|
||||
|
Moody’s
|
P-2
|
Baa2
|
Stable
|
January 2013
|
||||
|
S&P
|
A-3
|
BBB-
|
Stable
|
January 2013
|
||||
Pension Obligations
As part of the Separation, Pfizer transferred to us the net pension obligations associated with certain international defined benefit plans of
$22 million
and
$21 million
in 2014 and 2013, respectively. We expect to contribute a total of approximately
$7 million
to these plans in 2015. Also as part of the Separation, in accordance with the applicable local employee matters agreement, a net liability has been recognized as of December 31, 2014, for the pension obligation less the fair value of plan assets associated with the Philippines pension plan that will be transferred to us in 2015 (approximately
$1 million
).
59
|
Effective December 31, 2012, our employees ceased to participate in the Pfizer U.S. qualified defined benefit and U.S. retiree medical plans, and liabilities associated with our employees under these plans were retained by Pfizer. As part of the Separation, Pfizer is continuing to credit certain employees' service with Zoetis generally through December 31, 2017 (or termination of employment from Zoetis, if earlier), for certain early retirement benefits with respect to Pfizer's U.S. defined benefit pension and retiree medical plans. In connection with the employee matters agreement, Zoetis will be responsible for payment of three-fifths of the total cost of the service credit continuation (approximately
$38 million
) for these plans. The amount of the service cost continuation payment to be paid by Zoetis to Pfizer was determined and fixed based on an actuarial assessment of the value of the grow-in benefits and will be paid in equal installments over a period of
10
years. As of December 31, 2014, the remaining payments due to Pfizer (approximately $30 million in the aggregate) were to be paid over the next 8 years.
In 2013, Pfizer transferred to us the U.S. supplemental savings plan liability of approximately
$14 million
, cash of
$9 million
and a deferred tax asset of
$5 million
associated with employees transferred to us as part of the Separation. As of December 31, 2014, the supplemental savings plan liability was approximately $21 million.
For additional information, see Notes to Consolidated and Combined Financial Statements—
Note 13. Benefit Plans.
Share Repurchase Program
In November 2014, the company's Board of Directors authorized a $500 million share repurchase program. Purchases of Zoetis shares may be made at the discretion of management, depending on market conditions and business needs. There were no share repurchases under this program during the year ended December 31, 2014.
Off-balance sheet arrangements
In the ordinary course of business and in connection with the sale of assets and businesses, we may indemnify our counterparties against certain liabilities that may arise in connection with a transaction or that are related to activities prior to a transaction. These indemnifications typically pertain to environmental, tax, employee and/or product-related matters, and patent-infringement claims. If the indemnified party were to make a successful claim pursuant to the terms of the indemnification, we would be required to reimburse the loss. These indemnifications are generally subject to threshold amounts, specified claim periods and other restrictions and limitations. Historically, we have not paid significant amounts under these provisions and, as of
December 31, 2014
and December 31, 2013, recorded amounts for the estimated fair value of these indemnifications are not significant.
New accounting standards
For discussion of our new accounting standards, see Notes to Consolidated and Combined Financial Statements—
Note 4. Significant Accounting Policies—New Accounting Standards
.
Recently Issued Accounting Standards, Not Adopted as of
December 31, 2014
In May 2014, the Financial Accounting Standards Board (FASB) issued an accounting standards update that outlines a new, single comprehensive model for companies to use in accounting for revenue arising from contracts with customers. This update supersedes most current revenue recognition guidance under U.S. GAAP. The core principle of the new guidance is that an entity should recognize revenue to depict the transfer of goods or services to customers in an amount that reflects the consideration to which the entity expects to be entitled in exchange for those goods or services. The guidance includes a five-step model for determining how, when and how much revenue should be recognized. This update also requires additional disclosure about the nature, amount, timing and uncertainty of revenue and cash flows arising from contracts with customers. The provisions of the new standard are effective beginning January 1, 2017, for annual and interim reporting periods. Early adoption is not permitted. The new standard allows for either full retrospective or modified retrospective transition upon adoption. We are currently assessing the transition method we will elect for adoption as well as the potential impact that adopting this new guidance will have on our consolidated financial statements.
Forward-looking statements and factors that may affect future results
This report contains “forward-looking” statements. We generally identify forward-looking statements by using words such as “anticipate,” “estimate,” “could,” “expect,” “intend,” “project,” “plan,” “predict,” “believe,” “seek,” “continue,” “outlook,” “may,” “might,” “will,” “should,” “can have,” “likely” or the negative version of these words or comparable words or by using future dates in connection with any discussion of future performance, actions or events.
In particular, forward-looking statements include statements relating to our indebtedness, our ability to make interest and principal payments on our indebtedness, our ability to satisfy the covenants contained in our indebtedness, the redemption of the notes, new systems infrastructure stand-up, our 2015 financial guidance, future actions, business plans or prospects, prospective products, product approvals or products under development, product supply disruptions, R&D costs, timing and likelihood of success, future operating or financial performance, future results of current and anticipated products and services, strategies, sales efforts, expenses, production efficiencies, production margins, interest rates, foreign exchange rates, growth in emerging markets, the outcome of contingencies, such as legal proceedings, plans
related to share repurchases and dividends
, our agreements with Pfizer, the expected timing and content of regulatory actions, government regulation and financial results. These statements are not guarantees of future performance, actions or events. Forward-looking statements are subject to risks and uncertainties, many of which are beyond our control, and are potentially inaccurate assumptions. Among the factors that could cause actual results to differ materially from past results and future plans and projected future results are the following:
|
•
|
emerging restrictions and bans on the use of antibacterials in food-producing animals;
|
|
•
|
perceived adverse effects on human health linked to the consumption of food derived from animals that utilize our products;
|
|
•
|
increased regulation or decreased governmental support relating to the raising, processing or consumption of food-producing animals;
|
|
•
|
fluctuations in foreign exchange rates and potential currency controls;
|
|
•
|
changes in tax laws, regulations, and challenges brought against our incentive tax rulings;
|
|
•
|
legal factors, including product liability claims, antitrust litigation and governmental investigations, including tax disputes, environmental concerns, commercial disputes and patent disputes with branded and generic competitors, any of which could preclude commercialization of products or negatively affect the profitability of existing products;
|
|
•
|
an outbreak of infectious disease carried by animals;
|
|
•
|
adverse weather conditions and the availability of natural resources;
|
|
•
|
adverse global economic conditions;
|
|
•
|
failure of our R&D, acquisition and licensing efforts to generate new products;
|
60
|
|
•
|
quarterly fluctuations in demand and costs; and
|
|
•
|
governmental laws and regulations affecting domestic and foreign operations, including without limitation, tax obligations and changes affecting the tax treatment by the United States of income earned outside the United States that may result from pending and possible future proposals.
|
However, there may also be other risks that we are unable to predict at this time. These risks or uncertainties may cause actual results to differ materially from those contemplated by a forward-looking statement. You should not put undue reliance on forward-looking statements. Forward-looking statements speak only as of the date on which they are made. We undertake no obligation to publicly update forward-looking statements, whether as a result of new information, future events or otherwise, except as required by law or by the rules and regulations of the SEC. You are advised, however, to consult any further disclosures we make on related subjects in our Form 10-Q and 8-K reports and our other filings with the SEC. You should understand that it is not possible to predict or identify all such factors. Consequently, you should not consider the above to be a complete discussion of all potential risks or uncertainties.
|
Item 7A.
|
Quantitative and Qualitative Disclosures About Market Risk.
|
A significant portion of our revenue and costs are exposed to changes in foreign exchange rates. In addition, our outstanding borrowings may be subject to risk from changes in interest rates and foreign exchange rates. The overall objective of our financial risk management program is to seek to minimize the impact of foreign exchange rate movements and interest rate movements on our earnings. We manage these financial exposures through operational means and by using certain financial instruments. These practices may change as economic conditions change.
Foreign exchange risk
Our primary net foreign currency translation exposures are the euro, Brazilian real and Australian dollar. We seek to manage our foreign exchange risk, in part, through operational means, including managing same-currency revenue in relation to same-currency costs and same-currency assets in relation to same-currency liabilities.
Foreign exchange risk is also managed through the use of foreign currency forward-exchange contracts. These contracts are used to offset the potential earnings effects from mostly intercompany short-term foreign currency assets and liabilities that arise from operations.
Our financial instruments at
December 31, 2014
, were analyzed to determine their sensitivity to foreign exchange rate changes. The fair values of these instruments were determined using Level 2 inputs. For additional details, see Notes to Consolidated and Combined Financial Statements—
Note 4. Significant Accounting Policies
—
Fair Value
. The sensitivity analysis of changes in the fair value of all foreign currency forward-exchange contracts at
December 31, 2014
, indicates that if the U.S. dollar were to appreciate against all other currencies by 10%, the fair value of these contracts would increase by $
25 million
, and if the U.S. dollar were to weaken against all other currencies by 10%, the fair value of these contracts would decrease by $
21 million
. For additional details, see Notes to Consolidated and Combined Financial Statements—
Note 9B. Financial Instruments
—
Derivative Financial Instruments
.
Interest rate risk
Our outstanding debt balances are fixed rate debt. While changes in interest rates will have no impact on the interest we pay on our fixed rate debt, interest on our revolving credit facility will be exposed to interest rate fluctuations. At
December 31, 2014
, we had no outstanding principal balance under our revolving credit facility. See Notes to Consolidated and Combined Financial Statements—
Note 9. Financial Instruments
.
61
|
INDEX TO FINANCIAL STATEMENTS
|
Page
|
|
|
Audited Consolidated and Combined Financial Statements of Zoetis Inc. and Subsidiaries:
|
|
|
Consolidated and Combined Statements of Income for the Years Ended December 31, 2014, 2013 and 2012
|
|
|
Consolidated and Combined Statements of Comprehensive Income for the Years Ended December 31, 2014, 2013 and 2012
|
|
|
Consolidated Balance Sheets as of December 31, 2014 and 2013
|
|
|
Consolidated and Combined Statements of Equity for the Years Ended December 31, 2014, 2013 and 2012
|
|
|
Consolidated and Combined Statements of Cash Flows for the Years Ended December 31, 2014, 2013 and 2012
|
|
|
Schedule II—Valuation and Qualifying Accounts
|
|
62
|
Report of Independent Registered Public Accounting Firm
The Board of Directors and Stockholders
Zoetis Inc.:
We have audited the accompanying consolidated balance sheets of Zoetis Inc. and subsidiaries as of December 31, 2014 and 2013, and the related consolidated statements of income, comprehensive income, equity and cash flows for each of the years in the two-year period ended December 31, 2014, and the combined statements of income, comprehensive income, equity, and cash flows of Zoetis (the animal health business unit of Pfizer Inc.) for the year ended December 31, 2012. In connection with our audits of the consolidated and combined financial statements, we also have audited financial statement schedule II - Valuation and Qualifying Accounts. These consolidated and combined financial statements and financial statement schedule are the responsibility of the Company’s management. Our responsibility is to express an opinion on these consolidated and combined financial statements and financial statement schedule based on our audits.
We conducted our audits in accordance with the standards of the Public Company Accounting Oversight Board (United States). Those standards require that we plan and perform the audit to obtain reasonable assurance about whether the financial statements are free of material misstatement. An audit includes examining, on a test basis, evidence supporting the amounts and disclosures in the financial statements. An audit also includes assessing the accounting principles used and significant estimates made by management, as well as evaluating the overall financial statement presentation. We believe that our audits provide a reasonable basis for our opinion.
In our opinion, the consolidated and combined financial statements referred to above present fairly, in all material respects, the financial position of Zoetis Inc. and subsidiaries as of December 31, 2014 and 2013, and the consolidated results of their operations and their cash flows for each of the years in the two-year period ended December 31, 2014, and the combined results of their operations and their cash flows for the year ended December 31, 2012, in conformity with U.S. generally accepted accounting principles. Also, in our opinion, the related financial statement schedule referred to above, when considered in relation to the basic consolidated and combined financial statements taken as a whole, presents fairly, in all material respects, the information set forth therein.
We also have audited, in accordance with the standards of the Public Company Accounting Oversight Board (United States), Zoetis Inc. and subsidiaries' internal control over financial reporting as of December 31, 2014, based on criteria established in
Internal Control - Integrated Framework
(
1992)
issued by the Committee of Sponsoring Organizations of the Treadway Commission (COSO), and our report dated February 27, 2015, expressed an unqualified opinion on the effectiveness of the Company’s internal control over financial reporting.
/s/ KPMG LLP
New York, New York
February 27, 2015
63
|
Report of Independent Registered Public Accounting Firm
The Board of Directors and Stockholders
Zoetis Inc.:
We have audited Zoetis Inc. and subsidiaries’ (the “Company”) internal control over financial reporting as of December 31, 2014, based on criteria established in
Internal Control - Integrated Framework (1992)
issued by the Committee of Sponsoring Organizations of the Treadway Commission (COSO). The Company’s management is responsible for maintaining effective internal control over financial reporting, and for its assessment of the effectiveness of internal control over financial reporting, included in the accompanying Management’s Report on Internal Control Over Financial Reporting. Our responsibility is to express an opinion on the Company’s internal control over financial reporting based on our audit.
We conducted our audit in accordance with the standards of the Public Company Accounting Oversight Board (United States). Those standards require that we plan and perform the audit to obtain reasonable assurance about whether effective internal control over financial reporting was maintained in all material respects. Our audit included obtaining an understanding of internal control over financial reporting, assessing the risk that a material weakness exists, and testing and evaluating the design and operating effectiveness of internal control based on the assessed risk. Our audit also included performing such other procedures as we considered necessary in the circumstances. We believe that our audit provides a reasonable basis for our opinion.
A company's internal control over financial reporting is a process designed to provide reasonable assurance regarding the reliability of financial reporting and the preparation of financial statements for external purposes in accordance with generally accepted accounting principles. A company's internal control over financial reporting includes those policies and procedures that (1) pertain to the maintenance of records that, in reasonable detail, accurately and fairly reflect the transactions and dispositions of the assets of the company; (2) provide reasonable assurance that transactions are recorded as necessary to permit preparation of financial statements in accordance with generally accepted accounting principles, and that receipts and expenditures of the company are being made only in accordance with authorizations of management and directors of the company; and (3) provide reasonable assurance regarding prevention or timely detection of unauthorized acquisition, use, or disposition of the company’s assets that could have a material effect on the financial statements.
Because of its inherent limitations, internal control over financial reporting may not prevent or detect misstatements. Also, projections of any evaluation of effectiveness to future periods are subject to the risk that controls may become inadequate because of changes in conditions, or that the degree of compliance with the policies or procedures may deteriorate.
In our opinion, Zoetis Inc. and subsidiaries maintained, in all material respects, effective internal control over financial reporting as of December 31, 2014, based on criteria established in
Internal Control - Integrated Framework (1992)
issued by the Committee of Sponsoring Organizations of the Treadway Commission
.
We also have audited, in accordance with the standards of the Public Company Accounting Oversight Board (United States), the consolidated balance sheets of Zoetis Inc. and subsidiaries as of December 31, 2014 and 2013, and the related consolidated statements of income, comprehensive income, equity and cash flows for each of the years in the two-year period ended December 31, 2014, and the combined statements of income, comprehensive income, equity, and cash flows of Zoetis (the animal health business unit of Pfizer Inc.) for the year ended December 31, 2012, and our report dated February 27, 2015, expressed an unqualified opinion on those consolidated and combined financial statements.
/s/ KPMG LLP
New York, New York
February 27, 2015
64
|
ZOETIS INC. AND SUBSIDIARIES
CONSOLIDATED AND COMBINED STATEMENTS OF INCOME
|
Year Ended December 31,
|
||||||||||||
|
(MILLIONS, EXCEPT PER SHARE DATA)
|
2014
|
|
2013
|
|
2012
|
|
||||||
|
Revenue
|
$
|
4,785
|
|
$
|
4,561
|
|
$
|
4,336
|
|
|||
|
Costs and expenses:
|
||||||||||||
|
Cost of sales
(a)
|
1,717
|
|
1,669
|
|
1,563
|
|
||||||
|
Selling, general and administrative expenses
(a)
|
1,643
|
|
1,613
|
|
1,470
|
|
||||||
|
Research and development expenses
(a)
|
396
|
|
399
|
|
409
|
|
||||||
|
Amortization of intangible assets
|
60
|
|
60
|
|
64
|
|
||||||
|
Restructuring charges and certain acquisition-related costs
|
25
|
|
26
|
|
135
|
|
||||||
|
Interest expense, net of capitalized interest
|
117
|
|
113
|
|
31
|
|
||||||
|
Other (income)/deductions––net
|
7
|
|
(9
|
)
|
(46
|
)
|
||||||
|
Income before provision for taxes on income
|
820
|
|
690
|
|
710
|
|
||||||
|
Provision for taxes on income
|
233
|
|
187
|
|
274
|
|
||||||
|
Net income before allocation to noncontrolling interests
|
587
|
|
503
|
|
436
|
|
||||||
|
Net income/(loss) attributable to noncontrolling interests
|
4
|
|
(1
|
)
|
—
|
|
||||||
|
Net income attributable to Zoetis
|
$
|
583
|
|
$
|
504
|
|
$
|
436
|
|
|||
|
Earnings per share attributable to Zoetis Inc. stockholders:
|
||||||||||||
|
Basic
|
$
|
1.16
|
|
$
|
1.01
|
|
$
|
0.87
|
|
|||
|
Diluted
|
$
|
1.16
|
|
$
|
1.01
|
|
$
|
0.87
|
|
|||
|
Weighted-average common shares outstanding
(b)
:
|
||||||||||||
|
Basic
|
501.055
|
|
500.002
|
|
500.000
|
|
||||||
|
Diluted
|
502.025
|
|
500.317
|
|
500.000
|
|
||||||
|
Dividends declared per common share
|
$
|
0.299
|
|
$
|
0.267
|
|
$
|
—
|
|
|||
|
(a)
|
Exclusive of amortization of intangible assets, except as disclosed in
|
|
(b)
|
The weighted average shares outstanding for both basic and diluted earnings per share for the year ended December 31, 2012 was calculated using
500
million shares of common stock outstanding, which was the number of Zoetis Inc. shares outstanding at the time of the initial public offering, which was completed on February 6, 2013. There were no Zoetis restricted stock units, deferred stock units, stock options or performance shares outstanding prior to the initial public offering.
|
See Notes to Consolidated and Combined Financial Statements, which are an integral part of these statements.
65
|
ZOETIS INC. AND SUBSIDIARIES
CONSOLIDATED AND COMBINED STATEMENTS OF COMPREHENSIVE INCOME
|
Year Ended December 31,
|
||||||||||||
|
(MILLIONS OF DOLLARS)
|
2014
|
|
2013
|
|
2012
|
|
||||||
|
Net income before allocation to noncontrolling interests
|
$
|
587
|
|
$
|
503
|
|
$
|
436
|
|
|||
|
Other comprehensive loss, net of tax and reclassification adjustments:
|
||||||||||||
|
Foreign currency translation adjustments, net
|
(123
|
)
|
(54
|
)
|
(93
|
)
|
||||||
|
Benefit plans: Actuarial gains/(losses), net
(a)
|
(10
|
)
|
(2
|
)
|
1
|
|
||||||
|
Plan settlement, net
(b)
|
3
|
|
—
|
|
—
|
|
||||||
|
Total other comprehensive loss, net of tax
|
(130
|
)
|
(56
|
)
|
(92
|
)
|
||||||
|
Comprehensive income before allocation to noncontrolling interests
|
457
|
|
447
|
|
344
|
|
||||||
|
Comprehensive income/(loss) attributable to noncontrolling interests
|
5
|
|
(1
|
)
|
—
|
|
||||||
|
Comprehensive income attributable to Zoetis
|
$
|
452
|
|
$
|
448
|
|
$
|
344
|
|
|||
|
(a)
|
Presented net of reclassification adjustments and tax impacts, which are not significant in any period presented. Reclassification adjustments related to benefit plans are generally reclassified, as part of net periodic pension cost, into
Cost of sales, Selling, general and administrative expenses,
and/or
Research and development expenses,
as appropriate, in the consolidated and combined statements of income.
|
|
(b)
|
Reflects the 2014 settlement charge associated with the 2012 sale of our Netherlands manufacturing facility which was recorded to
Other (income)/deductions—net
. See
Note 13. Benefit Plans
for additional information.
|
See Notes to Consolidated and Combined Financial Statements, which are an integral part of these statements.
66
|
ZOETIS INC. AND SUBSIDIARIES
CONSOLIDATED BALANCE SHEETS
|
December 31,
|
|
December 31,
|
|
|||||
|
(MILLIONS OF DOLLARS, EXCEPT PER SHARE DATA)
|
2014
|
|
2013
|
|
||||
|
Assets
|
||||||||
|
Cash and cash equivalents
|
$
|
882
|
|
$
|
610
|
|
||
|
Accounts receivable, less allowance for doubtful accounts of $32 in 2014 and $31 in 2013
|
980
|
|
1,138
|
|
||||
|
Inventories
|
1,289
|
|
1,293
|
|
||||
|
Current deferred tax assets
|
109
|
|
97
|
|
||||
|
Other current assets
|
205
|
|
219
|
|
||||
|
Total current assets
|
3,465
|
|
3,357
|
|
||||
|
Property, plant and equipment, less accumulated depreciation of $1,145 in 2014 and $1,028 in 2013
|
1,318
|
|
1,295
|
|
||||
|
Goodwill
|
976
|
|
982
|
|
||||
|
Identifiable intangible assets, less accumulated amortization
|
727
|
|
803
|
|
||||
|
Noncurrent deferred tax assets
|
54
|
|
63
|
|
||||
|
Other noncurrent assets
|
67
|
|
58
|
|
||||
|
Total assets
|
$
|
6,607
|
|
$
|
6,558
|
|
||
|
Liabilities and Equity
|
||||||||
|
Short-term borrowings
|
$
|
7
|
|
$
|
15
|
|
||
|
Accounts payable
|
290
|
|
506
|
|
||||
|
Dividends payable
|
42
|
|
36
|
|
||||
|
Accrued expenses
|
475
|
|
570
|
|
||||
|
Accrued compensation and related items
|
238
|
|
229
|
|
||||
|
Income taxes payable
|
26
|
|
40
|
|
||||
|
Other current liabilities
|
8
|
|
19
|
|
||||
|
Total current liabilities
|
1,086
|
|
1,415
|
|
||||
|
Long-term debt, net of discount
|
3,643
|
|
3,642
|
|
||||
|
Noncurrent deferred tax liabilities
|
277
|
|
322
|
|
||||
|
Other taxes payable
|
57
|
|
49
|
|
||||
|
Other noncurrent liabilities
|
207
|
|
168
|
|
||||
|
Total liabilities
|
5,270
|
|
5,596
|
|
||||
|
Commitments and contingencies
|
|
|
||||||
|
Stockholders' equity:
|
||||||||
|
Preferred stock, $0.01 par value; 1,000,000,000 authorized, none issued
|
—
|
|
—
|
|
||||
|
Common stock, $0.01 par value: 6,000,000,000 authorized, 501,342,267 and 500,007,735 shares issued;
501,327,524 and 500,007,428 shares outstanding at December 31, 2014 and 2013, respectively
|
5
|
|
5
|
|
||||
|
Treasury stock, at cost, 14,743 and 307 shares of common stock at December 31, 2014 and 2013, respectively
|
—
|
|
—
|
|
||||
|
Additional paid-in capital
|
958
|
|
878
|
|
||||
|
Retained earnings
|
709
|
|
276
|
|
||||
|
Accumulated other comprehensive loss
|
(361
|
)
|
(219
|
)
|
||||
|
Total Zoetis Inc. equity
|
1,311
|
|
940
|
|
||||
|
Equity attributable to noncontrolling interests
|
26
|
|
22
|
|
||||
|
Total equity
|
1,337
|
|
962
|
|
||||
|
Total liabilities and equity
|
$
|
6,607
|
|
$
|
6,558
|
|
||
See Notes to Consolidated and Combined Financial Statements, which are an integral part of these statements.
67
|
ZOETIS INC. AND SUBSIDIARIES
CONSOLIDATED AND COMBINED STATEMENTS OF EQUITY
|
Zoetis
|
||||||||||||||||||||||||||||||||
|
Accumulated
|
|
Equity
|
|
|||||||||||||||||||||||||||||
|
Business
|
|
Additional
|
|
Other
|
|
Attributable to
|
|
|||||||||||||||||||||||||
|
Common
|
|
Treasury
|
|
Unit
|
|
Paid-in
|
|
Retained
|
|
Comprehensive
|
|
Noncontrolling
|
|
Total
|
|
|||||||||||||||||
|
(MILLIONS OF DOLLARS)
|
Stock
(a)
|
|
Stock
(a)
|
|
Equity
(b)
|
|
Capital
|
|
Earnings
|
|
Loss
|
|
Interests
|
|
Equity
|
|
||||||||||||||||
|
Balance, December 31, 2011
|
$
|
—
|
|
$
|
—
|
|
$
|
3,785
|
|
$
|
—
|
|
$
|
—
|
|
$
|
(65
|
)
|
$
|
16
|
|
$
|
3,736
|
|
||||||||
|
Net income
|
—
|
|
—
|
|
436
|
|
—
|
|
—
|
|
—
|
|
—
|
|
436
|
|
||||||||||||||||
|
Other comprehensive loss
|
—
|
|
—
|
|
—
|
|
—
|
|
—
|
|
(92
|
)
|
—
|
|
(92
|
)
|
||||||||||||||||
|
Share-based compensation awards
|
—
|
|
—
|
|
28
|
|
—
|
|
—
|
|
—
|
|
—
|
|
28
|
|
||||||||||||||||
|
Net transfers between Pfizer and noncontrolling interests
|
—
|
|
—
|
|
1
|
|
—
|
|
—
|
|
—
|
|
(1
|
)
|
—
|
|
||||||||||||||||
|
Net transfers—Pfizer
(b)
|
—
|
|
—
|
|
(4
|
)
|
—
|
|
—
|
|
—
|
|
—
|
|
(4
|
)
|
||||||||||||||||
|
Dividends declared
|
—
|
|
—
|
|
(63
|
)
|
—
|
|
—
|
|
—
|
|
—
|
|
(63
|
)
|
||||||||||||||||
|
Balance, December 31, 2012
|
$
|
—
|
|
$
|
—
|
|
$
|
4,183
|
|
$
|
—
|
|
$
|
—
|
|
$
|
(157
|
)
|
$
|
15
|
|
$
|
4,041
|
|
||||||||
|
Net income (loss)
|
—
|
|
—
|
|
94
|
|
—
|
|
410
|
|
—
|
|
(1
|
)
|
503
|
|
||||||||||||||||
|
Other comprehensive loss
|
—
|
|
—
|
|
—
|
|
—
|
|
—
|
|
(56
|
)
|
—
|
|
(56
|
)
|
||||||||||||||||
|
Share-based compensation awards
(c)
|
—
|
|
—
|
|
3
|
|
40
|
|
—
|
|
—
|
|
—
|
|
43
|
|
||||||||||||||||
|
Net transfers—Pfizer Inc.
(b)
|
—
|
|
—
|
|
(271
|
)
|
—
|
|
—
|
|
—
|
|
—
|
|
(271
|
)
|
||||||||||||||||
|
Separation adjustments
(d)
|
—
|
|
—
|
|
414
|
|
29
|
|
—
|
|
(6
|
)
|
8
|
|
445
|
|
||||||||||||||||
|
Employee benefit plan contribution from Pfizer Inc.
(e)
|
—
|
|
—
|
|
—
|
|
2
|
|
—
|
|
—
|
|
—
|
|
2
|
|
||||||||||||||||
|
Reclassification of net liability due to Pfizer Inc.
(f)
|
—
|
|
—
|
|
(60
|
)
|
—
|
|
—
|
|
—
|
|
—
|
|
(60
|
)
|
||||||||||||||||
|
Consideration paid to Pfizer Inc. in connection with the Separation
(g)
|
—
|
|
—
|
|
—
|
|
(3,551
|
)
|
—
|
|
—
|
|
—
|
|
(3,551
|
)
|
||||||||||||||||
|
Issuance of common stock to Pfizer Inc. in connection with the Separation and reclassification of Business Unit Equity
(g)
|
5
|
|
—
|
|
(4,363
|
)
|
4,358
|
|
—
|
|
—
|
|
—
|
|
—
|
|
||||||||||||||||
|
Dividends declared
|
—
|
|
—
|
|
—
|
|
—
|
|
(134
|
)
|
—
|
|
—
|
|
(134
|
)
|
||||||||||||||||
|
Balance, December 31, 2013
|
$
|
5
|
|
$
|
—
|
|
$
|
—
|
|
$
|
878
|
|
$
|
276
|
|
$
|
(219
|
)
|
$
|
22
|
|
$
|
962
|
|
||||||||
|
Net income
|
—
|
|
—
|
|
—
|
|
—
|
|
583
|
|
—
|
|
4
|
|
587
|
|
||||||||||||||||
|
Other comprehensive income (loss)
|
—
|
|
—
|
|
—
|
|
—
|
|
—
|
|
(131
|
)
|
1
|
|
(130
|
)
|
||||||||||||||||
|
Share-based compensation awards
(c)
|
—
|
|
—
|
|
—
|
|
31
|
|
—
|
|
—
|
|
—
|
|
31
|
|
||||||||||||||||
|
Defined contribution plan transactions
(h)
|
—
|
|
—
|
|
—
|
|
36
|
|
—
|
|
—
|
|
—
|
|
36
|
|
||||||||||||||||
|
Pension plan transfer from Pfizer Inc.
(i)
|
—
|
|
—
|
|
—
|
|
11
|
|
—
|
|
(11
|
)
|
—
|
|
—
|
|
||||||||||||||||
|
Employee benefit plan contribution from Pfizer Inc.
(e)
|
—
|
|
—
|
|
—
|
|
2
|
|
—
|
|
—
|
|
—
|
|
2
|
|
||||||||||||||||
|
Dividends declared
|
—
|
|
—
|
|
—
|
|
—
|
|
(150
|
)
|
—
|
|
(1
|
)
|
(151
|
)
|
||||||||||||||||
|
Balance, December 31, 2014
|
$
|
5
|
|
$
|
—
|
|
$
|
—
|
|
$
|
958
|
|
$
|
709
|
|
$
|
(361
|
)
|
$
|
26
|
|
$
|
1,337
|
|
||||||||
|
(a)
|
As of
December 31, 2014
, there were
501,327,524
outstanding shares of common stock and
14,743
shares or treasury stock. Treasury stock is recognized at the cost to reacquire the shares, which totaled approximately
$0.5
million for the year ended December 31, 2014. The cost to reacquire treasury shares for the year ended December 31, 2013 was insignificant.
|
|
(b)
|
All amounts associated with
Business Unit Equity
relate to periods prior to the Separation. See
Note 2A. The Separation, Adjustments Associated with the Separation, Senior Notes Offering, Initial Public Offering and Exchange Offer
—
The Separation.
|
|
(c)
|
Includes the issuance of shares of Zoetis Inc. common stock and the reacquisition of shares of treasury stock associated with exercises of employee share-based awards. Treasury shares are reacquired from employees for withholding tax purposes in connection with the vesting and exercise of awards under our equity compensation plan. For additional information, see
Note 14. Share-Based Payments
and
Note 15. Stockholders' Equity.
|
|
(d)
|
For additional information, see
Note 2B. The Separation, Adjustments Associated with the Separation, Senior Notes Offering, Initial Public Offering and Exchange Offer
—
Adjustments Associated with the Separation.
|
|
(e)
|
Represents contributed capital from Pfizer Inc. associated with service credit continuation for certain Zoetis Inc. employees in Pfizer Inc.'s U.S. qualified defined benefit and U.S. retiree medical plans.
See Note 13. Benefit Plans.
|
|
(f)
|
Represents the reclassification of the Receivable from Pfizer Inc. and the Payable to Pfizer Inc. from
Business Unit Equity
as of the Separation date. See
Note 2A. The Separation, Adjustments Associated with the Separation, Senior Notes Offering, Initial Public Offering and Exchange Offer
—
The Separation.
|
|
(g)
|
Reflects the Separation transaction. See
Note 2A. The Separation, Adjustments Associated with the Separation, Senior Notes Offering, Initial Public Offering and Exchange Offer
—
The Separation.
|
|
(h)
|
Reflects company matching and profit-sharing contributions funded through the issuance of shares of Zoetis Inc. common stock for the year ended December 31, 2014. For additional information, see
|
|
(i)
|
Reflects the 2014 transfers of defined benefit pension plans from Pfizer Inc. and the associated reclassification from
Additional Paid in Capital
to
Accumulated Other Comprehensive Loss.
See
Note 13. Benefit Plans.
|
See Notes to Consolidated and Combined Financial Statements, which are an integral part of these statements.
68
|
ZOETIS INC. AND SUBSIDIARIES
CONSOLIDATED AND COMBINED STATEMENTS OF CASH FLOWS
|
Year Ended December 31,
|
||||||||||||
|
(MILLIONS OF DOLLARS)
|
2014
|
|
2013
|
|
2012
|
|
||||||
|
Operating Activities
|
||||||||||||
|
Net income before allocation to noncontrolling interests
|
$
|
587
|
|
$
|
503
|
|
$
|
436
|
|
|||
|
Adjustments to reconcile net income before noncontrolling interests to net cash
|
||||||||||||
|
provided by operating activities:
|
||||||||||||
|
Depreciation and amortization expense
|
204
|
|
209
|
|
200
|
|
||||||
|
Share-based compensation expense
|
32
|
|
43
|
|
28
|
|
||||||
|
Asset write-offs and asset impairments
|
10
|
|
15
|
|
10
|
|
||||||
|
Deferred taxes
|
(49
|
)
|
23
|
|
(74
|
)
|
||||||
|
Employee benefit plan contribution from Pfizer Inc.
|
2
|
|
2
|
|
—
|
|
||||||
|
Other non-cash adjustments
|
(3
|
)
|
(10
|
)
|
3
|
|
||||||
|
Other changes in assets and liabilities, net of acquisitions and divestitures and transfers with Pfizer Inc.
|
||||||||||||
|
Accounts receivable
|
69
|
|
(99
|
)
|
(65
|
)
|
||||||
|
Inventories
|
(16
|
)
|
(104
|
)
|
(318
|
)
|
||||||
|
Other assets
|
(2
|
)
|
(24
|
)
|
(5
|
)
|
||||||
|
Accounts payable
|
(210
|
)
|
(82
|
)
|
96
|
|
||||||
|
Other liabilities
|
11
|
|
196
|
|
62
|
|
||||||
|
Other tax accounts, net
|
(9
|
)
|
9
|
|
81
|
|
||||||
|
Net cash provided by operating activities
|
626
|
|
681
|
|
454
|
|
||||||
|
Investing Activities
|
||||||||||||
|
Purchases of property, plant and equipment
|
(180
|
)
|
(184
|
)
|
(126
|
)
|
||||||
|
Milestone payment related to previously acquired intangibles
|
(15
|
)
|
—
|
|
—
|
|
||||||
|
Net proceeds from sales of assets
|
9
|
|
9
|
|
3
|
|
||||||
|
Other investing activities
|
(1
|
)
|
(4
|
)
|
(12
|
)
|
||||||
|
Net cash used in investing activities
|
(187
|
)
|
(179
|
)
|
(135
|
)
|
||||||
|
Financing Activities
|
||||||||||||
|
Increase/(decrease) in short-term borrowings, net
|
(8
|
)
|
16
|
|
—
|
|
||||||
|
Proceeds from issuance of long-term debt—senior notes, net of discount and fees
|
—
|
|
2,625
|
|
—
|
|
||||||
|
Stock-based compensation-related proceeds and excess tax benefits
|
2
|
|
—
|
|
—
|
|
||||||
|
Consideration paid to Pfizer Inc. in connection with the Separation
(a)
|
—
|
|
(2,559
|
)
|
—
|
|
||||||
|
Cash dividends paid
(b)
|
(146
|
)
|
(98
|
)
|
(63
|
)
|
||||||
|
Other net financing activities with Pfizer Inc.
|
(2
|
)
|
(184
|
)
|
(15
|
)
|
||||||
|
Net cash used in financing activities
|
(154
|
)
|
(200
|
)
|
(78
|
)
|
||||||
|
Effect of exchange-rate changes on cash and cash equivalents
|
(13
|
)
|
(9
|
)
|
(3
|
)
|
||||||
|
Net increase in cash and cash equivalents
|
272
|
|
293
|
|
238
|
|
||||||
|
Cash and cash equivalents at beginning of period
|
610
|
|
317
|
|
79
|
|
||||||
|
Cash and cash equivalents at end of period
|
$
|
882
|
|
$
|
610
|
|
$
|
317
|
|
|||
|
Supplemental cash flow information
|
||||||||||||
|
Cash paid during the period for:
|
||||||||||||
|
Income taxes
|
$
|
278
|
|
$
|
134
|
|
$
|
276
|
|
|||
|
Interest, net of capitalized interest
|
118
|
|
60
|
|
31
|
|
||||||
|
Non-cash transactions:
|
||||||||||||
|
Intangible asset acquisition
(c)
|
$
|
8
|
|
$
|
—
|
|
$
|
—
|
|
|||
|
Purchases of property, plant and equipment
|
9
|
|
16
|
|
14
|
|
||||||
|
Contingent purchase price consideration
|
—
|
|
3
|
|
—
|
|
||||||
|
Dividends declared, not paid
|
42
|
|
36
|
|
—
|
|
||||||
|
Zoetis Inc. senior notes transferred to Pfizer Inc. in connection with the Separation
(d)
|
—
|
|
992
|
|
—
|
|
||||||
|
(a)
|
Reflects the Separation transaction. Amount is net of the non-cash portion. See
Note 2A. The Separation, Adjustments Associated with the Separation, Senior Notes Offering, Initial Public Offering and Exchange Offer
—
The Separation.
|
|
(b)
|
For the twelve months ended December 31, 2012, reflects payments to other non-Zoetis Pfizer Inc. entities.
|
|
(c)
|
Reflects the non-cash portion of the acquisition of product registration and application rights from Pfizer. See
Note 19. Transactions and Agreements with Pfizer.
|
|
(d)
|
Reflects the non-cash portion of the Separation transaction. See
Note 2A. The Separation, Adjustments Associated with the Separation, Senior Notes Offering, Initial Public Offering and Exchange Offer
—
The Separation.
|
See Notes to Consolidated and Combined Financial Statements, which are an integral part of these statements.
69
|
ZOETIS INC. AND SUBSIDIARIES
NOTES TO CONSOLIDATED AND COMBINED FINANCIAL STATEMENTS
1. Business Description
Zoetis Inc. (collectively, Zoetis, the company, we, us or our) is a global leader in the discovery, development, manufacture and commercialization of animal health medicines and vaccines, with a focus on both livestock and companion animals. We organize and operate our business in
four
geographic regions: the United States (U.S.); Europe/Africa/Middle East (EuAfME); Canada/Latin America (CLAR); and Asia/Pacific (APAC).
We directly market our products in approximately
70
countries across North America, Europe, Africa, Asia, Australia and South America, and our products are sold in more than
120
countries, including developed markets and emerging markets. Our revenue is mostly generated in the U.S. and EuAfME. We have a diversified business, marketing products across
eight
core species: cattle, swine, poultry, sheep and fish (collectively, livestock) and dogs, cats and horses (collectively, companion animals); and within
five
major product categories: anti-infectives, vaccines, parasiticides, medicated feed additives and other pharmaceuticals.
|
2.
|
The Separation, Adjustments Associated with the Separation, Senior Notes Offering, Initial Public Offering and Exchange Offer
|
Pfizer Inc. (Pfizer) formed Zoetis to acquire, own and operate the animal health business of Pfizer. On
June 24, 2013
, Pfizer completed an exchange offer resulting in the full separation of Zoetis from Pfizer. For additional information, see
E. Exchange Offer.
|
A.
|
The Separation
|
In the first quarter of 2013, through a series of steps (collectively, the Separation), Pfizer transferred to us its subsidiaries holding substantially all of the assets and liabilities of its animal health business. In exchange, we transferred to Pfizer: (i) all of the issued and outstanding shares of our Class A common stock; (ii) all of the issued and outstanding shares of our Class B common stock; (iii) $
1.0 billion
in senior notes (see
C.
Senior Notes Offering
below); and (iv) an amount of cash equal to substantially all of the net proceeds received in the senior notes offering (approximately $
2.5 billion
).
|
B.
|
Adjustments Associated with the Separation
|
In connection with the Separation, certain animal health assets and liabilities included in the pre-Separation balance sheet were retained by Pfizer and certain non-animal health assets and liabilities (not included in the pre-Separation balance sheet) were transferred to Zoetis. The adjustments to the historical balance sheet of Zoetis (collectively, the Separation Adjustments) representing approximately $
445 million
of net liabilities retained by Pfizer, were primarily related to the following:
|
•
|
The removal of inventories (approximately $
74 million
), property, plant and equipment (approximately $
28 million
) and miscellaneous other net liabilities (approximately $
21 million
) associated with certain non-dedicated manufacturing sites that were retained by Pfizer;
|
|
•
|
The addition of property, plant and equipment (approximately $
56 million
) associated with a non-dedicated manufacturing site that was transferred to us by Pfizer (and then leased back to Pfizer under operating leases), and the removal of the inventory (approximately $
46 million
) and net other assets (approximately $
4 million
) at that site as these assets were retained by Pfizer;
|
|
•
|
The addition of net defined benefit plan liabilities (approximately $
21 million
) and deferred compensation liabilities (approximately $
4 million
);
|
|
•
|
The elimination of (i) noncurrent deferred tax assets (some of which were included within noncurrent deferred tax liabilities due to jurisdictional netting) related to net operating loss and tax credit carryforwards; (ii) net tax liabilities associated with uncertain tax positions; (iii) noncurrent deferred tax liabilities related to deferred income taxes on unremitted earnings; and (iv) other allocated net tax assets, all of which (approximately $
49 million
in net tax asset accounts) were retained by Pfizer;
|
|
•
|
The addition of (i) noncurrent deferred tax assets (approximately $
8 million
, some of which were included within noncurrent deferred tax liabilities due to jurisdictional netting) related to net benefit plan liabilities transferred to us by Pfizer; (ii) noncurrent deferred tax assets (approximately $
2 million
) related to net operating loss and tax credit carryforwards; and (iii) noncurrent deferred tax liabilities (approximately $
2 million
) related to property, plant and equipment transferred to us by Pfizer;
|
|
•
|
The elimination of allocated long-term debt (approximately $
582 million
), allocated accrued interest payable (approximately $
16 million
) and allocated unamortized deferred debt issuance costs (approximately $
2 million
) that were retained by Pfizer;
|
|
•
|
Certain net financial assets retained by Pfizer (approximately $
45 million
);
|
|
•
|
The removal of cash (approximately $
7 million
), inventories (approximately $
5 million
), property, plant and equipment (approximately $
8 million
), miscellaneous other assets (approximately $
3 million
) and other miscellaneous liabilities (approximately $
2 million
) associated with non-U.S. Pfizer businesses that did not transfer to us from Pfizer;
|
|
•
|
The addition of net receivables from Pfizer (approximately $
5 million
) associated with certain foreign taxes directly resulting from certain aspects of the Separation that were the responsibility of Pfizer under the terms of the tax matters agreement, see
|
|
•
|
The addition of (i) inventory (approximately $
15 million
); (ii) net deferred tax assets (approximately $
1 million
); and (iii) miscellaneous other assets (approximately $
5 million
) transferred to us by Pfizer, and the removal of (i) property, plant and equipment (approximately $
2
|
70
|
million
); (ii) miscellaneous other liabilities (approximately $
57 million
); and (iii) the elimination of prepaid taxes (approximately $
4 million
) that were retained by Pfizer; and
|
•
|
The addition of net benefit plan liabilities (approximately $
21 million
) associated with certain international plans that transferred from Pfizer to Zoetis in 2014. See
|
The Separation Adjustment associated with
Accumulated Other Comprehensive Loss
reflects the accumulated currency translation adjustment based on the actual legal entity structure of Zoetis.
|
C.
|
Senior Notes Offering
|
In connection with the Separation, on
January 28, 2013
, we issued
$3.65 billion
aggregate principal amount of our senior notes in a private placement, with an original issue discount of
$10 million
. For additional information, see
Note 9A. Financial Instruments
—
Debt.
|
D.
|
Initial Public Offering (IPO)
|
After the Separation, on
February 6, 2013
, an IPO of
99,015,000
shares of our Class A common stock (including the exercise of the underwriters' over-allotment option) at a price of
$26.00
per share was completed. Pfizer retained the net proceeds from the IPO.
Immediately following the IPO, there were
99,015,000
outstanding shares of Class A common stock and
400,985,000
outstanding shares of Class B common stock. The rights of the holders of Class A common stock and Class B common stock are identical, except with respect to voting and conversion rights. Following the IPO, Pfizer owned all of the outstanding shares of our Class B common stock, all of which was converted to Class A common stock in connection with the Exchange Offer. See
E. Exchange Offer.
There are no longer any shares of our Class B common stock outstanding.
In connection with the IPO, we entered into certain agreements that provide a framework for an ongoing relationship with Pfizer. For additional information, see
Note 19B. Transactions and Agreements with Pfizer
—
Agreements with Pfizer
.
|
E.
|
Exchange Offer
|
On
May 22, 2013
, Pfizer announced an exchange offer (the Exchange Offer) whereby Pfizer shareholders could exchange a portion of Pfizer common stock for Zoetis common stock. The Exchange Offer was completed on
June 24, 2013
, resulting in the full separation of Zoetis and the disposal of Pfizer's entire ownership and voting interest in Zoetis.
|
3.
|
Basis of Presentation
|
The consolidated and combined financial statements were prepared in accordance with accounting principles generally accepted in the United States of America (U.S. GAAP). For subsidiaries operating outside the United States, the consolidated and combined financial information is included as of and for the fiscal year ended November 30 for each year presented. All significant intercompany balances and transactions between the legal entities that comprise Zoetis have been eliminated. For those subsidiaries included in these consolidated and combined financial statements where our ownership is less than 100%, the minority interests have been shown in equity as
Equity attributable to noncontrolling interests
.
Certain reclassifications of prior year information have been made to conform to the current year's presentation. In the first quarter of 2014, we realigned our segment reporting with respect to our Client Supply Services (CSS) organization, which provides contract manufacturing services to third parties, to reflect how our chief operating decision maker currently evaluates our financial results. The revenue and earnings associated with CSS are now reported within
Other business activities
, separate from the four reportable segments. In 2013, CSS results were reported in the EuAfME segment. Such revisions have no impact on our consolidated financial condition, results of operations or cash flows for the periods presented. We have revised our segment results presented herein to reflect this new segment structure, including for the comparable 2013 and 2012 periods. For additional information, see
Note 18. Segment, Geographic and Other Revenue Information.
|
A.
|
Basis of Presentation Prior to the Separation
|
Prior to the Separation, the combined financial statements were derived from the consolidated financial statements and accounting records of Pfizer and included allocations for direct costs and indirect costs attributable to the operations of the animal health business of Pfizer. The pre-Separation financial statements and activities do not purport to reflect what the results of operations, comprehensive income/(loss), financial position, equity or cash flows would have been had we operated as an independent public company during the periods presented.
|
•
|
The combined statement of income for the year ended December 31, 2012, and the pre-Separation period included in the consolidated statement of income for the year ended December 31, 2013, include allocations from certain support functions (Enabling Functions) that are provided on a centralized basis within Pfizer, such as expenses for business technology, facilities, legal, finance, human resources, and, to a lesser extent, business development, public affairs and procurement, among others, as Pfizer did not routinely allocate these costs to any of its business units. These allocations were based on either a specific identification basis or, when specific identification is not practicable, proportional allocation methods (e.g., using third-party sales, headcount, etc.), depending on the nature of the services.
|
Costs associated with business technology, facilities and human resources were allocated primarily using proportional allocation methods and, for legal and finance, primarily using specific identification. In all cases, for support function costs where proportional allocation methods were used, we determined whether the costs are primarily influenced by headcount (such as a significant majority of facilities and human resources costs) or by the size of the business (such as most business technology costs), and we also determined whether the associated scope of those services provided were global, regional or local. Based on those analyses, the costs were allocated based on our share of worldwide revenue, domestic revenue, international revenue, regional revenue, country revenue, worldwide headcount, country headcount or site headcount, as appropriate.
71
|
As a result, costs associated with business technology and legal that were not specifically identified were mostly allocated based on revenue drivers and, to a lesser extent, based on headcount drivers; costs associated with finance that were not specifically identified were all allocated based on revenue drivers; and costs associated with facilities and human resources that were not specifically identified were predominantly allocated based on headcount drivers.
|
•
|
The combined statement of income for the year ended December 31, 2012, and the pre-Separation period included in the consolidated statement of income for the year ended December 31, 2013, includes allocations of certain manufacturing and supply costs incurred by manufacturing plants that were shared with other Pfizer business units, Pfizer's global external supply group and Pfizer's global logistics and support group (collectively, Pfizer Global Supply, or PGS). These costs may include manufacturing variances and changes in the standard costs of inventory, among others, as Pfizer did not routinely allocate these costs to any of its business units. These allocations were based on either a specific identification basis or, when specific identification is not practicable, proportional allocation methods, such as animal health identified manufacturing costs, depending on the nature of the costs.
|
|
•
|
The combined statement of income for the year ended December 31, 2012, and the pre-Separation period included in the consolidated statement of income for the year ended December 31, 2013, also includes allocations from the Enabling Functions and PGS for restructuring charges, integration costs, additional depreciation associated with asset restructuring and implementation costs, as Pfizer did not routinely allocate these costs to any of its business units. For additional information about allocations of restructuring charges and other costs associated with acquisitions and cost-reduction/productivity initiatives, see
Note 6. Restructuring Charges and Other Costs Associated with Acquisitions and Cost-Reduction/Productivity Initiatives
.
|
|
•
|
The combined statement of income for the year ended December 31, 2012, and the pre-Separation period included in the consolidated statement of income for the year ended December 31, 2013, includes an allocation of share-based compensation expense and certain other compensation expense items, such as certain fringe benefit expenses, maintained on a centralized basis within Pfizer, as Pfizer does not routinely allocate these costs to any of its business units. For additional information about allocations of share-based payments, see
|
The allocated expenses from Pfizer include the items noted below for the pre-Separation period in 2013 and the year ended December 31, 2012.
|
•
|
Enabling Functions operating expenses––
$11 million
and
$310 million
in 2013 and 2012, respectively (
$1 million
in 2012 in
Cost of sales
;
$11 million
and
$254 million
in 2013 and 2012, respectively, in
Selling, general and administrative expenses
; and
$55 million
in 2012, in
Research and development expenses
).
|
|
•
|
PGS manufacturing costs—
$25 million
in 2012 (in
Cost of sales).
|
|
•
|
Restructuring charges and certain acquisition-related costs—
$57 million
in 2012 (in
Restructuring charges and certain acquisition-related costs
).
|
|
•
|
Other costs associated with cost reduction/productivity initiatives—additional depreciation associated with asset restructuring—
$2 million
and
$13 million
in 2013 and 2012, respectively (
$2 million
and
$4 million
in 2013 and 2012, respectively, in
Selling, general and administrative expenses
and
$9 million
in 2012 in
Research and development expenses
).
|
|
•
|
Other costs associated with cost reduction/productivity initiatives—implementation costs—
$1 million
and
$9 million
in 2013 and 2012, respectively (
$1 million
and
$8 million
in 2013 and 2012, respectively, in
Selling, general and administrative expenses;
and
$1 million
in 2012 in
Research and development expenses
).
|
|
•
|
Share-based compensation expense—
$3 million
and
$33 million
in 2013 and 2012, respectively (
$1 million
and
$7 million
in 2013 and 2012, respectively, in
Cost of sales
;
$2 million
and
$21 million
in 2013 and 2012, respectively, in
Selling, general and administrative expenses
; and
$5 million
in 2012 in
Research and development expenses
).
|
|
•
|
Compensation-related expenses—
$1 million
and
$12 million
in 2013 and 2012, respectively (
$5 million
in 2012 in
Cost of sales
;
$1 million
and
$5 million
in 2013 and 2012, respectively, in
Selling, general and administrative expenses
; and
$2 million
in 2012 in
Research and development expenses
).
|
|
•
|
Interest expense—
$2 million
and
$31 million
in 2013 and 2012, respectively.
|
The income tax provision in the combined statement of income for the periods prior to the Separation was calculated as if Zoetis filed a separate return.
Management believes that the allocations were a reasonable reflection of the services received or the costs incurred on behalf of Zoetis and its operations and that the combined statements of income for the year ended December 31, 2012, and the pre-Separation period included in the consolidated statement of income for the year ended December 31, 2013, reflect all of the costs of the animal health business of Pfizer.
Prior to the Separation, we participated in Pfizer's centralized cash management system and generally all excess cash was transferred to Pfizer on a daily basis. Cash disbursements for operations and/or investing activities were funded as needed by Pfizer. We had also participated in Pfizer's centralized hedging and offsetting programs. As such, in the combined statement of income for the year ended December 31, 2012, we included the impact of Pfizer's derivative financial instruments used for offsetting changes in foreign currency rates, net of the related foreign exchange gains and losses for the portion that is deemed to be associated with the animal health operations. Such gains and losses were not material to the combined financial statements for the periods presented.
|
B.
|
Basis of Presentation After the Separation
|
The consolidated financial statements after the date of the Separation comprise the following: (i) the results of operations, comprehensive income, and cash flow amounts for the period prior to the Separation (see above), which includes allocations for direct costs and indirect costs attributable to
72
|
the operations of the animal health business; and (ii) the amounts for the period after the Separation, which reflect the results of operations, comprehensive income, financial position, equity and cash flows resulting from our operation as an independent public company.
The income tax provision prepared after the Separation is based on the actual legal entity structure of Zoetis, with certain accommodations pursuant to a tax matters agreement. For additional information, see
Note 19B. Transactions and Agreements with Pfizer
—
Agreements with Pfizer.
4. Significant Accounting Policies
New Accounting Standards
In May 2014, the Financial Accounting Standards Board (FASB) issued an accounting standards update that outlines a new, single comprehensive model for companies to use in accounting for revenue arising from contracts with customers. This update supersedes most current revenue recognition guidance under U.S. GAAP. The core principle of the new guidance is that an entity should recognize revenue to depict the transfer of goods or services to customers in an amount that reflects the consideration to which the entity expects to be entitled in exchange for those goods or services. The guidance includes a five-step model for determining how, when and how much revenue should be recognized. This update also requires additional disclosure about the nature, amount, timing and uncertainty of revenue and cash flows arising from contracts with customers. The provisions of the new standard are effective beginning January 1, 2017, for annual and interim reporting periods. Early adoption is not permitted. The new standard allows for either full retrospective or modified retrospective transition upon adoption. We are currently assessing the transition method we will elect for adoption as well as the potential impact that adopting this new guidance will have on our consolidated financial statements.
In July 2013, the FASB issued an accounting standards update regarding the presentation of an unrecognized tax benefit related to a net operating loss carryforward, a similar tax loss, or a tax credit carryforward. Under this new standard, this unrecognized tax benefit, or a portion thereof, should be presented in the financial statements as a reduction to a deferred tax asset if available under the tax law of the applicable jurisdiction to settle any additional income taxes that would result from the disallowance of a tax position. Otherwise, the unrecognized tax benefit should be presented in the financial statements as a separate liability. The assessment is based on the unrecognized tax benefits and deferred tax assets that exist at the reporting date. The provisions of the new standard were effective January 1, 2014, for annual and interim reporting periods and did not have a significant impact on our consolidated financial statements.
In March 2013, the FASB issued an accounting standards update regarding the accounting for cumulative translation adjustment (CTA) upon derecognition of assets or investment within a foreign entity. This new standard provides additional CTA accounting guidance on sales or transfers of foreign entity investments and assets as well as step acquisitions involving a foreign entity. The provisions of the new standard were effective as of January 1, 2014, and did not have a significant impact on our consolidated financial statements.
In February 2013, the FASB issued an accounting standards update regarding the measurement of obligations resulting from joint and several liability arrangements that may include debt agreements, other contractual obligations and settled litigation or judicial rulings. The provisions of this standard require that these obligations are measured at the amount representing the agreed upon obligation of the company as well as additional liability amounts it expects to assume on behalf of other parties in the arrangement. The provisions of the new standard were effective January 1, 2014, and did not have a significant impact on our consolidated financial statements.
Estimates and Assumptions
In preparing the consolidated and combined financial statements, we use certain estimates and assumptions that affect reported amounts and disclosures, including amounts recorded in connection with acquisitions. These estimates and underlying assumptions can impact all elements of our consolidated and combined financial statements. For example, in the consolidated and combined statements of income, in addition to estimates used in determining the allocations of costs and expenses from Pfizer, estimates are used when accounting for deductions from revenue (such as rebates, sales allowances, product returns and discounts), determining cost of sales, allocating cost in the form of depreciation and amortization, and estimating restructuring charges and the impact of contingencies. On the consolidated balance sheets, estimates are used in determining the valuation and recoverability of assets, such as accounts receivables, inventories, fixed assets, goodwill and other identifiable intangible assets, and estimates are used in determining the reported amounts of liabilities, such as taxes payable, benefit obligations, the impact of contingencies, deductions from revenue and restructuring reserves, all of which also impact the consolidated and combined statements of income.
Our estimates are often based on complex judgments, probabilities and assumptions that we believe to be reasonable but that can be inherently uncertain and unpredictable. If our estimates and assumptions are not representative of actual outcomes, our results could be materially impacted.
As future events and their effects cannot be determined with precision, our estimates and assumptions may prove to be incomplete or inaccurate, or unanticipated events and circumstances may occur that might cause us to change those estimates and assumptions. We are subject to risks and uncertainties that may cause actual results to differ from estimated amounts, such as changes in competition, litigation, legislation and regulations. We regularly evaluate our estimates and assumptions using historical experience and expectations about the future. We adjust our estimates and assumptions when facts and circumstances indicate the need for change. Those changes generally will be reflected in our consolidated financial statements on a prospective basis unless they are required to be treated retrospectively under relevant accounting standards. It is possible that others, applying reasonable judgment to the same facts and circumstances, could develop and support a range of alternative estimated amounts.
Acquisitions
Our consolidated and combined financial statements include the operations of acquired businesses from the date of acquisition. We account for acquired businesses using the acquisition method of accounting, which requires, among other things, that most assets acquired and liabilities assumed be recognized at their estimated fair values as of the acquisition date and that the fair value of acquired in-process research and development (IPR&D) be recorded on the balance sheet. Transaction costs are expensed as incurred. Any excess of the consideration transferred over the assigned values of the net assets acquired is recorded as goodwill. When we acquire net assets that do not constitute a business as defined in U.S. GAAP, no goodwill is recognized.
73
|
Amounts recorded for acquisitions can result from a complex series of judgments about future events and uncertainties and can rely heavily on estimates and assumptions. For information about the risks associated with estimates and assumptions, see
Estimates and Assumptions
.
Foreign Currency Translation
For most of our international operations, local currencies have been determined to be the functional currencies. We translate functional currency assets and liabilities to their U.S. dollar equivalents at exchange rates in effect at the balance sheet date and we translate functional currency income and expense amounts to their U.S. dollar equivalents at average exchange rates for the period. The U.S. dollar effects that arise from changing translation rates are recorded in
Other comprehensive income/(loss), net of tax.
The effects of converting non-functional currency assets and liabilities into the functional currency are recorded in
Other (income)/deductions––net.
For operations in highly inflationary economies, we translate monetary items at rates in effect at the balance sheet date, with translation adjustments recorded in
Other (income)/deductions––net
, and we translate non-monetary items at historical rates.
Revenue, Deductions from Revenue and the Allowance for Doubtful Accounts
We record revenue from product sales when the goods are shipped and title and risk of loss passes to the customer. At the time of sale, we also record estimates for a variety of deductions from revenue, such as rebates, sales allowances, product returns and discounts. Sales deductions are estimated and recorded at the time that
related revenue is recorded except for sales incentives, which are estimated and recorded at the time the related revenue is recorded or when the incentive is offered, whichever is later. As applicable, our estimates are generally based on contractual terms or historical experience, adjusted as necessary to reflect our expectations about the future. Taxes collected from customers relating to product sales and remitted to governmental authorities are excluded from
Revenue.
As of
December 31, 2014
and
2013
, accruals for sales deductions included in
Other current liabilities
are approximately $
136 million
and $
153 million
, respectively.
We also record estimates for bad debts. We periodically assess the adequacy of the allowance for doubtful accounts by evaluating the collectability of outstanding receivables based on factors such as past due history, historical and expected collection patterns, the financial condition of our customers, the robust nature of our credit and collection practices and the economic environment.
Amounts recorded for sales deductions and bad debts can result from a complex series of judgments about future events and uncertainties and can rely heavily on estimates and assumptions. For information about the risks associated with estimates and assumptions, see
Estimates and Assumptions.
Cost of Sales and Inventories
Inventories are carried at the lower of cost or market. The cost of finished goods, work-in-process and raw materials is determined using average actual cost. We regularly review our inventories for impairment and adjustments are recorded when necessary.
Selling, General and Administrative Expenses
Selling, general and administrative costs are expensed as incurred. Among other things, these expenses include the internal and external costs of marketing, advertising, and shipping and handling as well as certain costs related to business technology, facilities, legal, finance, human resources, business development, public affairs and procurement, among others.
Advertising expenses relating to production costs are expensed as incurred, and the costs of space in publications are expensed when the related advertising occurs. Advertising and promotion expenses totaled approximately $
132 million
in
2014
, $
143 million
in
2013
and $
141 million
in
2012
.
Shipping and handling costs totaled approximately $
62 million
in
2014
, $
60 million
in
2013
and $
59 million
in
2012
.
Research and Development Expenses
R&D costs are expensed as incurred. Research is the effort associated with the discovery of new knowledge that will be useful in developing a new product or in significantly improving an existing product. Development is the implementation of the research findings. Before a compound receives regulatory approval, we record upfront and milestone payments made by us to third parties under licensing arrangements as expense. Upfront payments are recorded when incurred, and milestone payments are recorded when the specific milestone has been achieved. Once a compound receives regulatory approval in a major market, we record any milestone payments in
Identifiable intangible assets, less accumulated amortization
and, unless the assets are determined to have an indefinite life, we amortize them on a straight-line basis over the remaining agreement term or the expected product life cycle, whichever is shorter.
Amortization of Intangible Assets, Depreciation and Certain Long-Lived Assets
Long-lived assets include:
|
•
|
Goodwill
—goodwill represents the excess of the consideration transferred for an acquired business over the assigned values of its net assets. Goodwill is not amortized.
|
|
•
|
Identifiable intangible assets, less accumulated amortization
—these acquired assets are recorded at our cost. Identifiable intangible assets with finite lives are amortized on a straight-line basis over their estimated useful lives. Identifiable intangible assets with indefinite lives that are associated with marketed products are not amortized until a useful life can be determined. Identifiable intangible assets associated with IPR&D projects are not amortized until regulatory approval is obtained. The useful life of an amortizing asset generally is determined by identifying the period in which substantially all of the cash flows are expected to be generated.
|
|
•
|
Property, plant and equipment, less accumulated depreciation
––these assets are recorded at our cost and are increased by the cost of any significant improvements after purchase. Property, plant and equipment assets, other than land and construction-in-progress, are depreciated
|
74
|
on a straight-line basis over the estimated useful life of the individual assets. Depreciation begins when the asset is ready for its intended use. For tax purposes, accelerated depreciation methods are used as allowed by tax laws.
Amortization expense related to finite-lived identifiable intangible assets that contribute to our ability to sell, manufacture, research, market and distribute products, compounds and intellectual property are included in
Amortization of
intangible assets
as they benefit multiple business functions. Amortization expense related to intangible assets that are associated with a single function and depreciation of property, plant and equipment are included in
Cost of sales
,
Selling, general and administrative expenses
and
Research and development expenses
, as appropriate.
We review all of our long-lived assets for impairment indicators throughout the year and we perform detailed testing whenever impairment indicators are present. In addition, we perform impairment testing for goodwill and indefinite-lived assets at least annually. When necessary, we record charges for impairments. Specifically:
|
•
|
For finite-lived identifiable intangible assets, such as developed technology rights, and for other long-lived assets, such as property, plant and equipment, whenever impairment indicators are present, we calculate the undiscounted value of the projected cash flows associated with the asset, or asset group, and compare this estimated amount to the carrying amount. If the carrying amount is found to be greater, we record an impairment loss for the excess of book value over fair value. In addition, in all cases of an impairment review, we re-evaluate the remaining useful lives of the assets and modify them, as appropriate.
|
|
•
|
For indefinite-lived identifiable intangible assets, such as brands and IPR&D assets, we test for impairment at least annually, or more frequently if impairment indicators exist, by first assessing qualitative factors to determine whether it is more likely than not that the fair value of the indefinite-lived intangible asset is less than its carrying amount. If we conclude it is more likely than not that the fair value is less than the carrying amount, a quantitative test that compares the fair value of the indefinite-lived intangible asset with its carrying value is performed. If the fair value is less than the carrying amount, an impairment loss is recognized. We record an impairment loss, if any, for the excess of book value over fair value. In addition, in all cases of an impairment review other than for IPR&D assets, we re-evaluate whether continuing to characterize the asset as indefinite-lived is appropriate.
|
|
•
|
For goodwill, we test for impairment on at least an annual basis, or more frequently if impairment indicators exist, either by assessing qualitative factors to determine whether it is more likely than not that the fair value of a reporting unit is less than its carrying amount, or by performing a quantitative assessment. If we choose to perform a qualitative analysis and conclude it is more likely than not that the fair value of a reporting unit is less than its carrying amount, a quantitative fair value test is performed. We determine the implied fair value of goodwill by subtracting the fair value of all the identifiable net assets other than goodwill from the fair value of the reporting unit and record an impairment loss for the excess, if any, of book value of goodwill over the implied fair value. In 2014, we quantitatively assessed, as of September 28, 2014, the fair value of each of our reporting units using the income approach. The fair value of each reporting unit was found to exceed its respective carrying value, therefore no impairments were recorded.
|
Impairment reviews can involve a complex series of judgments about future events and uncertainties and can rely heavily on estimates and assumptions. For information about the risks associated with estimates and assumptions, see
Estimates and Assumptions.
Software Capitalization and Depreciation
We capitalize certain costs incurred in connection with obtaining or developing internal-use software, including payroll and payroll-related costs for employees who are directly associated with the internal-use software project, external direct costs of materials and services and interest costs while developing the software. Capitalized software costs are included in
Property, plant and equipment
and are amortized using the straight-line method over the estimated useful life of
5
to
10
years. Capitalization of such costs ceases when the project is substantially complete and ready for its intended purpose. Costs incurred during the preliminary project and post-implementation stages, as well as software maintenance and training costs, are expensed in the period in which they are incurred. The company capitalized $
69 million
and $
35 million
of internal-use software for the years ended
December 31, 2014
and
2013
, respectively. Depreciation expense for capitalized software was $
6 million
in
2014
and
$2 million
in both
2013
and
2012
.
Restructuring Charges and Certain Acquisition-Related Costs
We may incur restructuring charges in connection with acquisitions when we implement plans to restructure and integrate the acquired operations or in connection with cost-reduction and productivity initiatives. Included in
Restructuring charges and certain acquisition-related costs
are all restructuring charges and certain costs associated with acquiring and integrating an acquired business. Transaction costs and integration costs are expensed as incurred. Termination costs are a significant component of restructuring charges and are generally recorded when the actions are probable and estimable.
Amounts recorded for restructuring charges and other associated costs can result from a complex series of judgments about future events and uncertainties and can rely heavily on estimates and assumptions. For information about the risks associated with estimates and assumptions, see
Estimates and Assumptions
.
Earnings per Share
Basic earnings per share is computed by dividing net income attributable to Zoetis by the weighted-average number of common shares outstanding during the period. Diluted earnings per share adjusts the weighted-average number of common shares outstanding for the potential dilution that could occur if common stock equivalents (stock options and restricted stock units) were exercised or converted into common stock, calculated using the treasury stock method.
Cash Equivalents
Cash equivalents include items almost as liquid as cash, such as certificates of deposit and time deposits with maturity periods of three months or less when purchased.
75
|
Fair Value
Certain assets and liabilities are required to be measured at fair value, either upon initial recognition or for subsequent accounting or reporting. For example, we use fair value extensively in the initial recognition of net assets acquired in a business combination. Fair value is estimated using an exit price approach, which requires, among other things, that we determine the price that would be received to sell an asset or paid to transfer a liability in an orderly market. The determination of an exit price is considered from the perspective of market participants, considering the highest and best use of assets and, for liabilities, assuming that the risk of non-performance will be the same before and after the transfer.
When estimating fair value, depending on the nature and complexity of the asset or liability, we may use one or all of the following approaches:
|
•
|
Income approach, which is based on the present value of a future stream of net cash flows.
|
|
•
|
Market approach, which is based on market prices and other information from market transactions involving identical or comparable assets or liabilities.
|
|
•
|
Cost approach, which is based on the cost to acquire or construct comparable assets less an allowance for functional and/or economic obsolescence.
|
These fair value methodologies depend on the following types of inputs:
|
•
|
Quoted prices for identical assets or liabilities in active markets (Level 1 inputs).
|
|
•
|
Quoted prices for similar assets or liabilities in active markets or quoted prices for identical or similar assets or liabilities in markets that are not active or are directly or indirectly observable (Level 2 inputs).
|
|
•
|
Unobservable inputs that reflect estimates and assumptions (Level 3 inputs).
|
A single estimate of fair value can result from a complex series of judgments about future events and uncertainties and can rely heavily on estimates and assumptions. For information about the risks associated with estimates and assumptions, see
Estimates and Assumptions
.
Accounts Receivable
The recorded amounts of accounts receivable approximate fair value because of their relatively short-term nature. As of
December 31, 2014
and
2013
,
Accounts receivable, less allowance for doubtful accounts,
of $
980 million
and $
1,138 million
, respectively, includes approximately $
72 million
and $
65 million
of other receivables, such as trade notes receivable and royalty receivables, among others.
Deferred Tax Assets and Liabilities and Income Tax Contingencies
Deferred tax assets and liabilities are recognized for the expected future tax consequences of differences between the financial reporting and tax bases of assets and liabilities using enacted tax rates and laws. We provide a valuation allowance when we believe that our deferred tax assets are not recoverable based on an assessment of estimated future taxable income that incorporates ongoing, prudent and feasible tax planning strategies.
We account for income tax contingencies using a benefit recognition model. If we consider that a tax position is more likely than not to be sustained upon audit, based solely on the technical merits of the position, we recognize the benefit. We measure the benefit by determining the amount that is greater than
50%
likely of being realized upon settlement, presuming that the tax position is examined by the appropriate taxing authority that has full knowledge of all relevant information. Under the benefit recognition model, if the initial assessment fails to result in the recognition of a tax benefit, we regularly monitor our position and subsequently recognize the tax benefit: (i) if there are changes in tax law, analogous case law or there is new information that sufficiently raise the likelihood of prevailing on the technical merits of the position to more likely than not; (ii) if the statute of limitations expires; or (iii) if there is a completion of an audit resulting in a favorable settlement of that tax year with the appropriate agency. We regularly re-evaluate our tax positions based on the results of audits of federal, state and foreign income tax filings, statute of limitations expirations, changes in tax law or receipt of new information that would either increase or decrease the technical merits of a position relative to the “more-likely-than-not” standard. Liabilities associated with uncertain tax positions are classified as current only when we expect to pay cash within the next 12 months. Interest and penalties, if any, are recorded in
Provision for taxes on income
and are classified on our consolidated balance sheet with the related tax liability.
Amounts recorded for valuation allowances and income tax contingencies can result from a complex series of judgments about future events and uncertainties and can rely heavily on estimates and assumptions. For information about the risks associated with estimates and assumptions, see
Estimates and Assumptions.
Benefit Plans
Prior to the Separation from Pfizer, employees who met certain eligibility requirements participated in various defined benefit pension plans and postretirement plans administered and sponsored by Pfizer. Generally, most of our employees were eligible to participate in Pfizer’s pension plans. The combined statements of income for the year ended December 31, 2012, and the pre-Separation period included in the consolidated statement of income for the year ended December 31, 2013, included all of the benefit plan expenses attributable to the animal health operations of Pfizer, including expenses associated with pension plans, postretirement plans and defined contribution plans. The expenses included allocations of direct expenses, as well as expenses that were deemed attributable to the animal health operations. The consolidated balance sheets as of December 31, 2014 and 2013, included the benefit plan assets and liabilities of those plans that were dedicated to animal health employees, as well as the benefit plan assets and liabilities that were transferred to Zoetis from Pfizer as part of the Separation. All dedicated benefit plans are pension plans.
For the dedicated plans, we recognize the overfunded or underfunded status of defined benefit plans as an asset or liability on the consolidated balance sheets and the obligations generally are measured at the actuarial present value of all benefits attributable to employee service rendered, as provided by the applicable benefit formula. Pension obligations may include assumptions such as long-term rate of return on plan assets, expected employee turnover, participant mortality, and future compensation levels. Plan assets are measured at fair value. Net periodic benefit costs are recognized, as required, into
Cost of sales, Selling, general and administrative expenses
and
Research and development expenses
, as appropriate.
76
|
Amounts recorded for benefit plans can result from a complex series of judgments about future events and uncertainties and can rely heavily on estimates and assumptions. For information about the risks associated with estimates and assumptions, see
Estimates and Assumptions.
Asset Retirement Obligations
We record accruals for the legal obligations associated with the retirement of tangible long-lived assets, including obligations under the doctrine of promissory estoppel and those that are conditioned upon the occurrence of future events. These obligations generally result from the acquisition, construction, development and/or normal operation of long-lived assets. We recognize the fair value of these obligations in the period in which they are incurred by increasing the carrying amount of the related asset. Over time, we recognize expense for the accretion of the liability and for the amortization of the asset.
As of
December 31, 2014
and
2013
, accruals for direct asset retirement obligations included in
Other current liabilities
are $
0.1 million
and $
0.1 million
, respectively, and included in
Other noncurrent liabilities
are $
13 million
and $
12 million
, respectively.
Amounts recorded for asset retirement obligations can result from a complex series of judgments about future events and uncertainties and can rely heavily on estimates and assumptions. For information about the risks associated with estimates and assumptions, see
Estimates and Assumptions.
Legal and Environmental Contingencies
We are subject to numerous contingencies arising in the ordinary course of business, such as product liability and other product-related litigation, commercial litigation, patent litigation, environmental claims and proceedings, government investigations and guarantees and indemnifications. We record accruals for these contingencies to the extent that we conclude that a loss is both probable and reasonably estimable. If some amount within a range of loss appears to be a better estimate than any other amount within the range, we accrue that amount. Alternatively, when no amount within a range of loss appears to be a better estimate than any other amount, we accrue the lowest amount in the range. We record anticipated recoveries under existing insurance contracts when recovery is assured.
Amounts recorded for contingencies can result from a complex series of judgments about future events and uncertainties and can rely heavily on estimates and assumptions. For information about the risks associated with estimates and assumptions, see
Estimates and Assumptions.
Share-Based Payments
Our compensation programs can include share-based payment plans. All grants under share-based payment programs are accounted for at fair value and such amounts generally are amortized on a straight-line basis over the vesting term to
Cost of sales, Selling, general and administrative expenses,
and
Research and development expenses
, as appropriate.
Amounts recorded for share-based compensation can result from a complex series of judgments about future events and uncertainties and can rely heavily on estimates and assumptions. For information about the risks associated with estimates and assumptions, see
Estimates and Assumptions
.
Business Unit Equity
Total business unit equity represents Pfizer’s equity investment in Zoetis and the net amounts due to or due from Pfizer. Recorded amounts reflect capital contributions and/or dividends, as well as the results of operations and other comprehensive income/(loss) for periods prior to the IPO.
Reclassifications
Certain reclassifications have been made to prior year data to conform to current year presentation.
5. Acquisitions, Divestitures and Certain Investments
A. Acquisitions
Acquisition of Abbott Animal Health
On November 17, 2014, we announced an agreement to purchase certain animal health assets of Abbott Laboratories (Abbott) for a total purchase price of
$255 million
. Abbott Animal Health, a subsidiary of Abbott, is a companion animal health business focused on the veterinary surgical suite. The purchase expands our companion animal product portfolio to bring veterinarians solutions for anesthesia and treating pain and serious illnesses, such as diabetes. For additional information, see
Note 21. Subsequent Events
.
B. Divestitures
On October 15, 2009, Pfizer acquired all the outstanding equity of Wyeth, including Fort Dodge Animal Health (FDAH). In connection with the regulatory approval process of that acquisition, we were required to divest certain animal health assets. In 2014, and as a result of a government-mandated sale, we sold certain product rights in Argentina and China that were associated with the FDAH acquisition. The proceeds from the sale were approximately
$3 million
, net of transaction costs, and we recognized a
$3 million
gain in
Other (income)/deductions––net
on the sale. In 2013, and as a result of a government-mandated sale, we sold certain product rights acquired from legacy Wyeth in Brazil. The proceeds from the sale were approximately $
6 million
, net of transactions costs, and we recognized a $
6 million
gain in
Other (income)/deductions––net
on the sale.
All of the divestiture transactions required transitional supply and service agreements, including technology transfers, where necessary and appropriate, as well as other customary ancillary agreements.
77
|
C. Certain Investments
Investment in Jilin Zoetis Guoyuan Animal Health Co., Ltd.
In 2011, Pfizer and Jilin Guoyuan Animal Health Company, Ltd. created a new company, Jilin Zoetis Guoyuan Animal Health Co., Ltd. (Jilin), to focus on swine vaccine development and commercialization in China. In exchange for payments of approximately $
14 million
, we acquired a
45%
equity interest in Jilin. We have determined that Jilin is a variable interest entity and that Zoetis is the primary beneficiary of Jilin since Zoetis (i) has the power to direct the activities of Jilin that most significantly impact Jilin’s economic performance, (ii) has the right to appoint the majority of the Board of Directors and (iii) has the obligation to absorb losses of Jilin that could potentially be significant to Jilin and the right to receive benefits from Jilin that could potentially be significant to Jilin. As such, since the formation of Jilin, we have included all of the operating results, assets, liabilities and cash flows of Jilin in our consolidated and combined financial statements. The
55%
interest held by Jilin Guoyuan Animal Health Company is reflected in our consolidated balance sheet as a noncontrolling interest. In connection with this investment, we recorded approximately
$3 million
in
Identifiable intangible assets
, consisting of a manufacturing license and an industrial land-use right in China, and approximately $
10 million
in
Goodwill
.
|
6.
|
Restructuring Charges and Other Costs Associated with Acquisitions and Cost-Reduction/Productivity Initiatives
|
In connection with the cost-reduction/productivity initiatives, we typically incur costs and charges associated with site closings and other facility rationalization actions, workforce reductions and the expansion of shared services, including the development of global systems. In connection with our acquisition activity, we typically incur costs and charges associated with executing the transactions, integrating the acquired operations, which may include expenditures for consulting and the integration of systems and processes, product transfers and restructuring the consolidated company, which may include charges related to employees, assets and activities that will not continue in the consolidated company. All operating functions can be impacted by these actions, including sales and marketing, manufacturing and R&D, as well as functions such as business technology, shared services and corporate operations.
During the year ended December 31, 2014, we recorded restructuring charges of
$12 million
related to employee severance costs in EuAfME and
$6 million
related to employee severance costs in our global manufacturing operations, as a result of initiatives to reduce costs and better align our organizational structure.
In the fourth quarter of 2012, when we were a business unit of Pfizer, we announced a restructuring plan related to our operations in Europe. In connection with these actions, we recorded a pre-tax charge of
$27 million
to recognize employee termination costs. As a result of becoming a standalone public company (no longer being a majority owned subsidiary of Pfizer) and related economic consideration, we revisited this restructuring action and decided to no longer implement this restructuring plan. As such, we reversed the existing reserve of
$27 million
in the second quarter of 2013.
In 2012, we incurred significant costs in connection with Pfizer’s cost-reduction initiatives (several programs initiated since 2005), and the acquisitions of FDAH on
October 15, 2009
, and King Animal Health (KAH) on
January 31, 2011
.
The components of costs incurred in connection with restructuring initiatives, acquisitions and cost-reduction/productivity initiatives follow:
|
Year Ended December 31,
|
||||||||||||
|
(MILLIONS OF DOLLARS)
|
2014
|
|
2013
|
|
2012
|
|
||||||
|
Restructuring charges and certain acquisition-related costs:
|
||||||||||||
|
Integration costs
(a)
|
$
|
8
|
|
$
|
21
|
|
$
|
26
|
|
|||
|
Restructuring charges (benefits)
(b)
:
|
||||||||||||
|
Employee termination costs
|
16
|
|
(23
|
)
|
49
|
|
||||||
|
Accelerated depreciation
|
—
|
|
5
|
|
—
|
|
||||||
|
Asset impairment charges
|
—
|
|
19
|
|
4
|
|
||||||
|
Exit costs
|
1
|
|
4
|
|
(1
|
)
|
||||||
|
Total direct
|
25
|
|
26
|
|
78
|
|
||||||
|
Integration costs
(a)
|
—
|
|
—
|
|
21
|
|
||||||
|
Restructuring charges
(b)
:
|
||||||||||||
|
Employee termination costs
|
—
|
|
—
|
|
19
|
|
||||||
|
Asset impairment charges
|
—
|
|
—
|
|
10
|
|
||||||
|
Exit costs
|
—
|
|
—
|
|
7
|
|
||||||
|
Total allocated
|
—
|
|
—
|
|
57
|
|
||||||
|
Total
Restructuring charges and certain acquisition-related costs
|
25
|
|
26
|
|
135
|
|
||||||
|
Other costs associated with cost-reduction/productivity initiatives:
|
||||||||||||
|
Additional depreciation associated with asset restructuring––direct
(c)
|
1
|
|
1
|
|
11
|
|
||||||
|
Additional depreciation associated with asset restructuring––allocated
(c)
|
—
|
|
2
|
|
13
|
|
||||||
|
Implementation costs––allocated
(d)
|
—
|
|
1
|
|
9
|
|
||||||
|
Total costs associated with restructuring, acquisitions and cost-reduction/productivity initiatives
|
$
|
26
|
|
$
|
30
|
|
$
|
168
|
|
|||
78
|
|
(a)
|
Integration costs represent external, incremental costs directly related to integrating acquired businesses and primarily include expenditures for consulting and the integration of systems and processes, as well as product transfer costs.
|
|
(b)
|
The restructuring charges for the year ended
December 31, 2014
, are primarily related to:
|
•
employee termination costs in EuAfME and in our global manufacturing operations ($
18 million
);
•
a reversal of a previously established reserve as a result of a change in estimate of employee termination costs ($
2 million
benefit); and
•
exit costs related to the exiting of a certain leased manufacturing facility ($
1 million
).
The restructuring charges (benefits) for the year ended
December 31, 2013
, are primarily related to:
•
a reversal of certain employee termination costs associated with our operations in Europe (
$27 million
benefit);
•
asset impairment charges related to one of our manufacturing facilities ($
17 million
); and
|
•
|
restructuring charges related to the exiting of certain leased manufacturing and research facilities consisting of employee termination expenses ($
2 million
), exit costs ($
4 million
), and accelerated depreciation ($
5 million
).
|
The direct restructuring charges (benefits) are associated with the following:
|
•
|
For the year ended
December 31, 2014
––EuAfME (
$12 million
) and manufacturing/research/corporate (
$5 million
).
|
|
•
|
For the year ended
December 31, 2013
—EuAfME (
$4 million
), CLAR (
$4 million
) and manufacturing/research/corporate (
$3 million
income).
|
|
•
|
For the year ended December 31, 2012––EuAfME (
$51 million
), CLAR (
$3 million
), APAC (
$1 million
income) and manufacturing/research/corporate (
$1 million
income).
|
|
(c)
|
Additional depreciation associated with asset restructuring represents the impact of changes in the estimated lives of assets involved in restructuring actions. In 2014, included in
Research and development expenses
. In 2013, included in
Cost of sales
($
1 million
) and
Selling, general and administrative expenses
($
2 million
). In 2012, included in
Cost of sales
(
$10 million
),
Selling, general and administrative expenses
(
$5 million
) and
Research and development expenses
(
$9 million
).
|
|
(d)
|
Implementation costs—allocated represent external, incremental costs directly related to implementing cost reduction/productivity initiatives, and primarily include expenditures related to system and process standardization and the expansion of shared services. Included in
Selling, general and administrative expenses
.
|
The components of and changes in our direct restructuring accruals follow:
|
Employee
|
|
Asset
|
|
|||||||||||||||||
|
Termination
|
|
Impairment
|
|
Accelerated
|
|
Exit
|
|
|||||||||||||
|
(MILLIONS OF DOLLARS)
|
Costs
|
|
Charges
|
|
Depreciation
|
|
Costs
|
|
Accrual
|
|
||||||||||
|
Balance, December 31, 2011
|
$
|
70
|
|
$
|
—
|
|
$
|
—
|
|
$
|
11
|
|
$
|
81
|
|
|||||
|
Provision/(Benefit)
|
49
|
|
4
|
|
—
|
|
(1
|
)
|
52
|
|
||||||||||
|
Utilization and other
(a)
|
(51
|
)
|
(4
|
)
|
—
|
|
(4
|
)
|
(59
|
)
|
||||||||||
|
Balance, December 31, 2012
|
68
|
|
—
|
|
—
|
|
6
|
|
74
|
|
||||||||||
|
Provision/(Benefit)
|
(23
|
)
|
19
|
|
5
|
|
4
|
|
5
|
|
||||||||||
|
Utilization and other
(a)
|
(16
|
)
|
—
|
|
—
|
|
(4
|
)
|
(20
|
)
|
||||||||||
|
Non-cash activity
|
—
|
|
(19
|
)
|
(5
|
)
|
—
|
|
(24
|
)
|
||||||||||
|
Separation adjustment
(b)
|
(14
|
)
|
—
|
|
—
|
|
—
|
|
(14
|
)
|
||||||||||
|
Balance, December 31, 2013
(c)
|
15
|
|
—
|
|
—
|
|
6
|
|
21
|
|
||||||||||
|
Provision/(Benefit)
|
16
|
|
—
|
|
—
|
|
1
|
|
17
|
|
||||||||||
|
Utilization and other
(a)
|
(13
|
)
|
—
|
|
(6
|
)
|
(19
|
)
|
||||||||||||
|
Balance, December 31, 2014
(c)
|
$
|
18
|
|
$
|
—
|
|
$
|
—
|
|
$
|
1
|
|
$
|
19
|
|
|||||
|
(a)
|
Includes adjustments for foreign currency translation.
|
|
(b)
|
See
Note 2B. The Separation, Adjustments Associated with the Separation, Senior Notes Offering, Initial Public Offering and Exchange Offer
—
Adjustments Associated with the Separation.
|
|
(c)
|
At
December 31, 2014
and 2013, included in
Other current liabilities
(
$13 million
for both years) and
Other noncurrent liabilities
(
$6 million
and $
8 million
, respectively).
|
|
7.
|
Other (Income)/Deductions—Net
|
The components of
Other (income)/deductions—net
follow:
|
Year Ended December 31,
|
||||||||||||
|
(MILLIONS OF DOLLARS)
|
2014
|
|
2013
|
|
2012
|
|
||||||
|
Royalty-related income
|
$
|
(32
|
)
|
$
|
(23
|
)
|
$
|
(32
|
)
|
|||
|
Identifiable intangible asset impairment charges
(a)
|
7
|
|
1
|
|
5
|
|
||||||
|
Net gain on sale of assets
(b)
|
(9
|
)
|
(6
|
)
|
—
|
|
||||||
|
Certain legal matters, net
(c)
|
10
|
|
1
|
|
(19
|
)
|
||||||
|
Foreign currency (gain)/loss
(d)
|
28
|
|
20
|
|
—
|
|
||||||
|
Other, net
(e)
|
3
|
|
(2
|
)
|
—
|
|
||||||
|
Other (income)/deductions—net
|
$
|
7
|
|
$
|
(9
|
)
|
$
|
(46
|
)
|
|||
|
(a)
|
In 2014, the intangible asset impairment charges primarily include (i) approximately $
6 million
related to the impairment of IPR&D assets related to a pharmaceutical product for dogs acquired with the FDAH acquisition in 2009, as a result of the termination of the development program due to a re-assessment of economic viability; and (ii) approximately $
1 million
related to finite-lived developed technology rights and IPR&D due to negative market conditions and the re-assessment of economic viability. In 2012, the intangible asset impairment charges include (i) approximately $
2 million
of finite-lived companion animal developed technology rights; (ii) approximately $
1 million
of finite-lived trademarks related to genetic testing services; and (iii) approximately $
2 million
of finite-lived patents related to poultry technology. The asset impairment charges for 2012 reflect, among other things, loss of revenue as a result of negative market conditions and, with respect to the poultry technology, a re-assessment of economic viability.
|
79
|
|
(b)
|
In 2014, represents the net gain on sale of land in our Taiwan joint venture of $
6 million
and the net gain on the government-mandated sale of certain product rights in Argentina and China that were associated with the FDAH acquisition in 2009 of $
3 million
. In 2013, represents the net gain on the government-mandated sale of certain product rights in Brazil that were acquired with the FDAH acquisition in
2009
.
|
|
(c)
|
In July 2014, we reached a commercial settlement with several large poultry customers in Mexico associated with specific lots of a Zoetis poultry vaccine. Although there have been no quality or efficacy issues with the manufacturing of this vaccine, certain shipments from several lots in Mexico may have experienced an issue in storage with a third party in Mexico that could have impacted their efficacy. We issued a recall of these lots in July 2014 and the product is currently unavailable in Mexico. For 2014, includes a
$13 million
charge recorded in the second quarter of 2014, which was partially offset by a $
1 million
insurance recovery recorded in the third quarter of 2014, related to the commercial settlement in Mexico. We do not expect any significant additional charges related to this issue. For 2014, also includes an insurance recovery of other litigation-related charges of $
2 million
. For 2012, represents income from a favorable legal settlement related to an intellectual property matter ($
14 million
) and a change in estimate for an environmental-related reserve due to a favorable settlement ($
7 million
income) partially offset by litigation-related charges ($
2 million
).
|
|
(d)
|
For 2014, primarily represents costs related to hedging and exposures to certain emerging market currencies, as well as losses related to the depreciation of the Argentine peso in the first quarter of 2014. For 2013, includes a foreign currency loss of $
9 million
incurred in the first quarter of 2013 related to the Venezuela currency devaluation in February 2013 and other foreign currency losses in the fourth quarter of 2013 primarily related to Argentina.
|
|
(e)
|
Includes interest income and other miscellaneous income and charges. For 2014, also includes a pension plan settlement charge related to the sale of a manufacturing plant of
$4 million
.
|
|
8.
|
Tax Matters
|
A. Taxes on Income
As of the Separation date, we operate under a new standalone legal entity structure. In connection with the Separation, adjustments have been made to the income tax accounts. See
Note 2B. The Separation, Adjustments Associated with the Separation, Senior Notes Offering, Initial Public Offering and Exchange Offer
—
Adjustments Associated with the Separation.
For the periods prior to the Separation presented in the combined financial statements, Zoetis did not generally file separate tax returns since Zoetis was generally included in the tax grouping of other Pfizer entities within the respective entity’s tax jurisdiction. The income tax provision included in these combined financial statements has been calculated using the separate return basis, as if Zoetis filed a separate tax return.
The components of
Income before provision for taxes on income
follow:
|
Year Ended December 31,
|
||||||||||||
|
(MILLIONS OF DOLLARS)
|
2014
|
|
2013
|
|
2012
|
|
||||||
|
United States
|
$
|
455
|
|
$
|
238
|
|
$
|
340
|
|
|||
|
International
|
365
|
|
452
|
|
370
|
|
||||||
|
Income before provision for taxes on income
(a)(b)
|
$
|
820
|
|
$
|
690
|
|
$
|
710
|
|
|||
The components of
Provision for taxes on income
based on the location of the taxing authorities follow:
|
Year Ended December 31,
|
||||||||||||
|
(MILLIONS OF DOLLARS)
|
2014
|
|
2013
|
|
2012
|
|
||||||
|
United States:
|
||||||||||||
|
Current income taxes:
|
||||||||||||
|
Federal
|
$
|
179
|
|
$
|
63
|
|
$
|
132
|
|
|||
|
State and local
|
13
|
|
12
|
|
5
|
|
||||||
|
Deferred income taxes:
|
||||||||||||
|
Federal
|
(14
|
)
|
10
|
|
(7
|
)
|
||||||
|
State and local
|
(3
|
)
|
2
|
|
11
|
|
||||||
|
Total U.S. tax provision
|
175
|
|
87
|
|
141
|
|
||||||
|
International:
|
||||||||||||
|
Current income taxes
|
90
|
|
89
|
|
211
|
|
||||||
|
Deferred income taxes
|
(32
|
)
|
11
|
|
(78
|
)
|
||||||
|
Total international tax provision
|
58
|
|
100
|
|
133
|
|
||||||
|
Provision for taxes on income
(a)(b)(c)
|
$
|
233
|
|
$
|
187
|
|
$
|
274
|
|
|||
|
(a)
|
In 2014
,
the
Provision for taxes on income
reflects the following:
|
|
•
|
U.S. tax expense of approximately $
2 million
as a result of providing U.S. deferred income taxes on certain current-year income earned outside the United States that will not be indefinitely reinvested overseas (see
C. Deferred Taxes
);
|
|
•
|
U.S. tax benefit related to U.S. Research and Development Tax Credit which was extended on December 19, 2014, and the U.S. Domestic Production Activities deduction;
|
|
•
|
Tax benefit related to the changes in valuation allowances and the resolution of other tax items;
|
|
•
|
Tax expense related to an $
8 million
discrete tax item during the first quarter of 2014 related to an intercompany inventory adjustment; and
|
|
•
|
Tax cost related to changes in uncertain tax positions (see
D. Tax Contingencies).
|
|
(b)
|
In 2013, the
Provision for taxes on income
reflects the following:
|
|
•
|
U.S. tax expense of approximately $
3 million
as a result of providing U.S. deferred income taxes on certain current-year income earned outside the United States that will not be indefinitely reinvested overseas (see
C. Deferred Taxes
);
|
|
•
|
U.S. tax benefit related to U.S. Research and Development Tax Credit which was retroactively extended on January 3, 2013, and the U.S. Domestic Production Activities deduction;
|
80
|
|
•
|
Tax expense of approximately $
25 million
related to the establishment of valuation allowance; and
|
|
•
|
Tax cost related to changes in uncertain tax positions (see
D. Tax Contingencies).
|
|
(c)
|
In 2012, the
Provision for taxes on income
reflects the following:
|
|
•
|
U.S. tax benefits of approximately $
29.3 million
, representing tax and interest, resulting from a multi-year settlement with the U.S. Internal Revenue Service with respect to audits for the years 2006 through 2008, and international tax benefits of approximately $
2.7 million
, representing tax and interest, resulting from the resolution of certain tax positions pertaining to prior years with various foreign tax authorities and from the expiration of certain statutes of limitations;
|
|
•
|
U.S. tax expense of approximately $
9 million
as a result of providing U.S. deferred income taxes on certain current-year income earned outside the United States that will not be indefinitely reinvested overseas (see
C. Deferred Taxes)
;
|
|
•
|
The expiration of the U.S. Research and Development Tax Credit on December 31, 2011; and
|
|
•
|
Tax cost related to changes in uncertain tax positions (see
D. Tax Contingencies
)
.
|
Tax Rate Reconciliation
The reconciliation of the U.S. statutory income tax rate to our effective tax rate follows:
|
Year Ended December 31,
|
|||||||||
|
2014
|
|
2013
|
|
2012
|
|
||||
|
U.S. statutory income tax rate
|
35.0
|
%
|
35.0
|
%
|
35.0
|
%
|
|||
|
State and local taxes, net of federal benefits
|
0.4
|
|
1.0
|
|
1.7
|
|
|||
|
Taxation of non-U.S. operations
(a)(b)
|
(8.9
|
)
|
(6.7
|
)
|
5.6
|
|
|||
|
Unrecognized tax benefits and tax settlements and resolution of certain tax positions
(c)
|
1.0
|
|
1.1
|
|
(4.1
|
)
|
|||
|
U.S. healthcare legislation
(d)
|
—
|
|
—
|
|
(0.4
|
)
|
|||
|
U.S. Research and Development Tax Credit and U.S. Domestic Production Activities deduction
(e)
|
(1.5
|
)
|
(1.2
|
)
|
(0.3
|
)
|
|||
|
Non-deductible / non-taxable items
(f)
|
0.5
|
|
0.5
|
|
0.8
|
|
|||
|
All other—net
|
1.9
|
|
(2.6
|
)
|
0.3
|
|
|||
|
Effective tax rate
|
28.4
|
%
|
27.1
|
%
|
38.6
|
%
|
|||
|
(a)
|
The rate impact of taxation of non-U.S. operations was a decrease to our effective tax rate in 2014 and 2013 due to (i) the jurisdictional mix of earnings as tax rates outside the United States are generally lower than the U.S. statutory income tax rate; and (ii) incentive tax rulings in Belgium effective December 1, 2012, and in Singapore effective October 29, 2012. The rate impact of taxation of non-U.S. operations was an increase to our effective tax rate in 2012 due to (i) the cost of repatriation decisions and other U.S. tax implications that more than offset the impact of the generally lower tax rates outside the United States; (ii) the tax impact of non-deductible items in those jurisdictions; and (iii) the tax impact of changes in uncertain tax positions related to our non-U.S. operations.
|
|
(b)
|
In 2014 and 2013, the impact to the rate due to increases in uncertain tax positions was more than offset by the jurisdictional mix of earnings and other U.S. tax implications of our foreign operations described in the above footnotes. The increase in the rate in 2012 is primarily due to increases in uncertain tax positions (see
D. Tax Contingencies
, for current and prior period increases to uncertain tax positions), of which a significant portion relates to our non-U.S. operations.
|
|
(c)
|
For a discussion about unrecognized tax benefits and tax settlements and resolution of certain tax positions, see
A. Taxes on Income
and
D. Tax Contingencies
.
|
|
(d)
|
The decrease in the rate in 2012 primarily relates to the tax benefit recorded in connection with the establishment of deferred income tax assets related to the Medicare Part D subsidy for retiree prescription drug coverage.
|
|
(e)
|
In 2014 and 2013, the decrease in the rate was due to the benefit associated with the U.S. Research and Development Tax Credit. In 2012, no benefit from the U.S. Research and Development Tax Credit was reflected as the credit expired on December 31, 2011, and was not extended until January 2013. In all years, we received a benefit from the U.S. Domestic Production Activities deduction.
|
|
(f)
|
Non-deductible items include meals and entertainment expenses.
|
|
B.
|
Tax Matters Agreement
|
In connection with the Separation, we entered into a tax matters agreement with Pfizer that governs the parties' respective rights, responsibilities and obligations with respect to tax liabilities and benefits, tax attributes, the preparation and filing of tax returns, the control of audits and other tax proceedings and other matters regarding taxes. For additional information, see below and
Note 19B. Transactions and Agreements with Pfizer
—
Agreements with Pfizer.
In connection with this agreement and the Separation, the activity in our income tax accounts reflects Separation Adjustments, including significant adjustments to the deferred income tax asset and liability accounts and the tax liabilities associated with uncertain tax positions. For additional information, see below and
Note 2B. The Separation, Adjustments Associated with the Separation, Senior Notes Offering, Initial Public Offering and Exchange Offer
—
Adjustments Associated with the Separation.
In general, under the agreement:
|
•
|
Pfizer will be responsible for any U.S. federal, state, local or foreign income taxes and any U.S. state or local non-income taxes (and any related interest, penalties or audit adjustments and including those taxes attributable to our business) reportable on a consolidated, combined or unitary return that includes Pfizer or any of its subsidiaries (and us and/or any of our subsidiaries) for any periods or portions thereof ending on or prior to December 31, 2012. We will be responsible for the portion of any such taxes for periods or portions thereof beginning on or after January 1, 2013, as would be applicable to us if we filed the relevant tax returns on a standalone basis.
|
|
•
|
We will be responsible for any U.S. federal, state, local or foreign income taxes and any U.S. state or local non-income taxes (and any related interest, penalties or audit adjustments) that are reportable on returns that include only us and/or any of our subsidiaries, for all tax periods whether before or after the completion of the Separation.
|
|
•
|
Pfizer will be responsible for certain specified foreign taxes directly resulting from certain aspects of the Separation.
|
81
|
We will not generally be entitled to receive payment from Pfizer in respect of any of our tax attributes or tax benefits or any reduction of taxes of Pfizer. Neither party's obligations under the agreement will be limited in amount or subject to any cap. The agreement also assigns responsibilities for administrative matters, such as the filing of returns, payment of taxes due, retention of records and conduct of audits, examinations or similar proceedings. In addition, the agreement provides for cooperation and information sharing with respect to tax matters.
Pfizer is primarily responsible for preparing and filing any tax return with respect to the Pfizer affiliated group for U.S. federal income tax purposes and with respect to any consolidated, combined, unitary or similar group for U.S. state or local or foreign income tax purposes or U.S. state or local non-income tax purposes that includes Pfizer or any of its subsidiaries, including those that also include us and/or any of our subsidiaries. We are generally not responsible for preparing and filing any tax returns that include only us and/or any of our subsidiaries.
The party responsible for preparing and filing a given tax return will generally have exclusive authority to control tax contests related to any such tax return.
C. Deferred Taxes
Deferred taxes arise as a result of basis differentials between financial statement accounting and tax amounts.
The components of our deferred tax assets and liabilities follow:
|
As of December 31,
|
||||||||
|
2014
|
2013
|
|||||||
|
(MILLIONS OF DOLLARS)
|
Assets (Liabilities)
|
|||||||
|
Prepaid/deferred items
|
$
|
56
|
|
$
|
59
|
|
||
|
Inventories
|
25
|
|
29
|
|
||||
|
Intangibles
|
(98
|
)
|
(111
|
)
|
||||
|
Property, plant and equipment
|
(89
|
)
|
(92
|
)
|
||||
|
Employee benefits
|
19
|
|
11
|
|
||||
|
Restructuring and other charges
|
5
|
|
4
|
|
||||
|
Legal and product liability reserves
|
19
|
|
13
|
|
||||
|
Net operating loss/credit carryforwards
|
65
|
|
51
|
|
||||
|
Unremitted earnings
|
(5
|
)
|
(3
|
)
|
||||
|
All other
|
(3
|
)
|
(10
|
)
|
||||
|
Subtotal
|
(6
|
)
|
(49
|
)
|
||||
|
Valuation allowance
|
(119
|
)
|
(128
|
)
|
||||
|
Net deferred tax liability
(a)(b)
|
$
|
(125
|
)
|
$
|
(177
|
)
|
||
|
(a)
|
The decrease in the total net deferred tax liability from December 31, 2013, to December 31, 2014, is primarily attributable to an increase in deferred tax assets related to net operating loss/credit carryforwards and other prepaid/deferred items, partially offset by a decrease in valuation allowances representing the amounts determined to be unrecoverable.
|
|
(b)
|
In 2014, included in
Current deferred tax assets
($
109 million
),
Noncurrent deferred tax assets
($
54 million
),
Other current liabilities
($
11 million
) and
Noncurrent deferred tax liabilities
($
277 million
). In 2013, included in
Current deferred tax assets
($
97 million
),
Noncurrent deferred tax assets
($
63 million
),
Other current liabilities
($
15 million
) and
Noncurrent deferred tax liabilities
($
322 million
).
|
We have carryforwards, primarily related to net operating losses, which are available to reduce future foreign and U.S. state income taxes payable with either an indefinite life or expiring at various times from 2015 to 2034.
Valuation allowances are provided when we believe that our deferred tax assets are not recoverable based on an assessment of estimated future taxable income that incorporates ongoing, prudent and feasible tax planning strategies. On the basis of this evaluation, as of December 31, 2014, a valuation allowance of $
119 million
has been recorded to record only the portion of the deferred tax asset that is more likely than not to be realized. The amount of the deferred tax asset considered realizable, however, could be adjusted if estimates of future taxable income during the carryforward period are reduced or increased or if objective negative evidence in the form of cumulative losses is no longer present and additional weight may be given to subjective evidence such as projections for growth.
In general, it is our practice and intention to permanently reinvest the majority of the earnings of the company’s non U.S. subsidiaries. As of December 31, 2014, the cumulative amount of such undistributed earnings was $
1.4 billion
, for which we have not provided U.S. federal income and foreign withholding taxes. As these earnings are intended to be indefinitely reinvested overseas, as of December 31, 2014, we cannot predict the time or manner of such potential repatriation. As such, it is not practicable to estimate the amount of the deferred tax liability associated with these unremitted earnings due to the complexity of its hypothetical calculation.
D. Tax Contingencies
We are subject to income tax in many jurisdictions, and a certain degree of estimation is required in recording the assets and liabilities related to income taxes. All of our tax positions are subject to audit by the local taxing authorities in each tax jurisdiction. These tax audits can involve complex issues, interpretations and judgments
and the resolution of matters may span multiple years, particularly if subject to negotiation or litigation. Our assessments are based on estimates and assumptions that have been deemed reasonable by management, but our estimates of unrecognized tax benefits and potential tax benefits may not be representative of actual outcomes, and variation from such estimates could materially affect our financial statements in the period of settlement or when the statute of limitations expire. We treat these events as discrete items in the period of resolution.
82
|
For a
description of our accounting policies associated with accounting for income tax contingencies, see
Note 4. Significant Accounting Policies—Deferred Tax Assets and Liabilities and Income Tax Contingencies.
For a description of the risks associated with estimates and assumptions, see
Note 4. Significant Accounting Policies—Estimates and Assumptions.
Uncertain Tax Positions
As tax law is complex and often subject to varied interpretations, it is uncertain whether some of our tax positions will be sustained upon audit. As of December 31, 2014 and 2013, we had approximately
$54 million
and
$44 million
, respectively, in net liabilities associated with uncertain tax positions, excluding associated interest:
|
•
|
Tax assets associated with uncertain tax positions primarily represent our estimate of the potential tax benefits in one tax jurisdiction that could result from the payment of income taxes in another tax jurisdiction. These potential benefits generally result from cooperative efforts among taxing authorities, as required by tax treaties to minimize double taxation, commonly referred to as the competent authority process. The recoverability of these assets, which we believe to be more likely than not, is dependent upon the actual payment of taxes in one tax jurisdiction and, in some cases, the successful petition for recovery in another tax jurisdiction. As of December 31, 2014 and 2013, we had approximately $
1 million
and $
1 million
, respectively, in assets associated with uncertain tax positions recorded in
Other noncurrent assets
.
|
|
•
|
Tax liabilities associated with uncertain tax positions represent unrecognized tax benefits, which arise when the estimated benefit recorded in our financial statements differs from the amounts taken or expected to be taken in a tax return because of the uncertainties described above. These unrecognized tax benefits relate primarily to issues common among multinational corporations. Substantially all of these unrecognized tax benefits, if recognized, would impact our effective income tax rate.
|
The reconciliation of the beginning and ending amounts of gross unrecognized tax benefits follows:
|
(MILLIONS OF DOLLARS)
|
2014
|
|
2013
|
|
2012
|
|
||||||
|
Balance, January 1
|
$
|
(45
|
)
|
$
|
(144
|
)
|
$
|
(114
|
)
|
|||
|
Adjustments associated with the Separation
(a)
|
—
|
|
115
|
|
—
|
|
||||||
|
Increases based on tax positions taken during a prior period
(b)
|
(1
|
)
|
(2
|
)
|
(2
|
)
|
||||||
|
Decreases based on tax positions taken during a prior period
(b)(c)
|
6
|
|
—
|
|
40
|
|
||||||
|
Decreases based on cash payments for a prior period
|
—
|
|
1
|
|
3
|
|
||||||
|
Increases based on tax positions taken during the current period
(b)
|
(15
|
)
|
(16
|
)
|
(73
|
)
|
||||||
|
Lapse in statute of limitations
|
1
|
|
1
|
|
2
|
|
||||||
|
Balance, December 31
(d)
|
$
|
(54
|
)
|
$
|
(45
|
)
|
$
|
(144
|
)
|
|||
|
(a)
|
The significant decrease in the total gross unrecognized tax benefits from December 31, 2012, to December 31, 2013, is primarily attributable to the elimination of net tax liabilities associated with uncertain tax positions that were retained by Pfizer. See
Note 2B. The Separation, Adjustments Associated with the Separation, Senior Notes Offering, Initial Public Offering and Exchange Offer— Adjustments Associated with the Separation.
|
|
(b)
|
Primarily included in
Provision for taxes on income.
|
|
(c)
|
In 2014, the decreases are primarily related to movements in foreign translation adjustments on prior year positions and effective settlement of certain issues with the U.S. tax authorities. In 2012, the decreases are primarily a result of effectively settling certain issues with the U.S. and non-U.S. tax authorities. See
A. Tax Matters—Taxes on Income.
|
|
(d)
|
In 2014, included in
Noncurrent deferred tax assets
($
6 million
) and
Other taxes payable
($
48 million
). In 2013, included in
Noncurrent deferred tax assets
($
6 million
) and
Other taxes payable
($
39 million
).
|
|
•
|
Interest related to our unrecognized tax benefits is recorded in accordance with the laws of each jurisdiction and is recorded in
Provision for taxes on income
in our consolidated and combined statements of income. In 2014, we recorded a net interest expense of $
1 million
; in 2013, we recorded a net interest expense of $
3 million
; and in 2012, we recorded a net interest expense of
$1 million
. Gross accrued interest totaled $
4 million
and $
11 million
as of December 31, 2014 and 2013, respectively, and were included in
Other taxes payable
. Accrued penalties are not significant.
|
Status of Tax Audits and Potential Impact on Accruals for Uncertain Tax Positions
We are subject to taxation in the United States including various states, and foreign jurisdictions. The United States is one of our major tax jurisdictions. For U.S. Federal and state tax purposes, the tax years 2013 and 2014 are open for examination (see
B. Tax Matters Agreement
for years prior to 2013).
In addition to the open audit years in the United States, we have open audit years in other major foreign tax jurisdictions, such as Canada (2010-2014), Asia-Pacific (2011-2014 primarily reflecting Australia
,
Japan, and New Zealand), Europe (2012-2014, primarily reflecting the United Kingdom, France and Germany) and Latin America (2005-2014, primarily reflecting Brazil and Mexico).
Any settlements or statute of limitations expirations could result in a significant decrease in our uncertain tax positions. We do not expect that within the next twelve months any of our gross unrecognized tax benefits, exclusive of interest, could significantly decrease as a result of settlements with taxing authorities or the expiration of the statutes of limitations. Our assessments are based on estimates and assumptions that have been deemed reasonable by management, but our estimates of unrecognized tax benefits and potential tax benefits may not be representative of actual outcomes, and any variation from such estimates could materially affect our financial statements in the period of settlement or when the statutes of limitations expire, as we treat these events as discrete items in the period of resolution. Finalizing audits with the relevant taxing authorities can include formal administrative and legal proceedings, and, as a result, it is difficult to estimate the timing and range of possible change related to our uncertain tax positions, and such changes could be significant.
83
|
|
9.
|
Financial Instruments
|
|
A.
|
Debt
|
Credit Facilities
In
December 2012
, we entered into a revolving credit agreement with a syndicate of banks providing for a
five
-year
$1.0 billion
senior unsecured revolving credit facility (the credit facility), which became effective in February 2013 upon the completion of the IPO and expires in December 2017. Subject to certain conditions, we have the right to increase the credit facility to up to
$1.5 billion
. The credit facility contains a financial covenant requiring us to not exceed a maximum total leverage ratio (the ratio of consolidated net debt as of the end of the period to consolidated Earnings Before Interest, Income Taxes, Depreciation and Amortization (EBITDA) for such period) of
4.35:1
for fiscal year 2013,
3.95:1
for fiscal year 2014,
3.50:1
for fiscal year 2015 and
3.00:1
thereafter. The credit facility also contains a financial covenant requiring that we maintain a minimum interest coverage ratio (the ratio of EBITDA at the end of the period to interest expense for such period) of
3.50:1
. In addition, the credit facility contains other customary covenants. We were in compliance with all financial covenants as of December 31, 2014. There were
no
borrowings outstanding as of both December 31, 2014 and 2013.
We have additional lines of credit and other credit arrangements with a group of banks and other financial intermediaries for general corporate purposes. We maintain cash and cash equivalent balances in excess of our outstanding short-term borrowings. As of
December 31, 2014
, we had access to
$74 million
of lines of credit which expire at various times through 2016. As of
December 31, 2014
, we had
$7 million
of short-term borrowings outstanding and $
3 million
of long-term borrowings outstanding related to these facilities. As of
December 31, 2013
, we had
$15 million
of short-term borrowings outstanding and $
2 million
of long-term borrowings outstanding related to these facilities.
Commercial Paper Program
In
February 2013
, we entered into a commercial paper program with a capacity of up to
$1.0 billion
. As of
December 31, 2014
and 2013,
no
commercial paper was issued under this program.
Short-Term Borrowings
There were short-term borrowings of
$7 million
as of
December 31, 2014
, and
$15 million
as of
December 31, 2013
(see
A. Credit Facilities
). The weighted-average interest rate on short-term borrowings outstanding was
7.8%
and
5.7%
as of
December 31, 2014
and
December 31, 2013
, respectively.
Senior Notes Offering and Other Long-Term Debt
On
January 28, 2013
, we issued
$3.65 billion
aggregate principal amount of our senior notes (the senior notes offering) in a private placement, with an original issue discount of
$10 million
. The senior notes are comprised of
$400 million
aggregate principal amount of our
1.150%
senior notes due 2016,
$750 million
aggregate principal amount of our
1.875%
senior notes due 2018,
$1.35 billion
aggregate principal amount of our
3.250%
senior notes due 2023 and
$1.15 billion
aggregate principal amount of our
4.700%
senior notes due 2043.
We sold
$2.65 billion
aggregate principal amount of our senior notes through the initial purchasers in the senior notes offering and Pfizer transferred
$1.0 billion
aggregate principal amount of our senior notes to certain of the initial purchasers, who sold such senior notes in the senior notes offering.
The senior notes are governed by an indenture and supplemental indenture (collectively, the indenture) between us and Deutsche Bank Trust Company Americas, as trustee. The indenture contains certain covenants, including limitations on our and certain of our subsidiaries' ability to incur liens or engage in sale-leaseback transactions. The indenture also contains restrictions on our ability to consolidate, merge or sell substantially all of our assets. In addition, the indenture contains other customary terms, including certain events of default, upon the occurrence of which the senior notes may be declared immediately due and payable.
Pursuant to the indenture, we are able to redeem the senior notes, in whole or in part, at any time by paying a make whole premium, plus accrued and unpaid interest to, but excluding, the date of redemption. Pursuant to our tax matters agreement with Pfizer, we will not be permitted to redeem the
2023
notes pursuant to this optional redemption provision, except under limited circumstances. Upon the occurrence of a change of control of us and a downgrade of the senior notes below an investment grade rating by each of Moody's Investors Service, Inc. and Standard & Poor's Ratings Services, we are, in certain circumstances, required to make an offer to repurchase all of the outstanding senior notes at a price equal to
101%
of the aggregate principal amount of the senior notes together with accrued and unpaid interest to, but excluding, the date of repurchase.
In connection with the senior notes offering, we entered into a registration rights agreement (Registration Rights Agreement) with the representatives of the initial purchasers of the senior notes. Pursuant to the terms of the Registration Rights Agreement, we were obligated, among other things, to use our commercially reasonable efforts to file a registration statement with the Securities and Exchange Commission (SEC) enabling holders of the senior notes to exchange the privately placed notes for publicly registered notes with substantially the same terms. We filed the registration statement with the SEC on September 13, 2013, the SEC declared the registration statement effective on September 24, 2013, and the exchange offer was completed on October 31, 2013.
84
|
The components of our long-term debt follow:
|
December 31,
|
|
December 31,
|
|
|||||
|
(MILLIONS OF DOLLARS)
|
2014
|
|
2013
|
|
||||
|
Lines of credit, due 2016-2018
|
$
|
3
|
|
$
|
2
|
|
||
|
1.150% Senior Notes due 2016
|
400
|
|
400
|
|
||||
|
1.875% Senior Notes due 2018
|
750
|
|
750
|
|
||||
|
3.250% Senior Notes due 2023
|
1,350
|
|
1,350
|
|
||||
|
4.700% Senior Notes due 2043
|
1,150
|
|
1,150
|
|
||||
|
3,653
|
|
3,652
|
|
|||||
|
Unamortized debt discount
|
(10
|
)
|
(10
|
)
|
||||
|
Long-term debt / Allocated long-term debt
|
$
|
3,643
|
|
$
|
3,642
|
|
||
The fair value of our long-term debt was
$3,690 million
and
$3,526 million
as of
December 31, 2014
, and
December 31, 2013
, respectively, and has been determined using a third-party matrix-pricing model that uses significant inputs derived from or corroborated by observable market data and Zoetis’ credit rating (Level 2 inputs). See
Note 4. Significant Accounting Policies— Fair Value.
The principal amount of long-term debt outstanding as of
December 31, 2014
, matures in the following years:
|
After
|
|
|||||||||||||||||||||||
|
(MILLIONS OF DOLLARS)
|
2015
|
|
2016
|
|
2017
|
|
2018
|
|
2018
|
|
Total
|
|
||||||||||||
|
Maturities
|
$
|
—
|
|
$
|
401
|
|
$
|
1
|
|
$
|
751
|
|
$
|
2,500
|
|
$
|
3,653
|
|
||||||
Interest Expense
Interest expense, net of capitalized interest, was $
117 million
for 2014, $
113 million
for 2013 and $
31 million
for 2012. Capitalized interest expense was $
4 million
and
$3 million
for the years ended
December 31, 2014
and 2013, respectively. We did not have capitalized interest expense for the year ended December 31, 2012.
|
B.
|
Derivative Financial Instruments
|
Foreign Exchange Risk
A significant portion of our revenue, earnings and net investment in foreign affiliates is exposed to changes in foreign exchange rates. We seek to manage our foreign exchange risk, in part, through operational means, including managing same-currency revenue in relation to same-currency costs and same-currency assets in relation to same-currency liabilities. Depending on market conditions, foreign exchange risk is also managed through the use of derivative financial instruments. These financial instruments serve to protect net income against the impact of the translation into U.S. dollars of certain foreign exchange-denominated transactions. The aggregate notional amount of foreign exchange derivative financial instruments offsetting foreign currency exposures was
$1.1 billion
and
$1.4 billion
as of
December 31, 2014
, and
December 31, 2013
, respectively. The derivative financial instruments primarily offset exposures in the euro, the Brazilian real and the Australian dollar. The vast majority of the foreign exchange derivative financial instruments mature within
60
days and all mature within
180
days.
All derivative contracts used to manage foreign currency risk are measured at fair value and are reported as assets or liabilities on the consolidated balance sheet. The company has not designated the foreign currency forward-exchange contracts as hedging instruments. We recognize the gains and losses on forward-exchange contracts that are used to offset the same foreign currency assets or liabilities immediately into earnings along with the earnings impact of the items they generally offset. These contracts essentially take the opposite currency position of that reflected in the month-end balance sheet to counterbalance the effect of any currency movement.
Fair Value of Derivative Instruments
The location and fair values of derivative instruments not designated as hedging instruments are as follows:
|
December 31,
|
|
December 31,
|
|
||||
|
(MILLIONS OF DOLLARS)
|
Balance Sheet Location
|
2014
|
|
2013
|
|
||
|
Foreign currency forward-exchange contracts
|
Other current assets
|
$
|
9
|
|
$
|
10
|
|
|
Foreign currency forward-exchange contracts
|
Other current liabilities
|
(4
|
)
|
(5
|
)
|
||
|
Total foreign currency forward-exchange contracts
|
$
|
5
|
|
$
|
5
|
|
|
We use a market approach in valuing financial instruments on a recurring basis. Our derivative financial instruments measured at fair value on a recurring basis use Level 2 inputs in the calculation of fair value. See
Note 4. Significant Accounting Policies— Fair Value.
The net gains incurred on foreign currency forward-exchange contracts not designated as hedging instruments were
$20 million
and
$27 million
for the years ended
December 31, 2014
, and 2013, respectively, and are recorded in
Other (income)/deductions—net.
This amount was substantially offset in
Other (income)/deductions—net
by the effect of changing exchange rates on the underlying foreign currency exposures.
85
|
|
10.
|
Inventories
|
The components of inventory follow:
|
As of December 31,
|
||||||||
|
(MILLIONS OF DOLLARS)
|
2014
|
|
2013
|
|
||||
|
Finished goods
|
$
|
688
|
|
$
|
862
|
|
||
|
Work-in-process
|
340
|
|
218
|
|
||||
|
Raw materials and supplies
|
261
|
|
213
|
|
||||
|
Inventories
|
$
|
1,289
|
|
$
|
1,293
|
|
||
11. Property, Plant and Equipment
The components of property, plant and equipment follow:
|
Useful Lives
|
As of December 31,
|
|||||||||
|
(MILLIONS OF DOLLARS)
|
(Years)
|
2014
|
|
2013
|
|
|||||
|
Land
|
—
|
$
|
36
|
|
$
|
36
|
|
|||
|
Buildings
|
33
1
/
3
- 50
|
918
|
|
883
|
|
|||||
|
Machinery, equipment and fixtures
|
3 - 20
|
1,342
|
|
1,205
|
|
|||||
|
Construction-in-progress
|
—
|
167
|
|
199
|
|
|||||
|
2,463
|
|
2,323
|
|
|||||||
|
Less: Accumulated depreciation
|
1,145
|
|
1,028
|
|
||||||
|
Property, plant and equipment
|
$
|
1,318
|
|
$
|
1,295
|
|
||||
Depreciation expense was $
141 million
in 2014, $
146 million
in 2013 and $
133 million
in 2012.
|
12.
|
Goodwill and Other Intangible Assets
|
|
A.
|
Goodwill
|
The components of, and changes in, the carrying amount of goodwill follow:
|
(MILLIONS OF DOLLARS)
|
U.S.
|
|
EuAfME
|
|
CLAR
|
|
APAC
|
|
Total
|
|
||||||||||
|
Balance, December 31, 2012
|
$
|
502
|
|
$
|
157
|
|
$
|
163
|
|
$
|
163
|
|
$
|
985
|
|
|||||
|
Other
(a)
|
(1
|
)
|
—
|
|
(1
|
)
|
(1
|
)
|
(3
|
)
|
||||||||||
|
Balance, December 31, 2013
|
$
|
501
|
|
$
|
157
|
|
$
|
162
|
|
$
|
162
|
|
$
|
982
|
|
|||||
|
Other
(a)
|
—
|
|
(4
|
)
|
(1
|
)
|
(1
|
)
|
(6
|
)
|
||||||||||
|
Balance, December 31, 2014
|
$
|
501
|
|
$
|
153
|
|
$
|
161
|
|
$
|
161
|
|
$
|
976
|
|
|||||
|
(a)
|
Primarily reflects adjustments for foreign currency translation.
|
The gross goodwill balance was
$1,512 million
as of
December 31, 2014
, and $
1,518 million
as of
December 31, 2013
. Accumulated goodwill impairment losses (generated entirely in fiscal 2002) were
$536 million
as of
December 31, 2014
, and
December 31, 2013
.
86
|
|
B.
|
Other Intangible Assets
|
The components of identifiable intangible assets follow:
|
As of December 31, 2014
|
As of December 31, 2013
|
|||||||||||||||||||||||
|
Identifiable
|
|
Identifiable
|
|
|||||||||||||||||||||
|
Gross
|
|
Intangible Assets,
|
|
Gross
|
|
Intangible Assets,
|
|
|||||||||||||||||
|
Carrying
|
|
Accumulated
|
|
Less Accumulated
|
|
Carrying
|
|
Accumulated
|
|
Less Accumulated
|
|
|||||||||||||
|
(MILLIONS OF DOLLARS)
|
Amount
|
|
Amortization
|
|
Amortization
|
|
Amount
|
|
Amortization
|
|
Amortization
|
|
||||||||||||
|
Finite-lived intangible assets:
|
||||||||||||||||||||||||
|
Developed technology rights
|
$
|
744
|
|
$
|
(259
|
)
|
$
|
485
|
|
$
|
762
|
|
$
|
(219
|
)
|
$
|
543
|
|
||||||
|
Brands
|
216
|
|
(111
|
)
|
105
|
|
216
|
|
(100
|
)
|
116
|
|
||||||||||||
|
Trademarks and tradenames
|
60
|
|
(41
|
)
|
19
|
|
59
|
|
(38
|
)
|
21
|
|
||||||||||||
|
Other
|
119
|
|
(116
|
)
|
3
|
|
121
|
|
(116
|
)
|
5
|
|
||||||||||||
|
Total finite-lived intangible assets
|
1,139
|
|
(527
|
)
|
612
|
|
1,158
|
|
(473
|
)
|
685
|
|
||||||||||||
|
Indefinite-lived intangible assets:
|
||||||||||||||||||||||||
|
Brands
|
38
|
|
—
|
|
38
|
|
39
|
|
—
|
|
39
|
|
||||||||||||
|
Trademarks and trade names
|
67
|
|
—
|
|
67
|
|
67
|
|
—
|
|
67
|
|
||||||||||||
|
In-process research and development
(a)
|
2
|
|
—
|
|
2
|
|
12
|
|
—
|
|
12
|
|
||||||||||||
|
Product rights
|
8
|
|
—
|
|
8
|
|
—
|
|
—
|
|
—
|
|
||||||||||||
|
Total indefinite-lived intangible assets
|
115
|
|
—
|
|
115
|
|
118
|
|
—
|
|
118
|
|
||||||||||||
|
Identifiable intangible assets
|
$
|
1,254
|
|
$
|
(527
|
)
|
$
|
727
|
|
$
|
1,276
|
|
$
|
(473
|
)
|
$
|
803
|
|
||||||
(a)
The in-process research and development (IPR&D) balance as of December 31, 2014, includes the impairment of IPR&D assets, related to a pharmaceutical product for dogs acquired with the FDAH acquisition in 2009, as a result of the termination of the development program due to a re-assessment of economic viability.
Developed Technology Rights
Developed technology rights represent the amortized cost associated with developed technology, which has been acquired from third parties and which can include the right to develop, use, market, sell and/or offer for sale the product, compounds and intellectual property that we have acquired with respect to products, compounds and/or processes that have been completed. These assets include technologies related to the care and treatment of cattle, swine, poultry, sheep, dogs, cats and horses.
Brands
Brands represent the amortized or unamortized cost associated with product name recognition, as the products themselves do not receive patent protection. The more significant finite-lived brands are Excenel, Lutalyse and Spirovac and the more significant indefinite-lived brands are the Linco family products and Mastitis.
Trademarks and Tradenames
Trademarks and tradenames represent the amortized or unamortized cost associated with legal trademarks and tradenames. The more significant components of indefinite-lived trademarks and tradenames are indefinite-lived trademarks and tradenames acquired from SmithKlineBeecham. The more significant finite-lived trademarks and tradenames are finite-lived trademarks and tradenames for vaccines acquired from CSL Animal Health.
In-Process Research and Development
IPR&D assets represent R&D assets that have not yet received regulatory approval in a major market. The majority of these IPR&D assets were acquired in connection with our acquisition of FDAH.
IPR&D assets are required to be classified as indefinite-lived assets until the successful completion or abandonment of the associated R&D effort. Accordingly, during the development period after the date of acquisition, these assets will not be amortized until approval is obtained in a major market, typically either the United States or the EU, or in a series of other countries, subject to certain specified conditions and management judgment. At that time, we will determine the useful life of the asset, reclassify the asset out of IPR&D and begin amortization. If the associated R&D effort is abandoned, the related IPR&D assets will be written-off, and we will record an impairment charge.
For IPR&D assets, there can be no certainty that these assets ultimately will yield a successful product.
Product Rights
Product rights represent product registration and application rights that were acquired from Pfizer in 2014. See
Note 19. Transactions and Agreements with Pfizer.
|
C.
|
Amortization
|
The weighted average life of our total finite-lived intangible assets, developed technology rights, and finite-lived brands is approximately
12
years. Total amortization expense for finite-lived intangible assets was
$63 million
in 2014, $
63 million
in 2013, and $
67 million
in 2012.
87
|
The annual amortization expense expected for the years 2015 through 2019 is as follows:
|
(MILLIONS OF DOLLARS)
|
2015
|
|
2016
|
|
2017
|
|
2018
|
|
2019
|
|
||||||||||
|
Amortization expense
|
$
|
60
|
|
$
|
60
|
|
$
|
60
|
|
$
|
58
|
|
$
|
55
|
|
|||||
D. Impairments
For information about intangible asset impairments, see
Note 7. Other (Income)/Deductions––Net.
13. Benefit Plans
The combined statement of income for the year ended December 31, 2012, and the pre-Separation period included in the consolidated statement of income for the year ended December 31, 2013, included all of the benefit plan expenses attributable to the animal health operations of Pfizer, including expenses associated with pension plans, postretirement plans and defined contribution plans. The expenses included allocations of direct expenses, as well as expenses that were deemed attributable to the animal health operations. The consolidated balance sheets as of December 31, 2014 and 2013 included the benefit plan assets and liabilities of only those plans that were dedicated to animal health employees, as well as the benefit plan assets and liabilities that were transferred to Zoetis from Pfizer as part of the Separation, as further discussed below. All dedicated benefit plans are pension plans.
Prior to the Separation from Pfizer, employees who met certain eligibility requirements participated in various defined benefit pension plans and postretirement plans administered and sponsored by Pfizer. Generally, most of our employees were eligible to participate in Pfizer’s pension plans. An employee’s pension benefits were determined based on a combination of years of service and average earnings, as defined in the specific plans. Participants in Pfizer's U.S. plans generally vested in benefits after three years of service. Participant vesting in the international plans varies based on the specific plan in each country.
Effective December 31, 2012, our employees ceased to participate in the Pfizer U.S. qualified defined benefit and U.S. retiree medical plans, and liabilities associated with our employees under these plans were retained by Pfizer. Pfizer is continuing to credit certain employees' service with Zoetis generally through December 31, 2017 (or termination of employment from Zoetis, if earlier), for certain early retirement benefits with respect to Pfizer's U.S. defined benefit pension and retiree medical plans. In connection with the employee matters agreement, Zoetis is responsible for payment of three-fifths of the total cost of the service credit continuation (approximately
$38 million
) for these plans and Pfizer is responsible for the remaining two-fifths of the total cost (approximately
$25 million
). The
$25 million
capital contribution from Pfizer and corresponding contra-equity account (which is being reduced as the service credit continuation is incurred) is included in
Employee benefit plan contribution from Pfizer Inc.
in the consolidated statement of equity. The balance in the contra-equity account was approximately
$20 million
and
$23 million
as of
December 31, 2014
and 2013, respectively. The amount of the service cost continuation payment to be paid by Zoetis to Pfizer was determined and fixed based on an actuarial assessment of the value of the grow-in benefits and will be paid in equal installments over a period of
ten
years. Pension and postretirement benefit expense associated with the extended service for certain employees in the U.S. plans totaled approximately
$6 million
per year in 2014 and 2013. For additional information see
Note 19B. Transactions and Agreements with Pfizer—Agreements with Pfizer—Employee matters agreement.
Pension expense associated with the U.S. and certain significant international locations totaled approximately $
19 million
in 2014, $
15 million
in 2013 (inclusive of service cost grow-in benefits discussed above) and $
61 million
in 2012.
A. International Pension Plans
As part of the Separation, certain Separation Adjustments (see
Note 2B. The Separation, Adjustments Associated with the Separation, Senior Notes Offering, Initial Public Offering and Exchange Offer: Adjustments Associated with the Separation
) were made to transfer the assets and liabilities of certain international defined benefit pension plans including Austria, France, Germany, India, Mexico, South Africa, Taiwan and Venezuela to Zoetis in 2013, and we assumed the liabilities allocable to employees transferring to us. Prior to the Separation, these benefit plans were accounted for as multi-employer plans. The net obligation of the transferred plans totaled
$21 million
.
Also as part of the Separation, a net liability was recognized in 2013 for the pension obligations less the fair value of plan assets associated with additional defined benefit pension plans in certain international locations that were expected to be transferred to us in 2014 (approximately
$21 million
), in accordance with the applicable local separation agreements or employee matters agreement. During 2014, our pension plans in Australia, Belgium, Japan and Switzerland were transferred to us from Pfizer, and the combined net pension obligations (approximately
$22 million
) and the related accumulated other comprehensive loss (approximately
$11 million
, net of tax) associated with these plans were recorded. The net liability was adjusted to reflect the transfer of these plans, and for the expected transfer of the Philippines pension plan in early 2015. As of December 31, 2014, the balance of the net liability was approximately
$1 million
.
Information about the dedicated pension plans in Germany, India, Korea and the Netherlands, as well as plans transferred to us in 2014 and 2013 as part of the Separation, is provided in the tables below.
Obligations and Funded Status––Dedicated Plans
The following table provides an analysis of the changes in the benefit obligations, plan assets and funded status of our dedicated pension plans (including those transferred to us in 2014 and 2013):
88
|
|
As of and for the
|
||||||||
|
Year Ended December 31,
|
||||||||
|
(MILLIONS OF DOLLARS)
|
2014
|
|
2013
|
|
||||
|
Change in benefit obligation:
|
||||||||
|
Projected benefit obligation, beginning
|
$
|
73
|
|
$
|
39
|
|
||
|
Separation adjustments
(a)
|
78
|
|
28
|
|
||||
|
Changes in actuarial assumptions and other
|
17
|
|
(2
|
)
|
||||
|
Plan settlement
|
(38
|
)
|
—
|
|
||||
|
Adjustments for foreign currency translation
|
(7
|
)
|
2
|
|
||||
|
Other––net
|
6
|
|
6
|
|
||||
|
Benefit obligation, ending
|
129
|
|
73
|
|
||||
|
Change in plan assets:
|
||||||||
|
Fair value of plan assets, beginning
|
45
|
|
35
|
|
||||
|
Separation adjustments
(a)
|
56
|
|
7
|
|
||||
|
Actual return on plan assets
|
3
|
|
—
|
|
||||
|
Company contributions
|
3
|
|
2
|
|
||||
|
Plan settlement
|
(38
|
)
|
—
|
|
||||
|
Adjustments for foreign currency translation
|
(3
|
)
|
2
|
|
||||
|
Other––net
|
(3
|
)
|
(1
|
)
|
||||
|
Fair value of plan assets, ending
|
63
|
|
45
|
|
||||
|
Funded status—Projected benefit obligation in excess of plan assets at end of year
(b)
|
$
|
(66
|
)
|
$
|
(28
|
)
|
||
|
(a)
|
Represents the benefit obligations and plan assets transferred to us in 2014 and 2013 (net obligation of approximately
$22 million
and
21 million
, respectively) from Pfizer as part of the Separation, as described above.
|
|
(b)
|
Included in
Other noncurrent liabilities.
|
Actuarial losses were approximately $
33 million
(
$25 million
net of tax) at
December 31, 2014
, and $
10 million
(
$7 million
net of tax) at
December 31, 2013
. The actuarial gains and losses primarily represent the cumulative difference between the actuarial assumptions and actual return on plan assets, changes in discount rates and changes in other assumptions used in measuring the benefit obligations. These actuarial gains and losses are recognized in
Accumulated other comprehensive income/(loss)
. At December 31, 2014, the actuarial losses included approximately
$15 million
(
$11 million
, net of tax) associated with the plans transferred to us from Pfizer during 2014. At December 31, 2013, the actuarial losses included approximately $
4 million
(
$3 million
net of tax) associated with the Netherlands plan. The actuarial loss associated with the Netherlands plan was recognized into net periodic benefit costs in full as a result of the termination of the insurance contract associated with the Netherlands plan in the first quarter of 2014. The remaining losses will be amortized into net periodic benefit costs over an average period of
13.5
years.
The estimated net actuarial loss that will be amortized from
Accumulated other comprehensive loss
into 2015 net periodic benefit cost is approximately $
2 million
.
Information related to the funded status of selected plans follows:
|
As of December 31,
|
||||||||
|
(MILLIONS OF DOLLARS)
|
2014
|
|
2013
|
|
||||
|
Pension plans with an accumulated benefit obligation in excess of plan assets:
|
||||||||
|
Fair value of plan assets
|
$
|
35
|
|
$
|
37
|
|
||
|
Accumulated benefit obligation
|
73
|
|
58
|
|
||||
|
Pension plans with a projected benefit obligation in excess of plan assets:
|
||||||||
|
Fair value of plan assets
|
63
|
|
42
|
|
||||
|
Projected benefit obligation
|
129
|
|
70
|
|
||||
Net Periodic Benefit Costs––Dedicated Plans
The following table provides the net periodic benefit cost associated with dedicated pension plans (including those transferred to us in 2014 and 2013):
|
Year Ended December 31,
|
||||||||||||
|
(MILLIONS OF DOLLARS)
|
2014
|
|
2013
|
|
2012
|
|
||||||
|
Service cost
|
$
|
4
|
|
$
|
2
|
|
$
|
1
|
|
|||
|
Interest cost
|
2
|
|
3
|
|
2
|
|
||||||
|
Expected return on plan assets
|
(1
|
)
|
(2
|
)
|
(1
|
)
|
||||||
|
Special termination benefits
|
1
|
|
—
|
|
—
|
|
||||||
|
Settlement loss
|
5
|
|
1
|
|
—
|
|
||||||
|
Net periodic benefit cost
|
$
|
11
|
|
$
|
4
|
|
$
|
2
|
|
|||
89
|
The settlement loss for the year ended December 31, 2014, includes a settlement charge of approximately
$4 million
(approximately
$3 million
, net of tax) associated with the 2012 sale of our Netherlands manufacturing facility. The pension assets associated with this plan were financed through an insurance contract for which the insurer was responsible for the investment of the plan assets. The active participants in the plan were transferred to the buyer at the time of sale and the plan liability associated with inactive participants remained with the insurance contract that was used to finance the plan. The insurance contract was also transferred to the buyer although we remained liable for the proportion of administrative costs that related to inactive members under the terms of this contract through December 31, 2013. Under the terms of the sale agreement, the contract was terminated on December 31, 2013 (fiscal year 2014 for our international operations), and the liability for benefits associated with this plan reverted in full to the insurance company.
Actuarial Assumptions––Dedicated Plans
The following table provides the weighted average actuarial assumptions for the dedicated pension plans (including those transferred to us in 2014 and 2013):
|
As of December 31,
|
|||||||||
|
(PERCENTAGES)
|
2014
|
|
2013
|
|
2012
|
|
|||
|
Weighted average assumptions used to determine benefit obligations:
|
|||||||||
|
Discount rate
|
2.8
|
%
|
5.0
|
%
|
4.6
|
%
|
|||
|
Rate of compensation increase
|
3.6
|
%
|
4.4
|
%
|
5.3
|
%
|
|||
|
Weighted average assumptions used to determine net benefit cost for the year ended December 31:
|
|||||||||
|
Discount rate
|
5.0
|
%
|
4.6
|
%
|
5.8
|
%
|
|||
|
Expected return on plan assets
|
4.0
|
%
|
4.5
|
%
|
3.6
|
%
|
|||
|
Rate of compensation increase
|
4.4
|
%
|
5.3
|
%
|
2.7
|
%
|
|||
The assumptions above are used to develop the benefit obligations at the end of the year and to develop the net periodic benefit cost for the following year. Therefore, the assumptions used to determine the net periodic benefit cost for each year are established at the end of each previous year, while the assumptions used to determine the benefit obligations are established at each year-end. The net periodic benefit cost and the benefit obligations are based on actuarial assumptions that are reviewed on an annual basis. The assumptions are revised based on an annual evaluation of long-term trends, as well as market conditions that may have an impact on the cost of providing retirement benefits. In 2013 and 2012, the calculation of the weighted average expected rate of compensation increase used to determine benefit obligations excluded the Netherlands plan as that plan had no active participants at December 31, 2013 and 2012 (the plan was terminated on December 31, 2013).
Actuarial and other assumptions for pension plans can result from a complex series of judgments about future events and uncertainties and can rely heavily on estimates and assumptions. For a description of the risks associated with estimates and assumptions, see
Note 4. Significant Accounting Policies—Estimates and Assumptions
.
Plan Assets—Dedicated Plans
The components of plan assets follow:
|
As of December 31,
|
||||||||
|
(MILLIONS OF DOLLARS)
|
2014
|
|
2013
|
|
||||
|
Cash and cash equivalents
|
$
|
1
|
|
$
|
—
|
|
||
|
Equity securities: Equity commingled funds
|
27
|
|
7
|
|
||||
|
Debt securities: Government bonds
|
26
|
|
31
|
|
||||
|
Other investments
|
9
|
|
7
|
|
||||
|
Total
(a)
|
$
|
63
|
|
$
|
45
|
|
||
|
(a)
|
Fair values are determined based on valuation inputs categorized as Level 1, 2 or 3 (see
|
A single estimate of fair value can result from a complex series of judgments about future events and uncertainties and can rely heavily on estimates and assumptions. For information about the risks associated with estimates and assumptions, see
Note 4. Significant Accounting Policies—Estimates and Assumptions.
Specifically, the following methods and assumptions were used to estimate the fair value of our pension assets:
|
•
|
Equity commingled funds––observable market prices.
|
|
•
|
Government bonds and other investments––principally observable market prices.
|
90
|
The long-term target asset allocations and the percentage of the fair value of plans assets for dedicated benefit plans follow:
|
As of December 31,
|
|||||||||
|
Target allocation
|
|
||||||||
|
percentage
|
|
Percentage of Plan Assets
|
|||||||
|
(PERCENTAGES)
|
2014
|
|
2014
|
|
2013
|
|
|||
|
Cash and cash equivalents
|
0-10%
|
|
2.1
|
%
|
—
|
%
|
|||
|
Equity securities
|
0-50%
|
|
42.5
|
%
|
14.2
|
%
|
|||
|
Debt securities
|
20-70%
|
|
41.3
|
%
|
70.1
|
%
|
|||
|
Other investments
|
0-40%
|
|
14.1
|
%
|
15.7
|
%
|
|||
|
Total
|
100
|
%
|
100
|
%
|
100
|
%
|
|||
Zoetis utilizes long-term asset allocation ranges in the management of our plans’ invested assets. Long-term return expectations are developed with input from outside investment consultants based on the company’s investment strategy, which takes into account historical experience, as well as the impact of portfolio diversification, active portfolio management, and the investment consultant’s view of current and future economic and financial market conditions. As market conditions and other factors change, the targets may be adjusted accordingly and actual asset allocations may vary from the target allocations.
The long-term asset allocation ranges reflect the asset class return expectations and tolerance for investment risk within the context of the respective plans’ long-term benefit obligations. These ranges are supported by an analysis that incorporates historical and expected returns by asset class, as well as volatilities and correlations across asset classes and our liability profile. This analysis, referred to as an asset-liability analysis, also provides an estimate of expected returns on plan assets, as well as a forecast of potential future asset and liability balances.
The investment consultants review investment performance with Zoetis on a quarterly basis in total, as well as by asset class, relative to one or more benchmarks.
Cash Flows—Dedicated Plans
Our plans are generally funded in amounts that are at least sufficient to meet the minimum requirements set forth in applicable employee benefit laws and local tax and other laws.
We expect to contribute approximately
$7 million
to our dedicated pension plans in 2015. Benefit payments are expected to be approximately
$3 million
for 2015,
$3 million
for 2016, and $
5 million
for each of the next three years. Benefit payments are expected to be approximately $
36 million
in the aggregate for the five years thereafter. These expected benefit payments reflect the future plan benefits subsequent to 2015 projected to be paid from the plans or from the general assets of Zoetis entities under the current actuarial assumptions used for the calculation of the projected benefit obligation and, therefore, actual benefit payments may differ from projected benefit payments.
Multi-employer Plans
Pension expense associated with the Philippines pension plan and certain other international benefit plans accounted for as multi-employer plans and transferred to us from Pfizer in 2013 and 2014, was approximately
$5 million
in 2014,
$7 million
in 2013 and $
6 million
in 2012. Contributions to these plans were approximately
$5 million
in 2014 and
$7 million
per year in 2013 and 2012. We expect the Philippines plan to transfer to us in early 2015.
B. Postretirement Plans
Prior to the Separation from Pfizer, many of our employees were eligible to participate in postretirement plans sponsored by Pfizer. As discussed above, Pfizer is continuing to credit certain United States employees' service with Zoetis generally through December 31, 2017 (or termination of employment from Zoetis, if earlier), for certain early retirement benefits with respect to Pfizer's U.S. retiree medical plans. Postretirement benefit expense associated with these U.S. retiree medical plans totaled approximately $
4 million
per year in 2014 and 2013 (inclusive of service cost grow-in benefits discussed above) and $
17 million
in 2012. The expected benefit payments for each of the next five years is approximately $
4 million
per year, and approximately $
10 million
in the aggregate over the remaining four years of the agreement with Pfizer.
Also prior to the Separation from Pfizer, employees in the United States who met certain eligibility requirements participated in a supplemental (non-qualified) savings plan sponsored by Pfizer. In 2013, Pfizer transferred the supplemental savings plan liability of approximately
$14 million
, cash of
$9 million
and a deferred tax asset of
$5 million
associated with employees transferred to us. Post-Separation, employees in the United States who meet certain eligibility requirements participate in a supplemental (non-qualified) savings plan sponsored by Zoetis. The cost of the supplemental savings plan was
$3 million
and
$1 million
in 2014 and 2013, respectively.
C. Defined Contribution Plans
Zoetis has a voluntary defined contribution plan (Zoetis Savings Plan) that allows participation by substantially all U. S. employees. Zoetis matches
100%
of employee contributions, up to a maximum of
5%
of each employee’s eligible compensation. The Zoetis Savings Plan also includes a profit-sharing feature that provides for an additional contribution ranging between
0
and
8
percent of each employee’s eligible compensation. All eligible employees receive the profit-sharing contribution regardless of the amount they choose to contribute to the Zoetis Savings Plan. The profit-sharing contribution is a discretionary amount provided by Zoetis and is determined on an annual basis. Employees can direct their contributions and the company's matching and profit-sharing contributions into any of the funds offered. These funds provide participants with a cross section of investing options, including the Zoetis stock fund. Through December 31, 2014, matching and profit-sharing contributions were funded through the issuance of Zoetis common stock.
91
|
Prior to the Separation from Pfizer, our U.S. employees were eligible to participate in Pfizer’s defined contribution plans, whereby employees contributed a portion of their salaries and bonuses to the plans, which was partially matched by Pfizer, largely in Pfizer stock or Pfizer stock units. The matching contributions in Pfizer stock were sourced through open market purchases.
Employees are permitted to diversify all or any portion of their company matching or profit-sharing contribution. Once the contributions have been paid, Zoetis has no further payment obligations. Contribution expense, associated with the U.S. defined contribution plans, totaled approximately $
38 million
in 2014, $
35 million
in 2013 and $
20 million
in 2012.
|
14.
|
Share-Based Payments
|
In January 2013, the Zoetis 2013 Equity and Incentive Plan (Equity Plan) became effective, in order to provide long-term incentives to, and facilitate the retention of, our employees. The principal types of stock-based awards available under the Equity Plan may include, but are not limited to, stock options, restricted stock and restricted stock units (RSUs), deferred stock unit awards (DSUs), performance-based awards and other equity-based or cash-based awards.
Twenty-five million
shares of stock were approved and registered with the SEC for grants to participants under the Equity Plan. The shares reserved may be used for any type of award under the Equity Plan. At December 31, 2014, the aggregate number of remaining shares available for future grant under the Equity Plan was approximately
17
million shares.
|
A.
|
Share-Based Compensation Expense
|
The components of share-based compensation expense follow:
|
Year Ended December 31,
|
||||||||||||
|
(MILLIONS OF DOLLARS)
|
2014
|
|
2013
|
|
2012
|
|
||||||
|
Stock options / stock appreciation rights
|
$
|
18
|
|
$
|
9
|
|
$
|
—
|
|
|||
|
RSUs / DSUs
|
14
|
|
9
|
|
—
|
|
||||||
|
Pfizer stock benefit plans—direct
|
—
|
|
25
|
|
28
|
|
||||||
|
Share-based compensation expense—direct
|
32
|
|
43
|
|
28
|
|
||||||
|
Share-based compensation expense—indirect
|
—
|
|
—
|
|
5
|
|
||||||
|
Share-based compensation expense—total
|
$
|
32
|
|
$
|
43
|
|
$
|
33
|
|
|||
|
Tax benefit for share-based compensation expense
|
(8
|
)
|
(6
|
)
|
(10
|
)
|
||||||
|
Share-based compensation expense, net of tax
|
$
|
24
|
|
$
|
37
|
|
$
|
23
|
|
|||
|
B.
|
Stock Options
|
Stock options represent the right to purchase shares of our common stock within a specified period of time at a specified price. The exercise price for a stock option will be not less than
100%
of the fair market value of the common stock on the date of grant. Stock options granted may include those intended to be “incentive stock options” within the meaning of Section 422 of the U.S. Internal Revenue Code of 1986 (the Code).
Stock options are accounted for using a fair-value-based method at the date of grant in the consolidated statement of income. The values determined through this fair-value-based method generally are amortized on a straight-line basis over the vesting term into
Cost of sales, Selling, general and administrative expenses,
or
Research and development expenses,
as appropriate.
Eligible employees may receive Zoetis stock option grants. Zoetis stock options granted vest after
three
years of continuous service from the grant date and have a contractual term of
10
years.
The fair-value-based method for valuing each Zoetis stock option grant on the grant date uses the Black-Scholes-Merton option-pricing model, which incorporates a number of valuation assumptions noted in the following table, shown at their weighted-average values:
|
Year Ended December 31,
|
||||||
|
2014
|
|
2013
|
|
|||
|
Expected dividend yield
(a)
|
0.93
|
%
|
1.00
|
%
|
||
|
Risk-free interest rate
(b)
|
2.01
|
%
|
1.30
|
%
|
||
|
Expected stock price volatility
(c)
|
24.72
|
%
|
28.21
|
%
|
||
|
Expected term
(d)
(years)
|
6.5
|
|
6.5
|
|
||
|
(a)
|
Determined using a constant dividend yield during the expected term of the Zoetis stock option.
|
|
(b)
|
Determined using the interpolated yield on U.S. Treasury zero-coupon issues.
|
|
(c)
|
Determined using implied volatility.
|
|
(d)
|
Determined using expected exercise and post-vesting termination patterns.
|
92
|
The following table provides an analysis of stock option activity for the year ended
December 31, 2014
:
|
Weighted-Average
|
|||||||||||||
|
Weighted-Average
|
|
Remaining
|
Aggregate
|
|
|||||||||
|
Exercise Price
|
|
Contractual Term
|
Intrinsic Value
(a)
|
|
|||||||||
|
Shares
|
|
Per Share
|
|
(Years)
|
(MILLIONS)
|
|
|||||||
|
Outstanding, December 31, 2013
|
2,879,564
|
|
$
|
26.11
|
|
||||||||
|
Granted
|
3,006,351
|
|
30.97
|
|
|||||||||
|
Exercised
|
(58,536
|
)
|
26.00
|
|
|||||||||
|
Forfeited
|
(286,066
|
)
|
29.75
|
|
|||||||||
|
Outstanding, December 31, 2014
|
5,541,313
|
|
$
|
28.56
|
|
8.7
|
$
|
66
|
|
||||
|
Exercisable, December 31, 2014
|
63,751
|
|
$
|
27.39
|
|
8.4
|
$
|
1
|
|
||||
|
(a)
|
Market price of underlying Zoetis common stock less exercise price.
|
The following table summarizes data related to stock option activity:
|
Year Ended/As of December 31,
|
||||||||
|
(MILLIONS OF DOLLARS, EXCEPT PER STOCK OPTION AMOUNTS)
|
2014
|
|
2013
|
|
||||
|
Weighted-average grant date fair value per stock option
|
$
|
8.01
|
|
$
|
7.05
|
|
||
|
Aggregate intrinsic value on exercise
|
1
|
|
—
|
|
||||
|
Cash received upon exercise
|
2
|
|
—
|
|
||||
|
Tax benefits realized related to exercise
|
1
|
|
—
|
|
||||
|
Total compensation cost related to nonvested stock options not yet recognized, pre-tax
|
17
|
|
11
|
|
||||
|
Weighted-average period over which stock option compensation is expected to be recognized (years)
|
1.8
|
|
2.0
|
|
||||
|
C.
|
Restricted Stock and Restricted Stock Units (RSUs)
|
Restricted stock is a share of our common stock that is subject to a risk of forfeiture or other restrictions that will lapse subject to the recipient's continued employment, the attainment of performance goals, or both. RSUs represent the right to receive shares of our common stock in the future (or cash determined by reference to the value of our common stock).
RSUs are accounted for using a fair-value-based method that utilizes the closing price of Zoetis common stock on the date of grant. In general, RSUs vest after
three
years of continuous service from the grant date and the values are amortized on a straight-line basis over the vesting term into
Cost of sales, Selling, general and administrative expenses,
or
Research and development expenses,
as appropriate.
The following table provides an analysis of RSU activity for the year ended
December 31, 2014
:
|
Weighted-Average
|
|
||||||
|
Grant Date Fair Value
|
|
||||||
|
Shares
|
|
Per Share
|
|
||||
|
Nonvested, December 31, 2013
|
949,370
|
|
$
|
26.82
|
|
||
|
Granted
|
844,079
|
|
31.03
|
|
|||
|
Vested
|
(58,306
|
)
|
27.81
|
|
|||
|
Reinvested dividend equivalents
|
10,545
|
|
28.92
|
|
|||
|
Forfeited
|
(122,714
|
)
|
28.77
|
|
|||
|
Nonvested, December 31, 2014
|
1,622,974
|
|
$
|
28.85
|
|
||
The follow table provides data related to RSU activity:
|
Year Ended/As of December 31,
|
||||||||
|
(MILLIONS OF DOLLARS)
|
2014
|
|
2013
|
|
||||
|
Total compensation cost related to nonvested RSU awards not yet recognized, pre-tax
|
$
|
24
|
|
$
|
17
|
|
||
|
Weighted-average period over which RSU cost is expected to be recognized (years)
|
1.8
|
|
2.1
|
|
||||
|
D.
|
Deferred Stock Units (DSUs)
|
DSUs, which are granted to non-employee Directors, represent the right to receive shares of our common stock at a future date. The DSU awards will be automatically settled and paid in shares (including fractional shares) within sixty days following the non-employee Director’s separation of service on the Board of Directors.
93
|
DSUs are accounted for using a fair-value-based method that utilizes the closing price of Zoetis common stock on the date of grant. DSUs vest immediately as of the grant date and the values are expensed at the time of grant into
Selling, general and administrative expenses
.
For the years ended
December 31, 2014
and 2013, Zoetis granted
36,256
and
34,804
DSUs, respectively, at a grant date weighted-average fair value of
$30.89
and $
28.15
, respectively, per stock unit. As of
December 31, 2014
and 2013, there were
71,727
and
35,024
DSUs outstanding, respectively, including dividend equivalents.
|
E.
|
Other Equity-Based or Cash-Based Awards.
|
Performance-based awards will require satisfaction of pre-established performance goals, consisting of one or more business criteria and a targeted performance level with respect to such criteria as a condition of awards vesting or being settled. Performance may be measured over a period of any length specified but not less than one year.
Our Compensation Committee is authorized to grant awards in the form of other equity-based awards or other cash-based awards, as deemed to be consistent with the purposes of the Equity Plan. The maximum value of the aggregate payment to be paid to any participant with respect to cash-based awards under the Equity Plan in respect of an annual performance period will be
$10 million
.
|
F.
|
Treatment of Outstanding Pfizer Equity Awards
|
Following the IPO, the equity awards previously granted to our employees by Pfizer continued to vest, and service with Zoetis counted as service with Pfizer for equity award purposes. On
June 24, 2013
, Pfizer completed the Exchange Offer whereby Pfizer disposed of all of its shares of Zoetis common stock owned by Pfizer. Pfizer accelerated the vesting of, and in some cases the settlement of, on a pro-rata basis, outstanding Pfizer RSUs, Total Shareholder Return Units (TSRUs) and Performance Share Awards (PSAs) previously granted to our employees, subject, in each case, to the requirements of Section 409A of the U.S. Internal Revenue Code, the terms of the 2004 Pfizer Stock Plan and the applicable award agreements and any outstanding deferral elections. In addition, unvested Pfizer stock options previously granted to our employees accelerated in full, and our employees generally have the ability to exercise the stock options until the earlier of (i) June 23, 2016 (
three
years from Pfizer's completion of the Exchange Offer), (ii) termination of employment from Zoetis or (iii) the expiration date of the stock option. Zoetis employees who held Pfizer stock options and were retirement eligible as of
June 24, 2013
, will have the full term of the stock option to exercise.
The accelerated vesting of the outstanding Pfizer stock options, and the settlement, on a pro-rata basis, of other Pfizer equity awards, resulted in the recognition of additional expense for the year ended December 31, 2013, of $
9 million
, which is included in stock-based compensation. The unvested portion of Pfizer RSUs, TSRUs and PSAs were forfeited as of the completion of the Exchange Offer. In the
third quarter
of 2013, Zoetis made a cash payment of approximately $
20 million
to certain non-executive Zoetis employees, based on the value of the employees' forfeited Pfizer RSUs, TSRUs and PSAs (as applicable). This amount is included in the consolidated statement of income as additional compensation expense for the year ended December 31, 2013. Members of the Zoetis Executive Team did not receive a cash payment for any forfeited Pfizer RSUs, TSRUs and PSAs, but instead, in the third quarter of 2013, they were granted Zoetis RSUs which were equivalent in value and vest on the same date as their forfeited Pfizer RSUs, TSRUs and PSAs.
|
15.
|
Stockholders' Equity
|
Zoetis is authorized to issue
6,000,000,000
shares of common stock and
1,000,000,000
shares of preferred stock.
Changes in common shares and treasury stock were as follows:
|
(MILLIONS OF DOLLARS AND SHARES)
|
Common Shares Issued
|
|
Treasury Stock
(a)
|
|
Cost of Treasury Stock
|
|
||||
|
Balance, December 31, 2012
|
—
|
|
—
|
|
$
|
—
|
|
|||
|
IPO
|
500.000
|
|
—
|
|
—
|
|
||||
|
Stock-based compensation
|
0.008
|
|
—
|
|
—
|
|
||||
|
Defined contribution plan
|
—
|
|
—
|
|
—
|
|
||||
|
Balance, December 31, 2013
|
500.008
|
|
—
|
|
—
|
|
||||
|
Stock-based compensation
|
0.104
|
|
0.015
|
|
0.5
|
|
||||
|
Defined contribution plans
|
1.230
|
|
—
|
|
—
|
|
||||
|
Balance, December 31, 2014
|
501.342
|
|
0.015
|
|
$
|
0.5
|
|
|||
|
(a)
|
Treasury shares are reacquired from employees for withholding tax purposes in connection with the vesting and exercise of awards under our equity compensation plan. For additional information regarding share-based compensation, see
|
A. Share Repurchase Program
In November 2014, the company's Board of Directors authorized a
$500 million
share repurchase program. Purchases of Zoetis shares may be made at the discretion of management, depending on market conditions and business needs. There were no share repurchases under this program during the year ended December 31, 2014.
B. Shareholder Rights Plan
In November 2014, the company adopted a one-year shareholder rights plan. Under the plan, one preferred stock purchase right was distributed for each share of common stock held by stockholders of record on November 24, 2014. Under certain circumstances, the rights will become exercisable and each right will entitle stockholders to buy a unit consisting of one one-thousandth of a share of Series A Junior Participating Preferred Stock of the company at an exercise price of
$200
per unit. In general, the rights become exercisable at the close of business on the tenth business day following (i) public announcement that a person or group acquired 15% or more of our common stock or (ii) commencement or announcement of a
94
|
tender offer or exchange offer that would result in a person or group owning
15%
or more of our common stock. The company is entitled to redeem the rights at
$0.001
per right at any time prior to 10 business days following the announcement that a person or group has acquired
15%
or more of our outstanding common stock. The rights will expire on November 16, 2015, unless the rights are earlier redeemed or exchanged by the company or terminated.
Subject to limited exceptions, if a person or group acquires
15%
or more of the outstanding common stock of the company (including in the form of synthetic ownership through derivative positions), each right (other than those held by that person or group) will become exercisable and entitle its holder to purchase, at the right's then-current exercise price, a number of shares of common stock having a market value at that time of twice the right's exercise price. If the company is acquired in a merger or other business combination transaction that has not been approved by the Board of Directors after the rights become exercisable, each right will entitle its holder to purchase, at the right's then-current exercise price, a number of shares of the acquiring company's common stock having a market value at that time of twice the right's exercise price.
C. Accumulated other comprehensive income (loss)
Changes, net of tax, in accumulated other comprehensive loss, excluding noncontrolling interest, follow:
|
Currency Translation
|
|
Accumulated
|
|
|||||||||
|
Adjustment
|
|
Benefit Plans
|
|
Other
|
|
|||||||
|
Net Unrealized
|
|
Actuarial
|
|
Comprehensive
|
|
|||||||
|
(MILLIONS OF DOLLARS)
|
Losses
|
|
Gains/(Losses)
|
|
Loss
|
|
||||||
|
Balance, December 31, 2011
|
$
|
(59
|
)
|
$
|
(6
|
)
|
$
|
(65
|
)
|
|||
|
Other comprehensive loss, net of tax
|
(93
|
)
|
1
|
|
(92
|
)
|
||||||
|
Balance, December 31, 2012
|
(152
|
)
|
(5
|
)
|
(157
|
)
|
||||||
|
Other comprehensive loss, net of tax
|
(54
|
)
|
(2
|
)
|
(56
|
)
|
||||||
|
Separation adjustments
(a)
|
(6
|
)
|
—
|
|
(6
|
)
|
||||||
|
Balance, December 31, 2013
|
(212
|
)
|
(7
|
)
|
(219
|
)
|
||||||
|
Other comprehensive loss, net of tax
|
(124
|
)
|
(7
|
)
|
(b)
|
(131
|
)
|
|||||
|
Pension plan transfers from Pfizer Inc.
(c)
|
—
|
|
(11
|
)
|
(11
|
)
|
||||||
|
Balance, December 31, 2014
|
$
|
(336
|
)
|
$
|
(25
|
)
|
$
|
(361
|
)
|
|||
|
(a)
|
See
Note 2B. The Separation, Adjustments Associated with the Separation, Senior Notes Offering, Initial Public Offering and Exchange Offer
—
Adjustments Associated with the Separation
.
|
|
(b)
|
Includes the 2014 settlement charge associated with the 2012 sale of our Netherlands manufacturing facility. See
Note 13. Benefit Plans.
|
|
(c)
|
Relates to 2014 transfers of defined benefit pension plans from Pfizer Inc. and the reclassification from
Additional Paid in Capital
to
Accumulated Other Comprehensive Loss
. See
|
|
16.
|
Earnings per Share
|
The weighted average shares outstanding for both basic and diluted earnings per share for the year ended December 31, 2012, was calculated using an aggregate of
500 million
shares of common stock outstanding, which was the number of Zoetis Inc. shares outstanding at the time of the IPO. There were no Zoetis RSUs, stock options or performance shares outstanding prior to the IPO.
The following table presents the calculation of basic and diluted earnings per share:
|
Year Ended December 31,
|
||||||||||||
|
(MILLIONS OF DOLLARS AND SHARES, EXCEPT PER SHARE DATA)
|
2014
|
|
2013
|
|
2012
|
|
||||||
|
Numerator
|
||||||||||||
|
Net income before allocation to noncontrolling interests
|
$
|
587
|
|
$
|
503
|
|
$
|
436
|
|
|||
|
Net income/(loss) attributable to noncontrolling interests
|
4
|
|
(1
|
)
|
—
|
|
||||||
|
Net income attributable to Zoetis Inc.
|
$
|
583
|
|
$
|
504
|
|
$
|
436
|
|
|||
|
Denominator
|
||||||||||||
|
Weighted-average common shares outstanding
|
501.055
|
|
500.002
|
|
500.000
|
|
||||||
|
Common stock equivalents: stock options, RSUs and DSUs
|
0.970
|
|
0.315
|
|
|
|
||||||
|
Weighted-average common and potential dilutive shares outstanding
|
502.025
|
|
500.317
|
|
500.000
|
|
||||||
|
Earnings per share attributable to Zoetis Inc. stockholders—basic
|
$
|
1.16
|
|
$
|
1.01
|
|
$
|
0.87
|
|
|||
|
Earnings per share attributable to Zoetis Inc. stockholders—diluted
|
$
|
1.16
|
|
$
|
1.01
|
|
$
|
0.87
|
|
|||
As of December 31, 2014 and 2013, the number of stock options outstanding under the company's Equity Plan that were excluded from the computation of diluted earnings per share, as the effect would have been antidilutive, were de minimis.
95
|
|
17.
|
Commitments and Contingencies
|
We and certain of our subsidiaries are subject to numerous contingencies arising in the ordinary course of business. For a discussion of our tax contingencies, see
Note 8. Tax Matters
.
|
A.
|
Legal Proceedings
|
Our non-tax contingencies include, among others, the following:
|
•
|
Product liability and other product-related litigation, which can include injury, consumer, off-label promotion, antitrust and breach of contract claims.
|
|
•
|
Commercial and other matters, which can include product-pricing claims and environmental claims and proceedings.
|
|
•
|
Patent litigation, which typically involves challenges to the coverage and/or validity of our patents or those of third parties on various products or processes.
|
|
•
|
Government investigations, which can involve regulation by national, state and local government agencies in the United States and in other countries.
|
Certain of these contingencies could result in losses, including damages, fines and/or civil penalties, and/or criminal charges, which could be substantial.
We believe that we have strong defenses in these types of matters, but litigation is inherently unpredictable and excessive verdicts do occur. We do not believe that any of these matters will have a material adverse effect on our financial position. However, we could incur judgments, enter into settlements or revise our expectations regarding the outcome of certain matters, and such developments could have a material adverse effect on our results of operations or cash flows in the period in which the amounts are paid.
We have accrued for losses that are both probable and reasonably estimable. Substantially all of these contingencies are subject to significant uncertainties and, therefore, determining the likelihood of a loss and/or the measurement of any loss can be complex. Consequently, we are unable to estimate the range of reasonably possible loss in excess of amounts accrued. Our assessments are based on estimates and assumptions that have been deemed reasonable by management, but the assessment process relies heavily on estimates and assumptions that may prove to be incomplete or inaccurate, and unanticipated events and circumstances may occur that might cause us to change those estimates and assumptions.
Amounts recorded for legal and environmental contingencies can result from a complex series of judgments about future events and uncertainties and can rely heavily on estimates and assumptions.
The principal matters to which we are a party are discussed below. In determining whether a pending matter is significant for financial reporting and disclosure purposes, we consider both quantitative and qualitative factors in order to assess materiality, such as, among other things, the amount of damages and the nature of any other relief sought in the proceeding, if such damages and other relief are specified; our view of the merits of the claims and of the strength of our defenses; whether the action purports to be a class action and our view of the likelihood that a class will be certified by the court; the jurisdiction in which the proceeding is pending; any experience that we or, to our knowledge, other companies have had in similar proceedings; whether disclosure of the action would be important to a reader of our financial statements, including whether disclosure might change a reader’s judgment about our financial statements in light of all of the information about the company that is available to the reader; the potential impact of the proceeding on our reputation; and the extent of public interest in the matter. In addition, with respect to patent matters, we consider, among other things, the financial significance of the product protected by the patent.
Roxarsone
®
(3-Nitro)
We are defendants in
nine
actions involving approximately
140
plaintiffs that allege that the distribution of the medicated feed additive Roxarsone allegedly caused various diseases in the plaintiffs, including cancers and neurological diseases. Other defendants, including various poultry companies, are also named in these lawsuits. Compensatory and punitive damages are sought in unspecified amounts.
In September
2006
, the Circuit Court of Washington County returned a defense verdict in
one
of the lawsuits, Mary Green, et al. v. Alpharma, Inc. et al. In
2008
, this verdict was appealed and affirmed by the Arkansas Supreme Court. Certain summary judgments favoring the poultry company co-defendants in Mary Green, et al. v. Alpharma, Inc. et al. were reversed by the Arkansas Supreme Court in
2008
. These claims were retried in
2009
and that trial also resulted in a defense verdict, which was affirmed by the Arkansas Supreme Court in April 2011. In October 2012, we entered into an agreement to resolve these cases, subject to the execution of full releases or dismissals with prejudice by all of the claimants. We received full releases from all claimants, and as a result, on January 23, 2014, the Court dismissed all nine actions with prejudice.
In June 2011, we announced that we would suspend sales in the United States of Roxarsone (3-Nitro) in response to a request by the U.S. FDA and subsequently stopped sales in several international markets.
Following our decision to suspend sales of Roxarsone (3-Nitro) in June 2011, Zhejiang Rongyao Chemical Co., Ltd., the supplier of certain materials used in the production of Roxarsone (3-Nitro), filed a lawsuit in the U.S. District Court for the District of New Jersey alleging that we are liable for damages it suffered as a result of the decision to suspend sales. In October 2013, the parties reached a preliminary agreement to resolve the matter, and the Court dismissed the action with prejudice. In December 2013, the parties finalized and executed the settlement agreement.
PregSure
®
We have received in total approximately
240
claims in Europe and New Zealand seeking damages related to calves claimed to have died of Bovine Neonatal Pancytopenia (BNP) on farms where PregSure BVD, a vaccine against Bovine Virus Diarrhea (BVD), was used. BNP is a rare syndrome that first emerged in cattle in Europe in 2006. Studies of BNP suggest a potential association between the administration of PregSure and the development of BNP, although no causal connection has been established. The cause of BNP is not known.
96
|
In
2010
, we voluntarily stopped sales of PregSure BVD in Europe, and recalled the product at wholesalers while investigations into possible causes of BNP continued. In
2011
, after incidences of BNP were reported in New Zealand, we voluntarily withdrew the marketing authorization for PregSure throughout the world.
We have settled approximately
half
of these claims for amounts that are not material individually or in the aggregate. Investigations into possible causes of BNP continue and these settlements may not be representative of any future claims resolutions.
Advocin
On January 30, 2012, Bayer filed a complaint against Pfizer alleging infringement and inducement of infringement of Bayer U.S. patent No. 5,756,506 covering, among other things, a process for treating bovine respiratory disease (BRD) by administering a single high dose of fluoroquinolone. The complaint was filed after our product Advocin
®
was approved as a single dose treatment of BRD, in addition to its previous approval as a multi-dose treatment of BRD. Bayer seeks a permanent injunction, damages and a recovery of attorney's fees, and has demanded a jury trial. Discovery has now concluded. We have filed motions for summary judgment of non-infringement and invalidity of the Bayer patent, which are currently pending before the Court.
Ulianopolis, Brazil
In February 2012, the Municipality of Ulianopolis (State of Para, Brazil) filed a complaint against Fort Dodge Saúde Animal Ltda. (FDSAL) and
five
other large companies alleging that waste sent to a local waste incineration facility for destruction, but that was not ultimately destroyed as the facility lost its operating permit, caused environmental impacts requiring cleanup.
The Municipality is seeking recovery of cleanup costs purportedly related to FDSAL's share of all waste accumulated at the incineration facility awaiting destruction, and compensatory damages to be allocated among the
six
defendants. We believe we have strong arguments against the claim, including defense strategies against any claim of joint and several liability.
At the request of the Municipal prosecutor, in April 2012, the lawsuit was suspended for one year. Since that time, the prosecutor has initiated investigations into the Municipality's actions in the matter as well as the efforts undertaken by the six defendants to remove and dispose of their individual waste from the incineration facility. The Municipal prosecutor held a meeting on October 3, 2014, in which it was announced there is no final outcome for the investigation as yet. Each defendant was called to verify tax documentation and provide comments on a proposed Term of Reference by January 2015.
In early August 2013, new labor claims were filed against FDSAL as well as
57
other companies. These claims were filed by
30
employees of the local waste incineration facility that was used by FDSAL and the
57
other companies. The employees of the incineration facility allege that FDSAL and the other users of the facility are severally liable for health injuries suffered in connection with plaintiffs' employment at the waste site. Based on legal precedent, it is possible that FDSAL may be considered a liable party. The plaintiffs' lawyers presented a motion for discontinuance of these 30 labor claims during the hearing held on December 9, 2013, because (i) not all defendants had been summoned which would generate delays in the proceedings and preliminaries of lawsuits' dismissal; and (ii) the pieces of evidence for each claim shall be more concentrated. The court dismissed the cases on the same date.
Other Matters
The European Commission published a decision on alleged competition law infringements by several human health pharmaceutical companies on June 19, 2013. One of the involved legal entities is Zoetis Products LLC, formerly having the name Alpharma Inc. Zoetis Products LLC's involvement is solely related to its human health activities prior to Pfizer's acquisition of King/Alpharma. Zoetis paid a fine in the amount of Euro
11 million
(approximately $
14 million
) and was reimbursed by Pfizer in accordance with the Global Separation Agreement between Pfizer and Zoetis, which provides that Pfizer is obligated to indemnify Zoetis for any liabilities arising out of claims not related to its animal health assets. We filed an appeal of the decision on September 6, 2013.
In July 2014, we reached a commercial settlement with several large poultry customers in Mexico associated with specific lots of a Zoetis poultry vaccine. Although there have been no quality or efficacy issues with the manufacturing of this vaccine, certain shipments from several lots in Mexico may have experienced an issue in storage with a third party in Mexico that could have impacted their efficacy. We issued a recall of these lots in July 2014 and the product is currently unavailable in Mexico. We recorded a $13 million charge in
Other (income)/deductions
—
net
in the second quarter of 2014, and we do not expect any significant additional charges related to this issue. In the third quarter of 2014, we were notified of an insurance recovery of $1 million and have recorded this in
Other (income)/deductions
—
net
.
B. Guarantees and Indemnifications
In the ordinary course of business and in connection with the sale of assets and businesses, we indemnify our counterparties against certain liabilities that may arise in connection with the transaction or related to activities prior to the transaction. These indemnifications typically pertain to environmental, tax, employee and/or product-related matters and patent-infringement claims. If the indemnified party were to make a successful claim pursuant to the terms of the indemnification, we would be required to reimburse the loss. These indemnifications are generally subject to threshold amounts, specified claim periods and other restrictions and limitations. Historically, we have not paid significant amounts under these provisions and, as of
December 31, 2014
, recorded amounts for the estimated fair value of these indemnifications are not significant.
C. Purchase Commitments
As of December 31, 2014, we have agreements totaling $
81 million
to purchase goods and services that are enforceable and legally binding and include amounts relating to contract manufacturing and information technology services.
97
|
D. Brazil Lease Agreements
In September 2012, Pfizer's subsidiary, Laboratórios Pfizer Ltda. (“Laboratórios”), as lessee, and our subsidiary, PAH Brasil Participações Ltda., (PAH Brasil), as lessor, entered into: (i) the Private Instrument of Non Residential Lease Agreement and Others, which establishes and regulates the use of the real property at our Guarulhos, Brazil facility (the Real Property Lease) and (ii) the Private Instrument of Lease Agreement Movable Assets and Others, which establishes the terms of the use of the fixed assets at the same site (the Fixed Asset Lease and, together with the Real Property Lease, the Brazil Leases). As a result of a merger of PAH Brasil into Fort Dodge Saúde Animal Ltda. (Fort Dodge Brazil) with Fort Dodge Brazil surviving, the Brazil Leases were assigned to Fort Dodge Brazil, later renamed Zoetis Indústria de Produtos Veterinários Ltda. (Zoetis Brazil).
Rent, rent adjustment and penalty
. The monthly rent under the Brazil Leases corresponds to the amount of depreciation of the fixed assets and real property covered by the leases. During the first month that the leases were in effect, the rent under the Fixed Asset Lease was R
$752,459
(approximately $
0.4 million
) and the rent under the Real Property Lease was R$
479,977
(approximately $
0.2 million
). In subsequent periods, the parties will adjust these amounts to reflect the anticipated monthly depreciation amount and previously paid amounts may be adjusted if the amounts paid differ from actual depreciation. Late payments under Brazil Leases are subject to an adjustment plus a penalty equal to
2%
and interest on arrears of
1%
per month. A breach of either of the Brazil Leases that is not cured within 30 days from receipt of notice thereof is subject to a penalty equal to three monthly rent payments under the applicable lease. In addition to the rent, Laboratórios will pay expenses related to water consumption, sewerage and electricity as well as all taxes levied on the property.
Covenants and obligations.
Laboratórios is required to maintain the fixed assets and real property in the same condition as they were received, except for normal wear and tear and any improvements thereon, and is responsible for the repair of any damage. Improvements on the existing fixed assets and investments in new fixed assets are permitted under the Fixed Asset Lease, provided Fort Dodge Brazil is given notice thereof and consents to Laboratórios's proposal. Costs for such improvements are paid or reimbursed by Fort Dodge Brazil unless the fixed asset is used solely to manufacture human health products, in which case the cost shall be the responsibility of Laboratórios and, in the event a new asset is purchased, exclusive ownership shall be retained by Laboratórios. The Real Property Lease also permits improvements on the property to be implemented by Laboratórios at its sole and entire discretion. Laboratórios is entitled to reimbursement for any related costs as long as Fort Dodge Brazil consented to the implementation of the improvements.
Term and termination.
The Brazil Leases will last for a period of five years commencing on September 28, 2012. The Real Property Lease provides for automatic renewals for successive periods of one year at Laboratórios's discretion, unless notice of non-renewal is provided by Laboratórios. The Fixed Asset Lease can be extended for additional terms of five years by executing an amendment to such lease.
The Brazil Leases terminate at any time if agreed upon by the parties. The Brazil Leases also terminate upon satisfaction of certain regulatory conditions that will permit the animal health manufacturing operations of Laboratórios to be transferred to Zoetis Brazil and the human pharmaceutical manufacturing operations to be transferred to another facility or party. The Fixed Asset Lease automatically terminates upon the termination of the Real Property Lease or, subject to certain conditions, the master manufacturing and supply agreement that provides for Zoetis-supplied products. The Real Property Lease automatically terminates upon the termination of the Fixed Asset Lease or the expropriation of the property and cannot be terminated by Zoetis Brazil prior to termination of the master manufacturing and supply agreement that provides for Zoetis-supplied products. In the event the property is partially or completely destroyed, Laboratórios has the option to terminate the Real Property Lease.
E. Commitments under Operating Leases
We have facilities, vehicles and office equipment under various non-cancellable operating leases with third parties. Total rent expense, net of sublease rental income, was approximately $
29 million
in 2014, $
32 million
in 2013 and $
17 million
in 2012.
Future minimum lease payments under non-cancellable operating leases as of December 31, 2014, follow:
|
After
|
|
|||||||||||||||||||||||||||
|
(MILLIONS OF DOLLARS)
|
2015
|
|
2016
|
|
2017
|
|
2018
|
|
2019
|
|
2019
|
|
Total
|
|
||||||||||||||
|
Maturities
|
$
|
27
|
|
$
|
23
|
|
$
|
17
|
|
$
|
12
|
|
$
|
8
|
|
$
|
17
|
|
$
|
104
|
|
|||||||
|
18.
|
Segment, Geographic and Other Revenue Information
|
|
A.
|
Segment Information
|
In the first quarter of 2014, we realigned our segment reporting with respect to our CSS organization, which provides contract manufacturing services to third parties, to reflect how our chief operating decision maker currently evaluates our financial results. The revenue and earnings associated with CSS are now reported within
Other business activities
, separate from our four reportable segments. In 2013 and 2012, CSS results were reported in the EuAfME segment. The current presentation of segments is more reflective of our commercial business since CSS operates differently from our commercial operations within the geographic segments. CSS revenue for 2013 was
$53 million
(livestock - $
15 million
; companion animal - $
38 million
). CSS revenue for 2012 was
$28 million
(livestock -
$11 million
; companion animal -
$17 million
) CSS earnings (loss) for 2013 and 2012 were
$8 million
and
$(1) million
, respectively. We have revised our segment results presented herein to reflect this new segment structure, including for the comparable 2013 and 2012 periods.
The animal health medicines and vaccines industry is characterized by meaningful differences in customer needs across different regions. As a result of these differences, among other things, we manage our operations through
four
geographic regions. Each operating segment has responsibility for its commercial activities. Within each of these regional operating segments, we offer a diversified product portfolio, including vaccines, parasiticides, anti-infectives, medicated feed additives and other pharmaceuticals, for both livestock and companion animal customers.
98
|
Operating Segments
|
•
|
The U.S.
|
|
•
|
EuAfME—Includes, among others, the United Kingdom, Germany, France, Italy, Spain, Northern Europe and Central Europe as well as Russia, Turkey and South Africa.
|
|
•
|
CLAR––Includes Canada, Brazil, Mexico, Central America and other South American countries.
|
|
•
|
APAC––Includes Australia, Japan, New Zealand, South Korea, India, China/Hong Kong, Northeast Asia, Southeast Asia and South Asia.
|
Our chief operating decision maker uses the revenue and earnings of the four operating segments, among other factors, for performance evaluation and resource allocation.
Other Costs and Business Activities
Certain costs are not allocated to our operating segment results, such as costs associated with the following:
|
•
|
Other business activities
, includes our CSS contract manufacturing results, as well as expenses associated with our dedicated veterinary medicine research and development organization, research alliances, U.S. regulatory affairs and other operations focused on the development of our products. Other R&D-related costs associated with non-U.S. market and regulatory activities are generally included in the respective regional segment.
|
|
•
|
Corporate
, which is responsible for platform functions such as business technology, facilities, legal, finance, human resources, business development, public affairs and procurement, among others. These costs also include compensation costs and other miscellaneous operating expenses not charged to our operating segments, as well as interest income and expense.
|
|
•
|
Certain transactions and events such as (i)
Purchase accounting adjustments
, where we incur expenses associated with the amortization of fair value adjustments to inventory, intangible assets and property, plant and equipment; (ii)
Acquisition-related activities
, where we incur costs for restructuring and integration; and (iii)
Certain significant items
, which includes non-acquisition-related restructuring charges, certain asset impairment charges, stand-up costs and costs associated with cost reduction/productivity initiatives.
|
|
•
|
Other unallocated
includes certain overhead expenses associated with our global manufacturing operations not charged to our operating segments. Effective January 1, 2014,
Other unallocated
also includes certain costs associated with business technology and finance that specifically support our global manufacturing operations. These costs were previously reported in
Corporate
. Also, beginning in the first quarter of 2014, certain supply chain and global logistics costs that were previously reported in the four reportable segments are reported in
Other unallocated
. This presentation better reflects how we measure the performance of the global manufacturing organization.
|
Segment Assets
We manage our assets on a total company basis, not by operating segment. Therefore, our chief operating decision maker does not regularly review any asset information by operating segment and, accordingly, we do not report asset information by operating segment. Total assets were approximately $
6.6 billion
at both
December 31, 2014
and 2013.
99
|
Selected Statement of Income Information
|
Depreciation
|
||||||||||||
|
(MILLIONS OF DOLLARS)
|
Revenue
(a)
|
Earnings
(b)
|
and Amortization
(c)
|
|||||||||
|
Year Ended December 31, 2014
|
||||||||||||
|
U.S.
|
$
|
2,059
|
|
$
|
1,176
|
|
$
|
33
|
|
|||
|
EuAfME
|
1,141
|
|
437
|
|
20
|
|
||||||
|
CLAR
|
815
|
|
310
|
|
13
|
|
||||||
|
APAC
|
720
|
|
278
|
|
17
|
|
||||||
|
Total reportable segments
|
4,735
|
|
2,201
|
|
83
|
|
||||||
|
Other business activities
(d)
|
50
|
|
(314
|
)
|
28
|
|
||||||
|
Reconciling Items:
|
||||||||||||
|
Corporate
(e)
|
—
|
|
(571
|
)
|
31
|
|
||||||
|
Purchase accounting adjustments
(f)
|
—
|
|
(51
|
)
|
51
|
|
||||||
|
Acquisition-related costs
(g)
|
—
|
|
(8
|
)
|
—
|
|
||||||
|
Certain significant items
(h)
|
—
|
|
(205
|
)
|
5
|
|
||||||
|
Other unallocated
(i)
|
—
|
|
(232
|
)
|
6
|
|
||||||
|
$
|
4,785
|
|
$
|
820
|
|
$
|
204
|
|
||||
|
Year Ended December 31, 2013
|
||||||||||||
|
U.S.
|
$
|
1,902
|
|
$
|
1,045
|
|
$
|
43
|
|
|||
|
EuAfME
|
1,115
|
|
412
|
|
22
|
|
||||||
|
CLAR
|
778
|
|
266
|
|
18
|
|
||||||
|
APAC
|
713
|
|
271
|
|
13
|
|
||||||
|
Total reportable segments
|
4,508
|
|
1,994
|
|
96
|
|
||||||
|
Other business activities
(d)
|
53
|
|
(312
|
)
|
28
|
|
||||||
|
Reconciling Items:
|
||||||||||||
|
Corporate
(e)
|
—
|
|
(567
|
)
|
23
|
|
||||||
|
Purchase accounting adjustments
(f)
|
—
|
|
(48
|
)
|
48
|
|
||||||
|
Acquisition-related costs
(g)
|
—
|
|
(22
|
)
|
—
|
|
||||||
|
Certain significant items
(h)
|
—
|
|
(240
|
)
|
5
|
|
||||||
|
Other unallocated
(i)
|
—
|
|
(115
|
)
|
9
|
|
||||||
|
$
|
4,561
|
|
$
|
690
|
|
$
|
209
|
|
||||
|
Year Ended December 31, 2012
|
||||||||||||
|
U.S.
|
$
|
1,776
|
|
$
|
921
|
|
$
|
28
|
|
|||
|
EuAfME
|
1,068
|
|
376
|
|
27
|
|
||||||
|
CLAR
|
769
|
|
253
|
|
23
|
|
||||||
|
APAC
|
695
|
|
236
|
|
17
|
|
||||||
|
Total reportable segments
|
4,308
|
|
1,786
|
|
95
|
|
||||||
|
Other business activities
(d)
|
28
|
|
(276
|
)
|
17
|
|
||||||
|
Reconciling Items:
|
||||||||||||
|
Corporate
(e)
|
—
|
|
(506
|
)
|
25
|
|
||||||
|
Purchase accounting adjustments
(f)
|
—
|
|
(52
|
)
|
52
|
|
||||||
|
Acquisition-related costs
(g)
|
—
|
|
(53
|
)
|
10
|
|
||||||
|
Certain significant items
(h)
|
—
|
|
(96
|
)
|
1
|
|
||||||
|
Other unallocated
(i)
|
—
|
|
(93
|
)
|
—
|
|
||||||
|
$
|
4,336
|
|
$
|
710
|
|
$
|
200
|
|
||||
|
(a)
|
Revenue denominated in euros were
$710 million
in 2014,
$693 million
in 2013, and
$639 million
in 2012.
|
|
(b)
|
Defined as income before provision for taxes on income.
|
|
(c)
|
Certain production facilities are shared. Depreciation and amortization is allocated to the reportable operating segments based on estimates of where the benefits of the related assets are realized.
|
|
(d)
|
Other business activities
reflects R&D costs managed by our Research and Development organization and not allocated to the operating segments, as well as our contract manufacturing business.
|
100
|
|
(e)
|
Corporate
includes, among other things, administration expenses, interest expense, certain compensation and other costs not charged to our operating segments.
|
|
(f)
|
Purchase accounting adjustments
include certain charges related to intangible assets, property, plant and equipment not charged to our operating segments.
|
|
(g)
|
Acquisition-related costs
can include costs associated with acquiring, integrating and restructuring acquired businesses, such as allocated transaction costs, integration costs, restructuring charges and additional depreciation associated with asset restructuring. For additional information, see
|
|
(h)
|
Certain significant items
are substantive, unusual items that, either as a result of their nature or size, would not be expected to occur as part of our normal business on a regular basis. Such items primarily include certain costs related to becoming an independent public company, restructuring charges and implementation costs associated with our cost-reduction/productivity initiatives that are not associated with an acquisition, certain legal and commercial settlements and the impact of divestiture-related gains and losses. For additional information, see
|
|
•
|
For 2014, certain significant items primarily includes: (i) Zoetis stand-up costs of $
168 million
; (ii) charges related to a commercial settlement in Mexico of
$13 million
, partially offset by the insurance recovery of
$1 million
; (iii) restructuring charges of $
12 million
related to employee termination costs in EuAfME and
$6 million
related to employee termination costs in our global manufacturing operations, partially offset by a
$2 million
benefit related to the reversal of a previously established reserve as a result of a change in estimate of employee termination costs; (iv) intangible asset impairment charges related to an IPR&D project acquired with the FDAH acquisition in 2009 of $
6 million
; (v) costs of
$5 million
due to unusual investor-related activities; (vi) the Zoetis portion of a net gain on the sale of land by our Taiwan joint venture of $
3 million
income, and the net gain on the government-mandated sale of certain product rights in Argentina that were acquired with the FDAH acquisition in 2009 of
$2 million
income; (vii) additional depreciation associated with asset restructuring of $
1 million
; (viii) a pension plan settlement charge related to a divestiture of a manufacturing plant of
$4 million
; and (ix) an insurance recovery of other litigation related charges of $
2 million
income. Stand-up costs include certain nonrecurring costs related to becoming an independent public company, such as new branding (including changes to the manufacturing process for required new packaging), the creation of standalone systems and infrastructure, site separation, accelerated vesting and associated cash payment related to certain Pfizer equity awards, and certain legal registration and patent assignment costs.
|
|
•
|
For 2013, certain significant items includes: (i) Zoetis stand-up costs of $
206 million
; (ii) $
20 million
income primarily related to a reversal of certain employee termination expenses, partially offset by restructuring charges related to exiting certain manufacturing and research facilities; (iii) $
6 million
income on the government-mandated sale of certain product rights in Brazil that were acquired with the FDAH acquisition in
2009
; (iv) asset impairment charges associated with asset restructuring of $
19 million
; (v) additional depreciation associated with asset restructuring of $
8 million
; (vi) write-offs of inventory and intercompany accounts that were transferred to us as part of the Separation from Pfizer of $
24 million
; and (vii) litigation-related charges of $
5 million
.
|
|
•
|
In 2012, certain significant items includes: (i)
$115 million
for restructuring charges and implementation costs associated with our cost-reduction/productivity initiatives that are not associated with an acquisition; (ii)
$14 million
income related to a favorable legal settlement for an intellectual property matter; and (iii)
$4 million
income due to a change in estimate related to transitional manufacturing purchase agreements associated with divestitures.
|
|
(i)
|
Includes overhead expenses associated with our manufacturing operations.
|
B. Geographic Information
Revenue exceeded
$100 million
in each of nine countries outside the United States in 2014, and in each of eight countries outside the United States in 2013 and 2012. The United States was the only country to contribute more than
10%
of total revenue in each year.
Property, plant and equipment, less accumulated depreciation, by geographic region follow:
|
As of December 31,
|
||||||||
|
(MILLIONS OF DOLLARS)
|
2014
|
|
2013
|
|
||||
|
U.S.
|
$
|
867
|
|
$
|
827
|
|
||
|
EuAfME
|
217
|
|
233
|
|
||||
|
CLAR
|
104
|
|
114
|
|
||||
|
APAC
|
130
|
|
121
|
|
||||
|
Property, plant and equipment, less accumulated depreciation
|
$
|
1,318
|
|
$
|
1,295
|
|
||
|
C.
|
Other Revenue Information
|
Significant Customers
We sell our livestock products primarily to veterinarians and livestock producers as well as third-party veterinary distributors, and retail outlets who generally sell the products to livestock producers. We sell our companion animal products primarily to veterinarians who then sell the products to pet owners. In 2014 and 2013, sales to our largest U.S. veterinary distributor represented approximately
11%
of total revenue. No single customer accounts for
10%
or more of our total revenue in 2012.
101
|
Revenue by Species
Significant species revenue are as follows:
|
Year Ended December 31,
|
||||||||||||
|
(MILLIONS OF DOLLARS)
|
2014
|
|
2013
|
|
2012
|
|
||||||
|
Livestock:
|
||||||||||||
|
Cattle
|
$
|
1,747
|
|
$
|
1,628
|
|
$
|
1,603
|
|
|||
|
Swine
|
695
|
|
652
|
|
592
|
|
||||||
|
Poultry
|
568
|
|
551
|
|
506
|
|
||||||
|
Other
|
93
|
|
85
|
|
94
|
|
||||||
|
3,103
|
|
2,916
|
|
2,795
|
|
|||||||
|
Companion Animal:
|
||||||||||||
|
Equine
|
182
|
|
179
|
|
185
|
|
||||||
|
Dogs and Cats
|
1,450
|
|
1,413
|
|
1,328
|
|
||||||
|
1,632
|
|
1,592
|
|
1,513
|
|
|||||||
|
Contract Manufacturing
|
50
|
|
53
|
|
28
|
|
||||||
|
Total revenue
|
$
|
4,785
|
|
$
|
4,561
|
|
$
|
4,336
|
|
|||
Revenue by Major Product Category
Significant revenue by major product category are as follows:
|
Year Ended December 31,
|
||||||||||||
|
(MILLIONS OF DOLLARS)
|
2014
|
|
2013
|
|
2012
|
|
||||||
|
Anti-infectives
|
$
|
1,398
|
|
$
|
1,295
|
|
$
|
1,268
|
|
|||
|
Vaccines
|
1,212
|
|
1,189
|
|
1,108
|
|
||||||
|
Parasiticides
|
708
|
|
691
|
|
675
|
|
||||||
|
Medicated feed additives
|
479
|
|
446
|
|
403
|
|
||||||
|
Other pharmaceuticals
|
783
|
|
739
|
|
710
|
|
||||||
|
Other non-pharmaceuticals
|
155
|
|
148
|
|
144
|
|
||||||
|
Contract manufacturing
|
50
|
|
53
|
|
28
|
|
||||||
|
Total revenue
|
$
|
4,785
|
|
$
|
4,561
|
|
$
|
4,336
|
|
|||
|
19.
|
Transactions and Agreements with Pfizer
|
Zoetis had related party transactions with Pfizer through the completion of the Exchange Offer on
June 24, 2013
. As of the completion of the Exchange Offer, Pfizer is no longer a related party. Activities while Pfizer was a related party, as well as ongoing agreements with Pfizer, are detailed below.
|
A.
|
Pre-Separation Period
|
For the combined statement of income for the year ended December 31, 2012, the costs of goods manufactured in manufacturing plants that were shared with other Pfizer business units was approximately
$420 million
.
In the pre-Separation period, Pfizer provided significant corporate, manufacturing and shared services functions and resources to us. Our combined financial statements as of and for the year ended
December 31, 2013
, respectively, reflect an allocation of these costs. For further information about the cost allocations for these services and resources, see
Note 3A. Basis of Presentation: Basis of Presentation Prior to the Separation.
Management believes that these allocations are a reasonable reflection of the services received. However, these allocations may not reflect the expenses that would have been incurred if we had operated as an independent public company for the period presented.
Pfizer uses a centralized approach to cash management and financing its operations. In the pre-Separation period, cash deposits were remitted to Pfizer on a regular basis and were reflected in business unit equity and, similarly, Zoetis' cash disbursements were funded through Pfizer's cash accounts and were reflected within
Business unit equity
.
|
B.
|
Agreements with Pfizer
|
In connection with the Separation and IPO, we and Pfizer entered into agreements that provide a framework for our ongoing relationship with Pfizer, certain of which are described below.
102
|
|
•
|
Global separation agreement
. This agreement governs the relationship between Pfizer and us following the IPO and includes provisions related to the allocation of assets and liabilities, indemnification, delayed transfers and further assurances, mutual releases, insurance and certain covenants.
|
|
•
|
Transitional services agreement
. This agreement grants us the right to continue to use certain of Pfizer's services and resources related to our corporate functions, such as business technology, facilities, finance, human resources, public affairs and procurement, in exchange for mutually agreed-upon fees based on Pfizer's costs of providing these services.
|
|
•
|
Tax matters agreement
. This agreement governs ours and Pfizer's respective rights, responsibilities and obligations with respect to tax liabilities and benefits, tax attributes, the preparation and filing of tax returns, the control of audits and other tax proceedings and other matters regarding taxes. Pursuant to this agreement, we have also agreed to certain covenants that contain restrictions intended to preserve the tax-free status of certain transactions, and we have agreed to indemnify Pfizer and its affiliates against any and all tax-related liabilities incurred by them relating to these transactions to the extent caused by an acquisition of our stock or assets or by any other action undertaken by us.
|
|
•
|
Research and development collaboration and license agreement
. This agreement permits certain of our employees to be able to review a Pfizer database to identify compounds that may be of interest to the animal health field. Pfizer has granted to us an option to enter into a license agreement subject to certain restrictions and requirements and we will make payments to Pfizer.
|
|
•
|
Employee matters agreement
. This agreement governs ours and Pfizer's respective rights, responsibilities and obligations with respect to the following matters: employees and former employees (and their respective dependents and beneficiaries) who are or were associated with Pfizer, us or the parties' respective subsidiaries or affiliates; the allocation of assets and liabilities generally relating to employees, employment or service-related matters and employee benefit plans; and other human resources, employment and employee benefits matters.
|
|
•
|
Master manufacturing and supply agreements
. These two agreements govern our manufacturing and supply arrangements with Pfizer. Under one of these agreements, Pfizer will manufacture and supply us with animal health products. Under this agreement, our manufacturing and supply chain leadership will have oversight responsibility over product quality and other key aspects of the manufacturing process with respect to the Pfizer-supplied products. Under the other agreement, we will manufacture and supply certain human health products to Pfizer.
|
|
•
|
Environmental matters agreement
. This agreement governs the performance of remedial actions for liabilities allocated to each party under the global separation agreement; addresses our substitution for Pfizer with respect to animal health assets and remedial actions allocated to us (including substitution related to, for example, permits, financial assurances and consent orders); allows our conditional use of Pfizer's consultants and contractors to assist in the conduct of remedial actions; and addresses the exchange of related information between the parties. The agreement also sets forth standards of conduct for remedial activities at the co-located facilities: Guarulhos, Brazil; Catania, Italy; Hsinchu, Taiwan; and Kalamazoo, Michigan, in the United States. In addition, the agreement sets forth site-specific terms to govern conduct at several of these co-located facilities.
|
|
•
|
Screening services agreement
. This agreement requires us to provide certain high throughput screening services to Pfizer's R&D organization for which Pfizer pays to us agreed-upon fees.
|
|
•
|
Intellectual property license agreements
. Under these agreements (i) Pfizer and certain of its affiliates licensed to us and certain of our affiliates the right to use certain intellectual property rights in the animal health field; (ii) we licensed to Pfizer and certain of its affiliates certain rights to intellectual property in all fields outside the animal health field; and (iii) Pfizer granted us rights with respect to certain trademarks and copyrighted works.
|
Following the Separation, we own, have access to or have the right to use, substantially all of the resources that were used, or held for use, exclusively in Pfizer's animal health business, including the following:
|
•
|
Intellectual Property
. As part of the Separation, Pfizer assigned to us ownership of certain animal health related patents, pending patent applications, and trademark applications and registrations. In addition, Pfizer licensed to us the right to use certain intellectual property rights in the animal health field. We licensed to Pfizer the right to use certain of our trademarks and substantially all of our other intellectual property rights in the human health field and all other fields outside of animal health. In addition, Pfizer granted us a transitional license to use certain of Pfizer's trademarks and we granted Pfizer a transitional license to use certain of our trademarks for a period of time following the completion of the IPO.
|
|
•
|
Manufacturing Facilities
. Our global manufacturing network consists of
13
“anchor” manufacturing sites and
14
“satellite” manufacturing sites. Ownership of, or the existing leasehold interest in, these facilities were conveyed to us by Pfizer as part of the Separation. Among these
27
manufacturing sites is our facility in Guarulhos, Brazil, which we leased back to Pfizer. Certain of our products are currently manufactured at
11
manufacturing sites that were retained by Pfizer. The products manufactured by Pfizer at these sites and at our Guarulhos, Brazil facility continue to be supplied to us under the terms of a manufacturing and supply agreement we entered into with Pfizer.
|
|
•
|
R&D Facilities
. We have R&D operations co-located with certain of our manufacturing sites in Australia, Belgium, Brazil, Spain and the United States to facilitate the efficient transfer of production processes from our laboratories to manufacturing sites. In addition, we maintain R&D operations at non-manufacturing locations in Belgium, Brazil, India and the United States. As part of the Separation, Pfizer conveyed to us its interest in each of these R&D facilities, with the exception of our Mumbai, India facility, which we expect Pfizer to transfer to us after the completion of the Separation for cash consideration to be agreed upon, and, in the interim, we are leasing this facility from Pfizer.
|
103
|
|
•
|
Employees
. In general, as part of the Separation, employees of Pfizer who were substantially dedicated to the animal health business became our employees. However, labor and employment laws or other business considerations in some jurisdictions delayed Pfizer from transferring to us employees who are substantially dedicated to the animal health business. In those instances, to the extent permissible under applicable law, we and Pfizer entered into mutually-acceptable arrangements to provide for continued operation of the business until such time as the employees in those jurisdictions can be transferred to us.
|
The amounts charged under each of the agreements with Pfizer, through the completion of the Exchange Offer on
June 24, 2013
, were as follows:
|
(MILLIONS OF DOLLARS)
|
||||
|
Transitional services agreement
|
$
|
63
|
|
|
|
Master manufacturing and supply agreements
|
130
|
|
||
|
Employee matters agreement
|
99
|
|
||
In certain jurisdictions, while the Zoetis entities obtain appropriate registration and licensing, Pfizer entities purchase product from Zoetis entities and resell such product to the local Zoetis entity at cost. This activity is reflected in
Accounts receivable
for the product Pfizer purchases from Zoetis entities and in
Accounts payable
for the product purchased from such Pfizer entities by our local Zoetis entity.
In 2014, Zoetis and Pfizer entered into an agreement whereby Pfizer agreed to transfer certain product registration and application rights associated with our operations in Indonesia. The fair value of these rights, as agreed by both parties, was
$8 million
, payable by Zoetis to Pfizer in four annual installments of
$2 million
each, beginning in October 2014. At December 31, 2014, the fair value of these indefinite-lived intangible assets of approximately
$8 million
was included in
Identifiable intangible assets, less accumulated amortization
and the remaining payable to Pfizer was included in
Other current liabilities
(
$2 million
) and
Other noncurrent liabilities
(
$4 million
).
At December 31, 2014 and 2013,
$24 million
and $
121 million
, respectively, was included in
Accounts receivable
as receivable from Pfizer, and
$42 million
and $
181 million
, respectively, was included in
Accounts Payable
as payable to Pfizer.
We remained part of Pfizer's consolidated U.S. tax returns until we fully separated on
June 24, 2013
, and therefore reflected 2013 U.S. income taxes payable of
$31 million
as a payable to Pfizer in
Accrued expenses
as of December 31, 2013.
104
|
20. Selected Quarterly Financial Data (Unaudited)
|
(MILLIONS OF DOLLARS, EXCEPT PER COMMON SHARE DATA)
|
FIRST
|
|
SECOND
|
|
THIRD
|
|
FOURTH
|
|
||||||||
|
2014:
|
||||||||||||||||
|
Revenue
|
$
|
1,097
|
|
$
|
1,158
|
|
$
|
1,210
|
|
$
|
1,320
|
|
||||
|
Costs and expenses
(a)
|
867
|
|
953
|
|
970
|
|
1,150
|
|
||||||||
|
Restructuring charges and certain acquisition-related costs
|
3
|
|
5
|
|
2
|
|
15
|
|
||||||||
|
Income before provision for taxes on income
|
227
|
|
200
|
|
238
|
|
155
|
|
||||||||
|
Provision for taxes on income
|
72
|
|
61
|
|
71
|
|
29
|
|
||||||||
|
Net income before allocation to noncontrolling interests
|
155
|
|
139
|
|
167
|
|
126
|
|
||||||||
|
Net income/(loss) attributable to noncontrolling interests
|
—
|
|
3
|
|
1
|
|
—
|
|
||||||||
|
Net income/(loss) attributable to Zoetis
|
$
|
155
|
|
$
|
136
|
|
$
|
166
|
|
$
|
126
|
|
||||
|
Earnings per common share--basic
(b)
|
$
|
0.31
|
|
$
|
0.27
|
|
$
|
0.33
|
|
$
|
0.25
|
|
||||
|
Earnings per common share--diluted
(b)
|
$
|
0.31
|
|
$
|
0.27
|
|
$
|
0.33
|
|
$
|
0.25
|
|
||||
|
2013:
|
||||||||||||||||
|
Revenue
|
$
|
1,090
|
|
$
|
1,114
|
|
$
|
1,103
|
|
$
|
1,254
|
|
||||
|
Costs and expenses
(a)
|
891
|
|
947
|
|
915
|
|
1,092
|
|
||||||||
|
Restructuring charges and certain acquisition-related costs
|
7
|
|
(20
|
)
|
3
|
|
36
|
|
||||||||
|
Income before provision for taxes on income
|
192
|
|
187
|
|
185
|
|
126
|
|
||||||||
|
Provision for taxes on income
|
52
|
|
59
|
|
54
|
|
22
|
|
||||||||
|
Net income before allocation to noncontrolling interests
|
140
|
|
128
|
|
131
|
|
104
|
|
||||||||
|
Net income/(loss) attributable to noncontrolling interests
|
—
|
|
—
|
|
—
|
|
(1
|
)
|
||||||||
|
Net income attributable to Zoetis
|
$
|
140
|
|
$
|
128
|
|
$
|
131
|
|
$
|
105
|
|
||||
|
Earnings per common share--basic
(b)
|
$
|
0.28
|
|
$
|
0.26
|
|
$
|
0.26
|
|
$
|
0.21
|
|
||||
|
Earnings per common share--diluted
(b)
|
$
|
0.28
|
|
$
|
0.26
|
|
$
|
0.26
|
|
$
|
0.21
|
|
||||
|
(a)
|
Costs and expenses in the fourth quarter reflect seasonal trends as well as specific costs associated with the build-up of our capabilities as an independent company.
|
|
(b)
|
The weighted average common shares outstanding for both basic and diluted earnings per share for 2012 was calculated using an aggregate of
500 million
shares of common stock outstanding, which was the number of Zoetis Inc. shares outstanding at the time of the IPO. There were no Zoetis RSUs, stock options or performance shares outstanding prior to the IPO.
|
Basic and diluted EPS are computed independently for each of the periods presented. Accordingly, the sum of the quarterly EPS amounts may not agree to the total for the year.
|
21.
|
Subsequent Events
|
Effective February 3, 2015, William F. Doyle entered into an indemnification agreement with the company on the company’s standard form of indemnification agreement for officers and directors. A copy of the company’s form of indemnification agreement was previously filed by the company as Exhibit 10.19 to Amendment No. 4 to the company’s Registration Statement on Form S-1 (File No. 333-183254), as originally filed with the Securities and Exchange Commission on August 13, 2012, as subsequently amended.
On February 10, 2015, after satisfying all customary closing conditions, including clearance under the Hart-Scott-Rodino Antitrust Improvements Act, we completed the purchase of certain assets of Abbott Animal Health. The purchase price includes a $
230 million
cash payment on the date of closing and a contingent payment of $
25 million
to be paid within one year of closing if certain product supply conditions are met. Abbott Animal Health is a companion animal health business focused on the veterinary surgical suite. The final allocation of the purchase price amongst assets, liabilities and goodwill is subject to final valuation.
105
|
Zoetis Inc. and Subsidiaries
Schedule II—Valuation and Qualifying Accounts
|
Balance,
|
|
Balance,
|
|
|||||||||||||
|
Beginning of
|
|
End of
|
|
|||||||||||||
|
(MILLIONS OF DOLLARS)
|
Period
|
|
Additions
|
|
Deductions
|
|
Period
|
|
||||||||
|
Year Ended December 31, 2014
|
||||||||||||||||
|
Allowance for doubtful accounts
|
$
|
31
|
|
$
|
5
|
|
$
|
(4
|
)
|
$
|
32
|
|
||||
|
Year Ended December 31, 2013
|
||||||||||||||||
|
Allowance for doubtful accounts
|
49
|
|
6
|
|
(24
|
)
|
(a)
|
31
|
|
|||||||
|
Year Ended December 31, 2012
|
||||||||||||||||
|
Allowance for doubtful accounts
|
29
|
|
23
|
|
(3
|
)
|
49
|
|
||||||||
(a)
Primarily reflects Separation Adjustments (see Notes to Consolidated and Combined Financial Statements—
Note 2B. The Separation, Adjustments Associated with the Separation, Senior Notes Offering, Initial Public Offering and Exchange Offer
—
Adjustments Associated with the Separation
)
as well as an adjustment related to improved accounts receivable collection experience.
106
|
None.
|
Item 9A.
|
Controls and Procedures
|
Disclosure Controls and Procedures
An evaluation was carried out under the supervision and with the participation of the company's management, including our Chief Executive Officer and Chief Financial Officer, of the effectiveness of the design and operation of our disclosure controls and procedures (as defined in Rules 13a-15(e) and 15d-15(e) under the Securities Exchange Act of 1934). Based upon that evaluation as of
December 31, 2014
, the company's Chief Executive Officer and Chief Financial Officer concluded that the company's disclosure controls and procedures are effective in alerting them in a timely manner to material information required to be disclosed in our periodic reports filed with the SEC.
Management's Report on Internal Control over Financial Reporting
Management is responsible for establishing and maintaining adequate internal control over financial reporting, as such term is defined under Rule 13a-15(f) of the Securities Exchange Act of 1934. Under the supervision and with the participation of management, including the company's Chief Executive Officer and Chief Financial Officer, we conducted an evaluation of the effectiveness of our internal control over financial reporting based on the framework in
Internal Control - Integrated Framework (1992)
issued by the Committee of Sponsoring Organizations of the Treadway Commission. Based on our evaluation under the framework in
Internal Control - Integrated Framework
, our management concluded that our internal control over financial reporting was effective as of
December 31, 2014
.
Changes in Internal Controls
During our most recent fiscal quarter, there has not been any change in our internal control over financial reporting (as such term is defined in Rules 13a-15(f) and 15d-15(f) under the Securities Exchange Act of 1934) that has materially affected, or is reasonably likely to materially affect, our internal control over financial reporting.
We are currently migrating many of our financial reporting and processing systems to an enterprise-wide solution. These system implementations are part of our ongoing stand-up efforts, and we plan to continue to implement such systems throughout the business over the course of the next few years. In connection with these implementations and resulting business process changes, we will enhance the design and documentation of our internal control over financial reporting process to maintain effective controls over our financial reporting.
None.
107
|
Information about our directors is incorporated by reference from the discussion under the heading
Item 1
-
Election of Directors
in our 2015 Proxy Statement. Information about compliance with Section 16(a) of the Exchange Act is incorporated by reference from the discussion under the heading
Ownership of Our Common Stock
in our 2015 Proxy Statement. Information about Zoetis Policies on Business Conduct governing our employees, including our Chief Executive Officer, Chief Financial Officer and Principal Accounting Officer, and the Code of Business Conduct and Ethics for Members of the Board of Directors, is incorporated by reference from the discussions under the headings
Corporate Governance at Zoetis
in our 2015 Proxy Statement. Information regarding the procedures by which our stockholders may recommend nominees to our Board of Directors is incorporated by reference from the discussion under the heading
Corporate Governance at Zoetis
in our 2015 Proxy Statement. Information about our Audit Committee, including the members of the Committee, and our Audit Committee financial experts, is incorporated by reference from the discussion under the heading
Corporate Governance at Zoetis
in our 2015 Proxy Statement.
Information about director compensation is incorporated by reference from the discussion under the heading
Corporate Governance at Zoetis
in our 2015 Proxy Statement. Information about executive compensation is incorporated by reference from the discussion under the heading
Executive
Compensation
in our 2015 Proxy Statement.
|
Item 12.
|
Security Ownership Of Certain Beneficial Owners And Management And Related Stockholder Matters.
|
Information required by this item is incorporated by reference from the discussion under the heading
Ownership of Our Common Stock
in our 2015 Proxy Statement.
Relationship with Pfizer
Prior to the completion of the senior notes offering, Pfizer transferred to us subsidiaries holding substantially all of the assets and liabilities of its animal health business. In exchange, we issued or transferred to Pfizer: (i) all of the issued and outstanding shares of our Class A common stock; (ii) all of the issued and outstanding shares of our Class B common stock; (iii) the Pfizer-owned notes; and (iv) an amount of cash equal to substantially all of the net proceeds we received in the senior notes offering, which amount was paid immediately prior to the completion of the IPO. Prior to the completion of the IPO, all of our outstanding shares of common stock were owned by Pfizer. Immediately following the completion of the IPO, Pfizer owned 100% of our outstanding Class B common stock and no shares of our Class A common stock, giving Pfizer 80.2% of the economic interest and combined voting power in shares of our outstanding common stock other than with respect to the election of directors and 97.6% of the combined voting power of our outstanding common stock with respect to the election of directors. On June 24, 2013, an exchange offer was completed, whereby Pfizer shareholders exchanged a portion of Pfizer common stock for Zoetis common stock, resulting in the full separation of Zoetis and the disposal of Pfizer's entire ownership and voting interest in Zoetis (the Exchange Offer).
In connection with the IPO and the Separation, we and Pfizer entered into, certain agreements that provide a framework for our ongoing relationship with Pfizer. Of the agreements summarized below, the material agreements are filed as exhibits to this 2014 Annual Report, and the summaries of these agreements set forth the terms of the agreements that we believe are material. The summaries below are qualified in their entirety by reference to the full text of such agreements.
Global separation agreement
We entered into a global separation agreement with Pfizer immediately prior to the completion of the IPO that governs the relationship between Pfizer and us following the IPO.
Allocation of assets and liabilities.
Notwithstanding the transfer of assets and assumption of liabilities that occurred prior to the completion of the Separation, the global separation agreement generally allocates assets and liabilities to us and Pfizer according to the business to which such assets or liabilities relate. In general, Pfizer conveyed, leased or licensed to us ownership of all assets that are used exclusively or held for use exclusively in Pfizer's animal health business and we have assumed all of Pfizer's historical and future liabilities to the extent relating to, arising out of or resulting from, the operation of the animal health business (whether before, on or after the consummation of the IPO), including:
|
•
|
warranty obligations created as part of the animal health business;
|
|
•
|
product liability claims with respect to any animal health product;
|
|
•
|
environmental liabilities relating to the animal health business and environmental liabilities at the real property that we acquired from Pfizer;
|
|
•
|
liabilities related to animal health businesses or operations that were discontinued or divested by Pfizer;
|
|
•
|
litigation liabilities; and
|
|
•
|
our debt obligations, including under the senior notes offering.
|
108
|
We and Pfizer agreed that our cash balance on the date of the completion of the IPO would be at least $300 million.
Indemnification
. Generally, each party will indemnify, defend and hold harmless the other party and its subsidiaries (and each of their affiliates) and their respective officers, employees and agents from and against any and all losses relating to, arising out of or resulting from: (i) liabilities assumed by the indemnifying party and (ii) any breach by the indemnifying party or its subsidiaries of the global separation agreement and the other agreements described in this section (unless such agreement provides for separate indemnification). The global separation agreement also specifies procedures with respect to claims subject to indemnification.
Delayed transfers and further assurances.
To the extent transfers of assets and assumptions of liabilities related to our business were not completed prior to the date of the agreement because of a necessary consent or governmental approval or because a condition precedent to any such transfer was not satisfied or any related relevant fact was not realized, the parties agreed to cooperate to effect such transfers or assumptions for agreed upon consideration as promptly as practicable.
Each of the parties agreed to cooperate with the other party and use commercially reasonable best efforts to take or to cause to be taken all actions, and to do, or to cause to be done, all things reasonably necessary, proper or advisable under applicable law, regulations and agreements to consummate and make effective the transactions contemplated by the global separation agreement and the other agreements described in this section.
Mutual releases
. Generally, each of Pfizer and us released the other party from any and all liabilities. The liabilities released include liabilities arising under any contract or agreement, existing or arising from any acts or events occurring or failing to occur or any conditions existing before the completion of the IPO.
Term.
The global separation agreement will continue unless terminated by us and Pfizer, although certain rights and obligations terminated upon the completion of the Exchange Offer.
Transitional services agreements
We entered into a transitional services agreement with Pfizer immediately prior to the completion of the IPO that granted us the right to continue to use certain of Pfizer's services and resources related to our corporate functions, such as business technology, facilities, finance, human resources, public affairs and procurement. We refer to these services and resources, collectively, as the “Pfizer services.”
We pay Pfizer mutually agreed-upon fees for the Pfizer services, which are based on Pfizer's costs of providing the Pfizer services. During the two years following the completion of the IPO (from February 6, 2013, through February 5, 2015), the markup for these services was 0% and, for the remainder of the term of the agreement, Pfizer may introduce a markup of 7%. For the services which Pfizer continues to provide to Zoetis under this agreement, a 7% markup will apply for the remainder of 2015. We are able to request good faith negotiations of the applicable fees if we believe that the fees materially overcompensate Pfizer for any of the Pfizer services and Pfizer has reciprocal rights if it believes the fees materially under compensate Pfizer. Third-party costs are passed through to us at Pfizer's or its affiliates' cost.
Under the agreement we are able to use the Pfizer services for a fixed term established on a service-by-service basis. However, we generally have the right to terminate a service earlier if we give notice to Pfizer. Partial reduction in the provision of any service requires Pfizer's consent. In addition, either party is able to terminate the agreement due to a material breach of the other party, subject to limited cure periods.
In addition, we may, from time to time, agree to provide to Pfizer certain limited reverse transitional services with respect to the continued use of certain assets or resources that Pfizer conveyed to us prior to the completion of the IPO. To the extent such services are provided, Pfizer will pay us a mutually agreed-upon fee for these services, which fee will be based on our costs of providing the service to Pfizer.
Tax matters agreement
Allocation of taxes
. We entered into a tax matters agreement with Pfizer immediately prior to the completion of the IPO that governs the parties' respective rights, responsibilities and obligations with respect to tax liabilities and benefits, tax attributes, the preparation and filing of tax returns, the control of audits and other tax proceedings and other matters regarding taxes. In general, under the agreement:
|
•
|
Pfizer is responsible for any U.S. federal, state, local or foreign income taxes and any U.S. state or local non-income taxes (and any related interest, penalties or audit adjustments and including those taxes attributable to our business) reportable on a consolidated, combined or unitary return that includes Pfizer or any of its subsidiaries (and us and/or any of our subsidiaries) for any periods or portions thereof ending on or prior to December 31, 2012. We are responsible for the portion of any such taxes for periods or portions thereof beginning on or after January 1, 2013, as would be applicable to us if we filed the relevant tax returns on a standalone basis.
|
|
•
|
We are responsible for any U.S. federal, state, local or foreign income taxes and any U.S. state or local non-income taxes (and any related interest, penalties or audit adjustments) that are reportable on returns that include only us and/or any of our subsidiaries, for all tax periods whether before or after the Separation date.
|
|
•
|
Pfizer is responsible for certain specified foreign taxes directly resulting from certain aspects of the Separation.
|
We are not generally entitled to receive payment from Pfizer in respect of any of our tax attributes or tax benefits or any reduction of taxes of Pfizer. Neither party's obligations under the agreement are limited in amount or subject to any cap. The agreement also assigns responsibilities for administrative matters, such as the filing of returns, payment of taxes due, retention of records and conduct of audits, examinations or similar proceedings. In addition, the agreement provides for cooperation and information sharing with respect to tax matters.
Pfizer is primarily responsible for preparing and filing any tax return with respect to the Pfizer affiliated group for U.S. federal income tax purposes and with respect to any consolidated, combined, unitary or similar group for U.S. state or local or foreign income tax purposes or U.S. state or local non-income tax purposes that includes Pfizer or any of its subsidiaries, including those that also include us and/or any of our subsidiaries. We are generally responsible for preparing and filing any tax returns that include only us and/or any of our subsidiaries.
109
|
The party responsible for preparing and filing a given tax return generally has exclusive authority to control tax contests related to any such tax return. We generally have exclusive authority to control tax contests with respect to tax returns that include only us and/or any of our subsidiaries.
Preservation of the tax-free status of certain aspects of the Separation
. We and Pfizer intend the Separation, the debt-for-debt-exchange, the debt-for-equity exchange, the transfer of cash proceeds of the senior notes offering to Pfizer and the Exchange Offer to qualify as a reorganization pursuant to which no gain or loss is recognized by Pfizer or its shareholders for federal income tax purposes under Sections 355, 368(a)(1)(D) and related provisions of the Code. In addition, we and Pfizer intend for the Separation, the debt-for-debt-exchange, the debt-for- equity exchange, the Exchange Offer and certain related transactions to qualify for tax-free treatment under U.S. federal, state and local tax law and/or foreign tax law.
Pfizer has received a private letter ruling from the IRS to the effect that, among other things, the Separation, the senior notes offering, the debt-for-equity exchange, the transfer of cash proceeds of the senior notes offering to Pfizer and the Exchange Offer will qualify as a transaction that is tax-free for U.S. federal income tax purposes under Sections 355 and 368(a)(1)(D) of the Code. In addition, Pfizer has received and will receive opinions from its outside tax advisors regarding the tax-free status of these transactions and certain related transactions. In connection with the ruling and the opinions, we and Pfizer have made and will make certain representations regarding the past and future conduct of our respective businesses and certain other matters.
We have agreed to certain covenants that contain restrictions intended to preserve the tax-free status of the Separation, the senior notes offering, the debt-for-equity exchange, the transfer of cash proceeds of the senior notes offering to Pfizer, the Exchange Offer and certain related transactions. Such covenants generally restrict our ability to pre-pay, pay down, redeem, retire or otherwise acquire, however effected, including pursuant to the terms thereof, the 2023 notes prior to stated maturity of the 2023 notes or to take or permit to be taken any action at any time, including, without limitation, any modification to the terms of the 2023 notes that could jeopardize, directly or indirectly, the qualification, in whole or part, of any of the Pfizer-owned notes as “securities” within the meaning of Section 361(a) of the Code. However, pursuant to the tax matters agreement, we are permitted to redeem the 2023 notes pursuant to the change of control redemption provision contained in the indenture governing the notes. We may take certain actions prohibited by these covenants only if Pfizer receives a private letter ruling from the IRS or we obtain and provide to Pfizer an opinion from a U.S. tax counsel or accountant of recognized national standing, in either case acceptable to Pfizer in its sole and absolute discretion, to the effect that such action would not jeopardize the tax-free status of these transactions. We will be barred from taking any action, or failing to take any action, where such action or failure to act adversely affects or could reasonably be expected to adversely affect the tax-free status of these transactions, for all time periods. In addition, during the time period ending two years after the date of the Exchange Offer these covenants will include specific restrictions on our:
|
•
|
issuance or sale of stock or other securities (including securities convertible into our stock but excluding certain compensatory arrangements);
|
|
•
|
sales of assets outside the ordinary course of business; and
|
|
•
|
entering into any other corporate transaction which would cause us to undergo a 40% or greater change in our stock ownership.
|
We generally agreed to indemnify Pfizer and its affiliates against any and all tax-related liabilities incurred by them relating to the Separation, the debt-for-debt-exchange, the debt-for-equity exchange, the transfer of cash proceeds of the senior notes offering to Pfizer, the Exchange Offer and/or certain related transactions to the extent caused by an acquisition of our stock or assets or by any other action undertaken by us. This indemnification provision applies even if Pfizer has permitted us to take an action that would otherwise have been prohibited under the tax-related covenants described above.
Research and development collaboration and license agreement
We entered into an R&D collaboration and license agreement with Pfizer immediately prior to the completion of the IPO. Under the agreement, certain of our employees are able to review a Pfizer database to identify compounds that may be of interest to us in the animal health field, and upon identifying any such compounds, we are able to request permission (known as “intent to access”) to conduct certain limited research activities. If Pfizer grants intent to access, the scope of permitted research activities will be specified on a case-by case basis by Pfizer and may include screening the Pfizer compound library. To conduct further R&D on the class of compounds identified during intent to access, we must request permission (known as “approval in principle”) from a joint steering committee described below and any approval will be subject to any restrictions specified by the joint steering committee. Certain compounds that we began researching prior to the completion of the IPO were granted approval in principle as of the completion of the IPO.
Upon granting approval in principle, Pfizer will grant us an option to enter into a license agreement, which will be exercisable no later than five years after the approval in principle is granted. Prior to exercising the option, our license from Pfizer under the agreement will be non-exclusive, except with respect to patents and know-how that we develop, for which our license will be exclusive (except as to Pfizer and its affiliates). Accordingly, in the case of non-exclusive licenses, Pfizer could itself, or could enable a third party to, conduct research on compounds that are the same or similar to those that we are researching. If we exercise the option and enter into the license agreement for a particular compound, our license to research, develop and commercialize products with such compounds for the animal health field will be exclusive, subject to any restrictions imposed by Pfizer and the joint steering committee. Except for certain compounds we began researching prior to the completion of the IPO, pursuant to any such license agreement, we will pay Pfizer an upfront payment, a milestone payment upon obtaining regulatory approval in a major market country and royalties on net sales. Our obligation to pay royalties will expire on a product-by-product and country-by-country basis upon the later of: (i) the expiration of the related patents and data exclusivity or (ii) ten years after the first commercial sale of such product.
During the term of the agreement, we are required to reimburse Pfizer's and its affiliates' costs in connection with the agreement. Certain of such costs are paid in the form of an annual access fee and others are invoiced on a quarterly basis. The joint steering committee is comprised of an equal number of representatives from each party and acts by consensus. If consensus cannot be reached, the matter will be referred to each party's alliance manager to propose potential solutions. If the alliance managers fail to propose such a solution, the matter will be referred to senior executives of each party. If the senior executives do not resolve the matter, Pfizer will have final decision making authority.
110
|
Pfizer will own all intellectual property invented or generated under the agreement (subject to any third-party rights) and will have sole discretion regarding filing, prosecuting and maintaining such intellectual property, subject to our rights, in certain instances, to request that Pfizer file or continue to maintain patents at our cost. Pfizer will have sole discretion regarding enforcement of any intellectual property licensed to us under the agreement.
We have confidentiality and other obligations related to the security of intellectual property and other confidential information and materials. If Pfizer reasonably believes that we violated these provisions, Pfizer is able to deny our access to such intellectual property and other confidential information and materials.
The term of the agreement is seven years, subject to extension by mutual agreement. The agreement will terminate with respect to particular compounds if intent to access or approval in principle is denied or we fail to exercise our license option. Pfizer is also able to terminate our rights under the agreement or any related license agreement (as applicable) with respect to any compound for which approval in principle has been granted (including compounds for which we have exercised the option and entered into a license agreement) if Pfizer pays us an agreed upon amount which is intended to reflect the fair market value of the compound under our license. This right will expire on a compound-by-compound basis when we submit a regulatory approval application for each compound in a major market country and will not apply to compounds for which approval in principle was granted prior to the completion of the IPO.
In the event of either party's uncured material breach, the other party can terminate the agreement. If the material breach concerns any security measures or confidentiality or use restrictions and such breach is the result of bad faith, gross negligence or willful misconduct, such breach will be deemed to not be curable and, in addition to the agreement terminating, Pfizer will be able to terminate any license agreements that we have entered into after exercising our option (except to the extent any license agreement relates to a commercial product).
The agreement will terminate automatically if we enter into an agreement resulting in our change of control, we assign or another party assumes this agreement without Pfizer's consent or we are otherwise acquired by a third party, or if either party becomes insolvent or certain other events related to our bankruptcy or indebtedness occur. If we acquire a certain interest in, or assets of, a human health company, Pfizer will be able to terminate the agreement, and if Pfizer acquires or is acquired by an animal health business of a certain size, either party will be able to terminate the agreement. Following expiration and termination for specific reasons, we will be granted a non-exclusive license to any intellectual property that we developed under the agreement to conduct research in the animal health field, subject to certain exclusions (which exclusions will include the compounds that we researched and developed under the agreement and other compounds designated by Pfizer on a case-by-case basis). Except as set forth above, license agreements entered into pursuant to the R&D collaboration and license agreement will not terminate if the R&D collaboration and license agreement terminates.
Employee matters agreement
We entered into an employee matters agreement with Pfizer immediately prior to the completion of the IPO. The employee matters agreement governs Pfizer's, our and the parties' respective subsidiaries' and affiliates' rights, responsibilities and obligations post-IPO with respect to the following matters in connection with the animal health business:
|
•
|
employees and former employees (and their respective dependents and beneficiaries) who are or were associated with Pfizer, us or the parties' respective subsidiaries or affiliates;
|
|
•
|
the allocation of assets and liabilities generally relating to employees, employment or service-related matters and employee benefit plans; and
|
|
•
|
other human resources, employment and employee benefits matters.
|
Employment
. We offered employment to employees who are providing services to our business and who did not otherwise transfer to our entities by operation of law. To the extent that severance obligations were triggered by such transfers, Pfizer administered the severance pay obligations in accordance with the terms and conditions of the applicable Pfizer severance pay plan or policy. Our employees who were providing services to our business and were on long-term disability on the applicable employee transfer date remained employees of Pfizer to the extent permissible under applicable law, collective bargaining agreements, trade union agreements or work council agreements.
Benefit plans generally
. Prior to the completion of the IPO, except to the extent provided in respect of certain jurisdictions, we became a participating employer in the Pfizer benefit plans (including legacy King Pharmaceuticals, Inc. benefit plans where applicable). We ceased to be a participating employer in the Pfizer plans and adopted our own benefit plans on the “Plan Transition Date,” which was a date following the completion of the IPO, which was determined by the parties, and which varied by benefit plan and by country. An appropriate allocation of our costs incurred under Pfizer benefit plans prior to the Plan Transition Date was charged back to Zoetis. The only exception to this is in Japan, where we participate with other employers in multiemployer plans administered by Pfizer. For these plans, we are charged for the appropriate allocation of the multiemployer plan costs.
Credited service
. In general, our employee benefit plans recognize service at Pfizer for those colleagues who were employed by Zoetis as of June 24, 2013, except as otherwise specified in the employee matters agreement.
Defined benefit and retiree medical plans
. Our employees ceased to participate in the Pfizer U.S. qualified defined benefit pension plan and the U.S. retiree medical plan effective December 31, 2012, and liabilities allocable to our employees under such plans were retained by Pfizer. Our employees under the U.S. qualified defined benefit pension plan became 100% vested in their accrued benefits as of December 31, 2012. Pfizer will continue crediting certain employees' service with us generally through December 31, 2017 (or termination of employment from us, if earlier), for certain early retirement benefits with respect to the defined benefit pension plan, and for plan eligibility with respect to the retiree medical plan. Outside the United States, Pfizer transferred to us its defined benefit plan pension assets and liabilities associated with the employees transferring to us in certain countries as described in the applicable local separation agreements. In certain countries, liabilities with respect to past service with Pfizer were retained by Pfizer.
111
|
Nonqualified defined benefit pension plans
. We ceased to be a participating employer in the Pfizer U.S. nonqualified defined benefit pension plans on December 31, 2012, and Pfizer will continue crediting certain employees' service with us through December 31, 2017 (or termination of employment from us if earlier), for certain early retirement benefits. Our employees under the U.S. nonqualified defined benefit pension plan became 100% vested in their accrued benefits as of December 31, 2012. Pfizer has retained the liabilities allocable to our employees under the U.S. nonqualified pension plans.
Defined contribution plans
. The employee matters agreement provided for the transfer from the U.S. Pfizer qualified defined contribution plan to a U.S. Zoetis qualified defined contribution plan on the Plan Transition Date, with assets and liabilities allocable to the participants who transferred to us. Our employees under the Pfizer qualified defined contribution benefit plan were 100% vested in their account balances as of the Plan Transition Date. Outside the United States, Pfizer transferred to our defined contribution plans assets and liabilities allocable to the employees transferring to us in the certain countries as described in any applicable local separation agreement.
Deferred compensation plans
. With respect to the supplemental savings plan in the United States, Pfizer transferred liabilities allocable to the employees who transferred to us as described in the employee matters agreement. Liabilities allocable to our employees under other Pfizer nonqualified plans will be retained by Pfizer.
Health and welfare plans
. Generally, we have established or continued (or assumed the obligation of contributing to) health and welfare plans or arrangements in every country where we have employees. Health and welfare liabilities allocable to our employees prior to the Plan Transition Date were retained by Pfizer and the allocated cost for these plans were charged to us.
Master manufacturing and supply agreements
We entered into two master manufacturing and supply agreements with Pfizer. Under the first of these agreements, Pfizer manufactures and supplies us with animal health products, which we refer to as the “Pfizer-supplied products.” Under the second agreement, we manufacture and supply Pfizer with human health products, which we refer to as the “Zoetis-supplied products.” Only our Kalamazoo manufacturing site manufactures Zoetis-supplied products. Following the termination of the lease agreements related to our Guarulhos manufacturing site and subject to the receipt of various regulatory approvals in Brazil, the parties may agree that the Guarulhos site may also manufacture Zoetis-supplied products pursuant to this second agreement. See "—
Brazil lease agreements
." We do not expect that any of our other sites will manufacture products for Pfizer.
Under the agreement related to the Pfizer-supplied products, our supply price is Pfizer's costs plus a percentage markup. Subject to limited exceptions, during the two years following the completion of the IPO (from February 6, 2013, through February 5, 2015), the markup was 0% and, for the remainder of the term of the agreement, the markup will be 15%. The cost of each Pfizer-supplied product is subject to annual review. The agreement related to the Zoetis-supplied products contains reciprocal payment provisions pursuant to which Pfizer makes payments related to the Zoetis supplied products.
These agreements will expire five years following the completion of the IPO, with limited exceptions. In addition, these agreements require that Pfizer or us, as the case may be, use commercially reasonable efforts to develop the capabilities and facilities to manufacture the applicable products on its own behalf or to establish alternative sources of supply reasonably prior to expiration of the applicable agreement. The party purchasing products under the agreement may terminate the agreement with respect to any manufacturing site upon at least six months' prior notice. Also, either party may terminate for customary reasons, including for material breach of the other party (subject to a 90-day cure period) or for a force majeure event affecting the other party that continues for at least 30 days.
Environmental matters agreement
We entered into an environmental matters agreement with Pfizer immediately prior to the completion of the IPO. The agreement sets forth standards for each party's performance of remedial actions for liabilities allocated to each party under the global separation agreement, addresses our substitution for Pfizer with respect to animal health assets and remedial actions allocated to us (including substitution related to, for example, permits, financial assurances and consent orders), allows our conditional use of Pfizer's consultants and contractors to assist in the conduct of remedial actions and addresses the exchange of related information between the parties.
The agreement also sets forth standards of conduct for remedial activities at the co-located facilities: Guarulhos, Brazil; Catania, Italy; Hsinchu, Taiwan; and Kalamazoo, Michigan, in the U.S. In addition, the agreement sets forth site-specific terms to govern conduct at several of these co-located facilities. The agreement lasts perpetually; however, the agreement will terminate automatically if the global separation agreement terminates.
Screening services agreement
We entered into an agreement with Pfizer immediately prior to the completion of the IPO, pursuant to which we provide certain high throughput screening services to Pfizer's R&D organization. Pfizer pays us agreed-upon fees for these services.
Intellectual property license agreements
Immediately prior the completion of the IPO, we entered into a patent and know-how license agreements with Pfizer, pursuant to which: (i) Pfizer and certain of its affiliates have licensed to us and certain of our affiliates the right to use certain intellectual property rights in the animal health field; and (ii) we have licensed to Pfizer and certain of its affiliates certain rights to intellectual property in all fields outside the animal health field.
Patent and know-how license agreement (Pfizer as licensor)
. Immediately prior to the completion of the IPO, we entered into a patent and know-how license agreement with Pfizer. Pursuant to the agreement, Pfizer granted us a royalty-free, fully paid-up, sublicensable (subject to certain restrictions), worldwide, exclusive license to certain patents and know-how to research, develop and commercialize certain commercial, development-stage, and early stage products in the field of animal health. We do not have rights to use most of these patents and know-how with any compounds other than those for which we are expressly licensed.
Pfizer also granted us a royalty-free, fully paid-up, sublicensable (subject to certain restrictions) non-exclusive, worldwide license to certain other Pfizer patents and know-how to research, develop and commercialize certain other products in the animal health field. Under the agreement, we also
112
|
have been granted a royalty-free, fully paid-up, sublicensable (subject to certain restrictions) non-exclusive, worldwide license for the animal health field to certain know-how that is not compound-related or product-related.
Pfizer also granted us a sublicense of certain third-party intellectual property for use in the animal health field, the terms of which are royalty-free and fully paid-up as between us and Pfizer, but otherwise vary based on each third-party agreement. With respect to certain of such third-party intellectual property, Pfizer will have a right of first negotiation with us for an exclusive license to improvements to such third-party intellectual property and related patents that we own.
Pfizer controls filing, prosecuting and maintaining patents licensed to us, except that at our cost we are able to file patent applications covering certain know-how licensed to us and certain know-how invented by us. We will grant Pfizer a royalty-free, fully paid-up, sublicensable, exclusive license for the human health field to any such patent applications and patents that issue from these patent applications that we own. We will be required to pay certain costs associated with filing and maintaining the patents exclusively licensed to us, or our license will convert to a non-exclusive license.
Pfizer will have the right to forego, and cease paying for, prosecution and maintenance of the licensed patents and it may delegate responsibility to prosecute and maintain exclusively licensed patents to us or assign such patents to us. If Pfizer assigns such patents to us, we will grant Pfizer a royalty-free license to the assigned patents in all fields of use, but this license will exclude (and we will retain) all rights that Pfizer exclusively licensed to us under the agreement before assigning the patents to us.
Pfizer will have the right to enforce against third-party infringements all patents licensed to us and patents that it may later assign to us if the infringement is within the scope of Pfizer's license to such assigned patents, unless Pfizer does not pay for certain prosecution and maintenance costs and the patents are exclusively licensed or assigned to us, in which case, we will have rights to enforce such patents against third-party infringements within the scope of our exclusive rights. We also will have the right to enforce new patents that we file and own.
The agreement expires, with respect to licensed patents, upon expiration of the last to expire patent right that Pfizer owns, with respect to third party intellectual property, upon expiration or termination of the agreement pursuant to which such third-party intellectual property is licensed to Pfizer and with respect to know-how that Pfizer owns, upon the thirtieth anniversary of the agreement. Upon expiration of the agreement in its entirety, our licenses to know-how owned by Pfizer convert to fully paid-up, perpetual licenses. We are able to terminate the agreement in whole or in part upon prior written notice to Pfizer. In the event of either party's uncured material breach, the other party is able to terminate the agreement. The agreement also provides that insolvency of either party and the occurrence of certain other events related to each party's bankruptcy or indebtedness will also result in automatic termination. In addition, in circumstances where Pfizer has an interest in the licensed intellectual property in connection with its human health development programs, our rights to use the licensed intellectual property are restricted and/or in limited instances, subject to Pfizer's right to terminate such license at will. Pfizer also has the ability to terminate any third-party agreements under which it is sublicensing rights to us.
Patent and know-how license agreement (Zoetis as licensor)
. Immediately prior to the completion of the IPO, we entered into a patent and know-how license agreement with Pfizer. Pursuant to the agreement, we granted Pfizer a royalty-free, fully paid-up, sublicensable (subject to certain restrictions), exclusive license to all patents and know-how that we own or have been licensed from third parties as of the IPO (excluding any patents and know-how licensed from third parties to which our rights are limited to animal health) for Pfizer to research, develop, and commercialize any products throughout the world in all fields except the animal health field. Under the agreement, we also granted Pfizer a royalty-free, fully paid-up, perpetual, sublicensable (subject to certain restrictions), non-exclusive license to certain patents filed within a certain period of time following the IPO that cover know-how that we own. Pfizer will be permitted to use such patents in connection with its research, development, and commercialization of products outside the animal health field.
Upon notice from Pfizer, we will be required to file patent applications covering know-how licensed to Pfizer or continue to prosecute and maintain patents that have already been filed. In each case, Pfizer reimburses us for related costs, which vary depending on whether patents are filed at the time of Pfizer's notice. We will have the sole right to enforce patents that are licensed to Pfizer under this agreement in the animal health field. Pfizer will have rights to enforce the licensed patents in all other fields (including the human health field) only if it reimburses us for certain costs related to prosecution and maintenance of such patents. If Pfizer decides that it will not reimburse us for such costs, we will have the right to enforce in such fields.
The agreement expires, with respect to licensed patents that we own, upon the expiration of the last to expire patent right, with respect to third-party intellectual property, upon the expiration or termination of the agreement pursuant to which such third-party intellectual property is licensed to us and with respect to know-how that we own, upon the thirtieth anniversary of the agreement. Upon expiration of the agreement in its entirety, Pfizer's licenses to any know-how owned by us will convert to fully paid-up, perpetual licenses. Pfizer is able to terminate the agreement in whole or in part upon prior notice to us. In the event of either party's uncured material breach, the other party is be able to terminate the agreement. The agreement also provides that the insolvency of either party and the occurrence of certain other events related to bankruptcy or indebtedness will also result in automatic termination. Upon termination of the agreement, all licenses terminate.
Trademark and copyright license agreements
. Immediately prior to the completion of the IPO, we entered into a trademark and copyright license agreement with Pfizer, pursuant to which Pfizer granted us rights with respect to certain trademarks and copyrighted works. Specifically, Pfizer granted us an exclusive, worldwide, royalty-free, perpetual and fully paid-up license to use certain scheduled trademarks in the same manner that we used such trademarks as a business unit of Pfizer and in connection with any modifications or line extensions of products with which such trademarks were used as a business unit of Pfizer. We are able to sublicense such trademarks to third parties with Pfizer's prior written consent, which Pfizer cannot unreasonably withhold, but such consent is not be required for sublicenses granted to our customers and distributors in the ordinary course of business. We do not have the right to register domain names that incorporate the trademarks or use the trademarks in the address of any social media or use the trademarks in any trade name, corporate name or “doing business as” name.
Pfizer also granted us a non-exclusive, worldwide, royalty-free, perpetual and fully paid-up license to use, copy and distribute to ourselves and our affiliates copyrights in certain policies and guidelines, and any related derivative works, that are necessary for us to continue to conduct certain aspects of our business in the same manner as they were conducted when we were a business unit of Pfizer.
113
|
The agreement will terminate on a trademark-by-trademark or copyrighted work-by-copyrighted work basis upon our written notice to Pfizer that we have ceased bona fide commercial use of such trademark or copyrighted work and it will terminate as to one of our affiliates if such affiliates ceases being an affiliate of us. We granted a similar license to Pfizer to use the Aureomycin trademark and variants thereof in connection with Pfizer's human health business.
Brazil lease agreements
In September 2012, Pfizer's subsidiary, Laboratórios Pfizer Ltda. (Laboratórios), as lessee, and our subsidiary, PAH Brasil Participações Ltda., (PAH Brasil), as lessor, entered into: (i) the Private Instrument of Non Residential Lease Agreement and Others, which establishes and regulates the use of the real property at our Guarulhos, Brazil facility (the Real Property Lease) and (ii) the Private Instrument of Lease Agreement Movable Assets and Others, which establishes the terms of the use of the fixed assets at the same site (the Fixed Asset Lease and, together with the Real Property Lease, the Brazil Leases). As a result of a merger of PAH Brasil into Fort Dodge Saúde Animal Ltda. (Fort Dodge Brazil) with Fort Dodge Brazil surviving, the Brazil Leases were assigned to Fort Dodge Brazil, later renamed Zoetis Indústria de Produtos Veterinários Ltda. (Zoetis Brazil).
Rent, rent adjustment and penalty
. The monthly rent under the Brazil Leases corresponds to the amount of depreciation of the fixed assets and real property covered by the leases. During the first month that the leases were in effect, the rent under the Fixed Asset Lease was R$752,459 (approximately $0.4 million) and the rent under the Real Property Lease was R$479,977 (approximately $0.2 million). In subsequent periods, the parties will adjust these amounts to reflect the anticipated monthly depreciation amount and previously paid amounts may be adjusted if the amounts paid differ from actual depreciation. Late payments under Brazil Leases are subject to an adjustment plus a penalty equal to 2% and interest on arrears of 1% per month. A breach of either of the Brazil Leases that is not cured within 30 days from receipt of notice thereof is subject to a penalty equal to three monthly rent payments under the applicable lease. In addition to the rent, Laboratórios will pay expenses related to water consumption, sewerage and electricity as well as all taxes levied on the property.
Covenants and obligations.
Laboratórios is required to maintain the fixed assets and real property in the same condition as they were received, except for normal wear and tear and any improvements thereon, and is responsible for the repair of any damage. Improvements on the existing fixed assets and investments in new fixed assets are permitted under the Fixed Asset Lease, provided Fort Dodge Brazil is given notice thereof and consents to Laboratórios's proposal. Costs for such improvements are paid or reimbursed by Fort Dodge Brazil unless the fixed asset is used solely to manufacture human health products, in which case the cost shall be the responsibility of Laboratórios and, in the event a new asset is purchased, exclusive ownership shall be retained by Laboratórios. The Real Property Lease also permits improvements on the property to be implemented by Laboratórios at its sole and entire discretion. Laboratórios is entitled to reimbursement for any related costs as long as Fort Dodge Brazil consented to the implementation of the improvements.
Term and termination.
The Brazil Leases will last for a period of five years commencing on September 28, 2012. The Real Property Lease provides for automatic renewals for successive periods of one year at Laboratórios's discretion, unless notice of non-renewal is provided by Laboratórios. The Fixed Asset Lease can be extended for additional terms of five years by executing an amendment to such lease.
The Brazil Leases terminate at any time if agreed upon by the parties. The Brazil Leases also terminate upon satisfaction of certain regulatory conditions that will permit the animal health manufacturing operations of Laboratórios to be transferred to Zoetis Brazil and the human pharmaceutical manufacturing operations to be transferred to another facility or party. The Fixed Asset Lease automatically terminates upon the termination of the Real Property Lease or, subject to certain conditions, the master manufacturing and supply agreement that provides for Zoetis-supplied products. The Real Property Lease automatically terminates upon the termination of the Fixed Asset Lease or the expropriation of the property and cannot be terminated by Zoetis Brazil prior to termination of the master manufacturing and supply agreement that provides for Zoetis-supplied products. In the event the property is partially or completely destroyed, Laboratórios has the option to terminate the Real Property Lease.
Mumbai, India interim lease agreement
We entered into an interim lease agreement with respect to our R&D facility in Mumbai, India. We will pay Pfizer a mutually agreed-upon rent for the facility and we anticipate the lease would expire upon the completion of the transfer of the Mumbai, India facility from Pfizer.
Policy concerning related person transactions
Our Board of Directors has adopted a written policy, which we refer to as the “related person transaction approval policy,” for the review of any transaction, arrangement or relationship in which we are a participant, if the amount involved exceeds $120,000 and one of our executive officers, directors, director nominees or beneficial holders of more than 5% of our total equity (or their immediate family members), each of whom we refer to as a “related person,” has a direct or indirect material interest. This policy was not in effect when we entered into the transactions described above.
Each of the agreements between us and Pfizer and its subsidiaries that have been entered into prior to the completion of the IPO, and any transactions contemplated thereby, have been deemed to be approved and not subject to the terms of such policy. If a related person proposes to enter into such a transaction, arrangement or relationship, which we refer to as a “related person transaction,” the related person must report the proposed related person transaction to the Chair of our Corporate Governance Committee (for purposes of this section only, we refer to the Corporate Governance Committee as the “Committee”). The policy calls for the proposed related person transaction to be reviewed and, if deemed appropriate, approved by the Committee. In approving or rejecting such proposed transactions, the Committee is required to consider relevant facts and circumstances. The Committee will approve only those transactions that, in light of known circumstances, are deemed to be in our best interests. In the event that any member of the Committee is not a disinterested person with respect to the related person transaction under review, that member will be excluded from the review and approval or rejection of such related person transaction; provided, however, that such Committee member may be counted in determining the presence of a quorum at the meeting of the Committee at which such transaction is considered. If we become aware of an existing related person transaction which has not been approved under the policy, the matter will be referred to the Committee. The Committee will evaluate all options available, including ratification, revision or termination of such transaction. In the event that management determines that it is impractical or undesirable to wait until a meeting of the Committee to consummate a related person transaction, the Chair of the Committee may approve such transaction in accordance with the related person transaction approval policy. Any such approval must be reported to the Committee at its next regularly scheduled meeting.
114
|
A copy of our related person transaction approval policy is available on our website.
Director Independence
Eight of our directors (William F. Doyle, Michael B. McCallister, Sanjay Khosla, Gregory Norden, Louise M. Parent, Willie M. Reed, Robert W. Scully and William C. Steere, Jr.) are independent under the applicable rules of the NYSE and the Exchange Act.
Information about the fees for professional services rendered by our independent registered public accounting firm in 2014 and 2013 is incorporated by reference from the discussion under the heading
Item 3
—
Ratification of Independent Registered Public Accounting Firm
in our 2015 Proxy Statement. Our Audit Committee’s policy on pre-approval of audit and permissible non-audit services of our independent registered public accounting firm is incorporated by reference from the discussion under the heading
Item 3
—
Ratification of Independent Registered Public Accounting Firm.
115
|
The following entire exhibits are included:
|
A.
|
(1) The financial statements and notes to financial statements are filed as part of this report in Item 8. Financial Statements and Supplementary Data.
|
(2) The financial statement schedule is listed in the Index to Financial Statements.
(3) The exhibits are listed in the Index to Exhibits.
116
|
SIGNATURES
Pursuant to the requirements of Section 13 or 15(d) of the Securities Exchange Act of 1934, the registrant has duly caused this report to be signed on its behalf by the undersigned, thereunto duly authorized.
|
Zoetis Inc.
|
|
|
By:
|
/S/ JUAN RAMÓN ALAIX
|
|
Juan Ramón Alaix
|
|
|
Chief Executive Officer and Director
|
|
We, the undersigned directors and officers of Zoetis Inc., hereby severally constitute Juan Ramón Alaix and Heidi Chen, and each of them singly, our true and lawful attorneys with full power to them and each of them to sign for us, in our names in the capacities indicated below, any and all amendments to this Annual Report on Form 10-K filed with the Securities and Exchange Commission.
Under the requirements of the Securities Exchange Act of 1934, this report was signed by the following persons on behalf of the Registrant and in the capacities and on the date indicated.
|
Name
|
Title
|
Date
|
||
|
/S/ JUAN RAMÓN ALAIX
|
Chief Executive Officer and Director
|
February 27, 2015
|
||
|
Juan Ramón Alaix
|
(Principal Executive Officer)
|
|||
|
/S/ PAUL S. HERENDEEN
|
Executive Vice President and
|
February 27, 2015
|
||
|
Paul S. Herendeen
|
Chief Financial Officer
(Principal Financial Officer and
Principal Accounting Officer)
|
|||
|
/S/ MICHAEL B. MCCALLISTER
|
Chairman and Director
|
February 27, 2015
|
||
|
Michael B. McCallister
|
||||
|
/S/ FRANK A. D'AMELIO
|
Director
|
February 27, 2015
|
||
|
Frank A. D’Amelio
|
||||
|
/S/ WILLIAM F. DOYLE
|
Director
|
February 27, 2015
|
||
|
William F. Doyle
|
||||
|
/S/ SANJAY KHOSLA
|
Director
|
February 27, 2015
|
||
|
Sanjay Khosla
|
||||
|
/s/ GREGORY NORDEN
|
Director
|
February 27, 2015
|
||
|
Gregory Norden
|
||||
|
/S/ LOUISE M. PARENT
|
Director
|
February 27, 2015
|
||
|
Louise M. Parent
|
||||
|
/S/ WILLIE M. REED
|
Director
|
February 27, 2015
|
||
|
Willie M. Reed
|
||||
|
/s/ ROBERT W. SCULLY
|
Director
|
February 27, 2015
|
||
|
Robert W. Scully
|
||||
|
/S/ WILLIAM C. STEERE, JR.
|
Director
|
February 27, 2015
|
||
|
William C. Steere, Jr.
|
||||
117
|
The exhibits listed below and designated with a
†
are filed with this report. The exhibits listed below and not so designated are incorporated by reference to the documents following the descriptions of the exhibits.
|
Exhibit 3.1
|
Restated Certificate of Incorporation of the Registrant (incorporated by reference to Exhibit 3.1 to Zoetis Inc.'s Quarterly
|
|
|
Report on Form 10-Q filed on November 10, 2014)
|
||
|
Exhibit 3.2
|
Amended and Restated By-laws of the Registrant (incorporated by reference to Exhibit 3.2 to Zoetis Inc.'s 2012 Annual
|
|
|
Report on Form 10-K filed on March 28, 2013)
|
||
|
Exhibit 3.3
|
Certificate of Designation of Series A Junior Participating Preferred Stock of Zoetis Inc. filed with the Secretary of State
|
|
|
of the State of Delaware on November 17, 2014 (incorporate by reference to Exhibit 3.1 to Zoetis Inc.’s Current Report
|
||
|
on Form 8-K filed on November 17, 2014)
|
||
|
Exhibit 4.1
|
Specimen Class A Common Stock Certificate (incorporated by reference to Exhibit 4.1 of Zoetis Inc.’s registration
|
|
|
statement on Form S-1 (File No. 333-183254))
|
||
|
Exhibit 4.2
|
Indenture, dated as of January 28, 2013, between Zoetis Inc. and Deutsche Bank Trust Company Americas, as trustee
|
|
|
(incorporated by reference to Zoetis Inc.'s registration statement on Form S-1 (File No. 333-183254))
|
||
|
Exhibit 4.3
|
First Supplemental Indenture, dated as of January 28, 2013, between Zoetis Inc. and Deutsche Bank Trust Company
|
|
|
Americas, as trustee (incorporated by reference to Exhibit 4.3 of Zoetis Inc.'s registration statement on Form S-1
|
||
|
(File No. 333-183254))
|
||
|
Exhibit 4.4
|
Form of 1.150% Senior Notes due 2016 (incorporated by reference to Exhibit 4.4 of Zoetis Inc.'s registration statement on
|
|
|
Form S-1 (File No. 333-183254))
|
||
|
Exhibit 4.5
|
Form of 1.875% Senior Notes due 2018 (incorporated by reference to Exhibit 4.5 of Zoetis Inc.'s registration statement on
|
|
|
Form S-1 (File No. 333-183254))
|
||
|
Exhibit 4.6
|
Form of 3.250% Senior Notes due 2023 (incorporated by reference to Exhibit 4.6 of Zoetis Inc.'s registration statement on
|
|
|
Form S-1 (File No. 333-183254))
|
||
|
Exhibit 4.7
|
Form of 4.700% Senior Notes due 2043 (incorporated by reference to Exhibit 4.7 of Zoetis Inc.'s registration statement on
|
|
|
Form S-1 (File No. 333-183254))
|
||
|
Exhibit 4.8
|
Rights Agreement, dated November 14, 2014, between Zoetis Inc. and Computershare Trust Company, N.A., as Rights Agent,
|
|
|
including the form of Certificate of Designation as Exhibit A, the form of Rights Certificate as Exhibit B and the form
|
||
|
of Summary of Rights to Purchase Preferred Stock as Exhibit C (incorporated by reference to Exhibit 4.1 to Zoetis Inc.’s
|
||
|
Current Report on Form 8-K filed on November 17, 2014)
|
||
|
Exhibit 10.1
|
Global Separation Agreement, dated February 6, 2013, by and between Zoetis Inc. and Pfizer Inc.
|
|
|
(incorporated by reference to Exhibit 10.1 to Zoetis Inc.’s 2012 Annual Report on Form 10-K filed on March 28, 2013)
|
||
|
Exhibit 10.2
|
Transitional Services Agreement, dated February 6, 2013, by and between Zoetis Inc. and Pfizer Inc.
|
|
|
(incorporated by reference to Exhibit 10.2 to Zoetis Inc.’s 2012 Annual Report on Form 10-K filed on March 28, 2013)
|
||
|
Exhibit 10.3
|
Tax Matters Agreement, dated February 6, 2013, by and between Zoetis Inc. and Pfizer Inc.
|
|
|
(incorporated by reference to Exhibit 10.3 to Zoetis Inc.’s 2012 Annual Report on Form 10-K filed on March 28, 2013)
|
||
|
Exhibit 10.4
|
Research and Development Collaboration and License Agreement, dated February 6, 2013, by and between Zoetis Inc.
|
|
|
and Pfizer Inc. (incorporated by reference to Exhibit 10.4 to Zoetis Inc.’s 2012 Annual Report on Form 10-K filed on
|
||
|
March 28, 2013)
|
||
|
Exhibit 10.5
|
Employee Matters Agreement (incorporated by reference to Exhibit 10.5 of Zoetis Inc.'s registration statement on Form S-1
|
|
|
(File No. 333-183254))
|
||
|
Exhibit 10.6
|
Pfizer Inc. 2004 Stock Plan, as Amended and Restated (incorporated by reference to Exhibit 10.6 of Zoetis Inc.'s registration
|
|
|
statement on Form S-1 (File No. 333-183254))*
|
||
|
Exhibit 10.7
|
Pfizer Inc. Amended and Restated Nonfunded Supplemental Retirement Plan, together with all material Amendments
|
|
|
(incorporated by reference to Exhibit 10.7 of Zoetis Inc.'s registration statement on Form S-1 (File No. 333-183254))*
|
||
|
Exhibit 10.8
|
Patent and Know-How License Agreement (Zoetis as licensor), dated February 6, 2013, by and between Zoetis Inc. and
|
|
|
Pfizer Inc. (incorporated by reference to Exhibit 10.8 to Zoetis Inc.’s 2012 Annual Report on Form 10-K filed on
|
||
|
March 28, 2013)
|
||
|
Exhibit 10.9
|
Patent and Know-How License Agreement (Pfizer as licensor), dated February 6, 2013, by and between Zoetis Inc. and
|
|
|
Pfizer Inc. (incorporated by reference to Exhibit 10.9 to Zoetis Inc.’s 2012 Annual Report on Form 10-K filed on
|
||
|
March 28, 2013)
|
||
118
|
|
Exhibit 10.10
|
Trademark and Copyright License Agreement, dated February 6, 2013, by and between Zoetis Inc. and Pfizer Inc.
|
|
|
(incorporated by reference to Exhibit 10.10 to Zoetis Inc.’s 2012 Annual Report on Form 10-K filed on March 28, 2013)
|
||
|
Exhibit 10.11
|
Private Instrument of Non Residential Lease Agreement and Others, dated September 28, 2012, by and between PAH Brasil
|
|
|
Participações Ltda. and Laboratórios Pfizer Ltda. (incorporated by reference to Exhibit 10.11 of Zoetis Inc.'s registration
|
||
|
statement on Form S-1 (File No. 333-183254))
|
||
|
Exhibit 10.12
|
Private Instrument of Lease Agreement Movable Assets and Others, dated September 28, 2012, by and between PAH Brasil
|
|
|
Participações Ltda. and Laboratórios Pfizer Ltda. (incorporated by reference to Exhibit 10.12 of Zoetis Inc.'s registration
|
||
|
statement on Form S-1 (File No. 333-183254))
|
||
|
Exhibit 10.13
|
Environmental Matters Agreement, dated February 6, 2013, by and between Zoetis Inc. and Pfizer Inc.
|
|
|
(incorporated by reference to Exhibit 10.13 to Zoetis Inc.’s 2012 Annual Report on Form 10-K filed on March 28, 2013)
|
||
|
Exhibit 10.14
|
Master Manufacturing and Supply Agreement, dated October 1, 2012, by and between Pfizer Inc. and Zoetis Inc. (Pfizer as
|
|
|
as manufacturer) (incorporated by reference to Exhibit 10.14 of Zoetis Inc.'s registration statement on Form S-1
|
||
|
(File No. 333-183254))
|
||
|
Exhibit 10.15
|
Registration Rights Agreement, dated February 6, 2013, by and between Zoetis Inc. and Pfizer Inc.
|
|
|
(incorporated by reference to Exhibit 10.15 to Zoetis Inc.’s 2012 Annual Report on Form 10-K filed on March 28, 2013)
|
||
|
Exhibit 10.16
|
Zoetis Inc. 2013 Equity and Incentive Plan (incorporated by reference to Exhibit 10.16 to Zoetis Inc.’s 2012 Annual Report
|
|
|
on Form 10-K filed on March 28, 2013)*
|
||
|
Exhibit 10.17
|
Sale of Business Severance Plan (incorporated by reference to Exhibit 10.17 to Zoetis Inc.’s 2012 Annual Report on
|
|
|
Form 10-K filed on March 28, 2013)*
|
||
|
Exhibit 10.18
|
Revolving Credit Agreement, dated as of December 21, 2012, among Zoetis Inc., the lenders named therein and JPMorgan
|
|
|
Chase Bank, N.A., as administrative agent (incorporated by reference to Exhibit 10.18 of Zoetis Inc.'s registration statement
|
||
|
on Form S-1 (File No. 333-183254))
|
||
|
Exhibit 10.19
|
Form of Indemnification Agreement for directors and officers (incorporated by reference to Exhibit 10.19 of Zoetis Inc.'s
|
|
|
registration statement on Form S-1 (File No. 333-183254))
|
||
|
Exhibit 10.20
|
Registration Rights Agreement, dated as of January 28, 2013, by and among Zoetis Inc. and Merrill Lynch, Pierce, Fenner &
|
|
|
Smith Incorporated, Barclays Capital Inc., J.P. Morgan Securities LLC and Deutsche Bank Securities Inc., as representatives
|
||
|
of the several initial purchasers (incorporated by reference to Exhibit 10.20 of Zoetis Inc.'s registration statement on Form
|
||
|
S-1 (File No. 333-183254))
|
||
|
Exhibit 10.21
|
Form of Restricted Stock Unit Award agreement (incorporated by reference to Exhibit 10.21 to Zoetis Inc.’s 2012 Annual
|
|
|
Report on Form 10-K filed on March 28, 2013)*
|
||
|
Exhibit 10.22
|
Form of Stock Option Award agreement (incorporated by reference to Exhibit 10.22 to Zoetis Inc.’s 2012 Annual Report
|
|
|
on Form 10-K filed on March 28, 2013)*
|
||
|
Exhibit 10.23
|
Form of Non-Employee Director Deferred Stock Unit Award agreement (incorporated by reference to Exhibit 10.22
|
|
|
on Form 10-K filed on March 28, 2013)*
|
||
|
Exhibit 10.24
|
Form of Cash Award agreement (incorporated by reference to Exhibit 10.24 to Zoetis Inc.’s 2012 Annual Report on
|
|
|
Form 10-K filed on March 28, 2013)*
|
||
|
Exhibit 10.25
|
Non-Employee Director Deferred Compensation Plan (incorporated by reference to Exhibit 10.1 to Zoetis Inc.’s
|
|
|
Current Report on Form 8-K filed on May 7, 2013)*
|
||
|
Exhibit 10.26
|
Zoetis Executive Severance Plan (incorporated by reference to Exhibit 10.1 to Zoetis Inc.’s Quarterly Report on Form 10-Q
|
|
|
filed on August 14, 2013)*
|
||
|
Exhibit 10.27
|
Zoetis Supplemental Savings Plan, as amended and restated, effective September 15, 2014 (incorporated by reference to
|
|
|
Exhibit 10.4 to Zoetis Inc.'s Quarterly Report on Form 10-Q filed on November 10, 2014*
|
||
|
Exhibit 10.28
|
Severance and Release Agreement between the Registrant and Richard A. Passov, effective April 21, 2014
|
|
|
(incorporated by reference to Exhibit 10.2 to Zoetis Inc.’s Quarterly Report on Form 10-Q filed on August 12, 2014)*
|
||
|
Exhibit 10.29
|
Zoetis Equity Deferral Plan, effective November 1, 2014 (incorporated by reference to Exhibit 10.5 to Zoetis Inc.’s
|
|
|
Quarterly Report on Form 10-Q filed on November 10, 2014)*
|
||
|
Exhibit 10.30
|
Offer Letter between Zoetis Inc. and Paul Herendeen, dated July 31, 2014 (incorporated by reference to Exhibit 10.3
|
|
119
|
|
to Zoetis Inc.’s Quarterly Report on Form 10-Q filed on November 10, 2014)*
|
||
|
Exhibit 10.31
|
Letter Agreement, dated as of February 3, 2015, by and among Zoetis and Pershing Square Capital Management, L.P.
|
|
|
and certain affiliates thereof and Sachem Head Capital Management LP and certain affiliates thereof (incorporated by
|
||
|
reference to Exhibit 99.1 to Zoetis Inc.’s Current Report on Form 8-K filed on February 4, 2015
|
||
|
Exhibit 12
|
Computation of Ratio of Earnings to Fixed Charges †
|
|
|
Exhibit 21.1
|
Subsidiaries of the Registrant †
|
|
|
Exhibit 23.1
|
Consent of KPMG LLP †
|
|
|
Exhibit 24.1
|
Power of Attorney (included as part of signature page) †
|
|
|
Exhibit 31.1
|
Certification by the Chief Executive Officer Pursuant to Section 302 of the Sarbanes-Oxley Act of 2002 †
|
|
|
Exhibit 31.2
|
Certification by the Chief Financial Officer Pursuant to Section 302 of the Sarbanes-Oxley Act of 2002 †
|
|
|
Exhibit 32.1
|
Certification by the Chief Executive Officer Pursuant to 18 U.S.C. Section 1350, as Adopted Pursuant to Section 906 of the
|
|
|
Sarbanes-Oxley Act of 2002 †
|
||
|
Exhibit 32.2
|
Certification by the Chief Financial Officer Pursuant to 18 U.S.C. Section 1350, as Adopted Pursuant to Section 906 of the
|
|
|
Sarbanes-Oxley Act of 2002 †
|
||
|
EX-101.INS
|
INSTANCE DOCUMENT
|
|
|
EX-101.SCH
|
SCHEMA DOCUMENT
|
|
|
EX-101.CAL
|
CALCULATION LINKBASE DOCUMENT
|
|
|
EX-101.LAB
|
LABELS LINKBASE DOCUMENT
|
|
|
EX-101.PRE
|
PRESENTATION LINKBASE DOCUMENT
|
|
|
EX-101.DEF
|
DEFINITION LINKBASE DOCUMENT
|
|
|
†
|
Filed herewith
|
|
*
|
Management contracts or compensatory plans or arrangements
|
120
|
TABLE OF CONTENTS
Part INote 19. Transactions and Agreements with PfizerNote 10. InventoriesNote 8. Tax MattersNote 12. Goodwill and Other Intangible AssetsNote 9A. Financial Instruments: DebtNote 13A. Benefit Plans International Pension PlansNote 9A. Financial Instruments DebtNote 13. Benefit PlansNote 19B. Transactions and Agreements with Pfizer Agreements with Pfizer Employee Matters AgreementNote 4. Significant Accounting Policies New Accounting StandardsItem 7A. Quantitative and Qualitative Disclosures About Market RiskNote 4. Significant Accounting PoliciesNote 9B. Financial InstrumentsNote 9. Financial InstrumentsItem 8. Financial Statements and Supplementary DataNote 4. Significant Accounting Policies Amortization Of Intangible Assets, Depreciation and Certain Long-lived AssetsNote 14. Share-based PaymentsNote 15. Stockholders' EquityNote 8B. Tax MattersNote 9A. Financial InstrumentsNote 19B. Transactions and Agreements with PfizerNote 18. Segment, Geographic and Other Revenue InformationNote 6. Restructuring Charges and Other Costs Associated with Acquisitions and Cost-reduction/productivity InitiativesNote 21. Subsequent EventsNote 4. Significant Accounting Policies Deferred Tax Assets and Liabilities and Income Tax ContingenciesNote 4. Significant Accounting Policies Estimates and AssumptionsNote 4. Significant Accounting Policies Fair ValueNote 7. Other (income)/deductions NetNote 6. Restructuring Charges and Other Costs Associated with Acquisition and Cost-reduction/productivity InitiativesNote 3A. Basis Of Presentation: Basis Of Presentation Prior To The SeparationItem 9. Changes in and Disagreements with Accountants on Accounting and Financial DisclosureItem 9A. Controls and ProceduresItem 9B. Other InformationPart IIIItem 10. Directors, Executive Officers and Corporate GovernanceItem 11. Executive CompensationItem 12. Security Ownership Of Certain Beneficial Owners and Management and Related Stockholder MattersItem 13. Certain Relationships and Related Transactions, and Director IndependenceItem 14. Principal Accounting Fees and ServicesPart IVItem 15. Exhibits, Financial Statement Schedules