UNITED STATES
SECURITIES AND EXCHANGE COMMISSION
Washington, D.C. 20549
FORM
(Mark One)
|
|
REGISTRATION STATEMENT PURSUANT TO SECTION 12( b ) OR ( g ) OF THE SECURITIES EXCHANGE ACT OF 1934 |
or
|
|
ANNUAL REPORT PURSUANT TO SECTION 13 OR 15( d ) OF THE SECURITIES EXCHANGE ACT OF 1934 |
For the fiscal year ended
or
|
|
TRANSITION REPORT PURSUANT TO SECTION 13 OR 15( d ) OF THE SECURITIES EXCHANGE ACT OF 1934 |
or
|
|
SHELL CO MPANY REPORT PURSUANT TO SECTION 13 OR 15(d) OF THE SECURITIES EXCHANGE ACT OF 1934 |
Date of event requiring this shell company report
Commission file number
(Exact name of Registrant as specified in its charter)
FRESENIUS MEDICAL CARE AG
(Translation of Registrant’s name into English)
(Jurisdiction of incorporation or organization)
(Address of principal executive offices)
(Name, Telephone, E-mail and/or Facsimile number and Address of Company Contact Person)
Securities registered or to be registered pursuant to Section 12(b) of the Act:
|
Title of each class |
|
Trading Symbol(s) |
|
Name of each exchange on which registered |
|
|
|
|
|
|
|
|
|
N/A |
|
|
| (1) | Not for trading, but only in connection with the registration of American Depositary Shares representing such shares. |
Securities registered or to be registered pursuant to Section 12(g) of the Act: None
Securities for which there is a reporting obligation pursuant to Section 15(d) of the Act: None
Indicate the number of outstanding shares of each of the issuer’s classes of capital or common stock as of the close of the period covered by the annual report:
Ordinary Shares, no par value:
Indicate by check mark if the registrant is a well-known seasoned issuer, as defined in Rule 405 of the Securities Act.
☒
If this report is an annual or transition report, indicate by check mark if the registrant is not required to file reports pursuant to Section 13 or 15(d) of the Securities Exchange Act of 1934.
☐
Yes
☒
Note – Checking the box above will not relieve any registrant required to file reports pursuant to Section 13 or 15(d) of the Securities Exchange Act of 1934 from their obligations under those Sections.
Indicate by check mark whether the registrant (1) has filed all reports required to be filed by Section 13 or 15(d) of the Securities Exchange Act of 1934 during the preceding 12 months (or for such shorter period that the registrant was required to file such reports) and (2) has been subject to such filing requirements for the past 90 days.
☒
Indicate by check mark whether the registrant has submitted electronically every Interactive Data File required to be submitted pursuant to Rule 405 of Regulation S-T (§232.405 of this chapter) during the preceding 12 months (or for such shorter period that the registrant was required to submit such files).
☒
Indicate by check mark whether the registrant is a large accelerated filer, an accelerated filer, a non-accelerated filer or an emerging growth company. See definition of “large accelerated filer, “accelerated filer” and “emerging growth company” in Rule 12b-2 of the Exchange Act.
|
|
Accelerated filer ☐ |
Non-accelerated filer ☐ |
|
|
|
Emerging growth company
|
If an emerging growth company that prepares its financial statements in accordance with U.S. GAAP, indicate by check mark if the registrant has elected not to use the extended transition period for complying with any new or revised financial accounting standards † provided pursuant to Section 13(a) of the Exchange Act. ☐
† The term “new or revised financial accounting standard” refers to any update issued by the Financial Accounting Standards Board to its Accounting Standards Codification after April 5, 2012.
Indicate by check mark whether the registrant has filed a report on and attestation to its management’s assessment of the effectiveness of its internal control over financial reporting under Section 404(b) of the Sarbanes-Oxley Act (15 U.S.C. 7262(b)) by the registered public accounting firm that prepared or issued its audit report.
If securities are registered pursuant to Section 12(b) of the Act, indicate by check mark whether the financial statements of the registrant included in the filing reflect the correction of an error to previously issued financial statements.
Indicate by check mark whether any of those error corrections are restatements that required a recovery analysis of incentive-based compensation received by any of the registrant’s executive officers during the relevant recovery period pursuant to §240.10D-1(b).
Indicate by check mark which basis of accounting the registrant has used to prepare the financial statements included in this filing:
☐ U.S. GAAP
☒
☐ Other
If “Other” has been checked in response to the previous question, indicate by check mark which financial statement item the registrant has elected to follow:
☐ Item 17
☐ Item 18
If this is an annual report, indicate by check mark whether the registrant is a shell company (as defined in Rule 12b-2 of the Exchange Act).
☐
Yes
Table of contents
|
|
|
|
Page |
|
Introduction |
|
|
|
|
|
|
|
|
|
N/A |
6 |
||
|
N/A |
6 |
||
|
|
6 |
||
|
|
23 |
||
|
N/A |
80 |
||
|
|
81 |
||
|
|
109 |
||
|
|
152 |
||
|
|
155 |
||
|
|
156 |
||
|
|
157 |
||
|
|
166 |
||
|
|
167 |
||
|
|
|
|
|
|
N/A |
169 |
||
|
N/A |
Material modifications to the rights of security holders and use of proceeds |
169 |
|
|
|
169 |
||
|
|
Management’s annual report on internal control over financial reporting |
169 |
|
|
|
169 |
||
|
|
169 |
||
|
|
170 |
||
|
|
170 |
||
|
|
170 |
||
|
|
171 |
||
|
|
Purchase of equity securities by the issuer and affiliated purchasers |
171 |
|
|
|
171 |
||
|
|
171 |
||
|
N/A |
178 |
||
|
N/A |
Disclosure regarding foreign jurisdictions that prevent inspections |
178 |
|
|
|
178 |
||
|
|
178 |
||
|
|
|
|
|
|
N/A |
181 |
||
|
|
181 |
||
|
|
181 |
i
Certain defined terms
In this report, “FME AG,” or the “Company,” “we”, “us” or “our” refers to Fresenius Medical Care AG or to Fresenius Medical Care AG and its subsidiaries on a consolidated basis, as the context requires. “FMCH” and “D-GmbH” refer, respectively, to Fresenius Medical Care Holdings, Inc., the holding company for our North American operations, and to Fresenius Medical Care Deutschland GmbH, one of our German subsidiaries. In addition, “Fresenius SE” and “Fresenius SE & Co. KGaA” refer to Fresenius SE & Co. KGaA. Fresenius SE owns 94,380,382 of our shares as of February 13, 2025, 32.2% based on 293,413,449 outstanding shares, as reported herein. In this report, we use Fresenius SE to refer to that company as a partnership limited by shares, effective on and after January 28, 2011, as well as both before and after the conversion of Fresenius AG from a stock corporation under German law into a European Company ( Societas Europaea ) on July 13, 2007. “Management Board” and “our Management Board” refer to the members of the management board of FME AG and, except as otherwise specified, “Supervisory Board” and “our Supervisory Board” refer to the supervisory board of FME AG. “Ordinary shares” refers to the ordinary shares prior to the conversion in 2013 of our preference shares into ordinary shares. Following such conversion, we refer to our ordinary shares as “shares.”
The term “Care Enablement” refers to our Care Enablement operating segment, which is primarily engaged in the distribution of health care products and equipment and includes research and development (R&D), manufacturing, supply chain and commercial operations, as well as supporting functions, such as regulatory and quality management. The term “Care Delivery” refers to the Care Delivery operating segment, which is primarily engaged in providing services for the treatment of chronic kidney disease (CKD), end-stage renal disease (ESRD) and other extracorporeal therapies, including value and risk-based care programs. Care Delivery also includes the pharmaceutical products business and the income from equity method investees related to the sale of certain renal pharmaceuticals from Vifor Fresenius Medical Care Renal Pharma Ltd. (VFMCRP), which are used in our clinics to provide health care services to our patients. Our operating segments are determined based upon how we manage our businesses and allocate resources with responsibilities by products and services and is aligned to the financial information that is presented on a quarterly basis to the chief operating decision maker.
Our Global Medical Office (GMO), which seeks to optimize medical treatments and clinical processes within the Company and supports both Care Delivery and Care Enablement, is centrally managed and its profit and loss are allocated to the segments. Similarly, we allocate costs related primarily to headquarters’ overhead charges, including accounting and finance as well as certain human resources, legal and IT costs, as we believe that these costs are attributable to the segments and used in the allocation of resources to Care Delivery and Care Enablement. These costs are allocated at budgeted amounts, with the difference between budgeted and actual figures recorded at the corporate level. However, certain costs, which relate mainly to shareholder activities, management activities, global internal audit and the remeasurement of certain investments and virtual power purchase agreements, are not allocated to a segment but are accounted for as corporate expenses. These activities do not fulfill the definition of a segment according to IFRS 8, Operating Segments and are also reported separately as Corporate (Corporate). Financing is a corporate function which is not controlled by the operating segments. Therefore, the Company does not include interest expense relating to financing as a segment measurement. In addition, the Company does not include income taxes as we believe taxes are outside the segments’ control. See note 29 of the notes to the consolidated financial statements included in this report for a further discussion on our operating segments.
At an extraordinary general meeting (EGM) of the Company held on July 14, 2023, the shareholders of the Company approved a proposal to change the legal form of the Company from a partnership limited by shares ( Kommanditgesellschaft auf Aktien – KGaA) into a stock corporation ( Aktiengesellschaft – AG), (the Conversion). Upon effectiveness of the Conversion, which occurred upon registration of the Conversion with the competent commercial register on November 30, 2023, Fresenius Medical Care Management AG, the Company’s former general partner (Management AG) exited the Company, Fresenius SE & Co. KGaA (Fresenius SE) ceased to control (as defined by IFRS 10, Consolidated Financial Statements) the Company and the Company ceased to be a member of the Fresenius SE consolidated group. Following the Conversion, Fresenius SE continued to hold 32.2% of our share capital.
The abbreviations “THOUS” and “M” are used to denote the presentation of amounts in thousands and millions, respectively. All references in this report to the notes to our financial statements are to the notes to the consolidated financial statements included in this report.
1
Forward-looking statements
This report contains forward-looking statements within the meaning of Section 27A of the Securities Act of 1933, as amended, and Section 21E of the Securities Exchange Act of 1934, as amended (the Exchange Act). When used in this report, the words “outlook,” “expects,” “anticipates,” “intends,” “plans,” “believes,” “seeks,” “estimates,” “guidance,” “target” and similar expressions are generally intended to identify forward looking statements. Although we believe that the assumptions and expectations reflected in such forward-looking statements are reasonable, forward-looking statements are inherently subject to risks and uncertainties, many of which cannot be predicted with accuracy and some of which might not be anticipated. Additionally, subsequent events and actual results, financial and otherwise, have differed in the past and, going forward, could differ materially from those set forth in or contemplated by the forward-looking statements contained elsewhere in this report. We have based these forward-looking statements on current estimates and assumptions made to the best of our knowledge. By their nature, such forward-looking statements involve risks, uncertainties, assumptions and other factors which could cause actual results, including our financial condition and profitability, to differ materially, positively or negatively, relative to the results expressly or implicitly described in or suggested by these statements. Moreover, forward-looking estimates or predictions derived from third parties’ studies or information (which we do not independently verify) may prove to be inaccurate. Consequently, we cannot give any assurance regarding the future accuracy of the opinions set forth in this report or the actual occurrence of the projected developments described herein. In addition, even if our future results meet the expectations expressed here, those results may not be indicative of our performance in future periods.
These risks, uncertainties, assumptions, and other factors, including associated costs, could cause actual results to differ from our projected results and include, among others, the following:
| ● | changes in governmental and private payor reimbursement for our complete products and services portfolio, including the United States (U.S. or USA) Medicare reimbursement system for dialysis and other health care services, including potentially significant changes to the Patient Protection and Affordable Care Act of 2010 (Pub.L. 111-148), as amended by the Health Care and Education Reconciliation Act (Pub.L. 111-152) (collectively, ACA) that could result from the expiration of insurance premium subsidies presently available under the ACA or future efforts to revise, repeal or replace the ACA, and changes by regulators to certain reimbursement models, such as the ESRD Treatment Choices (ETC) model and the Comprehensive Kidney Care Contracting (CKCC) model, which could significantly impact performance under these models in unanticipated ways; |
| ● | our ability to accurately interpret and comply with complex current and future government regulations applicable to our business including sanctions and export control laws and regulations, laws and regulations in relation to environmental, social and governance topics, the impact of health care, tax and trade law reforms, in particular the Organisation for Economic Co-operation and Development (OECD) initiatives for the reallocation of taxation rights to market countries (Pillar one) and introduction of a global minimum tax (Pillar two) as well as potential U.S. tax reform and countermeasures to OECD Global Tax deals, antitrust and competition laws in the countries and localities in which we operate, other government regulation including, in the U.S., the federal Medicare and Medicaid Fraud and Abuse Amendments of 1977, as amended (the Anti-Kickback Statute), the False Claims Act, the federal Physician Self-Referral Law (the Stark Law), the Civil Monetary Penalty Law, the Health Insurance Portability and Accountability Act, the Health Information Technology for Economic and Clinical Health Act, the Foreign Corrupt Practices Act (FCPA), the Federal Trade Commission Non-Compete Clause Rule (which is presently subject to an injunction against enforcement), the U.S. Securities and Exchange Commission’s (SEC) climate disclosure rules (which have been stayed by the SEC pending the completion of judicial review) and (in each case) other similar state laws, as well as the Food, Drug and Cosmetic Act and, outside the U.S. (International), inter alia, the European Union (EU) Medical Device Regulation (MDR), the EU General Data Protection Regulation, the EU Taxonomy Regulation, the EU Corporate Sustainability Reporting Directive (CSRD), the EU Artificial Intelligence Act, the NIS 2 Directive (Directive (EU) 2022/2555), the German Act on Human Rights Due Diligence in Supply Chains, the EU Due Diligence Directive, the two invoice policy, “Buy China” policy, volume-based procurement policies and the Tendering and Bidding Law in China and other related local legislation as well as other comparable regulatory regimes in many of the countries where we supply health care services and/or products. |
2
In the U.S., the interpretation of these statutes and the validity of existing interpretations by the agencies that administer such statutes may be subject to increased uncertainty as a result of the U.S. Supreme Court’s opinion in Loper Bright Enterprises v. Raimondo and Relentless v. Department of Commerce, 603 U.S. (2024) (Loper) in June 2024. Loper overruled the so-called “Chevron Doctrine” under which administrative agencies were accorded significant deference in their interpretation of the statutes they administer. The Loper opinion held that the U.S. Administrative Procedure Act requires courts to “exercise their independent judgment in deciding whether an agency has acted within its statutory authority.” While the effects of the Loper decision will become apparent over the succeeding months and years, it is possible that the decision could result in additional litigation challenging regulations, guidance, and decisions issued by agencies such as the U.S. Food and Drug Administration (FDA) and the Centers for Medicare and Medicaid (CMS), concern over the enforceability of such regulations until tested in court, challenges to CMS guidance in areas such as coverage billing requirements, coding decisions, add-on payments and procedure categorization and the Medicaid Drug Rebate Program, as well as the validity of advisory opinions and safe-harbor regulations issued by the Office of Inspector General of the Department of Health and Human Services under the Anti-Kickback Statute. Such additional litigation could also result in additional uncertainty regarding such regulations and interpretations due to conflicting interpretations and rulings issued by courts in different jurisdictions. Given the uncertainty created by the Loper decision, we cannot predict its potential impact on our financial condition and results of operations at this time;
| ● | the influence of private payors (including integrated care organizations, commercial insurance and Medicare Advantage plans, also known as Medicare Part C, offered by private health insurers approved by CMS to provide their members with Medicare Part A, Part B and usually Part D benefits (Medicare Advantage or MA plans), as well as efforts by these organizations to manage costs by limiting health care benefits, narrowing their networks, reducing provider reimbursement, implementing prior authorization requirements and/or restricting options for patient funding of health insurance premiums, including efforts by employer group health plans (EGHPs) and commercial insurers to make dialysis reimbursement payments at a lower rate as a result of the U.S. Supreme Court’s ruling in Marietta Memorial Hospital Employee Health Benefit Plan, et al. v. DaVita Inc. et al. 142 S. Ct. 1968 (2022) (Marietta), particularly if the U.S. Congress fails to enact legislation that would reverse the effects of that decision; |
| ● | the impact of worldwide pandemics (for example, the severe acute respiratory syndrome coronavirus 2 and the related Coronavirus disease (COVID-19) pandemic), including, without limitation, a significant increase in mortality of patients with chronic kidney diseases as well as an increase in persons experiencing renal failure, the impacts of global viruses on our patients, caregivers, employees, suppliers, supply chain, business and operations, and consequences of economic downturns resulting from global pandemics; |
| ● | our ability to attract and retain skilled employees and risks that competition for labor, high turnover rates and meaningfully higher personnel costs as well as legislative, union, or other labor-related activities or changes have and will continue to result in significant increases in our operating costs, decreases in productivity and partial suspension of operations and to impact our ability to address additional treatments and growth recovery; |
| ● | the increase in raw material, energy, labor and other costs, including an impact from these cost increases and/or supply chain impacts on our cost savings initiatives and increases due to geopolitical conflicts in certain regions (for example, impacts related to the war between Russia and Ukraine (Ukraine War)) as well as the impact that inflation may have on a potential impairment of our goodwill, investments or other assets as noted above; |
| ● | the outcome of litigation as well as government and internal investigations; |
| ● | launch of new technology, introduction of generic or new pharmaceuticals and medical devices that compete with our products or services, advances in medical therapies, including the increased utilization of pharmaceuticals that reduce the progression of CKD and its precursors, xenotransplantation research and development and new market entrants that compete with our businesses (further information regarding the impact of certain pharmaceuticals that reduce the progression of CKD and our analysis of their impact on our cash flow projections and goodwill sensitivity assessments can be found in note 2 a) of the notes to the consolidated financial statements included in this report); |
| ● | product liability risks and the risk of recalls of our products by regulators; |
3
| ● | our ability to continue to grow our health care services and products businesses, organically and through acquisitions, including, with respect to acquisitions, the effects of increased enforcement of antitrust and competition laws, and to implement our strategy; |
| ● | the impact of currency and interest rate fluctuations, including the heightened risk of fluctuations as a result of geopolitical conflicts in certain regions, the impact of the current macroeconomic inflationary environment on interest rates and a related effect on our borrowing costs; |
| ● | volatility in the valuation of financial instruments connected to energy prices or energy production volumes (such as virtual power purchase agreements (vPPAs)), including the heightened risk of volatility as a result of geopolitical conflicts in certain regions; |
| ● | potential impairment of our goodwill, investments or other assets due to decreases in the recoverable amount of those assets relative to their book value, particularly as a result of sovereign rating agency downgrades coupled with an economic downturn in various regions or as a result of geopolitical conflicts in certain regions; |
| ● | our ability to protect our information technology systems and protected health information against cyber-attacks and to prevent other data privacy or security breaches of our data (including data held by our third party service providers), current and potential litigation arising from cybersecurity breaches and the potential effects on our reputation, customer or vendor relationships, business operations or competitiveness of any cybersecurity incidents we or our service providers may incur, as well as our ability to effectively capture efficiency goals and align with contractual and other requirements related to data offshoring activities; |
| ● | changes in our costs of purchasing and utilization patterns for pharmaceuticals and our other health care products and supplies, the inability to procure raw materials or disruptions in our supply chain; |
| ● | increases in tariffs and trade barriers that could result from withdrawal by single or multiple countries from multilateral trade agreements or the imposition of sanctions, retaliatory tariffs and other countermeasures in the wake of trade disputes and geopolitical conflicts in certain regions along with the effects of global events, political and/or governmental volatility and the influence of the U.S. political landscape and associated developments on health care systems, our patients or our business; |
| ● | collectability of our receivables, which depends primarily on the efficacy of our billing practices, the financial stability and liquidity of our governmental and private payors, services from third-party clearinghouses, customers and intermediaries as well as payor strategies to delay, dispute or thwart the collection process; |
| ● | our ability to secure contracts and achieve cost savings and desired clinical outcomes in our operations, including in our value-based care operations and other health care risk management programs in which we participate or intend to participate; |
| ● | the greater size, market power, experience and product offerings of certain competitors in certain geographic regions and business lines; |
| ● | the use of accounting estimates, judgments and accounting pronouncement interpretations in our consolidated financial statements; |
| ● | our ability to continue to achieve projected cost savings through 2025 as part of our previously announced transformation of our operating structure and steps to achieve cost savings (FME25 Program) as well as the possibility that changing or increasing responsibilities of our employees as a result of this transformation could require additional resources in the short-term; |
| ● | our ability to improve our financial performance through the divestiture of non-core and dilutive assets; and |
| ● | our ability to achieve projected price increases for our products and corresponding services. |
4
Important factors that could contribute to such differences are noted in Item 3.D, “Key Information – Risk factors,” Item 4B, “Information on the Company – Business overview,” and the notes to our audited consolidated financial statements included in this report.
Our business is also subject to other risks and uncertainties that we describe from time to time in our periodic public filings which can be accessed at the SEC website at www.sec.gov. Developments in any of these areas could cause our results to differ materially from the results that we or others have projected or may project.
The actual accounting policies, the judgments made in the selection and application of these policies, as well as the sensitivities of reported results to changes in accounting policies, assumptions and estimates, are additional factors to be considered along with our financial statements and the discussion under “Results of operations” in Item 5 below, “Operating and financial review and prospects.” For a discussion of our critical accounting policies, see note 2 of the notes to the consolidated financial statements included in this report.
We provide certain non-financial information about our efforts and performance in environmental, social, and governance (ESG) matters. This information, prepared in accordance with Sections 315b to 315c in conjunction with Sections 289c to 289e of the German Commercial Code and the EU Taxonomy Regulation, addresses key topics such as environmental sustainability, social responsibility, anti-corruption measures, and human rights and is included in our German Annual Report ( Geschaeftsbericht ). We voluntarily comply with CSRD requirements, which are currently not incorporated into German law, as part of providing such non-financial information. This information, included in our German Annual Report, is reviewed by an independent auditor and made available on our website under “Publications” on the “Investors” page at www.freseniusmedicalcare.com. The report, including our ESG information for 2024, will be published following the filing of our annual Form 20-F with the SEC.
Our sustainability efforts, including those on diversity, equity and inclusion, are designed to comply with any applicable laws, in particular anti-discrimination laws and other legal requirements of the various jurisdictions in which we operate. We are monitoring relevant legal developments, including early 2025 Executive Orders issued in the U.S., and will review our activities in relevant Company entities as appropriate to facilitate ongoing compliance with applicable laws, in particular anti-discrimination laws, and related risk mitigation efforts. Additionally, this Form 20-F is being filed for the fiscal year ended December 31, 2024, prior to the recent Executive Orders issued in the United States.
In referencing such ESG information and/or any other portions of our German Annual Report and furnishing our website address in this report, however, we do not intend to incorporate any content from those documents or information on our website into this report, and any information in those documents or on our website should not be considered to be part of this report, except as may be expressly set forth herein. This disclosure reflects our ongoing commitment to transparency and sustainability.
Rounding adjustments applied to individual numbers and percentages shown in this and other reports may result in these figures differing immaterially from their absolute values. Some figures (including percentages) in this report have been rounded in accordance with commercial rounding conventions. In some instances, such rounded figures and percentages may not add up to 100% or to the totals or subtotals contained in this report. Furthermore, totals and subtotals in tables may differ slightly from unrounded figures contained in this report due to rounding in accordance with commercial rounding conventions. A dash (–) indicates that no data were reported for a specific line item in the relevant financial year or period, while a zero (0) is used when the pertinent figure, after rounding, amounts to zero.
Market and industry data
Except as otherwise specified herein, all patient and market data in this report have been derived using internal estimates and publicly available information collected by our internal market analysis tools. See Item 4.B, “Information on the Company - Business Overview – Major Markets and Competitive Position.”
5
Part I
|
Item 1. |
Identity of directors, senior management and advisors |
Not applicable
Item 2. Offer statistics and expected timetable
Not applicable
Item 3. Key information
We conduct our business on a global basis in various currencies with major operations located in the U.S. and Germany. We prepare our consolidated financial statements utilizing the euro as our reporting currency. We have converted the balance sheets of our non-euro denominated operations into euro at the exchange rates prevailing at the balance sheet date. Revenues and expenses are translated at the annual average exchange rates for the respective period, as shown.
A summary of the spot and annual average exchange rates for the euro to U.S. dollars for the last three years is set forth below. The European Central Bank (ECB) determines such rates (Reference Rates) based on the regular daily averaging of rates between central banks within and outside the European banking system. The ECB normally publishes the Reference Rates daily around 4 p.m. Central European Time (CET).
|
Exchange rates |
|
|
|
|
|
|
|
|
|
|
|
|
|
December 31, |
|
December 31, |
|
|
|
|
|
|
|
|
|
2024 |
|
2023 |
|
2024 |
|
2023 |
|
2022 |
|
|
|
spot exchange |
|
spot exchange |
|
average exchange |
|
average exchange |
|
average exchange |
|
|
|
rate in € |
|
rate in € |
|
rate in € |
|
rate in € |
|
rate in € |
|
1 U.S. dollar |
|
0.96256 |
|
0.90498 |
|
0.92386 |
|
0.92484 |
|
0.94962 |
|
B. |
Capitalization and indebtedness |
Not applicable
|
C. |
Reasons for the offer and use of proceeds |
Not applicable
|
D. |
Risk factors |
Before you invest in our securities, you should be aware that the occurrence of any of the events described in the following risk factors or elsewhere in this report, and other events that we have not predicted or assessed could affect the outcome of forward-looking statements included in this report and/or have a material adverse impact on our business, financial condition and results of operations. If the events described below or other unpredicted events occur, then the trading price of our securities could decline and you may lose all or part of your investment.
Risks relating to legal and regulatory matters
We operate in a highly regulated industry such that the potential for legislative reform provides uncertainty and potential threats to our operating models and results.
The delivery of health care services and products is highly regulated in virtually every country in which we operate. Proposals for legislative reform in these countries are often introduced to improve access to care, address quality of care issues and manage costs of the health care system. In the U.S., there have been efforts to pursue significant changes to existing health care programs, including efforts to repeal or replace the ACA which, while unsuccessful to date, continue. On June 17, 2021, the U.S. Supreme Court reversed lower court rulings that declared the ACA to be unconstitutional, holding that the states and other plaintiffs in the case did not have standing to challenge the law. If future efforts to limit or repeal the ACA are successful, such efforts could have significant effects on our businesses, both positive and negative, but the outcomes are impossible to predict.
6
In October 2017, the Trump administration discontinued making cost-sharing reduction (CSR) reimbursements to insurers, arguing that Congress failed to appropriate funding. In response, many state departments of insurance either allowed or required insurers to mitigate their losses by increasing the 2018 premiums on their ACA plans. Many insurers also mitigated the impact to themselves by “silver loading,” a practice whereby the premiums for silver-level plans were increased to offset the loss of CSR payments. Silver loading may also have mitigated the impact of premium increases to some low-income consumers by increasing their premium tax credits. In 2019 and 2020, all states either permitted or required silver loading. In 2017, several insurers sued the U.S. federal government to reinstate CSR payments. On June 21, 2021, the U.S. Supreme Court denied requests from multiple insurers to review lower court decisions that held they were not entitled to full unpaid CSR payments. As a result, insurers are entitled to the unpaid CSRs, but the total amount they are owed must be offset by any excess premium tax credits received from premium increases for 2018 and beyond. The Biden administration requested appropriations for CSR payments in its fiscal year (FY) 2025 budget request. Congress did not pass appropriations bills for FY 2025 and funding is maintained at current levels under a continuing resolution that expires on March 14, 2025. As a result, a reduction in the availability of insurance through insurance exchanges established by the ACA or expiration without renewal of insurance premium subsidies presently available under the ACA could reduce the number of our commercially insured patients and shift such patients to Medicare and Medicaid. In addition, the Marietta ruling makes it easier for health plans to design plan benefits for Medicare eligible ESRD patients in a way that makes private health insurance relatively less attractive to ESRD patients and Medicare relatively more attractive. In the Marietta case, the questions presented involved whether the health plan violated the Medicare Secondary Payor Act (MSPA) by “taking into account” that plan beneficiaries are eligible for Medicare and/or by “differentiating” between the benefits that the plan offers to patients with dialysis versus others. On June 21, 2022, the U.S. Supreme Court reversed the Sixth Circuit decision and held that the EGHP for Marietta Memorial Hospital did not violate the MSPA.
Bills were introduced previously to Congress that would address the Marietta decision, but will need to be reintroduced in the current Congress. The Restore Protections for Dialysis Patients Act would restore the interpretation of the Medicare Secondary Payer Act prior to the Marietta decision and ensure that patients cannot be discriminated against because of their need for dialysis. We cannot predict whether the U.S. Congress will enact this or any other proposed legislation that would reverse the potential effects of the Marietta decision. These bills will need to be reintroduced before they are taken up in the 119th Congress which began on January 3, 2025. As Medicare and Medicaid reimbursement rates are generally lower than the reimbursement rates paid by commercial insurers, a shift of commercially insured patients to Medicare and Medicaid could have a material adverse impact on our business, financial condition and results of operations. The Marietta ruling may also result in certain EGHPs reducing the benefits offered for dialysis, which could, depending on the number of patients impacted, have a material and adverse impact on our business, financial condition and results of operation. There can be no assurance that this proposal or any other legislation to address the Marietta decision will be enacted. See “Changes in reimbursement, payor mix and/or governmental regulations for health care could materially decrease our revenues and operating profit” below.
7
Changes in reimbursement, payor mix and/or governmental regulations for health care could materially decrease our revenues and operating profit.
We receive reimbursement for our health care services from both public, government-sponsored payors and private, commercial payors. A large portion of our businesses is reimbursed by government payors, in particular the Medicare and Medicaid programs in the U.S. For the fiscal year ended December 31, 2024, approximately 18% of our consolidated revenues resulted from Medicare and Medicaid (excluding Medicare Advantage) reimbursement. The Medicare and Medicaid programs change their payment methodologies and funding from time to time in ways that are driven by changes in statute, economic conditions, and policy. For example, the Budget Control Act of 2011 (BCA) required a $1.2 trillion reduction in deficits through 2021. As a backup, if Congress could not agree on proposals to reach this target, sequestration or across-the-board spending cuts would go into effect (U.S. Sequestration). On April 1, 2013, a 2% reduction to Medicare payments took effect and continues in force. Additionally, the Statutory Pay-As-You-Go Act of 2010 (Statutory PAYGO) requires that if the Congressional Budget Office determines that Congress has passed legislation increasing the federal budget deficit, a 4% sequester cut for Medicare program payments would become effective. To date, Congress has passed legislation increasing the federal deficit on a number of occasions subsequent to the passage of Statutory PAYGO, but has always acted to prevent such sequestration from becoming effective. Spending cuts pursuant to the U.S. Sequestration have adversely affected our operating results in the past and will continue to do so. In addition, options to restructure the Medicare program in the direction of a defined contribution, “premium support” model and to shift Medicaid funding to a block grant or per capita arrangement, with greater flexibility for the states, have been proposed or considered from time to time. Changes in payment methodologies and funding or payment requirements of (without limitation) the End-Stage Renal Disease Prospective Payment System (ESRD PPS), the Physician Fee Schedule, the Clinical Laboratory Fee Schedule and the Ambulatory Surgical Center Payment System may have material effects on our operating results. We may also experience changes in the interpretation of government regulations by the courts. We have very little opportunity to influence or predict the magnitude of many of those changes. For further information regarding Medicare and Medicaid reimbursement, including new payment models proposed by executive order in July 2019 which are intended to encourage identification and earlier treatment of kidney disease as well as increased home dialysis and transplants, see Item 4B, “Information on the Company — Business Overview — Regulatory and Legal Matters — Reimbursement.”
Our patients make decisions about their insurance coverage among options that, depending on their personal circumstances and location, may include Medicare, Medicaid, Medicare Advantage plans, employer group health coverage, exchange plans and other commercial coverage. Government reimbursement programs, including Medicare and Medicaid, generally pay less than commercial insurance, and Medicare Advantage plans generally pay less than other commercial plans. In addition, we may experience higher write-offs of Medicare deductibles and other cost-sharing amounts due to secondary uninsured and underinsured patients which would result in an increase in uncollectible accounts. As a result, the payments we receive from private payors generate a substantial portion of the profits we report. For further information, see the table “U.S. patient service revenue” detailing the percentage generated from government reimbursement and private payors in the U.S. in Item 4B, “Information on the Company — Business overview.”
Any of the following events, among others, could have a material adverse impact on our business, financial condition and results of operations:
| ● | we may be subject to rejections of or reductions in reimbursement from private payors, including, for example, through their use of lower allowed charges rather than rates based on our billed charges; |
| ● | we may experience a reduction in our ability to obtain and retain commercially insured patients to utilize our health care services; |
| ● | efforts by private payors to continue to control the cost of and/or the eligibility for access to health care services, including relative to insurance products on and off the health care exchanges established by the ACA and potential efforts by employer group health plans and commercial insurers to limit benefits or reduce reimbursement for our services or eliminate reimbursement for some of our services; |
| ● | a portion of our business that is currently reimbursed by private insurers or hospitals may become reimbursed by integrated care organizations, which may use payment methodologies that reduce reimbursement for our services. There can be no assurance that we can achieve future price increases from private insurers and integrated care organizations offering private insurance coverage to our patients; |
8
| ● | if legislative or regulatory efforts or litigation to restrict or eliminate the charitable funding of patient insurance premiums are successful, our patients with coverage under publicly funded programs like Medicare may be unable to continue to pay the premiums for that coverage and may become uninsured for dialysis services. In addition, a portion of our patients who are currently covered by private insurers may be unable to continue to pay the premiums for that coverage and may become uninsured for dialysis services or may elect to transition to government funded reimbursement programs that reimburse us at lower rates for our services. See Item 4B, “Information on the Company – Business Overview – Regulatory and Legal Matters – Reimbursement – Potential changes impacting our private payors” for further information; or |
| ● | if we are unable to secure appropriate reimbursement arrangements for the pharmaceuticals we provide in our dialysis clinics, we could experience a material adverse effect on our operating results. An increased utilization of bundled pharmaceuticals, as part of the ESRD PPS, or decreases in reimbursement for pharmaceuticals outside the bundled rate may result in a material adverse impact on our results of operations. |
For further information, see Item 4B, “Information on the Company — Business Overview — Regulatory and Legal Matters — Reimbursement.”
In addition to the foregoing factors, the health care insurance industry is experiencing continuing consolidation among insurers and pharmacy benefit managers, including increasing buyer power and impacts on referral streams. Such consolidation could have a material adverse effect on our ability to negotiate favorable coverage terms and reimbursement rates.
If we do not comply with the numerous governmental regulations applicable to our business, we could suffer adverse legal consequences, including exclusion from government health care programs or termination of our authority to conduct business, any of which would result in a material decrease in our revenue; this regulatory environment also exposes us to claims and litigation, including “whistleblower” suits.
Our operations in both our health care services business and our products business are subject to extensive governmental regulation in virtually every country in which we operate. We are also subject to other laws of general applicability, including antitrust, anti-bribery and anti-corruption laws as well as sustainability requirements. The applicable regulations, which differ from country to country, cover areas that include:
| ● | regulatory approvals for products or product improvements; |
| ● | regulatory approvals and oversight of clinical and certain non-clinical R&D activities; |
| ● | the quality, safety and efficacy of medical and pharmaceutical products and supplies; |
| ● | the operation and licensure of manufacturing facilities, laboratories, dialysis clinics, ambulatory surgery centers and other health care facilities; |
| ● | product labeling, advertising and other promotion; |
| ● | accurate reporting and billing for government and third-party reimbursement, including accurate and complete medical records to support such billing and, in the U.S., the obligation to report and return overpayments within 60 days of the time that the overpayment is identified and quantified; |
| ● | the discounting of reimbursed drug and medical device products and the reporting of drug prices to government authorities; |
| ● | limits on our ability to make acquisitions or certain investments and the terms of those transactions; |
| ● | the collection, dissemination, access, use, security, protection and privacy of protected health information or other protected data, as well as requirements to report data breaches to regulatory agencies; and |
| ● | compensation of medical directors and other financial arrangements with physicians and other referral sources. |
9
Failure to comply with one or more of these laws or regulations may give rise to a number of adverse legal consequences. These include, in particular, loss or suspension of federal certifications, loss or suspension of licenses under the laws of any state or governmental authority from which we generate substantial revenues, monetary and administrative penalties, product recalls, increased costs for compliance with government orders, complete or partial exclusion from government reimbursement programs, refunds of payments received from government payors and government health care program beneficiaries due to failures to meet applicable requirements or complete or partial curtailment of our authority to conduct business. Any of these consequences could have a material adverse impact on our business, financial condition and results of operations.
Our medical devices and drug products are subject to detailed, rigorous and frequently changing regulation by numerous national, supranational, federal and state authorities. In addition, our facilities and procedures and those of our suppliers are subject to periodic inspection by various regulatory authorities which may suspend, revoke, or adversely amend the authority necessary for research, manufacture, marketing or sale of our products and those of our suppliers. We and our suppliers must incur expense and spend time and effort to ensure compliance with these complex regulations, and if such compliance is not maintained, we and our suppliers could be subject to significant adverse administrative and judicial enforcement actions in the future. These possible enforcement actions could include warning letters, injunctions, civil penalties, seizures of our products, and criminal prosecutions as well as dissemination of information to the public about such enforcement actions. These actions could result in, among other things, substantial modifications to our business practices and operations; refunds; a total or partial shutdown of production while the alleged violation is remedied; and recalls, withdrawals or suspensions of current products from the market. Any of these events, in combination or alone, could disrupt our business and have a material adverse impact on our business, financial condition and results of operations.
We operate many facilities and engage with other business associates to help carry out our health care activities. In such a widespread, global system, it is often difficult to maintain the desired level of oversight and control over the thousands of individuals employed by many affiliated companies and their business associates. We rely on our management structure, regulatory and legal resources and the effective operation of our compliance programs to direct, manage and monitor our operations, including the activities of our employees and their agents, to comply with government regulations. We cannot assure that our internal control policies and procedures will always protect us from intentional or inadvertent acts of our employees or agents that contravene our compliance policies or violate applicable laws. If employees were to deliberately, recklessly or inadvertently fail to adhere to these regulations, then our authority to conduct business could be terminated and our operations could be significantly curtailed. Any such terminations or reductions could materially reduce our revenues. If we fail to identify in our diligence process or to promptly remediate any non-compliant business practices in companies that we acquire, we could be subject to penalties, claims for repayment or other sanctions. Any such terminations or reductions could materially reduce our revenues, with a resulting material adverse impact on our business, financial condition and results of operations. See also “Risks relating to internal control and compliance — We operate in many different jurisdictions and we could be adversely affected by violations of the U.S. Foreign Corrupt Practices Act and similar worldwide anti-corruption laws,” below.
By virtue of this regulatory environment, our business activities and practices are subject to extensive review by regulatory authorities and private parties, and continuing audits, subpoenas, other inquiries, claims and litigation relating to our compliance with applicable laws and regulations. We may not always be aware that an inquiry or action has begun, particularly in the case of “qui tam” or “whistleblower” actions brought by private plaintiffs under the False Claims Act, which are initially filed under seal. We are the subject of a number of governmental inquiries and civil suits by governmental and private plaintiffs. For information about certain of these pending investigations and lawsuits, see note 25 of the notes to our consolidated financial statements included in this report.
In addition, future legislative or regulatory changes could affect procedures or decision making for approving medical devices or pharmaceuticals. Any such legislation or regulations, if enacted or promulgated, could result in a delay or denial of regulatory approval for our products. If any of our products do not receive regulatory approval, or there is a delay in obtaining approval, this also could have a material adverse impact on our business, financial condition and results of operations.
Cyber-attacks or other privacy and data security incidents could disrupt our business and expose us to significant losses, liability and reputational damage.
We and our third-party service providers routinely process, store and transmit large amounts of data in our operations, including sensitive personal information as well as proprietary or confidential information relating to our business or third parties. We may be subject to breaches of the information technology security systems we use both internally and externally with third-party service providers.
10
Cyber-attacks may penetrate our and our third-party service providers’ security controls and result in the misappropriation or compromise of personal information or proprietary or confidential information, including such information which is stored or transmitted on the systems used by certain of our or their products, to create system disruptions, cause shutdowns (including disruptions to our production plants), or deploy viruses, worms, ransomware, denial-of-service attacks and other malicious software programs that attack our systems. We and our third-party service providers handle the personal information of our patients and beneficiaries, Patient Personal Data (PPD), throughout the U.S. and other parts of the world. We or our third-party service providers may experience a breach under the U.S. Health Insurance Portability and Accountability Act Privacy and Security Rules, the EU’s General Data Protection Regulation and or other similar laws (Data Protection Laws), including the following events:
| ● | impermissible use, access, or disclosure of unsecured PPD, |
| ● | a breach under Data Protection Laws when we or our business associates neglect to implement the required administrative, technical and physical safeguards of its electronic systems and devices, or |
| ● | a data breach that results in impermissible use, access or disclosure of personal identifying information of our employees, patients and beneficiaries. |
Our IT systems have been attacked in the past, resulting in certain patient data being illegally published. For information regarding our cybersecurity risk management and governance, see Item 16K. “Cybersecurity.” For information regarding litigation relating to cybersecurity incidents we experienced in 2023, see note 25 of the notes to the consolidated financial statements included in this report.
When appropriate, we have filed complaints against the unknown attackers with the relevant authorities and we contacted the patients who were affected by the illegal data publication as well as other relevant regulatory agencies and stakeholders. While there has not been any material impact to our financial condition and results of operations as a result of these attacks, future cyber-attacks against our IT systems may result in a loss of financial data or interruptions of our operations that could have a material adverse impact on our business, financial condition and results of operations in the future. The Ukraine War has increased the risk of cyber-attacks against our systems and data.
As we increase the amount of personal information or financial data that we store and share digitally, our exposure to these privacy and data breaches and cyber-attack risks increases (particularly as medical records are a high-value target), including the risk of undetected attacks, damage, loss or unauthorized disclosure or access, and the cost of attempting to protect against these risks also increases. Pursuant to recent legislation, Medicare coverage for telehealth services was extended to March 31, 2025. Commencing April 1, 2025, Medicare coverage for telehealth services will be available principally in rural areas. While the availability of telehealth services is convenient and improves access to medical care, increased reliance on, and utilization of, telemedicine for delivery of health care services could also increase the risk of privacy violations and our vulnerability to data breaches and cyber-attacks. There are no assurances that our security technologies, processes and procedures that we or our outside service providers have implemented to protect personal information and proprietary or confidential information and to build security into the design of our products will be effective. Any failure to keep our information technology systems, financial data and our patients’ and customers’ sensitive information secure from attack, damage, loss or unauthorized disclosure or access, whether as a result of our action or inaction or that of our third-party business associates or vendors that utilize and store such personal information on our behalf, could materially adversely affect our reputation and ability to continue normal operations. Additionally, such failure could expose us to mandatory public disclosure requirements, litigation and governmental enforcement proceedings, material fines, penalties and/or remediation costs, and compensatory, special, punitive and statutory damages, consent orders and other adverse actions, any of which could have a material adverse impact on our business, financial condition and results of operations.
11
If certain of our investments or value and risk-based care programs with health care organizations and health care providers are found to have violated the law, our business could be adversely affected.
A number of the dialysis clinics and health care centers that we operate are owned, or managed, by entities in which one or more hospitals, physicians or physician practice groups hold an interest. Physician owners, who are usually nephrologists, may also provide medical director services and physician owners may refer patients to those centers or other centers we own and operate or to other physicians who refer patients to those centers or other centers we own and operate. We also have arrangements with physician practices to collaborate on our value and risk-based care programs with public and private payors. In the past, certain parties have attempted to utilize our disclosure of these arrangements as the basis for qui tam proceedings under the Anti-Kickback Statute and the Stark Law. Such attempts have not been successful to date. Because our relationships with physicians are governed by the federal and state anti-kickback statutes and other state fraud and abuse laws, we have structured our arrangements to comply with many of the criteria for safe harbor protection and waivers under the Anti-Kickback Statute; however, these arrangements do not always satisfy all elements of applicable safe harbors. While we have established comprehensive compliance policies, procedures and programs to ensure ethical and compliant business operations, if one or more of our arrangements, including value and risk-based care programs, were found to be in violation of the Anti-Kickback Statute, the Stark Law, analogous state laws, or other similar laws worldwide, we could be required to restructure or terminate them. We could also be required to repay to Medicare, Medicaid as well as other federal health care program amounts pursuant to any prohibited referrals, and we could be subject to criminal and monetary penalties and exclusion from federal and state health care programs. Imposition of any of these penalties could have a material adverse impact on our business, financial condition and results of operations. See note 25 of the notes to our consolidated financial statements included in this report.
We are exposed to product liability, patent infringement and other claims which could result in significant costs and liability which we may not be able to insure on acceptable terms in the future.
Health care companies are typically subject to claims alleging negligence, product liability, breach of warranty, malpractice and other legal theories that may involve large claims and significant defense costs whether or not liability is ultimately imposed. Health care products may also be subject to recalls, statutory or regulatory shipping holds and intellectual property rights (for example patents or trademarks) infringement claims which, in addition to monetary penalties, may restrict our ability to sell or use our products. We cannot assure that such claims will not be asserted against us, or, for example, that significant adverse verdicts will not be reached against us or that large scale recalls of our products will not become necessary. In addition, the laws of some of the countries in which we operate provide legal rights to users of pharmaceutical products that could increase the risk of product liability claims. Product liability and intellectual property rights infringement claims, other actions for negligence or breach of contract and product recalls or related sanctions could result in significant costs. These costs could have a material adverse impact on our business, financial condition and results of operations.
While we have been able to obtain liability insurance in the past to partially cover our business risks, we cannot assure that such insurance will be available in the future either on acceptable terms or at all, or that our insurance carriers will not dispute their coverage obligations. In addition, FMCH, our largest subsidiary, is partially self-insured for professional, product and general liability, auto liability and worker’s compensation claims, up to pre-determined levels above which our third-party insurance applies. A successful claim for which we are self-insured or in excess of the limits of our insurance coverage could have a material adverse impact on our business, financial condition and results of operations. Liability claims, regardless of their merit or eventual outcome, also may have a material adverse effect on our business and result in a loss of customer confidence in us or our products, which could have a material adverse impact on our business, financial condition and results of operations. For information about certain of these pending investigations and lawsuits, see note 25 of the notes to our consolidated financial statements included in this report.
12
Risks relating to internal control and compliance
We operate in many different jurisdictions and we could be adversely affected by violations of the U.S. Foreign Corrupt Practices Act and similar worldwide anti-corruption laws.
The U.S. FCPA and similar worldwide anti-corruption laws generally prohibit companies and their intermediaries from making improper payments to public officials for the purpose of obtaining or retaining business. Our internal policies mandate compliance with these anti-corruption laws. We operate many facilities throughout the U.S. and other parts of the world. Our widespread, global operations have thousands of persons employed by many affiliated companies, and we rely on our management structure, regulatory and legal resources and effective operation of our compliance program to direct, manage and monitor the activities of these employees and third-party intermediaries. On March 29, 2019, we entered into a non-prosecution agreement (NPA) with the U.S. Department of Justice (DOJ) and a separate agreement with the SEC in connection with its Cease and Desist Order (SEC Order) intended to resolve fully and finally the U.S. government allegations against us arising from DOJ and SEC investigations into conduct in countries outside the U.S. that violated the FCPA or other anti-bribery laws. As part of these agreements, we agreed to the appointment of an independent compliance monitor (the Monitor). On December 30, 2022, the Monitor certified to our implementation of an effective anti-corruption compliance program and submitted her final certification report on January 31, 2023. The DOJ and SEC have accepted the Monitor’s certification and the NPA and SEC Order expired on March 1, 2023 and March 29, 2023, respectively. While we continue to make significant investments in our compliance and financial controls and in our compliance, legal and financial organizations (including certain remaining recommendations of the Monitor), and are fully committed to compliance with the FCPA and other applicable anti-bribery laws, we cannot ensure that our internal control policies and procedures always will protect us from deliberate, reckless or inadvertent acts of our employees or third-party intermediaries that contravene our compliance policies or violate applicable laws. Our continued expansion, including in developing countries, could increase the risk of such violations in the future. Violations of these laws, or allegations of such violations, could disrupt our business and result in a material adverse impact on our business, financial condition and results of operations.
In 2015, we self-reported to the German prosecutor conduct with a potential nexus to Germany and continued to cooperate with government authorities in Germany in their review of the conduct that prompted our and the U.S. government investigations.
For further information, see note 25 of the notes to our consolidated financial statements included in this report.
Risks relating to our business activities and industry
If physicians and other referral sources cease referring patients to our health care service businesses and facilities or cease purchasing or prescribing our products, our revenues would decrease.
In providing services within our health care business, we depend upon patients choosing our health care facilities as the location for their care. Patients may select a facility based, in whole or in part, on the recommendation of their physician. Physicians and other clinicians typically consider a number of factors when recommending a particular dialysis facility, dialysis home program, pharmacy, physician practice, vascular surgery center, or cardiac catheterization center to an ESRD patient, including the quality of care, the competency of staff, convenient scheduling, and location and physical condition. Physicians may change their recommendations, which may result in the movement of new or existing patients to competing facilities, including facilities established by the physicians themselves. At most of our dialysis clinics and home programs, a relatively small number of physicians often account for the referral of all or a significant portion of the patient base. We have no ability to dictate these recommendations and referrals. If a significant number of physicians or other referral sources cease referring their patients to our facilities and home programs or stop purchasing or prescribing our dialysis products, this would reduce our health care revenue and could materially adversely affect our overall operations.
As a company with operations spanning around 150 countries, we face specific risks from our global operations.
We operate dialysis clinics in around 40 countries and sell a range of products and services to customers in around 150 countries. Our global operations are subject to a number of risks, including but not limited to the following:
| ● | the economic and political situation in certain countries or regions could deteriorate, become unstable, or lead to armed conflict, as exemplified by the Ukraine War; |
13
| ● | geopolitical factors could intensify fluctuations in exchange rates, currency devaluations, and/or material increases in interest rates (for example, as a reaction from central banks to high inflation), any of which could adversely affect profitability and all of which have been heightened by the Ukraine War; |
| ● | sovereign rating agency downgrades coupled with an economic downturn in various regions or as a result of geopolitical conflicts in certain regions (for example, the Ukraine War) could result in impairment of our goodwill, investments or other assets due to decreases in the recoverable amount of those assets relative to their book value; |
| ● | we could face difficulties in enforcing and collecting accounts receivable under some countries’ legal systems; |
| ● | local regulations could restrict our ability to obtain a direct ownership interest in dialysis clinics or other operations; |
| ● | some countries or economic unions may impose charges or restrictions, such as local content requirements, which restrict the importation of our products or give local manufacturers an advantage in tenders or provide large discounts to providers for certain purchases of our products; |
| ● | potential increases in tariffs and trade barriers could occur affecting both the sale of our products and importation of products and product components, including upon any withdrawal by the U.S. or other countries from multilateral trade agreements, or the imposition of sanctions, retaliatory tariffs and other countermeasures in the wake of trade disputes and geopolitical conflicts and wars in certain regions (for example the Ukraine War); |
| ● | we could experience transportation delays or interruptions or higher energy costs or energy shortages; |
| ● | growth and expansion into emerging markets could cause us difficulty due to greater regulatory barriers than in the U.S. or Western Europe, the necessity of adapting to new regulatory systems, and problems related to entering new markets with different economic, social, legal and political systems and conditions; and |
| ● | we may not prevail in competitive contract tenders. |
Any one or more of these or other factors relevant to global operations could increase our costs, reduce our revenues, or disrupt our operations, with possible material adverse impact on our business and financial condition.
Certain countries in which we market, manufacture or sell our products do not have laws which protect our intellectual property to the same degree as those in the U.S. or elsewhere and our competitors may gain market position by designing products that infringe upon our intellectual property rights. An inability to protect our intellectual property in these countries could have an adverse effect on our business, results of operations and financial condition.
14
We conduct humanitarian-related business and provide life-sustaining health care products and services directly or indirectly in sanctioned countries, such as Russia, Belarus, Iran and Syria. We believe our humanitarian-related business is permitted by applicable sanctions regimes (or, in some cases is excluded from such regimes), and in light of the humanitarian nature of our products and services and the patient communities that benefit from our products, we expect to continue such activities, provided they continue to be permissible under or excluded from applicable export controls and economic sanctions. Life-sustaining health care products are usually not subject to trade sanctions/export controls. However, as a result of the escalation of EU, U.S. and other countries’ trade sanctions targeting Russia and Belarus, certain spare parts and components for our products fall under product categories subject to restrictions. Sanctions programs often, but do not always, provide for certain exemptions or availability of licensure for medical or pharmaceutical purposes. Furthermore, product registration procedures may be affected in case technology/technical information on products or components to be submitted in such procedures is or becomes subject to export or transfer restrictions for a relevant country and in case relevant licenses cannot be obtained, which ultimately may also have an impact on marketability of affected products. At this time, we expect that such risk would mostly be limited to product registration procedures in Russia and Belarus as a result of the escalation of EU, U.S. and other countries’ trade sanctions targeting Russia and Belarus, but it may also affect Eurasian Economic Union (EAEU) product registration procedures in other EAEU member states in case these involve an information exchange with Russian/Belarusian authorities of restricted technology/technical information and in case relevant licenses cannot be obtained. A violation of applicable economic sanctions or export controls laws and regulations could subject us to enforcement actions. Possible enforcement actions vary between jurisdictions and depend on the factual circumstances of the given violation, but could include criminal penalties, imprisonment of responsible individuals, administrative or civil penalties, restricted access to certain markets and reputational harm, among others. Our internal policies and procedures may not protect us from deliberate, reckless or inadvertent acts of our employees or agents that contravene our compliance policies or violate applicable laws.
If we fail to estimate, price for and manage medical costs in an effective manner, the profitability of our value and risk-based care programs could decline and could materially and adversely affect our results of operations, financial position and cash flows.
Through our value and risk-based care programs, we assume the risk of both medical and administrative costs for certain patients in return for fixed periodic payments or potential reimbursement based on our achievement against set benchmark targets from governmental and commercial insurers. Specifically in the U.S., our participation in various value and risk-based care programs includes the CMS CKCC model and capitation, risk-based or shared savings agreements with commercial insurers in which FMCH receives fixed periodic payments against set benchmark targets to cover all or a defined portion of the medical costs of a defined population of patients. For information on the value-based programs in which we participate, see Item 4B, “Information on the Company — Business overview — Other health care services — Value and risk-based care programs.”
Our profitability in our value-based agreements and risk products depends in part upon our ability to negotiate favorable financial terms, to manage a patient’s care, to collaborate with our payor partners, to coordinate with other health care providers, to accurately document patients’ health conditions for risk adjustment, and to find cost efficient, medically appropriate sites of service for our patients. Any failure to do so would limit our ability to improve the quality of patient care and health outcomes and to reduce medically unnecessary costs, which could lead to poorer performance under value and risk-based care programs.
The reserves that we establish in connection with the operation of our value and risk-based care programs are based upon assumptions and judgments concerning a number of factors, including trends in health care costs, expenses, patient hospitalization rates and other factors. To the extent the actual claims experience is less favorable than estimated based on our underlying assumptions, our incurred losses would increase, and future earnings could be adversely affected.
CMS relied on authority granted by the ACA to implement the CKCC model and seeks to deliver better health outcomes for ESRD patients while lowering CMS’ costs. Efforts to repeal or replace the ACA, while unsuccessful to date, continue. For further information, see “We operate in a highly regulated industry such that the potential for legislative reform provides uncertainty and potential threats to our operating models and results” and Item 4B, “Information on the Company — Business Overview — Regulatory and Legal Matters — Reimbursement — Executive order-based models.”
Our sales and earnings growth depends, in part, on our ability to develop and expand our core kidney care business, efficiently manage costs and execute our portfolio optimization plan to exit non-core and dilutive assets, as well as realize anticipated cost savings within our expected timeframe.
The health care industry experiences continuing consolidation, particularly among health care providers, as well as pressure on reimbursement and increasing costs, which requires us to identify both growth opportunities and efficiencies in the way we operate. Continuing consolidation in our industry could adversely affect our ability to find suitable acquisition targets and to increase future growth and product sales.
15
We also compete with other health care companies in seeking suitable acquisition targets and developing our core health care businesses. Our ability to make future acquisitions as well as develop our core kidney care business depends, in part, on the appropriate strategic target selection, the availability of financial resources and the current restrictions imposed by competition laws. The integration of acquired businesses may cause problems, e.g., by assuming unknown liabilities, underperformance subsequent to integration, associated requirements from competition authorities, or non-compliant business practices not disclosed by the seller or not uncovered during due diligence, any or all of which may result in our incurring unanticipated costs.
Our strategy includes the continuing transformation of our operating model into a significantly simplified structure of two global operating segments embodying a more centralized approach and reviewing our business portfolio, specifically with a view to exiting unsustainable markets and non-core businesses and the cessation of certain R&D programs to enable more focused capital allocation towards areas in our core business that are expected to have higher profitable growth. In addition, we are planning a limited launch to targeted Fresenius Kidney Care clinics in order to establish high-volume hemodiafiltration (HVHDF) as a new standard of care in the U.S. dialysis industry, beginning in 2025 with a broader commercial launch in 2026 and beyond. While we believe the FME25 Program and Legacy Portfolio Optimization (as defined in Item 4. “Information on the Company — A. History and development of the Company,” below) are providing us with a more efficient way of both managing and growing the business, the amounts of anticipated cost savings and anticipated expenses related thereto as well as the effectiveness of the planned HVHDF launch in the U.S. involve risks, uncertainties, assumptions and other factors that may cause the timing of actual results, performance or achievements to be materially different. Assumptions relating to the FME25 Program and the achievement of the aforementioned cost savings within the specified timeframe involve subjective decisions and judgments with respect to, among other things, the estimated impact of certain operational adjustments, labor management and labor relations (including our commitment to consult with works councils and other workplace representatives in good faith), and other cost and savings adjustments, as well as future economic, competitive, industry and market conditions and possible unanticipated effects from acquisitions, all of which are inherently uncertain and may not be completely within the control of our management. Although the Company’s management believes these estimates and assumptions related to the timing of these savings to be reasonable, there can be no assurance that the estimates described herein will prove to be accurate, result in anticipated operational efficiencies or be implemented according to our previously announced timing. We expect that our security holders, investors and other stakeholders will monitor both whether we achieve our anticipated FME25 Program cost savings at our anticipated implementation cost levels and whether we meet our announced timing in doing so. Failure to realize the expected cost savings from the FME25 Program within our announced timeframe described above could adversely impact the market for our securities and availability of financing, which, in addition, could limit our future growth, including growth in either our revenues or earnings within our health care services and products businesses. Any or all of these factors generally could have an adverse effect on our business, financial condition and results of operations. For further discussion on the impacts to our business in 2024 (see Item 5. “Operating and financial review and prospects — III. Results of operations, financial position and net assets”).
Our pharmaceutical product business could lose sales to generic drug manufacturers or new branded drugs.
Our branded pharmaceutical product business is subject to significant risk as a result of competition from manufacturers of generic drugs and other new competing medicines or therapies. The expiration or loss of patent protection for one of our products, the “at-risk” launch by a generic manufacturer of a generic version of one of our branded pharmaceutical products or the launch of new branded drugs that compete with one or more of our products could result in the loss of a major portion of sales of that branded pharmaceutical product in a very short time period, which could materially and adversely affect our business, financial condition and results of operations. See note 25 of the notes to the consolidated financial statements included in this report.
16
Our competitors could develop superior technology or otherwise take advantage of new competitive developments that impact our sales.
We face numerous competitors in both our health care services business and our dialysis products business, some of whom may possess substantial financial, marketing or R&D resources. Competition from new and existing competitors, and especially new competitive developments such as pharmaceuticals that reduce the progression of chronic kidney disease, and innovations in technology and care delivery models could materially adversely affect the future pricing and sale of our products and services. In 2023, a study on glucagon-like peptide 1 (GLP-1) receptor agonists, regarding its effectiveness in treating CKD experienced by diabetic patients was terminated early as a result of the study having met certain prespecified clinical endpoints. GLP-1 receptor agonist utilization together with sodium-glucose cotransporter 2 (SGLT2) inhibitors in the CKD population suggest a slight increase in the total CKD population and a slight reduction in the ESRD population growth rate that remain materially consistent with the patient population forecasts which do not include the utilization of these drugs. While the positive cardiovascular effects of the drugs, reducing mortality, as well as the progression-delaying effect of the drugs on the CKD population indicate a balanced effect of these drugs on our patient population, we cannot ensure that further developments or changes in population will not lead to a material adverse effect on our business and results of operations. Additional information regarding the impact of certain pharmaceuticals that reduce the progression of chronic kidney disease and our analysis of their impact on our cash flow projections and goodwill sensitivity assessments can be found in note 2 a) of the notes to the consolidated financial statements included in this report). In particular, technological innovation has historically been a significant competitive factor in the dialysis products business. The introduction of new products or services by competitors could qualify them for certain additional payments for new and innovative equipment or render one or more of our products or services less competitive or even obsolete, which could also affect, among other items, our sales and distribution of pharmaceuticals for which, to some extent, we are obligated to make certain minimum annual royalty payments.
Global economic conditions as well as disruptions in financial markets could have an adverse effect on our businesses.
We are dependent on the conditions of the financial markets and the global economy. In order to pursue our business, we are reliant on capital markets, as are our renal product customers and commercial health care insurers. Limited or more expensive access to capital in the financial markets could adversely affect our business and profitability. Among other things, the potential decline in federal and state revenues in a prolonged economic slowdown or recession could create additional pressures to contain or reduce reimbursements for our services from public payors around the world, including Medicare and Medicaid in the U.S. and other government sponsored programs in the U.S. and other countries around the world. Devaluation of currencies such as the impact from hyperinflationary economies as well as fluctuations in currencies as a result of geopolitical conflicts, unfavorable interest rate changes and worsening economic conditions, uncertainty arising from geopolitical conflicts regarding a possible deterioration of the global macroeconomic outlook, including inflationary cost increases in various markets in connection with deteriorating country credit ratings increase the risk of a goodwill impairment, which could lead to a partial or total goodwill write-off in the affected cash generating units, or have a negative impact on our investments and external partnerships. In addition, uncertainty as well as volatility in global financial markets, including the banking sector, and inflation could adversely affect the valuations of certain of our investments, interest rate-sensitive assets or liabilities or variable interest rates payable under our credit facilities or could make it more difficult to obtain or renew such facilities or to obtain other forms of financing in the future should access to these capital markets become restricted. Inflationary cost increases have also had and may continue to have an unfavorable effect on our business, especially if the prices and reimbursement rates for our products and services remain unchanged or do not adequately track against cost increases.
We have seen challenges in the labor market, in particular in the U.S., resulting in staff shortages, high turnover rates and meaningfully higher costs, which have and could continue to impact our growth, specifically in U.S. health care services where labor constraints affected our ability to increase treatment volumes. These impacts, combined with uncertainty in the macroeconomic environment, driving inflationary cost increases and supply chain constraints, have had a materially adverse effect on our results of operations. The current uncertainty in the macroeconomic environment has also intensified the risk that price increases and restricted access related to energy commodities, including the costs of oil, gas and electricity, may occur. Our implemented countermeasures may not offset a significant increase in prices which could result in an adverse effect on our results of operations going forward.
Job losses or increases in unemployment rates could result in a smaller percentage of our patients being covered by employer group health plans and a larger percentage being covered by lower paying government reimbursement programs. To the extent that our commercial payors are negatively impacted by a decline in the economy, we may experience further pressure on commercial rates, a further slowdown in collections and a reduction in the amounts we are able to collect. Any or all of these factors, or other consequences of the continuation, or worsening, of domestic and global economic conditions which cannot currently be predicted, could continue to have a material adverse effect on our businesses and results of operations.
17
We could be adversely affected if we experience shortages of goods or material price increases from our suppliers, or an inability to access new and improved products and technology.
Our business is dependent on the reliable supply of several raw materials and finished components for production and service purposes. If we are unable to obtain sufficient quantities of these materials at times of limited availability of such materials, this could result in delays in production or loss of sales and hence have an adverse effect on our results of operations. Similarly, price increases by suppliers (including from the impact of inflation) and the inability to access new products or technology could also adversely affect our results of operations. In particular, the lingering macroeconomic inflationary environment, together with geopolitical conflicts, have resulted in and could continue to lead to, among other consequences, material increases in costs for energy, supplies and transportation. Disruptions in supply, coupled with labor shortages, absenteeism and turnover as well as labor cost increases have resulted and could continue to result in a negative impact on our business. All of these factors introduce additional risk to our operations and exposure to legal liability in the delivery of our goods and services.
Our procurement risk mitigation efforts include (i) the development of partnerships with strategic suppliers through framework contracts, (ii) where reasonably practicable, at least two sources for all supply and price-critical primary products ( dual sourcing, multiple sourcing ), and (iii) measures to prevent loss of suppliers, such as risk analyses as well as continuous supply chain monitoring. Any failure of these measures to mitigate disruptive goods shortages and potential price increases or to allow access to favorable new product and technology developments could have an adverse impact on our business and financial condition. In some cases, for reasons of quality assurance, cost effectiveness, or availability, certain components or raw materials needed to manufacture our products are obtained from a sole supplier. A failure of any of our single-source suppliers to fulfil their contractual obligations in a timely manner or as a result of regulatory noncompliance or physical disruption at a manufacturing site could adversely affect our ability to manufacture and distribute our products in a timely or cost-effective manner, and our ability to make product sales. Due to the stringent regulations and requirements of regulatory agencies, including the U.S. FDA, regarding the manufacture of our products, we may not be able to quickly establish additional or replacement sources.
Any material disruption in government operations and funding could have a material adverse impact on our business, financial condition and results of operations.
A substantial portion of our revenues depends on government health care program reimbursement, and any disruptions in government operations could have a material adverse impact on our business, financial condition and results of operations. If the governments with which we do business default on their debts, there could be broad macroeconomic effects that could raise our cost of borrowing funds, and delay or prevent our future growth and expansion. Any future government shutdown, government default on debt, decline in government revenues during a prolonged economic slowdown and/or failure of governments to enact annual appropriations could have a material adverse impact on our business, financial condition and results of operations. Additionally, material disruptions in government operations may negatively impact regulatory approvals and guidance that are important to our operations and create uncertainty about the pace of upcoming health care regulatory developments.
If we are unable to attract and retain skilled medical, technical, engineering or key strategic personnel, or if legislative, union, other labor-related activities or changes or employee absenteeism and turnover result in significant increases in our operating costs or decreases in productivity, we may be unable to manage our growth, continue our technological development or execute our strategy.
Our continued growth in the health care business will depend upon our ability to attract and retain a skilled workforce, including highly skilled nurses, technicians and other medical personnel. Our health care products business depends on the development of new products, technologies and treatment concepts to be competitive, and for that we need to attract the best and most talented people, especially in R&D. Competition for those employees is intense and shortages for these sought-after employees, such as nurses, or skilled engineers and R&D personnel, as well as increased reliance on contracted nurses and other personnel, have increased our personnel and recruiting costs and may continue to do so, and/or could impair our reputation for production of technologically advanced products. In recent years, we experienced and may continue to experience, greater employee absenteeism and turnover and longer recruiting cycles which negatively impact our ability to produce and deliver the goods and services that we provide to our customers and our patients, as well as increased personnel costs. Moreover, we believe that future success in the provider business will be significantly dependent on our ability to attract and retain qualified physicians to serve as employees of or consultants to our health care services businesses.
Additionally, in recruiting, employing and retaining personnel, we may be exposed to increasing risks relating to various labor and staffing laws, legislative, union, or other labor-related activities or changes. These factors could also impact the integration of acquired companies into our operations, which could increase our costs, decrease our productivity and prevent us from realizing synergies from acquisitions. If we are unable to manage the risks above, then our growth and results of operations could be adversely impacted.
18
If we are unable to meet applicable legal requirements and/or market expectations with respect to sustainability, both our business and our reputation could suffer. We could be subject to fines and other financial burdens associated with global environmental, social and governance regulations, laws and activities, and we could alienate our patients, employees, customers, partners, investors and the communities we serve. Furthermore, if we do not meet investors’ or certain markets’ ESG standards, the market for our securities could be adversely impacted.
Companies’ ESG activities are facing increased scrutiny from stakeholders such as institutional and other investors, regulatory bodies and non-governmental organizations (NGOs). Failure to effectively identify, carry out and manage the necessary sustainability and related reporting activities as required or expected, as well as effectually manage the impact of factors beyond our control, could cause us to incur additional costs or damage our brand. We could also be subject to financial and other penalties imposed by the respective authorities in the jurisdictions in which we do business. For example, a rise in prices of carbon emission rights stemming from the requirements of European Climate Law could increase our production costs. Such cost increases could have an adverse effect on our operations and results if we do not accurately plan for, and effectively implement, necessary sustainable business practices. Additionally, we entered into several vPPAs with wind and solar energy project developers in Germany and in the U.S. in order to receive guarantees of origin and renewable energy certificates, respectively, to address our sustainability objectives. However, volatility in the valuation of financial instruments connected to energy prices or energy production volumes, including as a result of the heightened risk of volatility due to geopolitical conflicts in certain regions, could result in a material adverse effect on our business or results of operations.
In addition to environmental risks, we also face several social risks. High staff turnover is a risk, not only due to the expense associated with hiring and training new staff, but also because it could affect our ability to serve our patients. For further information on personnel risks, see the risk factor “If we are unable to attract and retain skilled medical, technical, engineering or key strategic personnel, or if legislative, union, other labor-related activities or changes or employee absenteeism and turnover result in significant increases in our operating costs or decreases in productivity, we may be unable to manage our growth, continue our technological development or execute our strategy.” above. Furthermore, companies are increasingly expecting their suppliers to share their commitment to sustainability and demonstrate sustainable business practices across their supply chains, including the ability to identify and mitigate risks related to human rights in their entire value chain in connection with the requirements of the German Supply Chain Due Diligence Act ( Lieferkettensorgfaltspflichtengesetz ) and other regulations, especially those passed or proposed within the EU. If we fail to comply with our legal obligations related to supply chain due diligence, we could face significant fines and be excluded from public tenders and contracts. We could also suffer reputational damage, especially given that our performance in this area is closely monitored by NGOs, investors and others.
In light of these expectations, among other aspects, we have incorporated sustainability as a performance target for the compensation of our Management Board. Should management fail to meet these outcomes, investors and/or debt providers may not deem us the correct fit for their investment or financing purposes, thereby negatively impacting our share price or our ability to source funding through debt financing. Our €2 billion syndicated multicurrency sustainability-linked revolving credit facility agreement (Syndicated Credit Facility), which serves as a backup facility, includes a sustainability component, pursuant to which the credit facility’s margin for any outstanding borrowings will rise or fall depending on our sustainability performance.
A heightened focus by certain regulators and other stakeholders on ESG topics may result in more extensive regulatory requirements aimed at mitigating the effects of climate change and other current and future ESG-related developments as well as possible challenges in complying with differing ESG standards and possible increased opposition to initiatives we undertake to meet our ESG goals. Should further regulation (such as climate disclosure requirements for entities with operations in California, U.S.) or stakeholder expectations be more stringent in the future, we may experience increased compliance burdens and costs to meet regulatory obligations and we cannot currently estimate what impact existing and future regulations will have on our business, financial condition and results of operations.
We are subject to risks associated with unpredictable events, such as public health crises and epidemics/pandemics or other significant events beyond our control.
We operate dialysis facilities or manufacturing facilities in many regions of the world, with diverse geographic, societal, political and economic conditions and we are subject to unpredictable events beyond our control such as natural disasters, terrorist attacks, social unrest or public health crises such as epidemics or pandemics from, for example, virus infections. Given the already compromised health condition of our typical dialysis patients, our patients represent a heightened at-risk population, particularly, but not limited to, during an epidemic or a pandemic which could lead to decreased treatments and increases in mortality rates in our patient population, resulting in an adverse impact on our operations. The COVID-19 global pandemic resulted in higher costs incurred to address staffing shortages, implement preventive measures to protect patients, employees and others, as well as a material deterioration of supply chains and the conditions of the global economy and financial markets. Any such unforeseeable events could have a material adverse effect on our business, financial condition and results of operations.
19
We need to develop new internal functions to perform certain business services that Fresenius SE provided to us prior to the Conversion.
Prior to the Conversion, as part of the Fresenius SE Group, we received certain essential capabilities that we did not then and currently do not independently have (either in full or in part). As a result of the Conversion, certain functions and services previously provided by FSE are to be established and/or provided internally. As part of the Conversion process, we entered into a series of transitional services agreements with Fresenius SE for various durations at a cost that we consider to be comparable to the costs we incurred for such services prior to the Conversion. While we have made progress in establishing internal capabilities for some of these functions, we cannot guarantee that we will be able to establish these functions after the transitional services period without experiencing material adverse effects on our business, financial condition and results of operations.
Risks relating to taxation and accounting
There are significant risks associated with estimating the amount of health care service revenues that we recognize that could impact the timing of our recognition of revenues or have a significant impact on our operating results and financial condition.
There are significant risks associated with estimating the amount of revenues from health care services that we recognize in a reporting period.
| ● | The billing and collection process is complicated due to a number of factors including insurance coverage changes, geographic coverage differences, differing interpretations of plan benefits and managed care contracts, and uncertainty about reimbursement from payors with whom we are not contracted. |
| ● | Laws and regulations governing Medicare, Medicaid and other federal programs are extremely complex, changing and subject to interpretation. |
| ● | Determining applicable primary and secondary insurance coverage for an extensive number of patients at any point in time, together with the changes in patient coverage that occur each month or changes in plan benefits, requires complex, resource-intensive processes. Errors in determining the correct coordination of benefits may result in refunds to payors. |
| ● | The complexity of estimating revenues from a primary payor also brings complexity to estimating revenues from secondary payors and patients. |
| ● | Collections, refunds and payor retractions may continue to occur for up to three years or longer after services are provided. |
If our estimates of revenues are materially inaccurate, it could impact the timing and amount of our recognition of revenues and have a significant impact on our operating results and financial condition. For further information regarding our revenue recognition policies, see note 1 k) of the notes to the consolidated financial statements included in this report.
20
Diverging views of fiscal authorities or changes in tax legislation could require us to make additional tax payments.
We are subject to potential changes in tax legislation as well as to ongoing tax audits in Germany, the U.S. and other jurisdictions. We have received notices of unfavorable adjustments and disallowances in connection with certain of these audits. Additionally, tax legislation in countries in which we operate is subject to constant change and development. For example, legislation seeking to impose additional income taxes against discriminatory or territorial tax of foreign jurisdictions could have negative effects on the amount of income tax expense which are currently unpredictable. If we are unsuccessful in contesting the above-mentioned notices or other unfavorable determinations or if tax legislation changes unfavorably in countries in which we operate, we could be required to make additional tax payments, which could have a material adverse impact on our business, financial condition and results of operations. See Item 5, “Operating and financial review and prospects — IV. Financial position.” For further information on the German tax authorities’ objections to our previously filed tax returns, see note 25 of the notes to the consolidated financial statements included in this report.
A dependency on the payment behavior and decision-making of our business partners can affect the collectability of accounts receivable.
Our health care product business and our dialysis services business differ across the regions in which we operate. In many cases, our products and services are paid for, either directly or indirectly, by government institutions. We believe the risk of default from a government payor is generally low to moderate worldwide which could, however, prove to be wrong, particularly in the event of a budget approval impasse or government shutdown which could result in significant payment delays even if it does not create a default. On a country level, the payor base is characterized by distinct customer or payor groups which can range in volume from a few customers to a considerable amount of customer types which have varying levels of risk associated with default or non-payment of receivables as well as risks for dependencies based upon the competition within low volume customer base environments. In certain cases, a resulting dependency on the payment behavior and decision-making of our business partners (for example, a decision to discontinue tender contracts) can affect the collectability of accounts receivable and can adversely affect our business, results of operations and financial condition. Our measures aiming to mitigate these risks by actively negotiating long-term contracts with major customers, targeted marketing activities, developing new product and pricing models as well as improving the quality of our services and products, could be insufficient or ineffective.
Risks relating to our financial condition and our securities
Our indebtedness may prevent us from fulfilling our debt-service obligations or implementing certain elements of our business strategy.
At December 31, 2024, we had consolidated debt (including lease liabilities as well as debt and lease liabilities included within liabilities directly associated with assets held for sale) of €10,988 M and consolidated total shareholders’ equity of €15,769 M. Our debt could jeopardize the successful execution of our business strategy, increase our vulnerability to general adverse economic conditions, limit our ability to obtain necessary financing to fund future working capital needs, capital expenditures, payment of dividends and other general corporate requirements, require us to dedicate a substantial portion of our cash flow from operations, as well as the proceeds of certain financings and asset dispositions, to payments on our indebtedness, thereby reducing the availability of our cash flow and such proceeds to fund other purposes, limit our flexibility in reacting to changes in our business and the industry in which we operate, place us at a competitive disadvantage compared to our competitors that have less debt, limit our ability to pursue possible future acquisitions and sell assets, make it more difficult for us to satisfy our obligations under our debt securities, and limit our ability to borrow additional funds. Additionally, a deterioration of our current rating could lead to a reintroduction of financial covenants, could limit our financial flexibility, increase our financing costs or limit access to funding.
21
Our leverage makes us vulnerable to a downturn in the operating performance of our business, larger than normal fluctuations or volatility in our cash flow, or a downturn in economic conditions. Our ability to make payments on and to refinance our indebtedness will depend on our ability to generate cash in the future, which is dependent on various factors. These factors include governmental and private insurer reimbursement rates for medical treatment and general economic, financial, competitive, legislative, regulatory, and other factors that are beyond our control. If our cash flow is not sufficient to meet our debt service and principal payment requirements, we could be required to refinance our obligations or to dispose of assets in order to meet such requirements. In addition, from time to time we need to refinance our existing debt as and when it matures. In either case, there is no guarantee that we will be able to refinance our existing indebtedness on terms comparable to those governing our existing indebtedness. If our cash flow is not sufficient to meet our debt service and principal payment requirements, or if we are unable to refinance our existing indebtedness on acceptable terms, it could have a material adverse effect on our business, financial condition, or results of operations. For information about our outstanding indebtedness, see note 16 and note 17 of the notes to our consolidated financial statements included in this report.
Our Syndicated Credit Facility and certain of our other financing instruments include covenants which, among other things, restrict or could have the effect of restricting our ability to dispose of assets and create liens, and restrict the indebtedness of our subsidiaries. These covenants may otherwise limit our activities as well. The breach of any of the covenants could result in a default and acceleration of the indebtedness under the respective financing agreements, which could, in turn, create additional defaults and acceleration of the indebtedness under the agreements relating to our other long-term indebtedness which would have an adverse effect on our business, financial condition and results of operations.
FME AG is not subject to any covenant that limits its ability to incur unsecured debt, regardless of our credit rating. If additional debt is added to our current debt levels, the related risks that we now face from our indebtedness could intensify.
Although Fresenius SE no longer controls our Company through ownership of 100% of Management AG, its significant share of ownership, certain provisions of our Articles of Association and certain provisions of our trademark license from Fresenius SE enable Fresenius SE to retain significant influence over the management of the Company.
Fresenius SE owns 32.2% of our outstanding shares as of February 13, 2025. Under our Articles of Association, Fresenius SE has the right to appoint two of the six shareholder representatives to our Supervisory Board for as long as it holds 30% or more of the Company’s share capital and the right to appoint one of the six shareholder representatives to the Supervisory Board for as long as it holds at least 15% (but less than 30%) of the Company’s share capital, and to dismiss those shareholder representatives. The Chair of our Supervisory Board is one of the Fresenius SE representatives. In the case of a tie in the Supervisory Board, the Chair has two votes in a new vote on the same matter if this also results in a tie. Under German law and our Articles of Association, certain matters requiring a resolution at our general meeting of shareholders require a qualified majority of 75% of the share capital represented at the time of the vote, including capital increases and decreases, the creation of authorized and conditional capital, the issuance of convertible bonds, corporate measures such as mergers or spin-offs, the conclusion of intercompany agreements ( Unternehmensverträge ) such as domination and/or profit and loss transfer agreements ( Beherrschungs- und/oder Gewinnabführungsverträge ), amendments to the Articles of Association, dissolution of the Company, mergers, a change in the legal form of the stock corporation and other fundamental changes. By virtue of its ownership of approximately 32.2% of our share capital, Fresenius SE therefore has a de facto veto right over any such resolution or resolutions if and when proposed for adoption by our shareholders. In addition, the Conversion and deconsolidation of the Company from the Fresenius SE Group resulted in the termination of certain voting restrictions on Fresenius SE’s shares in the Company, including a restriction on voting in the election of members of the Company’s Supervisory Board and members of Fresenius SE’s management board are now eligible to seek election to and serve on the Company’s Supervisory Board. The present Fresenius SE designees on our Supervisory Board are the Chief Executive Officer and Chief Financial Officer, respectively, of Fresenius SE. As a result of its share ownership, its de facto veto right over shareholder votes requiring a qualified majority and its representation on our Supervisory Board (including the Chair), Fresenius SE will continue to have the ability to exercise significant influence over the management of our Company in its form as an AG, and the interests and rights of Fresenius SE could deviate from the interests of the Company and its public shareholders.
22
We use “Fresenius” in our name and trademarks under a royalty-free license from Fresenius SE. Under amendments to that license entered into in connection with the Conversion, Fresenius SE has the right to terminate the license if, among other causes, a direct competitor of Fresenius SE acquires control of the Company or any other third party acquires control of the Company and Fresenius SE, acting reasonably, expects such acquisition to result in a not insignificant risk of negative impact on the Fresenius brand. In both cases, “control” is defined as acquisition of 30% or more of our shares. Such termination is with immediate effect, but we may continue using the “Fresenius” name for 18 months to facilitate rebranding efforts. These termination rights could serve to discourage third parties from attempting to acquire control of the Company, because any such change of control could risk the Company losing the right to use its corporate name, logo and related trademarks. Such impediments to a change of control could adversely affect the price of our shares.
Because we are not organized under U.S. law, we are subject to certain less detailed disclosure requirements under U.S. federal securities laws, and we are exempt from most of the governance rules of the New York Stock Exchange. The pooling agreement that required us to file quarterly reports and certain information with the SEC and maintain our ADS facility and a U.S. listing for ADSs representing our shares terminated upon effectiveness of the Conversion.
We are a “foreign private issuer,” as defined in the SEC’s regulations, and consequently we are not subject to all of the same disclosure requirements applicable to U.S. domestic companies. We file annual reports on Form 20-F instead of Form 10-K, and we are not required to file quarterly reports of Form 10-Q or current reports on Form 8-K. Instead, as a foreign private issuer, we are only required to furnish to the SEC, under cover of a Form 6-K, certain material information that we (i) make public pursuant to German law, (ii) file with a stock exchange on which our securities are traded and which is made public by that exchange, or (iii) distribute to our security holders. As a foreign private issuer, we are also exempt from the SEC’s proxy rules, our annual reports contain less detailed disclosure regarding certain matters than reports of domestic issuers and our officers, directors and 10% beneficial owners are exempt from the reporting requirements and short-swing profit recovery provisions of Section 16 of the Exchange Act. We are also generally exempt from most of the governance rules applicable to NYSE-listed companies. See Item 16G, “Corporate governance.” Prior to the Conversion, we were party to a pooling agreement under which we agreed to file with the SEC quarterly reports containing consolidated financial statements and to file information with the SEC with respect to annual and general meetings of our shareholders. In those reports, our Chief Executive Officer and Chief Financial Officer issued the certifications required by §302 and §906 of the Sarbanes-Oxley Act of 2002 (S-OX) on both a quarterly basis and an annual basis, rather than solely on an annual basis as is the practice of most foreign private issuers. The pooling agreement also required that we maintain the effectiveness of our deposit agreement covering our shares and ensure that the ADSs representing our shares are listed on either the New York Stock Exchange (NYSE) or the Nasdaq Stock Market.
The pooling agreement terminated in accordance with its terms upon effectiveness of the Conversion. While we currently expect to follow the reporting and certain other requirements of the pooling agreement (i.e., maintaining the deposit agreement and ADS program, continuing to maintain the NYSE listing of the ADSs and continuing to provide quarterly financial reports) as if the pooling agreement remained in effect, we cannot assure you that we will continue to do so. Any termination of the ADS facility could cause ADS holders to incur costs and inconvenience to maintain ownership of our shares. Any delisting from the NYSE (and/or a termination of SEC reporting) could adversely affect the liquidity of our shares and decrease information available regarding the Company, either of which could adversely affect our share price.
|
Item 4. |
Information on the Company |
| A. | History and development of the Company |
General
Fresenius Medical Care AG is a stock corporation ( Aktiengesellschaft or AG ) organized under the laws of Germany, formerly known as Fresenius Medical Care AG & Co. KGaA, a partnership limited by shares ( Kommanditgesellschaft auf Aktien or KGaA ).
The Company was originally incorporated on August 5, 1996 as a stock corporation and was transformed into a partnership limited by shares upon registration on February 10, 2006. Due to the Conversion, the Company is again a stock corporation having the legal name Fresenius Medical Care AG. FME AG is registered with the commercial register of the local court ( Amtsgericht ) of Hof (Saale), Germany, under the registration number HRB 6841. Our registered office ( Sitz ) is Hof (Saale), Germany. Our registered business address, and our principal office, is Else-Kröner-Strasse 1, 61352 Bad Homburg, Germany, telephone +49-6172-609-0.
23
History
On September 30, 1996, we completed a series of transactions to consummate an Agreement and Plan of Reorganization entered into on February 4, 1996 by Fresenius SE (then Fresenius AG) and W.R. Grace & Co. which we refer to as the “Merger” elsewhere in this report. Pursuant to that agreement, Fresenius SE contributed Fresenius Worldwide Dialysis, its global dialysis business, including its controlling interest in Fresenius USA, Inc., in exchange for 105,630,000 FME AG ordinary shares. Thereafter, subsidiaries of Fresenius SE merged with and into:
| ● | W.R. Grace & Co., whose sole business at the time of the transaction consisted of National Medical Care, Inc., its global health care business; and into |
| ● | Fresenius USA, Inc., |
pursuant to which W.R. Grace & Co. and Fresenius USA, Inc. became wholly owned subsidiaries of the Company and the shareholders of W.R. Grace & Co. and the shareholders of Fresenius USA, Inc. (other than Fresenius SE) exchanged their shares for 94,080,000 FME AG ordinary shares, and 10,290,000 FME AG ordinary shares, respectively.
On February 10, 2006, the Company completed the transformation of its legal form under German law from a German AG to a KGaA with the name Fresenius Medical Care AG & Co. KGaA, as approved by its shareholders during the EGM held on August 30, 2005. The Company as a KGaA was the same legal entity under German law, rather than a successor to the stock corporation.
As noted in “Certain defined terms” above, on November 30, 2023, the Company’s legal form was changed from a KGaA to an AG with Management AG exiting the Company and Fresenius SE ceasing control of the Company (as defined in IFRS 10).
Information regarding authorizations granted by our Annual General Meeting (AGM) to conduct share buy-back programs and reconciliations of any treasury share purchases, repurchases and retirements under such programs can be found in note 20 of the notes to the consolidated financial statements included in this report. The most recent authorization granted in May 2021 was confirmed at our 2023 EGM. We have not purchased any shares pursuant to the May 2021 authorization and we do not currently hold any treasury shares.
On August 24, 2022, we completed a business combination including Fresenius Health Partners, Inc. (FHP), the value-based care division of Fresenius Medical Care North America. The transaction, first announced in March 2022, received regulatory clearance and satisfied other customary closing conditions in the U.S. The new company, which operates under the Interwell Health brand (Interwell Health), creates an innovative, stand-alone entity combining FHP’s expertise in kidney care value-based contracting and performance, InterWell Health LLC’s clinical care models and network of around 1,700 nephrologists and Cricket Health, Inc.’s (Cricket) tech-enabled care model that utilizes its proprietary informatics, StageSmart™ and patient engagement platforms. We aim to significantly improve the care of patients with chronic kidney disease and further expand our leading position in value-based care. For further information, see Item 5, “Operating and financial review and prospects — I. Performance management system — Net leverage ratio (Non-IFRS ® Measure),” below and note 3 of the notes to the consolidated financial statements included in this report.
In December 2023, we completed the divestiture of National Cardiovascular Partners (NCP), comprising 21 facilities providing outpatient cardiac catheterization and vascular laboratory services, which were previously included in the Care Delivery segment of our U.S. health care service business. The NCP divestiture was effected as part of our review of our business portfolio, mainly due to exiting unsustainable markets and divesting non-core businesses, as well as the cessation of certain R&D programs to enable more focused capital allocation towards areas in our core business that are expected to have higher profitable growth (Legacy Portfolio Optimization). Additionally during 2024, we divested our service businesses in Chile, Ecuador, Sub-Saharan Africa, Türkiye, Guatemala, Curacao, Peru, Colombia and the Cura Day Hospitals Group in Australia, and the Company’s management committed to a plan to sell our renal dialysis clinic facilities and/or networks in Brazil, our business in Kazakhstan and select assets of the Company’s wholly owned Spectra Laboratories, all in connection with the Legacy Portfolio Optimization plan. Further information regarding our divestitures as well as assets classified as held for sale, see notes 3 and 4 of the notes to the consolidated financial statements included in this report.
24
For further information regarding important events in the development in our business, such as material mergers by us or our significant subsidiaries, acquisitions and dispositions of material assets outside the ordinary course of our business, material changes in the way we conduct our business, material changes in the products we produce and the services we provide, see Item 4, “Information on the Company,” in this Annual Report on Form 20-F for the year ended December 31, 2024 and our reports for prior years, filed with the SEC and also available on our website www.freseniusmedicalcare.com. In furnishing our website address in this report, however, we do not intend to incorporate any information on our website into this report, and any information on our website should not be considered to be part of this report, except as expressly set forth herein.
For information regarding our principal capital expenditures and divestitures since the beginning of our last financial year, and information concerning our principal capital expenditures and divestitures currently in progress, see Item 4, “Information on the Company — B. Business overview — Capital expenditures” and “— Acquisitions and investments” as well as Item 5, “Operating and financial review and prospects — III. Financial position — Net cash provided by (used in) investing activities.”
The SEC website contains reports, proxy and information statements and other information regarding registrants that file electronically with the SEC. The SEC’s website is www.sec.gov. For additional information regarding the availability of periodic reports and other information concerning us, see Item 10.H, “Documents on Display.”
|
B. |
Business overview |
Our business
As a vertically integrated medical technology (MedTech) and health care company, we combine medical device engineering and manufacturing expertise with comprehensive patient care.
The incidence of kidney disease is increasing worldwide. A significant rise in kidney disease drivers, such as obesity, diabetes and hypertension, has elevated kidney disease to a global public health epidemic. According to estimates, the number of people requiring dialysis globally is increasing at a rate of 4% to 5% each year and is expected to reach around 7 M people by 2035.
We are structured to meet the growing demand for the life-sustaining services and products that are vital to millions of people living with kidney disease worldwide. Kidney patients are individuals with different needs and preferences who require the right therapy, pharmaceuticals, medical technologies and products no matter where they receive treatment, be that in a clinic, hospital, at home or when traveling.
In our two operating segments, Care Delivery and Care Enablement, we provide the full spectrum of healthcare services, systems, devices, technologies, products and pharmaceuticals required to deliver high-quality care to people living with kidney disease around the globe.
Through our vertical integration, scope and scale, we manufacture and distribute kidney-care related medical devices, systems, pharmaceuticals and products to customers across around 150 countries (2023: around 150 countries) and operate 3,675 (2023: 3,925) dialysis centers throughout around 40 countries worldwide (2023: around 50), serving 299,352 dialysis patients (2023: 332,548). We manage the world’s largest network of dialysis centers in terms of the number of people treated and operate 39 production sites in 19 countries (2023: 40 production sites in 20 countries).
25
Our products and services
Our products and services for 2024 are shown in the following chart:
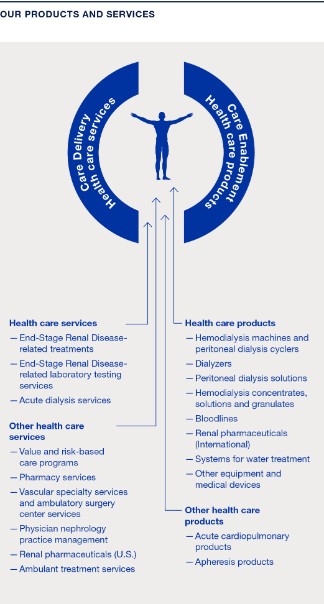
For information regarding the divestiture of business providing certain of these services during 2024, see notes 3 and 4 of the notes to the consolidated financial statements included in this report.
In 2024, approximately 4.2 M (2023: 4.1 M) patients worldwide regularly underwent dialysis treatment. Dialysis is a life-saving blood cleansing procedure that substitutes the function of the kidney in case of kidney failure. Healthy kidneys clean the blood of waste products, regulate water levels and produce important hormones. Chronic kidney failure or end-stage renal disease occurs when the kidneys are irreparably damaged and are no longer able to function adequately over a sustained period of time. Many diseases can lead to chronic kidney failure, particularly diabetes, chronic nephritis or high blood pressure. There are currently two treatment options for ESRD: kidney transplant and dialysis.
For a summary of our revenues attributable to our major categories of activity, split by operating and reportable segments as well as by regions, for the three years ended December 31, 2024, 2023 and 2022, see notes 5 a) and 29 of the notes to the consolidated financial statements included in this report.
26
We receive a substantial portion of our Care Delivery revenue from the U.S. Medicare program and other government sources. The following table provides information for the years ended December 31, 2024, 2023 and 2022 regarding the percentage of our U.S. patient service revenue included in our health care service revenue from: (a) the Medicare program, (b) private/alternative payors, such as commercial insurance, Medicare Advantage and private funds, (c) Medicaid and other government sources and (d) hospitals.
|
U.S. patient service revenue |
|
|
|
|
|
|
|
in % of U.S. patient service revenue |
|
|
|
|
|
|
|
|
|
Year ended December 31, |
||||
|
|
|
2024 |
|
2023 |
|
2022 |
|
Medicare program (1) |
|
22.1 |
|
24.5 |
|
31.5 |
|
Private / alternative payors (1) |
|
69.2 |
|
67.2 |
|
58.1 |
|
Medicaid and other government sources |
|
4.5 |
|
4.0 |
|
5.3 |
|
Hospitals |
|
4.2 |
|
4.3 |
|
5.1 |
|
Total |
|
100.0 |
|
100.0 |
|
100.0 |
| (1) | Revenue from Medicare Advantage plans associated with value and risk-based care programs previously included within the line “Medicare program” was reallocated to the line item “Private / alternative payors,” resulting in a decrease of revenue from Medicare of 10.0 percentage points and 4.6 percentage points and a corresponding increase in revenue from private payors of 10.0 percentage points and 4.6 percentage points for the years ended December 31, 2023 and 2022, respectively. |
Under the Medicare program, Medicare reimburses dialysis providers for the treatment of certain individuals who are diagnosed as having ESRD, regardless of age or financial circumstances. See “Regulatory and legal matters — Reimbursement.”
Dialysis treatment options for ESRD
Chronic kidney disease is a global epidemic. The number of patients requiring renal replacement therapy is increasing worldwide. At the end of 2024, about 5.2 M patients (2023: 5.0 M) underwent dialysis treatment or received a donor organ.
Due to the scarcity of compatible kidneys for transplant, most patients suffering from ESRD rely on dialysis, as demonstrated in the following table:
|
Patients with end-stage renal disease |
|
|
|
|
|
|
|
|
|
in M (rounded) |
|
December 31, |
|
|
|
December 31, |
|
|
|
|
|
2024 |
|
Share in % |
|
2023 |
|
Share in % |
|
Patients with end-stage renal disease |
|
5.2 |
|
100 |
|
5.0 |
|
100 |
|
of which patients with transplants |
|
1.0 |
|
19 |
|
1.0 |
|
19 |
|
Of which dialysis patients |
|
4.2 |
|
81 |
|
4.1 |
|
81 |
|
In-center hemodialysis |
|
3.7 |
|
72 |
|
3.6 |
|
72 |
|
Peritoneal dialysis |
|
0.4 |
|
8 |
|
0.4 |
|
8 |
|
Home hemodialysis |
|
<0.1 |
|
1 |
|
<0.1 |
|
1 |
A successful kidney transplant is considered the most effective treatment for ESRD, offering those patients a chance for a longer, healthier life. However, the number of organs donated worldwide has been significantly lower than the number of patients on transplant waiting lists for many years. Despite extensive efforts, particularly in regional initiatives, to raise awareness of kidney donation and promote willingness to donate, the global proportion of patients receiving a kidney transplant compared to other treatment methods has remained relatively unchanged and comparatively low over the last ten years. (See “— Regulatory and legal matters — Reimbursement — Executive order-based models” for a discussion of recent proposed changes to the U.S. organ donation system.)
The prevalence of CKD varies between regions. There are several reasons for this variance:
| ● | Countries differ demographically. |
| ● | Risk factors for kidney disease, such as obesity, diabetes and hypertension, vary widely. |
| ● | The genetic predisposition for kidney disease differs significantly around the world. |
| ● | Access to dialysis remains restricted in many countries, meaning that many patients suffering from CKD are not treated and therefore do not appear in available statistics. |
27
| ● | Cultural factors, such as nutrition, play a role. |
The number of dialysis patients rose worldwide by around 4% to 5% in 2024 (2023: 4%). For information regarding new drug classes such as GLP-1 receptor agonists or SGLT2 inhibitors and their impact on patient populations, see note 2 a) of the notes to the consolidated financial statements included in this report.
Comparison of dialysis treatment methods
In 2024, most dialysis patients were treated in one of around 51,000 dialysis centers worldwide (2023: 50,000), with an average of approximately 80 patients per center (2023: 80). However, this figure varies considerably from country to country.
Hemodialysis (HD) is by far the most common form of therapy for ESRD. Worldwide, a total of 89% of dialysis patients were treated with this therapy at dialysis centers in 2024 (2023: 89%). Home hemodialysis (HHD) is an alternative to treatment at a dialysis center. Worldwide, a total of around 1% of all patients are currently treated with HHD (2023: around 1%). In 2024, 10% of all dialysis patients were treated with peritoneal dialysis (PD) (2023: 10%). In the same period, around 11% of dialysis patients were treated with home dialysis (2023: 11%) and about 15% (2023: 15%) of all dialysis patients in the U.S. were treated with home dialysis. See below for brief descriptions of HD and PD.
The following chart shows a comparison of in-center and home dialysis:
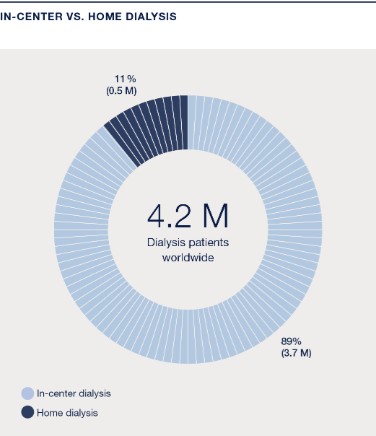
We also provide dialysis services under contract to hospitals in the U.S. on an “as needed” basis for hospitalized ESRD patients and for patients suffering from acute kidney failure. Acute kidney failure can result from infections, sepsis, hypotension, toxins, systemic diseases, trauma, or other causes, and requires dialysis until the patient’s kidneys recover their normal function. We provide services to these patients either at their bedside, using portable dialysis equipment, or at the hospital’s dialysis site. Contracts with hospitals provide for payment at negotiated rates that are generally higher than the Medicare reimbursement rates for chronic in-center outpatient treatments.
For acute renal failure, the predominant treatment method is continuous renal replacement therapy. Over 50%, or slightly more than 1 M acute patients, were treated with this method in 2024 (2023: over 50% or around 1 M). In this field, we have a market share of approximately 30% (2023: 30%). For additional information regarding patient growth in this field, see “— Corporate strategy and objectives,” below.
28
Hemodialysis . Hemodialysis removes toxins and excess fluids from the blood in a process in which the blood flows outside the body through plastic tubes known as bloodlines into a specially designed filter, called a dialyzer. The dialyzer separates waste products and excess water from the blood. Dialysis solution flowing through the dialyzer carries away the waste products and excess water and supplements the blood with solutes which must be added due to renal failure. The treated blood is returned to the patient. The hemodialysis machine pumps blood, adds anti-coagulants, regulates the purification process and controls the mixing of dialysis solution as well as the rate of its flow through the system. This machine can also monitor and record the patient’s vital signs.
At our clinics, we provide hemodialysis treatments at individual stations through the use of dialysis machines and disposable products. In hemodialysis treatment, a nurse connects the patient to the dialysis machine via bloodlines and monitors the dialysis equipment and the patient’s vital signs. The capacity of a clinic is a function of the number of stations and additional factors such as type of treatment, patient requirements, length of time per treatment, and local operating practices and ordinances regulating hours of operation.
As part of the dialysis therapy, we provide a variety of services to ESRD patients at our dialysis clinics in the U.S. These services include administering erythropoietin stimulating agents (ESAs), which are synthetic engineered hormones that stimulate the production of red blood cells. ESAs are used to treat anemia, a medical complication that ESRD patients frequently experience. We administer ESAs to most of our patients in the U.S. ESAs have historically constituted a material portion of our overall costs of treating our ESRD patients.
Peritoneal dialysis . Peritoneal dialysis removes toxins from the blood using the peritoneum, the membrane lining covering the internal organs located in the abdominal area, as a filter. Most peritoneal dialysis patients administer their own treatments in their own homes and workplaces, either by a treatment known as continuous ambulatory peritoneal dialysis (CAPD), or by a treatment known as continuous cycling peritoneal dialysis, also called automated peritoneal dialysis (APD). In both of these treatments, a surgically implanted catheter provides access to the peritoneal cavity. Using this catheter, the patient introduces a sterile dialysis solution from a solution bag through a tube into the peritoneal cavity. The peritoneum operates as the filtering membrane and, after a specified dwell time, the solution is drained and disposed. A typical CAPD peritoneal dialysis program involves the introduction and disposal of dialysis solution four times a day. With continuous cycling peritoneal dialysis, a machine pumps or “cycles” solution to and from the patient’s peritoneal cavity while the patient sleeps. During the day, one and a half to two liters of dialysis solution remain in the abdominal cavity of the patient. The human peritoneum can be used as a dialyzer only for a limited period of time, ideally only if the kidneys are still functioning to some extent.
For our home dialysis patients, we provide materials, training and patient support services, including clinical monitoring, follow-up assistance and arranging for the delivery of supplies to the patient’s residence. (See “— Regulatory and legal matters — Reimbursement — U.S.” for a discussion of the ESRD PPS and billing for these products and services.)
Care Delivery
Care Delivery encompasses our global network of dialysis clinics and includes services that address the complex health care needs and treatment choices of kidney patients. We support the entire spectrum of renal care for CKD and ESRD and are pioneers in dialysis as kidney replacement therapy.
Within Care Delivery, our value and risk-based care programs allow for partnerships with payors based in the U.S. and the government to reduce the overall cost of care. With our industry expertise, we leverage artificial intelligence, analytics, technological capabilities and platforms to support early interventions in care.
29
The service portfolio of Care Delivery is shown in the following chart:

The Fresenius Kidney Care and Fresenius Medical Care NephroCare (NephroCare) dialysis clinic networks comprise our 3,675 worldwide dialysis clinics which provide various forms of in-center kidney replacement therapies (2023: 3,925). In 2024, we treated 69% of our patients in the U.S. and 31% in International (2023: 62% in the U.S. and 38% in International).
As patients choose greater independence offered by home dialysis, we provide different options of home dialysis therapy, such as PD and HHD, to meet different patient needs. Currently, we serve over 85,000 patients globally (2023: over 85,000) with our PD and HHD solutions.
Care Delivery provides different forms of dialysis therapies for people living with ESRD and transplant referral coordination for eligible patients where offered, as illustrated in the following chart.
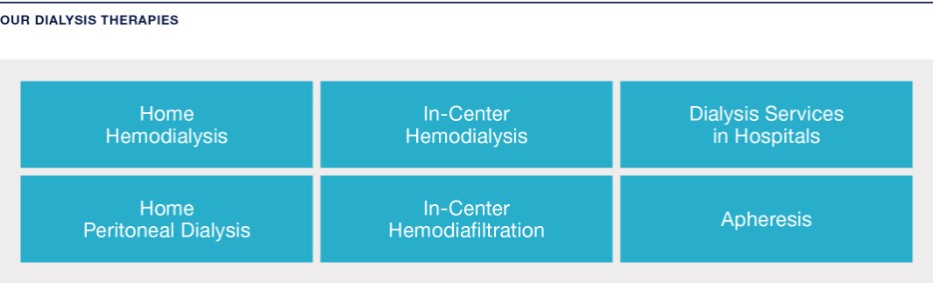
Although our dialysis clinic network is the heart of Care Delivery, the overall Care Delivery portfolio includes a range of services that meet the immediate and long-term needs of individuals living with kidney disease.
Pharmacy Services
We offer pharmacy services, mainly in the U.S. These services include providing renal medications and supplies to the homes of patients or to their dialysis clinics directly from renal pharmacists who are specially trained in treating and counseling patients living with kidney disease. We also produce and distribute kidney-disease related drugs and pharmaceuticals.
30
Vascular, cardiovascular and endovascular specialty services and vascular care ambulatory surgery center services
We operate physician office-based vascular access centers, mainly in the U.S. We also develop, own and manage specialty outpatient ambulatory surgery centers for vascular care. A patient receiving hemodialysis must have a vascular access site to enable blood to flow out of the patient’s body to a dialysis machine for cleansing and to return as newly cleaned blood to the body. Our centers create and coordinate the maintenance of these vascular access sites, helping to ensure maturation before use and good flow of blood. Additionally, our vascular care services provide both cardiovascular and endovascular specialty services. Cardiovascular procedures are similar to the setting of care and scope of services for vascular access procedures discussed above with a focus on treatment for heart disease, while endovascular surgical procedures are minimally invasive and designed to access many regions of the body via major and peripheral blood vessels and assist in both the maintenance of hemodialysis access and treatment of peripheral artery disease.
Value and risk-based care programs
We conduct a broad range of value and risk-based care programs spanning CKD and ESRD patient populations with both private and public payors. Value and risk-based care programs include shared risk arrangements in which private payors or government programs share the savings or losses from reductions or increases in the overall medical spend of a population under management assuming that certain quality thresholds are also met. Full risk arrangements include capitated arrangements and shared saving arrangements in which private payors or government programs credit us periodic, fixed payments based on expected medical expenses of such members. Since capitation arrangements often can be recognized as premium revenue and the full medical premium for ESRD beneficiaries generally is very large, capitation programs can drive significant revenue and, when costs are effectively managed, profit opportunities. We have participated recently in the following value-based programs:
| ● | CMS commenced its ESRD Treatment Choices model on January 1, 2021. The ESRD Treatment Choices model is a mandatory model that applies to ESRD facilities and managing clinicians in certain randomly selected geographic regions (specifically, Hospital Referral Regions) that comprise approximately 30% of adult ESRD beneficiaries in all 50 states and the District of Columbia. This model applies both upside and downside payment adjustments to certain claims submitted by participating physicians and dialysis facilities for Medicare dialysis patients over a span of six and one-half years. |
| ● | A voluntary CMS payment model, the Comprehensive Kidney Care Contracting model, began on January 1, 2022 as a successor program that builds upon the discontinued ESRD Seamless Care Organizations model. Under the CKCC model, renal health care providers participate by forming an entity known as a Kidney Care Entity (KCE). Through the KCE, renal health care providers take responsibility for the total cost and quality of care for Medicare beneficiaries with CKD stages 4 and 5 as well as Medicare beneficiaries with ESRD. In order to participate, KCEs must include nephrologists and transplant providers, and dialysis providers and other third parties are permitted to participate. The voluntary models allow KCEs to take on various amounts of financial risk. Two options, the CKCC global and professional models, allow renal health care providers to assume upside and downside financial risk. A third option, the CKCC graduated model, is limited to assumption of upside risk, but is unavailable to KCEs that include large dialysis organizations. |
| ● | Value and risk-based care programs with private payors to provide care to commercial and Medicare Advantage ESRD and CKD patients. Under these payment arrangements, our financial performance is based on our ability to manage a defined scope of medical costs within certain parameters for clinical outcomes. |
Physician nephrology services
We manage and operate nephrology physician practices in the United States.
Ambulant treatment services
We provide ambulant treatment services to a limited extent in parts of our Care Delivery business outside the U.S., which include comprehensive and specialized health check-up centers, vascular access and other chronic treatment services.
Other services
Through our Frenova subsidiary, we deliver a network of research sites, a diverse patient population and the expertise to initiate clinical trials rapidly. This subsidiary works with partner sites to enroll suitable patients for renal trials and studies of adjacent conditions. Frenova also offers data analytics and licensing services with access to one of nephrology’s largest longitudinal databases.
31
Additionally, our subsidiary, Spectra Laboratories, provides renal-specific laboratory testing and processing.
For additional information regarding our other health care services, see Item 3.D, “Key information — Risk factors and Item 4, “Information on the Company — Regulatory and legal matters — Reimbursement — U.S.”
High-volume hemodiafiltration
In Europe and the Middle East, we have been successfully treating patients with HVHDF for over a decade, underscoring its established benefits and potential for broader application. HVHDF is a kidney replacement therapy that combines both convection and diffusion to remove solutes from the body. Unlike conventional hemodialysis, which primarily uses diffusion, HVHDF incorporates high-volume convective therapy, infusing additional fluid and removing larger middle molecules.
This therapy gained additional attention in 2023 with the release of the European Union-funded CONVINCE study comparing the efficacy of HVHDF against high-flux hemodialysis (HF-HD). After beginning the study in 2018, researchers observed more than 1,300 participants over 2.5 years. The results showed a 23% decrease in all-cause mortality on average for patients treated with HVHDF as well as an improvement in patient-reported outcomes.
In February 2024, our 5008X hemodialysis system became the first FDA-approved machine capable of delivering HVHDF in the U.S. Paired with our FX CorAL dialyzer, which is already available in the U.S., the 5008X combines advanced engineering and membrane technologies to make HVHDF possible.
Before 2004, the use of hemodiafiltration (HDF) in NephroCare clinics in Europe, the Middle East and Africa (EMEA) was limited. After 2004, HDF became the standard therapy in NephroCare clinics in EMEA and has increased its share continuously among the dialysis techniques prescribed in the network. In 2024, 62% (2023: 57%) of NephroCare patients in EMEA were treated with this dialysis technique. In January 2014, NephroCare clinics in EMEA implemented HVHDF (an infusion volume greater than 21 liters per session) as a new quality key performance indicator for patients undergoing post-dilution HDF.
To establish HVHDF as a new standard of care in the U.S. dialysis industry, we are planning a limited launch to targeted Fresenius Kidney Care clinics during 2025 and a broader commercial launch in 2026 and beyond. HVHDF is expected to benefit both our Care Delivery and Care Enablement segment operations as we will produce new or updated products and provide treatments to our patients using this new modality.
Care Enablement
Care Enablement includes three product verticals: in-center dialysis, home dialysis and critical care. Each of these units is responsible for the entire product lifecycle, from ideation and creation to value generation, supply chain management, service and, ultimately, the end of the product’s life.
Products in our Care Enablement portfolio include dialyzers, in-center HD machines, home dialysis and PD cyclers, PD solutions, HD concentrates, solutions and granulates, bloodlines, renal pharmaceuticals, systems for water treatment, acute cardiopulmonary products, apheresis products and other medical devices. Care Enablement also conducts MedTech device and pharmaceutical-related R&D and includes manufacturing, supply chain and commercial operations.
The health care products we offer in around 150 countries worldwide focus on the following therapies:
| ● | Hemodialysis – HD is by far the most common type of therapy for chronic kidney failure. We provide a wide range of HD systems in dialysis centers as well as for use at home including machines, dialyzers, bloodline systems, HD solutions and concentrates, water treatment systems as well as data processing and analysis systems. |
| ● | Peritoneal dialysis – In PD, the peritoneum is used as a natural filter. We offer systems and solutions for CAPD and APD in dialysis centers as well as for use at home. |
| ● | Acute dialysis – In case of a sudden loss of renal function, continuous renal replacement therapy is used in intensive care units. Our portfolio includes acute dialysis machines, dialysis fluids, hemofilters, plasma filters, adsorbers and a variety of treatment kits and catheters. |
32
The portfolio includes both dialysis machines and dialyzer options for kidney replacement therapies across a wide range of clinical needs, including low flux dialysis, high flux dialysis, HDF and HVHDF.
With a comprehensive home dialysis portfolio, including both PD and HHD, we have a clear focus on this growth market. We are making significant progress in connected health solutions with a strong presence in the U.S. and ongoing expansion across EMEA.
We also offer extracorporeal therapy options for patients who cannot be sufficiently treated through conventional pharmaceutical regimens, including the removal of metabolic products, toxins, autoantibodies and immunocomplexes.
Based on internal estimates and publicly available information collected by our internal market analysis tools (see “Major markets and competitive position,” below), as well as data published by our significant competitors, we are the world’s largest manufacturer and distributor of equipment and related products for hemodialysis and the second largest manufacturer and distributor of peritoneal dialysis products, measured by publicly reported revenues. For the fiscal year 2024, health care products accounted for 22% of our consolidated total revenue (2023: 21%).
The following table shows the breakdown of our dialysis product revenues into sales of HD products, PD dialysis products and other health care products. The following amounts exclude intercompany product sales:
|
Health care product revenue |
|
|
|
|
|
|
|
|
|
|
|
|
|
in € M |
|
|
|
|
|
|
|
|
|
|
|
|
|
|
|
Year ended December 31, |
||||||||||
|
|
|
2024 |
|
2023 |
|
2022 |
||||||
|
|
|
Total |
|
|
|
Total |
|
|
|
Total |
|
|
|
|
|
product |
|
|
|
product |
|
|
|
product |
|
|
|
|
|
revenues |
|
% of total |
|
revenues |
|
% of total |
|
revenues |
|
% of total |
|
Hemodialysis products |
|
3,391 |
|
80 |
|
3,253 |
|
80 |
|
3,255 |
|
82 |
|
Peritoneal dialysis products |
|
358 |
|
8 |
|
359 |
|
9 |
|
384 |
|
10 |
|
Other |
|
502 |
|
12 |
|
448 |
|
11 |
|
341 |
|
8 |
|
Total |
|
4,251 |
|
100 |
|
4,060 |
|
100 |
|
3,980 |
|
100 |
In December 2016, we acquired Xenios AG (Xenios), expanding our capability to multi-organ support. The products are used for a wide range of extracorporeal gas exchange and offer a wide range of heart and lung support from partial CO 2 removal up to full oxygenation. Xenios’s Novalung® is the first extracorporeal membrane oxygenation (ECMO) system to be cleared for more than six hours of continuous use as extracorporeal life support.
Renal pharmaceuticals
We continue to acquire and in-license renal pharmaceuticals to improve dialysis treatment for our patients. Below are the primary renal pharmaceuticals we have acquired or for which we have obtained licenses for use:
PhosLo ®
In November 2006, we acquired PhosLo ® , a calcium-based phosphate binder. Phosphate binders keep phosphorus levels in ESRD patients in a healthy range by preventing the body from absorbing phosphorus from foods and assisting the passing of excess phosphorous out of the body. We have received approval of PhosLo ® in selected European countries. In October 2008, a competitive generic phosphate binder was introduced in the U.S. market, which reduced our PhosLo ® sales in 2009. In October 2009, we launched an authorized generic version of PhosLo ® to compete in the generic calcium acetate market. In April 2011, the FDA approved our New Drug Application for Phoslyra ® , a liquid formulation of PhosLo ® . In 2023, we discontinued the sale of Phoslyra in the U.S.
33
Venofer ® and Ferinject ®
In 2008, we entered into two separate and independent license and distribution agreements, one for certain countries in Europe and the Middle East with Vifor (International) Ltd., a subsidiary of Swiss-based CSL Vifor (formerly Vifor Pharma Ltd.) and one for the U.S. (with American Regent, Inc. (formerly Luitpold Pharmaceuticals Inc.)), to market and distribute intravenous iron products; Venofer ® (iron sucrose) and Ferinject ® (ferric carboxymaltose) outside of the U.S. Both drugs are used to treat iron deficiency anemia experienced by non-dialysis CKD patients as well as dialysis patients. Venofer ® is the originator intravenous iron sucrose product, a leading intravenous iron brand in terms of volume worldwide. Ferinject ® is a leading intravenous iron therapy with market authorization in 87 countries as of October 2024 and more than 30 million patient years of experience.
The first agreement concerns all commercialization activities for these intravenous iron products in the field of dialysis and became effective on January 1, 2009. In North America, a separate license agreement effective November 1, 2008, provides our subsidiary Fresenius USA Manufacturing Inc. (FUSA) with exclusive rights to manufacture and distribute Venofer ® to freestanding (non-hospital based) U.S. dialysis facilities and, in addition, grants FUSA similar rights for certain new formulations of the drug. In 2017, Fresenius Medical Care Canada acquired the license to distribute Venofer ® for ESRD and all indications in Canada. The license agreement has a term of five years with two additional two-year options. The U.S. license agreement has a term of ten years and includes FUSA extension options. In 2023, the North American agreement with American Regent was renegotiated and extended through December 31, 2028. The international agreement which had a term of 20 years was terminated in 2010 as a consequence of the establishment of Vifor Fresenius Medical Care Renal Pharma Ltd.
In December 2010, we announced the expansion of our agreements with CSL Vifor by forming a new renal pharmaceutical company, VFMCRP, with the intention to develop and distribute products focused on addressing distinct complications and areas of chronic kidney disease; renal anemia management, mineral and bone management, kidney function preservation and improvement, conditions associated with kidney impairment and its treatment; and cardio-renal management. FME AG owns 45% of the company, which is headquartered in Switzerland. CSL Vifor contributed licenses (or the commercial benefit in the U.S.) to its Venofer ® and Ferinject ® products for use in the dialysis and pre-dialysis market (CKD stages III to V). CSL Vifor and its existing key affiliates or partners retain the responsibility for commercialization of both products outside the renal field. With effect as of November 2, 2021, Vifor Pharma Participations Ltd replaced Vifor Pharma Ltd as a shareholder of VFMCRP.
Velphoro ®
As part of the agreement to create VFMCRP, CSL Vifor also contributed the asset Velphoro ® (sucroferric oxyhydroxide), a novel iron-based phosphate binder, to the new company (excluding certain rights within Japan). Fresenius Medical Care North America (FMCNA) markets the product on behalf of VFMCRP in the U.S. and commercial sales of Velphoro ® commenced in the first quarter of 2014 in the U.S. market. Velphoro ® has been approved in 51 countries and commercially launched in 40 countries worldwide and the VFMCRP partner Kissei also received approval from the Ministry of Health, Labour and Welfare in Japan during 2015 for the product which is marketed in Japan under the brand name P-TOL. In China, we received New Drug Approval in February 2023. For further information, refer to note 25 of the notes to the consolidated financial statements included in this report.
OsvaRen ® and Phosphosorb ®
In June 2015, VFMCRP, with CSL Vifor, was developed further. In addition to the iron replacement products Ferinject ® and Venofer ® for use in nephrology indications and the phosphate binder Velphoro ® in our shared product portfolio, VFMCRP acquired nephrology medicines commercialized by us, including the phosphate binders OsvaRen ® and Phosphosorb ® . The transfer of the marketing rights was largely completed during the fourth quarter of 2015, allowing the company to further develop its sales and marketing in key European markets.
Shared product portfolio
The core of the VFMCRP model is to in-license products predominantly initiated or used by nephrologists as part of the following areas: renal anemia, mineral and bone and cardio-renal management, kidney function improvement and renal associated conditions in both dialysis dependent and non-dialysis dependent CKD. The in-licensed products are detailed below:
Mircera ® (methoxy polyethylene glycol-epoetin beta) is a long-acting ESA licensed from F. Hoffmann-La Roche AG since 2015 to treat symptomatic anemia associated with chronic kidney disease. The product is currently supplied to over 5,000 dialysis clinics in the U.S. and its territories.
34
Retacrit ® (epoetin alfa-epbx) is a short-acting ESA approved in the US in 2018 for all indications of its reference drug, epoetin alfa. Retacrit ® is licensed from Pfizer Inc. since 2015 for certain channels, primarily comprising the U.S. non-hospital dialysis market and nephrology office practices. It is the first, and only, biosimilar ESA approved for use in the U.S.
Rayaldee ® (extended release calcifediol) is the first, and only, oral extended release formulation of calcifediol, a pro-hormone of the active form of vitamin D3, for the treatment of secondary hyperparathyroidism in CKD patients with vitamin D insufficiency. VFMCRP has an exclusive license agreement with OPKO Health, Inc., to co-develop and commercialize Rayaldee ® in Europe (except Russia), Canada, Australia and Japan. In 2022, Rayaldee ® was launched in Germany and Switzerland.
Tavneos ® (avacopan) is a first-in-class rare disease treatment for anti-neutrophil cytoplasmic antibody-associated vasculitis (AAV) licensed worldwide (except in the U.S., China, and other smaller Asian and Latin American countries) from ChemoCentryx, Inc., a wholly owned subsidiary of Amgen Inc. In the licensed territories, Tavneos ® has been approved for the treatment of two main forms of AAV in combination with a rituximab or cyclophosphamide regimen in Japan, the European Union (including Iceland, Liechtenstein and Norway), Canada, Great Britain, Switzerland, Australia, Kuwait, Israel, South Korea and Saudi Arabia. The therapy has been launched in Germany, Austria, Japan, Canada, Great Britain, Switzerland, Luxembourg, France, Spain, Finland, the Netherlands, Italy, Israel, United Arab Emirates, Saudi Arabia, Kuwait, Ireland, Australia and Greece.
Korsuva™/Kapruvia™ (difelikefalin) is the first product approved in EU and U.S. for the treatment of moderate-to-severe pruritus associated with CKD for adults undergoing hemodialysis. VFMCRP has a license agreement with Cara Therapeutics, Inc. (Cara), to develop and commercialize Korsuva/Kapruvia worldwide, excluding Japan and South Korea. Recently, CSL Vifor entered into discussions with Cara related to a potential acquisition of Korsuva/Kapruvia by CSL Vifor or one if its affiliates. In the U.S., VFMCRP’s rights are for the entire dialysis market. Our renal pharmaceuticals team promotes the product to our clinics/prescribers and receives a marketing fee on our clinical sales as well as group profit (as a shareholder of VFMCRP) for non-Fresenius Medical Care sales. CSL Vifor’s sales team promotes the product to all non-Fresenius Medical Care clinics/prescribers and receives a marketing fee on these sales. In 2023, CMS ruled that it would add an amount of $0.2493 to each Medicare Fee-for-Service patient treatment beginning in April 2024 through the end of 2024. Beginning in 2025, the amount will increase to $0.4601 for each Medicare Fee-for-Service patient treatment. The additional amount for 2026 will be calculated in the second half of 2025, with 2026 being the last year of the add-on payment for Korsuva. After this period, this amount will be taken out of the bundled rate. Fresenius Renal Pharmaceuticals and CSL Vifor agreed that both organizations would stop promotion of Korsuva, in the US market, in 2024. Neither organization will receive a marketing fee beginning in January 2024. Korsuva/Kapruvia is approved in the U.S., the EU (including Iceland, Liechtenstein and Norway), Great Britain, Canada, Switzerland, Kuwait, United Arab Emirates, Singapore and Australia. The product is available in the U.S., Germany, Austria, Sweden, France, Netherlands, Iceland, Ireland, Switzerland, UK, Finland, Norway, Bahrain, Kuwait, Oman, Qatar, Saudi Arabia, United Arab Emirates, Singapore, Canada, and Luxembourg. Further key launches are expected in the next 12 months.
VFMCRP also own the rights to Veltassa® (patiromer), a treatment for hyperkalaemia or elevated potassium levels, outside of the U.S. and Japan. In the licensed territories, Veltassa® was launched in 15 European markets as well as Israel, Saudi Arabia, United Arab Emirates, Kuwait, Australia and Canada (by partner Otsuka Canada Pharmaceutical, Inc.).
Global Medical Office
Our GMO plays a pivotal role in contributing clinical expertise to the management of our business, offering counsel to business leaders while maintaining close communication on the state of medicine and science in kidney disease care with the aim to connect the right care to the right person at the right time by leveraging advanced data analysis and research, as well as providing educational resources for physicians.
One primary area of focus for the GMO is advancing health equity, the fair and just opportunity to attain optimal health regardless of any factors that affect access to care and health outcomes, for the patients we serve. In 2024, we made progress addressing health disparities and promoting health equity for individuals living with ESRD. The GMO published its first Health Equity Strategic Plan which is now being implemented across the U.S. in our Fresenius Kidney Care centers. This plan outlines our goals, objectives, actions and resources dedicated to delivering care that enhances the quality of life for each patient and highlights those with specific social support needs.
35
Major markets and competitive position
To obtain and manage information on the status and development of global, regional and national markets, we have developed internal market analysis tools. We use these tools within the Company to collect, analyze and communicate current and essential information on the dialysis market, developing trends, our market position and those of our competitors. For some of these tools, country by country surveys are performed annually which focus on the total number of patients treated for ESRD, the treatment modalities selected, products used, treatment location, the structure of ESRD patient care providers and other metrics. These surveys have been refined since inception to facilitate access to more detailed information and to reflect changes in the development of therapies and products as well as changes to the structure of our competitive environment. Questionnaires are distributed to professionals in the field of dialysis who are in a position to provide ESRD-relevant country specific information themselves or who can coordinate appropriate input from contacts with the relevant know-how in each country. The surveys are then centrally validated and checked for consistency by cross-referencing them with the most recent publicly available sources of national ESRD information (e.g. registry data or publications, if available) and with the results of surveys performed in previous years. All information received is consolidated at a global and regional level and analyzed and reported together with publicly available information published by our competitors. New and updated information from countries, along with refinements to internal market analysis tools, may lead to retroactive adjustments of previously made statements and estimates concerning future developments. While we believe the information contained in our internal market analysis tools and competitor publications to be reliable, we have not independently verified the data or any assumptions from which our internal market analysis tools are derived or on which the estimates they contain are based, and we do not make any representation as to the accuracy of such information. Except as otherwise specified herein, all market patient and other market data in this report has been derived using our internal market analysis tools.
According to our estimates, the volume of the global dialysis market remained relatively stable at around €80 to 84 billion in 2024 (2023: €80 to 84 billion). We estimate the following approximate breakdown for this market volume: around €16 billion (2023: €16 billion) for dialysis products and the remainder for dialysis services (including the administration of dialysis drugs).
The number of dialysis patients worldwide rose by 4% to 5% to around 4.2 M in 2024 (2023: 4.1 M), according to our estimates. We are the global leader in dialysis care, providing treatment to about 7% of all dialysis patients (2023: 8%). In 2024, 299,352 people were treated in our network of dialysis centers (2023: 332,548).
The geographical breakdown according to patients treated can be found in the following chart:
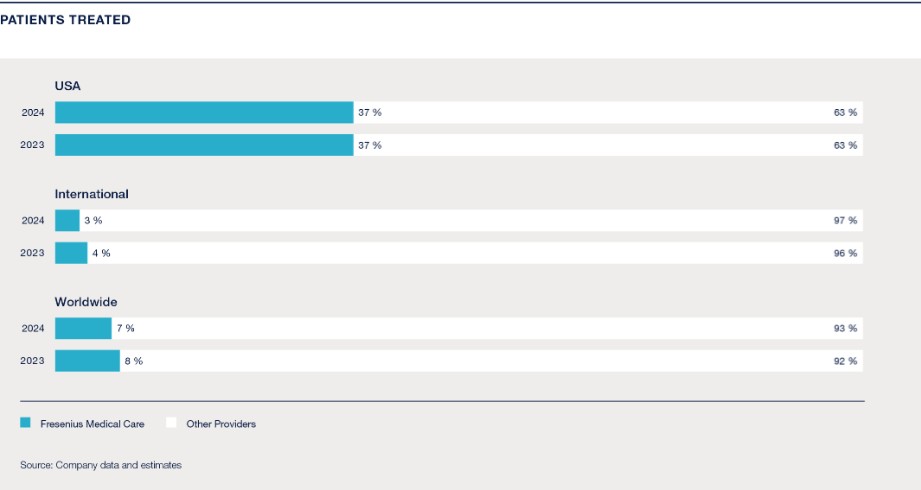
36
We are also the global market leader for dialysis products. Products made for use in our own dialysis centers or for sale to third-party customers accounted for a market share of around 35% in 2024 (2023: around 35%). We are also a leading provider of hemodialysis products, holding over 40% of the global market share in 2024 (2023: over 40%).
Dialyzers for HD are the largest product group in the dialysis market with a worldwide sales volume of around 425 M units in 2024 (2023: 410 M). Approximately 174 M (around 40%) of these were made by the Company (2023: 165 M, or around 40%), giving us by far the biggest market share. HD machines constitute another key component of our product business. Here, too, we are the market leader. Of the estimated 100,000 machines installed in 2024 (2023: 97,000), around 51,000, or around 50% (2023: 49,000, or around 50%), were produced by the Company. We hold the largest share of the HHD market. In 2024, more than 75% (2023: more than 75%) of all patients performing HHD utilized our dialysis machines.
Furthermore, we hold a strong position in the market for PD products: Around 15% (2023: around 15%) of all PD patients use products made by the Company.
The overall market for dialysis care services in the U.S. is consolidated. Across all market segments, we treat around 37% of all dialysis patients in the United States (2023: 37%). In the U.S., home dialysis is becoming increasingly important. In 2024, about 16% (2023: 16%) of our U.S. dialysis treatments were performed at home. Outside the U.S., the dialysis services business is much more fragmented. With around 1,050 dialysis centers (2023: 1,310) and approximately 93,000 patients (2023: 127,000), we operate the largest network of clinics.
Our competitive environment is described in more detail below:
Health Care Services. We operate in a competitive, international market environment and are, therefore, subject to certain trends, risks and uncertainties that could cause actual results to differ from our projected results. The major trends affecting the markets in which we operate are: the aging population and increased life expectancies, shortage of donor organs for kidney transplants, and increasing incidence and better treatment of and survival of patients with diabetes and hypertension, which frequently precede the onset of ESRD, all of which contribute to patient growth. In the U.S. and other markets in which dialysis is readily available, additional trends are:
Trends in the developed markets:
| ● | improvements in treatment quality, which prolong patient life; |
| ● | stronger demand for innovative products and therapies; |
| ● | advances in medical technology; |
| ● | ongoing cost-containment efforts and ongoing pressure to decrease health care costs, resulting in limited reimbursement rate increases; |
| ● | reimbursement for the majority of treatments by governmental institutions, such as Medicare and Medicaid in the U.S.; and |
| ● | challenges in certain labor markets. |
Trends in the emerging markets:
| ● | increasing national incomes and hence higher spending on health care; |
| ● | improving standards of living in developing countries, which make life-saving dialysis treatment available; |
| ● | consolidation of providers (e.g. hospital chains); |
| ● | consolidation of health care insurers with pricing pressure on providers; and |
| ● | privatization of health care providers. |
37
Our largest competitors in the dialysis services industry include DaVita, Inc., Diaverum AB, B. Braun SE, U.S. Renal Care, Inc. and Nephrocare Health Services Private Limited (NephroPlus).
U.S. government programs are the primary source of reimbursement for services to the majority of U.S. patients and, as such, competition for patients in the U.S. is based primarily on quality and accessibility of service and the ability to obtain referrals from physicians. However, the extension of periods during which commercial insurers are primarily responsible for reimbursement and the growth of managed care have placed greater emphasis on service costs for patients insured with private insurance.
In most countries other than the U.S., we compete primarily against individual freestanding clinics and hospital-based clinics. In many of these countries, especially the developed countries, governments directly or indirectly regulate prices and the opening of new clinics. Providers compete in all countries primarily on the basis of quality and availability of service and the development and maintenance of relationships with referring physicians.
Laboratory Services: Spectra, our dialysis laboratory subsidiary, competes in the U.S. with large nationwide laboratories, dedicated dialysis laboratories and numerous local and regional laboratories, including hospital laboratories. In the laboratory services market, companies compete on the basis of performance, including quality of laboratory testing, timeliness of reporting test results and cost-effectiveness. We believe that our services are competitive in these areas.
Products: We compete globally in the product market which is largely segmented among hemodialysis, peritoneal dialysis, home hemodialysis and renal pharmaceuticals. Our competitors include:
|
Akebia Therapeutics, Inc. |
Baxter International, Inc. |
Outset Medical, Inc. |
Toray Medical Co., Ltd. |
|
Ardelyx Inc. |
JMS Co., Ltd |
Quanta Dialysis Technologies Inc. |
Shandong Weigao Blood Purification Products Co., Ltd |
|
Asahi Kasei Medical Co., Ltd |
Mozarc Medical Holding LLC |
Sanofi S.A. |
|
|
B. Braun SE |
Nikkiso Co., Ltd. |
Physidia SAS |
|
|
Bain Medical Equipment (Guangzhou) Co., Ltd |
Nipro Corporation |
Takeda Pharmaceutical Company Limited |
|
We have invested significantly in developing proprietary processes, technologies and manufacturing equipment which we believe provide a competitive advantage in manufacturing our products.
Corporate strategy and objectives
“Creating a future worth living. For patients. Worldwide. Every day.” This vision guides our efforts to provide high-quality health care products and services that improve the lives of the patients we serve.
38
Our products and health care services are at the core of our strategy. To implement our strategy successfully, we will concentrate on three key areas: the renal care continuum, critical care solutions and complementary assets.
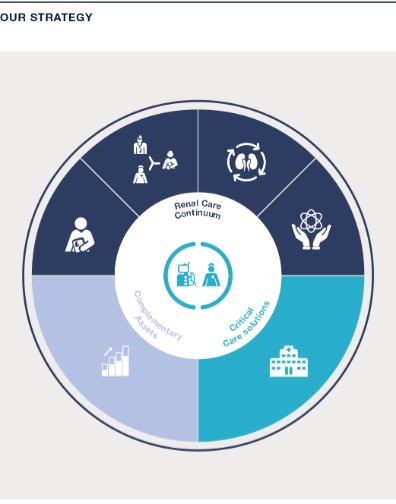
Renal care continuum
The future of health care includes an aging population and a rise in chronic diseases that will reshape patient demographics. The combination of fragmented care, cost pressures and staff shortages will create a need for new solutions. Moreover, digitalization, particularly through data analytics and artificial intelligence, is already changing the delivery of health care.
To meet the challenges of the future, we are leveraging our core strategic competencies: developing innovative products, operating outpatient facilities, standardizing medical procedures and coordinating patient care effectively.
The implementation of our corporate strategy brings us closer to our goal of providing health care for chronically and critically ill patients across the renal care continuum. We aim to use our innovative, high-quality products and services to offer sustainable solutions at a reliable cost.
The renal care continuum encompasses the following aspects:
| ● | New renal care models: We intend to use digital technologies such as artificial intelligence and big data analytics to develop new care models for patients with kidney failure, such as personalized dialysis and holistic home treatment. |
| ● | Value and risk-based care models: These models allow us to offer care that is not only better, but also affordable in the long term. Our aim is to establish sustainable partnerships with payors around the world to drive forward the transition from fee-for-service payment to pay-for-performance models. |
| ● | Chronic kidney disease and transplantation: We aim to provide patients with holistic care throughout their entire treatment plan. To this end, we have broadened our value and risk-based care programs to include the treatment of chronic kidney disease with an emphasis on slowing disease progression, enabling a smoother start to dialysis and preventing unnecessary hospital stays. We also intend to incorporate kidney transplants into value-based care models in the future. |
| ● | Future innovations: Through Fresenius Medical Care Ventures, we invest in start-ups and early-stage companies in the health care sector with the goal of gaining access to new and disruptive technologies and treatment concepts for our core business and complementary assets. |
39
Critical care solutions
The number of patients requiring continuous renal replacement therapy to treat acute kidney failure is set to rise from slightly more than 1.0 M patients in 2024 to over 1.5 M per year at the end of the next decade. In addition to acute dialysis, we are also active in other areas of extracorporeal critical care therapy, such as the treatment of acute heart, lung and multi-organ failure.
Complementary assets
We will supplement and strengthen our existing network where feasible through additional partnerships, investments and acquisitions. This will help us to create added medical value while saving costs, enabling us to build an even more solid foundation for our future growth in 2025 and beyond. For further information on the Interwell Health business combination, which supports our business activities, see note 3 of the notes to the consolidated financial statements included in this report.
Integrating sustainability
Sustainability is embedded in our vision, mission and strategic planning, reflecting our commitment to addressing global health care challenges and maximizing impact. We manage sustainability risks and opportunities by prioritizing areas such as operational efficiency, customer needs and employer attractiveness. Our strategic sustainability goals are designed to create value for our business and stakeholders, focusing on enhancing quality of care and access to health care, building the best team to serve patients and reducing our environmental footprint. Sustainability performance related to patients and employees is directly tied to the short-term incentives for the Management Board and senior executives, while the long-term incentive plan is linked to environmental performance. This comprehensive approach aligns with the United Nations Sustainable Development Goals.
For further information, see “— Environmental Management” and Item 6.B, “Directors, senior management and employees — Compensation” within the sub-sections “— New performance targets for the long-term variable compensation and “— Sustainability target,” below.
Structure
Optimizing our organizational structure remains central to our strategic transformation. Our aim is to enhance shareholder value and streamline decision-making processes, which is reflected in our change of legal form into an AG with a standard, two-tier board system in 2023. The implementation of our new legal form and operating model has removed layers from the governance structure and allows for more focused and agile decision-making, enabling faster execution of our strategic priorities.
Additionally, our transition into a German stock corporation ensures greater flexibility and bolsters the rights of our shareholders.
Capital allocation
A disciplined use and distribution of available capital is at the core of our financial strategy. We are focused on achieving sustainable growth while maintaining strong financial performance through an emphasis on deleveraging, ensuring investment-grade status and improving financial performance (in particular, with a focus on the improvement of return on invested capital). Driven by the success of the FME25 Program and an improved operational focus, capital generated through operational efficiencies and portfolio adjustments has been and will be used to reduce our debt and strengthen our balance sheet, positioning us for future growth while maintaining financial resilience in a challenging economic environment.
40
Operational efficiencies
Operational efficiency remains a cornerstone of our transformation efforts, primarily driven by the FME25 Program. With the objective to realize cost savings of €650 M by 2025, this program is designed to streamline processes and enhance our profitability. In our Care Enablement segment, which faces margin pressure, we have identified clear pathways to improve manufacturing processes, scale operations internationally and refine pricing strategies. Similarly, our Care Delivery segment is focused on increasing operational leverage, optimizing our geographic and business unit footprint and enhancing clinic management.
Legacy Portfolio Optimization
As part of our strategic execution, we have made significant progress in our Legacy Portfolio Optimization program, which is a key lever for unlocking value and focusing on core business areas which involves the review of our assets to assess growth potential and scalability, with a focus on aligning our portfolio with long-term strategic objectives and adjusting accordingly. Proceeds from divestitures have been and continue to be used to further reduce debt, reinforcing our commitment to maintaining financial discipline while pursuing sustainable growth.
In connection with our Legacy Portfolio Optimization program in our Care Delivery segment, we signed or closed divestments of our activities in all our Latin American markets and we successfully closed divestments of subsidiaries in Sub-Saharan Africa, Türkiye and the Cura Day Hospitals Group in Australia in 2024. These strategic actions reinforce our commitment to enhancing operational efficiency and focusing on areas related to our core business.
In Care Enablement, we are optimizing our product portfolio by refocusing R&D on future platforms and assessing the strategic fit of our Fresenius Medical Care Ventures portfolio.
Customers, marketing, distribution and service
We sell most of our products to dialysis clinics, hospitals and other specialized treatment clinics. A synergistic relationship among our sales, marketing and R&D personnel enables real-world insights from the field to be incorporated into our product development process. We maintain a direct sales force of trained salespersons engaged in the sale of hemodialysis and peritoneal dialysis as well as acute dialysis products and products for critical care. International sales teams engage directly with healthcare professionals and, together with marketing, represent us at industry events, while our clinical nurses provide support, training and assistance to customers. We offer customer service, training and education in the applicable local language, and technical support such as field service, repair shops, maintenance and warranty regulation for each country in which we sell dialysis products.
Our distribution network is designed for efficiency, with products moving from factories to central warehouses, then to regional facilities. We also provide direct-to-patient delivery for home dialysis products and offer direct shipping to health care facilities for certain product lines. To maximize our reach, we employ a combination of local sales forces, independent distributors, dealers, and sales agents to ensure our products are accessible worldwide.
41
Sales of dialysis products to Iran
We actively employ comprehensive policies, procedures and systems to ensure compliance with applicable controls and economic sanctions laws. We allocated resources to design, implement and maintain a compliance program specific to our U.S. and non-U.S. activities. Additionally, our dedication to providing its life-saving dialysis products to patients and sufferers of ESRD extends worldwide, including conducting humanitarian-related business with distributors in Iran in compliance with applicable law. In particular, our product sales to Iran from Germany are not subject to the EU’s restrictive measures against Iran established by Council Regulation (EU) No. 267/2012 of March 23, 2012, as last amended by Council Implementing Regulation (EU) 2021/1242 of July 29, 2021 implementing Regulation (EU) No 267/2012 concerning restrictive measures against Iran, as the Company’s products sold to Iran do not fall within the scope of the EU sanctions and none of the end users or any other person or organization involved is listed on the relevant EU sanctions lists. Because our sales to Iran were and are made solely by our German subsidiaries, the sales are not subject to the Iranian Transactions and Sanctions Regulations, 31 C.F.R Part 560 (ITSR) and are not eligible for licenses from the U.S. Treasury Department’s Office of Foreign Assets Control (OFAC) pursuant to the Trade Sanctions Reform and Export Enhancement Act of 2000. Also, ITSR § 560.215(a) is not applicable in the present case because we do not have a U.S. parent company and are not in any other way owned or controlled by a U.S. person, as those terms are used in ITSR § 560.215(a), and our affiliates involved in Iran-related transactions are also not “owned or controlled” by a U.S. person. That we have a U.S. subsidiary does not cause the ITSR to apply to our Iran-related transactions (because the sales by our non-U.S. affiliates are outside the scope of ITSR §560.215(a)). In any case, OFAC’s public guidance provides that sales of medical devices to Iran by non-U.S. companies are generally subject to humanitarian exceptions under U.S. sanctions targeting Iran.
During the year ended December 31, 2024, we sold approximately €10 M of dialysis products to an independent distributor. This distributor further distributes the products to other foreign distributors for resale, processing and assembling in Iran. The products included fiber bundles, dialysis concentrates, dialysis machines and parts, and related disposable supplies. The sales of these products generated approximately €5.1 M in operating income for the year ended December 31, 2024. All such sales were made by our German subsidiaries. Based on information available to us, we believe that most products were eventually sold to hospitals in Iran through state purchasing organizations affiliated with the Iranian Ministry of Health and were therefore sales to the “Government of Iran” as defined in ITSR § 560.304. Our 2024 sales to Iran represent approximately 0.05% of our total revenues. We have no subsidiaries, affiliates or offices, nor do we have any direct investment or own any assets, in Iran. In light of the humanitarian nature of our products and the patient communities that benefit from our products, we expect to continue selling dialysis products to Iran, provided such sales continue to be permissible under, or excluded from, applicable export control and economic sanctions laws and regulations.
Patient, physician and other relationships
We believe that our success in establishing and maintaining health care centers, both in the U.S. and in other countries, depends significantly on our ability to obtain the acceptance of and referrals from local physicians, hospitals and integrated care organizations. Our ability to provide high-quality dialysis care and to fulfill the requirements of patients and doctors depends significantly on our ability to enlist nephrologists as medical directors for our dialysis clinics and receive referrals from nephrologists, hospitals, post-acute care facilities and general practitioners.
Medicare program regulations rely on Conditions for Coverage rules for ESRD facilities which require that each dialysis clinic shall have a medical director who is responsible for overseeing the delivery of patient care and outcomes at the dialysis clinic. The medical director must be board-certified or board eligible in internal medicine or pediatrics, have completed a board-approved training program in nephrology and have at least twelve months of experience providing care to patients undergoing dialysis. We have engaged physicians or physician practices to serve as medical directors for our outpatient dialysis centers, home dialysis programs, and inpatient dialysis service relationships with hospitals. The compensation of our medical directors and other contracted physicians is negotiated individually in arm’s length negotiations and is based on the anticipated workload for each clinic or program the medical director will oversee, as well as any unique market factors such as, for example, the lack of availability of alternative options within the market. The total annual compensation of the medical directors is to be in place for a term of at least one year and the medical directors agree to seek to continue to improve quality, safety and efficiency. We have developed internal processes with the goal of setting the compensation of our medical directors at fair market value.
Almost all contracts we enter into with our medical directors in the U.S., as well as the typical contracts which we obtain when acquiring existing clinics, contain non-competition clauses concerning certain activities in defined areas for a defined period of time. These non-compete agreements restrict the physicians from owning or providing medical director services to other outpatient dialysis centers, but these clauses do not restrict the physicians from performing patient services directly at other locations/areas or referring patients to other facilities. We do not require physicians to send patients to us or to specific clinics.
42
In addition to our dialysis clinics, a number of our other health care centers employ or contract with physicians to provide professional and administrative services. We have financial relationships with these physicians in the form of compensation arrangements for the services rendered. We have processes in place to negotiate these contractual arrangements in compliance with federal and state laws applicable to financial relationships with physicians, such as the Stark Law and the Anti-Kickback Statute.
A number of the dialysis clinics and other health care centers we operate are owned, or managed, by entities in which we hold a controlling interest and one or more hospitals, physicians or physician practice groups hold a minority interest. We have granted holders of these minority interests put options or similar rights under which we could be required to purchase all or part of the minority owners’ noncontrolling interests. See note 1 a) of the notes to our audited consolidated financial statements included in this report. We also have agreements with physicians to provide management and administrative services at health care centers in which physicians or physician groups hold an ownership interest and agreements with physicians to provide professional services at such health care centers. Our relationships with physicians and other referral sources relating to these entities must comply with the federal Anti-Kickback Statute and Stark Law. There is a safe harbor under the Anti-Kickback Statute for certain investment interests in small entities. These entities have been designed to comply with the federal Anti-Kickback Statute and Stark Law, but they do not satisfy all of the requirements for safe harbor protection under the Anti-Kickback Statute. Failure to comply with a safe harbor does not render an arrangement illegal under the federal Anti-Kickback Statute and, therefore, physician entities that fall outside the safe harbors are not, by definition, prohibited by law but continue to be subject to legal scrutiny.
Our contractual and other relationships with physicians and other referral sources are subject to numerous legal requirements. While we operate under procedures and policies regarding compliance with these requirements, and in some respects, we follow the guidance under safe harbors, there is no assurance that our interpretations of legal requirements will always be accurate or that our execution of legal requirements will always be sufficient or complete.
For further information, see Item 3.D, “Key information — Risk factors.”
Capital expenditures
We invested, by operating segment, the gross amounts shown in the table below during the years ended December 31, 2024, 2023, and 2022.
|
Capital expenditures (gross) |
|
|
|
|
|
|
|
in € M |
|
|
|
|
|
|
|
|
|
2024 |
|
2023 |
|
2022 |
|
Capital expenditures for property, plant and equipment and capitalized development costs |
|
|
|
|
|
|
|
Care Delivery |
|
356 |
|
333 |
|
381 |
|
Care Enablement |
|
343 |
|
352 |
|
343 |
|
Total |
|
699 |
|
685 |
|
724 |
|
|
|
|
|
|
|
|
|
Acquisitions, investments, purchases of intangible assets and investments in debt securities |
|
|
|
|
|
|
|
Care Delivery |
|
37 |
|
55 |
|
638 |
|
Care Enablement |
|
68 |
|
83 |
|
108 |
|
Total |
|
105 |
|
138 |
|
746 |
For additional information regarding our capital expenditures, see Item 5.IV, “Operating and financial review and prospects — Financial position.”
43
Acquisitions and investments
A significant factor in the growth in our revenue and operating earnings in prior years has been our ability to acquire health care businesses, particularly dialysis clinics, on mutually beneficial terms. In the U.S., physicians and others who own dialysis operations might decide to sell their clinics (or investment interests in their clinics) to obtain relief from day-to-day administrative responsibilities and changing governmental regulations, to focus on patient care and to realize a return on their investment. Outside the U.S., doctors might determine to sell to us and/or enter into certain relationships with us to achieve the same goals and to gain a partner with extensive expertise in dialysis products and services. Privatization of health care in Eastern Europe and Asia could present additional acquisition opportunities. We believe we are also viewed as a valuable strategic health care partner outside the dialysis business due to our experience in managing chronic disease for dialysis patients and our record of improving quality and patient satisfaction and reducing the overall cost of care, and our leadership in advancing innovation and improvement in health care.
For information on the Interwell Health business combination, see Item 4.A “Information on the Company — A. History and development of the Company”, “I. Performance management system — Net leverage ratio (Non-IFRS Measure)” above and note 3 of the notes to the consolidated financial statements included in this report. For a discussion of our 2024, 2023 and 2022 acquisitions and investments, see Item 5, “Operating and financial review and prospects — IV. Financial position — Net cash provided by (used in) investing activities.”
Production
We operate modern development, production and distribution facilities worldwide to meet the demand for our dialysis products and other health care products. We have invested significantly in developing proprietary processes, technologies and manufacturing equipment resulting in a competitive advantage in manufacturing our products. Production facilities and distribution centers are located around the world, with many strategically positioned to reduce transportation cost and facilitate the distribution of products to our customers.
We produce and assemble hemodialysis machines and peritoneal dialysis cyclers in Germany and in Mexico. We manufacture and assemble dialyzers and polysulfone membranes in the U.S., Germany, France and Japan. We also produce and assemble hemodialysis machines and dialyzers in China. We manufacture hemodialysis concentrate products and PD solutions at various facilities worldwide. Additionally, we manufacture bloodlines in Mexico, China, Türkiye and Serbia. Home hemodialysis products and components are produced in Italy, Germany and Mexico.
Procurement
We manage the procurement of raw materials and semi-finished goods used in the manufacturing of renal products globally. This global approach enables us to:
| ● | enhance the efficiency of our processes, |
| ● | optimize cost structures, |
| ● | improve returns on our capital invested in manufacturing, |
| ● | respond quickly, and |
| ● | fulfill our commitment to meeting high quality and safety standards. |
We’ve established a Global Procurement team that is interconnected that brings specialization and expertise to the management of our supply chain in various areas including strategic Category Management (Indirect and Direct Procurement), Cost/Supplier Engineering, Procurement Operations, Process and Platforms, Center of Excellence and Global Business Services (Source to Receipt). These Global teams work together to ensure procurement is functioning appropriately to optimize cost, maintain high quality standards and lessen risks in our supply chains to ensure supply availability.
44
Our procurement risk mitigation efforts include the development of partnerships with strategic suppliers through framework contracts, maintaining, where reasonably practicable, at least two sources for all supply and price-critical primary products (dual sourcing, multiple sourcing), incorporating measures to prevent loss of suppliers such as continuous supply chain monitoring and the creation of risk mitigation strategies to increase supply chain resilience, particularly for primary and secondary suppliers located in countries with unpredictable geopolitical landscapes.
Our procurement policy combines worldwide sourcing of high-quality materials with the establishment of long-term supplier relationships. Additionally, we have processes in place to ensure that purchased materials comply with the quality specifications and safety standards required for our dialysis products. We outsource only after we have qualified suppliers, ensuring they meet our requirements. Interactive supplier relationship management and risk management systems connect all our global procurement activities to enhance global transparency, ensure compliance with our Global Code of Conduct for Business Partners, standardize processes and enable the constant monitoring of our projects and supplier-related activities.
With close to €8.0 billion of addressable spend per year purchased from over 70,000 external suppliers, procurement is a function having a significant operational and financial impact on the Company. Effective January 1, 2025, ProCure Medical GmbH (PMG), our subsidiary, commenced operations as our global procurement company. PMG will focus on global category management, strategic sourcing and supplier partnering in spend areas that we believe provide opportunities to capture incremental value through leveraging our procurement scale and skills above the country and regional levels. Overall, we anticipate that PMG will strengthen procurement’s strategic role within the Company and sharpen alignment with the goals and ambitions of the FME25 Program.
Quality assurance and quality management in dialysis care
Care Enablement
With a focus on quality, costs and availability, we introduced an improved organizational infrastructure with efficient processes and systems over the last several years. All production sites follow the Lean Manufacturing approach which, in our plants in North America and most of our plants in the European, Middle East and African regions, includes the “Lean Six Sigma” management system. The focus of Lean Manufacturing and Six Sigma is the continuous improvement of manufacturing processes in order to achieve a low defect rate resulting in improved product quality, while reducing manufacturing time. Our production of renal pharmaceuticals and medical devices must comply with current Good Manufacturing Practices under the applicable regulations of the U.S. FDA, the EU, the Brazilian Health Regulatory Agency (ANVISA) and other jurisdictions. See “— Regulatory and legal matters — Product Regulation,” below.
We have been successful in the continued harmonization of the major management systems in all manufacturing and development sites outside the U.S., the International Organization for Standardization (ISO)-certified marketing and sales sites in the EMEA region and the EU legal manufacturer under one globally harmonized management system (GMS). The GMS fulfills ISO 13485:2016, ISO 9001:2015 and ISO 14001 standards, the Medical Device Single Audit Program (MDSAP) underlying regulatory requirements, the Medical Device Directive 93/42/EEC as well as Regulation (EU) 2017/745 of April 5, 2017 on MDR, which have been implemented in the design, manufacture and distribution sites outside the U.S. (See also “Regulatory and Legal Matters — Facilities and Operational Regulation” below). Every medical device plant outside the U.S. has a local quality management system (QMS) directed by GMS that is certified either to ISO 13485:2016 and/or ISO 9001:2015 under MDSAP. Our operations in the U.S. continue to be governed under our North American Management System in compliance with U.S. FDA regulations. Where applicable, each site also complies to the Medical Device Directive 93/42/EEC, the MDSAP underlying regulatory requirements and additional national requirements based upon target markets and countries of manufacturing. Plants producing products with the Conformité Européene (CE) mark are in compliance with the EU MDR and our product portfolio is in the transition process to obtain EU MDR conformity in line with legal timelines until May 2028. The QMS of each site is reviewed through periodic corporate and local management reviews as well as internal audits.
All certified plants have successfully passed the annual ISO 13485, ISO 9001, MDSAP underlying regulatory requirements, external QMS audits and authority inspections for maintaining their required certifications and licenses.
45
Care Delivery
Our dialysis clinics work in conformance with the generally accepted quality standards of the industry, particularly the Kidney Disease Outcomes Quality Initiative (KDOQI) guidelines from the U.S., the European Renal Best Practice standard and increasingly, Kidney Disease: Improving Global Outcomes (KDIGO), an industry initiative for global clinical practice guidelines. Clinical data management systems are used to routinely collect certain medical parameters, which we evaluate in anonymized form in compliance with these guidelines.
At each of our dialysis clinics in the U.S., a quality assurance committee is responsible for reviewing quality of care data, choosing local quality improvement projects and monitoring the progress towards achieving the quality targets which are informed by KDOQI, KDIGO and the Quality Agenda established by the FMCNA Medical Office. A rigorous scoring system, Clinical Quality Score, reports trends in outcomes and performance comparison among all levels of the organization. Visual representation of key performance indicators can be viewed in increasing levels of detail to provide transparency of results. We continue to develop and implement programs and tools to assist in achieving our quality goals. These include treatment algorithms based on best medical evidence, outlier management teams, and technology to highlight opportunities for improvement at the dialysis chairside.
The Medicare Improvements for Patients and Providers Act of 2008 created the ESRD quality incentive program under which dialysis facilities in the U.S. that fail to achieve annual quality standards established by CMS could have base payments reduced in a subsequent year by up to 2%. See Item 5. “Operating and financial review and prospects - II. Financial condition and results of operations - Overview.” These programs blend the CMS quality standard measures against the industry baselines to attempt the improvement in quality through a pay for performance program that operates as a part of the ESRD PPS.
Outside the U.S., the Care Delivery International Clinic Quality Management Department (CDI CQM) is responsible for establishing and maintaining our internal quality management systems in the EMEA and Asia Pacific (APAC) regions. Currently established QMS play a critical role in meeting quality and safety, legal and normative requirements in country organizations and dialysis clinics. As the dialysis industry-related requirements are highly regulated in the EMEA region, the establishment and maintenance of a quality management system is a mandatory requirement to maintain the validity of clinic licenses. CDI QMS performs its scoping procedures according to local legal requirements and Company requirements across EMEA and APAC. As such, both CDI CQM and country quality managers share responsibilities for defining, controlling and mitigating the quality, safety and clinical risks during the audit process as well as ensuring a continuously improving system. The CDI QMS audit program is performed at both the country and clinic level by systems, environmental, health and safety, nursing and medical expert auditors. The audit program has a non-conformity rating strategy focusing on risk assessment and, by utilizing regular audits, our clinical compliance status can be monitored regularly. We use different tools and systems together with CDI QMS to monitor our compliance status and performance of countries and clinics, including performance management tools such as balanced scorecards. In EMEA and APAC, respectively, 601 and 125 dialysis centers clinical and operational performance are measured via the NephroCare Balanced Scorecard. We also utilize a Power BI tool to monitor non-conformities and respective corrective actions by all levels of the organization. Additionally, regular management and operational review meetings are held at both corporate and country levels to address and respond to risks.
Environmental management
Our Global Sustainability department leads our strategic sustainability initiatives related to environmental topics including energy and climate change, water and resource use. Global Sustainability collaborates closely with our business functions to implement activities. Care Delivery, in collaboration with our Real Estate Management team, is responsible for environmental management in our dialysis clinics. Care Enablement is responsible for sustainable manufacturing, product development, supply chain and sales operations. Our Management Board is the governing committee for all strategic environmental matters, approves global environmental policies and receives regular updates on the implementation of these policies. The Management Board also defines the overarching environmental strategy and sets global targets.
Sustainability targets are integrated into short- and long-term compensation plans for the Management Board, senior leadership and selected employees. In 2024, the Supervisory Board set three sustainability targets for the variable, incentive-based compensation of Management Board members. Climate-related considerations are factored into long-term compensation, with carbon dioxide equivalent (CO 2 e) emissions reduction set as the sustainability target for 20% of the long-term incentive. For further information, see Item 6.B, “Directors, senior management and employees — Compensation.” Administrative and supervisory body compensation is not linked to environmental targets.
46
Our Global Environmental Policy outlines our environmental management principles, objectives and minimum standards for environmental protection, including areas such as climate change mitigation and adaptation, energy efficiency and renewable energy deployment, water management, resource use and waste, among others. The policy addresses how we manage, monitor and reduce our environmental impact across our value chain.
Our environmental management approach is key to mitigating environmental impacts and addressing risks and opportunities. Our approach includes continuous monitoring of national and international regulations to ensure compliance and align with evolving requirements. We have established internal environmental standards, complemented by external certifications such as ISO 14001 and ISO 50001, where necessary or appropriate.
Our production sites, distribution centers, laboratories and dialysis clinics are subject to internal and external audits to verify compliance with environmental laws, local regulations, certifications and internal guidelines. We keep employees informed on environmental topics through internal articles, workshops, and Q&A sessions.
Climate change and climate protection
Our energy consumption and emissions
Energy is a key resource in manufacturing our products and delivering life-saving dialysis services, leading to both direct and indirect greenhouse gas (GHG) emissions. The production of dialyzer membranes, used to filter toxins from patients’ blood, is energy intensive. Dialysis machines also consume significant amounts of electricity during each patient treatment, which typically lasts around four hours.
Assessment of material impacts, risks and opportunities
The material impacts, risks and opportunities related to climate change and energy were identified through a double materiality assessment and also include our impact on climate change resulting from energy consumption across our business and value chain. We have assessed our activities and action plans concerning both current and potential future sources of greenhouse gas emissions. These factors are also regularly reviewed as part of the risk management process. We recognize that transitioning to a low-carbon economy, based on the applied scenarios, could impact macroeconomic trends, including increased regulatory requirements. This transition could impact our energy mix, with the shift towards renewable energy due to increased CO 2 e costs, and could also drive circular economy integration in our products and services. We continue to evaluate the potential financial impact of transition scenarios on our assets and our business model.
Financial effects
As part of our renewable electricity purchasing strategy, we entered into vPPAs in 2024 that have a financial impact on our financial position. For additional information regarding vPPAs, see note 26 of the notes to the consolidated financial statements included in this report.
Climate neutrality action plan
We define climate neutrality as a 90% reduction of market-based Scope 1 and Scope 2 emissions by 2040 compared to the base year, without using carbon credits. We are working on a net-zero target that includes Scope 3 emissions, as required by the Science Based Targets initiative (SBTi).
Energy-related direct and indirect GHG emission risks, along with growing regulatory and market pressures to transition to renewable energy, drive our strategies and measures in the climate neutrality action plan. These strategies aim to mitigate our impact on, and adapt to, climate change. To achieve our 2030 market-based Scope 1 and Scope 2 targets, we focus on procuring renewable electricity and implementing energy-efficiency measures. Additional measures will be defined for our 2040 Scope 1 and Scope 2 target. In 2025, we plan to review options for reducing our reliance on fossil fuels across our operations.
Our Scope 1 and Scope 2 GHG emissions mainly come from energy consumption in our clinics and production sites. We identify ways to reduce energy use and costs through global and local assessments, such as energy workshops. When purchasing equipment, switching to other energy sources or engaging in R&D to develop more sustainable products, we use our own capital but also consider third-party investments.
47
The majority of our greenhouse gases are indirect Scope 3 emissions resulting from activities in our value chain. Most of the emissions are related to our purchased products and services, as well as the use phase of our sold products. We are currently developing an action plan that includes measures related to our emission reduction targets across the value chain and will disclose more information in the future.
Renewable electricity
Generating and sourcing renewable electricity in the markets where we operate can lower costs, improve cash flow and enhance operations. In 2024, we made progress toward our climate neutrality targets. A key milestone was signing five vPPAs in Germany and the U.S. The Management Board made the decision to enter these agreements, allocating the necessary resources. These vPPAs are long-term purchase agreements with wind and solar parks. Three became operational in 2024, and the remaining two parks opened in January 2025. The contracts have term lengths of 10 to 15 years.
Through these greenfield vPPA projects, we support the expansion of renewable electricity, contributing to the sustainable development of national electricity grids. The projects are expected to feed around 580 gigawatt hours (GWh) of renewable energy into the grid annually, equal to approximately 46% of our reported global consumption. In 2024, the three operational projects fed 27.2 GWh of electricity into the grid, reducing market-based Scope 2 emissions by 10,131 tCO 2 e. Electricity from our vPPAs meets RE100 technical criteria. RE100 is an initiative that encourages businesses to source 100% of their electricity from high-quality renewable sources. In 2024, we also purchased 400,000 Green-e certified Energy Attribute Certificates (EACs). As a transitional measure, we will rely on EAC purchases to close gaps that cannot be addressed with other measures.
We also generate electricity from onsite solar systems at three manufacturing sites in Italy, Australia and Mexico, as well as at 19 of our dialysis clinics in the U.S., Portugal and Poland. The new installations at two clinics in Poland in 2024 are expected to cover 25% of the sites’ consumption.
To further increase the use of renewable electricity, we plan to continue evaluating opportunities for additional power purchase agreements, extend our green tariffs, install onsite solar panels and purchase unbundled EACs. Emission reductions through renewable electricity will be the primary contributor toward our first climate target: a 50% reduction in Scope 1 and market-based Scope 2 emissions by 2030.
Implementing energy-efficiency and process-optimization measures
Implementing measures to increase energy efficiency is a key element of our climate neutrality action plan. Through energy efficiency workshops at our production sites, we identified over 100 opportunities to reduce energy consumption by approximately 15% and emissions by 14%, based on 2023 data. These projects may also generate annual cost savings.
Targets and progress
In line with our environmental policy, we have set climate targets to reduce GHG emissions.
Scope 1 and Scope 2 targets
We aim for climate neutrality in our global operations by 2040, targeting a 90% reduction in market-based Scope 1 and Scope 2 emissions compared to the base year excluding carbon credits. By 2030, we plan to reduce our combined direct (Scope 1) and indirect (Scope 2) market-based GHG emissions by 50% compared to our 2020 base year emissions (915,732 tCO 2 e). Our global targets follow the SBTi (SBTi Corporate Net-Zero Standard published in March 2024) for achieving the Paris Agreement’s goal of limiting global temperature increases to 1.5°C.
To achieve our targets, we are working to decouple business growth from emissions. Emissions from electricity account for over 50% of our market-based Scope 1 and 2 emissions. We expect to achieve our 2030 target by switching to renewable electricity, supported by energy-efficiency measures. Beyond 2030, our focus will shift to reducing Scope 1 emissions, which accounts for 52% of our remaining market-based Scope 1 and 2 emissions in 2024. We plan to substitute the remaining fossil fuel consumption with carbon-neutral alternatives, such as electrification and switching to renewable fuels like hydrogen or biogas. To address the remaining 10% of residual emissions after 2040, we may explore new technologies, such as carbon capture and removal. We do not currently use an internal carbon pricing scheme due to its significant bureaucratic complexity and the challenge of establishing an effective incentive structure.
48
In 2024, we expanded our environmental data coverage to include all sources of market-based Scope 1 and 2 emissions, aligning with European Sustainability Reporting Standards requirements. The following emission sources were added to our reporting scope: natural gas and diesel consumption in dialysis clinics; mobile combustion from our car and truck fleets; energy consumption in warehouses, distribution centers, offices, pharmacies, laboratories and day care hospitals; as well as fugitive and process-based emissions. As a result, we adjusted our 2020 baseline to reflect these additions, leading to a 17% increase in our reported baseline emissions from 781,885 tCO 2 e to 915,732 tCO 2 e.
In 2025, the Management Board will review the impact of this baseline adjustment on our Scope 1 and Scope 2 targets. Our GHG inventory aligns with our emission targets and is validated internally. External validation by SBTi is planned.
Monitoring of climate targets
Our climate targets address material impacts, risks and opportunities related to climate change mitigation and energy. The metric used to track the effectiveness of our targets is the annual CO 2 e reduction compared to our 2020 base year. In 2024, we reduced our market-based Scope 1 and Scope 2 emissions by nearly 25% from our baseline, mainly using EACs. The reduction keeps us on track to meet our 2030 target by maintaining a minimum annual average reduction of 5%.
Our market-based Scope 1 and Scope 2 emissions declined by 13% in 2024 compared to 2023. Reported Scope 1 emissions decreased by 7%, mainly due to a reduced number of treatments and clinics. Reported market-based Scope 2 emissions decreased by 19%, mainly driven by the purchase of renewable energy certificates.
Scope 3 targets
Our global energy consumption contributes to GHG emissions across the upstream and downstream value chain. Stakeholders are increasingly interested in our climate change mitigation measures and energy footprint, as Scope 3 emissions are the primary driver of our GHG emissions. We are developing Scope 3 climate targets aligned with the net-zero criteria defined by the SBTi. The targets have been internally approved by the Management Board for submission to the SBTi. As the next step, we plan to submit the targets for validation and aim to publish our Scope 3 targets in 2025.
49
Target validation
In 2025, our market-based Scope 1 and 2 targets will be reviewed by the Management Board, considering adjustments to the 2020 base year. The targets have not yet been validated by an external third party. In January 2024, we submitted our commitment to the SBTi for near-term and net-zero Scope 1, 2 and 3 targets. The SBTi independently evaluates and validates company targets based on its scientifically validated and widely accepted methodology. We plan to submit our target sets for validation in 2025. As part of this process, we will consider aligning the Scope 1 and Scope 2 targets with the net-zero targets of the SBTi.

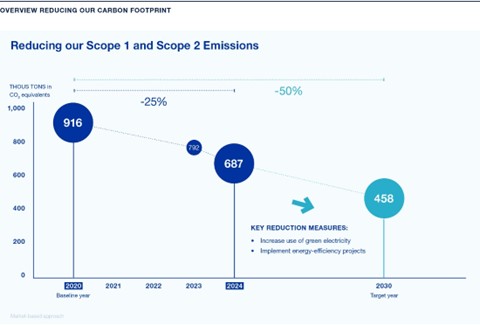
50
Metrics
Certain metrics related to our climate change and energy usage are provided in the following tables:
|
Energy consumption and mix |
|
|
|
|
|
|
|
2024 |
|
2023 |
|
(1) Fuel consumption from coal and coal products (MWh) |
|
— |
|
— |
|
(2) Fuel consumption from crude oil and petroleum products (MWh) (1) |
|
309,055 |
|
379,318 |
|
(3) Fuel consumption from natural gas (MWh) (2) |
|
1,344,856 |
|
1,382,433 |
|
(4) Fuel consumption from other fossil sources (MWh) |
|
— |
|
— |
|
(5) Consumption of purchased or acquired electricity, heat, steam, and cooling from fossil sources (MWh) (3) |
|
750,671 |
|
888,310 |
|
(6) Total fossil energy consumption (MWh) (calculated as the sum of lines 1 to 5) |
|
2,404,582 |
|
2,650,060 |
|
Share of fossil sources in total energy consumption (%) |
|
81 |
|
86 |
|
(7) Consumption from nuclear sources (MWh) (4) |
|
117,657 |
|
178,181 |
|
Share of consumption from nuclear sources in total energy consumption (%) |
|
4 |
|
6 |
|
(8) Fuel consumption for renewable sources, including biomass (also comprising industrial and municipal waste of biologic origin, biogas, renewable hydrogen, etc.) (MWh) |
|
— |
|
— |
|
(9) Consumption of purchased or acquired electricity, heat, steam, and cooling from renewable sources (MWh) (5) |
|
439,131 |
|
258,509 |
|
(10) Consumption of self-generated non-fuel renewable energy (MWh) (6) |
|
1,604 |
|
1,022 |
|
(11) Total renewable energy consumption (MWh) (calculated as the sum of lines 8 to 10) |
|
440,736 |
|
259,531 |
|
Share of renewable sources in total energy consumption (%) |
|
15 |
|
— |
|
Total energy consumption (MWh) (calculated as the sum of lines 6, 7 and 11) |
|
2,962,975 |
|
3,087,772 |
| (1) | Including fleet fuel, stationary diesel, fuel oil, LPG, propane. |
| (2) | All data stated as lower heating value. |
| (3) | Thereof 3% district heating (2024 share). |
| (4) | Only from grid electricity consumption. |
| (5) | Including vPPAs, EACs and green tariffs. |
| (6) | From solar. |
|
Energy production (M MWh) |
||||
|
|
|
2024 |
|
2023 |
|
Total Energy production |
|
151,525 |
|
149,322 |
|
Total non-renewable energy production (MWh) |
|
149,834 |
|
148,206 |
|
Total renewable energy production (MWh) |
|
1,691 |
|
1,116 |
We consider our Care Enablement business with its manufacturing, transporting and storage activities, as a high climate impact sector based on the criteria defined in Commission Delegated Regulation (EU) 2022/1288).
|
Information related to activities in high climate impact sectors |
|
|
|
|
|
2024 |
|
Total energy consumption from activities in high climate impact sectors per net revenue from these activities (MWh/Monetary unit) |
|
0.00028752 |
51
|
Greenhouse gas emissions (THOUS tons) |
|
||||||||||||||
|
|
|
Retrospective |
|
Milestones and target years (1) |
|
||||||||||
|
|
|
|
|
|
|
|
|
Variance |
|
|
|
|
|
Annual % |
|
|
|
|
|
|
|
|
|
|
to prior |
|
|
|
|
|
target / |
|
|
|
|
2020 |
|
2023 |
|
2024 |
|
year |
|
2030 |
|
2040 |
|
Base year |
|
|
Scope 1 GHG emissions (2) |
|
||||||||||||||
|
Gross Scope 1 GHG emissions (tCO 2 eq) (3) |
|
376,907 |
|
387,049 |
|
360,803 |
|
(7) |
% |
N/A |
|
N/A |
|
N/A |
|
|
Scope 1 GHG emissions from regulated emission trading schemes (%) |
|
25 |
% |
25 |
% |
26 |
% |
4 |
% |
N/A |
|
N/A |
|
N/A |
|
|
Scope 2 GHG emissions |
|
||||||||||||||
|
Gross location-based Scope 2 GHG emissions (tCO 2 eq) (4) |
|
541,727 |
|
470,806 |
|
450,611 |
|
(4) |
% |
N/A |
|
N/A |
|
N/A |
|
|
Gross market-based Scope 2 GHG emissions (tCO 2 eq) (5) |
|
538,825 |
|
405,340 |
|
326,636 |
|
(19) |
% |
N/A |
|
N/A |
|
N/A |
|
|
Significant Scope 3 GHG emissions |
|
||||||||||||||
|
Total Gross indirect (Scope 3) GHG emissions (tCO 2 eq) |
|
N/A |
|
N/A |
|
2,993,388 |
|
N/A |
|
N/A |
|
N/A |
|
N/A |
|
|
3.1 Purchased goods and services |
|
N/A |
|
N/A |
|
1,385,959 |
|
N/A |
|
N/A |
|
N/A |
|
N/A |
|
|
3.2 Capital goods |
|
N/A |
|
N/A |
|
45,931 |
|
N/A |
|
N/A |
|
N/A |
|
N/A |
|
|
3.3 Fuel and energy-related activities |
|
N/A |
|
N/A |
|
134,332 |
|
N/A |
|
N/A |
|
N/A |
|
N/A |
|
|
3.4 Upstream transportation and distribution |
|
N/A |
|
N/A |
|
147,807 |
|
N/A |
|
N/A |
|
N/A |
|
N/A |
|
|
3.5 Waste generated in operations |
|
N/A |
|
N/A |
|
155,689 |
|
N/A |
|
N/A |
|
N/A |
|
N/A |
|
|
3.6 Business travel |
|
N/A |
|
N/A |
|
32,477 |
|
N/A |
|
N/A |
|
N/A |
|
N/A |
|
|
3.7 Employee commuting |
|
N/A |
|
N/A |
|
192,383 |
|
N/A |
|
N/A |
|
N/A |
|
N/A |
|
|
3.8 Upstream leased assets |
|
N/A |
|
N/A |
|
Included in Scope 1 & 2 |
|
N/A |
|
N/A |
|
N/A |
|
N/A |
|
|
3.9 Downstream transportation and distribution |
|
N/A |
|
N/A |
|
Not significant |
|
N/A |
|
N/A |
|
N/A |
|
N/A |
|
|
3.10 Processing of sold products |
|
N/A |
|
N/A |
|
Not applicable to our business model |
|
N/A |
|
N/A |
|
N/A |
|
N/A |
|
|
3.11 Use of sold products |
|
N/A |
|
N/A |
|
847,284 |
|
N/A |
|
N/A |
|
N/A |
|
N/A |
|
|
3.12 End-of-life treatment of sold products |
|
N/A |
|
N/A |
|
51,526 |
|
N/A |
|
N/A |
|
N/A |
|
N/A |
|
|
3.13 Downstream leased assets |
|
N/A |
|
N/A |
|
Not applicable to our business model |
|
N/A |
|
N/A |
|
N/A |
|
N/A |
|
|
3.14 Franchises |
|
N/A |
|
N/A |
|
Not applicable to our business model |
|
N/A |
|
N/A |
|
N/A |
|
N/A |
|
|
3.15 Investments |
|
N/A |
|
N/A |
|
Not significant |
|
N/A |
|
N/A |
|
N/A |
|
N/A |
|
|
Total GHG emissions |
|
||||||||||||||
|
Total Scope 1, 2, & 3 GHG emissions (location-based) (tCO 2 eq) |
|
N/A |
|
N/A |
|
3,804,802 |
|
N/A |
|
N/A |
|
N/A |
|
N/A |
|
|
Total Scope 1, 2, & 3 GHG emissions (market-based) (tCO 2 eq) |
|
N/A |
|
N/A |
|
3,680,827 |
|
N/A |
|
N/A |
|
N/A |
|
N/A |
|
|
Percentage of Scope 3 emissions calculated using primary data obtained from suppliers or other value chain partners (%) |
|
N/A |
|
N/A |
|
— |
|
N/A |
|
N/A |
|
N/A |
|
N/A |
|
| (1) | The targets refer to our published 2030 and 2040 climate neutrality targets. By 2030, we aim to reduce our market-based Scope 1 and 2 GHG emissions by 50% compared to 2020. By 2040, we aim to reduce our combined Scope 1 & 2 emissions by 90% compared to 2020. |
| (2) | The only source of biogenic emissions in our Scope 1 emissions is related to the mobile combustion of diesel and petrol, for which we apply the average biofuel blend emission factor from the UK Department for Environment, Food and Rural Affairs (DEFRA). We have not accounted for biogenic emissions in the calculation of the biofuel blend share. |
| (3) | Scope 1 emission factors are applied from DEFRA. |
| (4) | Scope 2 location-based emission factors are utilized from the International Energy Agency (IEA). The emission factors are extracted from our energy reporting tool, Resource Advisor. |
| (5) | Scope 2 market-based emission factors are utilized from U.S. Residual Mix (Green-e Energy Emissions Rates, Reliable Disclosure Systems for Europe (RE-DISS) Residual European Mix and the IEA. The emission factors are extracted from our energy reporting tool, Resource Advisor. The residual mix factors only show CO 2 . |
|
GHG intensity per net revenue |
||
|
|
|
2024 |
|
Total GHG emissions (location-based) per net revenue (tCO 2 eq/Monetary unit) |
|
0.00020 |
|
Total GHG emissions (market-based) per net revenue (tCO 2 eq/Monetary unit) |
|
0.00019 |
|
Data related to Power Purchasing Agreements (PPAs) |
|
2024 |
|
|
Number of vPPAs (of which operational) |
|
5 (3) |
|
|
Amount of electricity produced (GWh) |
|
27.2 |
|
|
Amount of emissions reduced (CO 2 e) |
|
10,131 |
|
|
Amount of purchased EACs which were (un)bundled with electricity (1) |
|
|
|
|
|
|
|
|
|
|
|
|
2024 |
|
Share in 2024 in % |
|
2023 |
|
Share in 2023 in % |
|
|
Unbundled EACs from vPPAs (2) |
|
27,203 |
|
6 |
|
— |
|
— |
|
|
Unbundled EACs purchased (3) |
|
400,000 |
|
91 |
|
250,000 |
|
97 |
|
|
Bundled EACs in green tariffs (4) |
|
11,928 |
|
3 |
|
8,509 |
|
3 |
|
|
Total unbundled EAC (5) |
|
427,203 |
|
97 |
|
250,000 |
|
97 |
|
|
Total bundled EAC (6) |
|
11,928 |
|
3 |
|
8,509 |
|
3 |
|
| (1) | This table refers to all renewable electricity procured from the grid alongside bundled or unbundled EACs. It does not account for self-generated renewable electricity. The EACs are categorized by their bundling status and contractual instrument. |
| (2) | EACs from vPPAs consist of Guarantees of Origin from three vPPAs in Germany, registered under the guarantees of origin register ( Herkunftsnachweisregister or HKNR) in Germany. |
| (3) | Unbundled EACs are exclusively purchased in the U.S. in the form of RECs. These RECs come from multiple regions and are recorded in their respective registries. |
| (4) | All bundled EACs originate from a single green tariff in Colombia. |
| (5) | The total unbundled EACs include both unbundled EACs from vPPAs and unbundled EAC purchases. |
| (6) | The total bundled EACs include EACs bundled with green tariffs. |
52
Water management
Our water footprint
Large volumes of water are required at both our production sites and dialysis clinics to provide life-sustaining care for patients. It is critical that the water we use for dialysis is of high quality. For this reason, we typically use municipal water, which is further treated in our dialysis clinics. We are committed to safeguarding water resources, using them responsibly and developing strategies to continuously optimize our water footprint.
Assessment of material impacts, risks and opportunities
Our withdrawal of large volumes of water is primarily related to providing life-saving dialysis treatments and producing medical products, which could contribute to water stress or water risk in the surrounding area of the operating facilities. Increasing regulations and market changes may require a faster reduction of our water footprint. Water is essential for providing high-quality products and services to our patients and it may not be possible to reduce our water footprint within a short time horizon. Focusing on operational water efficiency could lead to potential cost savings.
The material impacts, risks and opportunities related to water were identified in a double materiality assessment and are regularly reviewed during the risk management process. We assess our impact on water using the Aqueduct Water Risk Atlas from the World Resources Institute (WRI). The results help us identify areas of water stress and risk, as well as anticipate changes in water stress conditions. We also consider water stress in our climate scenario analysis in accordance with the guidance of the Task Force on Climate-related Financial Disclosures (TCFD). This analysis covers multiple water risks, including water stress, drought stress and heat stress.
The results of our water-related assessments are incorporated into our corporate risk management process. As part of our water strategy, we continuously review opportunities to optimize water withdrawal and initiate appropriate actions accordingly.
Developing our water strategy and optimizing our water footprint
We are further developing a global water strategy to outline our commitments to water management. This strategy is expected to address risks related to our operations, focusing on sites likely to face water stress challenges. The strategy includes awareness activities, practice sharing, internal guidance and key areas for action. Water action plans will help to optimize the water footprint for our Care Delivery segment’s clinic network, particularly in areas with extreme high-water stress. For Care Enablement, the water strategy will support projects within our Green and Lean initiative at production sites. The Green & Lean initiative enables best practices to be shared across the organization with the objective of reducing energy consumption, waste generation and water withdrawal.
The implementation of water strategy and optimization projects requires adequate resources. Project teams, drawn from various departments, are upskilled and trained according to the project’s needs. Currently, our action plan does not require significant capital or operating expenditures and, therefore, these expenditures are not specifically disclosed in our consolidated financial statements.
In 2024, activities to optimize our water footprint were aligned with the objectives of our water strategy. We implemented eight water-related projects at our production sites, expected to save 53,338 m 3 of water annually, representing about 0.9% of our water withdrawal at the production sites. At one of our biggest sites, L’Arbresle in France, we replaced the cooling tower with a new generation system, enabling significant water savings. At our Bogotá site in Colombia, optimizing the cleaning frequency of production tanks led to considerable water savings.
Targets
We aim to develop water action plans by 2026 that will define targets for optimization measures at production sites and dialysis clinics in areas with extreme high-water stress. The goal is to optimize our water footprint and develop sustainable water action plans to further improve water efficiency. While there are currently no quantified water targets, we plan to integrate such targets into our water strategy moving forward. We measure the effectiveness of our policies and actions based on the qualitative target mentioned above. We are regularly reviewing the status of our water action plans with stakeholders and management to ensure that we are on track for our 2026 goal.
53

|
Water |
|
|
|
|
|
|
2024 |
|
|
Reported water withdrawal compared to previous year (%) |
|
— |
% |
|
Water withdrawal (M m³) (1), (2) |
|
35.2 |
|
|
Thereof municipal water |
|
34.9 |
|
|
Thereof ground water |
|
0.3 |
|
|
Water withdrawal in extreme/high water risk/stress areas (M m³) |
|
7.4 |
|
|
Water withdrawal (m 3 / € M revenue) |
|
1,819 |
|
|
Water consumption (M m³) (3) |
|
2.7 |
|
|
Water consumption in extreme/high water risk/stress areas (M m³) (4) |
|
0.4 |
|
|
Water consumption (m 3 / € M revenue) |
|
142.0 |
|
|
Water reuse/recycle (M m³) (5), (6) |
|
95.1 |
|
|
Water discharge (M m³) |
|
32.4 |
|
| (1) | Water withdrawal data are part of our environmental data collection process and are based on meter readings and invoices. Water withdrawal figures also include estimations. |
| (2) | Water is primarily sourced from municipal supplies in accordance with local water quality standards and is regularly tested to ensure water quality meets operational and safety requirements. |
| (3) | Water consumption for production sites: Water withdrawal – water discharge = water consumption | Water consumption applies only to production sites. In our clinics, we have determined that water in = water out. |
| (4) | Location-based assessment based on an external tool that incorporates water risk/stress to receive a high-level overview of sites that may be affected. |
| (5) | Care Enablement: Water reuse/recycling numbers are based on an extrapolation method which incorporates real data. Care Delivery: Water reuse/recycling numbers are extrapolated on the reverse osmosis system information available. |
| (6) | Some water is reused/recycled multiple times, as it runs in closed loops (e.g. for cooling and heating). Therefore, the value of the reused/recycled water can exceed 100% of the actual water withdrawal. |
Resource use and circular economy
Our resource footprint
In the health care industry, strict hygiene requirements apply to materials and the safe disposal of hazardous waste to prevent harm to patients, employees and the environment. We are committed to reducing both hazardous and non-hazardous waste while continually improving waste management practices.
Information on resource inflows
Resource inflows primarily consist of raw materials used in manufacturing our dialysis products, such as machines and disposables. Key material inflows include plastics, chemicals and (semi)-manufactured parts such as electronic components sourced from third-party manufacturers. Due to stringent product safety and quality requirements in the health care sector, the use of recycled content or biological materials in products is currently limited.
To determine resource inflows, we analyzed third-party products used in treatments and patient care alongside procurement data for our manufacturing processes. Material weights are determined using our procurement databases or estimated based on reference weights of materials and products.
Information on resource outflows
Our key product portfolio includes machines, disposables and fluids for various dialysis therapy types. For machines, we focus on circular principles such as durability, repairability and disassembly to ensure reliable patient care. Durability is covered within the product development process. Our dialysis machines are designed for a long lifespan and frequent use. An internal study of historic field data and operating hours in different countries estimates the machines’ durability at approximately 10 years. This study was conducted by internal experts, but has not been externally validated. Currently, limited data are available for comparison with competitors’ dialysis machines.
54
We provide on-site and preventive maintenance performed by certified technicians supported by predictive models to minimize downtime and receive regular software updates. Repairability and disassembly are considered during the design phase of medical devices. Machines are designed to allow for the simple replacement of wear parts such as valves, detectors and rotors. Spare parts are utilized by our technical service teams to extend machine lifespan. Due to regulatory requirements for patient safety and quality, our disposables and some of their packaging materials are currently not designed for circularity, limiting the implementation of circular principles. Nevertheless, we continue to explore opportunities for circularity within our product portfolio and packaging.
We also evaluate our product portfolio and packaging for recyclable content. While our machines can be recycled, the process depends on the availability of local infrastructure and specialized suppliers. Most of the packaging used for our machines, concentrates, disinfectants and solutions is recyclable.
Our Care Delivery and Care Enablement segments generate different types of waste, including a significant amount of hazardous and non-hazardous waste, primarily from treating patients in our clinics and producing life-saving products. Waste from patient treatments in our centers is primarily composed of disposable dialysis and medical products, including dialyzers and bloodlines. These disposables are not suitable for recycling, as they may come into contact with blood. The packaging of these products, which meet strict hygiene requirements, consists of multiple materials making recycling more challenging.
Waste from manufacturing sites, dialysis clinics and other facilities constitutes a significant proportion of our total waste including chemical waste, solvents, plastics and general waste.
Assessment of material impacts, risks and opportunities
The material impacts, risks and opportunities related to resource use and circular economy were identified through a double materiality assessment and are regularly reviewed during the risk management process. The use of materials, primarily plastics and virgin granules is increasingly regulated. Inability to adapt our products and services swiftly to meet regulatory and customer demands could jeopardize market approval or compliance with tender requirements. Replacing certain raw materials at a reasonable cost or switching suppliers poses challenges due to strict MedTech and health care regulations as well as the specific attributes of our medical products. The increasing number of regulations, rising costs and evolving market requirements related to waste reduction present challenges for the highly regulated MedTech and health care industry. Improvements in sourcing and reducing the eco-footprint of our products and services can mitigate certain negative impacts while fostering innovation. These changes could also lead to cost savings. A circular economy strategy, including waste management, material use, product end-of-life and product design, could lead to benefits such as increased efficiency in material use and processes. These improvements may drive operational advancements and economic advantages.
Developing a circular economy strategy
In 2024, we developed a global, circular economy strategy through a structured process involving multiple internal stakeholders, including relevant business units, sustainability experts and senior leadership. The Management Board approved the strategic principles. Our strategy is designed to optimize resource efficiency, reduce our carbon footprint and comply with evolving regulatory requirements. This strategy reflects our commitment to integrating circular economy principles into our operations and value chain.
Key actions include:
| ● | Product design: We will focus on implementing product and packaging specifications that consider circularity while maintaining performance, patient safety and regulatory compliance by expanding the assessment of our product portfolio and packaging to identify circularity opportunities. |
| ● | Material use: We analyze the materials used for our products and packaging. We plan to collaborate with suppliers to develop solutions that reduce reliance on primary raw materials and decrease overall material consumption across our operations. |
| ● | Product end-of-life management: We aim to improve recovery, reuse and recycling of selected products by analyzing opportunities in our value chain and partnering with suppliers, waste collectors and research institutes. |
| ● | Waste management: We identify opportunities to minimize landfill disposal and support resource recovery efforts. The goal is to optimize waste disposal and improve recycling solutions across our operations. |
We plan to begin implementing our circular economy action plan in 2025, with initial actions expected over the next two to three years.
55
Waste management and reporting
Waste is currently managed at a regional or local level due to varying local regulations and the nature of waste disposal. We aim to establish global processes and guidelines to improve waste segregation at the source, enabling better identification of materials for recycling or reuse. Implementation will partly depend on regulatory opportunities to influence local waste management infrastructure.
Key actions implemented in 2024 include:
| ● | Waste audits and right-sizing of waste services: In 2024, we continued waste audits in the U.S. to improve transparency around waste types and explore ways to avoid and reduce waste. These audits help us evaluate waste generation and refine our waste estimation process. For example, we analyze waste disposal practices and reduce related disposal costs by installing smaller waste bins and optimizing bin collection schedules. |
| ● | Recycling projects: We advanced ongoing recycling projects, including the recycling of plastic canisters from dialysis centers in Germany. We are currently assessing the feasibility of expanding this project. Additionally, we launched a printer cartridge collection and recycling program for all U.S. locations. In 2024, we returned 7,447 cartridges, amounting to more than 11,000 kg of material sent for recycling. |
| ● | Waste efficiency: During 2024, we implemented six waste efficiency initiatives at our manufacturing sites, which collectively prevented the generation of approximately 6,000 kilograms of waste. Additionally, a separate initiative in the U.S. involved conducting waste audits at our clinics to quantify the actual types and amounts of waste generated, replacing previously estimated data. This audit revealed that we have been overreporting waste across approximately 1,800 of our U.S. clinics. As a result, this reporting improvement allowed us to refine our waste generation values, accounting for a difference of about 16,000 metric tons. |
| ● | Waste reporting: In 2024, we expanded the scope of our resource use reporting to improve transparency. We established processes for reporting material inflows required to manufacture products and provide dialysis in our clinics. Global waste reporting processes for our business segments were also introduced, covering total waste, hazardous and non-hazardous waste and waste treatment methods. |
Targets
Aligned with our Global Environmental Policy, we aim to minimize environmental impacts and reduce our overall footprint. As part of our circular economy strategy, we plan to develop global targets in the mid-term, including quantitative objectives for circularity indicators.
Currently, we have established local internal targets for waste management across all our manufacturing sites, aiming to improve recovery rates by 0.5 to 3% annually. These targets focus on increasing waste diversion from landfills and incineration, aligning with the recycling tier of the waste hierarchy. This hierarchy ranks waste management strategies based on their environmental impact, emphasizing the most sustainable options. Performance of our targets at production sites is evaluated by comparing recycling and recovery data from the current year with that of the previous year. Oversight is provided by the appointed environmental representatives at each manufacturing site.
These voluntary targets are approved by the management of Care Enablement and depend on the performance of the manufacturing sites. By driving year-over-year improvements, these targets underline our commitment to improving waste management practices.
56
Metrics
Our metrics in the area of resource use for the years ended December 31, 2024 and 2023 are included below:
|
Total weight of resource inflow (metric tons) (1) |
|
|
|
|
|
2024 |
|
Total weight of technical and biological materials |
|
1,256,570 |
|
Biological materials sustainably sourced with certifications (%) |
|
— |
|
Total weight of secondary reused or recycled components |
|
7,397 |
|
Secondary reused or recycled components (%) |
|
0.6 |
| (1) | Estimations are applied to calculate the weight of materials where primary data is unavailable. Available weight per product category and spend data are used. Spend data from November 2023 to October 2024 was retrieved for this analysis. The total weight of third-party products used for a standard dialysis treatment is multiplied by the number of treatments performed in a year. |
|
Recyclable content in products and packaging (%) (1) |
|
|
|
|
|
2024 |
|
Machines (2) |
|
24 |
|
Packaging |
|
79 |
| (1) | Data used for the calculation have been obtained from lifecycle assessment calculations, product specifications and packaging statements, weighted according to production volumes. Publicly available recycling rates from sources like Eurostat have been used to determine recyclability of components such as metals, wood and cardboard. A representative product from each product group is used to calculate the wood and cardboard packaging components. |
| (2) | Only machines are considered in the assessment of recyclable content, as other products are either blood-contaminated or consumed during use. |
|
Total waste and break-down by type (metric tons) (1) |
|
|
|
|
|
2024 |
|
Total hazardous waste (2) |
|
47,800 |
|
Total non-hazardous waste |
|
151,607 |
|
Total waste |
|
199,407 |
|
Total recycled waste |
|
60,722 |
|
Total non-recycled waste |
|
138,685 |
|
Share of non-recycled waste (%) |
|
70 |
| (1) | Data for the Care Enablement segment are manually collected and categorized by waste type and treatment method, and may include estimations. For the Care Delivery segment, data come from supplier reports and internal systems. Where primary data is unavailable, extrapolations or estimations are based on waste generation factors from similar activities. An internal study of in-center dialysis clinic waste assumes that the amount of non-hazardous waste equals the amount of blood-contaminated waste. |
| (2) | No radioactive waste was generated. |
57
|
Total amount of hazardous and non-hazardous waste by treatment method (metric tons) (1) |
|
|
|
|
|
|
|
|
|
Non-hazardous |
|
|
|
Hazardous waste |
|
waste |
|
|
|
2024 |
|
2024 |
|
Preparation for reuse |
|
— |
|
702 |
|
Recycled |
|
516 |
|
60,207 |
|
Other recovery operations |
|
36 |
|
10,109 |
|
Total diverted from disposal |
|
552 |
|
71,018 |
|
Incineration |
|
2,931 |
|
11,423 |
|
Landfill |
|
30 |
|
50,938 |
|
Other disposal operations |
|
44,287 |
|
18,228 |
|
Total directed to disposal |
|
47,248 |
|
80,589 |
| (1) | Data for the Care Enablement segment are manually collected and categorized by waste type and treatment method and may include estimations. For the Care Delivery segment, data come from supplier reports and internal systems. Where primary data are unavailable, extrapolations or estimations are based on waste generation factors from similar activities. If primary data on the treatment method are unavailable, hazardous and non-hazardous waste amounts are estimated using general assumptions or reference values from statistical databanks in respective countries. |
Patents and patent licenses
As the owner of patents or licensee under patents throughout the world, we currently hold rights in over 9,500 patents and patent applications in major markets.
Technologies that are the subject of granted patents or pending patent applications include aspects of our hemodialysis, peritoneal dialysis and critical care treatment systems, relating to both single-use products and treatment machines.
Other parts of the patent portfolio relate to platform and future technologies, such as digital and data management.
We believe that our success will continue to depend significantly on our technology. As a standard practice, we obtain the legal protections we believe are appropriate for our intellectual property. Nevertheless, we are in a position to successfully market a significant number of products for which patent protection has lapsed or where only particular features are patented. We believe that even after the expiration of some of our patents, our proprietary know how for the manufacturing of our products and our continuous efforts to obtain targeted patent protection for newly developed upgraded products will continue to provide us with a competitive advantage. From time to time, our patents may be infringed by third parties and, in such cases, we will assert and enforce our rights. Registered patents may also be subject to invalidation claims made by competitors in formal proceedings (oppositions, trials, re-examinations, invalidation action, etc.) either in part or in whole. In addition, technological developments could suddenly and unexpectedly reduce the value of some of our existing intellectual property (see Item 3.D, “Key Information – Risk Factors”).
Trademarks
As the owner of trademarks or licensee under trademarks throughout the world, we currently hold rights in over 3,600 registered trademarks or trademark applications covering inter alia our key product branding in major markets.
Our principal trademarks and corporate names are or comprise the designation “Fresenius Medical Care” which we use stand-alone or together with a triangular “F” figure in our corporate logo. The use of “Fresenius” in our trademarks is based on a perpetual, royalty-free license from Fresenius SE, our major shareholder. The Trademark License Agreement remains in full force after our Conversion and related deconsolidation from Fresenius SE with some amendments/clarification concerning, inter alia, standards regarding the use of the “Fresenius Marks” (details to be defined in Branding Guidelines jointly developed by Fresenius SE and us), limits on the current and future stand-alone use of the “Fresenius” name by us, the introduction of customary termination rights for good cause and the introduction of reporting obligations regarding any harmful use of the Licensed Marks and/or the “Fresenius” name. See Item 7.B, “Related party transactions — Trademarks.”
58
Risk management
We see risk management as the ongoing task of determining, analyzing and evaluating the spectrum of actual and potential risks arising from our business operations in our environment and, where possible, taking preemptive and corrective measures. Our risk management system provides us with a basis for these activities. It enables management to identify risks that could jeopardize our growth or going concern and to take steps to minimize any negative impact. Accordingly, it is an important component of our management and governance.
Risk management system
The main objective of the risk management system is to identify potential risks as early as possible to assess their impact on business activities and enable us, where necessary, to take appropriate countermeasures. Due to constantly changing external as well as internal requirements and conditions, our risk management system is continuously evolving. In the past fiscal year, we expanded our risk reporting to the Management Board and Supervisory Board by increasing the focus on the potential of combined risk effects and utilizing a holistic approach when analyzing, discussing and presenting risk information. In addition, the risk accountability and operational responsibilities of individuals and committees were specified to further improve the quality of risk information and response measures.
The organizational structure of our corporate risk management as well as the processes are shown in the following overview:
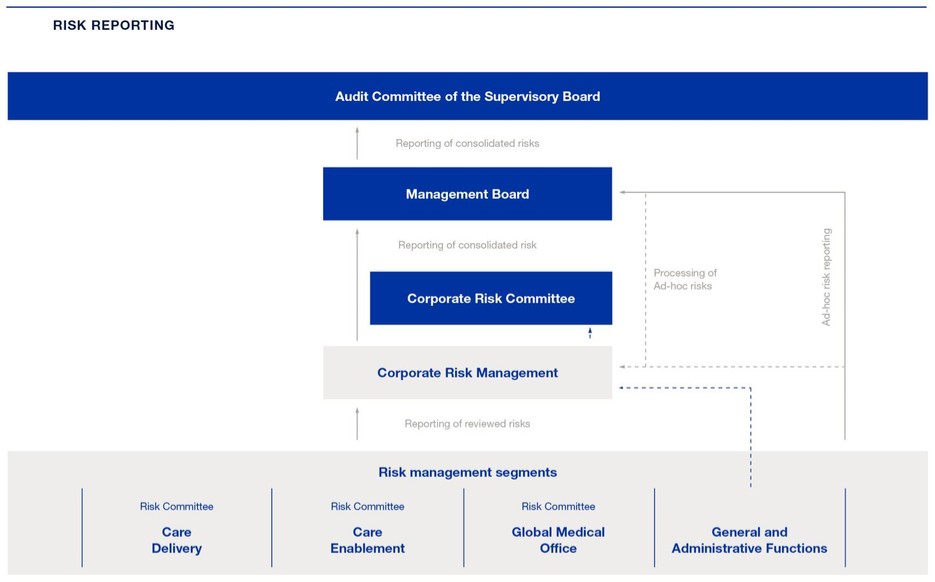
The structure of the internal risk management system is based on the internationally recognized framework for company-wide risk management, the “Enterprise Risk Management - Integrated Framework” of the Committee of Sponsoring Organizations of the Treadway Commission (COSO). Additionally, sustainability-related risk management is part of our internal risk management system.
59
As part of the risk management system, risk coordinators, utilizing risk management software, assume the task of coordinating risk management activities within our risk management segments, in particular for risk identification and assessment with individual risk owners by means of, among other things, workshops, interviews and queries. These activities relate to existing and potential emerging short-term as well as mid-term risks. Semi-annually, identified risk information is processed by the risk coordinators and reviewed by the respective heads of general and administrative (G&A) functions, followed by further discussion and review in risk committees. Subsequently, the central risk management function gathers the risks and risk responses from risk management segments, analyzes and discusses them in the corporate risk committee and communicates the compiled results to the Management Board. The analysis of the risk environment also includes determining the degree of a potential threat to our going concern by aggregating all risks with the aid of a software-supported risk simulation.
The Management Board and central risk management are promptly informed of new risks that are estimated to be high or develop into high risks in order to ensure appropriate responses (see Item 5. “Operating and financial review and prospects — VI. Risk matrix” regarding the classification of risks). The effectiveness of the risk management system is monitored by the Audit Committee of the Supervisory Board which also receives risk reporting information.
In addition to risk reporting, standard reporting to management is an important tool for managing and controlling risks, as well as for taking preventive measures in a timely manner. Therefore, our Management Board is informed on a monthly basis about the industry situation, our operating and non-operating business and the outcome of analyses of our earnings and financial position, as well as of our assets position on a quarterly basis.
The Global Internal Audit department is regularly informed about the results of the risk management system. This department determines risk focus areas and audits a selected number of our departments, subsidiaries and information technology (IT) applications worldwide each year. Determined risk focus areas are audited across all business segments. The department works according to the internationally accepted standards of the Institute of Internal Auditors, which was confirmed by a quality assessment in 2022. The next quality assessment is planned for 2027. The scope of internal auditing is widespread and involves, among other activities, periodic assessment of the effectiveness of controls (including legal and compliance controls) over business processes, IT security, the reliability of financial reporting and compliance with accounting regulations and internal policies. Since 2021, Global Internal Audit has conducted third-party audits of selected sales intermediaries in order to give assurance that business transactions with our products are in accordance with applicable compliance standards.
Our locations and units to be audited are determined annually on the basis of a selection model taking various risks into consideration. This annual audit plan is reviewed and approved by the Management Board and the Audit Committee of the Supervisory Board. All audit reports with material observations are presented to the Management Board.
The Global Internal Audit department is also responsible for monitoring the implementation of measures mitigating identified deficiencies. The Management Board is informed about the mitigation status on a quarterly basis. The Audit Committee of the Supervisory Board is also informed of the audit results. In 2024, a total of 25 audits and 16 sales intermediary audits were carried out. Risk focus areas were compliance, FCPA, governance and ESG.
Nevertheless, it is important to note that a functioning and adequate risk management system cannot guarantee that all risks are fully identified and controlled.
For information regarding our risk management processes relating to environmental matters, including climate change, see “ — Environmental Management” above. For information regarding our risk management processes relating to cybersecurity, see Item 16K, “Cybersecurity” in this report.
60
Internal control and risk management system for the Company’s accounting process
Our internal control system over financial reporting is designed to provide reasonable assurance regarding the reliability of financial reporting and the preparation of our financial statements for external reporting purposes in accordance with IFRS Accounting Standards as issued by the International Accounting Standards Board (IASB). Our internal reporting process is designed for the reliable recording, processing and control of financial data and key figures. Figures and data are compared and discussed regularly on a monthly and quarterly basis with the previous year’s values, budget targets, and the latest projections. In addition, the Management Board and the departments responsible for preparing the consolidated financial statements discuss all parameters, assumptions and estimates that substantially affect the externally reported consolidated and segment results. The Audit Committee of the Supervisory Board also reviews current quarterly results and compares them with budgets and projections.
The internal control system contains guidelines and instructions designed for the appropriate and accurate recording and presentation of Company transactions within financial reporting.
Further control mechanisms aimed at achieving reliable financial reporting and correct recording of transactions within the accounting and the consolidation process include automated and manual reconciliations, as well as the organizational separation of certain functions to prevent potential conflicts of interest. Furthermore, several preventive approval steps as well as detective plausibility checks are in place in various core finance and finance-related processes to ensure correct financial reporting. All process owners identify and assess the risks of their respective processes in terms of the implications for accounting and financial reporting. These process owners also determine that corresponding controls are in place to minimize these risks. Changes to accounting standards are discussed on an ongoing basis and considered in the preparation of the financial statements. Employees responsible for financial reporting are provided with regular training regarding changes in accounting standards. The consolidation is performed by a central department. The basis for the consolidation is derived from reporting packages and sub-group consolidated financial statements prepared and submitted by local group entities. The preparation of reporting packages and sub-group consolidated financial statements is performed according to central requirements and guidelines.
As we are also listed on the NYSE, we are required to adhere to the requirements of S-OX. Section 404 of this federal law stipulates that management of companies listed in the U.S. are responsible for implementing and adhering to an effective internal control system to produce reliable financial reporting. A yearly scoping takes place to determine entities, processes and controls which are subject to S-OX requirements. The design and operating effectiveness of the internal control system over financial reporting are routinely tested and considered in regular internal audits. Control testing results are being regularly discussed with the respective stakeholders and remediation of control deficiencies is monitored. These criteria are also included in the annual audit of our internal control system by our independent registered public accounting firm. A quarterly certification process has been implemented as a formal accountability and responsibility mechanism for countries, segments, shared services centers as well as corporate entities which aims at the accuracy of financial reporting and the associated disclosure controls and procedures.
The internal control system over financial reporting follows the criteria of the COSO model, Internal Control – Integrated Framework (2013), which was developed by COSO and is recognized as a standard by the SEC. In accordance with the COSO model, the internal control system over financial reporting is divided into five components: control environment, risk assessment, control activities, information and communication, as well as the monitoring of the internal control system. Each of these components is regularly documented, tested and assessed. We aligned our internal controls to fulfill the requirements of the COSO model.
Our review of the internal control system over financial reporting is designed to comply with a specific SEC guideline (Guidance Regarding Management’s Report on Internal Control Over Financial Reporting) and is conducted with software support. Initially, regional internal control teams coordinate the assessment of the controls in each country, after which the results are consolidated for the Company and its subsidiaries. Controls within our shared services centers and at the corporate level are assessed as well. Based upon this assessment, management evaluates the effectiveness of the internal control system for the current fiscal year. External advisors are consulted as needed. A corporate steering committee meets several times a year to review regulatory developments and changes of relevant internal control requirements, to discuss possible control deficiencies and derive further measures. In addition, in its meetings, the Audit Committee of the Supervisory Board is informed regularly of the results of management’s assessment.
Internal control systems over financial reporting are subject to inherent limitations, irrespective of how carefully these systems are designed. As a result, there is no absolute assurance that financial reporting objectives can be met, nor that misstatements will always be prevented or detected.
61
For further information on these requirements, limitations and management’s assessment of the Company’s internal control over financial reporting for 2024, see Items 15.A. and 15.B, “Disclosure controls and procedures” and “Management’s annual report on internal control over financial reporting.”
Regulatory and legal matters
Regulatory and compliance overview
Our operations are subject to extensive governmental regulation by virtually every country in which we operate including, most notably, in the U.S., at the federal, state and local levels. Although these regulations differ from country to country, in general, non-U.S. regulations are designed to accomplish the same objectives as U.S. regulations governing the operation of health care centers, laboratories and manufacturing facilities for health care products, the provision of high quality health care for patients, compliance with labor and employment laws, the maintenance of occupational, health, safety and environmental standards and the provision of accurate reporting and billing for payments and/or reimbursement. In the U.S., some states establish regulatory processes that must be satisfied prior to the establishment of new health care centers. Outside the U.S., each country has its own payment and reimbursement rules and procedures, and some countries prohibit private ownership of health care providers or establish other regulatory barriers to direct ownership by foreign companies.
Any of the following matters could have a material adverse effect on our business, financial condition and results of operations:
| ● | failure to receive required licenses, certifications, clearances or other approvals for new or existing services, facilities, or products or significant delays in such receipt; |
| ● | complete or partial loss of various certifications, licenses, or other permits required under governmental authority by withdrawal, revocation, suspension, or termination or restrictions of such certificates and licenses by the imposition of additional requirements or conditions, or the initiation of proceedings possibly leading to such restrictions or the partial or complete loss of the required certificates, licenses or permits; |
| ● | recoupment or required refunding of payments received from government and private payors as well as government health care program beneficiaries because of any failures to meet applicable requirements; |
| ● | a non-appealable finding of material violations of applicable health care or other laws; and |
| ● | changes resulting from health care reform or other government actions that restrict our operations, reduce reimbursement or reduce or eliminate coverage for particular products or services we provide. |
We must comply with all U.S., German and other legal and regulatory requirements under which we operate, including the U.S. federal Medicare and Medicaid Fraud and Abuse Amendments of 1977, as amended, generally referred to as the “Anti-Kickback Statute,” the federal False Claims Act, the federal Physician Self-Referral Law, commonly known as the “Stark Law,” the U.S. Civil Monetary Penalties Law, including the prohibition on inducements to patients to select a particular health care provider and the federal FCPA, as well as other fraud and abuse laws and similar state statutes, as well as similar laws in other countries.
As a global health care company, we are subject to laws and regulations including privacy and data protection. These laws and regulations govern, amongst other elements, the collection, use, disclosure, retention, and transfer of personal data. For example, the EU’s General Data Protection Regulation, which became effective in May 2018, imposes substantial worldwide obligations on the processing and disclosure of personal data. Additional requirements are imposed by U.S. federal rules protecting the privacy and security of patient medical information, as promulgated under the Health Insurance Portability and Accountability Act of 1996 and, as amended by the Health Information Technology for Economic and Clinical Health Act (enacted as part of the American Recovery and Reinvestment Act of 2009), among other rules promulgated by individual state legislatures. These laws continue to develop globally and differ from jurisdiction to jurisdiction, which increases the complexity and costs of our global data protection and security compliance programs. Because of varying legal requirements across the world, the Fresenius Medical Care Global Privacy Foundation (the Foundation) establishes a set of requirements to help ensure appropriate use of personal data throughout its life cycle. While the Foundation creates a baseline compliance requirement for all of our subsidiaries and personnel, we are also obligated to comply with the requirements of all applicable local laws that impose other or stricter standards.
62
A number of U.S. states in which we operate have laws that prohibit business entities, such as the Company and our subsidiaries, from practicing medicine, employing physicians to practice medicine or exercising control over medical decisions by physicians (known collectively as the corporate practice of medicine prohibition). These states also prohibit entities from engaging in certain arrangements, such as fee-splitting, with physicians. Additional state and local laws and regulations require us to maintain certain licenses and certifications to operate our facilities and/or manufacture and distribute our products and services.
Our merger and acquisition activity, as well our business operations in both products and services, are regulated by antitrust and competition laws in the countries and localities in which we operate. Some of our transactions are subject to prior review and clearance by competition authorities, while others do not require any such review or clearance. Violations of competition laws may result in government enforcement action as well as private lawsuits. We develop and execute strategies in conformity with these laws to drive innovation and appropriate competition in our businesses and we provide regular internal training on appropriate business strategies under the competition laws.
The ACA enacted in the U.S. in 2010 and other recent laws expanded the reach of many of these laws and expanded federal enforcement authority. Moreover, there can be no assurance that applicable laws, or the regulations thereunder, will not be amended, or that enforcement agencies or the courts will not make interpretations inconsistent with our own, any one of which could have a material adverse effect on our business, reputation, financial condition and operating results. Sanctions for violations of these statutes may include criminal or civil penalties, such as imprisonment, fines or forfeitures, denial of payments, and suspension or exclusion from the Medicare, Medicaid and other federal health programs. In the U.S., some of these laws have been broadly interpreted by a number of courts, and significant government funds and personnel have been devoted to their enforcement because such enforcement has become a high priority for the federal government and some states. We, and the health care industry in general, will continue to be subject to extensive federal, state and foreign (i.e., non-U.S.) regulation, the full scope of which cannot be predicted. In addition, the U.S. Congress and federal and state regulatory agencies continue to consider modifications to health care laws that may create further restrictions. Proposals to restructure the Medicare program in the direction of a defined contribution, “premium support” model and to shift Medicaid funding to a block grant or per capita arrangement, with greater flexibility for the states, may also be considered. Changes of this nature could have significant effects on our businesses, but, due to the continued uncertainty about the implementation of the ACA, including potential further legal challenges to or significant modifications to or repeal of that legislation, the outcomes and impact of such changes on our business, financial condition and results of operations are currently impossible to quantify or predict.
We maintain a comprehensive worldwide compliance program under the overall supervision of our chief compliance officer. The program includes a compliance staff, a written code of business conduct applicable worldwide and available on our website, training programs, regulatory compliance policies and procedures including corrective action for failure to follow policies, provisions for anonymous reporting of suspected violations of applicable laws or Company policies, and periodic internal audits of our compliance procedures. We operate many facilities throughout the U.S. and other countries in which we do business. In such a widespread, global system, it is often difficult to maintain the desired level of oversight and control over the thousands of individuals employed by many affiliated companies. We rely on our management structure, regulatory and legal resources, and the effective operation of our compliance program to direct, manage and monitor the activities of these employees. If our employees or their agents or subcontractors, deliberately or inadvertently, were to submit inadequate or incorrect billings to any federally-funded health care program, or engage in unlawful conduct with physicians or other referral sources or vendors with which we do business, the actions of such persons could subject us and our subsidiaries to liability under the Federal Food, Drug, and Cosmetic Act, Anti-Kickback Statute, the Stark Law, the False Claims Act or the Foreign Corrupt Practices Act, among other laws. See note 25 of the notes to our audited consolidated financial statements included in this report.
While we operate under procedures and policies developed in response to the regulatory environment in which we conduct our business, there is no assurance that our interpretations of legal requirements will always be accurate or that our execution of legal requirements will always be sufficient or complete. Any failure to comply with legal requirements could result in repayment obligations, civil and criminal penalties, loss of licenses and certifications required to conduct business, limitations on our operations and greater governmental oversight.
63
Product regulation
U.S. pharmaceuticals
In the U.S., numerous regulatory bodies, including the FDA and comparable state regulatory agencies impose requirements on certain of our subsidiaries as a manufacturer, distributor and/or a seller of drug products under their respective jurisdictions. Some of the products our subsidiaries manufacture and/or distribute are subject to regulation under the Federal Food, Drug, and Cosmetic Act of 1938, as amended (FDCA) and FDA’s implementing regulations. These products include our peritoneal dialysis and saline solutions, PhosLo ® (calcium acetate), Phoslyra ® (calcium acetate oral solution), Venofer ® (iron sucrose injection, USP), and Velphoro (sucroferric oxyhydroxide). Distribution of PhosLo ® and Phoslyra ® was discontinued in 2024. Many of these requirements are similar to those for devices, as described below. We are required to register as an establishment with the FDA, submit listings for drug products in commercial distribution and comply with regulatory requirements governing product approvals, drug manufacturing, labelling, promotion, distribution, post market safety reporting and recordkeeping. We are subject to periodic inspections by the FDA and other authorities for compliance with inspections as well as with federal CMS average sales price reporting, medical drug rebate program and other requirements. Our pharmaceutical products must be manufactured in accordance with current Good Manufacturing Practices (cGMP). We are required to provide information to the FDA whenever we become aware of a report of an adverse drug experience associated with the use of one of our drug products that is both serious and unexpected, as defined in FDA regulations and guidance. We are required to notify the FDA of certain product quality issues. In addition, as with the marketing of our medical devices, in order to obtain marketing approval of our drug products, we must satisfy mandatory procedures and safety and efficacy requirements. Furthermore, the FDA prohibits our products division from marketing or promoting our pharmaceutical products in a false or misleading manner and from otherwise misbranding or adulterating them. Finally, if the FDA believes that a company is not in compliance with applicable drug regulations, it has similar enforcement authorities as those discussed below with respect to medical devices, including under the administrative, civil, and criminal penalty provisions of the FDA. Other state and federal regulatory and enforcement agencies have authority to enforce related fraud, consumer protection, privacy, and other laws.
Pharmaceuticals outside the U.S.
Some of our products, such as peritoneal dialysis and acute dialysis solutions as well as phosphate binders and other orally administered drugs, are considered medicinal products subject to the specific drug law provisions in various countries. The EU has issued several directives and regulations on medicinal products, including a directive on medicinal products for human use, like Regulation (EC) 726/2004 (March 31, 2004) and Directive 2001/83/EC (November 6, 2001), as amended. Each member of the EU is responsible for conforming its law to comply with the latter directive. In Germany, the German Drug Law ( Arzneimittelgesetz or AMG), which implements several EU requirements, is the primary regulation applicable to medicinal products.
The provisions of the AMG are comparable with the legal standards in all other European Union countries. As in many other countries, the AMG generally provides that a medicinal product may only be placed on the market if it has been granted a corresponding marketing authorization. Such marketing authorization is granted by the licensing authorities only if the quality, efficacy and safety of the medicinal product have been scientifically proven. Medicinal products marketed on the basis of a corresponding marketing authorization are subject to ongoing control by the competent authorities. The marketing authorization may also be subsequently restricted or made subject to specific requirements.
The production of medicinal products requires a manufacturing license which is granted by the competent authorities of the relevant EU Member State for a specific manufacturing facility and for specific medicinal products and forms of medicinal products. The manufacturing license is granted only if the manufacturing facility, production techniques and production processes comply with the national drug law requirements, with the principles and guidelines of EU-Good Manufacturing Practice (EU-GMP). International guidelines also govern the manufacture of medicinal products and, in many cases, overlap with national requirements. Material regulations concerning manufacture and registration related to medicinal products have been issued by the European Commission (EC) and the International Council on Harmonisation of Technical Requirements for Pharmaceuticals for Human Use (ICH). The Pharmaceutical Inspection Co-operation Scheme (PIC/S), an international informal cooperative arrangement between regulatory authorities, aims at harmonizing inspection procedures by developing common standards in the field of good manufacturing practices and by providing training opportunities to inspectors. Among other things, the EC, PIC/S and ICH establish requirements for good manufacturing practices, many of which are then adopted at the national level. Another international standard, which is non-binding for medicinal products, is the ISO9001:2015 system for assuring quality management system requirements. This system has a broader platform than EU-GMP, which is more detailed and is primarily acknowledged outside the field of medicinal products, e.g., with respect to medical devices.
64
U.S. medical devices
Our subsidiaries engaged in the manufacture of medical devices are required to register with the FDA as device manufacturers and submit listing information for devices in commercial distribution. As a manufacturer of medical devices, we are subject to requirements governing premarket approval and clearance, labelling, promotion, clinical research, medical device adverse event reporting, manufacturing practices, reporting of corrections and removals, and recordkeeping, and we are subject to periodic inspection by the FDA for compliance with these requirements. With respect to manufacturing, we are subject to FDA’s Quality System Regulation (21 C.F.R. Part 820) and related FDA guidance, which requires us to manufacture products in accordance with cGMP, including standards governing product design. The medical device reporting regulations and guidance require that we report to the FDA whenever we receive or become aware of information that reasonably suggests that a device may have caused or contributed to a death or serious injury, or that a device has malfunctioned and a device or similar device would be likely to cause or contribute to a death or serious injury if the malfunction were to recur. FDA regulations also may require us to conduct product recalls and take certain other product corrective actions in response to potential quality issues. In addition, the FDA prohibits our products division from promoting our manufactured products for unapproved or uncleared indications or in a false or misleading manner. We are also prohibited from promoting unapproved or uncleared drugs or devices more generally. Finally, as with our pharmaceutical products, states impose additional requirements on our drug and device manufacturing and distribution activities, including requiring additional state licenses. We are subject to periodic inspections by the FDA and other authorities for compliance with these requirements.
In January 2023, SEIU-United Healthcare Workers West, a labor union, submitted a petition requesting that the U.S. FDA issue a recall of certain of our dialysis machines to address certain purported safety matters raised by their petition. The Company believes that the claims raised by the union’s petition are without merit. The FDA has not responded to the petition. If and when the FDA acts on the petition, the Company will respond appropriately.
Medical devices outside the U.S.
In the European Union, medical devices are subject to their own regulatory requirements. Since May 26, 2021, the Medical Device Regulation (EU) 2017/746 of the European Parliament and of the Council of April 5, 2017 on in vitro diagnostic medical devices and repealing Directive 98/79/EC and Commission Decision 2010/227/EU have replaced former acts and set out the main regulatory framework. Although the MDR is self-binding in all Member States of the EU, numerous acts of the EC and of national legislation in each Member State are necessary to fully implement the legal provisions. These provisions essentially include higher safety standards to be met by medical devices and, therefore, require a new conformity assessment procedure and re-certification of all medical devices regardless of whether they have already been placed on the market.
Originally, the transitional provisions according to Article 120 of the MDR allowed manufacturers until May 2024, at the latest, to continue to place their medical devices on the EU market based on a valid EC certificate according to the former directives and local laws for medical devices.
However, on March 15, 2023, the European Parliament published Regulation (EU) 2023/607 (2 nd amendment to the MDR), with major relevance for certification and products which are already on the market in compliance with the Medical Devices Directive (MDD). MDD certificates shall be considered valid until end of the new transition dates. We have met all requirements of the 2 nd amendment enabling us to continuously place MDD products on the market until December 31, 2027 or December 31, 2028, depending on the specific products’ individual risk class. The corresponding manufacturer’s declaration and confirmation letters by the notified body have been issued accordingly.
Conformity of our QMS with the applicable MDR requirements was assessed and confirmed by our notified body during an initial certification audit in 2019 and surveillance audits in 2020 through 2023. During 2024, the MDR recertification audit was successfully passed. After the additionally required successful assessment of the submitted technical documentation, the first EU certificate, pursuant to the MDR, was issued mid 2020 by our notified body. For each extension of the product scope of the EU certificate, a review of a sample of the technical documentation from the respective product group is required. Following this step-wise approach, our EU MDR certificate has been extended in 2023 and 2024 resulting in greater than 95% coverage of those product categories required to certify our product portfolio. The completion of the MDR certificate to cover 100% of our currently available product categories is expected by the end of 2025.
65
According to the current EU regulations, the CE mark serves as a general product passport for all Member States of the EU and the European Economic Area (EEA). Upon receipt of an EC certificate for a product according to the applicable conformity assessment procedure, e.g. a certified full quality management system for medical devices according to ISO 13485:2016, and the documented declaration and proof of conformity of our products to the harmonized European norms (Declaration of Conformity), we as the legal manufacturer are able to mark products as being in compliance with the EU requirements. If able to do so, the manufacturer must place a CE mark on the products. Medical devices that do not bear the CE mark cannot be sold or distributed within the EU.
Clinical Research
Our subsidiaries engaged in the manufacture and sale of medicinal products and medical devices, when engaged in clinical research involving investigational products, are subject to many requirements governing the conduct of clinical research, including Good Clinical Practice (GCP) standards. Similarly, our subsidiaries involved in the provision of clinical research services may also be subject to those requirements governing the conduct of clinical research depending on the nature of the research involved.
FDA and other regulatory bodies’ enforcement action
If the FDA or other regulatory bodies believe that a regulated company is not in compliance with applicable laws and regulations, they can pursue various administrative and enforcement actions, including, for example, issuing an untitled or warning letter, initiating a seizure action, or seeking an injunction. Among other things, these actions can result in the assessment of administrative penalties, product recalls and civil or criminal enforcement. Such actions could also lead to additional enforcement by other state or federal government agencies as well as lawsuits by patients or shareholders.
On December 4, 2023, the FDA issued a warning letter to us citing several deficiencies of the cGMP requirements of the Quality System regulation and alleging possible corrective and preventive action failures, among other things, in connection with the use of silicone tubing used in certain of our dialysis machines that was previously reported to the FDA. We have responded and continue to update the FDA about continuing remediation efforts. For a description of the status of outstanding FDA warning letters related to our operations, see note 25 of the notes to the consolidated financial statements included in this report.
We cannot assure that all necessary regulatory clearances or approvals, including those for new products or product improvements, will be granted on a timely basis, if at all. Delays in or failure to receive clearance or approval or delays in or failures to carry out product recalls may result in liability and reputational harm and may materially adversely affect our operating results. If at any time the FDA or other regulatory bodies believe we are not in compliance with applicable laws and regulations, they could take administrative, civil, or criminal enforcement action, resulting in liability and reputational harm, which could materially affect our operating results.
Potential changes impacting our private payors in the U.S.
The operation of charitable insurance premium assistance programs such as that offered by the American Kidney Fund (AKF) has received increased attention over the last few years by CMS and state insurance regulators and legislators. The result may be a regulatory framework that differs from the current framework or that varies from state to state. Even in the absence of actions by CMS or state regulators and legislatures to restrict the access that patients currently have to premium assistance programs, insurers are likely to continue efforts to thwart charitable premium assistance by premium assistance programs to our patients. If successful in a material area or scope of our U.S. operations, these efforts would have a material adverse impact on our business and operating results.
One such law that was enacted is AB290 in California (U.S.). Upon enactment, we, along with other providers and the AKF, filed suit challenging the validity of the law. Jane Doe, et al. v. Xavier Becerra, et al., 8:19-cv-02105, U.S. District Court for the Central District of California, Southern Division. In December 2019, the court issued a preliminary injunction staying implementation of the law. On January 9, 2024, the court issued a summary judgment decision which, among other things, upheld the provisions limiting reimbursement paid to providers who donate to the AKF when such reimbursement relates to services provided to patients who receive AKF support. On May 9, 2024, the court issued a final judgment, but stayed entry of such judgment while the parties appeal. See “— Regulatory and legal matters — Reimbursement — Possible changes in statutes or regulations” for further information on charitable premium assistance programs.
66
Marietta Memorial Hospital Employee Health Benefit Plan, et al. v. DaVita Inc. et al. No. 20-1641: On November 5, 2021, the U.S. Supreme Court granted certiorari of an appeal by an employer group health plan, the plan sponsor, and the plan’s advisor of the U.S. Court of Appeals for the Sixth Circuit (Sixth Circuit) decision in DaVita Inc.’s favor. The questions presented involved whether the health plan violated the MSPA by “taking into account” that plan beneficiaries are eligible for Medicare and/or by “differentiating” between the benefits that the plan offers to patients with dialysis versus others. On June 21, 2022, the U.S. Supreme Court reversed the Sixth Circuit decision and held that the employee health plan for Marietta Memorial Hospital did not violate the MSPA.
The Marietta ruling makes it easier for health plans to design plan benefits for Medicare eligible ESRD patients in a way that makes private health insurance relatively less attractive to ESRD patients and Medicare relatively more attractive. As Medicare and Medicaid reimbursement rates are generally lower than the reimbursement rates paid by commercial insurers, a shift of commercially insured patients to Medicare and Medicaid could have a material adverse impact on our business, financial condition and results of operations. The Marietta ruling may also result in certain EGHPs reducing the benefits offered for dialysis, which could, depending on the number of patients impacted, have a material and adverse impact on our business, financial condition and results of operation. Bills were introduced previously to Congress that would address the Marietta decision, but will need to be reintroduced in the current Congress. The Restore Protections for Dialysis Patients Act would restore the interpretation of the Medicare Secondary Payer Act prior to the Marietta decision and ensure that patients cannot be discriminated against because of their need for dialysis. These bills will need to be reintroduced before they are taken up in the 119th Congress which began on January 3, 2025. There can be no assurance that this proposal or any other legislation to address the Marietta decision will be enacted.
U.S. ballot initiatives and other legislation
Further federal or state legislation or regulations may be enacted in the future through legislative and public referendum processes, which could substantially modify or reduce the amounts paid for services and products offered by us and our subsidiaries, mandate new or alternative operating models and payment models, and/or increase our operating expenses that could present more risk to our health care service operations. Ballot initiatives that are successfully introduced at the state level in the U.S. require the vote of state citizens to directly adopt or reject proposed new legislation. These ballot initiatives require a material expenditure of resources by us to participate in public discourse regarding the proposed new legislation underlying the initiatives, which if passed, could further regulate multiple aspects of our operations including, for instance, clinic staffing requirements, state inspection requirements and profit margins on commercial business. Efforts to enact new state laws regarding our operations are continuing. State regulation at this level would introduce an unprecedented level of oversight and additional expense at the clinic level which could have a material adverse effect on our business in the impacted states. It is also possible that statutes may be adopted or regulations may be promulgated in the future that impose additional eligibility requirements for participation in the federal and state health care programs. Such new legislation or regulations could, depending upon the detail of the provisions, have positive or adverse effects, possibly material, on our businesses and results of operations. See “ — Regulatory and legal matters — Reimbursement – Possible changes in statutes or regulations,” below.
Environmental regulation
We are subject to a broad range of federal, foreign, state and local laws and regulations relating to pollution and the protection of the environment. These laws regulate, among other things, the discharge of materials into the environment, the handling and disposal of medical and other wastes, remediation of contaminated sites and other matters relating to worker, public and consumer health and safety as well as to the protection of the environment. In addition, the Company uses substances regulated under U.S. and EU environmental laws, primarily in product design as well as manufacturing and sterilization processes. Noncompliance with these regulations can result in significant fines or penalties or limitations on our operations. The applicable environmental, health and safety laws and regulations, and any changes to them or their enforcement, may require us to make material expenditures with respect to ongoing compliance with or remediation under these laws and regulations or require that we modify our products or processes in a manner that increases our costs or reduces revenues. For information regarding our activities in the areas of energy and climate protection, water management, waste management and biodiversity and pollution, see “Environmental Management,” above.
67
Facilities and operational regulation
The COVID-19 pandemic had an impact on the standard operating practices at our manufacturing facilities, distribution operations and global clinic network and resulted in changes to these practices through the implementation of additional best practice procedures along with procedures required by the jurisdictions in which we operate. Within our production facilities and clinic network, we defined and implemented further hygiene and infection control measures and precautions in order to maintain sufficient clinical staff and available space to treat all of our patients, including those who are or may be infected with COVID-19 while not unnecessarily exposing our care teams or other patients to whom we provide dialysis services, and who are among the groups most vulnerable to COVID-19. Vaccination became the top priority for our clinic network once vaccines were made available in the jurisdictions in which our clinics are located.
U.S.
Federal, state and local regulations (implemented by CMS, FDA, the Occupational Health and Safety Administration (OSHA), the Drug Enforcement Administration, and state departments or boards of public health, public welfare, medicine, nursing, pharmacy, and medical assistance, among others) require us to meet various standards relating to, among other things, the management, licensing, safety, security and operation of facilities (including, e.g., laboratories, pharmacies, and clinics), personnel qualifications and licensing, the maintenance of proper records, equipment, and quality assurance programs, and the dispensing, storage, and administration of controlled substances. All of our operations in the U.S. are subject to periodic inspection by federal, state and local agencies to determine if the operations, premises, equipment, personnel and patient care meet applicable standards. To receive Medicare/Medicaid reimbursement, our health care centers, renal diagnostic support business and laboratories must be certified by CMS. While all of our entities that furnish Medicare or Medicaid services maintain and renew the required certifications, material adverse effects on our business, financial condition, and results of operations could potentially occur if certain of those entities lose or are delayed in renewing a certification.
Our operations are subject to various U.S. Department of Transportation, Nuclear Regulatory Commission, Environmental Protection Agency, and OSHA requirements and other federal, state and local hazardous and medical waste disposal laws. As currently in effect, laws governing the disposal of hazardous waste do not classify most of the waste produced in connection with the provision of our health care services as hazardous, although disposal of non-hazardous medical waste is subject to specific state regulation. Our operations are also subject to various air emission and wastewater discharge regulations.
Several states have certificate of need programs regulating the establishment or expansion of health care facilities, including dialysis centers. We believe that we have obtained all necessary approvals for the operation of our health care facilities in accordance with all applicable state certificate of need laws. In states that also have certificate of need programs, the licensure requirements are separate and in addition to the need for certificates of need. In response to the COVID-19 pandemic, federal and state governmental agencies implemented a number of temporary measures, including waivers and modifications to existing facility certification, licensing and certificate of need rules and regulations. These temporary measures generally lasted only during the existence of the COVID-19 public health emergency. The federal public health emergency declared by the U.S. Department of Health and Human Services (HHS) as a result of the COVID-19 pandemic expired May 11, 2023. To the extent we relied on these waivers or modifications, in certain circumstances we could be forced to either obtain new, permanent certifications, licenses or certificates of need for certain health care centers, renal diagnostic support businesses and laboratories to continue operating them in the manner we have during the public health emergency, or we could be forced to change our operations if we are no longer able to rely on these modifications or waivers.
Non-U.S.
We are subject to a broad spectrum of regulation in almost all countries. Our operations must comply with various environmental and transportation regulations in the various countries in which we operate. Our manufacturing facilities and dialysis clinics are also subject to various standards relating to, among other things, facilities, management, personnel qualifications and licensing, maintenance of proper records, equipment, quality assurance programs, the operation of pharmacies, the protection of workers from blood-borne diseases and the dispensing of controlled substances. All of our operations may be subject to periodic inspection by various governmental authorities to determine if the operations, premises, equipment, personnel and patient care meet applicable standards. Our dialysis clinic operations and our related activities generally require licenses, which may be subject to periodic renewal and may be revoked for violation of applicable regulatory requirements.
68
In addition, many countries impose various investment restrictions on foreign companies. For instance, government approval may be required to enter into a joint venture with a local partner. Some countries do not permit foreign investors to own a majority interest in local companies or require that companies organized under their laws have at least one local shareholder. Investment restrictions may therefore affect the operating procedures and other characteristics of our subsidiaries and joint ventures in these and other countries.
We believe our facilities are currently in compliance in all material respects with the applicable national and local requirements in the jurisdictions in which they operate.
Reimbursement
As a global company delivering health care and dialysis products, we are represented in around 150 countries worldwide. Consequently, we face the challenge of addressing the needs of a wide variety of stakeholders, such as patients, customers, payors, regulators and legislators in very different economic environments and health care systems.
Health care systems and reimbursement structures for ESRD treatment vary significantly by country. In general, the government (in some countries in coordination with private insurers) or social and private insurance programs pay for health care. Funding is achieved through taxes and other sources of government income, from social security contributions, or a combination of those sources. However, not all health care systems provide for dialysis treatment. In some developing countries, only limited subsidies from government, social insurances or charitable institutions are available, and typically dialysis patients must personally finance all or a substantial share of the treatment cost. Irrespective of the funding structure, in some countries patients needing dialysis do not receive treatment on a regular basis but rather only when financial resources allow.
U.S.
Our dialysis clinics provide outpatient hemodialysis treatment and related services for ESRD patients. In the U.S., Medicare pays as the primary insurer for Medicare-eligible individuals under many circumstances. Some patients pay for their health care services primarily through commercial insurance coverage. For Medicare primary patients, Medicare pays 80% of the prospective payment amount for the ESRD Prospective Payment system items and services. The beneficiary or third-party insurance payors (including employer-sponsored health insurance plans, commercial insurance carriers, including Medicare Advantage, Medicaid Risk plans and the Medicaid program) on behalf of the beneficiary are responsible for paying the beneficiary’s cost-sharing obligations (typically an annual deductible and 20% co-insurance), subject to the specific coverage policies of such payors. Each third-party payor, including Medicaid, makes payment under contractual or regulatory reimbursement provisions that may or may not cover the full 20% co-payment or annual deductible. Where the beneficiary has no third-party insurance or the third-party insurance does not fully cover the co-payment or deductible, the beneficiary is responsible for paying the co-payments or the deductible, which we frequently cannot fully collect despite collection efforts.
Medicare’s ESRD Prospective Payment System. Under the ESRD PPS, CMS reimburses dialysis facilities with a single payment for each dialysis treatment, inclusive of (i) all items and services included in the former composite rate, (ii) calcimimetics (as of January 1, 2021), oral vitamin D analogues, oral levocarnitine, ESAs and other ESRD-related pharmaceuticals (other than vaccines and oral-only drugs) furnished to ESRD patients that were previously reimbursed separately under Part B or Part D of the Medicare program, (iii) most dialysis-related diagnostic laboratory tests and (iv) certain other items and services furnished to individuals for the treatment of ESRD.
Payment rates vary by both patient and facility. CMS subjects a base ESRD PPS payment rate to case-mix adjustments that take into account individual patient characteristics (e.g., age, body surface area, body mass) and certain co-morbidities. The base payment rate is also adjusted for (i) certain high cost patient outliers reflecting unusual variations in medically necessary care, (ii) disparately high costs incurred by low volume facilities relative to other facilities, (iii) provision of home dialysis training and (iv) wage-related costs in the geographic area in which the provider is located. The Protecting Access to Medicare Act of 2014 (PAMA) provides that rates will be updated by the market basket rate of increase net of multifactor productivity adjustment. The ESRD PPS also provides for: (i) a training add-on payment for home and self-dialysis modalities, (ii) a transitional drug add-on payment adjustment (TDAPA), (iii) a transitional add-on payment adjustment for new and innovative equipment and supplies (TPNIES), and (iv) beginning in 2024, a 3-year post-TDAPA base rate adjustment period to temporarily account for the cost and utilization of drugs covered by TDAPA payments.
69
On November 1, 2024, CMS issued a final rule for the ESRD PPS rate for calendar year (CY) 2025 which CMS anticipates will result in an increase in total payments to ESRD facilities of 2.7%. The 2.7% increase reflects a 1.0% increase in the base rate per treatment to $273.82, plus additional adjustments for inflation and productivity (as mandated by the ACA) and wage index budget neutrality adjustments. CMS notes that the 1.0% target for ESRD outlier payments was achieved in CY 2023 and expects such payments to represent approximately 1% of the total in CY 2025. Additionally, CMS finalized an additional $0.4601 be added to the base rate to account for Korsuva™, a prescription medication used for the treatment of moderate-to-severe pruritus associated with CKD for adults undergoing hemodialysis. The final Acute Kidney Injury payment rate for CY 2025 is equal to the CY 2025 ESRD PPS base rate. In addition, the final rule confirmed that, effective January 1, 2025, oral only drugs (including phosphate binders) would be reimbursed under the ESRD PPS using the TDAPA, as provided in the CY 2016 ESRD PPS final rule (80 FR 69027) and subsequent rules, and would no longer be paid for under Medicare Part D, which could have an adverse effect on our business, financial condition and results of operations in future periods. To account for operational costs related to ESRD facilities providing phosphate binders, CMS will provide an additional $36.41 monthly increase to the TDAPA.
Sequestration of Medicare payments. On August 2, 2011, the BCA was enacted, raising the U.S. debt ceiling and putting into effect a series of actions for deficit reduction. The BCA, in effect, required automatic across-the-board spending cuts for most government programs over nine fiscal years (2013-2021); these cuts were projected to total $1.2 trillion. The first cuts for Medicare payments to providers and suppliers were initially implemented on April 1, 2013. As a result of subsequent legislation, these cuts have been extended through FY 2032. Under the BCA, as amended, the reduction in Medicare payments to providers and suppliers (the U.S. Sequestration) is limited to one adjustment of no more than 2% in each year through 2031, and in 2032 there will be an adjustment of 2% for the first half of FY 2032, dropping to 0.0% for the second half of FY 2032. The U.S. Sequestration is independent of Medicare’s annual inflation update mechanisms, such as the market basket update pursuant to the ESRD PPS.
PAMA also included a provision addressing ESRD-related drugs with only an oral form, which are referred to as “oral-only” drugs and which have been paid separately. In the future, these drugs are expected to be reimbursed under the ESRD PPS, and the Secretary of Health and Human Services is expected to adjust the ESRD PPS payment rates to reflect the additional cost to dialysis facilities of providing these medications. Subsequently, the Achieving a Better Life Experience Act of 2014 delayed inclusion of oral-only drugs in the ESRD PPS until January 1, 2025.Under the CY 2025 ESRD PPS Final Rule, oral-only drugs were incorporated into the ESRD PPS bundled payment effective January 1, 2025, and reimbursed using TDAPA.
In a final rule published on November 6, 2015, CMS provided for implementation of the PAMA oral-only provision. CMS clarified that once the FDA approves any non-oral ESRD-related drug in a category previously considered oral only, such category of drugs will cease to be considered oral only. However, for at least two years, CMS planned to for both oral and non-oral versions of the drug using a TDAPA. During this transition period, CMS planned to not pay outlier payments for these drugs, but the agency will collect data reflecting utilization of both the oral and injectable or intravenous forms of the drugs, as well as payment patterns, in order to help determine how to appropriately adjust the ESRD PPS payment rate as these drugs are included in the payment bundle. At the end of this transition period, CMS will incorporate payment for the oral and non-oral versions of the drug in the ESRD PPS payment rates, utilizing a public rulemaking process, as CMS did in the CY 2021 final rule for calcimimetics.
Revisions to Medicare’s Physician Fee Schedule. The Medicare and CHIP Reauthorization Act of 2015 (MACRA) removed the periodic threat of substantial reductions in payment rates under the Physician Fee Schedule (PFS) that could have, if they had been permitted to take effect, significantly affected our businesses and those of our affiliated physicians. MACRA permanently removed the “sustainable growth rate” provision and in its place specified modest increases in PFS payment rates for the next several years. MACRA creates an elaborate scheme of incentive payments and penalty adjustments starting in 2019 based on 2017 physician performance as reflected in various measures of cost, use of health information technology, practice improvement activities, and quality of care and on possible participation in “advanced alternative payment models,” such as some accountable care organizations. We cannot predict whether this scheme is likely to have material effects on our revenues and profitability in our nephrology, urgent care, vascular, cardiovascular and endovascular specialty services. Through an annual rule-making cycle, CMS revises PFS payment rates to account for across-the-board updates as well as, from time to time, changes in the evaluation of physician work and practice expenses used to set rates for individual services paid under the PFS. While impacts of large changes are usually spread out over several years, such changes have the potential to affect the rates for specific services that are extensively furnished in our physician businesses and hence to affect materially the revenues of those businesses.
70
On November 1, 2024, CMS announced the CY 2025 final rule for hospital outpatient and ambulatory surgery center (ASC) payment systems. The final rule updates the ASC payment system for CY 2025 to generally increase the reimbursement rates for the range of procedures provided in an ASC. The average increase is 2.9% compared to the prior year. On November 1, 2024, CMS also issued the final Physician Fee Schedule for CY 2025. The CY 2025 Physician Fee Schedule conversion factor is $32.35, a decrease of $0.94 (or 2.8%) from the CY 2024 conversion factor of $33.29.
ESRD PPS quality incentive program. The ESRD PPS’s Quality Incentive Program (QIP) affects Medicare payments based on performance of each facility on a set of quality measures. Based on a prior year’s performance, dialysis facilities that fail to achieve the established quality standards have payments for a particular year reduced by up to 2 percent. CMS updates the set of quality measures each year, adding, revising or retiring measures.
Under the ESRD QIP, CMS assesses the total performance of each facility on a set of quality measures specified per payment year and applies up to a 2% payment reduction to facilities that do not meet a minimum total performance score. In the CY 2025 final rule, and effective January 1, 2025, CMS replaced the Kt/V Dialysis Adequacy Comprehensive clinical measure with a Kt/V Dialysis Adequacy measure topic, which is comprised of four individual Kt/V measures and scored based on a separate set of performance standards for each of those measures. CMS also removed the National Healthcare Safety Network Dialysis Event reporting measure from the ESRD QIP measure set beginning with PY 2027. In addition, new QIP requirements that facilities perform screening for social drivers of health began in 2025.
ACA provides for broad health care system reforms, including (i) provisions to facilitate access to private health insurance, (ii) expansion of the Medicaid program, (iii) industry fees on device and pharmaceutical companies based on sales of brand name products to government health care programs, (iv) increases in Medicaid prescription drug rebates, (v) commercial insurance market reforms that protect consumers, such as bans on lifetime and annual limits, coverage of pre-existing conditions, and limits on waiting periods, (vi) provisions encouraging integrated care, efficiency and coordination among providers (vii) provisions for reduction of health care program waste and fraud and (viii) a 2.3% excise tax on manufacturers’ medical device sales starting in 2013. However, pursuant to the Consolidated Appropriations Act of 2016, enacted December 18, 2015, the medical device excise tax was suspended for all sales of such devices in 2016 and 2017. On January 22, 2018, Congress passed a continuing resolution that further extended this moratorium for 2018 and 2019. In December 2019, Congress passed, and President Trump signed, a full FY 2020 domestic appropriations package that permanently repeals the medical device tax. In 2017, Congress considered legislation to “repeal and replace” ACA and may return to these issues in the future. The Biden administration did not support policies that it viewed as undermining ACA access, coverage and payment provisions and issued an executive order to review and examine policies or practices that may undermine the health insurance marketplace or the individual, small group, or large group markets for health insurance in the U.S., the Trump administration has rescinded that executive order and it is currently unclear what policies or practices may be introduced under the current administration.
ACA includes a provision referred to as the individual mandate that requires most U.S. citizens and noncitizens to have health insurance that meets certain specified requirements or be subject to a tax penalty. On December 22, 2017, sweeping changes to the U.S. Tax Code were signed into law. Among the provisions included in the law was an amendment to this ACA provision that reduced to zero the excise tax penalty imposed on individuals who do not obtain minimum essential health care coverage. The provision became effective in 2019. The Congressional Budget Office estimated in November of 2017 that elimination of the mandate had the potential to decrease the number of individuals with health insurance by approximately 4 million in 2019 and premiums were likely to increase because healthier individuals were likely to opt out of paying for health insurance without the influence of a penalty. On February 26, 2018, the Texas and Wisconsin Attorneys General, leading a 20-state coalition, filed a lawsuit challenging the constitutionality of the ACA in the Northern District of Texas titled Texas and Wisconsin, et al v. United States, et al (N.D. Tex). The plaintiffs argued that because the amendment “renders legally impossible the Supreme Court’s prior savings construction of the Affordable Care Act’s core provision – the individual mandate – the Court should hold that the ACA is unlawful and enjoin its operations.” On December 14, 2018, the Court granted a partial summary judgment finding the individual mandate unconstitutional and the remaining provisions of the ACA inseparable, and therefore invalid, and granted the plaintiffs’ claim for declaratory relief in Count 1 of the amended complaint. On December 30, 2018, the Court issued a final judgment on Count 1, which enabled the decision to be appealed. In December 2019, a three-judge panel from the U.S. Court of Appeals for the Fifth Circuit affirmed a district court ruling that found the individual mandate to be unconstitutional because it can no longer be read as a tax, and there is no other constitutional provision that justifies this exercise of congressional power. The Supreme Court issued an opinion in the case, California v. Texas v. Azar , on June 17, 2021 denying the plaintiffs’ constitutional challenge to the ACA on the grounds that they lacked standing.
71
Pharmaceuticals. We participate in the federal Medicaid rebate program established by the Omnibus Budget Reconciliation Act of 1990, as well as other government reimbursement programs including Medicare Part D Gap, TriCare and state pharmacy assistance programs established according to statutes, government regulations and policy. We make our pharmaceutical products available to authorized users of the Federal Supply Schedule (FSS) of the General Services Administration under an FSS contract negotiated by the Department of Veterans Affairs. Under our license to market and distribute the intravenous iron medication Venofer ® to freestanding dialysis clinics, we also are considered, for statutory price reporting purposes, to be the manufacturer of Venofer ® (when sold by us under one of our national drug codes (NDCs)), which is reimbursed under Part B of the Medicare program. Our products are also subject to a federal requirement that any company participating in the Medicaid rebate or Medicare program charge prices to Medicare comparable to the rebates paid by State Medicaid agencies on purchases under the Public Health Services (PHS) pharmaceutical pricing program managed by the Department of Health and Human Services (also known as the “340B program” by virtue of the section of the Public Health Service Act that created the program). The PHS pricing program extends these deep discounts on outpatient drugs to a variety of community health clinics and other entities that receive health services grants from the PHS, certain “look alikes,” as well as various other providers. ACA expanded the 340B program to include additional providers.
Under the Medicaid rebate program, we pay a rebate to each state Medicaid program based upon sales of our covered outpatient drugs that are separately reimbursed by those programs. ACA increased the minimum federal Medicare rebate percentages, effective January 1, 2010. Rebate calculations and price reporting rules are complex and, in certain respects, subject to interpretations of law, regulation, or policy guidance by us, government or regulatory agencies and the courts. The Medicaid rebate amount is computed each quarter based on our submission to CMS of our current Average Manufacturer Price and Best Price for our pharmaceutical products. The Veterans Health Care Act imposes a requirement that the prices we charge to certain federal entities under the FSS must be no greater than the Federal Ceiling Price, which is determined by applying a statutory discount to the average price charged to non-federal customers through wholesalers. Because the amount the government pays to reimburse the cost of a drug under Part B of the Medicare program is ordinarily based on the drug’s average sales price (ASP), additional price calculation and reporting obligations are imposed on the manufacturers of Part B drugs under that program (to the extent these manufacturers participate in the Medicaid rebate program, from which an obligation to report Part B drug prices flows). Since Venofer ® is covered under Part B, we are responsible for compiling and utilizing a wide range of sales data elements to determine the ASP of Venofer ® marketed under our NDCs and reporting it to CMS. The Medicare ESRD PPS system incorporates payment for Venofer ® at dialysis facilities.
Government agencies may make changes in program interpretations, requirements or conditions of participation, and retain the right to audit the accuracy of our computations of rebates and pricing, some of which may result in implications (such as recoupment) for amounts previously estimated or paid which may have a material adverse effect on our operating results.
Laboratory tests . Spectra obtains a portion of its revenue from Medicare, which pays for clinical laboratory services provided to dialysis patients in two ways. Payment for most tests is included in the ESRD PPS bundled rate paid to dialysis clinics. The dialysis clinics obtain the laboratory services from laboratories and pay the laboratories for the services. In accordance with industry practice, Spectra usually provides such testing services under capitation agreements with its customers pursuant to which it bills a fixed amount per patient per month to cover the laboratory tests included in the ESRD PPS rate designated in the capitation agreement. Second, the few laboratory tests performed by Spectra for Medicare beneficiaries that are not included in the ESRD PPS bundled rate are billed separately to Medicare. Such tests are paid at 100% of the payment amounts on Medicare’s Clinical Laboratory Fee Schedule (CLFS), although payment rates are further reduced by a 2% sequestration adjustment that remains in place until further notice.
PAMA required CMS to substantially revise how payment rates are determined under the CLFS. The new rates, effective January 1, 2018, were determined based on the median of rates paid by private payors for these tests in the period before the new rates took effect. The new rates are effective for most tests for a three-year period, with no updates during that period for inflation or other factors. PAMA provided that rate declines were limited to 10% in each of the first three years. The Further Continuing Appropriations and Other Extensions Act of 2024 is the latest in a series of legislation which extended the phase-in of payment reductions. There is no reduction for 2021-2024 and payment may not be reduced by more than 15% from 2025 through 2027. CMS will collect private payor data and calculate new payment rates every 3 years, which will resume after the next reporting period in 2025. Payment rates for the majority of tests paid on the CLFS were reduced under PAMA. These declines are not expected to directly affect Spectra’s principal source of revenue, payments from dialysis facilities for laboratory tests included in the ESRD PPS. We cannot predict whether Spectra may witness indirect effects in future years as the laboratory industry and its customers adjust to the new CLFS rates.
Coordination of benefits. Medicare entitlement begins for most patients at least three months after the initiation of chronic dialysis treatment at a dialysis center. During the first three months, considered to be a waiting period, the patient or patient’s insurance, Medicaid or a state renal program is generally responsible for payment.
72
Patients who are covered by Medicare and are also covered by an EGHP are subject to a 30-month coordination period during which the EGHP is the primary payor and Medicare the secondary payor. During this coordination period, the EGHP pays a negotiated rate or in the absence of such a rate, our standard rate or a rate defined by its plan documents. The EGHP payments are generally higher than the Medicare payment. EGHP insurance, when available, will therefore generally cover as the primary payor for a total of 33 months, including the 3-month waiting period plus the 30-month coordination period. Any significant decreases in EGHP reimbursement rates could have material adverse effects on our provider business and, because the demand for our products is affected by provider reimbursement, on our products business.
Participation in new Medicare payment arrangements. For information on our value-based agreements and health insurance products, see “- Business Overview - Other health care services - Value and risk-based care programs,” above.
Executive order-based models. On July 10, 2019, an Executive Order on advancing kidney health was signed in the United States. Among other things, the order instructed the Secretary of the HHS to develop new Medicare payment models to encourage identification and earlier treatment of kidney disease as well as increased home dialysis and transplants. One of those models, for which the rule was finalized on September 29, 2020 and later amended through finalized changes on October 29, 2021, the ETC model, is a mandatory model that creates financial incentives for home treatment and kidney transplants with a start date in January 2021 and ending in June 2027. This model applies both upside and downside payment adjustments to claims submitted by physicians and dialysis facilities for certain Medicare home dialysis patients over the span of six and one-half years. Participants in this model are based on a random selection of 30% of the Hospital Referral Regions. As of December 31, 2024, 975 of our U.S. dialysis facilities, representing approximately 35% of our U.S. dialysis facilities, are within the random selection of Hospital Referral Regions and therefore are in areas selected for participation in the model. An initial upside-only payment, Home Dialysis Payment Adjustment (HDPA), was applied for the first three years of the model, beginning in January 2021, in decreasing payment adjustments ranging from 3% in the first HDPA payment year, to 2% in the second HDPA payment year, and to 1% in the final HDPA payment year. This model also includes a Performance Payment Adjustment (PPA) beginning in July 2022. PPA payments will be a combined calculation of home dialysis (home, self-dialysis and nocturnal in-center) and transplant (living donor transplants and transplant waitlist) rates based upon a participant’s historic performance and/or increasingly weighted benchmark data from comparison geographic areas. CMS utilizes a two-tiered approach in PPA scoring to stratify participants with a high volume of beneficiaries who are dual-eligible for Medicare and Medicaid or Low Income Subsidy recipients. Possible PPA payment adjustments increase over time and ranged from (5%) to 4% in the first PPA payment year (beginning July 2022) for both physicians and facilities and will increase to (9%) and 8% for physicians and (10%) and 8% for facilities in the final PPA payment year (ending in June 2027).
On October 31, 2022, CMS finalized refinements to the ETC model, including a change to the improvement in scoring methodology and a change to the requirements related to flexibilities regarding furnishing and billing kidney disease patient education services under the ETC model. CMS also discussed its intent to publish participant-level performance data. These changes did not result in additional estimated savings to the Medicare program. At this time, our payment adjustments from the ETC model have resulted in a net positive adjustment.
Pursuant to the Executive Order, the Secretary of HHS also announced voluntary payment models, Kidney Care First (KCF) and CKCC models (graduated, professional and global), which aim to build on the existing Comprehensive ESRD Care model. These voluntary models create financial incentives for health care providers to manage care for Medicare beneficiaries with CKD stages 4 and 5 and with ESRD, to delay the start of dialysis, and to incentivize kidney transplants. The voluntary models allow health care providers to take on various amounts of financial risk by forming an entity known as a KCE. Two options, the CKCC global and professional models, allow renal health care providers to assume upside and downside financial risk. A third option, the CKCC graduated model, is limited to assumption of upside risk, but is unavailable to KCEs that include large dialysis organizations such as the Company. Under the global model, the KCE is responsible for 100% of the total cost of care for all Medicare Part A and B services for aligned beneficiaries, and under the professional model, the KCE is responsible for 50% of such costs. As of December 31, 2024, we participated in 23 KCEs, 20 of which began assuming financial risk within the first performance year on January 1, 2022, while 4 began assuming financial risk within the second performance year on January 1, 2023 and one KCE ended performance during the year. The CKCC model is expected to run through 2026. In October 2024, CMS released the performance scores for 2022 participants in which the majority of the KCEs organized by Interwell Health, our value and risk-based care subsidiary, qualified as high performers in various quality metrics. As of December 2024, approximately 54,000 patients were aligned to KCEs in which we participated.
73
Federal surprise billing statute and regulations. The No Surprises Act was enacted on December 27, 2020 as part of the 2021 Budget Act. The No Surprises Act aims to address surprise, balance billing to patients at the national level (many states already had laws regulating balance billing). Effective January 1, 2022, the legislation limits patient payment responsibility for certain unavoidable out-of-network services, prohibits certain providers and facilities (not including dialysis facilities) from balance billing patients for those services, establishes price transparency disclosure requirements for providers and insurers and mandates creation of dispute resolution processes for patients, providers and insurers to address unanticipated medical bills. The Department of Labor, HHS and the Department of the Treasury have collectively issued several Final Rules to implement the requirements of the statute. The statute and regulations have only limited applicability to our business: our ASCs and certain providers of services ancillary to ASC services (such as anesthesia) are subject to certain requirements of the statute and regulations; and our dialysis facilities are subject to certain requirements of the statute and regulations with respect to price transparency for individuals who are uninsured or “self-pay” (i.e., individuals who plan to pay out of pocket without using insurance).
Possible changes in statutes or regulations. Further federal or state legislation or regulations may be enacted in the future that could substantially modify or reduce the amounts paid for services and products offered by us and our subsidiaries and/or implement new or alternative payment models for dialysis that could present more risk sharing for dialysis clinics. For example, ballot initiatives introduced at the state level which could further regulate clinic staffing requirements, state inspection requirements and commercial reimbursement rates. Additionally, in response to the COVID-19 pandemic, the federal and state governments implemented wide-ranging, temporary measures that have affected the regulatory and legal landscape in which we operate. These measures included temporary waivers and modifications to certain statutes, regulations, government reimbursement and funding programs and the governments’ enforcement priorities. While the public health emergency has ended, certain of the emergency measures such as certain telehealth services remain in effect.
Non-U.S.
A country’s approach to reimbursement and market pricing is markedly influenced by the type of health care funding system it employs. In the major European and British Commonwealth countries, health care systems are generally based on one of two funding models. The health care systems of countries such as Germany, France, Belgium, Austria, Czech Republic and Poland are based on the Bismarck-type system; where mandatory employer and employee contributions dedicated to health care financing are required. Countries such as the United Kingdom, Canada, Denmark, Finland, Portugal, Sweden and Italy established their national health services using the Beveridge-type system, which provides a national health care system financed by taxes. However, during the last decade, health care financing under many social security systems has also been significantly subsidized with tax money.
In the Asia-Pacific region, Universal Health Care (UHC) is at varying stages of implementation and, as such, reimbursement mechanisms may vary significantly between countries (including variances at the state, provincial or city level). Tax-based health care funding systems are mostly seen in New Zealand, Malaysia and Thailand where governments have more direct levers to manage the provision of health care. Other countries, such as Japan and South Korea, finance health care through social health insurance mandating citizens to make contributions into a pooled fund. In Taiwan, dialysis costs for all patients with ESRD are reimbursed by national health insurance, with the government covering premiums in the case of low-income citizens. Singapore has a multi-tier system with mandatory medical savings account alongside means-tested subsidies to cover catastrophic illnesses. Indonesia and India continue their effort to achieve UHC amidst system challenges.
India has a fragmented and complex payer landscape involving both government and private payors. Out-of-pocket expenses remain a large contribution of the overall health care expenditure in the country. The Pradhan Mantri National Dialysis Programme launched the Ayushman Bharat Yojana, a national health insurance scheme aimed at providing free access to health care for low-income earners, in 2018. Coverage is expanding, but payors and providers are also increasingly implementing cost containment strategies across the region to manage the rising demand for health care. On September 11, 2024, the prime minister approved a major expansion of the Ayushman Bharat Pradhan Mantri Jan Arogya Yojana (AB PM-JAY), whereby all senior citizens aged 70 and above will receive health coverage regardless of their income. South Korea has a universal national health insurance system with a fee-for-service payment scheme in place based on employee taxes, government subsidies, tobacco surcharges and other contributions. For dialysis specifically, a 9:1 ratio exists where the insurance scheme covers 90% of the dialysis costs and 10% must be paid by the patient out-of-pocket.
74
China has achieved UHC by establishing a tiered health care system nationwide and a multi-layer medical insurance system (MLMIS) covering approximately 95% of its population. For the MLMIS, the main coverage scheme is Basic Medical Insurance (BMI) composed of employees’ BMI and residents’ BMI (the basic insurance every citizen receives independent of employment status), administrated by the National Healthcare Security Administration (NHSA). The system includes reimbursement for drugs listed in the National Reimbursement Drug List (NRDL) and partial medical services listed in the National Basic Medical Insurance Diagnostic and Treatment Programs.
For employees’ BMI, the pooled funds come from employer contribution and employee payroll tax and is much more prominent than the contribution of the residents’ BMI, leading to more comprehensive health care coverage.
For residents’ BMI, the NHSA merged the insurance schemes for urban and rural residents at the national level in 2019 and began applying the terminology of “basic medical insurance for urban and rural residents” as one statistical item in the NHSA annual report. However, the threshold and compensation level remain different between urban and rural residents.
Given the large geographical disparity in terms of economic development and BMI pooled funds, the specific reimbursement policies issued by local Health Security Administration vary, although general guidance of the NHSA is followed.
Similarly to national standards of health care coverage and reimbursement, there is a clear trend for volume-based procurement of medical technologies.
In the Latin America region, health care systems are funded by public payors, private payors or a combination of both. For countries such as Argentina, Brazil, Chile, Colombia, Curaçao, Ecuador, Guatemala and Peru, UHC covers ESRD for all citizens, funded by employers as well as individual compulsory contributions. In general, UHC is not yet fully implemented. Private insurers complement health care coverage, particularly in Argentina, Brazil and Colombia, and may be preferred by patients for a better quality of treatment or convenience. For those countries in Latin America in which we operate, with the exception of Chile, Curaçao, Ecuador and Peru where rates may vary depending upon payors, reimbursement rates are independent of treatment modality. Each payor (public or private) defines its own tariff, subject to a yearly revision to restore the value eroded by inflation. In Colombia, competition bids for lower prices without regard to adjusted tariffs and in Brazil, where public payors represent more than 80% of the share, inflation adjustments for dialysis care services are not often received. For information regarding our divestitures of businesses in certain Latin American countries, see note 5 e) of the notes to our audited consolidated financial statements included in this report.
Remuneration for ESRD treatments widely differs between countries but there are three broad types of reimbursement modalities: global budget, fee-for-service reimbursement and a bundled payment or capitation rate paid at predetermined periods. In some cases, reimbursement modalities may also vary within the same country depending on the type of health care provider (public or private). Budget allocation is a reimbursement modality used mainly for public providers in most European countries where the funding is based on taxation and in some of the countries where it is based on social security. Fee-for-service, which used to be the most common reimbursement modality for private providers in European and Asia-Pacific countries, is increasingly being replaced by periodic reimbursement bundles. These include different components of the ESRD treatment and level of payment is linked to certain quality parameters.
Additionally, in all countries, operations are increasingly subject to cost management strategies (also due to inflation) as a significant increase in logistic cost, personnel cost, raw materials and other costs are not fully reflected in reimbursement changes. Additionally, many health systems apply health technology assessments methods (a strict analysis on the entry of new products and services), which require additional data, reviews and administrative processes, all of which increase the complexity, timing and costs of obtaining reimbursement for products and services, simultaneously putting continuous downward pressure on available reimbursement. In June 2021, the EU approved the EU Health Technology Assessments Regulation which will fully enter into force in 2025 and is expected to unify and further reinforce the trend. In addressing these cost containment pressures, the Company is developing more expertise in the Health Economics, Market Access and Political Affairs fields in order to respond, counteract and proactively anticipate health system funding changes that impact our business. The main aim of this development is to demonstrate that our products and services create value for patients and for those who pay for health care. The Company advocates to encourage a long-term partnership for sustainable health care financing and value-based payment programs.
75
Generally, in European countries with established dialysis programs, reimbursements range from €70 to more than €400 per treatment. In Asia-Pacific and Latin America, reimbursement rates can be significantly lower. Where treatment is reimbursed on a fee-for-service basis, reimbursement rates are sometimes allocated in accordance with the type of treatment performed. However, because the services and costs that are reimbursed differ widely between countries, calculation of an average global reimbursement amount would likely bear little relation to the actual reimbursement system in any one country. Hence, country comparison will be relevant only if it includes an analysis of the cost components covered, including their individual costs, services rendered and the structure of the dialysis clinic in the countries being compared.
In light of the inflationary environment and geopolitical volatility, the medical device industry is facing significant cost increases which cannot be easily transferred as price increases to health care customers that need to operate under a fixed budget. Nevertheless, reimbursement and price increases have been acknowledged and granted in some health systems already and discussions are ongoing in most countries.
Anti-kickback statutes, False Claims Act, Stark Law and other fraud and abuse laws in the United States
Some of our operations are subject to federal and state statutes and regulations governing financial relationships between health care providers and potential referral sources and reimbursement for services and items provided to patients with Medicare, Medicaid and other types of U.S. Government and state government health insurance. Our operations are also subject to federal statutes that govern the relationships and assistance that we may provide to our patients. Such laws include the Anti-Kickback Statute, the False Claims Act, the Stark Law, the Civil Monetary Penalty Law and other federal health care fraud and abuse laws and similar state laws. The U.S. Government, many individual states and private third-party risk insurers have devoted increasing resources to combat fraud, waste, and abuse in the health care sector.
The Office of the Inspector General of HHS (OIG), state Medicaid fraud control units, and other enforcement agencies have dedicated substantial resources to their efforts to detect arrangements and practices that may violate fraud and abuse laws.
The government’s ability to pursue actions against potential violators has been enhanced over the past years, by expanding the government’s investigative authority, expanding criminal and administrative penalties, by increasing funding for enforcement and providing the government with expanded opportunities to pursue actions under the federal Anti-Kickback Statute, the False Claims Act, and the Stark Law. For example, the ACA narrowed the public disclosure bar under the False Claims Act, allowing increased opportunities for whistleblower litigation. In addition, the legislation modified the intent standard under the federal Anti-Kickback Statute, making it easier for prosecutors to prove that alleged violators had met the requisite knowledge requirement. The ACA and implementing regulations also require providers and suppliers to report any Medicare or Medicaid overpayment and return the overpayment on the later of 60 days of identification of the overpayment or the date the cost report is due (if applicable), or else all claims associated with the overpayment will become false claims. The ACA also provides that any claim submitted from an arrangement that violates the Anti-Kickback Statute is a false claim.
In late 2020, both CMS and the OIG issued final rules that implemented changes to the regulations for the Stark Law, Anti-Kickback statute and Civil Monetary Penalty Law. These rules were aimed at easing the burden of compliance and promoting coordinated care.
76
Health care reform
In response to increases in health care costs in recent years, there have been, and continue to be, proposals by the federal government, state governments, regulators and third-party payors to control these costs and reform the U.S. health care system. The ACA, enacted in 2010, contained broad health care system reforms, including (i) provisions to facilitate access to affordable health insurance for all Americans, (ii) expansion of the Medicaid program, (iii) an industry fee on pharmaceutical companies starting in 2011 based on sales of brand name pharmaceuticals to government health care programs, (iv) increases in Medicaid prescription drug rebates effective January 1, 2010, (v) commercial insurance market reforms that protect consumers, such as bans on lifetime and annual limits, coverage of pre-existing conditions, and limits on waiting periods, (vi) provisions encouraging integrated care, efficiency and coordination among providers (vii) provisions for reduction of health care program waste and fraud and (viii) a 2.3% excise tax on manufacturers’ medical device sales starting in 2013. However, pursuant to the Consolidated Appropriations Act of 2016, which was signed into law on December 18, 2015, the medical device excise tax was suspended for all sales of such devices in 2016 and 2017. On January 22, 2018, Congress passed a continuing resolution that further extended this moratorium for 2018 and 2019. In December 2019, Congress passed, and former President Trump signed, a full FY 2020 domestic appropriations package that permanently repeals the medical device tax. Throughout the years of the Obama Administration, the Republicans in Congress attempted on several occasions to repeal the ACA, recognizing that any such effort would be rejected by a Presidential veto. Similarly, during the 2016 Presidential campaign, President Trump called for a repeal and replacement of the ACA, though no legislation to repeal the ACA passed during his first term in office. In the 2020 Presidential campaign, President Biden called for further expansions of the ACA, the potential for a reduction in Medicare eligibility age, and a so-called “public option.” In 2021, Congress passed the America Rescue Plan which increased subsidies, called enhanced premium tax credits, to further decrease the cost of coverage. These enhanced subsidies are set to expire in December 2025 unless extended by Congress. We cannot predict what Congress or the second Trump administration will do.
In National Federation of Independent Business v. Sebelius, the U.S. Supreme Court affirmed the right of individual states to elect whether or not to participate in the ACA’s Medicaid expansion. As of November 2024, forty-one states (and the District of Columbia) elected to expand their programs. Because 10 states have so far declined to participate, the number of uninsured individuals is greater than originally expected when the ACA was passed. We cannot predict whether additional states will agree to participate in the expansion in future years, presuming that there is no change in the current law.
The first Trump administration and several states led by Republican Governors filed suit to challenge the constitutionality of the ACA and, in particular, its requirement that all U.S. citizens purchase health coverage, known as the “individual mandate.” In December 2019, a three-judge panel from the U.S. Court of Appeals for the Fifth Circuit affirmed a district court ruling that found the mandate to be unconstitutional because, after elimination of the excise tax penalty imposed on individuals who do not obtain minimum essential health care coverage, there is no other constitutional provision that justifies this exercise of congressional power. On June 17, 2021, the Supreme Court issued an opinion in the case, California v. Texas, upholding the ACA. For additional information, see “—Reimbursement – U.S. – ESRD PPS quality incentive program” above.
77
The first Trump administration initiated revisions to regulations and sub-regulatory guidance relating to implementation of various provisions of the ACA, with or without changes in legislation. Significantly, in October 2017, the first Trump administration announced that it would immediately cease paying CSR subsidies to insurers. These subsidies reduce deductibles, coinsurance and copayments for individuals and families at or below 250% of the federal poverty level. Under the law insurers are still mandated to provide lower out-of-pocket costs for low-income individuals; as a result, ending CSR payments has caused many insurers to increase premiums in the individual insurance market to offset the loss of the federal support. In its FY 2019, 2020 and 2021 budget proposals, the first Trump administration altered course and requested authority to fund CSR payments. None of the FY 2019, FY 2020, or FY 2021 CSR budget proposals were ultimately included in appropriations authorized by Congress. The Biden administration’s budget request to Congress for FY 2023 included appropriations for CSR payments, although the Consolidated Appropriations Act of 2023, which will fund the federal government during FY 2023, did not include specific CSR appropriations. While the Biden administration again requested appropriations for CSR payments in its FY 2024 budget request, Congress has yet to finalize any of its FY 2024 appropriations bills as of January 2024. Insurers have challenged the previous administration’s non-payment of CSR subsidies in litigation. On April 27, 2020, the Supreme Court issued its decision in Maine Community Health Options vs. United States, in which the Supreme Court held that the government was obligated to make full risk corridor payments. On August 14, 2020 the Court of Appeals for the Federal Circuit issued decisions in two cases ( Sanford Health Plan v. United States and Community Health Choice v. United States ) holding that the previous administration owed CSRs to health plans in 2017 and directed the Court of Federal Claims to decide the status of payments owed in 2018 and later, a process that is ongoing. On June 21, 2021, the Supreme Court denied petitions to review the decisions of the Court of Appeals for the Federal Circuit in these cases. On January 28, 2021, President Biden issued an Executive Order on Strengthening Medicaid and the Affordable Care Act, which directs the Secretaries of the Departments of Health and Human Services, Treasury and Labor to, among other things, review and examine policies or practices that may undermine the Health Insurance Marketplace or the individual, small group, or large group markets for health insurance in the U.S., policies or practices that may present unnecessary barriers to individuals and families attempting to access Medicaid or ACA coverage, and policies or practices that may reduce the affordability of coverage or financial assistance for coverage, including for dependents, and to “as soon as practicable, publish proposed rules suspending, revising or rescinding those agency actions inconsistent with the policy goal of protecting and strengthening Medicaid and the ACA and to make high-quality health care accessible and affordable for every American.” The Biden Executive Order suggested a reversal of the first Trump administration’s position with respect to CSR payments and the promotion of other financial supports to ensure high-quality affordable coverage options. It is uncertain what, if anything, President Trump will do regarding this matter during his second term.
On April 27, 2020, the Supreme Court ruled in Maine Community Health Options v. United States that the federal government must pay over $12 billion to health insurers that sold consumer policies on public exchanges and had claimed losses under the Risk Corridors Program established by the ACA. To encourage health insurers to participate in the public exchanges, the ACA created the Risk Corridors Program, a temporary framework to compensate insurers for unexpectedly unprofitable plans during the ACA’s first three years. Pursuant to a formula, insurers with profits exceeding a certain amount were required to pay to the government a portion of the excess profits, and insurers that experienced higher than expected loses would be reimbursed by the government. Rather than paying the amounts owed, Congress, through appropriations riders, prevented CMS from paying these amounts for each year of the program. In Maine Community Health Options, the Supreme Court held that, notwithstanding the appropriations riders, the government is required to pay the amounts owed to the participating insurers, which total over $12 billion.
In addition, further regulations may be promulgated in the future that could substantially change the Medicare and Medicaid reimbursement systems, or that could impose additional eligibility requirements for participation in the federal and state health care programs. Moreover, such regulations could alter the current responsibilities of third-party insurance payors (including employer-sponsored health insurance plans, commercial insurance carriers and the Medicaid program) including, without limitation, with respect to cost-sharing. Changes of this nature could have significant effects on our businesses, but, due to the continued uncertainty about the implementation of the ACA, including potential further legal challenges to or significant modifications to or repeal of that legislation , the outcomes and impact of such changes on our business, financial condition and results of operations are impossible to quantify or predict.
78
On February 12, 2021, the Biden administration issued a letter to states that received approvals to impose work requirements for Medicaid beneficiaries under Trump administration policy guidance, which the Biden administration has rescinded. The Biden administration informed these states of its intention to review all Medicaid work requirements, which were granted as waivers pursuant to Section 1115 of the Social Security Act, to assess whether the waivers may remain in place. Since this announcement, CMS has rescinded all previously issued Section 1115 waivers authorizing Medicaid work requirements. The first Trump administration had asserted that work requirements will help people lead healthier lifestyles. Opponents fear these requirements simply will lead to the poor and disabled losing health benefits, and that such requirements exacerbate the hardships resulting from increased unemployment during the COVID-19 pandemic. While the Biden administration made its policy against Medicaid work requirements clear, it is possible that future administrations will seek to grant Section 1115 waivers tied to work requirements. It is uncertain what, if anything, President Trump will do regarding this matter during his second term.
On March 31, 2023, the continuous Medicaid enrollment provision of the Families First Coronavirus Response Act (FFCRA) expired. This provision allowed Medicaid beneficiaries to maintain continuous coverage during the COVID-19 pandemic without affirmatively renewing coverage each year. Since the expiration of the continuous enrollment provision of the FFCRA, a number of states have disenrolled Medicaid beneficiaries who have not elected to renew their Medicaid enrollment. These actions by states have resulted in a large number of previous Medicaid beneficiaries losing coverage.
|
C. |
Organizational structure |
The following chart shows our organizational structure and our significant subsidiaries as of December 31, 2024. Fresenius Medical Care Holdings, Inc. conducts its business as “Fresenius Medical Care North America.” For additional discussion regarding the Company’s principal subsidiaries, see note 1 a) of the notes to our audited consolidated financial statements included in this report.
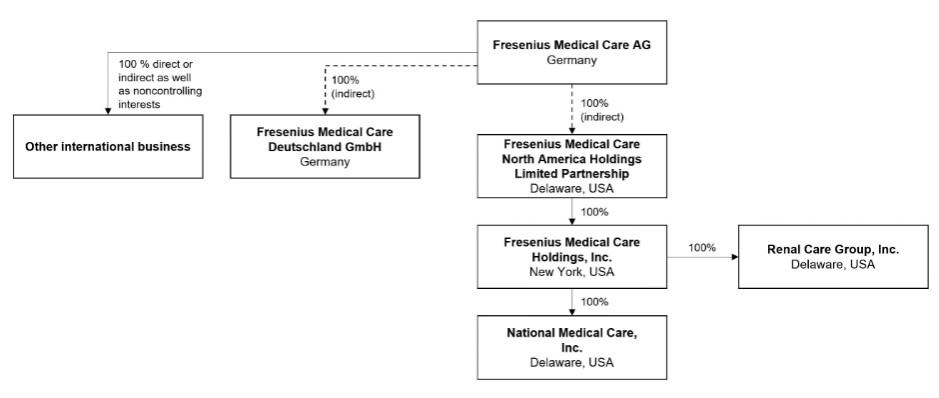
79
|
D. |
Property, plant and equipment |
Property
The table below describes our principal facilities. We do not own the land and buildings comprising our principal facilities in Germany. Rather, we lease those facilities on a long-term basis from Fresenius SE or one of its affiliates. These leases are described in note 6, “Related party transactions,” of the notes to the consolidated financial statements included in this report.
|
|
|
Floor area |
|
Currently |
|
|
|
|
|
|
|
(approximate |
|
owned or |
|
Lease |
|
|
|
Location |
|
square meters) |
|
leased |
|
expiration |
|
Use |
|
|
|
|
|
|
|
|
|
|
|
Suzhou, China (Changshu Plant) |
|
117,627 |
|
leased / owned |
|
August 2055 / December 2056 |
|
Manufacture of hemodialysis bloodline sets & AV Fistula set, HD dialyzer and peritoneal dialysis solutions |
|
|
|
|
|
|
|
|
|
|
|
St. Wendel, Germany |
|
113,285 |
|
leased |
|
December 2026 |
|
Manufacture of polysulfone membranes, dialyzers and peritoneal dialysis solutions; research and development |
|
|
|
|
|
|
|
|
|
|
|
Ogden, Utah,U.S. |
|
102,193 |
|
owned |
|
|
|
Manufacture of polysulfone membranes and dialyzers and peritoneal dialysis solutions; research and development |
|
|
|
|
|
|
|
|
|
|
|
Biebesheim / Gernsheim, Germany |
|
65,000 |
|
leased |
|
December 2026 / December 2028 |
|
Central distribution Europe, Asia-Pacific and Latin America |
|
|
|
|
|
|
|
|
|
|
|
L´Arbresle, France |
|
48,120 |
|
owned |
|
|
|
Manufacture of polysulfone dialyzers, special filters, dry & liquid hemodialysis concentrates, empty pouches, injection molding |
|
|
|
|
|
|
|
|
|
|
|
Schweinfurt, Germany |
|
38,100 |
|
leased |
|
December 2026 |
|
Manufacture of hemodialysis machines and peritoneal dialysis cyclers; research and development |
|
|
|
|
|
|
|
|
|
|
|
Fukuoka, Japan (Buzen Plant) |
|
37,092 |
|
owned |
|
|
|
Manufacture of peritoneal dialysis bags and dialyzers |
|
|
|
|
|
|
|
|
|
|
|
Bogota, Colombia |
|
37,979 |
|
owned |
|
|
|
Manufacture of dry and liquid concentrates, CAPD and APD bags, intravenous solutions, empty Biofine bags |
|
|
|
|
|
|
|
|
|
|
|
Waltham, Massachusetts,U.S. |
|
36,473 |
|
leased |
|
April 2029 |
|
Corporate headquarters and administration - U.S. |
|
|
|
|
|
|
|
|
|
|
|
Enstek, Malaysia |
|
28,778 |
|
owned |
|
|
|
Manufacture of peritoneal dialysis solutions and hemodialysis concentrate |
|
|
|
|
|
|
|
|
|
|
|
Fukuoka, Japan (Buzen Plant) |
|
27,943 |
|
owned |
|
|
|
Manufacture of peritoneal dialysis bags and dialyzers |
|
|
|
|
|
|
|
|
|
|
|
Knoxville, Tennessee,U.S. |
|
27,637 |
|
owned |
|
|
|
Manufacture of peritoneal dialysis solutions |
|
|
|
|
|
|
|
|
|
|
|
Palazzo Pignano, Italy |
|
27,435 |
|
owned |
|
|
|
Manufacture of bloodlines and tubing, office |
|
|
|
|
|
|
|
|
|
|
|
São Paulo, Brazil |
|
24,755 |
|
owned |
|
|
|
Manufacture of hemodialysis concentrate solutions, dry hemodialysis concentrates, peritoneal dialysis bags, intravenous solutions bags, peritoneal dialysis and blood lines sets and warehouse |
|
|
|
|
|
|
|
|
|
|
|
Guadalajara, México |
|
24,234 |
|
owned |
|
|
|
Manufacture of saline, sodium citrate and liquid acids |
|
|
|
|
|
|
|
|
|
|
|
Oita, Japan (Inukai Plant) |
|
24,084 |
|
owned |
|
|
|
Manufacture of fiber bundles |
|
|
|
|
|
|
|
|
|
|
|
Bad Homburg, Germany |
|
16,368 |
|
leased |
|
December 2026 /December 2029 |
|
Corporate headquarters and administration |
|
|
|
|
|
|
|
|
|
|
|
Antalya,Türkiye |
|
23,181 |
|
leased |
|
December 2024 / December 2037 |
|
Manufacture of bloodlines, warehousing and sterilization plant |
|
|
|
|
|
|
|
|
|
|
|
Tijuana, Mexico |
|
22,126 |
|
leased |
|
May 2029 / September 2026 |
|
Manufacturing of NxStage Medical, Inc. (NxStage) System One equipment and related disposables |
|
|
|
|
|
|
|
|
|
|
|
Southaven, Mississippi,U.S. |
|
19,666 |
|
leased |
|
November 2040 |
|
Clinical laboratory testing and administration |
|
|
|
|
|
|
|
|
|
|
|
Rockleigh, New Jersey,U.S. |
|
17,742 |
|
leased |
|
December 2028 |
|
Clinical laboratory testing and administration |
|
|
|
|
|
|
|
|
|
|
|
Reynosa, Mexico |
|
15,746 |
|
leased |
|
October 2027 |
|
Manufacture of bloodlines |
|
|
|
|
|
|
|
|
|
|
|
Vrsac, Serbia |
|
15,365 |
|
owned |
|
|
|
Administration, production and warehouse building |
|
|
|
|
|
|
|
|
|
|
|
Bad Homburg (OE), Germany |
|
10,300 |
|
leased / owned |
|
December 2026 |
|
Manufacture of hemodialysis concentrate solutions / technical services / logistics services |
We lease most of our dialysis clinics, manufacturing, laboratory, warehousing and distribution and administrative and sales facilities in the U.S. and other countries on terms which we believe are customary in the industry. We own those dialysis clinics and manufacturing facilities that we do not lease.
For information regarding our capital expenditures, see “Item 4.B. Business Overview – Capital Expenditures.”
Item 4A. Unresolved staff comments
Not applicable
80
Item 5. Operating and financial review and prospects
You should read the following discussion and analysis of the results of operations of the Company and its subsidiaries in conjunction with our historical consolidated financial statements and related notes contained elsewhere in this report. Some of the statements contained below, including those concerning future revenue, costs and capital expenditures and possible changes in our industry and competition and financial condition include forward-looking statements. We made these forward-looking statements based on the expectations and beliefs of management concerning future events which may affect us, but we cannot assure that such events will occur or that the results will be as anticipated. Because such statements involve risks and uncertainties, actual results may differ materially from the results which the forward-looking statements express or imply. Such statements include the matters and are subject to the uncertainties that we described in the discussion in this report entitled “Introduction - Forward-looking statements.” See also Item 3.D, “Key Information – Risk factors.”
Our business is also subject to other risks and uncertainties that we describe from time to time in our public filings. Developments in any of these areas could cause our results to differ materially from the results that we or others have projected or may project.
Our reported financial condition and results of operations are sensitive to accounting methods, assumptions and estimates that are the basis for our financial statements.
For information about our discretionary accounting policies and estimations, see note 2 of the notes to our consolidated financial statements included in this report. The critical accounting policies, judgments made in the creation and application of these policies, and sensitivities of reported results to changes in accounting policies, assumptions and estimates are factors to be considered along with our financial statements, and the discussion below in III. Results of operations, financial position and net assets - “Results of operations.”
|
I. |
Performance management system |
The Management Board oversees our Company by setting strategic and operational targets and measuring various financial key performance indicators used for internal management determined in euro based upon IFRS Accounting Standards and other measures, as described below.
The key performance indicators used for internal management are identical in the individual operating segments. Each operating segment is evaluated based on target figures that reflect the revenue and expenses they control. For a discussion of items that we believe are within or are outside of operating segment control, see “II. Financial condition and results of operations — Company Structure,” below).
Certain of the following financial measures and other financial information as well as discussions and analyses set out in this report include measures that are not defined by IFRS Accounting Standards (Non-IFRS Measures). We believe this information, along with comparable IFRS ® Accounting Standards financial measurements, is useful to our investors as it provides a basis for assessing our performance, payment obligations related to performance-based compensation, our compliance with covenants and enhanced transparency as well as comparability of our results. Non-IFRS financial measures should not be viewed or interpreted as a substitute for financial information presented in accordance with IFRS Accounting Standards.
Our presentation of some financial measures used in this report such as changes in revenue, operating income and net income attributable to shareholders of FME AG (or net income) includes the impact of translating local currencies to our reporting currency for financial reporting purposes. We calculate and present these financial measures using both IFRS Accounting Standards and at constant exchange rates in our publications to show changes in these metrics and other items without giving effect to period-to-period currency fluctuations. Under IFRS Accounting Standards, amounts received in local (non-euro) currency are translated into euro at the average exchange rate for the period presented. Once we translate the local currency for the constant currency, we then calculate the change, as a percentage, of the current period calculated using the prior period exchange rates versus the prior period. This resulting percentage is a Non-IFRS Measure referring to a change as a percentage at constant currency. These currency-adjusted financial measures are identifiable by the designated terms “Constant Exchange Rates” or “Constant Currency.”
The primary key performance indicators are presented both in accordance with IFRS Accounting Standards and at Constant Currency. Each of these indicators presented at Constant Currency is considered a non-IFRS measure. For the purposes of management compensation, these metrics are also benchmarked at the underlying exchange rates used in the calculation of our incentive compensation targets.
81
We believe that the measures at Constant Currency are useful to investors, lenders and other creditors because such information enables them to gauge the impact of currency fluctuations on our revenue, operating income, net income attributable to shareholders of FME AG and other items from period to period. In addition, under our long-term incentive plans, we measure the attainment of certain predetermined financial targets for revenue growth and net income growth in Constant Currency. However, we limit our use of Constant Currency period-over-period changes to a measure for the impact of currency fluctuations on the translation of local currency into euro. We do not evaluate our results and performance without considering both:
| (1) | period-over-period changes in revenue, operating income, net income attributable to shareholders of FME AG and other items prepared in accordance with IFRS Accounting Standards, and |
| (2) | Constant Currency changes in revenue, operating income, net income attributable to shareholders of FME AG and other items. |
We caution the readers of this report not to consider these measures in isolation, but to review them in conjunction with changes in revenue, operating income, net income attributable to shareholders of FME AG and other items prepared in accordance with IFRS Accounting Standards. We present the growth rate derived from non-IFRS measures next to the growth rate derived from IFRS Accounting Standards measures such as revenue, operating income, net income attributable to shareholders of FME AG and other items. As the reconciliation is inherent in the disclosure included within “Results of operations, financial position and net assets,” below, we believe that a separate reconciliation would not provide any additional benefit.
Financial performance indicators
Primary key performance indicators
Revenue and revenue growth
We use revenue and revenue growth as key performance indicators as we believe that the key to continue growing our revenue is to attract new patients and increase the number of treatments performed each year. The number of treatments performed each year is therefore an indicator of both the absolute amount of revenue as well as continued revenue growth. For further information regarding revenue recognition and measurement, refer to note 1 k) of the notes to the consolidated financial statements included in this report. Revenue and revenue growth are also benchmarked based on movement at Constant Exchange Rates (Non-IFRS Measures).
Operating income
Operating income is the most appropriate measure for evaluating the profitability of the operating segments and therefore is also a key performance indicator. Operating income is also benchmarked based on movement at Constant Exchange Rates (Non-IFRS Measure).
82
Secondary financial performance indicators
Return on invested capital (ROIC) (Non-IFRS Measure)
ROIC is the ratio of operating income, for the last twelve months, after tax (net operating profit after tax or NOPAT) to the average invested capital of the last five quarter closing dates, including adjustments for acquisitions and divestitures made during the last twelve months with a purchase price above a €50 M threshold, consistent with the respective adjustments made in the determination of adjusted EBITDA (earnings before interest, taxes, depreciation and amortization) below (see “Net leverage ratio (Non-IFRS Measure)”). Beginning in 2024, we further adjust ROIC for costs related to Legacy Portfolio Optimization incurred during the last twelve months to increase comparability of the underlying financial figures of certain Management Board compensation performance targets with the Company’s operating performance and to adequately recognize the actual performance of the members of the Management Board. ROIC expresses how efficiently we allocate the capital under our control or how well we employ our capital with regard to investment projects. The following tables show the reconciliation of average invested capital to total assets, which we believe to be the most directly comparable IFRS Accounting Standards financial measure, and how ROIC is calculated:
|
Reconciliation of average invested capital and ROIC (Non-IFRS Measure, unadjusted) |
||||||||||
|
in € M, except where otherwise specified |
|
|
|
|
|
|
|
|
|
|
|
|
|
December 31, |
|
September 30, |
|
June 30, |
|
March 31, |
|
December 31, |
|
2024 |
|
2024 |
|
2024 |
|
2024 |
|
2024 |
|
2023 |
|
Total assets |
|
33,567 |
|
32,511 |
|
33,896 |
|
34,336 |
|
33,930 |
|
Plus: Cumulative goodwill amortization and impairment loss (1) |
|
504 |
|
519 |
|
565 |
|
519 |
|
629 |
|
Minus: Cash and cash equivalents (1) |
|
(1,185) |
|
(1,387) |
|
(1,112) |
|
(1,192) |
|
(1,427) |
|
Minus: Deferred tax assets (1) |
|
(230) |
|
(296) |
|
(281) |
|
(279) |
|
(292) |
|
Minus: Accounts payable to unrelated parties (1) |
|
(906) |
|
(779) |
|
(793) |
|
(748) |
|
(775) |
|
Minus: Accounts payable to related parties |
|
(55) |
|
(73) |
|
(100) |
|
(110) |
|
(123) |
|
Minus: Provisions and other current liabilities (2) |
|
(2,803) |
|
(2,671) |
|
(3,062) |
|
(3,026) |
|
(2,936) |
|
Minus: Income tax liabilities (1) |
|
(222) |
|
(227) |
|
(189) |
|
(280) |
|
(231) |
|
Invested capital |
|
28,670 |
|
27,597 |
|
28,924 |
|
29,220 |
|
28,775 |
|
|
|
|
|
|
|
|
|
|
|
|
|
Average invested capital as of December 31, 2024 |
|
28,637 |
|
|
|
|
|
|
|
|
|
|
|
|
|
|
|
|
|
|
|
|
|
Operating income |
|
1,392 |
|
|
|
|
|
|
|
|
|
Income tax expense (3) |
|
(502) |
|
|
|
|
|
|
|
|
|
NOPAT |
|
890 |
|
|
|
|
|
|
|
|
|
Adjustments to average invested capital and ROIC |
||||||||||
|
in € M, except where otherwise specified |
|
|
|
|
|
|
|
|
|
|
|
|
|
December 31, |
|
September 30, |
|
June 30, |
|
March 31, |
|
December 31, |
|
2024 |
|
2024 |
|
2024 (4) |
|
2024 (4) |
|
2024 (4) |
|
2023 (4) |
|
Total assets |
|
— |
|
(38) |
|
(47) |
|
(622) |
|
(709) |
|
Plus: Cumulative goodwill amortization and impairment loss |
|
— |
|
(2) |
|
(2) |
|
(50) |
|
(84) |
|
Minus: Cash and cash equivalents |
|
— |
|
3 |
|
5 |
|
24 |
|
35 |
|
Minus: Deferred tax assets |
|
— |
|
2 |
|
2 |
|
3 |
|
10 |
|
Minus: Accounts payable to unrelated parties |
|
— |
|
2 |
|
2 |
|
13 |
|
12 |
|
Minus: Accounts payable to related parties |
|
— |
|
— |
|
— |
|
1 |
|
1 |
|
Minus: Provisions and other current liabilities (2) |
|
— |
|
8 |
|
7 |
|
29 |
|
39 |
|
Minus: Income tax liabilities |
|
— |
|
— |
|
— |
|
1 |
|
3 |
|
Invested capital |
|
— |
|
(25) |
|
(33) |
|
(601) |
|
(693) |
|
|
|
|
|
|
|
|
|
|
|
|
|
Adjustment to average invested capital as of December 31, 2024 |
|
(270) |
|
|
|
|
|
|
|
|
|
|
|
|
|
|
|
|
|
|
|
|
|
Adjustment to operating income (4) |
|
139 |
|
|
|
|
|
|
|
|
|
Adjustment to income tax expense (4) |
|
(50) |
|
|
|
|
|
|
|
|
|
Adjustment to NOPAT |
|
89 |
|
|
|
|
|
|
|
|
83
|
Reconciliation of average invested capital and ROIC (Non-IFRS Measure) |
||||||||||
|
in € M, except where otherwise specified |
|
|
|
|
|
|
|
|
|
|
|
|
|
December 31, |
|
September 30, |
|
June 30, |
|
March 31, |
|
December 31, |
|
2024 |
|
2024 |
|
2024 (4) |
|
2024 (4) |
|
2024 (4) |
|
2023 (4) |
|
Total assets |
|
33,567 |
|
32,473 |
|
33,849 |
|
33,714 |
|
33,221 |
|
Plus: Cumulative goodwill amortization and impairment loss (1) |
|
504 |
|
517 |
|
563 |
|
469 |
|
545 |
|
Minus: Cash and cash equivalents (1) |
|
(1,185) |
|
(1,384) |
|
(1,107) |
|
(1,168) |
|
(1,392) |
|
Minus: Deferred tax assets (1) |
|
(230) |
|
(294) |
|
(279) |
|
(276) |
|
(282) |
|
Minus: Accounts payable to unrelated parties (1) |
|
(906) |
|
(777) |
|
(791) |
|
(735) |
|
(763) |
|
Minus: Accounts payable to related parties |
|
(55) |
|
(73) |
|
(100) |
|
(109) |
|
(122) |
|
Minus: Provisions and other current liabilities (2) |
|
(2,803) |
|
(2,663) |
|
(3,055) |
|
(2,997) |
|
(2,897) |
|
Minus: Income tax liabilities (1) |
|
(222) |
|
(227) |
|
(189) |
|
(279) |
|
(228) |
|
Invested capital |
|
28,670 |
|
27,572 |
|
28,891 |
|
28,619 |
|
28,082 |
|
|
|
|
|
|
|
|
|
|
|
|
|
Average invested capital as of December 31, 2024 |
|
28,367 |
|
|
|
|
|
|
|
|
|
|
|
|
|
|
|
|
|
|
|
|
|
Operating income (4) |
|
1,531 |
|
|
|
|
|
|
|
|
|
Income tax expense (3), (4) |
|
(552) |
|
|
|
|
|
|
|
|
|
NOPAT |
|
979 |
|
|
|
|
|
|
|
|
|
|
|
|
|
|
|
|
|
|
|
|
|
ROIC in % |
|
3.5 |
|
|
|
|
|
|
|
|
|
Adjustments to average invested capital and ROIC (excluding Legacy Portfolio Optimization costs) |
|
|
|
in € M, except where otherwise specified |
|
|
|
|
|
December 31, |
|
2024 |
|
2024 |
|
Adjustment to operating income |
|
136 |
|
Adjustment to income tax expense |
|
80 |
|
Adjustment to NOPAT |
|
216 |
84
|
Reconciliation of average invested capital and ROIC (Non-IFRS Measure, excluding Legacy Portfolio Optimization costs) |
||||||||||
|
in € M, except where otherwise specified |
||||||||||
|
|
|
December 31, |
|
September 30, |
|
June 30, |
|
March 31, |
|
December 31, |
|
2024 |
|
2024 |
|
2024 (4) |
|
2024 (4) |
|
2024 (4) |
|
2023 (4) |
|
Total assets |
|
33,567 |
|
32,473 |
|
33,849 |
|
33,714 |
|
33,221 |
|
Plus: Cumulative goodwill amortization and impairment loss (1) |
|
504 |
|
517 |
|
563 |
|
469 |
|
545 |
|
Minus: Cash and cash equivalents (1) |
|
(1,185) |
|
(1,384) |
|
(1,107) |
|
(1,168) |
|
(1,392) |
|
Minus: Deferred tax assets (1) |
|
(230) |
|
(294) |
|
(279) |
|
(276) |
|
(282) |
|
Minus: Accounts payable to unrelated parties (1) |
|
(906) |
|
(777) |
|
(791) |
|
(735) |
|
(763) |
|
Minus: Accounts payable to related parties |
|
(55) |
|
(73) |
|
(100) |
|
(109) |
|
(122) |
|
Minus: Provisions and other current liabilities (2) |
|
(2,803) |
|
(2,663) |
|
(3,055) |
|
(2,997) |
|
(2,897) |
|
Minus: Income tax liabilities (1) |
|
(222) |
|
(227) |
|
(189) |
|
(279) |
|
(228) |
|
Invested capital |
|
28,670 |
|
27,572 |
|
28,891 |
|
28,619 |
|
28,082 |
|
|
|
|
|
|
|
|
|
|
|
|
|
Average invested capital as of December 31, 2024 |
|
28,367 |
|
|
|
|
|
|
|
|
|
|
|
|
|
|
|
|
|
|
|
|
|
Operating income (4) |
|
1,667 |
|
|
|
|
|
|
|
|
|
Income tax expense (3), (4) |
|
(472) |
|
|
|
|
|
|
|
|
|
NOPAT |
|
1,195 |
|
|
|
|
|
|
|
|
|
|
|
|
|
|
|
|
|
|
|
|
|
ROIC in % (excluding Legacy Portfolio Optimization costs) |
|
4.2 |
|
|
|
|
|
|
|
|
|
Reconciliation of average invested capital and ROIC (Non-IFRS Measure, unadjusted) |
||||||||||
|
in € M, except where otherwise specified |
|
|
|
|
|
|
|
|
|
|
|
|
|
December 31, |
|
September 30, |
|
June 30, |
|
March 31, |
|
December 31, |
|
2023 |
|
2023 |
|
2023 |
|
2023 |
|
2023 |
|
2022 |
|
Total assets |
|
33,930 |
|
35,635 |
|
34,960 |
|
35,501 |
|
35,754 |
|
Plus: Cumulative goodwill amortization and impairment loss |
|
629 |
|
703 |
|
644 |
|
640 |
|
645 |
|
Minus: Cash and cash equivalents (1) |
|
(1,427) |
|
(1,574) |
|
(1,363) |
|
(1,224) |
|
(1,274) |
|
Minus: Loans to related parties |
|
— |
|
— |
|
— |
|
— |
|
(1) |
|
Minus: Deferred tax assets (1) |
|
(292) |
|
(304) |
|
(314) |
|
(307) |
|
(313) |
|
Minus: Accounts payable to unrelated parties (1) |
|
(775) |
|
(762) |
|
(721) |
|
(822) |
|
(813) |
|
Minus: Accounts payable to related parties |
|
(123) |
|
(119) |
|
(140) |
|
(111) |
|
(138) |
|
Minus: Provisions and other current liabilities (2) |
|
(2,936) |
|
(3,235) |
|
(3,018) |
|
(3,007) |
|
(3,008) |
|
Minus: Income tax liabilities |
|
(231) |
|
(263) |
|
(230) |
|
(215) |
|
(171) |
|
Invested capital |
|
28,775 |
|
30,081 |
|
29,818 |
|
30,455 |
|
30,681 |
|
|
|
|
|
|
|
|
|
|
|
|
|
Average invested capital as of December 31, 2023 |
|
29,962 |
|
|
|
|
|
|
|
|
|
|
|
|
|
|
|
|
|
|
|
|
|
Operating income |
|
1,369 |
|
|
|
|
|
|
|
|
|
Income tax expense (3) |
|
(508) |
|
|
|
|
|
|
|
|
|
NOPAT |
|
861 |
|
|
|
|
|
|
|
|
85
|
Adjustments to average invested capital and ROIC |
||||||||||
|
in € M, except where otherwise specified |
|
|
|
|
|
|
|
|
|
|
|
|
|
December 31, |
|
September 30, |
|
June 30, |
|
March 31, |
|
December 31, |
|
2023 |
|
2023 |
|
2023 (4) |
|
2023 (4) |
|
2023 (4) |
|
2022 (4) |
|
Total assets |
|
— |
|
(370) |
|
(361) |
|
(361) |
|
(368) |
|
Minus: Cash and cash equivalents |
|
— |
|
20 |
|
20 |
|
20 |
|
20 |
|
Minus: Accounts payable to unrelated parties |
|
— |
|
5 |
|
5 |
|
5 |
|
5 |
|
Minus: Provisions and other current liabilities (2) |
|
— |
|
16 |
|
16 |
|
16 |
|
16 |
|
Invested capital |
|
— |
|
(329) |
|
(320) |
|
(320) |
|
(327) |
|
|
|
|
|
|
|
|
|
|
|
|
|
Adjustment to average invested capital as of December 31, 2023 |
|
(259) |
|
|
|
|
|
|
|
|
|
|
|
|
|
|
|
|
|
|
|
|
|
Adjustment to operating income (4) |
|
(32) |
|
|
|
|
|
|
|
|
|
Adjustment to income tax expense (4) |
|
12 |
|
|
|
|
|
|
|
|
|
Adjustment to NOPAT |
|
(20) |
|
|
|
|
|
|
|
|
|
Reconciliation of average invested capital and ROIC (Non-IFRS Measure) |
||||||||||
|
in € M, except where otherwise specified |
|
|
|
|
|
|
|
|
|
|
|
|
|
December 31, |
|
September 30, |
|
June 30, |
|
March 31, |
|
December 31, |
|
2023 |
|
2023 |
|
2023 (4) |
|
2023 (4) |
|
2023 (4) |
|
2022 (4) |
|
Total assets |
|
33,930 |
|
35,265 |
|
34,599 |
|
35,140 |
|
35,386 |
|
Plus: Cumulative goodwill amortization and impairment loss |
|
629 |
|
703 |
|
644 |
|
640 |
|
645 |
|
Minus: Cash and cash equivalents (1) |
|
(1,427) |
|
(1,554) |
|
(1,343) |
|
(1,204) |
|
(1,254) |
|
Minus: Loans to related parties |
|
— |
|
— |
|
— |
|
— |
|
(1) |
|
Minus: Deferred tax assets (1) |
|
(292) |
|
(304) |
|
(314) |
|
(307) |
|
(313) |
|
Minus: Accounts payable to unrelated parties (1) |
|
(775) |
|
(757) |
|
(716) |
|
(817) |
|
(808) |
|
Minus: Accounts payable to related parties |
|
(123) |
|
(119) |
|
(140) |
|
(111) |
|
(138) |
|
Minus: Provisions and other current liabilities (2) |
|
(2,936) |
|
(3,219) |
|
(3,002) |
|
(2,991) |
|
(2,992) |
|
Minus: Income tax liabilities |
|
(231) |
|
(263) |
|
(230) |
|
(215) |
|
(171) |
|
Invested capital |
|
28,775 |
|
29,752 |
|
29,498 |
|
30,135 |
|
30,354 |
|
|
|
|
|
|
|
|
|
|
|
|
|
Average invested capital as of December 31, 2023 |
|
29,703 |
|
|
|
|
|
|
|
|
|
|
|
|
|
|
|
|
|
|
|
|
|
Operating income (4) |
|
1,337 |
|
|
|
|
|
|
|
|
|
Income tax expense (3), (4) |
|
(496) |
|
|
|
|
|
|
|
|
|
NOPAT |
|
841 |
|
|
|
|
|
|
|
|
|
ROIC in % |
|
2.8 |
|
|
|
|
|
|
|
|
|
(1) |
Includes amounts related to assets, and associated liabilities, classified as held for sale (see note 4 of the notes to the consolidated financial statements included in this report). |
|
(2) |
Including non-current provisions, non-current labor expenses and variable payments outstanding for acquisitions and excluding pension liabilities and noncontrolling interests subject to put provisions. |
|
(3) |
Adjusted for noncontrolling partnership interests. |
|
(4) |
Including adjustments for acquisitions and divestitures made during the last twelve months with a purchase price above a €50 M threshold. |
Operating income margin
Operating income margin represents the ratio of operating income to revenue. We believe operating income margin shows the profitability of each of our operating segments and our company on a consolidated basis.
86
Net income and net income growth
As net income represents the profitability of our business after all costs including operating costs, interest income and expense, taxes and the impacts of noncontrolling interests in our subsidiaries, this metric shows our profit for the period after taking into account all aspects of our business. On a consolidated level, we also use percentage growth in net income (net income attributable to shareholders of FME AG) at Constant Currency as an additional performance indicator used for internal management. Net income and net income growth are also benchmarked based on movement at Constant Exchange Rates (Non-IFRS Measures).
Basic earnings per share growth
Percentage growth in basic earnings per share at Constant Currency (Non-IFRS Measure) is a performance indicator to evaluate our profitability. This indicator helps to manage our overall performance. Basic earnings per share is calculated by dividing net income attributable to shareholders by the weighted-average number of outstanding shares over the course of the year.
Net cash provided by (used in) operating activities in % of revenue
Our consolidated statement of cash flows indicates how we generated and used cash and cash equivalents. In conjunction with our other primary financial statements, it provides information that helps us evaluate changes to our net assets and our financial structure (including liquidity and solvency). Net cash provided by (used in) operating activities is applied to assess whether a business can internally generate the cash required to make the necessary replacement and expansion of investments. This indicator is impacted by the profitability of our business and the development of working capital, mainly receivables. Net cash provided by (used in) operating activities in percent of revenue shows the percentage of our revenue that is available in terms of financial resources. This measure is an indicator of our operating financial strength.
Free cash flow in % of revenue (Non-IFRS Measure)
Free cash flow (which we define as net cash provided by (used in) operating activities after capital expenditures, before acquisitions and investments) refers to the cash flow we have at our disposal, including cash flows that may be restricted for other uses. This indicator shows the percentage of revenue available for acquisitions and investments, dividends to shareholders, debt servicing and reductions in debt financing or for repurchasing shares.
For a reconciliation of cash flow performance indicators for the years ended 2024, 2023 and 2022 which reconciles free cash flow and free cash flow in percent of revenue to Net cash provided by (used in) operating activities and Net cash provided by (used in) operating activities in percent of revenue, see “Item 5. Operating and financial review and prospects — IV. Financial position — Sources of liquidity.”
Capital expenditures
We manage our investments using a detailed coordination and evaluation process. The Management Board sets our complete investment budget as well as the investment targets. Before realizing specific investment projects or acquisitions, our internal Acquisition & Investment Committee examines, based on certain thresholds, the individual projects and measures considering the expected return on investment and potential yield. Investment projects are evaluated using common methods such as net present value, internal interest rate methods and return on invested capital. We utilize this evaluation methodology to ensure that we only make and implement investments and acquisitions that increase shareholder value. Capital expenditures for property, plant and equipment and capitalized development costs is an indicator used for internal management. It influences the capital invested for replacement and expansion.
Net leverage ratio (Non-IFRS Measure)
The net leverage ratio is a performance indicator used for capital management. To determine the net leverage ratio, debt and lease liabilities less cash and cash equivalents (net debt) is compared to adjusted EBITDA, which we define as EBITDA adjusted for:
| ● | the effects of acquisitions and divestitures made during the year with a purchase price above a €50 M threshold as defined in our Syndicated Credit Facility (See note 17 of the notes to the consolidated financial statements included in this report), |
| ● | non-cash charges, |
87
| ● | impairment loss (including any impairment losses associated with the FME25 Program and Legacy Portfolio Optimization, as defined below), and |
| ● | special items, including: |
| i. | costs related to our FME25 Program, |
| ii. | the impact from the remeasurement of our investment in Humacyte, Inc. and receivables related to a royalty stream that we are entitled to base on sales made by Humacyte, Inc. in the U.S. (Humacyte Remeasurements), |
| iii. | certain costs associated with the Conversion, primarily related to the requisite relabeling of our products, transaction costs (such as costs for external advisors and conducting an extraordinary general meeting) and costs related to the establishment of dedicated administrative functions required to manage certain services which have historically been administered at the Fresenius SE group level and paid by the Company through corporate charges (Legal Form Conversion Costs), and |
| iv. | impacts from strategic divestitures identified during our Legacy Portfolio Optimization review. During the year ended December 31, 2024, these impacts are mainly driven by gains and losses from divestitures, impairment losses resulting from the measurement of assets held for sale or from write-downs of related non-current assets (see notes 4 and 5 e) of the notes to the consolidated financial statements included in this report). |
The ratio is an indicator of the length of time the Company needs to service the net debt out of its own resources. We believe that the net leverage ratio provides alternative information that management believes to be useful in assessing our ability to meet our payment obligations in addition to considering the absolute amount of our debt. We have a strong market position in a growing, global and mainly non-cyclical market. Furthermore, most of our customers have a high credit rating as the dialysis industry is characterized by stable and sustained cash flows. We believe this enables us to work with a reasonable proportion of debt.
Adjusted EBITDA, a non-IFRS Measure, is used in our capital management and is also relevant in major financing instruments, including the Syndicated Credit Facility. You should not consider adjusted EBITDA to be an alternative to net earnings determined in accordance with IFRS Accounting Standards or to cash flow from operations, investing activities or financing activities. In addition, not all funds depicted by adjusted EBITDA are available for management’s discretionary use. For example, a substantial portion of such funds are subject to contractual restrictions and functional requirements to fund debt service, capital expenditures and other commitments from time to time as described in more detail elsewhere in this report.
For our self-set target range for the net leverage ratio and a reconciliation of adjusted EBITDA and net leverage ratio as of December 31, 2024 and 2023, see “Item 5. Operating and financial review and prospects — IV. Financial position — Financing strategy.”
88
|
II. |
Financial condition and results of operations |
Overview
We are the world’s leading provider of products and services for individuals with renal diseases based on publicly reported revenue and number of patients treated. We provide dialysis and related services for individuals with renal diseases as well as other health care services. We also develop, manufacture and distribute a wide variety of health care products. Our health care products include hemodialysis machines, peritoneal dialysis cyclers, dialyzers, peritoneal dialysis solutions, hemodialysis concentrates, solutions and granulates, bloodlines, renal pharmaceuticals, systems for water treatment, as well as acute cardiopulmonary and apheresis products. We supply dialysis clinics we own, operate or manage with a broad range of products and also sell dialysis products to other dialysis service providers. We sell our health care products to customers in around 150 countries and we also use them in our own health care service operations. Our dialysis business is therefore vertically integrated. Our other health care services include value and risk-based care programs, pharmacy services, vascular specialty services as well as ambulatory surgery center services, physician nephrology practice management and ambulant treatment services. We estimate that the size of the global dialysis market was approximately €80 to 84 billion in 2024 (€80 to 84 billion in 2023). Dialysis patient growth results from factors such as the aging population and increased life expectancies; shortage of donor organs for kidney transplants; increasing incidence of kidney disease and better treatment of and survival of patients with diabetes, hypertension and other illnesses, which frequently lead to the onset of CKD; improvements in treatment quality, new pharmaceuticals and product technologies, which prolong patient life; and improving standards of living in developing countries, which make life-saving dialysis treatment available. We are also engaged in different areas of health care product therapy research.
As a global company delivering health care services and products, we face the challenge of addressing the needs of a wide variety of stakeholders, such as patients, customers, payors, regulators and legislators in many different economic environments and health care systems. In general, government-funded programs (in some countries in coordination with private insurers) pay for certain health care items and services provided to their citizens. Not all health care systems provide payment for dialysis treatment. Therefore, the reimbursement systems and ancillary services utilization environment in various countries significantly influence our business.
Company structure
For a description of our structure, especially as it relates to our operating segments, see “Certain defined terms,” above, as well as note 29 of the notes to the consolidated financial statements included in this report.
Significant U.S. reimbursement matters
The majority of health care services we provide are paid for by governmental institutions. For the year ended December 31, 2024, approximately 18% of our consolidated revenue was attributable to U.S. federally-funded health care benefit programs, such as Medicare and Medicaid reimbursement, under which reimbursement rates are set by CMS. Legislative changes could affect reimbursement rates for a significant portion of the services we provide. The stability of reimbursement in the U.S. has been affected by (i) the ESRD PPS, (ii) the U.S. federal government across the board spending cuts in payments to Medicare providers commonly referred to as “U.S. Sequestration” and (iii) the reduction to the ESRD PPS rate to account for the decline in utilization of certain drugs and biologicals associated with dialysis pursuant to the American Taxpayer Relief Act of 2012 as subsequently modified under PAMA. See detailed discussions on these and further legislative developments in “Reimbursement” in Item 4.B above, “Information on the Company — B. Business overview.”
89
Presently, there is considerable uncertainty regarding possible future changes in health care regulation, including the regulation of reimbursement for dialysis services. As a consequence of the pressure to decrease health care costs, government reimbursement rate increases in the U.S. have historically been limited and are expected to continue in this fashion. However, any significant decreases in reimbursement under Medicare, commercial insurance or Medicare Advantage plans, or in patient access to commercial insurance or Medicare Advantage plans could have material adverse effects on our health care services business and, because the demand for dialysis products is affected by Medicare reimbursement, on our products business. To the extent that increases in operating costs that are affected by inflation, such as labor and supply costs, are not fully reflected in a compensating increase in reimbursement rates, our business and results of operations would be adversely affected. In addition, the U.S. Supreme Court’s Marietta ruling makes it easier for health plans to design plan benefits for Medicare eligible ESRD patients in a way that makes commercial insurance relatively less attractive to ESRD patients and Medicare relatively more attractive. The Marietta ruling could also result in certain EGHPs reducing the benefits offered for dialysis, which could, depending on the number of patients impacted, have a material and adverse impact on our business, financial condition and results of operations. Bills were introduced previously to Congress that would address the Marietta decision, but will need to be reintroduced in the current Congress. The Restore Protections for Dialysis Patients Act would restore the interpretation of the Medicare Secondary Payer Act prior to the Marietta decision and ensure that patients cannot be discriminated against because of their need for dialysis. These bills will need to be reintroduced before they are taken up in the 119th Congress which began on January 3, 2025. As Medicare and Medicaid reimbursement rates are generally lower than the reimbursement rates paid by commercial insurers, a shift of commercially insured patients to Medicare and Medicaid could have a material adverse impact on our business, financial condition and results of operations in 2024 and beyond. There can be no assurance that this proposal or any other legislation to address the Marietta decision will be enacted. For additional information regarding these regulatory matters, See Item 3.D, “Key information — Risk factors,” and Item 4.B, “Information on the Company — B. Business Overview — Regulatory and Legal Matters — Health care Reform” and “— Reimbursement — Potential changes impacting our private payors in the U.S.,” above.
Participation in new Medicare payment arrangements
We also participate (or have participated) in the programs, initiatives and arrangements, each with the specific reimbursement models, described in Item 4.B, “Information on the Company — B. Business overview — Other health care services — Value and risk-based care programs” and “ — Reimbursement — Executive-order based models” above.
|
III. |
Results of operations, financial position and net assets |
Highlights
The following items represent notable impacts or trends in our business and/or industry for the year ended December 31, 2024:
Legacy Portfolio Optimization
We continue to review our business portfolio, specifically with a view to exiting unsustainable markets and divesting non-core businesses and the cessation of certain R&D programs to enable more focused capital allocation towards areas in our core business that are expected to have higher profitable growth. During the year ended December 31, 2024, the impacts from Legacy Portfolio Optimization mainly comprise the items described in “— I. Performance management system — Financial performance indicators — Secondary performance indicators — Net leverage ratio (Non-IFRS Measure),” above (see note 4 of the notes to the consolidated financial statements included in this report).
Overall, the impacts from Legacy Portfolio Optimization resulted in a negative effect on operating income of €288 M for the year ended December 31, 2024 (€204 M for the year ended December 31, 2023).
FME25 Program
Overall, the costs related to the FME25 Program resulted in a negative impact to operating income of €180 M for the year ended December 31, 2024, (€153 M for the year ended December 31, 2023). For the year ended December 31, 2024, recurring savings related to the FME25 Program were €567 M (€346 M for the year ended December 31, 2023).
In the discussion of our results for the year ended December 31, 2024 compared to the year ended December 31, 2023 below, the effects of the costs and savings related to the FME25 Program are presented on a net basis.
Third-party Cyber Incident
90
On February 21, 2024, one of our third party service providers was subject to a cyber-attack leading to the shutdown of its systems (the Third-party Cyber Incident). As this third party provided us with a range of financial clearinghouse services, the cyber-attack on its systems led to delays in claim processing impacting our consolidated financial statements, primarily affecting accounts receivable balances and cash flows. As of December 31, 2024, the impacts related to the Third-party Cyber Incident have been substantially resolved and are no longer material.
Other Trends
We continue to face significant challenges in the labor market resulting in meaningfully higher costs. While we have seen signs of a stabilization of the labor market, such challenges continued and costs increased in 2024 as we made investments in our employees. Additionally, overall treatments decreased for the year ended December 31, 2024 compared to the year ended December 31, 2023 primarily as divestitures in connection with Legacy Portfolio Optimization had a negative impact on overall treatment volume. Specifically in the U.S., volumes were negatively affected by the cancellation of less profitable acute care contracts contributing to a 0.2% decline in Same Market Treatment Growth (as defined below) for the year ended December 31, 2024 in addition to the impacts from divestitures noted above, as indicated in the discussion of our consolidated revenue and operating segment results and in the tables under “Key Performance Indicators,” below.
The following sections summarize our consolidated results of operations, financial position and net assets as well as key performance indicators by reporting segment, as well as Corporate, for the periods indicated. We prepared the information consistent with the manner in which management internally disaggregates financial information to assist in making operating decisions and evaluating management performance.
For a discussion of our 2023 results as compared to our 2022 results and our financial position during and as of the end of 2023, see Item 5. “Operating and financial review and prospects — III. Results of operations, financial position and net assets — Results of operations and — IV. Financial position,” within our 2023 Annual report on Form 20-F, which is incorporated herein by reference.
Results of operations
Revenue and operating income generated in countries outside the eurozone are subject to currency fluctuations. As a significant portion of our operations are derived from our businesses in the U.S., the development of the euro against the U.S. dollar can have a material impact on our results of operations, financial position and net assets and the impacts of foreign currency transaction and translation effects are included in the discussion of our key and secondary performance indicators below.
91
Year ended December 31, 2024 compared to year ended December 31, 2023
|
Results of operations |
||||||||||
|
in € M |
|
|
|
|
|
|
|
|
|
|
|
|
|
|
|
|
|
Change in % |
||||
|
|
|
|
|
|
|
|
|
Currency |
|
|
|
|
|
|
|
|
|
|
|
translation |
|
Constant |
|
|
|
2024 |
|
2023 |
|
As reported |
|
effects |
|
Currency (1) |
|
Revenue |
|
19,336 |
|
19,454 |
|
(1) |
|
(1) |
|
0 |
|
Costs of revenue |
|
(14,579) |
|
(14,529) |
|
0 |
|
1 |
|
1 |
|
Selling, general and administrative costs |
|
(3,143) |
|
(3,196) |
|
(2) |
|
1 |
|
(1) |
|
Research and development |
|
(183) |
|
(232) |
|
(21) |
|
0 |
|
(21) |
|
Income from equity method investees |
|
135 |
|
122 |
|
11 |
|
0 |
|
11 |
|
Other operating income |
|
760 |
|
515 |
|
48 |
|
0 |
|
48 |
|
Other operating expense |
|
(934) |
|
(765) |
|
22 |
|
1 |
|
23 |
|
|
|
|
|
|
|
|
|
|
|
|
|
Operating income |
|
1,392 |
|
1,369 |
|
2 |
|
(1) |
|
3 |
|
Operating income margin |
|
7.2 |
|
7.0 |
|
|
|
|
|
|
|
Interest income |
|
72 |
|
88 |
|
(19) |
|
(1) |
|
(18) |
|
Interest expense |
|
(407) |
|
(424) |
|
(4) |
|
0 |
|
(4) |
|
Income tax expense |
|
(316) |
|
(301) |
|
5 |
|
1 |
|
6 |
|
Net income |
|
741 |
|
732 |
|
1 |
|
(1) |
|
2 |
|
Net income attributable to noncontrolling interests |
|
(203) |
|
(233) |
|
(13) |
|
0 |
|
(13) |
|
Net income attributable to shareholders of FME AG |
|
538 |
|
499 |
|
8 |
|
(1) |
|
9 |
|
Basic and diluted earnings per share in € |
|
1.83 |
|
1.70 |
|
8 |
|
(1) |
|
9 |
| (1) | For further information on Constant Exchange Rates, see “I. Performance management system” above. |
Key Performance Indicators
The following discussions include our two operating and reportable segments and the measures we use to manage these segments. For further information, see note 29 of the notes to the consolidated financial statements included in this report.
|
Revenue |
|
|
|
|
||||||||||
|
in € M, except dialysis treatment, patient and clinic data |
|
|
|
|
|
|
|
|
|
|
|
|
|
|
|
|
|
|
|
|
|
Change in % |
||||||||
|
|
|
|
|
|
|
|
|
Currency |
|
|
|
|
|
Same Market |
|
|
|
|
|
|
|
|
|
translation |
|
Constant |
|
Organic |
|
Treatment |
|
|
|
2024 |
|
2023 |
|
As reported |
|
effects |
|
Currency (1) |
|
growth |
|
Growth (2) |
|
Revenue |
|
19,336 |
|
19,454 |
|
(1) |
|
(1) |
|
0 |
|
4 |
|
|
|
Care Delivery segment |
|
15,275 |
|
15,578 |
|
(2) |
|
0 |
|
(2) |
|
4 |
|
0.3 |
|
Thereof: U.S. |
|
12,798 |
|
12,665 |
|
1 |
|
0 |
|
1 |
|
4 |
|
(0.1) |
|
Thereof: International |
|
2,477 |
|
2,913 |
|
(15) |
|
(2) |
|
(13) |
|
4 |
|
1.4 |
|
Care Enablement segment |
|
5,557 |
|
5,345 |
|
4 |
|
(1) |
|
5 |
|
5 |
|
|
|
Inter-segment eliminations |
|
(1,496) |
|
(1,469) |
|
2 |
|
0 |
|
2 |
|
|
|
|
|
Dialysis treatments |
|
47,617,071 |
|
51,654,540 |
|
(8) |
|
|
|
|
|
|
|
|
|
Patients |
|
299,352 |
|
332,548 |
|
(10) |
|
|
|
|
|
|
|
|
|
Clinics |
|
3,675 |
|
3,925 |
|
(6) |
|
|
|
|
|
|
|
|
| (1) | For further information on Constant Exchange Rates, see “I. Performance management system” above. |
| (2) | Same market treatment growth represents growth in treatments, adjusted for certain reconciling items including (but not limited to) treatments from acquisitions, closed or sold clinics and differences in dialysis days (Same Market Treatment Growth). |
Consolidated
Revenue decreased as compared to the year ended December 31, 2023 primarily driven by the effect of closed or sold operations (primarily related to Legacy Portfolio Optimization), the absence, in 2024, of a settlement agreement in 2023 related to a previous complaint we filed against the U.S. government in 2019 which sought to recover amounts owed to us under the Tricare program (Tricare Settlement) and a negative impact from foreign currency translation, partially offset by an increase in organic growth in both Care Delivery and Care Enablement.
92
Care Delivery
The decrease in Care Delivery revenue as compared to the year ended December 31, 2023 was driven by the effect of closed or sold operations (primarily related to Legacy Portfolio Optimization) and the absence, in 2024, of the Tricare Settlement, partially offset by an increase in organic growth. Organic growth was supported by value and risk-based care programs, reimbursement rate increases and a favorable payor mix, partially offset by increased implicit price concessions. As of December 31, 2024, the number of patients treated in dialysis clinics that we own or operate in Care Delivery decreased as compared to December 31, 2023, primarily driven by divestitures in connection with our Legacy Portfolio Optimization plan. Treatments in our Care Delivery segment decreased as compared to the year ended December 31, 2023, mainly due to the effect of closed or sold clinics (primarily related to Legacy Portfolio Optimization). During the year ended December 31, 2024, we acquired 3, opened 30 and combined, closed or sold 283 dialysis clinics.
U.S.
In the U.S., the increase in revenue was driven by an increase in organic growth, partially offset by the absence, in 2024, of the Tricare Settlement and the effect of closed or sold operations (primarily related to Legacy Portfolio Optimization). Organic growth in the U.S. was supported by value and risk-based care programs, reimbursement rate increases and a favorable payor mix, partially offset by increased implicit price concessions. In the U.S., 206,436 patients (December 31, 2023: 205,308) were treated in dialysis clinics that we own or operate. Treatments remained relatively stable at 31,213,447 for the year ended December 31, 2024 as compared to 31,210,375 for the year ended December 31, 2023, primarily as Same Market Treatment Growth was limited by the cancellation of less profitable acute care contracts (-0.2%). We owned or operated 2,624 dialysis clinics in the U.S. at December 31, 2024 as compared to 2,615 dialysis clinics at December 31, 2023. During the year ended December 31, 2024, we opened 27 and combined, closed or sold 18 dialysis clinics.
International
In International, the decrease in revenue was driven by the effect of closed or sold operations (primarily related to Legacy Portfolio Optimization) and a negative impact from foreign currency translation, partially offset by an increase in organic growth and an increase in dialysis days. There were 92,916 patients, a decrease of 27% (December 31, 2023: 127,240) treated in dialysis clinics that we own or operate in International, primarily driven by divestitures in connection with Legacy Portfolio Optimization. Treatments in International decreased by 20% to 16,403,624 for the year ended December 31, 2024 as compared to 20,444,165 for the year ended December 31, 2023 driven by the effect of closed or sold operations (primarily related to Legacy Portfolio Optimization), partially offset by Same Market Treatment Growth and an increase in dialysis days. We owned or operated 1,051 dialysis clinics in International at December 31, 2024 as compared to 1,310 dialysis clinics at December 31, 2023. During the year ended December 31, 2024, we acquired 3, opened 3 and combined, closed or sold 265 dialysis clinics.
93
Care Enablement
Care Enablement revenue increased as compared to the year ended December 31, 2023 primarily driven by higher revenues related to in-center disposables, machines for chronic treatment, home hemodialysis products and products for acute care treatments, partially offset by a negative impact from foreign currency translation. The development was driven by volume increases for our products across all of our geographical regions. Additionally, pricing momentum outside of China remained positive. In China, pricing was negatively impacted by volume-based procurement.
|
Operating income (loss) |
||||||||||
|
in € M |
|
|
|
|
|
|
|
|
|
|
|
|
|
|
|
|
|
Change in % |
||||
|
|
|
|
|
|
|
|
|
Currency |
|
|
|
|
|
|
|
|
|
|
|
translation |
|
Constant |
|
|
|
2024 |
|
2023 |
|
As reported |
|
effects |
|
Currency (1) |
|
Operating income (loss) |
|
1,392 |
|
1,369 |
|
2 |
|
(1) |
|
3 |
|
Care Delivery segment |
|
1,190 |
|
1,516 |
|
(22) |
|
(1) |
|
(21) |
|
Care Enablement segment |
|
267 |
|
(67) |
|
n.a. |
|
|
|
n.a. |
|
Inter-segment eliminations |
|
(17) |
|
(13) |
|
30 |
|
5 |
|
25 |
|
Corporate |
|
(48) |
|
(67) |
|
(29) |
|
(1) |
|
(28) |
|
Operating income (loss) margin |
|
7.2 |
|
7.0 |
|
|
|
|
|
|
|
Care Delivery segment |
|
7.8 |
|
9.7 |
|
|
|
|
|
|
|
Care Enablement segment |
|
4.8 |
|
(1.2) |
|
|
|
|
|
|
| (1) | For further information on Constant Exchange Rates, see “I. Performance management system” above. |
Consolidated
The increase in our operating income was largely driven by a positive impact from business growth, net savings associated with the FME25 Program and a positive impact from value and risk-based care programs, partially offset by higher personnel expense, the absence, in 2024, of the Tricare Settlement, inflationary cost increases and an unfavorable impact from Legacy Portfolio Optimization.
Care Delivery
Care Delivery operating income decreased primarily as a result of an unfavorable impact from Legacy Portfolio Optimization, the absence, in 2024, of the Tricare Settlement, higher personnel expense and inflationary cost increases, partially offset by a positive impact from business growth, a positive impact from value and risk-based care programs and net savings associated with the FME25 Program.
Care Enablement
For the year ended December 31, 2024, Care Enablement recorded operating income as compared to an operating loss for the year ended December 31, 2023, primarily due to a favorable impact from business growth (driven by positive volume and pricing developments which were partially offset by volume-based procurement in China), a favorable impact from Legacy Portfolio Optimization, net savings from the FME25 Program and a positive impact from the remeasurement of receivables related to a royalty stream that we are entitled to base on sales made by Humacyte, Inc. in the U.S., partially offset by inflationary cost increases and unfavorable foreign currency transaction effects.
Secondary performance indicators and other contributors to profit and loss
Costs of revenue remained relatively stable as compared to the year ended December 31, 2023 as increased value and risk-based care program expenses (primarily related to higher memberships) in Care Delivery, higher personnel expense in Care Delivery and inflationary cost increases were mostly offset by lower costs associated with business growth in Care Delivery (partially offset by higher costs in Care Enablement), the absence, in 2024, of the results of operations for businesses previously divested under Legacy Portfolio Optimization primarily within Care Delivery, net savings from the FME25 Program and a positive impact from foreign currency translation. In Care Delivery, costs of revenue decreased slightly to €12,120 M from €12,151 M for the comparable period. In Care Enablement, costs of revenue increased by 2% to €3,915 M from €3,834 M for the comparable period. In addition to a 1% positive impact from foreign currency translation, costs of revenue increased by 3% at Constant Currency.
94
Selling, general and administrative (SG&A) expense decreased for the year ended December 31, 2024 as compared to the prior year comparable period driven by lower costs associated with business growth.
The decrease in research and development expense for the year ended December 31, 2024 as compared to the prior year comparable period was largely driven by lower personnel costs for R&D projects, higher capitalization of development costs and lower costs related to activities in the field of regenerative medicine, partially offset by increased R&D activity.
The increase in income from equity method investees was primarily driven by higher earnings attributable to VFMCRP.
The increase in other operating income was primarily driven by foreign exchange gains, a positive impact from Humacyte Remeasurements and the impacts from Legacy Portfolio Optimization.
The increase in other operating expense was primarily driven by the impacts from Legacy Portfolio Optimization, foreign exchange losses and an unfavorable impact from the valuation of vPPAs, partially offset by the absence, in 2024, of the results of operations for businesses previously divested under Legacy Portfolio Optimization.
For additional information regarding other operating income and expense, see note 5 e) of the notes to the consolidated financial statements included in this report.
Net interest expense remained relatively stable at €335 M from €336 M as a favorable impact from refinancing activities and favorable effects from foreign currency swaps were mostly offset by higher net interest expense on taxes related to a settlement, lower interest associated with receivables related to a royalty stream that we are entitled to base on sales made by Humacyte, Inc. in the U.S., a negative impact from the Third-party Cyber Incident and unfavorable foreign currency translation effects.
The effective tax rate increased to 29.9% from 29.1% for the same period of 2023 primarily driven by a negative impact from Legacy Portfolio Optimization, partially offset by lower tax provisions related to the recognition of a previously unrecognized deferred tax asset and tax law changes. For information regarding the impact of Pillar Two tax legislation, see note 5 g) of the notes to the consolidated financial statements included in this report.
The decrease in net income attributable to noncontrolling interests was primarily due to lower earnings in fully consolidated entities in which we have less than 100% ownership, partially offset by a favorable impact from Legacy Portfolio Optimization.
The increase in net income attributable to shareholders of FME AG was as a result of the combined effects of the items discussed above.
Basic earnings per share increased primarily due to the increase in net income attributable to shareholders of FME AG described above. The average weighted number of shares outstanding for the period was unchanged at 293.4 M in 2024 (2023: 293.4 M).
We employed 111,513 people (total headcount) as of December 31, 2024 (December 31, 2023: 119,845). This 7% decrease was largely due to the divestiture of certain businesses in connection with Legacy Portfolio Optimization.
IV. Financial position
Our investment and financing strategy did not change substantially in the past fiscal year as our business model, which is based on stable and high cash flows, allows for a reasonable proportion of debt. We regard our refinancing options as being very stable and flexible. During the past fiscal year, the focus of our investing activities was on our health care services business.
Financing strategy
Our financing strategy aims at ensuring financial flexibility, managing financial risks and optimizing financing costs. Financial flexibility is ensured through maintaining sufficient liquidity. Refinancing risks are limited due to the Company’s balanced maturity profile, which is characterized by a wide range of maturities of up to 2031. Corporate bonds in euro and U.S. dollar form the basis of our mid- and long-term financing instruments. Corporate bonds in euro are issued under our €10 billion debt issuance program. For short-term financing we use our €1.5 billion commercial paper program and bilateral credit lines. The €2 billion Syndicated Credit Facility serves as a backup facility and was undrawn at December 31, 2024.
95
The following chart summarizes our main financing debt mix as of December 31, 2024:

In our long-term capital management, we focus primarily on the net leverage ratio, a Non-IFRS measure, see “I. Performance management system — Net leverage ratio (Non-IFRS Measure),” above. Our self-set target for the net leverage ratio is 3.0 - 3.5x, which management considers appropriate for the Company. The following table shows the reconciliation of net debt and adjusted EBITDA and the calculation of the net leverage ratio as of December 31, 2024 and 2023.
|
Reconciliation of adjusted EBITDA and net leverage ratio to the most directly comparable IFRS Accounting Standards financial measure |
||||
|
in € M, except for net leverage ratio |
|
|
|
|
|
|
|
December 31, |
|
December 31, |
|
|
|
2024 |
|
2023 |
|
|
|
|
|
|
|
Debt and lease liabilities (1) |
|
10,988 |
|
12,187 |
|
Minus: Cash and cash equivalents (2) |
|
(1,185) |
|
(1,427) |
|
Net debt |
|
9,803 |
|
10,760 |
|
|
|
|
|
|
|
Net income |
|
741 |
|
732 |
|
Income tax expense |
|
316 |
|
301 |
|
Interest income |
|
(72) |
|
(88) |
|
Interest expense |
|
407 |
|
424 |
|
Depreciation and amortization |
|
1,536 |
|
1,613 |
|
Adjustments (3) |
|
450 |
|
409 |
|
Adjusted EBITDA |
|
3,378 |
|
3,391 |
|
Net leverage ratio |
|
2.9 |
|
3.2 |
| (1) | Debt includes the following balance sheet line items: short-term debt, current portion of long-term debt and long-term debt, less current portion as well as debt and lease liabilities included within liabilities directly associated with assets held for sale. |
| (2) | Includes cash and cash equivalents included within assets held for sale (see note 4 of the notes to the consolidated financial statements included in this report). |
96
| (3) | Acquisitions and divestitures made for the last twelve months with a purchase price above a €50 M threshold as defined in the Syndicated Credit Facility (2024: -€23 M; 2023: -€35 M), non-cash charges, primarily related to pension expense (2024: €52 M; 2023: €56 M), impairment loss (2024: €207 M; 2023: €139 M) and special items, including costs related to the FME25 Program (2024: €164 M; 2023: €106 M), Legal Form Conversion Costs (2024: €9 M; 2023: €30 M), Legacy Portfolio Optimization (2024: €113 M; 2023: €128 M) and Humacyte Remeasurements (2024: -€72 M; 2023: -€15 M). |
The key financial risks we are exposed to include foreign exchange risk and interest rate risk. To manage these risks, we enter into various hedging transactions that have been authorized by the Management Board. Counterparty risks are managed via internal credit limits, taking into account the external credit ratings of the respective hedging counterparty. We do not use financial instruments for trading or other speculative purposes (for financial risks, see Item 11. “Quantitative and qualitative disclosures about market risk — Management of foreign exchange and interest rate risks” below as well as note 26 of the notes to the consolidated financial statements included in this report). For information on our credit ratings, see note 21 of the notes to the consolidated financial statements included in this report. A rating is not a recommendation to buy, sell or hold securities of the Company, and may be subject to suspension, change or withdrawal at any time by the assigning rating agency.
Fresenius SE, under a transitional service agreement, conducts treasury services for us until the separation and establishment of an independent treasury team has been finalized. We have established guidelines for risk management procedures and controls which govern the use of financial instruments. These guidelines include a clear segregation of duties with regards to execution on the one hand and administration, accounting and controlling on the other. Throughout 2024, these transitional service agreements were terminated, with very few exceptions which will continue through the beginning of 2025.
Effect of off-balance-sheet financing instruments on our financial position, assets and liabilities
We are not involved in off-balance-sheet transactions that have or are reasonably likely to have a material current or future effect on our financial condition, changes in financial condition, revenues or expenses, results of operations, liquidity, cash requirements or capital resources.
Sources of liquidity
Our primary sources of liquidity are typically cash provided by operating activities, cash provided by short-term debt, proceeds from the issuance of long-term debt and divestitures. We require this capital primarily to finance working capital needs, fund the FME25 Program and acquisitions, operate clinics, develop free-standing renal dialysis clinics and other health care facilities, purchase equipment for existing or new renal dialysis clinics and production sites, repay debt and pay dividends (see “Net cash provided by (used in) investing activities” and “Net cash provided by (used in) financing activities” below) and to satisfy put option obligations to holders of minority interests in our majority-owned subsidiaries.
As of December 31, 2024, our available borrowing capacity under unutilized credit facilities amounted to approximately €3.5 billion, including €2.0 billion under the Syndicated Credit Facility, which we maintain as a backup for general corporate purposes (see note 17 of the notes to the consolidated financial statements included in this report).
At December 31, 2024, we had cash and cash equivalents of €1,180 M (December 31, 2023: €1,403 M).
Free cash flow (Net cash provided by (used in) operating activities, after capital expenditures, before acquisitions and investments) is a Non-IFRS Measure and is reconciled to net cash provided by (used in) operating activities, the most directly comparable IFRS Accounting Standards measure, see “— I. Performance management system — Net cash provided by (used in) operating activities in % of revenue” and “ — Free cash flow in % of revenue (Non-IFRS Measure)” above.
97
The following table shows the cash flow performance indicators for the years ended December 31, 2024, and 2023 and reconciles free cash flow and free cash flow in percent of revenue to Net cash provided by (used in) operating activities and Net cash provided by (used in) operating activities in percent of revenue, respectively:
|
Cash flow measures |
|
|
|
|
|
in € M, except where otherwise specified |
|
|
|
|
|
|
|
2024 |
|
2023 |
|
Revenue |
|
19,336 |
|
19,454 |
|
Net cash provided by (used in) operating activities |
|
2,386 |
|
2,629 |
|
Capital expenditures |
|
(699) |
|
(685) |
|
Proceeds from sale of property, plant and equipment |
|
14 |
|
16 |
|
Capital expenditures, net |
|
(685) |
|
(669) |
|
Free cash flow |
|
1,701 |
|
1,960 |
|
Net cash provided by (used in) operating activities in % of revenue |
|
12.3 |
|
13.5 |
|
Free cash flow in % of revenue |
|
8.8 |
|
10.1 |
Net cash provided by (used in) operating activities
Net cash provided by (used in) operating activities is impacted by the profitability of our business, the development of our working capital, principally inventories, receivables and cash outflows that occur due to a number of specific items as discussed below. The decrease in net cash provided by operating activities in percent of revenue as compared to the year ended 2023 was driven by a negative impact from the phasing of dividend payments received from equity method investments and the absence, in 2024, of the Tricare Settlement, partially offset by a favorable effect from certain working capital items (mainly accounts receivable from related parties and inventories). Delays in collections of trade accounts receivable in the U.S. (including significant delays in the first half of 2024 from the Third-party Cyber Incident) were partially mitigated by the substantial resolution of the impacts related to the Third-party Cyber Incident during the second half of 2024.
The profitability of our business depends significantly on reimbursement rates for our services. For the year ended December 31, 2024, approximately 78% of our revenue was generated by providing health care services, a major portion of which is reimbursed by either public health care organizations or private insurers. In 2024, approximately 18% of our consolidated revenue was attributable to reimbursements from U.S. federal health care benefit programs such as Medicare and Medicaid. Legislative changes could affect Medicare reimbursement rates for a significant portion of the services we provide as well as the scope of Medicare coverage. A decrease in reimbursement rates or the scope of coverage could have a material adverse effect on our business, financial position and results of operations and thus on our capacity to generate cash flow. See “II. Financial condition and results of operations — Overview” above.
We intend to continue to address our current cash and financing requirements using net cash provided by operating activities, issuances under our commercial paper program (see note 16 of the notes to the consolidated financial statements included in this report) as well as from the use of our bilateral credit lines. We expect that we will have adequate sources of financing available to us. Our Syndicated Credit Facility is also available for backup financing needs. In addition, to finance acquisitions or meet other needs, we expect to utilize long-term financing arrangements, such as the issuance of bonds (see “Net cash provided by (used in) financing activities,” below).
Net cash provided by (used in) operating activities depends on the collection of accounts receivable. Commercial customers and government institutions generally have different payment cycles. Lengthening their payment cycles could have a material adverse effect on our capacity to generate cash flow. In addition, we could face difficulties enforcing and collecting accounts receivable under the legal systems of, and due to the economic conditions in, some countries. Accounts receivable balances, net of expected credit losses, represented Days Sales Outstanding (DSO) (Non-IFRS Measure) of 63 days at December 31, 2024, a decrease as compared to 67 days at December 31, 2023.
98
DSO by segment is calculated by dividing the respective segment’s trade accounts and other receivables from unrelated parties (including receivables related to assets held for sale) less contract liabilities, converted to euro using the average exchange rate for the period presented by the average daily sales for the last twelve months of that segment, including sales or value-added tax, converted to euro using the average exchange rate for the period. In order to ensure comparability of line items included in the consolidated balance sheets and consolidated statements of income, trade accounts and other receivables from unrelated parties (including receivables related to assets held for sale) and contract liabilities as of December 31, 2024 are adjusted for a decrease in the amount of €78.5 M and an increase in the amount of €1.5 M, respectively (December 31, 2023: an increase of €65.2 M and €2.0 M, respectively), which represents the impact on these line items from foreign currency translation. Additionally, daily revenues in the amount of €(0.6) M and €(0.4) M for the twelve months ended December 31, 2024 and December 31, 2023, respectively, are adjusted in relation to amounts related to acquisitions and divestitures made within the reporting period with a purchase price above a €50 M threshold, to increase consistency with the respective adjustments in the determination of adjusted EBITDA (See “— I. Performance management system — Net leverage ratio (Non-IFRS Measure)” above) and in the amount of €1.0 M and €0.9 M for the twelve months ended December 31, 2024 and December 31, 2023, respectively to include sales or value-added tax and other smaller effects.
The development of DSO by reporting segment is shown in the table below:
|
Development of days sales outstanding |
||||||
|
in days |
|
|
|
|
|
|
|
|
|
December 31, |
|
|
||
|
|
|
2024 |
|
2023 |
|
Explanation of movement |
|
|
|
|
|
|
|
|
|
Care Delivery |
|
53 |
|
59 |
|
A positive effect from Legacy Portfolio Optimization |
|
|
|
|
|
|
|
|
|
Care Enablement |
|
95 |
|
97 |
|
Improvement of payment collections in certain geographical regions |
|
|
|
|
|
|
|
|
|
FME AG |
|
63 |
|
67 |
|
|
Due to the fact that a large portion of our reimbursement is provided by public health care organizations and private payors, we expect that most of our accounts receivable will be collectible.
For information regarding litigation exposure as well as ongoing and future tax audits, see note 25 of the notes to the consolidated financial statements included in this report.
Net cash provided by (used in) investing activities
Net cash used in investing activities in 2024 and 2023 was €85 M and €544 M, respectively. The following table shows a breakdown of our investing activities for 2024 and 2023:
|
Cash flows relating to investing activities |
||||||||||||
|
in € M |
|
|
|
|
|
|
|
|
|
|
|
|
|
|
|
|
|
|
|
Acquisitions, investments, |
|
|
|
|
||
|
|
|
Capital expenditures, net, |
|
purchases of intangible |
|
Proceeds from divestitures |
||||||
|
|
|
including capitalized |
|
assets and investments in |
|
and the sale of debt |
||||||
|
|
|
development costs |
|
debt securities |
|
securities |
||||||
|
|
|
2024 |
|
2023 |
|
2024 |
|
2023 |
|
2024 |
|
2023 |
|
|
|
|
|
|
|
|
|
|
|
|
|
|
|
Care Delivery |
|
353 |
|
330 |
|
37 |
|
55 |
|
658 |
|
195 |
|
Care Enablement |
|
332 |
|
339 |
|
68 |
|
82 |
|
47 |
|
67 |
|
Total |
|
685 |
|
669 |
|
105 |
|
137 |
|
705 |
|
262 |
The majority of our capital expenditures was used for maintaining existing clinics and centers, capitalization of machines provided to our customers, capitalization of certain development costs, expansion of production capacity and equipping new clinics and centers. Capital expenditures accounted for approximately 4% and 3% of total revenue in 2024 and 2023, respectively.
Investments in 2024 were primarily comprised of purchases of debt securities and equity investments. Divestitures in 2024 mainly related to the divestment of equity investments (including divestitures under our Legacy Portfolio Optimization program) and debt securities.
99
Investments in 2023 were primarily comprised of purchases of debt securities. Divestitures in 2023 were mainly related to the divestment of equity investments (including divestitures under our Legacy Portfolio Optimization program) and debt securities. Acquisitions in 2023 related primarily to the purchase of dialysis clinics. Additionally, purchases of intangibles in 2023 related primarily to emission rights certificates.
In 2025, we anticipate capital expenditures around €0.9 billion and expect to limit acquisition and investment spending, while focusing on the organic growth of our business. Our anticipated capital expenditures are driven by the need to position us well to capture growth opportunities, including the limited launch of HVHDF to targeted U.S. clinics beginning in 2025, as well as to maintain quality levels and patient experience. Additionally, we plan accelerated capital expenditures in new production facilities as well as into R&D activities for a more globalized product portfolio.
Further information regarding our acquisitions, investments and divestitures, see notes 4 and 5 e) of the notes to the consolidated financial statements included in this report.
Net cash provided by (used in) financing activities
In 2024 and 2023, net cash used in financing activities was €2,569 M and €1,859 M, respectively.
In 2024, cash was mainly used in the repayment of debt (including short and long-term debt, the accounts receivable securitization program as well as lease liabilities), payment of dividends and distributions to noncontrolling interests.
In 2023, cash was mainly used in the repayment of lease liabilities (including lease liabilities from related parties), the repayment of long-term debt (including the repayment at maturity of bonds in an aggregate principal amount of €650 M), the payment of dividends, distributions to noncontrolling interests and the repayment of short-term debt (including borrowings under our commercial paper program and short-term debt from related parties), partially offset by proceeds from long-term debt and short-term debt (including borrowings under our commercial paper program and short-term debt from related parties).
On May 22, 2024, we paid a dividend with respect to 2023 of €1.19 per share (€1.12 per share for 2022 paid in 2023). The total dividend payments in 2024 and 2023 were €349 M and €329 M, respectively.
The following chart summarizes our significant long-term financing instruments as well as their maturity structure at December 31, 2024:
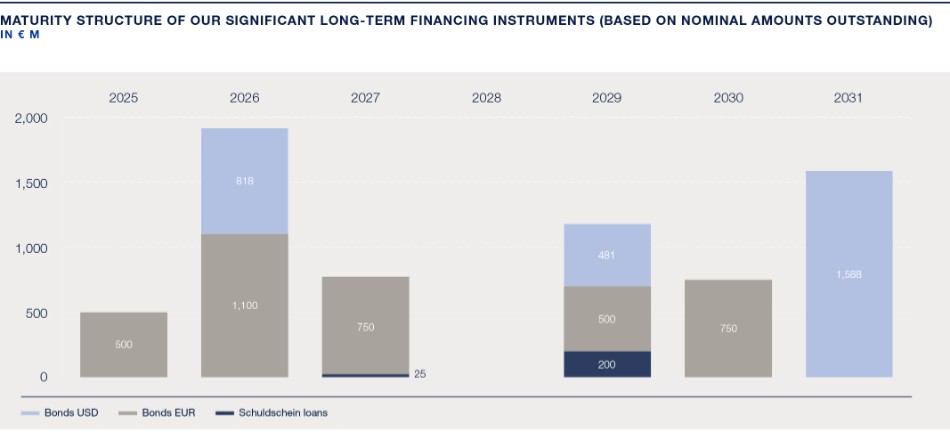
100
For a description of our short-term debt, long-term sources of liquidity and contractual cash flows (including interest) resulting from recognized financial liabilities and derivative financial instruments recorded in the consolidated balance sheets, see notes 16, 17 and 26 of the notes to the consolidated financial statements included in this report.
The following table summarizes our available sources of liquidity at December 31, 2024:
|
Available sources of liquidity |
|
|
|
|
|
|
|
|
|
|
|
in € M |
|
|
|
|
|
|
|
|
|
|
|
|
|
|
|
Expiration per period of |
||||||
|
|
|
|
|
Less than 1 |
|
|
|
|
|
|
|
|
|
Total |
|
year |
|
1-3 years |
|
3-5 years |
|
Over 5 years |
|
Syndicated Credit Facility |
|
2,000 |
|
— |
|
— |
|
2,000 |
|
— |
|
Other unused lines of credit |
|
1,508 |
|
938 |
|
570 |
|
— |
|
— |
|
|
|
3,508 |
|
938 |
|
570 |
|
2,000 |
|
— |
An additional source of liquidity is our commercial paper program, under which up to €1,500 M of short-term notes can be issued on a flexible and continuous basis. As of December 31, 2024, we did not utilize the commercial paper program. As of December 31, 2023, we utilized €400 M of the commercial paper program.
At December 31, 2024, we had short-term debt from unrelated parties (excluding the current portion of long-term debt) in the total amount of €2 M.
For information regarding other contractual commitments, see note 25 of the notes to the consolidated financial statements included in this report.
Although current and future economic conditions could adversely affect our business and our profitability, we believe that we are well positioned to continue to operate our business while meeting our financial obligations as they come due, and to resume growing our business as macroeconomic conditions improve and headwinds subside. Because of the non-discretionary nature of the health care services we provide, the need for health care products utilized to provide such services and the availability of government reimbursement for a substantial portion of our health care services, our business is generally not cyclical. A substantial portion of our accounts receivable is generated by governmental payors. While payment and collection practices vary significantly between countries and even between agencies within one country, government payors usually represent low to moderate credit risk. However, limited or expensive access to capital could make it more difficult for our customers to do business with us, or to do business generally, which could adversely affect our business by causing our customers to reduce or delay their purchases of our health care products (see “III. Results of operations, financial position and net assets” and Item 3.D, “Key Information — Risk factors,” above). If the conditions in the capital markets worsen, this could increase our financing costs and limit our financial flexibility.
At our AGM scheduled to be held on May 22, 2025, our Supervisory Board will propose to the shareholders a dividend of €1.44 per share for 2024, payable in 2025 (for 2023 paid in 2024: €1.19). The total expected dividend payment is approximately €423 M compared to dividends of €349 M for 2023 paid in 2024.
Our principal financing needs in 2025 relate to the repayment of bonds at maturity in July 2025. The dividend payment in May 2025, anticipated capital expenditures and, to a lesser extent, exercises of put options as well as further acquisition payments are expected to be covered by our cash flow, including the use of existing credit facilities and, if required, additional debt financing. We have sufficient flexibility to meet our financing needs in 2025.
101
|
V. |
Balance sheet structure |
Total assets as of December 31, 2024 decreased by 1% to €33.6 billion from €33.9 billion as compared to 2023. Apart from a 4% positive impact resulting from foreign currency translation, total assets decreased by 5% to €32.2 billion primarily due to a decrease in assets classified as held for sale as a result of divestitures in connection with Legacy Portfolio Optimization, goodwill, property, plant and equipment, right of use assets, cash and cash equivalents and trade accounts and other receivables from unrelated parties.
Current assets as a percent of total assets decreased to 24% at December 31, 2024 as compared to 26% at December 31, 2023, primarily as a result of an increase total assets driven by goodwill as a result of foreign currency translation as well as decreases in assets classified as held for sale as a result of divestitures in connection with Legacy Portfolio Optimization and cash and cash equivalents. The equity ratio, the ratio of our equity divided by total liabilities and shareholders’ equity, increased to 47% at December 31, 2024 as compared to 44% at December 31, 2023, primarily driven by a decrease in debt and an increase in shareholders’ equity driven by net income. ROIC increased to 3.5% at December 31, 2024 as compared to 2.8% at December 31, 2023 primarily driven by an increase in operating income over the last twelve months, including adjustments for acquisitions and divestitures made during the year with a purchase price above a €50 M threshold. ROIC excluding Legacy Portfolio Optimization costs was 4.2% at December 31, 2024. Goodwill, included in the item “Invested capital,” has a significant impact on the calculation of ROIC. The weighted average cost of capital (WACC), including weighted risk premiums for country risks, was 6.3%. See “— I. Performance management system — Return on invested capital (ROIC) (Non-IFRS Measure)” above.
For supplementary information on capital management and our capital structure, see note 21 of the notes to the consolidated financial statements included in this report.
|
VI. |
Risk Matrix |
In addition to the consolidated financial statements prepared in accordance with IFRS Accounting Standards included in this report, we are subject to home country reporting requirements in Germany. These require that we provide an assessment of the probability and impact of certain risks and uncertainties that could materially affect our outlook. A summary of such risk assessment is set forth below.
Although we believe our FY 2025 outlook, which we issued in connection with the announcement of our results for the 2024 fiscal year, is based on reasonable assumptions, it is subject to risks and uncertainties that may materially impact the achievement of the outlook. In the following table, we have listed certain risks and the corresponding risk factor (or other discussion of such risks) within this report as well as our assessment of the reasonable probability and potential impact of these known risks on our results for the FY 2025. The risks and their related risk factors or other disclosure headings have been paired together to provide further information on the risks as well as provide an indication of the locations at which they are discussed in this report. The assessment below should be read together with the discussions of such risks and uncertainties contained in Item 3.D, “Key Information — Risk factors” and Item 11, “Quantitative and qualitative disclosures about market risk.” Our Litigation risk represents an assessment of material litigation currently known or threatened and is discussed in note 25 of the notes to the consolidated financial statements included in this report. These assessments by their nature do not purport to be a prediction or assurance as to the eventual resolution of such risks. As with all forward-looking statements, actual results may vary materially. See “Forward-looking Statements” immediately following the Table of Contents to this report. Other risks discussed in Item 3.D, “Key Information — Risk factors,” that are not included in the table below were deemed to have a medium to long-term potential effect on our business, financial condition and results of operations. The classification of potential impact and likelihood as well as the localization of the risks within the risk matrix are depicted below:
102
|
Potential impact |
|
Description of impact |
|
Classification |
|
Likelihood |
|
|
Severe |
|
Material negative impact |
|
Almost certain |
|
> 90% to 100 |
% |
|
Major |
|
Significant negative impact |
|
Likely |
|
> 50% to 90 |
% |
|
Medium |
|
Moderate negative impact |
|
Possible |
|
> 10% to 50 |
% |
|
Low |
|
Small negative impact |
|
Unlikely |
|
0% to 10 |
% |
|
Likelihood |
|||||||||
|
|
|
|
Low |
|
Medium |
|
Major |
|
Severe |
103
|
Risk Number |
|
Risk factor (or other related disclosure) within the report |
|
|
|
|
|
|
|
1 |
|
If we do not comply with the numerous governmental regulations applicable to our business, we could suffer adverse legal consequences, including exclusion from government health care programs or termination of our authority to conduct business, any of which would result in a material decrease in our revenue; this regulatory environment also exposes us to claims and litigation, including “whistleblower” suits. |
|
|
2 |
|
If certain of our investments or value and risk-based care programs with health care organizations and health care providers are found to have violated the law, our business could be adversely affected. |
|
|
3 |
|
If we fail to estimate, price for and manage medical costs in an effective manner, the profitability of our value and risk-based care programs could decline and could materially and adversely affect our results of operations, financial position and cash flows. |
|
|
4 |
|
There are significant risks associated with estimating the amount of health care service revenues that we recognize that could impact the timing of our recognition of revenues or have a significant impact on our operating results and financial condition. |
|
|
5 |
|
Any material disruption in government operations and funding could have a material adverse impact on our business, financial condition and results of operations. |
|
|
6 |
|
A dependency on the payment behavior and decision-making of our business partners can affect the collectability of accounts receivable. |
|
|
7 |
|
Changes in reimbursement, payor mix and/or governmental regulations for health care could materially decrease our revenues and operating profit. |
|
|
8 |
|
We operate in a highly regulated industry such that the potential for legislative reform provides uncertainty and potential threats to our operating models and results. |
|
|
9 |
|
We could be adversely affected if we experience shortages of goods or material price increases from our suppliers, or an inability to access new and improved products and technology. |
|
|
10 |
|
If we are unable to attract and retain skilled medical, technical, engineering or key strategic personnel, or if legislative, union, other labor-related activities or changes or employee absenteeism and turnover result in significant increases in our operating costs or decreases in productivity, we may be unable to manage our growth, continue our technological development or execute our strategy. |
|
|
11 |
|
We operate in many different jurisdictions and we could be adversely affected by violations of the U.S. Foreign Corrupt Practices Act and similar worldwide anti-corruption laws. |
|
|
12 |
|
Cyber-attacks or other privacy and data security incidents could disrupt our business and expose us to significant losses, liability and reputational damage. |
|
|
13 |
|
Our indebtedness may prevent us from fulfilling our debt-service obligations or implementing certain elements of our business strategy. |
|
|
14 |
|
Foreign currency and interest rate exposure. See Item 5, “Operating and financial review and prospects – IV. Financial position,” Item 11, “Quantitative and qualitative disclosures about market risk – Market risk” and note 26 of the notes to the consolidated financial statements included in this report. |
|
|
15 |
|
Legal and regulatory matters (see note 25 of the notes to the consolidated financial statements included in this report). |
|
|
16 |
|
Diverging views of fiscal authorities or changes in tax legislation could require us to make additional tax payments. |
|
|
17 |
|
As a company with operations spanning around 150 countries, we face specific risks from our global operations. |
|
|
18 |
|
We are subject to risks associated with unpredictable events, such as public health crises and epidemics/pandemics or other significant events beyond our control. |
|
|
19 |
|
Global economic conditions as well as disruptions in financial markets could have an adverse effect on our businesses. |
|
|
20 |
|
If we are unable to meet applicable legal requirements and/or market expectations with respect to sustainability, both our business and our reputation could suffer. We could be subject to fines and other financial burdens associated with global environmental, social and governance regulations, laws and activities, and we could alienate our patients, employees, customers, partners, investors and the communities we serve. Furthermore, if we do not meet investors’ or certain markets’ ESG standards, the market for our securities could be adversely impacted. |
|
|
21 |
|
We need to develop new internal functions to perform certain business services that Fresenius SE provided to us prior to the Conversion. |
|
VII. Research and development
Health care systems face major financial challenges. With our R&D activities, we aim to develop innovative products and therapies that not only meet high quality standards and improve clinical outcomes, but are also affordable. As an operator of proprietary dialysis clinics and a provider of products for treating patients at home, we believe that these goals are entirely compatible.
104
Global research and development strategy
Our R&D strategy contributes to our corporate strategy, which aims to provide health care for chronically and critically ill patients across the renal care continuum by developing adjacent products and therapies utilizing ECMO as well as by developing and acquiring complementary assets. Furthermore, our globally-oriented R&D strategy enables us to respond more effectively to the worldwide rise in demand for high-quality yet cost-efficient treatment and therapy methods. In doing so, we also take regional or local market conditions into account and offer a differentiated product range across all three key areas of our corporate strategy. See Item 4B “Business overview — Major markets and competitive position” and “— Our strategy and competitive strengths” above.
In conjunction with our R&D activities, we collaborate with external partners to expand our comprehensive innovation and technology network. These partners include numerous academic institutions, such as research institutes at prestigious universities in the U.S. With the Renal Research Institute (RRI) in New York, our subsidiary, we have a renowned institution in the field of clinical research into all aspects of CKD that is working on fundamental issues relating to renal therapies.
In addition, Fresenius Medical Care Ventures collaborates with start-ups and early-stage companies with the objective of promoting an open culture of innovation and enabling access to the latest technologies.
R&D highlights in 2024
In 2024, RRI, as well as the Biomedical Evidence Generation (BMEG) and Computational Medicine (CM) teams within the GMO, undertook several R&D initiatives. These efforts highlighted our commitment to improving care for patients with ESRD and advancing the field of nephrology. A unifying theme across all these initiatives is the enhancement of patient care through personalized and precision medicine.
Advancements in dialysis technology and personalized therapy
RRI and CM have developed innovative approaches to improve personalized fluid management, anemia treatment and dialysis technology. These initiatives aim to create safer, more personalized treatments that enhance patient experience and outcomes.
| a. | Fluid management: The Adaptive Ultrafiltration Controller (aUFC), developed by RRI and CM, is designed to adjust fluid removal rates in real-time during dialysis. This technology has the potential to significantly improve patient outcomes by optimizing fluid management and has received the 21 st Century Breakthrough Device designation from the FDA, highlighting its potential to transform patient care. The BMEG team has developed a protocol for a study of the aUFC, scheduled for 2025, which will play a key role in the planned FDA submission. This study represents a critical step toward the widespread adoption of this technology in clinical practice. |
| b. | Anemia management: Anemia InSights, a physiology-based mathematical model and predictive tool that customizes anemia management developed by RRI and CM, is designed to improve the attainment of target hemoglobin levels and decrease the utilization of ESAs. The results of a randomized controlled trial of this model have been published in the Clinical Journal of the American Society of Nephrology (2024 Jun 11;19(9):1138-47). |
| c. | HVHDF and patient reported outcomes: BMEG staff played a pivotal role in the design, execution, analysis and publication of the CONVINCE study, which assessed the impact of HVHDF on patient outcomes. Notably, the study demonstrated significant improvements in patient-reported outcomes, including a slower decline in cognitive function (Kidney International, 2024 Nov;106(5):961-971). |
Artificial intelligence (AI) applications
RRI is also developing AI applications in the dialysis space. These applications underscore RRI’s commitment to harnessing data-driven insights to address complications and improve care delivery.
105
| a. | RRI has advanced the application of AI in dialysis care with tools such as the intradialytic hypotension prediction model. This model accurately forecasts blood pressure drops during dialysis, allowing for proactive adjustments to enhance patient safety and outcomes. The findings from this work have been published in Nephrology Dialysis Transplantation (2023 Jun 30;38(7):1761-1769). RRI has developed a dashboard for this prediction model which is currently awaiting IT integration. |
| b. | Also, RRI is actively developing AI-driven tools to enhance vascular health management, including a mobile application designed to classify arteriovenous fistula (AVF) aneurysms. This app enables timely detection and intervention for patients at risk, supporting improved clinical outcomes. Initial findings have been published in the Clinical Kidney Journal (2021 Dec 16;15(4):829-830). RRI aims to submit this application as a medical device to the FDA by 2025. |
| c. | Nutrition plays a vital role in the well-being of patients with kidney disease, necessitating a personalized approach to address their unique dietary needs. RRI is leveraging generative AI to enhance precision nutrition strategies, considering medical, socio-economic and cultural factors for a highly diverse patient population. The initial results from this work have been published in the Journal of Renal Nutrition (2024 Nov;34(6):477-481) and presented at international conferences, showcasing the potential of AI-driven solutions to improve dietary guidance and overall patient care. |
For information on risks related to AI and our response to managing those risks, see Item 16K. “Cybersecurity.”
Biomarker research and lab sciences
Metabolomics and proteomics provide insights into a patient’s condition. The RRI Research Lab focused on the following projects within the field of dialysis-related multiomics:
| a. | Prediction of AVF maturation outcomes: A significant proportion of newly created AVF fail to mature into functional vascular accesses. To address this challenge, RRI, in collaboration with Manchester University has identified a panel of metabolomic biomarkers that can predict AVF maturation success. These biomarkers offer valuable insights to improve decision-making in vascular access planning. Preliminary findings have been presented at international conferences, highlighting the potential impact of this research on clinical practices. To further validate these biomarkers, RRI has initiated a partnership with the U.S. National Institutes of Health for a large-scale evaluation in a broader patient cohort. This collaborative effort aims to refine predictive tools for AVF maturation, ultimately improving outcomes for patients requiring vascular access. |
| b. | Studies on PD: Spent peritoneal dialysate contains thousands of metabolites that provide valuable information about the function of the peritoneal membrane. The RRI Research Lab is leveraging advanced laboratory techniques and machine learning to analyze these metabolomic patterns, aiming to assess the membrane’s ability to remove fluid and waste products efficiently. This approach seeks to replace some of the current testing methods, which are often cumbersome and time-consuming, with faster, more precise evaluations. By streamlining the assessment process, RRI aims to enhance the management and outcomes of PD therapy. |
| c. | Identification of a uremic toxin: When the kidneys fail, waste products known as uremic solutes accumulate in the body, contributing to various complications. In collaboration with academic partners, RRI has identified a specific solute, uremic solute 3-carboxy-4-methyl-5-propyl-2-furanpropionate (CMPF), which is believed to play a role in the development of anemia in patients with kidney disease. Current research is focused on developing methods to enhance the removal of CMPF, aiming to mitigate its impact on anemia and improve patient outcomes. This work represents a significant step toward better understanding and managing the complex effects of uremic solutes in kidney failure. |
Strengthening global research partnerships
In 2024, RRI strengthened its global collaborations with academic and clinical partners, driving innovation in kidney care through expanded initiatives. Highlights include the growth of the MONDO International Network and partnerships with leading institutions such as Imperial College London, the University of Maryland, the University of California, Santa Barbara and Maastricht University. These collaborations promote data-sharing and knowledge exchange, fostering a dynamic ecosystem for research and development. Additionally, RRI continued its commitment to education by providing training opportunities for students from Fisk University, Nashville.
These R&D highlights reflect the multifaceted approach by RRI, BMEG, and CM to enhance ESRD treatment and patient quality of life, from advanced technologies to translational research. The developments set a foundation for ongoing innovation in renal care.
106
Innovations in 2024
We are working on new products that are close to market launch and have an extensive portfolio of innovation projects. These focus on technologies in our core business as well as related areas of strategic interest.
The digitalization of products and processes in health care is a key aspect of innovation. We are primarily focused on connecting patients, physicians and nursing staff, improving nursing documentation at the point of care and improving water treatment technologies through automation. We leverage data and know-how from Care Enablement, our Care Delivery clinics and GMO to help identify new medical product and service innovations as well as the potential for digitalization. Our goal is to achieve better treatment results for our patients, seamless connectivity, workflow optimization for nurses and significant reductions in treatment costs for our customers.
Home dialysis
Home dialysis is a rapidly growing part of our overall business. In 2024, over 14,500 U.S.-based patients were utilizing the NxStage portable HHD systems (2023: over 13,500). This development was enabled by the introduction of the new, FDA-approved GuideMe software on the NxStage VersiHD cycler to the U.S. market. GuideMe’s digital technology leverages the touchscreen interface to offer an enhanced user experience for patients and nurses with walk-through graphical guidance, improving ease of learning and skill retention while facilitating the transition to home dialysis.
In March 2024, we also launched the NxStage VersiHD cycler in Europe. Additionally, we continued our drive towards cost optimization for the NxStage portfolio by in-sourcing pre-mixed dialysate bags which were cleared by the FDA in January 2024.
In addition to the NxStage launches, the introduction of the Liberty Select Cycler with kinexus PD bidirectional remote therapy management in 2024 advanced PD management. This technology enables clinical teams to remotely access patient treatment data and programs or update patient prescriptions. Since launching in the U.S., approximately 27,000 therapy prescription programs have been delivered remotely, and data for over 4.5 M patient treatments have been digitally transmitted.
In May 2024, we introduced kinexus PD Remote Therapy Management in certain European countries for both CAPD and APD patients utilizing the sleep.safe harmony cycler and plan to continue expanding to additional countries in Europe and Asia.
In-center dialysis
In February 2024, we received 510(k) clearance from the FDA for our 5008X Hemodialysis System, enabling us to initiate clinical evaluations and user studies in the U.S. prior to the planned commercial launch starting in 2026. We have successfully conducted a variety of different treatment modalities, including HVHDF dialysis therapy, which we will offer more broadly to dialysis patients in the U.S. in the coming years.
The digitalization of our in-center therapy enhances patient care through personalized treatments and remote monitoring, which reduce overall dialysis-related health care costs, drive innovation and improve operational efficiency, ensuring regulatory compliance and boosting data management capabilities.
We have also expanded automation in dialysis water pre-treatment with online-monitoring solutions via our AquaSENS and AquaSOFT quality offerings. In 2024, we introduced PuraSafe, a remote monitoring system for our central reverse osmosis system, in select markets.
Critical care
We provide hospitals and intensive care units (ICUs) with a comprehensive portfolio of technologies for the extracorporeal organ support of critically ill patients.
Our multiFiltratePRO platform provides ICU staff with a wide range of features to support patient care in continuous renal replacement therapy. In 2024, we added the hemoperfusion mode to enhance the therapeutic capabilities of multiFiltratePRO. Further technological developments included a new-design monitor and secure connectivity board (SCB) to strengthen cybersecurity, scheduled for release in 2026. We also advanced production of domestic multiFiltratePRO in China after obtaining approval from the Chinese authorities and successfully delivering the first machines to our Chinese customers in August 2024.
107
The introduction of our own PVC-free Biofine® foil for our CiCa® dialysate bags facilitated cost reductions, with production having commenced in December 2024. In May 2024, we obtained 510(k) clearance for our pureFLOW fluids 400, 401, 402, and 407, as well as Special 510(k) clearance for our new multiFlux 1000 filter for use in acute renal failure.
Our Apheresis Pathogen Reduction Device (APRED) is designed to provide health care professionals with a modern, technologically advanced device for therapeutic apheresis. In August 2024, we obtained CE MDR certification for APRED and, following the subsequent market launch, the first lipoprotein apheresis treatments were carried out with APRED in September 2024.
Furthermore in 2024, we developed multiHL7, providing a connectivity solution for multiFiltratePRO devices. Connectivity was a key driver in the upgrade of our Xenios 2.0 console. The system supports the simple implementation of standards-based medical data, allowing for the flexible integration of machine data into various patient monitoring systems. Medical data are automatically sent to a patient data management system or electronic medical record, which can significantly reduce the workload for health care providers by streamlining documentation and data management processes.
In August 2024, we obtained MDR approval for Xenios 2.0, our new ECLS treatment system enabling health care professionals to provide the full range of ECLS treatments for neonatal and adult patients. Developed with safety features, a simplified guided user interface and improved connectivity, the system provides cutting-edge technology and intelligent troubleshooting for physicians and caregivers.
A related development was the launch of our Ready4 multiFiltratePRO Augmented Reality training application. This training supplement uses augmented reality to overlay digital elements in the real world, aiding the proficiency and confidence of users of the multiFiltratePRO acute dialysis device in ICUs.
R&D resources
R&D expenditure corresponded to 4% (2023: 6% and 2022: 6%) of our health care product revenue. At the end of 2024, our patent portfolio comprised some 9,529 property rights across approximately 1,586 patent families, i.e. groups of patents linked to the same invention. In 2024, we produced around 54 additional patent families. Our broad portfolio of patents provides us with a wide range of treatment options in this competitive field.
As of December 31, 2024, 1,384 employees (total headcount) worked for the Company in R&D worldwide (December 31, 2023: 1,358). These employees come from various backgrounds, with professionals from medical, business and technical fields collaborating alongside software, data and AI specialists on interdisciplinary teams. The majority of our R&D staff, over 840 employees, are based in Europe. Most R&D activities are carried out at our facilities in Schweinfurt and Bad Homburg v. d. Höhe (Germany). Other development sites are in St. Wendel (Germany), Bucharest (Romania), Palazzo Pignano (Italy) and Krems (Austria). In the U.S., we maintain a center of excellence for the development of dialyzers and other disposable products in Ogden, Utah. In China, development activities in Shanghai and Changshu are focused on the growing demand for cost-effective dialysis systems in Asia and emerging markets. The Global R&D organization coordinates collaboration and knowledge-sharing across all these sites.
|
Research and development expenditures |
||||||
|
in € M |
|
|
|
|
|
|
|
|
|
2024 |
|
2023 |
|
2022 |
|
Total |
|
183 |
|
232 |
|
229 |
|
Employees |
||||||
|
Total headcount, as of December 31, for the respective period presented |
|
|
|
|
|
|
|
|
|
2024 |
|
2023 |
|
2022 |
|
Total |
|
1,384 |
|
1,358 |
|
1,235 |
|
Number of patents |
||||||
|
As of December 31, for the respective period presented |
|
|
|
|
|
|
|
|
|
2024 |
|
2023 |
|
2022 |
|
Total |
|
9,529 |
|
9,537 |
|
10,086 |
VIII. Trend information
For information regarding significant trends in our business see Item 5, “Operating financial review and prospects.”
108
|
IX. |
Tabular disclosure of contractual obligations |
The information required by this item may be found in Item 5B under the caption “– IV. Financial position – net cash provided by (used in) financing activities.”
Item 6. Directors, senior management and employees
|
A. |
Directors and senior management |
General
Under the German Stock Corporation Act ( Aktiengesetz or AktG ), our corporate bodies are our Management Board, Supervisory Board and general meeting of shareholders. For a detailed discussion of our legal and management structure, see Item 16G, “Corporate governance — The legal structure of the Company.” The business address of all members of our Management Board and our Supervisory Board, as described below, is Else-Kröner-Strasse 1, 61352 Bad Homburg, Germany.
Supervisory Board
Pursuant to Article 8 paragraph 1 of the Articles of Association of the Company, the Supervisory Board of the Company consists of twelve members, of whom, subject to the existence of the appointment right pursuant to Article 8 paragraph 2 of the Articles of Association, six are to be elected by the general meeting of shareholders (shareholder representatives) and six are to be elected by the employees (employee representatives) in accordance with the provisions of the German Co-Determination Act (MitbestG). Pursuant to Article 8 paragraph 2 of the Articles of Association, Fresenius SE & Co. KGaA, if it holds shares in the Company with a proportionate amount of the share capital of the Company of at least 15%, is entitled to appoint one of the Supervisory Board members representing the shareholders; if Fresenius SE & Co. KGaA holds shares in the Company with a proportionate amount of the share capital of the Company of at least 30%, it is entitled to appoint two of the Supervisory Board members representing the shareholders.
The EGM of the Company on July 14, 2023, which resolved on the change of the legal form of the Company into the legal form of an AG, also held elections to the Supervisory Board. Mr. Shervin J. Korangy, Dr. Marcus Kuhnert, Mr. Gregory Sorensen, M.D. and Ms. Pascale Witz were elected as members of the Supervisory Board of the Company in the legal form of an AG. Fresenius SE & Co. KGaA, which holds shares in the Company with a proportionate amount of the share capital of the Company of approximately 32.2%, appointed Mr. Michael Sen and Ms. Sara Hennicken to the Supervisory Board on the same day.
Upon motion of the Management Board of the Company, the competent local court in Hof (Saale), Germany, by resolution dated January 23, 2024 appointed Ms. Stefanie Balling, Ms. Beate Haßdenteufel, Mr. Frank Michael Prescher, Dr. Manuela Stauss-Grabo, Mr. Ralf Erkens and Ms. Regina Karsch as employee representatives to the Supervisory Board of the Company, effective January 26, 2024. Ms. Stefanie Balling, Ms. Beate Haßdenteufel and Mr. Frank Michael Prescher are employees of the Company in accordance with Section 7 paragraph 2 no. 1, paragraph 4 MitbestG. Dr. Manuela Stauss-Grabo was appointed as a representative of the executive employees of the Company in accordance with Section 7 paragraph 2 no. 1, paragraph 4 MitbestG in combination with Section 15 paragraph 1 sentence 2 MitbestG. Mr. Ralf Erkens and Ms. Regina Karsch are representatives of the trade union IGBCE in accordance with Section 7 paragraph 2 no. 1 MitbestG. IGBCE is the trade union represented in the Company within the meaning of Section 7 paragraph 5 MitbestG.
The Supervisory Board of the Company thus includes the number of members representing each constituency (shareholders and employees) as required by law and by our Articles of Association. The judicial appointment of the employee representatives is effective for the period until the election of the employee representatives by the employees of the Company entitled to vote have been completed in accordance with the relevant statutory provisions. The election of the employee representatives is expected to be completed in the middle of 2025.
At its meeting on March 14, 2024, the Supervisory Board elected Mr. Michael Sen as Chair and Ms. Stefanie Balling as Deputy Chair of the Supervisory Board. Mr. Sen had already been elected as Chair of the Supervisory Board at its meeting on July 14, 2023. Ms. Balling, in her position as Deputy Chair, succeeded Ms. Hennicken, who had been elected as Deputy Chair of the Supervisory Board at its meeting on July 14, 2023.
109
Unless the General Meeting specifies a shorter term of office, the Supervisory Board members are elected in accordance with Article 8 paragraph 3 of the Articles of Association of the Company until the end of the ordinary General Meeting which resolves on the discharge of the Supervisory Board members for the fourth fiscal year after commencement of the term of office. The fiscal year in which the term of office commences is not considered for this calculation. The same applies for the Supervisory Board members to be elected by the employees. However, the election of the first Supervisory Board of the Company in the form of an AG by the EGM and the appointment by Fresenius SE & Co. KGaA each took place for the period until the end of the General Meeting of the Company which resolves on the ratification of actions of the members of the Supervisory Board of the Company for fiscal year 2026. This deviation was effected in line with the Articles of Association of the Company with a view to preferences that had been expressed by investors and proxy advisors. The term of office of those members of the Supervisory Board to be elected by the employees who must be employees of the Company is subject to additional requirements in accordance with Sections 7 paragraph 4, 6 paragraph 2 sentence 1 MitbestG. Among other things, they must have reached the age of 18 and have been with the Company for one year. If a Supervisory Board member who must be an employee of the Company in accordance with Section 7 paragraph 2 MitbestG loses his or her eligibility for election, that board member’s office expires.
The elections of the shareholder representatives are conducted in accordance with recommendation C.15 of the German Corporate Governance Code (GCGC) as individual elections. In case of election proposals to the General Meeting, a curriculum vitae is provided for each candidate in accordance with recommendation C.14 of the GCGC, and any personal or business relationship of a candidate with the enterprise, the corporate bodies of the Company or a significant shareholder of the Company are disclosed in accordance with recommendation C.13 of the GCGC.
The Supervisory Board has resolved a standard age limit for its members and shall, as a rule, only include persons who have not reached the age of 75 years at the time of their election or appointment. Before the expiration of their term, any member of the Supervisory Board may be removed by court upon formal request of a simple majority of the Supervisory Board if there is good cause for such removal (for example, a severe breach of duty as a Supervisory Board member). Members elected by the shareholders may also be removed by a resolution of the general meeting of shareholders with a majority of three quarters of the votes cast at such general meeting. The employee representatives may also be removed by a voting decision by all employees of the Company in Germany requiring a 75% majority of the votes cast; the motion for removal must be submitted by the relevant employee group (non-executive employees, executive employees or union).
Our Supervisory Board ordinarily passes resolutions by a simple majority of the votes cast. The Chair, who is typically selected from among the Supervisory Board members elected by the shareholders, has a tie-breaking vote in case of any deadlock. The principal function of the Supervisory Board is to oversee the management of the Company, including to appoint and to supervise the Management Board in its management of the Company, to be involved in involved in strategy and planning, to approve dividend payments and other matters which are not in the ordinary course of business or are of fundamental importance to us. The Supervisory Board is also responsible for determining the compensation for the individual members of the Management Board as well as determining and reviewing the compensation system for the members of the Management Board.
The table below provides the names of the current members of the Supervisory Board and their ages:
|
Name |
|
Current Age |
|
Shareholder Representatives |
|
|
|
Mr. Michael Sen, Chair (1), (2), (5) |
|
56 |
|
Ms. Sara Hennicken (2) |
|
44 |
|
Mr. Shervin J. Korangy (2), (3) |
|
50 |
|
Dr. Marcus Kuhnert (1), (4) |
|
56 |
|
Mr. Gregory Sorensen, M.D. (4), (5) |
|
62 |
|
Ms. Pascale Witz (2), (3) |
|
58 |
|
Employee Representatives |
|
|
|
Ms. Stefanie Balling (1), (4), (5) |
|
56 |
|
Mr. Ralf Erkens (1) |
|
59 |
|
Ms. Beate Haßdenteufel (5) |
|
54 |
|
Ms. Regina Karsch (3) |
|
41 |
|
Mr. Frank Michael Prescher (4) |
|
61 |
|
Dr. Manuela Stauss-Grabo (3) |
|
56 |
| (1) | Member of the Presiding Committee. |
| (2) | Member of the Nomination Committee. |
| (3) | Member of the Compensation Committee. |
110
| (4) | Member of the Audit Committee. |
| (5) | Member of the Mediation Committee. |
For information regarding the Supervisory Board committees, see “Board Practices,” below.
Shareholder representatives
MR. MICHAEL SEN has been Chair of the Supervisory Board since the Conversion (previously Chair of the supervisory board of Management AG since October 1, 2022). Mr. Sen has also been the Chief Executive Officer of Fresenius SE and Chair of the Management Board of Fresenius Management SE since October 1, 2022. Mr. Sen joined the management board of Fresenius Management SE in April 2021 as the Chair of the Management Board of Fresenius Kabi AG, a wholly owned subsidiary of Fresenius SE specializing in lifesaving medicines and technologies for infusion, transfusion and clinical nutrition. Mr. Sen served as CEO of Fresenius Kabi AG until a successor was appointed in March 2023 and has served as Chair of Fresenius Kabi AG’s supervisory board since March 2023. Before joining Fresenius Kabi AG, Mr. Sen was a member of the Management Board of Siemens AG, where he was responsible for the health care business Siemens Healthineers and for Siemens’ energy business. Prior to that, he was Chief Financial Officer of E.ON SE. At the start of his professional career, Mr. Sen completed an apprenticeship at Siemens in Berlin and then studied business administration at the Technical University of Berlin.
MS. SARA HENNICKEN has been the Chief Financial Officer of Fresenius SE since September 1, 2022. Ms. Hennicken became a member of the Company’s Supervisory Board upon the Conversion (previously Ms. Hennicken had been a member of the supervisory board of Management AG since September 1, 2022). She is also a member of the supervisory board of Fresenius Kabi AG since September 1, 2022 and, after having served as its Chair, became its Deputy Chair on March 8, 2023. Ms. Hennicken also serves as a member of the supervisory board of VAMED AG as of December 14, 2022 and became its Deputy Chair on July 12, 2023. In May 2024, Ms. Hennicken was appointed a member of the supervisory board of Deutsche Lufthansa AG. Ms. Hennicken joined Fresenius SE in 2019 as Senior Vice President Global Treasury & Corporate Finance for Fresenius and Fresenius Medical Care. Previously, she spent 14 years in investment banking, including nine years at Deutsche Bank, lastly as Managing Director and Senior Client Executive in Corporate Finance Coverage before moving to Fresenius. Between 2005 and 2010 she worked for Citigroup in Frankfurt and London. Ms. Hennicken studied economics in Germany and in the United States.
MR. SHERVIN J. KORANGY became a member of the Supervisory Board upon effectiveness of the Conversion. Mr. Korangy currently serves as the President and the Chief Executive Officer and a member of board of directors of BVI Medical, Inc. (BVI), a TPG Capital portfolio company, that is a global developer, manufacturer and marketer of devices for ophthalmic surgery. Prior to his current role at BVI, Mr. Korangy served as the Chief Financial Officer and Chief Strategy Officer from 2017 to 2019. Prior to joining BVI, Mr. Korangy served as a senior executive of Novartis AG, a diversified health care products company, from 2010 until March 2017. During his seven years at Novartis, he served in various international capacities spanning strategy, mergers & acquisitions, integrations, sales & marketing and general management, including serving as the Global Head of Corporate Finance based in Switzerland. In 2011, Mr. Korangy co-founded Sight Sciences, Inc., a medical device company. Previously, he was a Managing Director at the Blackstone Group, one of the largest global investment firms, which he joined in 1996. During his more than 14 years at Blackstone, he served as both an advisor in the Restructuring/Special Situations business and as an investor in the Private Equity business. Mr. Korangy currently serves as a member of the Board of Directors for The Hain Celestial Group, Inc., a leading marketer, manufacturer and seller of organic and natural, “better-for-you” consumer products. He is Chair of the compensation committee and a member of the nominating and governance committee at Hain. Mr. Korangy serves on the Undergraduate Board of the Wharton School since July 2024. Mr. Korangy has served on the Wharton McNulty Leadership Advisory Board, established by the Center for Leadership and Change Management, since January 2019. Mr. Korangy is a graduate of The Wharton School at the University of Pennsylvania.
DR. MARCUS KUHNERT became a member of the Supervisory Board upon effectiveness of the Conversion. Dr. Kuhnert was a member of the Executive Board and Chief Financial Officer of Merck KGaA, a global science and technology company headquartered in Darmstadt, Germany, from August 2014 until June 30, 2023. Dr. Kuhnert continued to serve as a member of the Executive Board of E. Merck KG until July 31, 2024. In September 2017, Dr. Kuhnert additionally took over the responsibility for the newly-founded Business Services of Merck KGaA, Darmstadt, Germany. Dr. Kuhnert also assumed the accountability for Group Procurement in October 2018 and for IT in July 2020. Before joining Merck KGaA, Dr. Kuhnert worked for Henkel AG & Co. KGaA (a global chemical and consumer goods company headquartered in Düsseldorf, Germany), most recently as Chief Financial Officer of the Laundry & Home Care business unit. Dr. Kuhnert studied Business Administration and Mechanical Engineering at the Technical University of Darmstadt from which he received a PhD. Dr. Kuhnert is a member of the Board of Directors of Döhler Group SE, a global producer and provider of technology-based ingredients and ingredient systems for the food and beverage industries based in Darmstadt, Germany. He is also a member of the supervisory board of MEWA Textil-Service SE, Germany, and maxingvest GmbH & Co. KGaA, Germany.
111
MR. GREGORY SORENSEN, M.D., became a member of the Supervisory Board of the Company on May 20, 2021. Until effectiveness of the Conversion, he was also a member of the supervisory board of Management AG since May 2021. Mr. Sorensen holds an M.D. degree from Harvard Medical School, an MS in Computer Science from Brigham Young University and a BS in Biology from the California Institute of Technology. Since August 2023, Mr. Sorensen is a member of the Board of Directors and the Chief Science Officer of RadNet, Inc. Mr. Sorensen has been President of DeepHealth, Inc. (a subsidiary of RadNet, Inc.) and Executive Chair of the Board of Directors of IMRIS (Deerfield Imaging, Inc.) since 2015. From 2011 until 2015, he was President and Chief Executive Officer of Siemens Medical Solutions USA, Inc. Mr. Sorensen was a member of the supervisory board of Siemens Healthineers AG from April 2018 until February 2023.
MS. PASCALE WITZ became a member of the Supervisory Board of the Company on May 12, 2016. Until effectiveness of the Conversion, she was also a member of the supervisory board of Management AG since May 2021. Ms. Witz is currently president of PWH Advisors, a strategic advisory firm serving life sciences companies. Ms. Witz was a member of the Executive Committee of Sanofi S.A., serving as Executive Vice President, Diabetes and Cardiovascular, after serving as Executive Vice President, Global Pharmaceutical Divisions. From 2009 to 2013, Ms. Witz was President and CEO of GE Healthcare Pharmaceutical Diagnostics. Previously, Ms. Witz held a number of other executive positions at GE Healthcare and Becton Dickinson. Ms. Witz has served on the Board of Directors of Regulus Therapeutics Inc. since June 1, 2017, Horizon Therapeutics from August 3, 2017 until October 6, 2023, and Revvity, Inc. (formerly known as Perkin Elmer Inc.) since October 30, 2017.
Employee representatives
MS. STEFANIE BALLING became a member of the Supervisory Board on January 26, 2024. Ms. Balling also currently serves as Chair of the general works council of the Company and has been chair of the Schweinfurt works council of D-GmbH since 2010. Since 2006, Ms. Balling has worked as a strategic buyer for D-GmbH and has also served as a member of the examination committee of the Wuerzburg-Schweinfurt Chamber of Industry and Commerce since 2014. From 2018 to 2023, Ms. Balling served as Chair of the general works council of Fresenius SE.
MR. RALF ERKENS became a member of the Supervisory Board on January 26, 2024. As of November 2024, Mr. Erkens is a Specialist Secretary of the Industrial Union for Mining, Chemical and Energy (IGBCE). Previously, he was the District Manager of the Rhine-Main union district for the IGBCE since 2013. Mr. Erkens also served as District Manager of the IGBCE’s Schleswig-Holstein district from 2010 to 2013 and Deputy District Manager of its Hamburg/Harburg district from 2005 to 2010. Mr. Erkens is a member of the supervisory board of Abbott GmbH in Wiesbaden, Germany.
MS. BEATE HAßDENTEUFEL became a member of the Supervisory Board on January 26, 2024. Ms. Haßdenteufel has served as Chair of the representative body for the severely disabled employees at our St. Wendel facility since 2013 and Deputy Chair of the St. Wendel works council since 2012. From 2022 to 2023, Ms. Haßdenteufel served as Second Deputy of the joint representative body for disabled employees at Fresenius SE.
MS. REGINA KARSCH became a member of the Supervisory Board on January 26, 2024. Ms. Karsch has been the Board Secretary to the Deputy Chair of the IGBCE in Hanover, Germany since 2022. Prior to her current position, Ms. Karsch served as a Trade Union Secretary of the IGBCE from 2020 to 2021, Head of the Diversity & Anti-Discrimination Department of the IGBCE from 2018 to 2020, and in other IGBCE positions from 2015 to 2017. Ms. Karsch holds a Master of Arts of Political Science and History degree from Gottfried Wilhelm Leibniz University in Hanover, Germany.
MR. FRANK MICHAEL PRESCHER became a member of the Supervisory Board on January 26, 2024. Mr. Prescher has been employed since 2017 as a Nursing Service Manager at Nephrocare Mönchengladbach GmbH and has served as Chair of the works council of Nephrocare Mönchengladbach GmbH since 2016. From 1993 to 2016, Mr. Prescher worked in Technical Management at Dialysis Center Dr. Ropertz u. Dr. Jennessen. Mr. Prescher trained as a registered nurse at Franziskus Hospital in Mönchengladbach, Germany.
DR. MANUELA STAUSS-GRABO became a member of the Supervisory Board on January 26, 2024. Dr. Stauss-Grabo has been Senior Vice President and Head of Clinical Research in the Global Medical Office of the Company since 2024. From 2015 to 2024, Dr. Stauss-Grabo held various management and research positions in the Company’s Global Medical Office, including Vice President and Head of Biomedical Evidence Generation (global and outside the U.S.) as well as Vice President and Head of Clinical Research for the EMEA region. Dr. Stauss-Grabo obtained a diploma in Biology from Julius-Maximilians University in Wuerzburg, Germany, and a Ph.D. in Pharmacy from Phillips-University in Marburg, Germany.
112
Management Board
Each member of the Management Board is appointed by the Supervisory Board for a maximum term of five years and is eligible for reappointment thereafter. Initial appointments are typically limited to a term of three years. Our Supervisory Board has resolved a standard age limit for the Management Board members. Board members shall, as a rule, retire from the Management Board at the end of the calendar year in which they reach the age of 65 years. The Management Board member serving as the Global Chief Medical Officer, Mr. Franklin W. Maddux, M.D., who was originally appointed for the period until the end of 2022, reached the aforementioned standard age limit. In view of Mr. Maddux’s extensive knowledge and the importance of the Global Medical Office in the Company’s operating model, the Supervisory Board resolved to appoint Mr. Maddux as a member of the Management Board for an additional five years, making an exception to the standard age limit. The exemption from the standard age limit is intended to ensure continuity of management in an area that is essential to our success.
The Management Board adopts resolutions at meetings by simple majority of votes cast, and outside the meetings by simple majority of its members. In case of a tie, the Chair of the Management Board has the casting vote.
The table below provides names, positions and terms of office of the current members of the Management Board and their ages:
|
|
|
|
|
|
|
Year term |
|
Name |
|
Current Age |
|
Position |
|
expires |
|
Ms. Helen Giza |
|
57 |
|
Chief Executive Officer |
|
2027 |
|
Mr. Martin Fischer |
|
48 |
|
Chief Financial Officer |
|
2026 |
|
Mr. Franklin W. Maddux, M.D. |
|
67 |
|
Global Chief Medical Officer |
|
2027 |
|
Mr. Craig Cordola, Ed.D. |
|
53 |
|
Management Board Member responsible for Care Delivery |
|
2026 |
|
Dr. Katarzyna Mazur-Hofsäß |
|
61 |
|
Management Board Member responsible for Care Enablement |
|
2026 |
|
Dr. Jörg Häring |
|
55 |
|
Management Board Member responsible for Legal, Compliance and Human Resources |
|
2027 |
MS. HELEN GIZA was appointed Chief Executive Officer of the Company and Chair of the Management Board upon effectiveness of the Conversion. Previously, Ms. Giza was Chief Executive Officer and Chair of the management board of Management AG effective December 6, 2022 and Chief Financial Officer of the management board of Management AG effective November 1, 2019. Ms. Giza continued to serve as acting Chief Financial Officer of the management board of Management AG until a successor, Mr. Martin Fischer, was appointed for the position effective October 1, 2023. Prior to joining Fresenius Medical Care, she was Chief Integration and Divestiture Management Officer at Takeda Pharmaceuticals. Before joining the Takeda Corporate Executive Team, she served as Chief Financial Officer of Takeda’s U.S. business unit from 2008 to 2018. Prior to that, she held a number of key international finance and controlling positions, amongst others, at TAP Pharmaceuticals and Abbott Laboratories. On August 22, 2023, Ms. Giza was appointed a non-executive director on the Board of Directors of Resonetics, LLC. Ms. Giza is a U.K. Chartered Certified Accountant and holds a Master of Business Administration from the Kellogg School of Management at Northwestern University in Evanston, Illinois, U.S.
MR. MARTIN FISCHER was appointed Chief Financial Officer and member of the management board of Management AG as of October 1, 2023 and became Chief Financial Officer and a member of the Management Board of the Company upon effectiveness of the Conversion. Prior to his appointment, Mr. Fischer was Head of Finance for Siemens Healthineers’ Diagnostics division based in Tarrytown, NY, USA since 2019. Previously, he headed the Board Office and Organizations function for Siemens Healthineers after leading the business plan and operating model development for the company’s initial public offering in March 2018. Prior to that, Mr. Fischer held a number of key international operational and finance positions in health care within Siemens AG. Mr. Fischer holds a degree in business informatics from the Reutlingen University of Applied Sciences and an MBA from Friedrich Alexander University, Nuremberg, Germany. He completed the Chief Financial Officer Program at Columbia Business School in New York, USA.
113
MR. FRANKLIN W. MADDUX, M.D. was appointed Global Chief Medical Officer in 2019 and appointed to the management board of Management AG effective January 1, 2020. Mr. Maddux became a member of the Management Board of the Company upon effectiveness of the Conversion. He is an expert nephrologist, IT entrepreneur and health care executive with more than 40 years of experience in health care. He joined the Company in 2009 and was appointed Executive Vice President for Clinical & Scientific Affairs and Chief Medical Officer for Fresenius Medical Care North America in 2011, where he was responsible for the delivery of high-quality, value-based care for the largest integrated renal care network on the continent. His expertise and research interests have focused on quality care for chronic kidney disease patients around the world. He also serves as the Company’s board observer at Humacyte, Inc.
MR. CRAIG CORDOLA, Ed. D. was appointed Chief Executive Officer of Care Delivery and member of the Management Board of the Company as of January 1, 2024. Prior to joining the Company in 2024, he served in several executive roles with Ascension from 2017 through 2023, including Executive Vice President for Ascension Capital, Executive Vice President and Chief Operating Officer as well as President and Chief Executive Officer for Ascension Texas. Mr. Cordola has almost 30 years of experience in the health care industry, holding Chief Executive Officer roles and other senior leadership positions at several health care organizations. He holds an Ed. D. in Leadership and Learning in Organizations from Peabody College at Vanderbilt University, an MHA/MBA from the University of Houston at Clear Lake and a Bachelor of Arts from The University of Texas.
DR. KATARZYNA MAZUR-HOFSÄß was designated Chief Executive Officer of Care Enablement and the member of the management board of Management AG responsible for Care Enablement effective January 1, 2022 and became Chief Executive Officer of Care Enablement and Management Board member of the Company responsible for Care Enablement upon effectiveness of the Conversion. She was previously appointed Chief Executive Officer for our former Europe, Middle East and Africa segment effective September 1, 2018. From 2013 until 2018, she was president for the Europe, Middle East and Africa region at the med-tech company Zimmer Biomet. In her 25 year-professional career, Dr. Mazur-Hofsäß gained extensive international experience in executive general management positions. She is a physician by educational background and holds a Ph.D. from Gdansk Medical University in Poland as well as an MBA from the Warsaw School of Economics and the University of Minnesota. Dr. Mazur-Hofsäß is a non-executive member of the Board of Directors of Smith & Nephew plc.
DR. JÖRG HÄRING was appointed member of the Management Board responsible for Legal, Compliance and Human Resources and Labor Relations Director as of June 1, 2024. Prior to joining Fresenius Medical Care, Dr. Jörg Häring was a member of the Management Committee, Chief Legal & Assurance Officer and Secretary of the Board at the Spanish energy company Compañía Española de Petróleos (CEPSA), overseeing Legal, Corporate Audit, Risk Management and Compliance globally. He previously spent 18 years with the Siemens Group, including nearly 13 years as General Counsel. Before joining Siemens, he worked at the law firm Cleary, Gottlieb, Steen & Hamilton in Frankfurt, Germany and Brussels, Belgium. Dr. Häring holds a Ph.D. in law and a degree in economics from the University of Tübingen, Germany.
|
B. |
Compensation |
We are exempt from NYSE and SEC rules requiring listed companies to maintain compensation committees consisting of independent directors. However, we maintain a Compensation Committee which is responsible for preparing the decisions of the Supervisory Board regarding the compensation of the members of the Management Board. The Compensation Committee also prepares the regular review by the Supervisory Board of the appropriateness of the compensation system and of the total compensation of the individual appropriateness of the compensation system and of the total compensation of the individual Management Board members and reviews the annual compensation report. See Item 6.C, “Directors, senior management and employees – Board Practices.” We are also not subject to the compensation disclosure provisions of SEC Regulation S-K, which include a requirement to provide a “Compensation Discussion and Analysis” explaining the material elements of the compensation paid to a company’s CEO, CFO and certain other highly-compensated executive officers or employees. See Item 16G, “Corporate Governance.” Instead, as a German publicly-held company, we prepare a Compensation Report in accordance with the requirements of the German statutory provisions referred to below. Set forth below is a convenience translation of the Compensation Report of FME AG for the fiscal year 2024, substantially in its entirety. Definitions expressly set forth in this Compensation Report are applicable solely to the Compensation Report.
By referring to our German Annual Report ( Geschaeftsbericht or our Annual Report 2024) and to our and other websites throughout this Compensation Report, we do not intend to incorporate into this report any information in our Annual Report 2024 or on our and other websites, and any information on our and other websites should not be considered to be part of this report, except as expressly set forth herein.
114
Introduction
The Compensation Report of Fresenius Medical Care AG (Company) for the fiscal year 2024 (Fiscal Year) was prepared in accordance with the requirements of Section 162 of the German Stock Corporation Act ( Aktiengesetz – AktG). The Compensation Report includes individualized and comprehensive information on the compensation within the meaning of Section 162 paragraph 1 AktG awarded and due to current and former members of the management board and of the supervisory board in the Fiscal Year and benefits within the meaning of Section 162 paragraph 2 AktG awarded or promised to members of the management board.
The 2024 Annual General Meeting (AGM) of the Company approved the Compensation Report for 2023 with a majority of around 98.39% of the votes cast. The management board of the Company (Management Board) and the supervisory board of the Company (Supervisory Board) are therefore reaffirmed in the manner of reporting. The structure of the Compensation Report for the Fiscal Year and the level of detail of the information provided are essentially the same as in the previous year.
The Company existed in the legal form of a partnership limited by shares until November 30, 2023. Until then, the Company’s business was managed by its general partner, i.e. Fresenius Medical Care Management AG (General Partner). The General Partner exited the Company when the change in legal form took effect. The members of the management board of the General Partner then in office were appointed as members of the Management Board. No compensation was awarded or due to the former General Partner or the members of its supervisory board in the Fiscal Year. Details on the duration of the service agreements of the members of the Management Board can be found in the Company’s Declaration on Corporate Governance, which can be found on the Company’s website at www.freseniusmedicalcare.com/en/investors/corporate-governance/ in the section “Declaration on Corporate Governance.” The Compensation Report therefore generally no longer contains information on the compensation awarded or due to the General Partner or the members of its supervisory board in previous fiscal years. The information on compensation awarded or due to former members of the management board of the General Partner for their activities in this function continues to be reported where applicable.
Unless otherwise indicated, the following information on the compensation of the members of the Management Board relates to the members of the Management Board of the Company in office in the Fiscal Year. For the amounts, see the section “Compensation tables for the Management Board members in office in the Fiscal Year.”
For information on compensation of former members of the Management Board of the Company or of the management board of the former General Partner of the Company and the amounts of such compensation, see the section “Former Management Board members’ compensation.”
Certain disclosures in this Compensation Report fulfil reporting obligations from the company’s sustainability statement resulting from the application of the European Sustainability Reporting Standards (ESRS). The corresponding references are marked in the following, for example with [ESRS 2, 40g] , and are located in or at the end of the corresponding sections in which the disclosures can be found.
The Fiscal Year in retrospect
The compensation awarded and due to the members of the Management Board in the Fiscal Year rewarded their performance in particular in achieving the Company’s strategic goals. At the same time, it provided effective incentives for the long-term value-creation of the Company – taking into account the interests of patients, shareholders, employees and other stakeholders as well as compensation practices in relevant comparable markets. Therefore, the compensation of the members of the Management Board made a significant contribution to promoting the business strategy and the long-term sustainable development of the Company and the group.
Business performance and economic environment
See Item 5, “Operating and financial review and prospects,” above.
Short-term incentive target achievement
The business performance in the Fiscal Year was reflected by an overall target achievement of 99.20% to 127.92% for the short-term variable compensation component (Short-Term Incentive) for the Fiscal Year. For further details see the section “Short-Term Incentive – MBBP 2024+.”
115
Long-term incentive target achievement for the performance period ending at the end of the Fiscal Year
The performance period of the allocation made in 2022 under the Management Board Long Term Incentive Plan 2020 (MB LTIP 2020) as a long-term variable compensation component (Long-Term Incentive) ended upon the end of the Fiscal Year. The performance periods for the allocations made in 2023 and 2024 will only end in the coming years.
The target achievement for the allocation made in 2022 was governed by the fiscal years 2022, 2023 and 2024. The target achievement levels of the performance targets “revenue growth” and “net income growth” were calculated based on a compound annual growth rate (CAGR) over the entire three-year performance period. Annual target values applied to the performance target “return on invested capital” (ROIC).
Against this background, target achievement in contrast to the allocations for previous years is no longer reported per year, but per performance target. The target values and the target achievement were each as shown in the following table:
|
Target values and target achievement for the allocation 2022 under the MB LTIP 2020 |
|
|||||||||||||||||||
|
|
|
Target values |
|
Actual values |
|
Target achievement |
|
|||||||||||||
|
|
|
|
|
|
|
|
|
|
|
Currency |
|
At constant |
|
|
|
|
|
|
||
|
|
|
|
|
|
|
|
|
As |
|
translation |
|
currency according |
|
|
|
|
|
|
||
|
|
|
0% |
|
100% |
|
200% |
|
reported |
|
adjustment |
|
to plan terms |
|
|
CAGR |
|
|
|
||
|
Revenue growth |
|
|
|
|
|
|
|
|
|
|
|
|
|
|
|
|
|
|
||
|
2022 |
} |
|
|
|
|
|
|
|
|
10.1 |
% |
(8.0) |
% |
2.1 |
% |
} |
|
|
|
|
|
2023 |
|
|
≤ 2 |
% |
= 5 |
% |
≥ 8 |
% |
0.3 |
% |
5.2 |
% |
5.5 |
% |
2.5 |
% |
17 |
% |
||
|
2024 |
|
|
|
|
|
|
|
|
(0.6) |
% |
0.6 |
% |
0.0 |
% |
|
|
|
|
||
|
|
|
|
|
|
|
|
|
|
|
|
|
|
|
|
|
|
|
|
||
|
Net income growth |
|
|
|
|
|
|
|
|
|
|
|
|
|
|
|
|
|
|
||
|
2022 |
} |
|
|
|
|
|
|
|
|
(30.5) |
% |
(6.1) |
% |
(36.6) |
% |
} |
|
|
|
|
|
2023 |
|
|
≤ 10 |
% |
= 17 |
% |
≥ 20 |
% |
(25.9) |
% |
1.6 |
% |
(24.3) |
% |
(19.3) |
% |
0 |
% |
||
|
2024 |
|
|
|
|
|
|
|
|
7.8 |
% |
1.6 |
% |
9.4 |
% |
|
|
|
|
||
|
|
|
|
|
|
|
|
|
|
|
|
|
|
|
|
|
|
|
|
||
|
Return on invested capital (ROIC) |
|
|
|
|
|
|
|
|
|
|
|
|
|
|
|
|
|
|
||
|
2022 |
} |
|
|
|
|
|
|
|
|
3.3 |
% |
— |
% |
3.3 |
% |
|
|
0 |
% |
|
|
2023 |
|
|
≤ 5.5 |
% |
= 6.0 |
% |
≥ 6.5 |
% |
2.8 |
% |
— |
% |
2.8 |
% |
|
|
0 |
% |
||
|
2024 |
|
|
|
|
|
|
|
|
3.5 |
% |
— |
% |
3.5 |
% |
|
|
0 |
% |
||
|
Overall Target Achievement |
|
|
|
|
|
|
|
|
|
|
|
|
|
|
|
|
6 |
% |
||
The compensation under the MB LTIP 2020 vests on the third anniversary after the respective allocation and is required to be invested in shares of the Company acquired on the stock exchange which are to be held for at least one year. In accordance with recommendation G.10 of the German Corporate Governance Code (GCGC), the members of the Management Board therefore cannot dispose of the corresponding amounts before four years have passed since the respective allocation.
The specific amounts to be invested in shares of the Company from the aforementioned allocation for 2022 can be determined only after vesting in 2025 and will be disclosed in the Compensation Report for 2025.
Details on the vested amounts to be invested in shares of the Company in the Fiscal Year from the allocation for 2021 under the MB LTIP 2020 can be found in the section “Vested amounts (Allocation 2021).”
Information on the outstanding tranches of Long-Term Incentives, including a temporal profile of the individual tranches, can be found in the section “Outstanding share-based compensation components.”
116
Compensation-relevant changes for the Management Board
The amount of the target total direct compensation (consisting of base salary as well as the target amounts and allocation values for short-term and long-term variable compensation) of the members of the Management Board in office in the Fiscal Year remained unchanged from the previous year both overall and in terms of its individual components. The main changes relevant to the compensation for the Management Board compared to the previous year are as follows.
Changes to the Management Board
Dr. Jörg Häring has been appointed as a member of the Management Board with effect from June 1, 2024. Dr. Häring is responsible for the newly created department Global Legal, Compliance and Human Resources. Performance-based variable compensation components were granted or allocated to Dr. Häring in accordance with the Compensation System 2024+ on a pro rata basis for the period from his appointment as of June 1, 2024.
Mr. Craig Cordola, Ed.D., has been appointed as the member of the Management Board responsible for the Care Delivery business segment with effect from January 1, 2024. Mr. Cordola, Ed.D., succeeds Mr. William Valle, who left the Management Board at the end of December 31, 2023.
Introduction and implementation of the Compensation System 2024+
The Company’s 2024 AGM approved the “Compensation System 2024+” with a majority of around 87.58% of the votes cast. The Compensation System 2024+ was developed on the basis of the “Compensation System 2020+”, which had been approved by the Company’s 2020 AGM with a majority of around 95.05% of the votes cast. The Compensation System 2024+ in principle applies to the compensation of the Management Board from the Fiscal Year and has been implemented in the service agreements of the members of the Management Board.
Guiding principles of the Compensation System 2024+
The objective of the Compensation System 2024+ is to enable the members of the Management Board to participate reasonably in a sustainable and long-term development of the Company’s business and to reward them based on their duties and performance as well as their success in managing the Company’s economic and financial position giving due regard to the peer environment, and to make a significant contribution to the implementation and further development of the business strategy. [ESRS 2, 29a]
117
The guiding principles on which the Compensation System 2024+ is based are shown in the following diagram:
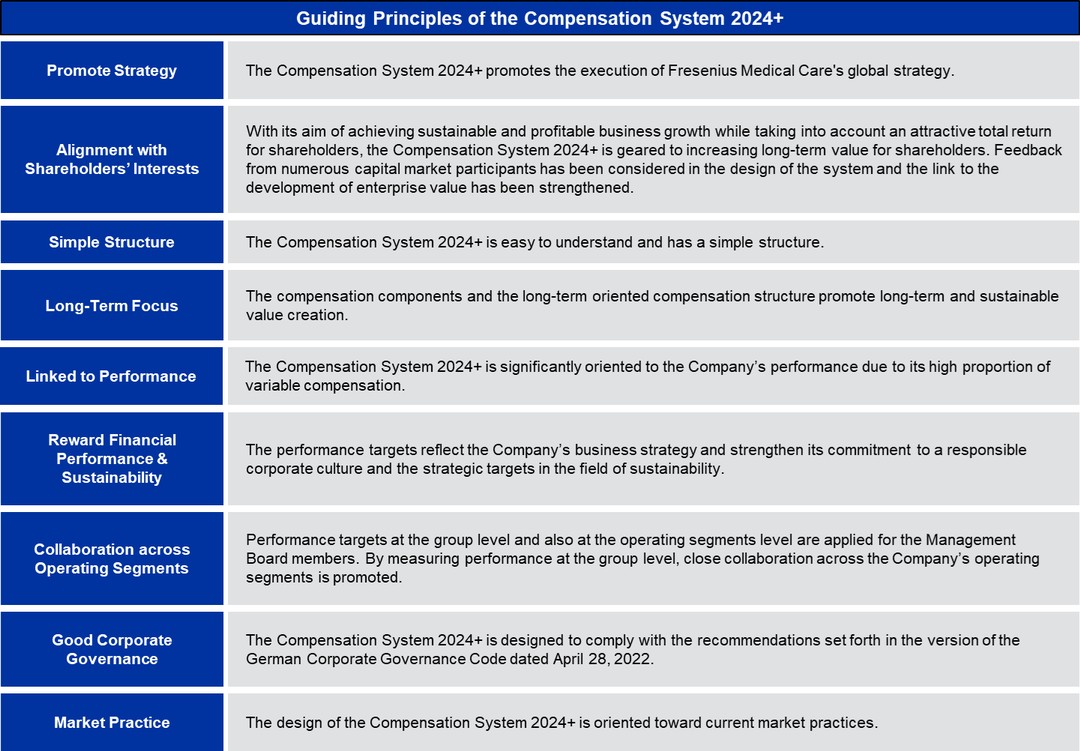
118
Components of the Compensation System 2024+
The following diagram shows the compensation components and further design elements of the Compensation System 2024+, which are described in more detail below:
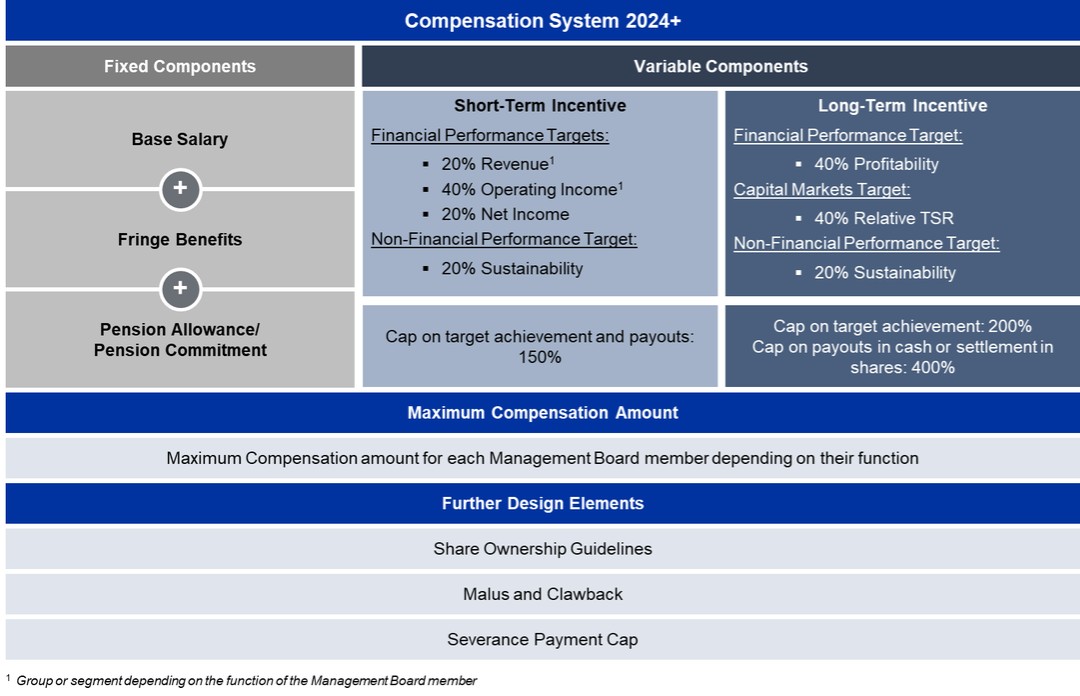
119
Compensation System 2020+ and Compensation System 2024+ in comparison
The key differences between the Compensation System 2020+ and the Compensation System 2024+ are shown in the following diagram:
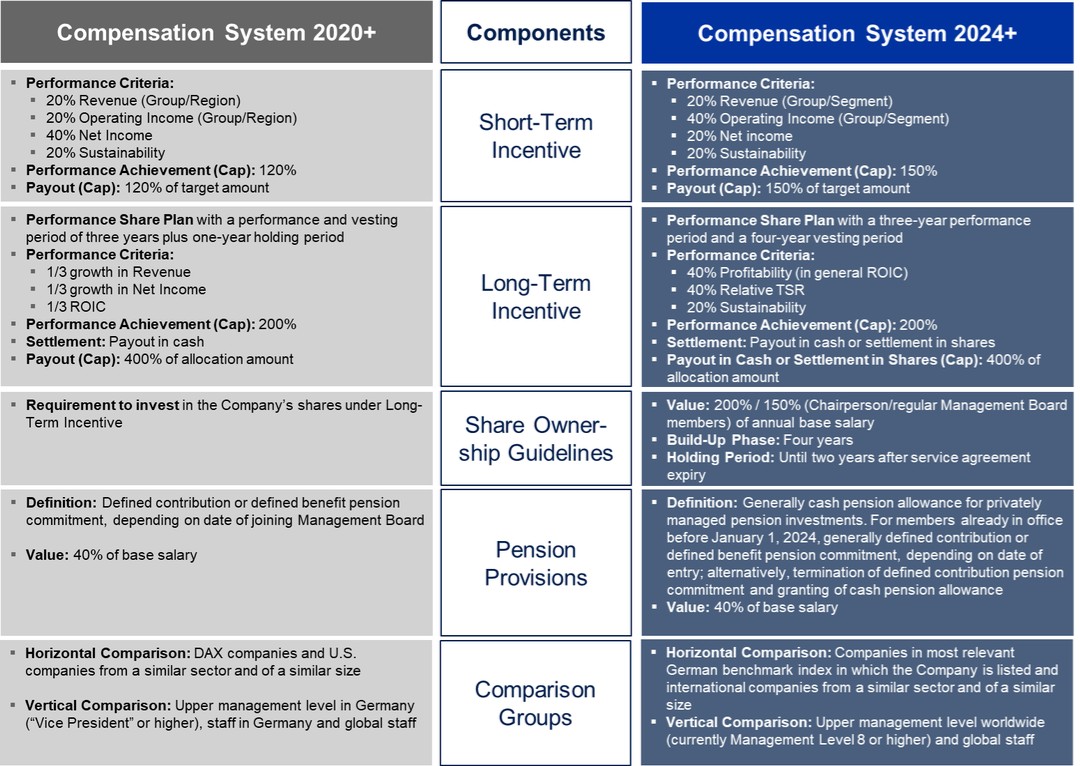
Significant changes relevant to compensation relate in particular to pension arrangements and the introduction of more stringent share ownership guidelines in addition to already existing shareholding requirements. In addition, a capital market-related and a non-financial, sustainability-related performance target have been introduced for allocations of long-term variable compensation from the Fiscal Year onwards.
New pension arrangements: Cash pension allowance
The pension scheme has been generally converted from pension commitments to pension allowances. The pension allowance amounts to 40% of the respective base salary and is paid out in cash for privately managed pension investments. Existing defined benefit pension commitments remain unaffected. Further details on this can be found in the section “Pension-related obligations.”
120
Introduction of Share Ownership Guidelines
The introduction of Share Ownership Guidelines is intended to tie the Management Board compensation even more closely to the interests of the shareholders and the sustainable development of Fresenius Medical Care. These guidelines provide that the Chairperson of the Management Board must invest 200% and the other Management Board members must invest 150% of their relevant annual base salary in shares of the Company. The highest annual base salary during the period in which the shares are to be acquired is to be applied. The shares must generally be acquired within four years of the start of the respective service agreement, but no earlier than January 1, 2024, and must be held for a period of at least two years after the end of the respective service agreement. Existing shareholding requirements in connection with personal investments, such as from the MB LTIP 2020, remain unaffected. Shares acquired prior to the beginning of the relevant investment period or as part of an equity settlement under a long-term incentive plan are credited to the investment obligation. Changes in the value of the shares after their acquisition are not taken into account for purposes of the fulfillment of the investment obligation. Further details on this can be found in the section “Share Ownership Guidelines and Shareholdings.”
New performance targets for the long-term variable compensation
The introduction of a capital markets target for the Long-Term Incentive addresses investor-specific requirements for the inclusion of a relative performance measurement in comparison to relevant competitors and ties the compensation of the Management Board to the long-term capital market performance of Fresenius Medical Care. In line with current national and international market practice, the total shareholder return (TSR) compared to competitors (Relative TSR) is used as the capital market target. The target achievement of the Relative TSR is determined based on the percentile ranking of the TSR performance of the Company in comparison to the TSR performance of companies in one or more comparison groups determined by the Supervisory Board. In general, STOXX® Europe 600 Health Care and S&P 500 Health Care indices are determined as comparison groups.
The introduction of a non-financial, sustainability-related performance target for the Long-Term Incentive in addition to the non-financial, sustainability-related performance target for the Short-Term Incentive is derived from the Company’s commitment toward maintaining a responsible corporate culture and attaining strategic sustainability targets, which also takes into account the requirements of the Company’s shareholders and further stakeholders. Sustainability is an essential and integral part of the corporate strategy of Fresenius Medical Care. By considering key objectives in the areas of Environment, Social and Governance (ESG) in the context of Long-Term Incentives, also investor-specific and social requirements are met and the long-term, sustainable development of Fresenius Medical Care is promoted. For the allocation of the Long-Term Incentive for the Fiscal Year, the reduction in market-based CO 2 e emissions, for which more detailed information can be found in the company’s sustainability statement, was defined as the sustainability target. [ESRS 2, 29c]
Compensation Governance for Management Board members
Compensation for the members of the Management Board is granted on the basis of the respective compensation system, which was submitted by the Supervisory Board to the general meeting for approval. The Supervisory Board is responsible for determining the compensation of the members of the Management Board. The Supervisory Board is supported in this by the Compensation Committee formed from among its members, which prepares the resolutions of the Supervisory Board. In the Fiscal Year, the Compensation Committee comprised Ms. Pascale Witz (Chairwoman) and Mr. Shervin J. Korangy as well as, since March 14, 2024, Dr. Manuela Stauss-Grabo (Deputy Chairwoman) and Ms. Regina Karsch.
Compensation systems applying to compensation
The compensation of the Management Board members for the Fiscal Year was determined in accordance with the Compensation System 2024+, which was approved by the Company’s AGM on May 16, 2024 with a majority of around 87.58% of the votes cast and implemented in the service agreements of the members of the Management Board. [ESRS 2, 29e]
Compensation components allocated before the Fiscal Year generally continue to be subject to the applicable underlying compensation system. This in particular concerns allocations of long-term variable compensation made in previous years under the Compensation System 2020+. Further information on this can be found in the section “Overview of outstanding share-based compensation components” and in the section “Temporal profile of the share-based compensation components.” There are no outstanding variable, performance-based compensation components from the period before the Compensation System 2020+.
The compensation components awarded and due in the Fiscal Year are in accordance with the respective compensation systems.
121
Details of the Compensation System 2024+ and the Compensation System 2020+ are available on the Company’s website at www.freseniusmedicalcare.com/en/about-us/management-board/compensation/. The main elements of the Compensation System 2024+ are set out in this Compensation Report in the section “Components of the Compensation System 2024+.” The main elements of the Compensation System 2020+ are set out in the Compensation Reports for the fiscal years 2023, 2022 and 2021, which are included in our Annual Reports on Form 20-F for such respective years. They are also set out in this Compensation Report insofar as they are relevant to compensation awarded or due in the Fiscal Year.
The Compensation System 2024+ and the Compensation System 2020+ as well as the compensation awarded or due in the Fiscal Year are in each case in accordance with the relevant recommendations of the GCGC in the version dated April 28, 2022.
Compensation structure (target compensation)
Under the Compensation System 2024+, the Supervisory Board determines the target amount for short-term variable compensation for each fiscal year and the allocation amount for each allocation of long-term variable compensation. The target amount or the allocation amount is the amount that is earned if the target achievement is 100%. The target amount for the short-term variable compensation can be set within a range of 100% (multiplier of 1) to 125% (multiplier of 1.25) of the relevant base salary of the respective member of the Management Board and in general amounts to 105% (multiplier of 1.05). The allocation amount for the long-term variable compensation of the Chairperson of the Management Board can be set within a range of 105% (multiplier of 1.05) to 200% (multiplier of 2) and for the other Management Board members can be set within a range of 105% (multiplier of 1.05) to 150% (multiplier of 1.5) of the relevant base salary and in general amounts to 135% (multiplier of 1.35). The multiplier is determined at the beginning of each performance period. The allocation amount for the long-term variable compensation must exceed the target amount of the short-term variable compensation.
For the Fiscal Year, the Supervisory Board applied a multiplier of 1.05 for the short-term variable compensation and a multiplier of 1.35 for the allocation amount for the long-term variable compensation for all members of the Management Board. This corresponds to the multipliers that were to be applied under the Compensation System 2020+. The compensation structure of the target total direct compensation for the Fiscal Year therefore consists of 29% base salary, 31% short-term incentive and 40% long-term incentive.
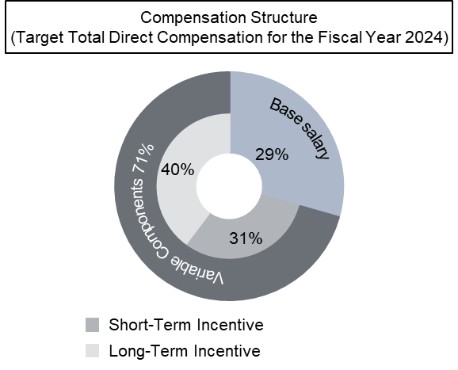
Owing to a 71% share of performance-based variable compensation components in the target total direct compensation, the compensation of the Management Board is, as a whole, performance-based. Owing to a 40% long-term incentive share (i.e., 56% of performance-based variable compensation components) in the target total direct compensation, the compensation of the Management Board is geared to promoting sustainable and long-term corporate development.
Information on the relative shares of the fixed and the variable compensation components in the compensation granted in the Fiscal Year can be found in the tables in the sections “Compensation tables for the Management Board members in office in the Fiscal Year” and “Former Management Board members’ compensation”, respectively.
122
Compensation reviews
The value of the total target compensation of each Management Board member is determined by the Supervisory Board in line with the Compensation System 2024+. In compliance with the requirements of the German Stock Corporation Act and the recommendations of the GCGC, it is ensured that compensation is commensurate with the duties and performance of each Management Board member and the Company’s situation, is geared toward the long-term, sustainable development of Fresenius Medical Care and does not exceed customary compensation without any special justification. To this end, both external and internal compensation comparisons are conducted. As a result, the respective total compensation may differ among the Management Board members, diligently considering the respective Management Board member’s function and responsibilities as well as differences in international pay practices. The total compensation for the individual Management Board members takes into account the interests of the Company in retaining Management Board members and attracting qualified candidates for the Management Board.
Horizontal comparison (peer group)
In order to assess the appropriateness of the Compensation System 2024+ and the individual compensation of the Management Board members, the Supervisory Board conducts a horizontal review of compensation amounts and structures (external comparison). The horizontal comparison is made at a national level with other companies from the most relevant German benchmark index in which the Company is listed (since December 27, 2024, DAX, until then in the Fiscal Year MDAX) and at an international level with companies operating in a similar sector and having a similar size.
For the Fiscal Year, the MDAX companies as of December 31, 2023 and – depending on the specific tasks of the relevant member of the Management Board – the following companies were used as international peer group: Baxter International Inc., Becton, Dickinson and Company, Boston Scientific Corporation, Cigna Corporation, Coloplast A/S, CVS Health Corporation, DaVita Inc., Encompass Health Corporation, Koninklijke Philips N.V., Medtronic plc, Merck KGaA, Sartorius AG, Siemens Healthineers AG, and Smith & Nephew plc. In addition, the DAX companies as of December 31, 2023 were also used. The changes in the composition of the international peer group compared to the previous year serve to better reflect the global orientation of Fresenius Medical Care and also to include relevant European companies of a similar size in the comparison.
Vertical comparison (intra-company)
The Supervisory Board also takes into account a vertical review of the compensation levels of Fresenius Medical Care’s employees when determining the compensation system and the compensation of the Management Board members (internal comparison). The compensation of the Management Board members and of the members of the upper management of Fresenius Medical Care (currently Management Level 8 or higher) as well as of the global staff (generally all employees with the exception of Fresenius Medical Care’s upper management) is set in relation. When conducting the vertical review, the Supervisory Board in accordance with recommendation G.4 of the GCGC also takes into account the development of compensation levels over time.
Result of the review of the appropriateness of the compensation
On the basis of the compensation reviews it carried out in the Fiscal Year, the Supervisory Board came to the conclusion that the compensation of the Management Board is appropriate in terms of both its structure and amount.
Caps and maximum compensation
The Management Board members’ total compensation is limited by a cap applicable to each variable compensation component and by maximum compensation.
For the Short-Term Incentive, the target achievement and payout are capped at 150% of the relevant target amount. For the Long-Term Incentive, the target achievement is capped at 200% for each allocation. In addition, the amounts received from each allocation of the Long-Term Incentive – irrespective of whether they are paid out in cash or, as provided for alternatively under the Compensation System 2024+, settled in shares of the Company – are capped at 400% of the allocation amount. Since the amount payable in cash or to be settled in shares also depends on the development of the Company’s share price, the opportunity of benefiting from the share price development in the relevant vesting period thus also is limited. The Supervisory Board has further agreed a cap option for the variable compensation components in the event that extraordinary developments occur. In the Fiscal Year, there was no reason for the Supervisory Board to make use of this cap option.
123
In addition, there is a maximum amount of total compensation for each member of the Management Board (maximum compensation). The maximum compensation limits the benefits that a member of the Management Board can receive as compensation for a fiscal year, irrespective of when the actual payment accrues. The maximum compensation includes the base salary for the fiscal year (paid out during the fiscal year), the Short-Term Incentive for the fiscal year (paid out in the following fiscal year) and the Long-Term Incentive for the fiscal year (paid out in later fiscal years) and all fringe benefits, sign-on bonuses and other compensation for the relevant fiscal year such as a pension allowance for the relevant fiscal year (paid out in general during the fiscal year). Any pension service costs incurred in a fiscal year in line with a pension commitment being part of the fixed compensation components are also included in the calculation of the maximum compensation. A Management Board member’s maximum compensation may be lower than the sum of the potentially achievable payouts from the individual compensation components determined or allocated for a fiscal year.
The caps and maximum compensation are shown in the following diagram:
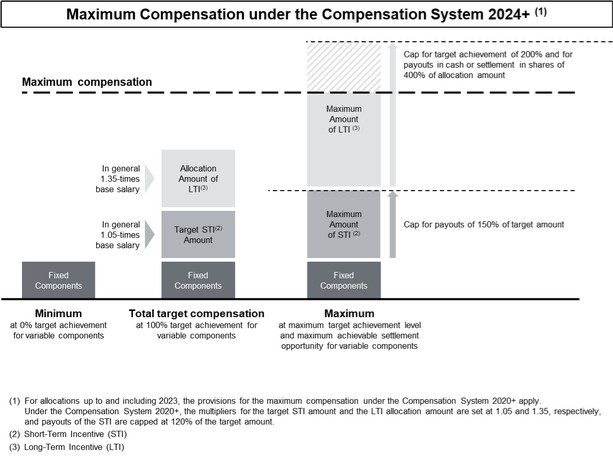
The maximum compensation for a fiscal year is determined based on the currency of the base salary as specified in the relevant Management Board member’s service agreement. Under the Compensation System 2024+ and the allocation of responsibilities on which it is based, and in accordance with the respective service agreement, it amounts to €12,000 THOUS or $12,975 THOUS for the Chairperson of the Management Board (CEO), €9,500 THOUS or $10,272 THOUS for the Management Board member responsible for the Care Delivery operating segment (under the Compensation System 2020+ until the reorganization of the allocation of responsibilities to realign the Company’s operating model: Management Board member responsible for the North America region), and €7,000 THOUS or $7,569 THOUS for any other Management Board function. The aforementioned amounts in euro for the maximum compensation are identical to those under the Compensation System 2020+. The aforementioned U.S. dollar amounts were based on an updated exchange rate compared to the Compensation System 2020+.
|
Amount of the maximum compensation under the Compensation System 2024+ |
|||||
|
in THOUS |
|
|
|
|
|
|
|
|
|
|
Contractually agreed maximum |
|
|
|
|
Function |
|
compensation |
|
|
Helen Giza |
|
Chairwoman and Chief Executive Officer |
|
$ |
12,975 |
|
Craig Cordola, Ed.D. |
|
Chief Executive Officer for Care Delivery |
|
$ |
10,272 |
|
Martin Fischer |
|
Chief Financial Officer |
|
€ |
7,000 |
|
Dr. Jörg Häring |
|
Legal, Compliance and Human Resources |
|
€ |
7,000 |
|
Franklin W. Maddux, M.D. |
|
Global Chief Medical Officer |
|
$ |
7,569 |
|
Dr. Katarzyna Mazur-Hofsäß |
|
Chief Executive Officer for Care Enablement |
|
€ |
7,000 |
Information on compliance with the maximum compensation can be found in the section “Compliance with maximum compensation (Allocations 2021).”
124
Malus and clawback
The Supervisory Board is entitled to withhold or reclaim variable compensation components in cases of a Management Board member’s misconduct or non-compliance with his or her duties or internal Company guidelines, considering the characteristics of the individual case. Within this framework, the Supervisory Board ensures that contractual provisions are in place determining detailed requirements for withholding or reclaiming variable compensation components and setting forth the consequences thereof, including the forfeiture, in full or in part, of all or some variable compensation components. Also, the Supervisory Board has adopted a policy that in accordance with applicable regulatory requirements provides that the Company may recover excess incentive-based compensation if it is required to prepare an accounting restatement due to material noncompliance with relevant financial reporting requirements under U.S. federal securities laws.
In the Fiscal Year, there was no reason for the Supervisory Board to make use of these authorizations. See Item 6.F, “Directors, senior management and employees — Disclosure of a registrant’s actions to recover erroneously awarded compensation.”
Management Board members’ compensation
The compensation awarded or due in the Fiscal Year to the Management Board members in office in the Fiscal Year will be described in more detail below. Tables showing their respective total compensation are set out in the section “Compensation tables for the Management Board members in office in the Fiscal Year.” Information on the compensation for former Management Board members are set out in the section “Former Management Board members’ compensation.”
Compensation awarded and due to the members of the Management Board in the Fiscal Year consisted of fixed and variable components:
| – | fixed compensation, consisting of a base salary, fringe benefits and, if applicable, a pension allowance in cash, |
| – | one-year variable compensation (Short-Term Incentive) and |
| – | multi-year variable compensation (Long-Term Incentive), consisting of payments under share-based cash-settled compensation allocated in previous years. |
Fixed compensation components
Management Board members receive a base salary and fringe benefits as well as a pension allowance or a pension commitment as fixed compensation components. The pension commitment does not, however, constitute compensation in the meaning of Section 162 paragraph 1 AktG.
The amount of the base salary is set out in the individual service agreements of the members of the Management Board. In line with standard local practice, the base salary is generally paid in twelve monthly installments for members of the Management Board resident in Germany and in biweekly installments for members of the Management Board resident in the U.S.
In the Fiscal Year, the fringe benefits awarded or due to the Management Board members under their individual service agreements consisted mainly of the private use of company cars, the payment of a mobility allowance or the use of rental cars, housing, rent and relocation payments, reimbursement of fees for the preparation of tax returns, reimbursement of charges, contributions to pension schemes (other than the pension commitments or the cash pension allowance set out herein), contributions to accident, life and health insurances or other insurances as well as tax equalization compensation due to varying tax rates applicable in Germany and the country in which the relevant Management Board member is personally taxable. See the section “Further information” for details of such tax equalization compensation.
In addition, individual Management Board members received a pension allowance in cash amounting to 40% of their base salary for their own pension provision. For individual other Management Board members, pension commitments exist. Payments to the Management Board members under pension commitments will generally only become due when the covered event occurs. The pension allowance and the pension commitments are set out in the section “Pension-related obligations.”
125
Short-Term Incentive – MBBP 2024+
Under the Compensation System 2024+, the Management Board members are entitled to receive a Short-Term Incentive in accordance with the Management Board Bonus Plan 2024+ (MBBP 2024+), which may result in a cash payment. The Short-Term Incentive rewards the Management Board members for the Company’s performance in the relevant fiscal year. The Short-Term Incentive is linked to the achievement of three financial targets and one non-financial, sustainability-related performance target.
The target Short-Term Incentive amount for the Fiscal Year (which is paid out at a target achievement level of 100%) equaled 105% (multiplier of 1.05) of the relevant base salary of the respective Management Board member.
Functioning
The functioning of the MBBP 2024+ is shown in the following diagram:
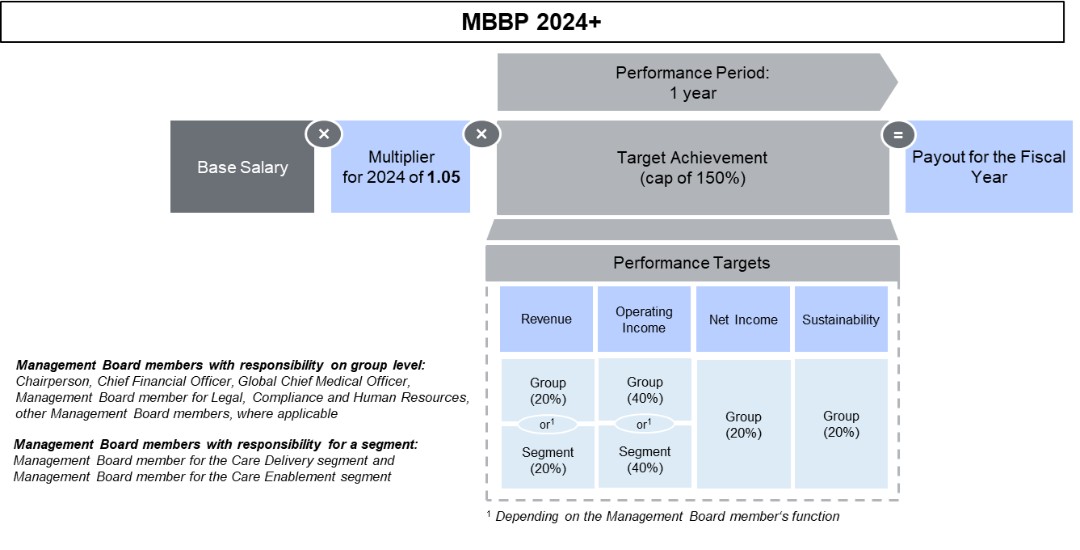
The Short-Term Incentive is measured based on the achievement of four performance targets: 20% relate to revenue, 40% to operating income, 20% to net income and 20% to the achievement of a measurable sustainability target, which can also consist of various sub-targets.
The Supervisory Board defines for each performance target the specific target values that lead to a target achievement of 0% (lower threshold), 100% and 150% (cap). The Supervisory Board may also set additional target values leading to a target achievement of between 0% and 150%. The following applies to each performance target: If the lower threshold of a target value is not exceeded, the target achievement is 0%. If the upper target value is reached or exceeded, the target achievement is 150%. Target achievement in the range between two adjacent target values is generally determined by linear interpolation.
The Short-Term Incentive is paid out in the year following the year of target achievement.
Link to strategy
The financial performance targets (revenue, operating income, net income) reflect key operating figures of the Company and support Fresenius Medical Care’s strategy of achieving sustainable and profitable growth. The non-financial, sustainability-related performance target underlines Fresenius Medical Care’s commitment to implement its global sustainability targets.
126
The respective weighting of the individual performance targets for the Short-Term Incentive and their link to Fresenius Medical Care’s strategy are shown in the following diagram:
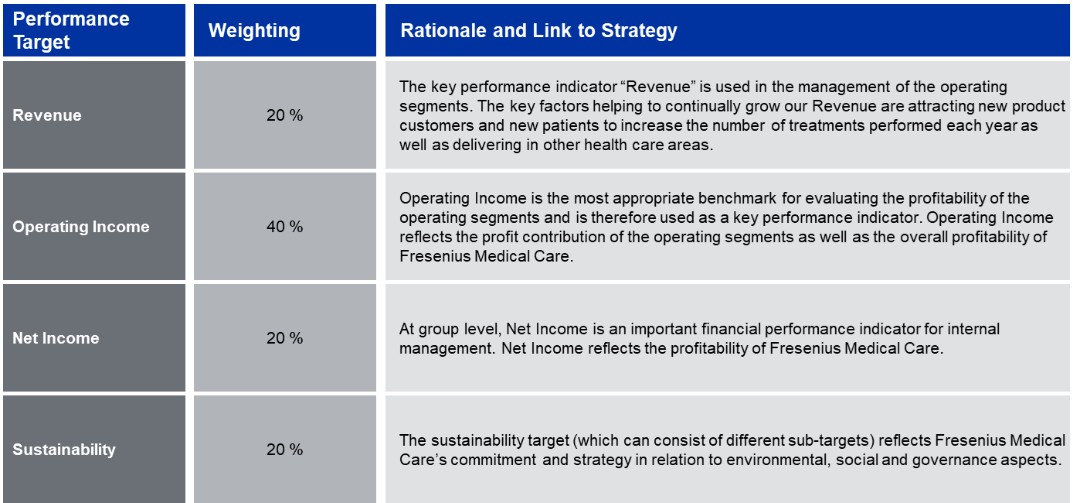
Financial performance targets
The underlying financial figures of the financial performance targets for the Short-Term Incentive are at constant currency and may be adjusted for certain effects to ensure comparability of the financial figures with respect to the operational performance, e.g., effects from certain acquisitions and divestments or effects from changes in IFRS accounting standards.
In order to further enhance collaboration across the operating segments and at the same time incentivize the Management Board members with respect to their individual responsibilities, some performance targets are measured at group level whereas others are measured at the level of the area of responsibility of the individual Management Board member. The financial performance targets “revenue” and “operating income” are in principle measured at group level. For the Management Board members with responsibility for the Care Delivery and Care Enablement operating segments, these performance targets are measured at the level of the segment for which they are responsible. The net income target for all Management Board members is measured at group level. By measuring certain performance targets at group level as well as at the level of the operating segments, the financial performance of both the group and that of the relevant operating segments is reflected.
127
The target values applied to the financial performance targets in the Fiscal Year for the Short-Term Incentive and their achievement are set out in the table below.
|
Short-Term Incentive – Target values and target achievement in the Fiscal Year (financial performance targets) |
||||||||||||||||
|
|
|
|
|
|
|
|
|
|
|
|
|
|
|
|
|
Target |
|
|
|
Target values (1) |
|
Actual values |
|
achievement |
||||||||||
|
|
|
|
|
|
|
|
|
|
|
|
|
Adjust- |
|
According to |
|
|
|
|
|
0% |
|
30% |
|
100% |
|
150% |
|
As reported |
|
ments (2) |
|
plan terms |
|
|
|
|
|
in € M |
|
in € M |
|
in € M |
|
in € M |
|
in € M |
|
in € M |
|
in € M |
|
in % |
|
|
|
|
|
|
|
|
|
|
|
|
|
|
|
|
|
|
|
Revenue |
|
|
|
|
|
|
|
|
|
|
|
|
|
|
|
|
|
Group |
|
≤ 17,597 |
|
= 18,575 |
|
= 19,553 |
|
≥ 20,530 |
|
19,336 |
|
(182) |
|
19,154 |
|
71.45 |
|
Care Delivery |
|
≤ 13,893 |
|
= 14,665 |
|
= 15,436 |
|
≥ 16,208 |
|
15,275 |
|
(191) |
|
15,084 |
|
68.08 |
|
Care Enablement |
|
≤ 5,033 |
|
= 5,312 |
|
= 5,592 |
|
≥ 5,871 |
|
5,557 |
|
(13) |
|
5,544 |
|
88.09 |
|
|
|
|
|
|
|
|
|
|
|
|
|
|
|
|
|
|
|
Operating income |
|
|
|
|
|
|
|
|
|
|
|
|
|
|
|
|
|
Group |
|
≤ 1,404 |
|
|
|
= 1,652 |
|
≥ 1,900 |
|
1,392 |
|
272 |
|
1,664 |
|
102.49 |
|
Care Delivery |
|
≤ 1,266 |
|
|
|
= 1,490 |
|
≥ 1,713 |
|
1,190 |
|
273 |
|
1,463 |
|
88.20 |
|
Care Enablement |
|
≤ 185 |
|
|
|
= 218 |
|
≥ 250 |
|
267 |
|
(3) |
|
264 |
|
150.00 |
|
|
|
|
|
|
|
|
|
|
|
|
|
|
|
|
|
|
|
Net income |
|
≤ 616 |
|
|
|
= 725 |
|
≥ 834 |
|
538 |
|
277 |
|
815 |
|
141.53 |
| (1) | According to the plan terms, the financial figures underlying the target values had to be adjusted by effects resulting from strategic portfolio divestments. The target values shown here already include these adjustments. |
| (2) | According to the plan terms, the financial figures underlying the target achievement were translated at the exchange rates that were applied for the determination of the target values to ensure comparability. In addition, they were adjusted according to the plan terms for one-time effects in connection with strategic portfolio divestments to the extent these effects deviate from the one-time effects included in the target values. |
Sustainability target
The sustainability target relates to strategic focus areas of Fresenius Medical Care in the areas of Environment, Social and Governance (ESG). The sustainability target is defined by the Supervisory Board for each fiscal year and can also consist of various sub-targets. The sustainability target is measured at group level for all Management Board members in order to ensure close collaboration among them in the context of the Company’s sustainability efforts.
For the Fiscal Year, the Supervisory Board defined two equally weighted sub-targets as sustainability target for the Short-Term Incentive: Patient Satisfaction and Employee Satisfaction. Both sub-targets have already been used for the sustainability target for 2023. These sub-targets are in line with the topics of quality of care and employee engagement relevant to Fresenius Medical Care, which emerged from the company’s last materiality analysis in 2023. In order to determine the target achievement, the values reported in the company’s sustainability statement for the Fiscal Year were used for each sub-target. The company’s sustainability statement for the Fiscal Year was reviewed by the auditor with limited assurance. [ESRS 2, 29b,d]
Patient Satisfaction was determined using the Net Promoter Score (NPS). The NPS is a strategically relevant measure of patient satisfaction with the company’s services, measured as the patient’s likelihood to recommend Fresenius Medical Care to others for dialysis treatment. The NPS is determined on the basis of patient surveys conducted as part of Fresenius Medical Care’s global Patient Experience Program. Fresenius Medical Care has set itself the target of achieving an NPS value of at least 70 every year. This corresponds to a target achievement for the sustainability sub-target “Patient Satisfaction” of 100% for the Fiscal Year. The NPS is calculated in integers.
The target achievement for the sustainability sub-target “Patient Satisfaction” was 120.00%.
|
Short-Term Incentive – Sustainability sub-target Patient Satisfaction |
||||||||||||||||||||||
|
|
|
Target values |
|
Target achievement |
||||||||||||||||||
|
|
|
0% |
|
50% |
|
75% |
|
100% |
|
110% |
|
120% |
|
130% |
|
140% |
|
150% |
|
Absolute |
|
Relative |
|
|
|
in points |
|
in points |
|
in points |
|
in points |
|
in points |
|
in points |
|
in points |
|
in points |
|
in points |
|
in points |
|
in % |
|
Net Promoter Score |
|
≤ 50 |
|
=58 |
|
=65 |
|
=70 |
|
=71 |
|
=72 |
|
=73 |
|
=74 |
|
≥ 75 |
|
72 |
|
120.00 |
128
The sustainability sub-target “Employee Satisfaction” is another strategically relevant indicator and was measured using the Employee Engagement Score (EES). As part of a group-wide survey, the company evaluated employee feedback on positive aspects of the working environment as well as opportunities for improvement. The company determined the EES by asking employees to indicate the extent to which they agree that they a) tell others great things about working at Fresenius Medical Care, b) rarely think about leaving Fresenius Medical Care, and c) are inspired to do their best work every day. Employees responded on a scale from one (I strongly disagree) to six (I strongly agree). Based on the average score across all three items, employees were categorized as engaged or not engaged. The EES is the proportion of all employees categorized as “engaged” based on this methodology.
The target achievement for the sustainability sub-target “Employee Satisfaction” was 100.00%.
|
Short-Term Incentive – Sustainability sub-target Employee Satisfaction |
||||||||||||
|
|
|
Target values |
|
Target achievement |
||||||||
|
|
|
0 % |
|
50 % |
|
100 % |
|
150 % |
|
Absolute |
|
Relative |
|
|
|
in % |
|
in % |
|
in % |
|
in % |
|
in % |
|
in % |
|
Employee Engagement Score |
|
≤ 50 |
|
= 52 |
|
= 56 |
|
≥ 63 |
|
56 |
|
100.00 |
The overall target achievement for the sustainability target was 110.00%. The target achievement for the sustainability target and the individual, equally weighted sustainability sub-targets are shown in the following table:
|
Short-Term Incentive – Sustainability target achievement in the Fiscal Year |
||||||
|
in % |
|
|
|
|
|
|
|
Target achievement per sustainability sub-target |
|
Sustainability target achievement |
||||
|
|
|
|
|
|
|
|
|
Patient Satisfaction (50%) |
|
Employee Satisfaction (50%) |
|
|
|
|
|
|
|
|
|
|
|
|
|
120.00 |
|
100.00 |
|
|
|
110.00 |
Overall target achievement
The degree of the overall target achievement for the Short-Term Incentive is determined based on the weighted arithmetic mean of the target achievement level of each performance target. Multiplying the degree of the respective overall target achievement with the target Short-Term Incentive amount results in the final Short-Term Incentive amount. After the corresponding resolution of the Supervisory Board, the final Short-Term Incentive amount is paid to the respective Management Board member in cash. Since the overall target achievement is capped at 150%, the final Short-Term Incentive amount is also capped at 150% of the respective target Short-Term Incentive amount.
The following table shows the target achievement per performance target as well as the overall target achievement for the Fiscal Year:
|
Short-Term Incentive – Overall target achievement in the Fiscal Year |
||||||||||
|
in % |
|
|
|
|
|
|
|
|
|
Overall target |
|
|
|
Target achievement (weighting) |
|
achievement |
||||||
|
|
|
Revenue |
|
Operating income |
|
Net income |
|
Sustainability target |
|
|
|
|
|
(20%) |
|
(40%) |
|
(20%) |
|
(20%) |
|
|
|
Helen Giza |
|
71.45 |
|
102.49 |
|
141.53 |
|
110.00 |
|
105.59 |
|
Craig Cordola, Ed.D. |
|
68.08 |
|
88.20 |
|
141.53 |
|
110.00 |
|
99.20 |
|
Martin Fischer |
|
71.45 |
|
102.49 |
|
141.53 |
|
110.00 |
|
105.59 |
|
Dr. Jörg Häring |
|
71.45 |
|
102.49 |
|
141.53 |
|
110.00 |
|
105.59 |
|
Franklin W. Maddux, M.D. |
|
71.45 |
|
102.49 |
|
141.53 |
|
110.00 |
|
105.59 |
|
Dr. Katarzyna Mazur-Hofsäß |
|
88.09 |
|
150.00 |
|
141.53 |
|
110.00 |
|
127.92 |
129
The amounts to be paid out to the individual Management Board members in 2025 on the basis of this overall target achievement for the Fiscal Year, taking into account the target amount (base salary times the multiplier) and in compliance with the cap, can be found in the following table:
|
Short-Term Incentive – Amounts to be paid in 2025 for the performance in the Fiscal Year |
||||||||||||
|
in € THOUS |
|
|
|
|
|
|
|
|
|
|
|
|
|
|
|
|
|
|
|
|
|
|
|
Overall |
|
|
|
|
|
|
|
|
|
|
|
|
|
target |
|
|
|
|
|
|
|
|
|
Target |
|
|
|
achievement |
|
Payout |
|
|
|
Base salary |
|
Multiplier |
|
amount |
|
Cap (150%) |
|
in % |
|
amount |
|
|
|
|
|
|
|
|
|
|
|
|
|
|
|
Helen Giza (1) |
|
1,663 |
|
1.05 |
|
1,746 |
|
2,619 |
|
105.59 |
|
1,844 |
|
Craig Cordola, Ed.D. (1) |
|
1,340 |
|
1.05 |
|
1,407 |
|
2,111 |
|
99.20 |
|
1,395 |
|
Martin Fischer |
|
800 |
|
1.05 |
|
840 |
|
1,260 |
|
105.59 |
|
887 |
|
Dr. Jörg Häring (2) |
|
408 |
|
1.05 |
|
428 |
|
642 |
|
105.59 |
|
453 |
|
Franklin W. Maddux, M.D. (1) |
|
979 |
|
1.05 |
|
1,028 |
|
1,542 |
|
105.59 |
|
1,086 |
|
Dr. Katarzyna Mazur-Hofsäß |
|
1,064 |
|
1.05 |
|
1,117 |
|
1,676 |
|
127.92 |
|
1,429 |
| (1) | Note for the amounts as set out herein that the compensation benefits for Ms. Helen Giza as well as Messrs. Craig Cordola, Ed.D. and Franklin W. Maddux, M.D. are denominated in U.S. dollars and that the amounts are subject to currency fluctuations. The translation of U.S. dollar amounts was done at the average exchange rate for the applicable calendar year. |
| (2) | Dr. Jörg Häring was appointed as a member of the Management Board as of June 1, 2024, and correspondingly receives the Short-Term Incentive for the Fiscal Year on a pro-rated basis. |
The corresponding information on the Short-Term Incentive paid out in the Fiscal Year for the performance in 2023 to Management Board members who served in 2023 was previously disclosed in the Compensation Report for the year 2023, a convenience translation of which was included in our Annual Report on Form 20-F for 2023.
Long-Term Incentive – MB LTIP 2020
On the basis of the Compensation System 2020+, Performance Shares were allocated in previous years to the Management Board members in office at the time under the MB LTIP 2020 as a performance-based Long-Term Incentive. In the Fiscal Year, the compensation from the Performance Shares allocated for 2021 was earned.
Performance Shares under the MB LTIP 2020 are non-equity, cash-settled virtual compensation instruments with a performance period of three years. Any amounts received from the Performance Shares are subject to the achievement of three equally weighted performance targets and further depend on the development of the stock exchange price of the shares of the Company.
The allocation amount for the Performance Shares equaled 135% (multiplier of 1.35) of the relevant base salary of the respective Management Board member. In order to determine the number of Performance Shares to be allocated to the relevant Management Board member, the relevant allocation amount was divided by the value per Performance Share determined in accordance with IFRS 2 and considering the average price of the Company’s shares over a period of 30 calendar days prior to each relevant allocation date. The number of Performance Shares to vest for each Management Board member depended on the achievement of the performance targets.
130
Functioning
The functioning of the MB LTIP 2020 is shown in the following diagram:
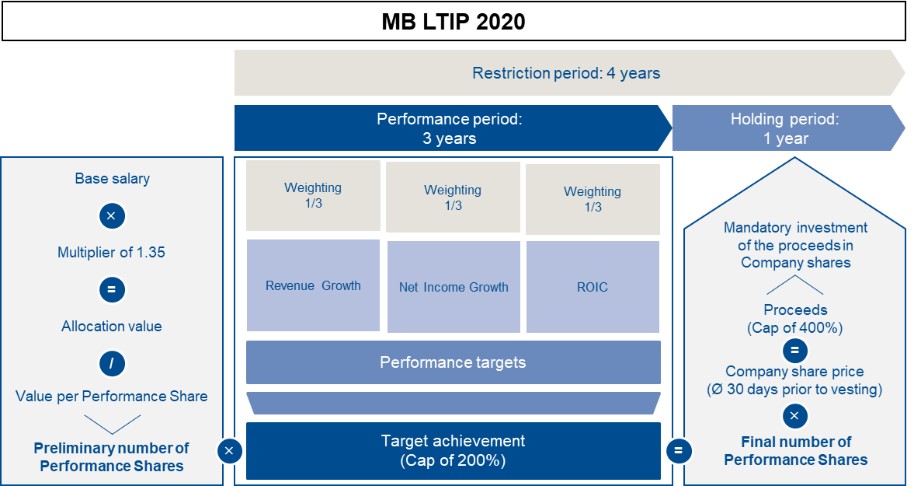
The Supervisory Board defined for each performance target the specific target values that lead to a target achievement of 0% (lower threshold), 100% and 200% (cap). The following applies to each performance target: If the lower target value is not exceeded, a target achievement of 0% applies. If the upper target value is reached or exceeded, a target achievement of 200% applies. If the actual financial figures range between the relevant target values applicable to a target achievement of 0% to 100% or 100% to 200%, the target achievement is determined by linear interpolation. At the end of the three-year performance period, the Supervisory Board determines the overall target achievement by taking the average of the target achievement levels for the three performance targets in the applicable three-year performance period. The three performance targets are equally weighted.
Based on the degree of the overall target achievement, the number of Performance Shares to vest is determined for each member of the Management Board. The number of Performance Shares may increase or decrease over the performance period. A total loss as well as (at most) doubling of the allocated Performance Shares in case of a target achievement of 200% (cap) is possible. After the final determination of the overall target achievement, the number of Performance Shares to vest is multiplied by the average price of the Company’s shares over the 30 calendar days preceding the relevant vesting date in order to calculate the corresponding amount received from the Performance Shares to vest. The total proceeds from the Performance Shares (the amount that can be earned under an allocation) are capped at 400% of the relevant allocation amount.
The proceeds from the Performance Shares (after taxes and duties) are transferred to a bank, which uses them to purchase shares of the Company on the stock exchange. The shares acquired in this way are subject to a holding period of at least one year. In accordance with recommendation G.10 of the GCGC, the members of the Management Board can therefore only dispose of this Long-Term Incentive after a period of at least four years.
Link to strategy
The three performance targets revenue growth, net income growth and return on invested capital (ROIC) were selected because they provide effective incentives that the Company’s investments achieve a certain return and thus promote long-term, profitable growth and an attractive total return for shareholders. These performance targets form part of the Company’s primary key performance indicators or secondary financial performance indicators and support the execution of the Company’s long-term strategy.
131
The respective weighting of the individual performance targets for the Long-Term Incentive and their link to Fresenius Medical Care’s strategy are shown in the following diagram:
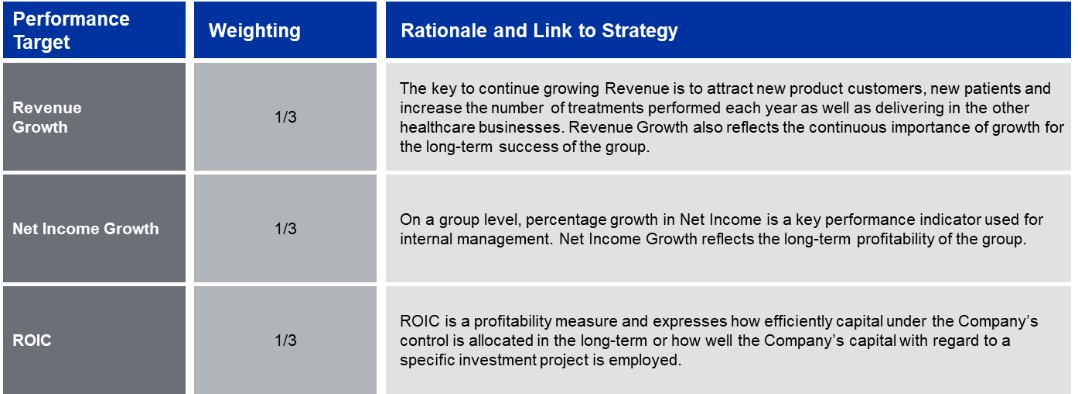
Target values and target achievement (Allocation 2021)
In the Fiscal Year, the Long-Term Incentive from the allocation for 2021 was earned. The performance targets for the 2021, 2022 and 2023 performance periods were decisive for target achievement. The annual target values and target achievement are shown in the following table:
|
Long-Term Incentive – Target values and target achievement for the Allocation 2021 under the MB LTIP 2020 |
|
||||||||||||||||
|
|
|
Target values |
|
Actual values |
|
Target achievement |
|
||||||||||
|
|
|
|
|
|
|
|
|
|
|
|
|
At Constant |
|
|
|
|
|
|
|
|
|
|
|
|
|
|
|
|
Currency |
|
Currency |
|
Per |
|
|
|
|
|
|
|
|
|
|
|
|
As |
|
translation |
|
according to |
|
performance |
|
|
|
|
|
|
0% |
|
100% |
|
200% |
|
reported |
|
adjustment |
|
plan terms |
|
target |
|
Annual |
|
|
2021 |
|
|
|
|
|
|
|
|
|
|
|
|
|
|
|
|
|
|
Revenue growth |
|
≤ 1 |
% |
= 6 |
% |
≥ 11 |
% |
(1.3) |
% |
3.1 |
% |
1.8 |
% |
16 |
% |
|
|
|
Net income growth |
|
≤ 0 |
% |
= 5 |
% |
≥ 10 |
% |
(16.8) |
% |
2.4 |
% |
(14.4) |
% |
0 |
% |
5 |
% |
|
Return on invested capital (ROIC) |
|
≤ 5.5 |
% |
= 6.0 |
% |
≥ 6.5 |
% |
4.9 |
% |
— |
% |
4.9 |
% |
0 |
% |
|
|
|
|
|
|
|
|
|
|
|
|
|
|
|
|
|
|
|
|
|
|
2022 |
|
|
|
|
|
|
|
|
|
|
|
|
|
|
|
|
|
|
Revenue growth |
|
≤ 1 |
% |
= 6 |
% |
≥ 11 |
% |
10.1 |
% |
(8.0) |
% |
2.1 |
% |
22 |
% |
|
|
|
Net income growth |
|
≤ 0 |
% |
= 5 |
% |
≥ 10 |
% |
(30.5) |
% |
(6.1) |
% |
(36.6) |
% |
0 |
% |
7 |
% |
|
Return on invested capital (ROIC) |
|
≤ 5.5 |
% |
= 6.0 |
% |
≥ 6.5 |
% |
3.3 |
% |
— |
% |
3.3 |
% |
0 |
% |
|
|
|
|
|
|
|
|
|
|
|
|
|
|
|
|
|
|
|
|
|
|
2023 |
|
|
|
|
|
|
|
|
|
|
|
|
|
|
|
|
|
|
Revenue growth |
|
≤ 1 |
% |
= 6 |
% |
≥ 11 |
% |
0.3 |
% |
5.2 |
% |
5.5 |
% |
90 |
% |
|
|
|
Net income growth |
|
≤ 0 |
% |
= 5 |
% |
≥ 10 |
% |
(25.9) |
% |
1.6 |
% |
(24.3) |
% |
0 |
% |
30 |
% |
|
Return on invested capital (ROIC) |
|
≤ 5.5 |
% |
= 6.0 |
% |
≥ 6.5 |
% |
2.8 |
% |
— |
% |
2.8 |
% |
0 |
% |
|
|
|
|
|
|
|
|
|
|
|
|
|
|
|
|
|
|
|
|
|
|
Overall Target Achievement |
|
|
|
|
|
|
|
|
|
|
|
|
|
|
|
14 |
% |
132
Vested amounts (Allocation 2021)
The following table shows the amounts that vested in the Fiscal Year from the Allocation 2021 and were awarded within the meaning of Section 162 paragraph 1 sentence 1 AktG:
|
Long-Term Incentive – Vested amount from the Allocation 2021 of the MB LTIP 2020 |
||||||||||||
|
|
|
|
|
Number of |
|
|
|
|
|
|
|
|
|
|
|
|
|
allocated |
|
|
|
Number of final |
|
|
|
|
|
|
|
Fair Value at |
|
Performance |
|
Overall target |
|
Performance |
|
Share price at |
|
|
|
|
|
allocation |
|
Shares |
|
achievement |
|
Shares |
|
vesting |
|
Vested amount |
|
|
|
in € THOUS |
|
|
|
in % |
|
|
|
in € |
|
in € THOUS |
|
|
|
|
|
|
|
|
|
|
|
|
|
|
|
Members of the Management Board in office in the Fiscal Year |
|
|
|
|
|
|
|
|
|
|
|
|
|
Helen Giza (1) |
|
1,138 |
|
20,941 |
|
14 |
|
2,932 |
|
36.79 |
|
121 |
|
Franklin W. Maddux, M.D. (1) |
|
1,016 |
|
18,625 |
|
14 |
|
2,608 |
|
36.79 |
|
107 |
|
Dr. Katarzyna Mazur-Hofsäß |
|
1,225 |
|
22,533 |
|
14 |
|
3,155 |
|
36.79 |
|
116 |
|
|
|
|
|
|
|
|
|
|
|
|
|
|
|
Former members of the Management Board |
|
|
|
|
|
|
|
|
|
|
|
|
|
Rice Powell (1) |
|
2,231 |
|
40,894 |
|
14 |
|
5,725 |
|
36.79 |
|
236 |
|
Dr. Olaf Schermeier |
|
1,105 |
|
20,328 |
|
14 |
|
2,846 |
|
36.79 |
|
105 |
|
William Valle (1) |
|
1,723 |
|
31,582 |
|
14 |
|
4,421 |
|
36.79 |
|
182 |
|
Kent Wanzek (1) |
|
1,033 |
|
18,929 |
|
14 |
|
2,650 |
|
36.79 |
|
109 |
|
Harry de Wit |
|
1,012 |
|
18,614 |
|
14 |
|
2,606 |
|
36.79 |
|
96 |
| (1) | Note for the amounts set out that the compensation benefits for Ms. Helen Giza as well as for Messrs. Franklin W. Maddux M.D., Rice Powell, William Valle and Kent Wanzek are denominated in U.S. dollars and that the amounts are subject to currency fluctuations. The translation of U.S. dollar amounts for the Long-Term Incentive awarded in the Fiscal Year (vested amount) was done at the closing rate of the vesting date. |
The amounts that vested in the Fiscal Year (after taxes and duties) were not paid out but in accordance with the plan terms transferred to a bank, which used them to purchase shares of the Company on the stock exchange. The shares acquired in this way are subject to a holding period of at least one year.
133
Compliance with maximum compensation (Allocations 2021)
In the Fiscal Year, compliance with the maximum compensation from allocations from 2021 could be conclusively assessed since the vesting period for the Long-Term Incentive allocated in 2021 under the MB LTIP 2020 ended and the amount earned in this respect was determined. The individual maximum compensation limits for the respective members of the Management Board for 2021 were in each case complied with. It was not necessary to reduce the payout amount of the Long-Term Incentive (as provided for in order to avoid exceeding the maximum compensation if necessary). The details are shown in the following table:
|
Compliance with the maximum compensation of the members of the Management Board then in office for 2021 |
|
||||||
|
in € THOUS |
|
Members of the Management Board in office in the Fiscal Year |
|
||||
|
|
|
Helen Giza |
|
Franklin W. Maddux, M.D. (1) |
|
Dr. Katarzyna Mazur-Hofsäß |
|
|
|
|
|
|
|
|
|
|
|
Base salary |
|
855 |
|
822 |
|
920 |
|
|
Fringe benefits |
|
214 |
|
171 |
|
60 |
|
|
Pension expense |
|
— |
|
— |
|
2,498 |
(2) |
|
Total fixed components |
|
1,069 |
|
993 |
|
3,478 |
|
|
Short-Term Incentive |
|
712 |
|
684 |
|
892 |
|
|
Long-Term Incentive (MB LTIP 2020) |
|
121 |
|
104 |
|
116 |
|
|
Total variable components |
|
833 |
|
788 |
|
1,008 |
|
|
Total compensation for 2021 |
|
1,902 |
|
1,781 |
|
4,486 |
|
|
Cap Short-Term Incentive |
|
1,077 |
|
1,036 |
|
1,159 |
|
|
Cap Long-Term Incentive |
|
4,617 |
|
4,439 |
|
4,968 |
|
|
Maximum compensation |
|
7,000 |
(3) |
7,000 |
|
7,000 |
|
|
in € THOUS |
|
Former members of the Management Board |
|
||||||||
|
|
|
Rice Powell (1) |
|
Dr. Olaf Schermeier |
|
William Valle (1) |
|
Kent Wanzek (1) |
|
Harry de Wit |
|
|
|
|
|
|
|
|
|
|
|
|
|
|
|
Base salary |
|
1,804 |
|
830 |
|
1,394 |
|
835 |
|
760 |
|
|
Fringe benefits |
|
333 |
|
88 |
|
256 |
|
167 |
|
331 |
|
|
Pension expense |
|
— |
|
282 |
|
1,348 |
|
470 |
|
548 |
|
|
Total fixed components |
|
2,137 |
|
1,200 |
|
2,998 |
|
1,472 |
|
1,639 |
|
|
Short-Term Incentive |
|
1,502 |
|
691 |
|
1,075 |
|
695 |
|
779 |
|
|
Long-Term Incentive (MB LTIP 2020) |
|
228 |
|
105 |
|
176 |
|
105 |
|
96 |
|
|
Total variable components |
|
1,730 |
|
796 |
|
1,251 |
|
800 |
|
875 |
|
|
Total compensation for 2021 |
|
3,867 |
|
1,996 |
|
4,249 |
|
2,272 |
|
2,514 |
|
|
Cap Short-Term Incentive |
|
2,273 |
|
1,046 |
|
1,756 |
|
1,052 |
|
958 |
|
|
Cap Long-Term Incentive |
|
9,742 |
|
4,482 |
|
7,528 |
|
4,509 |
|
4,104 |
|
|
Maximum compensation |
|
12,000 |
(4) |
7,000 |
|
9,500 |
(5) |
7,000 |
|
7,000 |
|
| (1) | The maximum compensation of Messrs. Franklin W. Maddux M.D., Rice Powell, William Valle and Kent Wanzek for 2021 is agreed in U.S. dollars. For the presentation in this table, the U.S. dollar amounts were translated with the exchange rate of €1/$1.11947 used when the maximum compensation in the Compensation System 2020+ was determined, which is why the amounts set out herein may deviate from the amounts set out in other tables of this Compensation Report or in tables of previous Compensation Reports. |
| (2) | The pension commitment was made in 2021. The pension expense set out herein includes the past service cost which relates to the service period rendered since the appointment as a member of the Management Board effective September 1, 2018. |
| (3) | In 2021, Ms. Helen Giza was Chief Financial Officer. Therefore, the maximum compensation amount applicable to the Chief Financial Officer applies to her maximum compensation for 2021. |
| (4) | In 2021, Mr. Rice Powell was Chairman of the Management Board. Therefore, the maximum compensation amount applicable to the Chairman of the Management Board applies to his maximum compensation for 2021. |
| (5) | In 2021, Mr. William Valle was the Management Board member responsible for the North America Region. Therefore, the maximum compensation amount applicable to the Management Board member responsible for the North America region under the Compensation System 2020+ applies to his maximum compensation for 2021. |
Compensation tables for the Management Board members in office in the Fiscal Year
The following tables show the individualized compensation awarded and due in the Fiscal Year to each Management Board member in office in the Fiscal Year. In addition, the pension expense incurred for the individual contractual pension commitments is disclosed. The tabular presentation is based on the model tables of the GCGC in its previous version dated February 7, 2017.
134
For the purposes of the following tables, compensation is deemed to have been “awarded in the fiscal year” if it has vested in the fiscal year. For this purpose, compensation is deemed to have vested in the year in which the underlying activity has been fully performed and the entitlement to payment of the compensation is no longer subject to any conditions precedent or conditions subsequent. For the Long-Term Incentives shown in this Compensation Report, this corresponds to the year in which they are paid out. The Long-Term Incentive earned under the MB LTIP 2020 is to be regarded as “awarded” irrespective of the fact that the amounts earned are to be invested in shares of the Company in accordance with the applicable plan terms.
Based on this understanding, the Short-Term Incentive is considered to have vested in the year, and is shown in the following tables for the respective years, in which the underlying activity was performed. This facilitates comparison of the performance of the members of the Management Board in a year with the performance of the Company in the same year and allows the Short-Term Incentive to be allocated on an accrual basis to the year in which the performance was performed. The columns for 2024 therefore contain the Short-Term Incentive for the Fiscal Year that will not be paid out until 2025, and the columns for 2023 contain the Short-Term Incentive for 2023 that was paid out in the Fiscal Year.
Insofar as members of the Management Board in office in the Fiscal Year have received payments as compensation for forfeited compensation benefits from a previous employment relationship, the corresponding amounts are reported under fringe benefits. Such payments were or are only made if the member of the Management Board has not resigned from office and the Company has not terminated such member’s service agreement and would not be entitled to terminate it when the payment becomes due.
|
Compensation of the members of the Management Board in office in the Fiscal Year |
||||||||||||||||
|
in € THOUS |
|
|
|
|
|
|
|
|
|
|
|
|
|
|
|
|
|
|
|
Helen Giza |
|
Craig Cordola, Ed.D. |
||||||||||||
|
|
|
Chairwoman and Chief Executive Officer |
|
Chief Executive Officer for Care Delivery |
||||||||||||
|
|
|
Member of the Management Board since November 1, 2019 |
|
Member of the Management Board since January 1, 2024 |
||||||||||||
|
|
|
2024 |
|
2023 (1) |
|
2024 |
|
2023 (1) |
||||||||
|
|
|
Absolute |
|
Ratio in % |
|
Absolute |
|
Ratio in % |
|
Absolute |
|
Ratio in % |
|
Absolute |
|
Ratio in % |
|
Base salary |
|
1,663 |
|
|
|
1,665 |
(4) |
|
|
1,340 |
|
|
|
|
|
|
|
Fringe benefits |
|
80 |
|
|
|
23 |
|
|
|
447 |
(4) |
|
|
|
|
|
|
Cash pension allowance |
|
— |
|
|
|
|
|
|
|
536 |
|
|
|
|
|
|
|
Total non-performance-based compensation |
|
1,743 |
|
47 |
|
1,688 |
|
39 |
|
2,323 |
|
62 |
|
|
|
|
|
Short-Term Incentive |
|
1,844 |
|
50 |
|
2,017 |
|
47 |
|
1,395 |
|
38 |
|
|
|
|
|
Long-Term Incentive |
|
121 |
|
3 |
|
599 |
|
14 |
|
— |
|
— |
|
|
|
|
|
Allocation 2019 (Share Based Award (2) ) |
|
|
|
|
|
32 |
|
|
|
|
|
|
|
|
|
|
|
Allocation 2019 (MB LTIP 2019 (3) ) |
|
|
|
|
|
180 |
|
|
|
|
|
|
|
|
|
|
|
Allocation 2020 (MB LTIP 2020) |
|
|
|
|
|
387 |
|
|
|
|
|
|
|
|
|
|
|
Allocation 2021 (MB LTIP 2020) |
|
121 |
|
|
|
|
|
|
|
— |
|
|
|
|
|
|
|
Total variable compensation |
|
1,965 |
|
|
|
2,616 |
|
|
|
1,395 |
|
|
|
|
|
|
|
Total compensation according to sec. 162 para. 1 sent. 2 no. 1 AktG |
|
3,708 |
|
|
|
4,304 |
|
|
|
3,718 |
|
|
|
|
|
|
|
Pension expense |
|
729 |
|
|
|
625 |
|
|
|
— |
|
|
|
|
|
|
|
Total compensation including pension expense |
|
4,437 |
|
|
|
4,929 |
|
|
|
3,718 |
|
|
|
|
|
|
135
|
|
|
Martin Fischer |
|
Dr. Jörg Häring |
||||||||||||
|
|
|
Chief Financial Officer |
|
Legal, Compliance and Human Resources |
||||||||||||
|
|
|
Member of the Management Board since October 1, 2023 |
|
Member of the Management Board since June 1, 2024 |
||||||||||||
|
|
|
2024 |
|
2023 (1) |
|
2024 |
|
2023 (1) |
||||||||
|
|
|
Absolute |
|
Ratio in % |
|
Absolute |
|
Ratio in % |
|
Absolute |
|
Ratio in % |
|
Absolute |
|
Ratio in % |
|
Base salary |
|
800 |
|
|
|
200 |
|
|
|
408 |
|
|
|
|
|
|
|
Fringe benefits |
|
437 |
(5) |
|
|
445 |
(5) |
|
|
354 |
(7) |
|
|
|
|
|
|
Cash pension allowance |
|
400 |
(6) |
|
|
|
|
|
|
163 |
|
|
|
|
|
|
|
Total non-performance-based compensation |
|
1,637 |
|
65 |
|
645 |
|
73 |
|
925 |
|
67 |
|
|
|
|
|
Short-Term Incentive |
|
887 |
|
35 |
|
242 |
|
27 |
|
453 |
|
33 |
|
|
|
|
|
Long-Term Incentive |
|
— |
|
— |
|
— |
|
— |
|
— |
|
— |
|
|
|
|
|
Allocation 2019 (Share Based Award (2) ) |
|
|
|
|
|
— |
|
|
|
|
|
|
|
|
|
|
|
Allocation 2019 (MB LTIP 2019 (3) ) |
|
|
|
|
|
— |
|
|
|
|
|
|
|
|
|
|
|
Allocation 2020 (MB LTIP 2020) |
|
|
|
|
|
— |
|
|
|
|
|
|
|
|
|
|
|
Allocation 2021 (MB LTIP 2020) |
|
— |
|
|
|
|
|
|
|
— |
|
|
|
|
|
|
|
Total variable compensation |
|
887 |
|
|
|
242 |
|
|
|
453 |
|
|
|
|
|
|
|
Total compensation according to sec. 162 para. 1 sent. 2 no. 1 AktG |
|
2,524 |
|
|
|
887 |
|
|
|
1,378 |
|
|
|
|
|
|
|
Pension expense |
|
— |
|
|
|
— |
|
|
|
— |
|
|
|
|
|
|
|
Total compensation including pension expense |
|
2,524 |
|
|
|
887 |
|
|
|
1,378 |
|
|
|
|
|
|
|
Compensation of the members of the Management Board in office in the Fiscal Year |
||||||||||||||||
|
|
|
Franklin W. Maddux, M.D. |
|
Dr. Katarzyna Mazur-Hofsäß |
||||||||||||
|
|
|
Global Chief Medical Officer |
|
Chief Executive Officer for Care Enablement |
||||||||||||
|
|
|
Member of the Management Board since January 1, 2020 |
|
Member of the Management Board since September 1, 2018 |
||||||||||||
|
|
|
2024 |
|
2023 (1) |
|
2024 |
|
2023 (1) |
||||||||
|
|
|
Absolute |
|
Ratio in % |
|
Absolute |
|
Ratio in % |
|
Absolute |
|
Ratio in % |
|
Absolute |
|
Ratio in % |
|
Base salary |
|
979 |
|
|
|
980 |
|
|
|
1,064 |
|
|
|
1,064 |
|
|
|
Fringe benefits |
|
187 |
|
|
|
187 |
|
|
|
57 |
|
|
|
32 |
|
|
|
Cash pension allowance |
|
— |
|
|
|
|
|
|
|
— |
|
|
|
|
|
|
|
Total non-performance-based compensation |
|
1,166 |
|
49 |
|
1,167 |
|
43 |
|
1,121 |
|
42 |
|
1,096 |
|
34 |
|
Short-Term Incentive |
|
1,086 |
|
46 |
|
1,188 |
|
44 |
|
1,429 |
|
54 |
|
1,289 |
|
40 |
|
Long-Term Incentive |
|
107 |
|
5 |
|
353 |
|
13 |
|
116 |
|
4 |
|
825 |
|
26 |
|
Allocation 2019 (Share Based Award (2) ) |
|
|
|
|
|
— |
|
|
|
|
|
|
|
227 |
|
|
|
Allocation 2019 (MB LTIP 2019 (3) ) |
|
|
|
|
|
— |
|
|
|
|
|
|
|
226 |
|
|
|
Allocation 2020 (MB LTIP 2020) |
|
|
|
|
|
353 |
|
|
|
|
|
|
|
372 |
|
|
|
Allocation 2021 (MB LTIP 2020) |
|
107 |
|
|
|
|
|
|
|
116 |
|
|
|
|
|
|
|
Total variable compensation |
|
1,193 |
|
|
|
1,541 |
|
|
|
1,545 |
|
|
|
2,114 |
|
|
|
Total compensation according to sec. 162 para. 1 sent. 2 no. 1 AktG |
|
2,359 |
|
|
|
2,708 |
|
|
|
2,666 |
|
|
|
3,210 |
|
|
|
Pension expense |
|
397 |
|
|
|
418 |
|
|
|
611 |
|
|
|
499 |
|
|
|
Total compensation including pension expense |
|
2,756 |
|
|
|
3,126 |
|
|
|
3,277 |
|
|
|
3,709 |
|
|
| (1) | Note for purposes of comparison between the amounts indicated and those of the Fiscal Year that the compensation is subject to foreign exchange rate fluctuations depending on whether it is contractually denominated in euro (Mr. Martin Fischer, Dr. Jörg Häring and Dr. Katarzyna Mazur-Hofsäß) or U.S. dollars (Ms. Helen Giza, Craig Cordola, Ed.D. and Mr. Franklin W. Maddux, M.D.). The plan terms of the Share Based Award entitled to payments in euro. In principle, the translation of U.S. dollar amounts was done at the average exchange rate for the applicable calendar year. For the Long-Term Incentive the translation of U.S. dollar amounts was done at the closing rate of the applicable vesting date. |
| (2) | The Share Based Award was an amount of the variable compensation component that under the compensation systems applicable until December 31, 2019 was to be converted into virtual shares of the Company not backed by equity of the Company as an amount to be deferred. Further details can be found in previous Compensation Reports. |
| (3) | The Management Board Long Term Incentive Plan 2019 (MB LTIP 2019) was the predecessor plan to the MB LTIP 2020. Further details can be found in previous Compensation Reports. |
| (4) | The fringe benefits of Mr. Craig Cordola, Ed.D. reported for the Fiscal Year include a payment of $450 THOUS (€416 THOUS), which he received as compensation for forfeited compensation benefits from a previous employment relationship. As agreed, Mr. Cordola, Ed.D. invested 50% of the net amount of this compensation in shares of the Company. |
| (5) | The fringe benefits of Mr. Martin Fischer include a payment of €300 THOUS for each of the Fiscal Year and 2023, which he received as compensation for forfeited compensation benefits from a previous employment relationship. In 2025, Mr. Fischer can receive a further payment of up to €300 THOUS as compensation for forfeited compensation benefits from a previous employment relationship. |
| (6) | Since October 1, 2024, Mr. Martin Fischer has received the pension allowance described in this Compensation Report. The defined contribution pension commitment previously promised to Mr. Fischer in the event of the conclusion of a corresponding reinsurance policy was canceled in view of the new pension regulations under the Compensation System 2024+. The amount reported here also includes an amount of €320 THOUS (corresponding to 40% of his annual base salary), which Mr. Fischer received in the Fiscal Year as compensation for the insurance contributions that would otherwise have to be paid for the period from October 1, 2023 to September 30, 2024. |
| (7) | The fringe benefits of Dr. Jörg Häring reported for the Fiscal Year include a payment of €300 THOUS, which he received as compensation for forfeited compensation benefits from a previous employment relationship. |
136
Outstanding share-based compensation components
The following information concerns outstanding share-based compensation components. To the extent share-based compensation components are outstanding after the end of the Fiscal Year, these relate solely to allocations of Performance Shares under the MB LTIP 2020 and the MB LTIP 2024+.
MB LTIP 2024+ (Allocation in the Fiscal Year)
Under the Compensation System 2024+, the members of the Management Board were allocated Performance Shares as a long-term variable compensation component under the Management Board Long-Term Incentive Plan 2024+ (MB LTIP 2024+) in the Fiscal Year. The functioning of the MB LTIP 2024+ is shown in the following diagram:
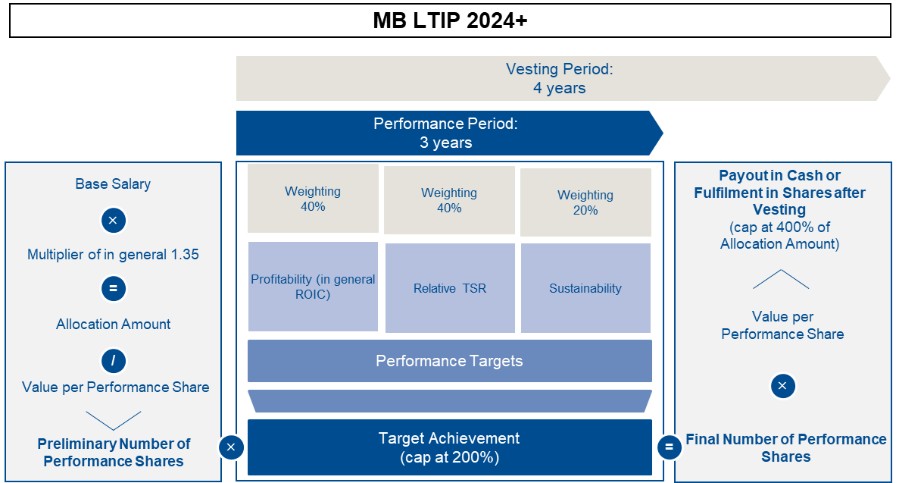
137
As in previous years, return on invested capital (ROIC) has been set as the profitability target. The target achievement of the Relative TSR is determined based on the percentile ranking of the TSR performance of the Company in comparison to the TSR performance of the companies of the STOXX® Europe 600 Health Care and S&P 500 Health Care indices. The reduction in market-based CO 2 e emissions has been set as the sustainability target. This target is in line with the topic of climate protection relevant to Fresenius Medical Care, which emerged from the company’s last materiality analysis in 2023. Information on the target values and the respective performance target achievement will be disclosed after the end of the performance period in the Compensation Report for the relevant fiscal year.
The performance shares allocated in the Fiscal Year are paid out in cash after vesting. The allocation amount for the Performance Shares equaled 135% (multiplier of 1.35) of the relevant base salary of the respective Management Board member. The number of Performance Shares allocated in the Fiscal Year, which was determined taking into account the allocation amount (base salary times the multiplier) and the value per Performance Share on the allocation date, is shown in the following table:
|
Performance Shares allocated in the Fiscal Year under the MB LTIP 2024+ |
||||||||||||
|
|
|
|
|
|
|
|
|
Value per |
|
|
|
|
|
|
|
|
|
|
|
|
|
Performance |
|
Number of |
|
|
|
|
|
|
|
|
|
|
|
Share |
|
Performance |
|
|
|
|
|
Base salary |
|
Multiplier |
|
Allocation amount |
|
at allocation (1) |
|
Shares |
|
Cap (400%) |
|
|
|
in € THOUS |
|
|
|
in € THOUS |
|
in € |
|
|
|
in € THOUS |
|
Helen Giza (2) |
|
1,663 |
|
1.35 |
|
2,245 |
|
31.54 |
|
71,358 |
|
8,980 |
|
Craig Cordola, Ed.D. (2) |
|
1,340 |
|
1.35 |
|
1,809 |
|
31.54 |
|
57,483 |
|
7,236 |
|
Martin Fischer |
|
800 |
|
1.35 |
|
1,080 |
|
31.54 |
|
34,242 |
|
4,320 |
|
Dr. Jörg Häring (3) |
|
408 |
|
1.35 |
|
551 |
|
34.78 |
|
15,850 |
|
2,204 |
|
Franklin W. Maddux, M.D. (2) |
|
979 |
|
1.35 |
|
1,322 |
|
31.54 |
|
42,022 |
|
5,288 |
|
Dr. Katarzyna Mazur-Hofsäß |
|
1,064 |
|
1.35 |
|
1,436 |
|
31.54 |
|
45,542 |
|
5,744 |
| (1) | The value per Performance Share as set out herein and relevant for the number of Performance Shares to be allocated is determined according to the plan terms considering the average price of the Company’s shares over a period of 30 calendar days prior to the allocation date and assuming a 100% target achievement for the performance target “Relative TSR”, which is why it may deviate from the Fair Value according to IFRS 2. |
| (2) | Note for the amounts as set out herein that the compensation benefits for Ms. Helen Giza as well as Messrs. Craig Cordola, Ed.D. and Franklin W. Maddux, M.D. are denominated in U.S. dollars and that the amounts are subject to currency fluctuations. The translation of U.S. dollar amounts was done at the average exchange rate for the applicable calendar year. |
| (3) | Dr. Jörg Häring was appointed as a member of the Management Board as of June 1, 2024, and has therefore received a pro-rated allocation under the MB LTIP 2024+ in the Fiscal Year. The allocation for Dr. Häring was made as of June 1, 2024. The value per Performance Share at allocation therefore differs from that for the other Management Board members, for whom the allocation was made as of March 1, 2024. |
138
Overview of outstanding share-based compensation components
The status of the outstanding Performance Shares of the current and former members of the Management Board in the Fiscal Year and further information are shown in the following table:
|
Overview of outstanding Performance Shares allocated under the MB LTIP 2020 and under the MB LTIP 2024+ |
||||||||||||
|
|
|
|
|
|
|
|
|
|
|
|
|
Number of |
|
|
|
|
|
|
|
|
|
Number of |
|
|
|
Performance |
|
|
|
|
|
|
|
|
|
allocated |
|
Overall target |
|
Shares as of |
|
|
|
|
|
|
|
Fair Value at |
|
Performance |
|
achievement |
|
December 31, |
|
|
|
Allocation date |
|
Vesting date |
|
allocation (1) |
|
Shares |
|
(if final) |
|
2024 |
|
|
|
|
|
|
|
in € THOUS |
|
|
|
in % |
|
|
|
Members of the Management Board in office in the Fiscal Year |
||||||||||||
|
Helen Giza |
|
|
|
|
|
|
|
|
|
|
|
|
|
Allocation 2022 |
|
March 1, 2022 |
|
March 1, 2025 |
|
1,688 |
|
32,279 |
|
6 |
|
1,937 |
|
Allocation 2023 |
|
March 1, 2023 |
|
March 1, 2026 |
|
2,177 |
|
67,568 |
|
|
|
67,568 |
|
Allocation 2024 |
|
March 1, 2024 |
|
March 1, 2028 |
|
2,182 |
|
71,358 |
|
|
|
71,358 |
|
Total |
|
|
|
|
|
|
|
171,205 |
|
|
|
140,863 |
|
|
|
|
|
|
|
|
|
|
|
|
|
|
|
Craig Cordola, Ed.D. |
|
|
|
|
|
|
|
|
|
|
|
|
|
Allocation 2024 |
|
March 1, 2024 |
|
March 1, 2028 |
|
1,758 |
|
57,483 |
|
|
|
57,483 |
|
Total |
|
|
|
|
|
|
|
57,483 |
|
|
|
57,483 |
|
|
|
|
|
|
|
|
|
|
|
|
|
|
|
Martin Fischer |
|
|
|
|
|
|
|
|
|
|
|
|
|
Allocation 2023 |
|
October 1, 2023 |
|
October 1, 2026 |
|
264 |
|
7,037 |
|
|
|
7,037 |
|
Allocation 2024 |
|
March 1, 2024 |
|
March 1, 2028 |
|
1,049 |
|
34,242 |
|
|
|
34,242 |
|
Total |
|
|
|
|
|
|
|
41,279 |
|
|
|
41,279 |
|
|
|
|
|
|
|
|
|
|
|
|
|
|
|
Dr. Jörg Häring |
|
|
|
|
|
|
|
|
|
|
|
|
|
Allocation 2024 |
|
June 1, 2024 |
|
June 1, 2028 |
|
546 |
|
15,850 |
|
|
|
15,850 |
|
Total |
|
|
|
|
|
|
|
15,850 |
|
|
|
15,850 |
|
|
|
|
|
|
|
|
|
|
|
|
|
|
|
Franklin W. Maddux, M.D. |
|
|
|
|
|
|
|
|
|
|
|
|
|
Allocation 2022 |
|
March 1, 2022 |
|
March 1, 2025 |
|
1,110 |
|
20,974 |
|
6 |
|
1,258 |
|
Allocation 2023 |
|
March 1, 2023 |
|
March 1, 2026 |
|
1,282 |
|
39,790 |
|
|
|
39,790 |
|
Allocation 2024 |
|
March 1, 2024 |
|
March 1, 2028 |
|
1,285 |
|
42,022 |
|
|
|
42,022 |
|
Total |
|
|
|
|
|
|
|
102,786 |
|
|
|
83,070 |
|
|
|
|
|
|
|
|
|
|
|
|
|
|
|
Dr. Katarzyna Mazur-Hofsäß |
|
|
|
|
|
|
|
|
|
|
|
|
|
Allocation 2022 |
|
March 1, 2022 |
|
March 1, 2025 |
|
1,359 |
|
26,074 |
|
6 |
|
1,564 |
|
Allocation 2023 |
|
March 1, 2023 |
|
March 1, 2026 |
|
1,375 |
|
42,852 |
|
|
|
42,852 |
|
Allocation 2024 |
|
March 1, 2024 |
|
March 1, 2028 |
|
1,395 |
|
45,542 |
|
|
|
45,542 |
|
Total |
|
|
|
|
|
|
|
114,468 |
|
|
|
89,958 |
|
|
|
|
|
|
|
|
|
|
|
|
|
|
|
Former members of the Management Board |
||||||||||||
|
Rice Powell |
|
|
|
|
|
|
|
|
|
|
|
|
|
Allocation 2022 |
|
March 1, 2022 |
|
March 1, 2025 |
|
2,425 |
|
45,841 |
|
6 |
|
2,750 |
|
Total |
|
|
|
|
|
|
|
45,841 |
|
|
|
2,750 |
|
|
|
|
|
|
|
|
|
|
|
|
|
|
|
William Valle |
|
|
|
|
|
|
|
|
|
|
|
|
|
Allocation 2022 |
|
March 1, 2022 |
|
March 1, 2025 |
|
1,888 |
|
35,678 |
|
6 |
|
2,141 |
|
Allocation 2023 |
|
March 1, 2023 |
|
March 1, 2026 |
|
1,995 |
|
61,938 |
|
|
|
61,938 |
|
Total |
|
|
|
|
|
|
|
97,616 |
|
|
|
64,079 |
| (1) | The IFRS 2 Fair Value in principle reflects all market conditions, including for the Allocation 2024 the current target achievement for the performance target “Relative TSR” on the respective allocation date. The amounts set out herein for the Allocation 2024 are based on a 100% target achievement for the performance target “Relative TSR” to avoid the allocation value being influenced by short-term volatility in the development of the Company’s Relative TSR and to enable comparability of the allocation value with those from previous years. |
139
Temporal profile of the share-based compensation components
The following diagram shows the temporal profile of the outstanding share-based compensation components. The temporal profile uses a simplified, schematic illustration of the allocations. The details can be found in the tables above and in the corresponding explanations.
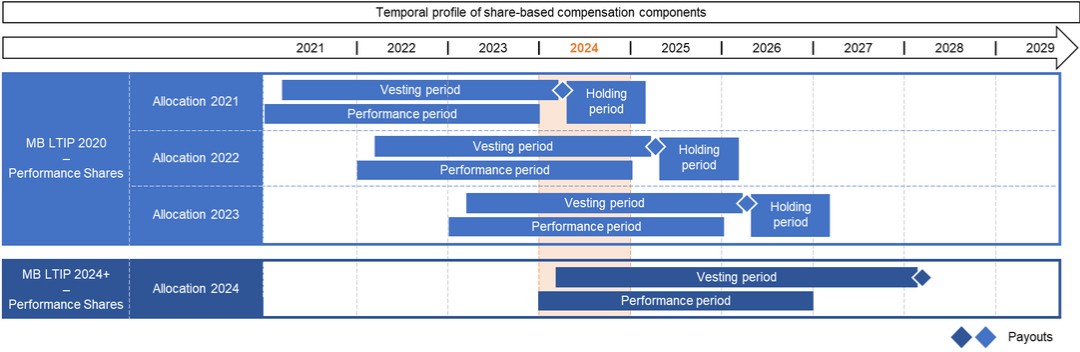
Share Ownership Guidelines and Shareholdings
Under the formal Share Ownership Guidelines (SOG) introduced with the Compensation System 2024+, the members of the Management Board are generally obliged to invest a portion of their compensation in shares of the Company (SOG amount) within four years of the start of their respective service agreement, but no earlier than January 1, 2024, and to hold these shares for at least two years after the end of their respective service agreement. Further information on this can be found in the section “Introduction of Share Ownership Guidelines.”
The obligation to invest the amounts earned from allocations under the MB LTIP 2020 in accordance with the applicable plan terms in shares of the Company, which must be held for at least one year, remains unaffected. The amounts invested by the members of the Management Board in the Fiscal Year in this respect are shown in the section “Vested amounts (Allocation 2021).”
In addition, in 2021, the supervisory board of the General Partner responsible at the time decided that the Management Board members then in office – with their consent – would acquire shares on the Company on the stock exchange for a portion of their variable compensation and hold such shares for at least three years. Further information on this can be found in the Compensation Report for previous years.
Shares acquired prior to the beginning of the investment period relevant for the SOG or as part of an equity settlement under a long-term incentive plan are credited to the investment obligation. Changes in the value of the shares after their acquisition are not taken into account for purposes of the fulfillment of the investment obligation under the SOG.
140
The shareholdings notified to the Company as of the end of the Fiscal Year of the members of the Management Board in office in the Fiscal Year as well as the status of the fulfillment of the SOG are shown in the following table. The investment obligation under the SOG may be satisfied by acquisition of shares or American Depositary Shares (ADSs). For simplification purposes, the number of shares and ADSs have been combined in the following table. Where ADSs are held, two ADSs represent one share.
|
Overview on the SOG requirements and on the status |
||||||||||||||||
|
|
|
|
|
|
|
|
|
|
|
|
|
|
|
|
|
|
|
|
|
|
|
SOG requirements |
|
Status as of December 31, 2024 |
||||||||||
|
|
|
Member of the |
|
|
|
SOG amount |
|
|
|
|
|
|
|
|
|
|
|
|
|
Management Board |
|
Annual base |
|
in % of base |
|
|
|
|
|
Amount |
|
Status of |
|
Number of |
|
|
|
since |
|
salary |
|
salary |
|
SOG amount |
|
To fulfill until |
|
invested (3) |
|
fulfillment |
|
shares |
|
|
|
|
|
in € THOUS |
|
in % |
|
in € THOUS |
|
|
|
in TSD € |
|
in % |
|
|
|
Helen Giza (1) |
|
November 1, 2019 |
(2) |
1,663 |
|
200 |
|
3,326 |
|
December 31, 2027 |
|
767 |
|
23 |
|
17,036 |
|
Craig Cordola, Ed.D. (1) |
|
January 1, 2024 |
|
1,340 |
|
150 |
|
2,010 |
|
December 31, 2027 |
|
1,379 |
|
69 |
|
39,448 |
|
Martin Fischer |
|
October 1, 2023 |
|
800 |
|
150 |
|
1,200 |
|
December 31, 2027 |
|
— |
|
— |
|
— |
|
Dr. Jörg Häring |
|
June 1, 2024 |
|
700 |
|
150 |
|
1,050 |
|
May 31, 2028 |
(4) |
— |
|
— |
|
— |
|
Franklin W. Maddux, M.D. (1) |
|
January 1, 2020 |
|
979 |
|
150 |
|
1,469 |
|
December 31, 2027 |
|
1,188 |
|
81 |
|
23,687 |
|
Dr. Katarzyna Mazur-Hofsäß |
|
September 1, 2018 |
|
1,064 |
|
150 |
|
1,596 |
|
December 31, 2027 |
|
553 |
|
35 |
|
12,928 |
| (1) | The annual base salary and consequently also the SOG amount and the amount invested for Ms. Helen Giza and for Messrs. Craig Cordola, Ed.D. and Franklin W. Maddux, M.D is agreed in U.S. dollars. For the presentation in this table, the U.S. dollar amounts were translated with the average exchange rate of the calendar year. |
| (2) | Ms. Helen Giza is Chairwoman and Chief Executive Officer since December 6, 2022, for whom the increased SOG amount applies. |
| (3) | According to the SOG, the acquired shares are in principle credited with the amount invested. There is no revaluation on a specific reporting date or at current share prices. To the extent the acquisition is made in a currency other than that of the agreed base salary and consequently also of the SOG amount, the translation of the invested amounts is done at the exchange rate of the respective acquisition date. |
| (4) | Dr. Jörg Häring is member of the Management Board since June 1, 2024, which is why the time limit for investing the SOG amount deviates from the time limit for the other members of the Management Board. |
Other benefits and commitments
The following information concerns benefits and commitments to members of the Management Board within the meaning of Section 162 paragraph 2 AktG and related disclosures as, for instance, on the cash pension allowance.
Benefits from third parties
Unless otherwise stated in this Compensation Report, no benefits were awarded or promised to the members of the Management Board by a third party in the Fiscal Year with regard to their activities as members of the Management Board, and compensation awarded to members of the Management Board for management activities or supervisory board mandates in companies of the Company’s group is offset against the compensation of the respective member of the Management Board. If the Supervisory Board resolves that compensation awarded to members of the Management Board for supervisory board activities outside the Company’s group shall be deducted in full or in part from the compensation of the respective member of the Management Board, this will be made transparent accordingly.
Pension-related obligations
The pension arrangements with the members of the Management Board and the changes to the corresponding commitments agreed in the Fiscal Year to implement the Compensation System 2024+ are presented below.
Cash pension allowance and defined contribution pension commitments
The members of the Management Board first appointed with effect from or after January 1, 2024, Mr. Craig Cordola, Ed.D. and Dr. Jörg Häring, as well as future members of the Management Board, have been or will be granted a cash pension payment allowance in the amount of 40% of their respective base salary in accordance with the Compensation System 2024+. The pension allowance is generally paid in the same cycle as the base salary.
141
In the Fiscal Year, it was agreed with the members of the Management Board Ms. Helen Giza and Mr. Franklin W. Maddux, M.D., each of whom has been granted a pension commitment within the framework of a defined contribution plan, and with Mr. Martin Fischer, who had been promised such a pension commitment in the event of the conclusion of a corresponding reinsurance policy, that the pension commitments would each be canceled and that they would instead be granted the aforementioned pension allowance with effect from the cancellation of the pension commitment. The cancellation of the pension commitment for Mr. Fischer took effect at the end of September 30, 2024. The termination of the pension commitments for Ms. Giza and Mr. Maddux, M.D. will each take effect in 2025. It was agreed with the aforementioned members of the Management Board that they would each receive a payment in the amount of the sum of the insurance contributions that have been paid (for Ms. Giza and Mr. Maddux, M.D.) or should have been paid (for Mr. Fischer, for whose pension commitment no reinsurance policy had until then been taken out) as compensation when the cancellation of the respective pension commitments takes effect. As the insurance contributions for the financing of the defined contribution plans and the pension allowance each correspond to 40% of the annual base salary, this change is neutral in terms of amount for the members of the Management Board.
For the defined contribution commitments that still exist after the end of the Fiscal Year, there is generally a waiting period for the granting of benefits during the first three years after the pension commitment has been made. Under the defined contribution plan, an annual insurance contribution amounting to 40% of the base salary, which determines the future benefit amount, is paid for the respective Management Board member retrospectively for the period from the appointment as a member of the Management Board. After reaching the relevant retirement age under the defined contribution plan, payments can be made either as a one-off payment or optionally in ten annual installments. An annuity payment is not provided. The defined contribution plan provides for survivors’ benefits (Hinterbliebenenversorgung) and benefits after the occurrence of a full or partial reduction in earning capacity (Erwerbsminderung) . The implementation of the defined contribution plan is carried out in the form of external financing as a defined contribution plan with a reinsurance policy. The risks of death and occupational disability are covered already upon making of the pension commitment.
The insurance contributions in the Fiscal Year and the present value as of December 31 of the Fiscal Year are as follows:
|
Defined contribution pension commitments |
|
|
|
|
|
in € THOUS |
|
Insurance |
|
Present value as of |
|
|
|
contribution 2024 |
|
December 31, 2024 |
|
Helen Giza |
|
729 |
|
2,427 |
|
Franklin W. Maddux, M.D. |
|
397 |
|
1,704 |
|
Total: |
|
1,126 |
|
4,131 |
Defined benefit pension commitments
The Management Board member Dr. Katarzyna Mazur-Hofsäß and individual former Management Board members, each of whom were appointed to the Management Board before January 1, 2019, were each made an individual, performance-based (i.e., defined benefit) contractual pension commitment.
The defined benefit pension commitments each provide for a retirement pension and survivor benefits ( Hinterbliebenenversorgung ) as of the time of conclusively ending active work (at age 65 at the earliest) or upon occurrence of disability or incapacity to work ( Berufs- oder Erwerbsunfähigkeit ) or of a full or partial reduction in earning capacity ( Erwerbsminderung ), calculated by reference to the amount of the recipient’s most recent base salary.
The retirement pension in principle amounts to 30% of the pensionable income. The aforementioned percentage increases by 1.5 percentage points for each full year of service, up to a maximum of 45%. The pensionable income is determined on the basis of the average base salary in the last five years before the occurrence of the insured event. Current retirement pensions increase according to statutory requirements (Section 16 of the German Act for the Improvement of Company Pension Plans ( BetrAVG )). As a general rule, 30% of the gross amount of any post-retirement income from an activity of the Management Board member is to be offset against the pension.
If the Management Board member dies, the surviving spouse receives a pension amounting to 60% of the pension claim applicable at that time. Furthermore, the deceased Management Board member’s natural legitimate children ( leibliche eheliche Kinder ) receive an orphan’s pension amounting to 20% of the pension claim applicable at that time until they complete their education, but no longer than they reach 25 years of age. However, all orphans’ pensions and the surviving spouse’s pension, taken together, may not exceed 90% of the Management Board member’s pension claim.
142
If the Management Board member leaves the Management Board before reaching the age of 65, the rights to the aforementioned benefits survive. In such case, however, the pension to be paid is reduced – unless the Management Board member ceases to hold office because a covered event occurs (disability or incapacity to work, payment of a survivor’s pension in case of death or, if applicable, early retirement) – in proportion to the ratio of the actual years of service as a Management Board member to the potential years of service until reaching the age of 65.
According to IAS 19, the pension commitment for Dr. Katarzyna Mazur-Hofsäß has increased by €632 THOUS in the Fiscal Year and amounted to €3,660 THOUS on December 31, 2024 (December 31, 2023: €3,028 THOUS).
U.S.-based 401(k) Savings Plan
Based on individual contractual commitments, the Management Board members Ms. Helen Giza and Mr. Craig Cordola, Ed.D., additionally participated in the U.S.-based 401(k) Savings Plan in the Fiscal Year. In this context, an amount of $10,350 (€9,562) for Ms. Giza and an amount of $4,756 (€4,394) for Mr. Cordola, Ed.D., were earned in the Fiscal Year. This plan generally allows employees in the U.S. to invest a limited portion of their gross salaries in retirement pension programs. The company supports its employees at this with matching contributions of up to 50% of the annual payments.
Post-employment non-competition covenant
A post-employment non-competition covenant was agreed with each member of the Management Board. If such covenant becomes applicable, the member of the Management Board will receive, for a period of up to two years, non-compete compensation amounting to half of the respective annual base salary for each year the non-competition covenant is applied.
Change of control
The service agreements of the Management Board members contain no express provisions for the event of a change of control.
Severance payment cap
The service agreements concluded with the Management Board members provide for a severance payment cap. Under this cap, payments in connection with the early termination of a Management Board activity may not exceed the value of two years’ compensation and may not compensate for more than the remaining term of the service agreement. To calculate the relevant annual compensation, only the fixed compensation components are applied. If the Company has terminated the service agreement for good cause or would be entitled to do so, no severance payments will be made.
Continued compensation in cases of sickness
All Management Board members have received individual contractual commitments to obtain continued compensation in cases of sickness for a maximum of twelve months; after six months of sick leave, insurance benefits may be offset against such payments. If a Management Board member dies, the surviving dependents will be paid three more monthly installments after the month of death, not to exceed, however, the amount due for the period until the scheduled expiration of the relevant service agreement.
Further information
Compensation of the U.S. members of the Management Board Ms. Helen Giza, Mr. Craig Cordola, Ed.D., and Mr. Franklin W. Maddux, M.D., was paid or taxed partly in the U.S. (in U.S. dollars) and partly in Germany (in euro). With respect to the amount paid in Germany, it was agreed with the aforementioned Management Board members that due to varying tax rates in both countries, the increased or lower tax burden to such members of the Management Board arising from German tax rates in comparison to U.S. tax rates will be balanced or will be paid back by them (net compensation). Pursuant to a modified net compensation agreement, these Management Board members will be treated as if they were taxed in the U.S. only. Since the actual tax burden can be calculated only in connection with the preparation of the Management Board members’ tax returns, subsequent adjustments may have to be made, which will then be retroactively covered in future Compensation Reports.
143
To the extent permitted by law, the Company undertook to indemnify the Management Board members from claims asserted against them arising out of their work for the Company and its affiliates, to the extent such claims exceed their liability under German law. To secure such obligations, a Directors & Officers liability insurance is in place having a deductible that corresponds to the specifications under German stock corporation law.
In accordance with applicable legal requirements, no loans or advance payments on future compensation components were awarded to members of the Management Board in the Fiscal Year.
Former Management Board members’ compensation
The compensation awarded or due to former members of the Management Board in the Fiscal Year is shown individually in the following table, unless the respective member of the Management Board left before the end of 2014. Members of the Management Board who left before the end of 2014 received pension payments totaling €583 THOUS in the Fiscal Year. Otherwise, no compensation was awarded or due to former members of the Management Board in the Fiscal Year.
|
Compensation of the former members of the Management Board |
|
||||||||||||
|
in € THOUS |
|
||||||||||||
|
|
|
Michael Brosnan (1) |
|
Roberto Fusté |
|
Dr. Carla Kriwet |
|
||||||
|
|
|
Member of the |
|
Member of the |
|
Member of the |
|
||||||
|
|
|
Management Board until |
|
Management Board until |
|
Management Board until |
|
||||||
|
|
|
October 31, 2019 |
|
March 31, 2016 |
|
December 5, 2022 |
|
||||||
|
|
|
Absolute |
|
Ratio in % |
|
Absolute |
|
Ratio in % |
|
Absolute |
|
Ratio in % |
|
|
Pension payments |
|
374 |
|
|
|
293 |
|
|
|
— |
|
|
|
|
Fringe benefits |
|
— |
|
|
|
— |
|
|
|
297 |
(2) |
|
|
|
Total non-performance-based compensation |
|
374 |
|
100 |
|
293 |
|
100 |
|
297 |
|
100 |
|
|
Allocation 2021 (MB LTIP 2020) |
|
— |
|
|
|
— |
|
|
|
— |
|
|
|
|
Total variable compensation |
|
— |
|
— |
|
— |
|
— |
|
— |
|
— |
|
|
Total compensation according to sec. 162 para. 1 sent. 2 no. 1 AktG |
|
374 |
|
|
|
293 |
|
|
|
297 |
|
|
|
|
|
|
Ronald Kuerbitz (1) |
|
Rice Powell (1) |
|
Dr. Olaf Schermeier |
|
||||||
|
|
|
Member of the |
|
Member of the |
|
Member of the |
|
||||||
|
|
|
Management Board until |
|
Management Board until |
|
Management Board until |
|
||||||
|
|
|
February 17, 2017 |
|
December 31, 2022 |
|
December 31, 2021 |
|
||||||
|
|
|
Absolute |
|
Ratio in % |
|
Absolute |
|
Ratio in % |
|
Absolute |
|
Ratio in % |
|
|
Pension payments |
|
11 |
|
|
|
684 |
|
|
|
— |
|
|
|
|
Fringe benefits |
|
— |
|
|
|
10 |
|
|
|
— |
|
|
|
|
Total non-performance-based compensation |
|
11 |
|
100 |
|
694 |
|
75 |
|
— |
|
— |
|
|
Allocation 2021 (MB LTIP 2020) |
|
— |
|
|
|
236 |
|
|
|
105 |
|
|
|
|
Total variable compensation |
|
— |
|
— |
|
236 |
|
25 |
|
105 |
|
100 |
|
|
Total compensation according to sec. 162 para. 1 sent. 2 no. 1 AktG |
|
11 |
|
|
|
930 |
|
|
|
105 |
|
|
|
|
|
|
William Valle (1) |
|
Kent Wanzek (1) |
|
Harry de Wit |
|
||||||
|
|
|
Member of the |
|
Member of the |
|
Member of the |
|
||||||
|
|
|
Management Board until |
|
Management Board until |
|
Management Board until |
|
||||||
|
|
|
December 31, 2023 |
|
December 31, 2021 |
|
December 31, 2021 |
|
||||||
|
|
|
Absolute |
|
Ratio in % |
|
Absolute |
|
Ratio in % |
|
Absolute |
|
Ratio in % |
|
|
Pension payments |
|
— |
|
|
|
273 |
|
|
|
— |
|
|
|
|
Fringe benefits |
|
— |
|
|
|
— |
|
|
|
— |
|
|
|
|
Total non-performance-based compensation |
|
— |
|
— |
|
273 |
|
71 |
|
— |
|
— |
|
|
Allocation 2021 (MB LTIP 2020) |
|
182 |
|
|
|
109 |
|
|
|
96 |
|
|
|
|
Total variable compensation |
|
182 |
|
100 |
|
109 |
|
29 |
|
96 |
|
100 |
|
|
Total compensation according to sec. 162 para. 1 sent. 2 no. 1 AktG |
|
182 |
|
|
|
382 |
|
|
|
96 |
|
|
|
| (1) | Note for the amounts set out that the compensation benefits for Messrs. Michael Brosnan, Ronald Kuerbitz, Rice Powell, William Valle and Kent Wanzek are denominated in U.S. dollars. In principle, the translation of U.S. dollar amounts was done at the average exchange rate for the applicable calendar year. For the Long-Term Incentive the translation of U.S. dollar amounts was done at the closing rate of the applicable vesting date. |
| (2) | As already reported in the 2022 Compensation Report, an entitlement to payments of up to €1,300 THOUS for forfeited compensation benefits from a previous service relationship was agreed with Dr. Kriwet on conclusion of her service agreement, which could have become due in March 2024 and March 2025. With the payment of €285 set out herein all entitlements under this agreement have been settled. The fringe benefits reported here also include an amount of €12 THOUS attributable to the value of the use of a company car to which Dr. Kriwet was entitled as agreed, as already reported in the 2022 Compensation Report. |
144
For an explanation as to how the compensation components correspond to the relevant compensation system, as to how compensation promotes the long-term development of the Company, as to how the performance criteria were applied and as to how the compensation “awarded” in the Fiscal Year is defined, see the respective aforementioned statements regarding the compensation for the Management Board members in office in the Fiscal Year.
Remuneration of the members of the Supervisory Board
The Supervisory Board advises and monitors the Management Board and is involved in the strategy and planning and in all matters of fundamental importance to the company. In view of these tasks, which carry a high degree of responsibility, the members of the Supervisory Board are intended to receive appropriate remuneration, which also takes sufficient account of the time required to hold the Supervisory Board office. In addition, Supervisory Board remuneration that is appropriate also with respect to the market environment ensures that the Company will continue to have qualified candidates for the Supervisory Board in the future. Appropriate remuneration of the Supervisory Board members thus contributes to the promotion of the business strategy and the long-term development of the Company.
The remuneration for the members of the Supervisory Board is granted on the basis of the Company’s Articles of Association. According to Article 14 of the Articles of Association, the members of the Supervisory Board receive fixed remuneration, fringe benefits (comprising the reimbursement of expenses and insurance coverage) and, if they serve on committees of the Supervisory Board, generally remuneration for these committee activities.
The fixed remuneration for service on the Supervisory Board or committees of the Supervisory Board is payable in four equal installments at the end of a calendar quarter. The members of the Supervisory Board do not receive variable remuneration; the remuneration awarded and due to them exclusively comprises fixed remuneration components.
If a fiscal year is not a complete calendar year, the remuneration relating to a full fiscal year is paid on a pro rata temporis basis. This generally applies accordingly if members of the Supervisory Board hold their office in the Supervisory Board or in a committee of the Supervisory Board or hold the office as chairperson or deputy chairperson only during a part of a full fiscal year.
The members of the Supervisory Board are reimbursed for the expenses incurred in the exercise of their office, including any statutory value-added tax owed by them. Furthermore, a Directors & Officers liability insurance in favor of the supervisory board members is in place, having a deductible corresponding to the specifications applying to management board members under German stock corporation law.
Changes to the remuneration in the Fiscal Year
The Company’s 2024 AGM resolved with a majority of around 99.49% of the votes cast to amend the corresponding provisions of the Articles of Association with effect from July 1, 2024. The remuneration of the members of the Supervisory Board was increased moderately overall in order to appropriately take into account the further increased demands regarding the responsibilities of the Supervisory Board and certain Supervisory Board committees as well as the corresponding increase in time expenditure, and to ensure that the Company remains competitive in the competition for highly qualified Supervisory Board candidates. The currency of the remuneration was changed from U.S. dollars to euro. The resolution of the Company’s 2024 AGM on the Supervisory Board members’ remuneration can be found on the Company’s website at www.freseniusmedicalcare.com/en/about-us/supervisory-board/remuneration.
The changes to the remuneration for serving on the Supervisory Board and its committees effective July 1, 2024 are as follows:
The fixed remuneration for each Supervisory Board member of previously $160 THOUS per year was changed to €170 THOUS per year. The additional remuneration for the chairperson and the deputy chairperson of the Supervisory Board was adjusted accordingly from $160 THOUS and $80 THOUS per year to €170 THOUS and €85 THOUS per year, respectively.
The members of the Audit Committee and the Presiding Committee instead of $40 THOUS per year receive €55 THOUS per year for their work in each of these committees. For serving as a member of the Compensation Committee and the Nomination Committee as well as any other committee only the currency of the remuneration was changed from U.S. dollars to euro; in this respect, instead of $40 THOUS per year, €40 THOUS per year are to be paid.
145
The additional remuneration for the chairperson of the aforementioned Supervisory Board committees was adjusted accordingly from $40 THOUS per year to €55 THOUS per year for the respective chairperson of the Audit Committee or the Presiding Committee and to €40 THOUS per year for the respective chairperson of the Compensation Committee or the Nomination Committee.
The additional remuneration for the deputy chairperson of committees of the Supervisory Board of previously $20 THOUS was canceled.
No additional remuneration is paid for serving as a member of the Mediation Committee.
Remuneration awarded and due in the Fiscal Year
The remuneration awarded and due in the Fiscal Year to the members of the Supervisory Board of the Company is shown in the following table. No remuneration was awarded or due to former Supervisory Board members in the Fiscal Year.
|
Remuneration of the members of the Supervisory Board in office in the Fiscal Year (1) |
|
|||||||||||
|
in € THOUS |
|
|||||||||||
|
|
|
|
|
|
|
|
|
|
|
|
||
|
|
|
Remuneration for |
|
|
|
|
|
|
|
|
||
|
|
|
supervisory board |
|
Remuneration for |
|
|
|
|
||||
|
|
|
activities |
|
committee services |
|
Total remuneration |
||||||
|
|
|
2024 |
|
2023 (2) |
|
2024 |
|
2023 (2) |
|
2024 |
|
2023 (2) |
|
|
|
|
|
|
|
|
|
|
|
|
|
|
|
Michael Sen (3) |
|
318 |
|
296 |
|
191 |
|
148 |
|
509 |
|
444 |
|
Stefanie Balling (4) |
|
215 |
|
— |
|
105 |
|
— |
|
320 |
|
— |
|
Ralf Erkens (5) |
|
150 |
|
— |
|
39 |
|
— |
|
189 |
|
— |
|
Beate Haßdenteufel (6) |
|
150 |
|
— |
|
11 |
|
— |
|
161 |
|
— |
|
Sara Hennicken (7) |
|
174 |
|
155 |
|
38 |
|
3 |
|
212 |
|
158 |
|
Regina Karsch (8) |
|
150 |
|
— |
|
31 |
|
— |
|
181 |
|
— |
|
Shervin J. Korangy (9) |
|
159 |
|
12 |
|
86 |
|
8 |
|
245 |
|
20 |
|
Dr. Marcus Kuhnert (10) |
|
159 |
|
12 |
|
138 |
|
9 |
|
297 |
|
21 |
|
Frank Michael Prescher (11) |
|
150 |
|
— |
|
39 |
|
— |
|
189 |
|
— |
|
Gregory Sorensen, M.D. (12) |
|
159 |
|
148 |
|
54 |
|
3 |
|
213 |
|
151 |
|
Dr. Manuela Stauss-Grabo (13) |
|
150 |
|
— |
|
37 |
|
— |
|
187 |
|
— |
|
Pascale Witz (14) |
|
172 |
|
148 |
|
127 |
|
82 |
|
299 |
|
230 |
|
Total |
|
2,106 |
|
771 |
|
896 |
|
253 |
|
3,002 |
|
1,024 |
| (1) | Shown without withholding tax. The currency of the remuneration was changed from U.S. dollars to euro effective July 1, 2024. The translation of U.S. dollar amounts was made for the period from January 1, 2024 to June 30, 2024 using the average exchange rate for the first half of 2024 and for the previous year using the average exchange rate for the previous year. |
| (2) | Mr. Michael Sen and Ms. Sara Hennicken each were exclusively, and Mr. Gregory Sorensen, M.D. and Ms. Pascale Witz each were also, members of the supervisory board of the Company’s General Partner, Fresenius Medical Care Management AG, which was involved in the corporate governance of the Company until the change in the Company’s legal form took effect on November 30, 2023. In continuation of the Company’s previous reporting practice, the amounts shown in this table for 2023 also include the remuneration they received for their work on the supervisory board of Fresenius Medical Care Management AG. |
| (3) | Until November 30, 2023, member and Chairman of the supervisory board of Fresenius Medical Care Management AG in its function as the General Partner. Since then, member and Chairman of the Supervisory Board of the Company as well as of the Presiding Committee and the Nomination Committee. |
| (4) | Since January 26, 2024, member of the Supervisory Board of the Company. Since March 14, 2024, Deputy Chairwoman of the Supervisory Board as well as member and Deputy Chairwoman of the Audit Committee and the Presiding Committee. |
| (5) | Since January 26, 2024, member of the Supervisory Board of the Company. Since March 14, 2024, member of the Presiding Committee. |
| (6) | Since January 26, 2024, member of the Supervisory Board of the Company. |
| (7) | Until November 30, 2023, member of the supervisory board of Fresenius Medical Care Management AG in its function as the General Partner. Since then, member of the Supervisory Board of the Company and of the Nomination Committee. From November 30, 2023 to March 14, 2024 Deputy Chairwoman of the Supervisory Board of the Company. |
| (8) | Since January 26, 2024, member of the Supervisory Board of the Company. Since March 14, 2024, member of the Compensation Committee. |
| (9) | Since November 30, 2023, member of the Supervisory Board of the Company, member of the Compensation Committee as well as member and Deputy Chairman of the Nomination Committee. |
| (10) | Since November 30, 2023, member of the Supervisory Board of the Company, member and Chairman of the Audit Committee as well as member of the Presiding Committee. |
| (11) | Since January 26, 2024, member of the Supervisory Board of the Company. Since March 14, 2024, member of the Audit Committee. |
| (12) | Until November 30, 2023, also member of the supervisory board of Fresenius Medical Care Management AG in its function as the General Partner. Since then, member of the Audit Committee. |
| (13) | Since January 26, 2024, member of the Supervisory Board of the Company. Since March 14, 2024, member and Deputy Chairwoman of the Compensation Committee. |
| (14) | Until November 30, 2023, also member of the supervisory board of Fresenius Medical Care Management AG in its function as the General Partner. Since then, also member and Chairwoman of the Compensation Committee as well as member of the Nomination Committee. Until March 14, 2024, also member and Deputy Chairwoman of the Audit Committee; until November 30, 2023, Chairwoman of the Audit Committee. |
146
Comparative presentation of the development of the compensation
The development of the compensation awarded and due to the current and former members of the Management Board and the Supervisory Board, the development of the Company’s earnings and the development of the average compensation of employees on a full-time equivalent (FTE) basis are shown comparatively in the following table. The disclosures are also made for the former members of the management board of the former General Partner of the Company (i.e., Fresenius Medical Care Management AG). The disclosures are only made for persons to whom compensation was granted or due in the Fiscal Year.
Metrics for the performance of the Company
For the purposes of a comparative presentation of the Company’s performance, in addition to the Company’s annual results for the year under German commercial law, which shows the Company’s earnings development pursuant to German commercial law, revenue and net income as well as operating income and return on invested capital (ROIC) are also used, each of which serve as primary key performance indicators or secondary financial performance indicators of the group and as performance targets for the Management Board members’ variable compensation.
Information on the compensation awarded and due
Since the Compensation Report for 2021, the compensation has been reported in accordance with the provisions of the new Section 162 AktG introduced at the time. In order to obtain a reasonable comparison between the individual years, the information contained in the following table on the compensation of the members of the Management Board and the Supervisory Board in 2020 is also reported in accordance with the understanding of the term “compensation awarded and due” applied in the compensation tables in the section “Compensation tables for the Management Board members in office in the Fiscal Year.” The amounts disclosed for 2020 therefore differ in some cases from the corresponding disclosures in the Compensation Report for 2020.
Financial figures
The figures set out in the compensation comparison are disclosed at current currency and in accordance with the accounting standards applied by the Company in the relevant fiscal year, while the growth rates relating to the Management Board members’ Long-Term Incentive are determined at Constant Currency and the figures relating to the Management Board members’ Short-Term Incentive are translated at the exchange rates that were applied for the determination of the target values.
As disclosed in the Compensation Reports for the relevant years, the figures used for determining the level of target achievement and for determining the Management Board members’ compensation were and are, in some cases, adjusted for certain effects to ensure comparability of the figures with respect to the operational performance.
Consequently, there is only a limited degree of comparability between the figures relating to each year shown in the following table and the corresponding amounts of the Management Board members’ compensation and, in particular, between these figures in terms of their respective annual change.
Compensation of the Management Board
In accordance with the applicable plan terms, an award in the meaning of this Compensation Report from the Long-Term Incentive to the members of the Management Board is generally made only after expiry of the multi-year vesting period. As a result, compensation awarded or due to Management Board members is usually lower in the first years of their Management Board activity than in subsequent years.
The vesting periods for the various Long-Term Incentives included in the following table are not identical. This means that more than one tranche of the Long-Term Incentives could be earned in certain years and is therefore deemed to have been awarded. This applies, for example, to the 2019 allocation under the Management Board Long Term Incentive Plan 2019 (MB LTIP 2019) and the 2020 allocation under the MB LTIP 2020, which each vested in 2023.
The pension allowance introduced with effect from January 1, 2024 for individual members of the Management Board is compensation within the meaning of Section 162 paragraph 1 sentence 2 no. 1 AktG and is therefore – unlike the pension expense for pension commitments incurred for individual current or former members of the Management Board – included in the amounts shown in the following table.
147
Compensation of the Supervisory Board
The variable compensation component previously in place for the Supervisory Board was eliminated with effect from January 1, 2021. To compensate for this, the fixed compensation of the members of the Supervisory Board was increased effective from January 1, 2021. Furthermore, the compensation for the members of the Supervisory Board and its committees was changed with effect as of July 1, 2024 and increased moderately overall in order to appropriately take into account the further increased demands regarding the responsibilities of the Supervisory Board and certain Supervisory Board committees as well as the corresponding increase in time expenditure. See “Changes to the remuneration in the Fiscal Year” in the section “Remuneration of the Members of the Supervisory Board.”
Compensation of the employees
Employee compensation is based on the average wages and salaries of all employees on an FTE basis at the Company and its group companies worldwide in the respective year in order to enable reporting that is consistent with the corresponding figures from reports for previous years as well as the most comprehensive comparison possible over the entire comparative period.
148
Table on the development of the compensation
The comparative presentation of the development of the compensation over the past five years is shown in the following table:
|
Comparative presentation of the development of the compensation |
|
||||||||||||||||||
|
|
|
2024 |
|
Change |
|
2023 |
|
Change |
|
2022 |
|
Change |
|
2021 |
|
Change |
|
2020 |
|
|
|
|
in € THOUS |
|
in % |
|
in € THOUS |
|
in % |
|
in € THOUS |
|
in % |
|
in € THOUS |
|
in % |
|
in € THOUS |
|
|
|
|
|
|
|
|
|
|
|
|
|
|
|
|
|
|
|
|
|
|
|
Revenue |
|
19,335,909 |
|
(1) |
|
19,453,617 |
|
0 |
|
19,398,017 |
|
10 |
|
17,618,685 |
|
(1) |
|
17,859,063 |
|
|
Operating income |
|
1,392,395 |
|
2 |
|
1,369,438 |
|
(9) |
|
1,511,755 |
|
(18) |
|
1,852,290 |
|
(20) |
|
2,304,409 |
|
|
Net income |
|
537,913 |
|
8 |
|
498,997 |
|
(26) |
|
673,405 |
|
(31) |
|
969,308 |
|
(17) |
|
1,164,377 |
|
|
ROIC |
|
3.5 |
% |
25 |
|
2.8 |
% |
(15) |
|
3.3 |
% |
(33) |
|
4.9 |
% |
(16) |
|
5.8 |
% |
|
Annual result according to the statutory financial statements of Fresenius Medical Care AG |
|
966,458 |
|
21 |
|
798,197 |
|
n.a. |
|
(1,141,219) |
|
n.a. |
|
1,737,017 |
|
n.a. |
|
(1,357,242) |
|
|
Average employees’ compensation |
|
60.8 |
|
17 |
|
51.9 |
|
(1) |
|
52.3 |
|
15 |
|
45.4 |
|
(2) |
|
46.2 |
|
|
CEO pay ratio (CEO in office at year-end to average employees) |
|
61:1 |
|
n.a. |
|
83:1 |
|
n.a. |
|
38:1 |
|
n.a. |
|
119:1 |
|
n.a. |
|
165:1 |
|
|
|
|
|
|
|
|
|
|
|
|
|
|
|
|
|
|
|
|
|
|
|
Members of the Management Board in office in the Fiscal Year |
|
||||||||||||||||||
|
Helen Giza |
|
3,708 |
|
(14) |
|
4,304 |
|
119 |
|
1,969 |
|
11 |
|
1,781 |
|
(12) |
|
2,014 |
|
|
Craig Cordola, Ed.D. |
|
3,718 |
|
n.a. |
|
— |
|
n.a. |
|
— |
|
n.a. |
|
— |
|
n.a. |
|
— |
|
|
Martin Fischer |
|
2,524 |
|
185 |
|
887 |
|
n.a. |
|
— |
|
n.a. |
|
— |
|
n.a. |
|
— |
|
|
Dr. Jörg Häring |
|
1,378 |
|
n.a. |
|
— |
|
n.a. |
|
— |
|
n.a. |
|
— |
|
n.a. |
|
— |
|
|
Franklin W. Maddux, M.D. |
|
2,359 |
|
(13) |
|
2,708 |
|
61 |
|
1,683 |
|
(15) |
|
1,986 |
|
(33) |
|
2,949 |
|
|
Dr. Katarzyna Mazur-Hofsäß |
|
2,666 |
|
(17) |
|
3,210 |
|
69 |
|
1,903 |
|
2 |
|
1,872 |
|
(6) |
|
1,993 |
|
|
Former members of the Management Board |
|
||||||||||||||||||
|
Michael Brosnan |
|
374 |
|
(38) |
|
601 |
|
57 |
|
382 |
|
(41) |
|
651 |
|
(83) |
|
3,813 |
|
|
Roberto Fusté |
|
293 |
|
— |
|
293 |
|
— |
|
293 |
|
7 |
|
274 |
|
(87) |
|
2,157 |
|
|
Dr. Carla Kriwet |
|
297 |
|
n.a. |
|
— |
|
(100) |
|
3,173 |
|
n.a. |
|
— |
|
n.a. |
|
— |
|
|
Ronald Kuerbitz |
|
11 |
|
n.a. |
|
— |
|
n.a. |
|
— |
|
n.a. |
|
— |
|
n.a. |
|
— |
|
|
Rice Powell |
|
930 |
|
(64) |
|
2,574 |
|
(45) |
|
4,658 |
|
(14) |
|
5,424 |
|
(29) |
|
7,642 |
|
|
Dr. Olaf Schermeier |
|
105 |
|
(84) |
|
670 |
|
4 |
|
644 |
|
(75) |
|
2,578 |
|
(15) |
|
3,042 |
|
|
William Valle |
|
182 |
|
(97) |
|
6,387 |
|
85 |
|
3,457 |
|
(7) |
|
3,709 |
|
(16) |
|
4,402 |
|
|
Kent Wanzek |
|
382 |
|
(66) |
|
1,137 |
|
54 |
|
740 |
|
(71) |
|
2,554 |
|
(30) |
|
3,654 |
|
|
Harry de Wit |
|
96 |
|
(86) |
|
706 |
|
11 |
|
637 |
|
(77) |
|
2,814 |
|
(13) |
|
3,243 |
|
|
Members of the supervisory board in office in the Fiscal Year |
|
||||||||||||||||||
|
Michael Sen |
|
509 |
|
15 |
|
444 |
|
289 |
|
114 |
|
n.a. |
|
— |
|
n.a. |
|
— |
|
|
Stefanie Balling |
|
320 |
|
n.a. |
|
— |
|
n.a. |
|
— |
|
n.a. |
|
— |
|
n.a. |
|
— |
|
|
Ralf Erkens |
|
189 |
|
n.a. |
|
— |
|
n.a. |
|
— |
|
n.a. |
|
— |
|
n.a. |
|
— |
|
|
Beate Haßdenteufel |
|
161 |
|
n.a. |
|
— |
|
n.a. |
|
— |
|
n.a. |
|
— |
|
n.a. |
|
— |
|
|
Sara Hennicken |
|
212 |
|
34 |
|
158 |
|
216 |
|
50 |
|
n.a. |
|
— |
|
n.a. |
|
— |
|
|
Regina Karsch |
|
181 |
|
n.a. |
|
— |
|
n.a. |
|
— |
|
n.a. |
|
— |
|
n.a. |
|
— |
|
|
Shervin J. Korangy |
|
245 |
|
1,125 |
|
20 |
|
n.a. |
|
— |
|
n.a. |
|
— |
|
n.a. |
|
— |
|
|
Dr. Marcus Kuhnert |
|
297 |
|
1,314 |
|
21 |
|
n.a. |
|
— |
|
n.a. |
|
— |
|
n.a. |
|
— |
|
|
Frank Michael Prescher |
|
189 |
|
n.a. |
|
— |
|
n.a. |
|
— |
|
n.a. |
|
— |
|
n.a. |
|
— |
|
|
Gregory Sorensen, M.D. |
|
213 |
|
41 |
|
151 |
|
(1) |
|
152 |
|
77 |
|
86 |
|
n.a. |
|
— |
|
|
Dr. Manuela Stauss-Grabo |
|
187 |
|
n.a. |
|
— |
|
n.a. |
|
— |
|
n.a. |
|
— |
|
n.a. |
|
— |
|
|
Pascale Witz |
|
299 |
|
30 |
|
230 |
|
10 |
|
209 |
|
12 |
|
187 |
|
24 |
|
151 |
|
Outlook for the compensation for 2025
The Supervisory Board has again set the two equally weighted sub-targets “patient satisfaction” and “employee satisfaction” as the sustainability target for the STI for 2025 and the reduction in market-based CO 2 e emissions as the sustainability target for the LTI allocation for 2025. The other performance targets for the STI for the year 2025 and for the allocation of the LTI for 2025 also correspond to those of the Fiscal Year. Information on the target values and the respective performance target achievement will be disclosed after the end of the performance period in the Compensation Report for the relevant fiscal year.
149
C. Board practices
For information relating to the terms of office of the Management Board and of the Supervisory Board, and the periods in which the members of those bodies have served in office, see Item 6.A, “Directors, senior management and employees — Directors and senior management,” above.
The Audit Committee of the Supervisory Board currently consists of Dr. Marcus Kuhnert (Chair), Ms. Stefanie Balling (member and Deputy Chair since March 14, 2024), Mr. Gregory Sorensen, M.D., and Mr. Frank Michael Prescher (since March 14, 2024). Ms. Pascale Witz served as a member and Deputy Chair of the Audit Committee until March 14, 2024. Dr. Kuhnert and Mr. Sorensen are independent directors for purposes of SEC Rule 10A-3 and NYSE Rule 303A.06, as was Ms. Witz for the time she served on the Audit Committee. For details on the exemption relied upon with respect to Ms. Balling and Mr. Prescher, who are employee representatives, see Item 16D, “Exemptions from the listing standards for audit committees.” The primary function of the Audit Committee is to assist FME AG’s Supervisory Board in fulfilling its oversight responsibilities, primarily through:
| ● | overseeing FME AG’s accounting and financial reporting processes, the performance of the internal audit function and the effectiveness of the internal control system; |
| ● | overseeing the auditing of FME AG’s financial statements; |
| ● | overseeing FME AG’s sustainability related objectives and the auditing or assurance of the Company’s sustainability reporting required by law; |
| ● | overseeing the independence and performance of FME AG’s outside auditors; |
| ● | overseeing the effectiveness of our risk management system; |
| ● | overseeing the effectiveness of our systems and processes utilized to comply with relevant legal and regulatory standards for global health care companies; |
| ● | overseeing our relationship with Fresenius SE and its affiliates as well as overseeing related party transactions generally; |
| ● | reporting by FME AG’s outside auditors directly to the Audit Committee; and |
| ● | performing such other functions and exercising such other responsibilities as are required to be performed or exercised by audit committees by applicable law or as may be delegated to the Audit Committee by the Supervisory Board. |
The Supervisory Board has formed a Presiding Committee consisting of Mr. Michael Sen (Chair) and Dr. Marcus Kuhnert as well as, since March 14, 2024, Ms. Stefanie Balling (Deputy Chair) and Mr. Ralf Erkens. The Presiding Committee is responsible in particular for administrative matters relating to the Supervisory Board and for various Management Board matters including recommendations to the Supervisory Board on the appointment or dismissal of Management Board members and on the allocation of responsibilities among the Management Board members. The Presiding Committee further reviews and assesses the Company’s corporate governance.
The Supervisory Board has formed a Compensation Committee consisting of Ms. Pascale Witz (Chair) and Mr. Shervin J. Korangy as well as, since March 14, 2024, Ms. Regina Karsch and Dr. Manuela Stauss-Grabo (Deputy Chair). The Compensation Committee is responsible for preparing the decisions of the Supervisory Board regarding the compensation of the members of the Management Board. This includes the preparation of the determination of the compensation system and of the short-term and long-term incentive plans for the Management Board as well as the definition of the targets for variable compensation components and the definition of target values as well as of the determination of the target achievement. The Compensation Committee also prepares the regular review by the Supervisory Board of the appropriateness of the compensation system and of the total compensation of the individual Management Board members. The Compensation Committee also reviews the annual compensation report.
150
The Nomination Committee of the Supervisory Board of the Company consists of Mr. Michael Sen (Chair), Mr. Shervin J. Korangy (Deputy Chair), Ms. Sara Hennicken and Ms. Pascale Witz. The Nomination Committee recommends suitable candidates to the Supervisory Board for its proposals to the General Meeting for the election of Supervisory Board members or, if required, for judicial appointment of shareholder representatives on the Supervisory Board. The Nomination Committee also, in certain cases, makes recommendations to the Supervisory Board on members of the shareholder representatives to be elected to the committees of the Supervisory Board.
Following the judicial appointment of employee representatives to the Supervisory Board, the Supervisory Board has formed a Mediation Committee ( Vermittlungsausschuss ) effective March 14, 2024 consisting of Mr. Michael Sen (Chair), Ms. Stefanie Balling (Deputy Chair), Ms. Beate Haßdenteufel and Mr. Gregory Sorensen, M.D. The Mediation Committee, in accordance with the German Co-Determination Act, convenes to resolve any disputes among the members of the Supervisory Board that may arise in connection with the appointment or dismissal of members of the Management Board.
We are exempt from the NYSE rule requiring companies listed on that exchange to maintain compensation committees and nominating committees consisting of independent directors. See Item 16G, “Corporate governance.”
|
D. |
Employees |
At December 31, 2024, we had 111,513 employees (total headcount) as compared to 119,845 at December 31, 2023, and 128,044 at December 31, 2022. For further information on the movement in employees, see Item 5, “Operating and financial review and prospects — III. Results of operations, financial position and net assets,” above. The following table shows the number of employees by our major category of activities for the last three fiscal years.
|
|
|
December 31, |
|
December 31, |
|
December 31, |
|
|
|
2024 |
|
2023 |
|
2022 |
|
Total Company |
|
111,513 |
|
119,845 |
|
128,044 |
|
|
|
|
|
|
|
|
|
U.S. |
|
60,516 |
|
60,868 |
|
63,052 |
|
Care Delivery |
|
55,437 |
|
55,047 |
|
56,665 |
|
Care Enablement |
|
5,024 |
|
5,805 |
|
6,371 |
|
Corporate |
|
55 |
|
16 |
|
16 |
|
|
|
|
|
|
|
|
|
Germany |
|
7,658 |
|
7,581 |
|
7,827 |
|
Care Delivery |
|
2,545 |
|
2,394 |
|
2,656 |
|
Care Enablement |
|
5,025 |
|
5,125 |
|
5,114 |
|
Corporate |
|
88 |
|
62 |
|
57 |
|
|
|
|
|
|
|
|
|
Rest of the world |
|
43,339 |
|
51,396 |
|
57,165 |
|
Care Delivery |
|
25,161 |
|
33,556 |
|
38,329 |
|
Care Enablement |
|
18,168 |
|
17,839 |
|
18,835 |
|
Corporate |
|
10 |
|
1 |
|
1 |
During 2024 and the prior two fiscal years, we have not suffered any protracted labor-related work disruptions. Collective bargaining agreements apply to different groups of employees within the Company, depending on local laws and practices.
We respect the principles of freedom of association and the right to collective bargaining, including the rights of our employees to freely choose whether or not to be represented by a particular trade union, and engage in collective bargaining in accordance with applicable law and practice globally. In cases where our employees are represented by unions or works councils, we manage these relationships responsibly, following local laws and practices.
During 2024 and 2023, we experienced an increase in union organizing activity in the state of California (U.S.) which we expect will continue in 2025.
151
|
E. |
Share ownership |
As of December 31, 2024, no member of our Supervisory Board or our Management Board beneficially owned 1% or more of our outstanding shares, according to the most recent information available. See Item 6.B, “Directors, senior management and employees — Compensation” for information regarding share-based compensation, including the grants of cash-settled performance shares and provisions of the compensation system providing for mandatory share retention to promote share ownership. Additionally, stock option and other share-based plans are discussed in detail in note 23 of the notes to our consolidated financial statements included in this report.
|
F. |
Disclosure of a registrant’s action to recover erroneously awarded compensation |
During 2024, we did not have an accounting restatement that required recovery of erroneously awarded incentive-based compensation pursuant to our incentive-based compensation recovery policy. As of December 31, 2024, there were no outstanding balances of erroneously awarded incentive-based compensation to be recovered from the application of the policy to a prior restatement. Our Incentive-based Compensation Recover Policy is included as Exhibit 97 to this Report.
Item 7. Major shareholders and related party transactions
|
A. |
Major shareholders |
Security ownership of certain beneficial owners of the Company
Our outstanding share capital consists of shares issued only in bearer form. Accordingly, unless we receive information regarding acquisitions of our shares through a filing with the SEC or through the German statutory requirements referred to below, or except as described below with respect to our shares held in American Depositary Receipt (ADR) form, we, despite a right to request depositaries to disclose corresponding information, face difficulties precisely determining who our shareholders are at any specified time or how many shares any particular shareholder owns.
Since we are a foreign private issuer under the rules of the SEC, our directors and officers are not required to report their ownership of our equity securities or their transactions in our equity securities pursuant to Section 16 of the Securities and Exchange Act of 1934. However, persons who become “beneficial owners” of more than 5% of our shares are required to report their beneficial ownership pursuant to Section 13(d) of the Securities and Exchange Act of 1934.
In addition, under Article 19(1) of the Regulation (EU) No. 596/2014 of the European Parliament and of the Council of April 16, 2014 on market abuse (Market Abuse Regulation or MAR), persons discharging managerial responsibilities within an issuer of shares, as well as persons closely associated with them, are obliged to notify the issuer and the competent authority, i.e. for the Company as issuer, the German Federal Financial Supervisory Authority ( Bundesanstalt für Finanzdienstleistungsaufsicht or BaFin), of every transaction conducted on their own account relating to the shares or debt instruments of the issuer or to derivatives or other financial instruments linked thereto no later than three business days after the date of the transaction. This notification obligation applies once the volume of all transactions of such person conducted within a calendar year exceeds a total amount of €20,000. Persons discharging managerial responsibilities include, inter alia, the members of management as well as supervisory boards.
In addition, holders of voting securities of a German company listed on the regulated market ( Regulierter Markt ) of a German stock exchange or a corresponding trading segment of a stock exchange within the EU are, under Sections 33, 34 of the German Securities Trading Act ( Wertpapierhandelsgesetz or WpHG), obligated to notify the company of held or attributed holding whenever such holding reaches, exceeds or falls below certain thresholds, which have been set at 3%, 5%, 10%, 15%, 20%, 25%, 30%, 50% and 75% of a company’s outstanding voting rights. Such notification obligations will also apply pursuant to Section 38 of the WpHG to the direct or indirect holder of instruments granting an unconditional right to acquire voting rights when due or providing discretion as to the acquisition of shares or instruments that have a similar economic effect as well as pursuant to Section 39 of the WpHG to the aggregate of held or attributed voting rights and instruments (in each case excluding the 3% threshold). For threshold notifications furnished to us by third parties, see note 20 of the notes to the consolidated financial statements included in this report.
152
We have been informed that as of February 13, 2025, Fresenius SE owned 94,380,382 shares, or 32.2% of our outstanding shares. Subject to any applicable statutory limitations and the provisions of our Articles of Association granting Fresenius SE the right to designate up to two members of our Supervisory Board, all of our outstanding shares have the same voting rights.
On January 7, 2025, Harris Associates Investment Trust, Boston, Massachusetts, U.S., disclosed pursuant to Section 33 of the WpHG that 3.00% of the voting rights of the Company were held as of January 3, 2025.
On October 28, 2024, Harris Associates L.P., Wilmington, Delaware, U.S., with respect to attributed voting rights, disclosed pursuant to Sections 33, 34 of the WpHG that 4.95% of the voting rights of the Company were held as of October 23, 2024.
On October 4, 2024, BlackRock, Inc., Wilmington, Delaware, U.S., with respect to attributed voting rights, disclosed pursuant to Sections 33, 34 of the WpHG that 4.34% of the voting rights of the Company and pursuant to Section 38 of the WpHG that instruments relating to 0.16% of the voting rights of the Company were held as of October 1, 2024.
On January 6, 2023, Dodge & Cox International Stock Fund, San Francisco, California, U.S., disclosed pursuant to Section 33 of the WpHG that 3.00% of the voting rights of the Company were held as of January 3, 2023.
On December 16, 2022, Dodge & Cox, San Francisco, California, U.S., with respect to attributed voting rights, disclosed pursuant to Sections 33, 34 of the WpHG that 5.03% of the voting rights of the Company were held as of December 13, 2022. According to an amended Schedule 13G filed with the SEC on February 13, 2024, Dodge & Cox, an investment adviser registered under the U.S. Investment Advisers Act of 1940, is the beneficial owner of 7.4% of the Company’s shares. The Schedule 13G states that Dodge & Cox has sole voting power and sole dispositive power over such shares, and that clients of Dodge & Cox, including investment companies registered under the U.S. Investment Company Act of 1940 and other managed accounts, have the right to receive or power to direct the receipt of dividends from, and the proceeds from the sale of, such shares.
On October 28, 2022, Richard Pzena, with respect to attributed voting rights, disclosed pursuant to Sections 33, 34 of the WpHG that 5.20% of the voting rights of the Company were held as of October 24, 2022.
On July 14, 2022, Artisan Partners Asset Management Inc., Wilmington, Delaware, U.S., with respect to attributed voting rights, disclosed pursuant to Sections 33, 34 of the WpHG that 2.99% of the voting rights of the Company were held as of July 12, 2022.
Bank of New York Mellon, our ADR depositary, informed us, that as of December 31, 2024, 38,873,048 ADRs were held of record by 2,121 U.S. holders. Two ADRs represent one share. Exhibit 2.1, “Description of Securities,” provides additional information regarding our ADRs and American Depositary Shares (ADSs).
Security ownership of certain beneficial owners of Fresenius SE
Fresenius SE’s share capital consists solely of ordinary shares, issued only in bearer form. Accordingly, Fresenius SE has, despite a right to request depositaries to disclose corresponding information, difficulties precisely determining who its shareholders are at any specified time or how many shares any particular shareholder owns. However, under the WpHG, holders of voting securities of a German company listed on the regulated market (Regulierter Markt) of a German stock exchange or a corresponding trading segment of a stock exchange within the EU are obligated to notify a company of certain levels of holdings, as described above.
The Else Kröner-Fresenius-Stiftung is the sole shareholder of Fresenius Management SE, the general partner of Fresenius SE, and has sole power to elect the supervisory board of Fresenius Management SE. In addition, based on the most recent information available, the Else Kröner-Fresenius-Stiftung owns approximately 27% of the Fresenius SE ordinary shares. See Item 7.B, “Related party transactions – Other interests,” below.
153
|
B. |
Related party transactions |
In connection with the formation of FME AG, and the combination of the dialysis businesses of Fresenius SE and W.R. Grace & Co. in 1996, Fresenius SE and its affiliates and FME AG and its affiliates entered into several agreements for the purpose of giving effect to the Merger and defining our ongoing relationship. Fresenius SE and W.R. Grace & Co. negotiated these agreements. The information below summarizes the material aspects of certain agreements, arrangements and transactions between FME AG and Fresenius SE, their affiliates and with certain of our equity method investees. For further information, see note 6 of the notes to the consolidated financial statements included in this report. The following descriptions are not complete and are qualified in their entirety by reference to those agreements, which have been filed with the SEC and the NYSE. We believe that the leases, the supply agreements and the service agreements summarized below are no less favorable to us and no more favorable to Fresenius SE than would have been obtained in arm’s-length bargaining between independent parties. The trademark and other intellectual property agreements summarized below were negotiated by Fresenius SE and W.R. Grace & Co., and, taken independently, are not necessarily indicative of market terms.
In the discussion below regarding our contractual and other relationships with Fresenius SE:
| ● | the term “we (or us) and our affiliates” refers only to FME AG and its subsidiaries; and |
| ● | the term “Fresenius SE and its affiliates” refers only to Fresenius SE and affiliates of Fresenius SE other than FME AG and its subsidiaries. |
Real property leases
For information with respect to our principal properties, see “Item 4.D. Property, plant and equipment.” For discussion of related party leases, see note 6 of the notes to the consolidated financial statements included in this report.
Trademarks
Fresenius SE continues to own the name “Fresenius” and several marks containing “Fresenius” (hereinafter referred to as Fresenius Marks). Fresenius SE and Fresenius Medical Care Deutschland GmbH (D-GmbH) entered into agreements containing the following provisions (Trademark License Agreement). Fresenius SE has granted to D-GmbH, for our benefit and that of our affiliates, an exclusive, worldwide, royalty-free, perpetual license to use “Fresenius Medical Care” in our names, and to use the Fresenius marks, including some combination marks containing the Fresenius name that were used by the worldwide dialysis business of Fresenius SE, and the “Fresenius Marks” as a trademark in all aspects of the renal business. D-GmbH, for our benefit and that of our affiliates, has also been granted a worldwide, royalty-free, perpetual license to use the “Fresenius Marks” in the former National Medical Care non-renal business if it is used as part of a trademark containing the words “Fresenius Medical Care” together with one or more descriptive words, such as “Fresenius Medical Care Vascular Care” or “Fresenius Medical Care Physician Services.”
We and our affiliates have the right to use “Fresenius Marks” in other medical businesses only with the consent of Fresenius SE. Fresenius SE may not unreasonably withhold its consent. Fresenius SE will not use or license third parties to use the Fresenius Marks in the renal business worldwide and will not use the Fresenius Marks alone or in combination with any other words in the US and Canada, except in combination with one or more additional words such as “Pharma Home Care” as a service mark in connection with its home care business.
The Trademark License Agreement remains in full force after our Conversion and related deconsolidation from Fresenius SE with some amendments/clarification concerning, inter alia , standards regarding the use of the “Fresenius Marks” (details to be defined in Branding Guidelines jointly developed by Fresenius SE and us), limits on the current and future stand-alone use of the “Fresenius” name by us, the introduction of customary termination rights for good cause and the introduction of reporting obligations regarding any harmful use of the Licensed Marks and/or the “Fresenius” name.
Services agreements and products
For information on our services agreements and products, see note 6 of the notes to the consolidated financial statements included in this report.
154
Financing
For information on our related party financing arrangements, see note 6 and note 16 of the notes to the consolidated financial statements included in this report.
Key management personnel
For information on transactions involving our key management personnel, see Item 6.B, “Directors, senior management and employees – Compensation” and notes 6, 23 and 31 of the notes to the consolidated financial statements included in this report.
Settlements with former directors
For information regarding settlements with certain former members of the General Partner’s Management Board in connection with their respective resignations from the Management Board, see “Item 6.B, “Directors, senior management and employees — Compensation — Management Board members’ compensation — Other benefits and commitments — Agreements with a member of the Management Board who resigned from office at the end of the Fiscal Year.”
General Partner reimbursement
For information on reimbursement obligations to our former General Partner, see note 6 of the notes to the consolidated financial statements included in this report.
Item 8. Financial information
The information called for by parts 8.A.1 through 8.A.6 of this item is in the section beginning on Page F-1.
8.A.7. Legal and regulatory matters
The information in note 25 of the notes to the consolidated financial statements of this report is incorporated by this reference in response to this item.
8.A.8. Dividend policy
We generally pay annual dividends on our shares in amounts that we determine on the basis of FME AG’s prior year’s balance sheet profit ( Bilanzgewinn ) as shown in the statutory unconsolidated financial statements that we prepare under German law on the basis of the accounting principles of the German Commercial Code ( Handelsgesetzbuch or HGB). The payment of dividends is subject to approval by a resolution of the general meeting of shareholders. We adhere to our dividend policy of developing dividends in line with the development of net income excluding special items. For a description of special items, see Item 5, “Operating and financial review and prospects — I. Performance management system,” above.
Our Management Board and Supervisory Board propose dividends to the AGM and the AGM approves dividends. The dividends are paid in respect of the fiscal year preceding the respective AGM. Since all of our shares are in bearer form, we remit dividends to the depositary bank ( Depotbank ) on behalf of the shareholders.
The table below provides information regarding the annual dividend per share that we paid on our shares. These payments were made in the years shown in the table. They relate to the results of operations in the year preceding the payment.
|
|
|
2024 |
|
2023 |
|
2022 |
|||
|
Per share amount |
|
€ |
1.19 |
|
€ |
1.12 |
|
€ |
1.35 |
For the proposed dividend for 2024 payable in 2025, see Item 5. IV. “Operation and financial review and prospects – Financial position – Net cash provided by (used in) financing activities.”
155
Except as described in the Description of Securities filed as Exhibit 2.1 to this report, holders of ADSs will be entitled to receive dividends on the shares represented by the respective ADSs. We will pay any cash dividends payable to such holders to the depositary in euros and, subject to certain exceptions, the depositary will convert the dividends into U.S. dollars and, after deduction of its fees and any taxes, distribute the dividends to ADS holders. For additional information regarding the distribution of dividends to ADS holders, see part D. “American Depositary Shares,” in the “Description of Securities” filed as Exhibit 2.1 to this report. Fluctuations in the exchange rate between the U.S. dollar and the euro will affect the amount of dividends that ADS holders receive. Dividends paid to holders and beneficial holders of the ADSs will be subject to deduction of German withholding tax. You can find a discussion of German withholding tax below in “Item 10.E. Taxation.”
Item 9. The offer and listing
The information required by Items 9.A.3, 9.A.5 and 9.A.6 is incorporated herein by reference to the information under the heading “Information pertaining to Item 9. The offer and listing details” in Exhibit 2.1 to this report.
A.4. and C. Information regarding the trading markets for of our stock
Trading markets
Trading on the Frankfurt Stock Exchange
The principal trading market for our shares is the Frankfurt Stock Exchange ( FWB ® Frankfurter Wertpapierbörse ). The ordinary shares of Fresenius Medical Care AG were originally listed on the Frankfurt Stock Exchange effective October 2, 1996, and, following the effectiveness of the Conversion on November 30, 2023, continue to be listed and traded on the Frankfurt Stock Exchange under the symbol FME.
Our shares have been listed on the Regulated Market ( Regulierter Markt ) of the Frankfurt Stock Exchange and on the Prime Standard of the Regulated Market, which is a sub-segment of the Regulated Market with additional post-admission obligations. Admission to the Prime Standard requires the fulfillment of the following transparency criteria: publication of quarterly reports, in both German and English; preparation of financial statements in accordance with international accounting standards; publication of a company calendar; convening of at least one analyst conference per year; and publication of ad-hoc notifications (i.e., certain announcements of certain price-relevant material developments and events required to be made as soon as possible) in English. Companies aiming to be listed in this segment have to apply for admission. Listing in the Prime Standard is a prerequisite for inclusion of shares in the selection indices of the Frankfurt Stock Exchange. Since December 27, 2024, we are included in the DAX® 40, the index representing the performance of the 40 largest publicly traded companies listed on the Frankfurt Stock Exchange.
Deutsche Börse AG operates the Frankfurt Stock Exchange, which is the largest of the German stock exchanges by value of shares traded. Our shares are traded on Xetra, the electronic trading system of the Deutsche Börse. The trading hours for Xetra are between 9:00 a.m. and 5:30 p.m. CET. Only brokers and banks that have been admitted to Xetra by the Frankfurt Stock Exchange have direct access to the system and may trade on it. Private investors can trade on Xetra through their banks and brokers.
Deutsche Börse AG publishes information for all traded securities on the Internet, www.deutsche-boerse.com.
Transactions on Xetra and the Frankfurt Stock Exchange settle on the second business day following the trade. The Frankfurt Stock Exchange can suspend a quotation if orderly trading is temporarily endangered or if a suspension is deemed to be necessary to protect the public.
The Hessian Stock Exchange Supervisory Authority ( Hessische Börsenaufsicht ) and the Trading Monitoring Unit of the Frankfurt Stock Exchange ( HÜSt – Handelsüberwachungsstelle ) both monitor trading on the Frankfurt Stock Exchange.
The Federal Financial Supervisory Authority ( BaFin ), an independent federal authority, is responsible for the general supervision of securities trading pursuant to the provisions of the Regulation (EU) No. 596/2014 of the European Parliament and of the Council ( Market Abuse Regulation or MAR ), the WpHG and other applicable laws.
156
Trading on the New York Stock Exchange
ADSs representing the ordinary shares of Fresenius Medical Care AG were originally listed on the NYSE effective October 1, 1996 and following effectiveness of the Conversion, continue to be listed and traded under the symbol FMS. Effective December 3, 2012, we effected a two-for-one split of our outstanding ADSs, which changed the ratio of our ADSs to shares from one ADSs representing one share to two ADSs representing one share. The Depositary for the ADSs is Bank of New York Mellon (the Depositary). For information regarding the terms of ADSs representing shares of FME AG, see Exhibit 2.1.
Item 10. Additional information
|
A. |
Share Capital |
General information regarding our share capital
As of February 13, 2025, our share capital consists of 293,413,449 outstanding bearer shares without par value ( Stückaktien ) and a nominal value of €1.00 each. Our share capital has been fully paid in.
On July 14, 2023, in connection with the resolution on the Company’s change of legal form, our EGM also resolved to continue in effect after the Company’s change in legal form authorizations by our general meeting of shareholders granted in August 2020 approving the creation of authorized capital for a period of five years expiring on August 26, 2025, and in May 2021 authorizing the acquisition and utilization of treasury shares for a period of five years expiring on May 19, 2026, including, in each case, the possibility to exclude the shareholders’ subscription rights. We have not issued any shares pursuant to the August 2020 authorization or purchased any shares pursuant to the May 2021 authorization and we do not currently hold any treasury shares. For additional information see Exhibit 2.1 “Description of Securities” and note 23 of the notes to the consolidated financial statements included in this report.
|
B. |
Articles of Association |
|
B2. |
Certain provisions relating to directors |
Our Articles of Association do not contain any provisions with respect to the power of a member of the Supervisory Board or the Management Board to vote on a proposal, arrangement or contract in which he or she is materially interested, their power to vote compensation to themselves or any members of the Supervisory Board or the Management Board, borrowing powers exercisable by the board members, or their retirement or non-retirement under a standard age limit requirement. The Supervisory Board, however, itself set a standard age limit for members of the Supervisory Board and of the Management Board, but this standard age limit may be waived by the Supervisory Board. See Item 6.A., “Directors, senior management and employees — Directors and senior management — “Supervisory Board” and “— Management Board.” Transactions in which a related party of the Company (which includes members of the Management Board and the Supervisory Board) is interested are required to be entered into at market conditions. Such transactions may be subject to review by the Supervisory Board. See Item 6.C, “Directors, senior management and employees — Board practices.” The compensation of members of our Supervisory Board is fixed by the Articles of Association. The Supervisory Board, assisted by its Compensation Committee, is responsible for determining the compensation of members of the Management Board. See Item 6.B, “Directors, senior management and employees — Compensation — The Company’s structure and corporate bodies’ compensation — Management Board members’ compensation” and Item 6.C, “Directors, senior management and employees — Board practices.” The Articles of Association do not require ownership of our shares for director qualification. For share ownership requirements applying to our Management Board members, see Item 6.B, “Directors, senior management and employees — Compensation. For information regarding the provisions of our Articles of Association and applicable law requiring that our Supervisory Board be composed on a parity basis of six supervisory board members representing our shareholders and six supervisory board members representing our employees, see Item 6. Directors, senior managers and employees and Item 16G, “Corporate Governance.”
157
|
B.5 |
Provisions relating to shareholder meetings |
The Articles of Association provide that a general meeting is to be called at least thirty days prior to the day of the general meeting (excluding the call date and the meeting date), unless a shorter period is permitted by law. This notice period shall be extended by the days of the period for registration, i.e. the six days prior to the general meeting, unless a shorter period is provided in the meeting invitation, excluding the meeting date and the date that registration is received. Under the Articles of Association, the general meeting shall be held at the place where the Company’s registered office is located, in a German city where a stock exchange is situated or at the place where the registered office of a domestic affiliated company is located. Only shareholders who have registered and provided evidence of their entitlement to exercise shareholder rights are entitled to attend and vote at the general meeting. As evidence of entitlement, evidence of the shareholding by the ultimate intermediary is required. In conformity with amendments to the German Stock Corporation Act, the Articles of Association provide that such evidence must relate to the close of business on the 22nd day prior to the general meeting. At our 2023 AGM, our shareholders approved amendments to our Articles of Association to authorize the General Partner (and now the Management Board) for a period of two years to convene general meetings as virtual meetings, as authorized by recent amendment to the AktG.
The remaining information required by Item 10, comprising Items 10.B.3 and 10.B.4, and Items 10.B.6 through 10.B.10, including a description of our ordinary shares, is contained in Exhibit 2.1 to this report, and is incorporated by reference to said exhibit. The description of our ordinary shares contained in Exhibit 2.1 is qualified in its entirety by reference to the complete text of our Articles of Association, which are available at the locations referred to therein.
C. Material contracts
For information regarding certain of our material contracts, see “Item 7.B. Major shareholders and related party transactions — Related party transactions” and note 6 of the notes to the consolidated financial statements included in this report. For a description of our share-based compensation plans and stock option plan, see Item 6.B. “Directors, senior management and employees — Compensation,” and note 23 of the notes to the consolidated financial statements included in this report. No additional options can be granted under our Stock Option Plan 2011 (2011 SOP) and all remaining unexercised options under the 2011 SOP had already expired before December 31, 2023. For a description of our Syndicated Credit Facility and our agreements relating to our long-term and short-term indebtedness, see note 16 and note 17 of the notes to the consolidated financial statements included in this report.
158
D. Exchange controls
Exchange controls and other limitations affecting security holders.
Germany, in principle, does not restrict the export or import of capital. However, there are restrictions on transactions based on sanctions, international embargoes or terror prevention resolutions. These concern, for example, North Korea, Russia, Crimea/Sevastopol, non-government controlled areas of Ukraine in the oblasts of Donetsk, Kherson, Luhansk and Zaporizhzhia and Syria. Restrictions of this nature are adopted at the EU level and, where required, enforced by German national authorities. Furthermore, the Federal Ministry for Economic Affairs and Climate Action ( Bundesministerium für Wirtschaft und Klimaschutz ) may review and restrict or prohibit the direct or indirect acquisition of 25% or more of the voting rights in any German company by a person or company with residency outside of the EU and the European Free Trade Area if such acquisition is likely to impair public security or order. This threshold is 20% for investments in companies active in specific sectors deemed particularly important (e.g. development of personal protective equipment, vaccines, medicinal products, in-vitro diagnostics), and 10% for investments in further defined companies (e.g. operators of critical infrastructure, providers of software for critical infrastructure) or companies active in other sectors deemed essential (e.g. media, certain IT security functions). The 10% threshold also applies to the so-called sector-specific review (including acquisitions by non-German persons and companies) concerning, in particular, German defense companies. The relevant provisions also apply to other means of acquisition, e.g. asset deals, and mergers. Further, for statistical purposes, resident individuals or corporations residing in Germany must report payments of more than €12,500 (or the corresponding amount in other currencies) received from/for account of or made to/for account of an individual or a corporation resident outside of Germany to the German Federal Bank ( Deutsche Bundesbank) . Certain payments (for example, for the import, export or transfer of goods) are exempt. Specific reporting requirements apply if reports must be lodged for transit trade transactions (relating, inter alia, to the designation of the good) and in case the resident operates a maritime shipping company. In addition, residents (excluding natural persons, monetary financial institutions, investment stock corporations and capital management companies regarding the claims and liabilities of their investment funds) must report (i) monthly any claims against, or any liabilities payable to, non-resident individuals or corporations, if such claims or liabilities, in the aggregate exceed €5 M at the end of any month, and (ii) quarterly claims against, or liabilities payable to, non-residents arising under derivative financial instruments ( derivative Finanzinstrumente ) if the claims, or liabilities, exceed €500 M at the end of the quarter. Further, in principle, residents must report yearly the value ( Stand ) of the assets ( Vermögen ) (i) of non-resident companies in which either 10% or more of the shares or of the voting rights in a company are to be attributed to the resident, (ii) of non-resident companies if more than 50% of the shares or of the voting rights are to be attributed to one or more non-resident companies which are controlled by the resident, and (iii) of the resident’s non-resident branch offices and permanent establishments of a domestic company, and the assets which are ascribed to foreign branches and permanent establishments of a foreign company which fulfills the conditions mentioned under (ii). Likewise, equivalent to the conditions described with regard to assets of German residents abroad, residents must report yearly the value of the assets of foreigners in Germany.
Except as described above, there are no limitations imposed by German law or our Articles of Association ( Satzung ) on the right of a non-resident to hold our shares or the ADSs evidencing shares.
|
E. |
Taxation |
U.S. and German tax consequences of holding ADSs
The discussion below is intended only as a descriptive summary and does not purport to be a complete analysis of all potential German tax and U.S. federal income tax consequences relating to the ownership and disposition of ADSs of the Company. Each holder of ADSs should consult its own tax advisors with respect to the particular German and U.S. federal income tax consequences of the ownership and disposition of ADSs in light of its particular circumstances, including the application of the German and U.S. federal income tax considerations discussed below, as well as the application of state, local, foreign or other laws.
159
This summary is based on the current tax laws of Germany and the U.S., including the current “Convention between the United States of America and the Federal Republic of Germany for the Avoidance of Double Taxation and the Prevention of Fiscal Evasion with respect to Taxes on Income and Capital and to Certain Other Taxes”, as amended through the 2006 Protocol to the conventions which entered into force on December 28, 2007 (the Treaty). The 2006 Protocol is effective in respect of withholding taxes for amounts paid on or after January 1, 2007. Changes related to other taxes on income became effective on January 1, 2008.
German taxation
For German tax purposes, a holder of ADSs is generally treated as the economic owner of the underlying shares and, therefore, is generally treated as a shareholder of the Company (Federal Ministry of Finance circular dated May 24, 2013, as updated on December 18, 2018) for tax purposes. Differences may, however, apply when the holder of the ADSs seeks to obtain treaty relief from dividend withholding tax in Germany (e.g., in terms of requirements to provide evidence regarding the actual ownership of the ADS and entitlement to economic ownership in the underlying shares).
Tax treatment of dividends
Dividend distributions by German corporations paid to resident and non-resident shareholders are generally subject to dividend withholding tax at a rate of 25% (plus solidarity surcharge). The tax withholding obligation in general applies regardless of whether and, if so, to what extent the dividend is exempt from tax at the shareholder’s level.
For non-resident shareholders, the withholding tax rate of 25% may be reduced up to 0%, e.g. on the basis of a double tax treaty. For corporate non-German holders, 40% of the withheld and remitted withholding tax may be refunded upon application at the German Federal Tax Office (at the address noted below), which would generally result in a net dividend tax of 15% (plus solidarity surcharge). The entitlement of corporate non-German holders to further reductions of the withholding tax under an applicable income tax treaty remains unaffected. A partial refund of this withholding tax can be obtained by U.S. Holders under the Treaty (see discussion below). Foreign corporations will generally have to meet certain activity or substance criteria defined by applicable law in order to receive an exemption from or a (partial) refund of German dividend withholding tax.
Under the Treaty, the refund of German tax, including the withholding tax, Treaty payment and solidarity surcharge, will not be granted when the ADSs are part of the business property of a U.S. Holder’s permanent establishment located in Germany or are part of the assets of an individual U.S. Holder’s fixed base located in Germany and used for the performance of independent personal services. In this case, however, withholding tax and solidarity surcharge may be credited against German income tax liability.
Taxation of capital gains
If the shares are not held as business assets of a domestic business, capital gains realized by a non-German holder are only taxable in Germany if the disposing holder holds (or has held at any time in the last five years) 1% or more of the Company’s stated capital. Under the Treaty, a U.S. Holder who is not a resident of Germany for German tax purposes will not be liable for German tax on capital gains realized or accrued on the sale or other disposition of ADSs unless the ADSs are part of the business property of a permanent establishment located in Germany or are part of the assets of a fixed base of an individual located in Germany and used for the performance of independent personal services.
Refund procedures
To claim a refund under the Treaty, the U.S. Holder, as defined below, must submit an application for refund to the German tax authorities, with the original bank voucher, or certified copy thereof issued by the paying entity documenting the tax withheld or a withholding tax certificate ( Steuerbescheinigung ), as the case may be, within four years from the end of the calendar year in which the dividend is received.
Claims for refund are made on a special German claim for refund form, which must be filed with the German Federal Tax Office: Bundeszentralamt für Steuern, An der Küppe 1, D-53225 Bonn, Germany. The claim refund forms may be obtained from the German Federal Tax Office at the same address where the applications are filed, or from the Embassy of the Federal Republic of Germany, 4645 Reservoir Road, N.W., Washington, D.C. 20007-1998, or can be downloaded from the homepage of the Bundeszentralamt für Steuern (www.bzst.de).
160
U.S. Holders must also submit to the German tax authorities a certification (on IRS Form 6166) with respect to their last filed U.S. federal income tax return. Requests for IRS Form 6166 are made on IRS Form 8802, which requires payment of a user fee. IRS Form 8802 and its instructions can be obtained from the Internal Revenue Service (IRS) website at www.irs.gov .
German Gift or Inheritance Tax; Other German taxes
The transfer of ADSs to another person by way of gift or inheritance is generally subject to German gift or inheritance tax only if (i) the decedent, the donor, the heir, donee or any other beneficiary maintained a domicile or his/her habitual abode in Germany, or has its place of management or statutory seat in Germany at the time of the transfer, or is a German citizen who has spent no more than five consecutive years outside Germany without maintaining a residence in Germany (special rules apply to certain former German citizens who neither maintain their domicile nor have their habitual abode in Germany), (ii) the ADSs were held by the decedent or donor as part of business assets for which a permanent establishment or other fixed place of business was maintained in Germany or for which a permanent representative in Germany had been appointed, or (iii) the decedent or donor, at the time of the inheritance or gift, held either individually or collectively with related parties, directly or indirectly, at least 10% of the Company’s registered share capital.
The U.S.-Germany estate, inheritance and gift tax treaty provides that an individual whose domicile is determined to be in the U.S. for purposes of such treaty will not be subject to German inheritance and gift tax, the equivalent of the U.S. federal estate and gift tax, on the individual’s death or making of a gift unless the ADSs are part of the business property of a permanent establishment located in Germany or are part of the assets of a fixed base of an individual located in Germany and used for the performance of independent personal services. An individual’s domicile in the U.S., however, does not prevent imposition of German inheritance and gift tax with respect to an heir, donee, or other beneficiary who is domiciled in Germany at the time the individual died or the gift was made.
Such U.S.-Germany estate, inheritance and gift tax treaty also provides a credit against U.S. federal estate and gift tax liability for the amount of inheritance and gift tax paid in Germany, subject to certain limitations, in a case where ADSs are subject to German inheritance or gift tax and U.S. federal estate or gift tax.
There are no German transfer, stamp or other similar taxes that would apply to U.S. Holders who purchase or sell ADSs.
U.S. taxation
The following discussion describes the material U.S. federal income tax considerations relating to the ownership and disposition of the ADSs by a U.S. Holder (as defined below) who holds ADSs as capital assets for tax purposes, based on the Internal Revenue Code of 1986, as amended (the Code), IRS rulings and pronouncements, judicial decisions, final, temporary and proposed Treasury regulations, and the Treaty, all as now in effect and all of which are subject to change or differing interpretations, possibly with retroactive effect. The discussion below is intended only as a descriptive summary and does not purport to be a complete analysis of all of the potential U.S. tax consequences of holding ADSs of the Company. In particular, this discussion does not address all of the tax consequences that may be relevant to specific U.S. Holders in light of their particular circumstances or to U.S. Holders subject to special tax rules, such as certain financial institutions, insurance companies, regulated investment companies, real estate investment trusts, grantor trusts, traders that have elected the “mark-to-market” method of accounting, a U.S. expatriate within the meaning of Sections 877 or 877A of the Code, tax-exempt entities (including a private foundation, an “individual retirement account” or a Roth IRA), persons subject to special tax accounting rules as a result of any item of gross income with respect to ADSs being taken into account in an applicable financial statement, persons who directly, indirectly, or constructively own 10% or more, by vote or value, of the equity of the Company, investors holding ADSs through partnerships or other fiscally transparent entities, investors liable for the alternative minimum tax, investors that hold ADSs as part of a straddle or a hedge, investors whose functional currency is not the U.S. dollar, dealers in securities and persons holding ADSs in connection with a trade or business conducted outside of the U.S. or in connection with a permanent establishment or other fixed place of business outside of the United States. Moreover, this description does not address the U.S. federal estate and gift tax or alternative minimum tax, or state and local tax consequences of the acquisition, ownership or disposition of ADSs. U.S. Holders should consult their tax advisors regarding U.S. federal, state and local tax consequences of owning and disposing of ADSs.
161
For purposes of this discussion, a “U.S. Holder” is a beneficial owner of ADSs that for U.S. federal income tax purposes, is (1) an individual who is a citizen or resident of the U.S.; (2) a corporation created or organized under the laws of the U.S., any state thereof or the District of Columbia; (3) an estate, the income of which is subject to U.S. federal income tax regardless of its source; or (4) a trust, if it (i) is subject to the primary supervision of a U.S. court and one or more U.S. persons control all substantial decisions of the trust or (ii) has a valid election in effect under applicable U.S. Treasury Regulations to be treated as a U.S. person. If a partnership (including for this purpose any entity treated as a partnership for U.S. federal income tax purposes) is a beneficial owner of ADSs, the U.S. federal income tax consequences to a partner in the partnership will generally depend on the status of the partner and the activities of the partnership. A holder of ADSs that is a partnership and the partners in such partnership should consult their own tax advisors regarding the U.S. federal income tax consequences of the ownership and disposition of ADSs.
Ownership of ADSs in general
For U.S. federal income tax purposes, a holder of ADSs generally will be treated as the owner of the shares represented by such ADSs. The U.S. Treasury Department has expressed concern that depositaries for ADSs, or other intermediaries between the holders of shares of an issuer and the issuer, may be taking actions that are inconsistent with the claiming of U.S. foreign tax credits by U.S. Holders of such receipts or shares. Accordingly, the analysis regarding the availability of a U.S. foreign tax credit for German taxes and sourcing rules described below could be affected by future actions that may be taken by the U.S. Treasury Department.
Tax treatment of distributions
Subject to the discussion below under “Passive Foreign Investment Company considerations,” a U.S. Holder that receives a distribution with respect to ADSs generally will be required to include the U.S. dollar value of the gross amount of such distribution (before reduction for any German withholding taxes) in gross income as a dividend when actually or constructively received to the extent of the U.S. Holder’s pro rata share of the Company’s current or accumulated earnings and profits (as determined under U.S. federal income tax principles). To the extent a distribution received by a U.S. Holder is not a dividend because it exceeds the U.S. Holder’s pro rata share of the Company’s current and accumulated earnings and profits, the distribution will be treated first as a tax-free return of capital and reduce (but not below zero) the adjusted tax basis of the U.S. Holder’s ADSs. To the extent the distribution exceeds the adjusted tax basis of the U.S. Holder’s ADSs, the remainder will be taxed as capital gain. We do not intend to maintain calculations of earnings and profits, as determined for U.S. federal income tax purposes. Consequently, any distributions generally will be treated as dividend income.
With respect to non-corporate U.S. Holders, certain dividends received from a qualified foreign corporation (“qualified dividend income”) will be subject to U.S. federal income tax at preferential rates applicable to long-term capital gains (the maximum rate which under current law is 20%), rather than the higher rates of tax generally applicable to items of ordinary income, provided that the ADSs in respect of which such dividend is paid have been held for at least 61 days during the 121 day period beginning 60 days before the ex-dividend date and certain other requirements are met. Periods during which you hedge a position in our ADSs or related property may not count for purposes of the holding period test. The dividends would also not be eligible for the lower rate if you elect to take dividends into account as investment income for purposes of limitations on deductions for investment income. Provided (i) the ADSs of the Company are readily tradable on the NYSE (or certain other stock exchanges) or the Company qualifies for benefits under the Treaty and (ii) the Company was not, in the taxable year prior to the year in which the dividend was paid, and is not, in the taxable year in which the dividend is paid, a passive foreign investment company (discussed below), the Company will be treated as a qualified foreign corporation for this purpose. This reduced rate will not be available in all situations, and U.S. Holders should consult their tax advisors regarding the application of the relevant rules to their particular circumstances.
Subject to certain complex limitations, it is possible that any German tax withheld from distributions in accordance with the Treaty and paid over to Germany will be deductible or creditable against your U.S. federal income tax liability. However, under recently finalized Treasury regulations, it is possible that such withholding taxes will not be creditable unless you are eligible for and elect to claim the benefits of the Treaty. Special rules apply in determining the foreign tax credit limitation with respect to dividends that are subject to the preferential tax rates. To the extent a reduction or refund of the tax withheld is reasonably certain to be refunded under German law or under the Treaty, the amount of tax withheld would not be expected to be eligible for credit against your U.S. federal income tax liability.
162
Furthermore, if the dividends are taxed as qualified dividend income (as discussed above), the amount of the dividend taken into account for purposes of calculating the foreign tax credit limitation will in general be limited to the gross amount of the dividend, multiplied by a fraction, the numerator of which is the reduced tax rate applicable to qualified dividend income and denominator of which is the highest tax rate normally applicable to dividends. However, such foreign tax credit may be disallowed if the U.S. Holder held such ADSs or equity shares for less than a minimum period during which the U.S. Holder is not protected from risk of loss or is obligated to make payments related to the dividends. The limitation on foreign taxes eligible for credit is calculated separately with respect to specific classes of income. For this purpose, any dividends distributed by us with respect to ADSs or equity shares will generally constitute “passive category income” but could, in the case of certain U.S. Holders, constitute “general category income.” The rules relating to the determination of the foreign tax credit are complex and U.S. Holders should consult their tax advisors to determine whether and to what extent a credit would be available in their particular circumstances, including the effects of any applicable income tax treaties.
Dividends will generally constitute foreign source income for foreign tax credit limitation purposes. However, if we are a “United States-owned foreign corporation,” solely for foreign tax credit purposes, a portion of the dividends allocable to our U.S. source earnings and profits may be re-characterized as U.S. source. A “United States-owned foreign corporation” is any foreign corporation in which U.S. persons own, directly or indirectly, 50% or more (by vote or by value) of the stock. In general, United States-owned foreign corporations with less than 10% of earnings and profits attributable to sources within the U.S. are exempted from these rules. Although we don’t believe we are currently a “United States-owned foreign corporation,” we may become one in the future. In such case, if 10% or more of our earnings and profits are attributable to sources within the U.S., a portion of the dividends paid on the ADSs allocable to our U.S. source earnings and profits will be treated as U.S. source, and as such, a U.S. Holder may not offset any foreign tax withheld as a credit against U.S. federal income tax imposed on that portion of dividends.
The U.S. dollar value of any distribution on the ADSs made in euros generally should be calculated by reference to the spot exchange rate between the U.S. dollar and the euro in effect on the date the distribution is actually or constructively received by the U.S. Holder regardless of whether and when the Euros so received are in fact converted into U.S. dollars. A U.S. Holder who receives payment in Euros and converts those Euros into U.S. dollars at an exchange rate other than the rate in effect on such day may have a foreign currency exchange gain or loss, which would generally be treated as ordinary income or loss from sources within the U.S. for U.S. foreign tax credit purposes.
Sales, exchange or other disposition of ADSs
Subject to the discussion below under “Passive foreign investment company considerations,” upon a sale, exchange, or other disposition of the ADSs, a U.S. Holder will generally recognize a capital gain or loss for U.S. federal income tax purposes in an amount equal to the difference between the amount realized and the U.S. Holder’s tax basis in the ADSs. Such gain or loss will generally be long-term capital gain or loss if the U.S. Holder’s holding period for the ADSs exceeds one year. Individual U.S. Holders are generally taxed at a preferential rate on long-term capital gains (the maximum rate which under current law is 20%). The deductibility of capital losses is subject to limitations. Any such gain or loss that you recognize will generally be treated as U.S. source income or loss for foreign tax credit limitation purposes. You should consult your own tax advisor regarding the availability of a foreign tax credit or deduction in respect of any German tax imposed on a sale or other disposition of ADSs.
In the case of a cash-basis U.S. Holder who receives Euros in connection with the sale or other disposition of ADSs, the amount realized will be calculated based on the U.S. dollar value of the Euros received as determined by reference to the spot rate in effect on the settlement date of such exchange. A U.S. Holder who receives payment in Euros and converts Euros into U.S. dollars at a conversion rate other than the rate in effect on the settlement date may have foreign currency exchange gain or loss that would be treated as ordinary income or loss from sources within the U.S. for U.S. foreign tax credit purposes.
An accrual-basis U.S. Holder may elect the same treatment required of cash-basis taxpayers with respect to a sale or disposition of ADSs, provided that the election is applied consistently from year to year. Such election may not be changed without the consent of the IRS. In the event that an accrual-basis U.S. Holder does not elect to be treated as a cash-basis taxpayer (pursuant to the Treasury regulations applicable to foreign currency transactions), such U.S. Holder may have foreign currency gain or loss for U.S. federal income tax purposes because of differences between the U.S. dollar value of the currency received prevailing on the trade date and the settlement date. Any such currency gain or loss would be treated as ordinary income or loss from sources within the U.S. for U.S. foreign tax credit purposes. However, if foreign currency is converted into U.S. dollars on the date received by the U.S. Holder, a cash-basis or electing accrual-basis U.S. Holder should not recognize any gain or loss on such conversion.
163
Taxation of foreign currency gains upon refund of German withholding taxes
U.S. Holders of ADSs who receive a refund attributable to reduced withholding taxes under the Treaty may be required to recognize foreign currency gain or loss, which will be treated as ordinary income or loss, to the extent that the dollar value of the refund on the date it is received by the U.S. Holders differs from the dollar equivalent of the refund on the date the dividend on which such withholding taxes were imposed was received by the depositary or the U.S. Holder, as the case may be.
Passive Foreign Investment Company considerations
Special adverse U.S. federal income tax rules apply to U.S. Holders owning shares of a Passive Foreign Investment Company (PFIC). In general, if you are a U.S. Holder, we will be a PFIC with respect to you if for any taxable year in which you held our ADSs or shares: (i) at least 75% of our gross income for the taxable year is passive income or (ii) at least 50% of the value, determined on the basis of a quarterly average, of our assets is attributable to assets that produce or are held for the production of passive income. The determination of whether we are a PFIC will be made annually. Accordingly, it is possible that we may become a PFIC in the current or any future taxable year due to changes in our asset or income composition. The value of assets for purposes of the asset test, including the value of our goodwill and other unbooked intangibles, will generally be determined by reference to the market price of our ADSs or shares, which may fluctuate considerably, especially in times of high market volatility. Accordingly, fluctuations in the market price of our ADSs or shares may affect our PFIC status for any taxable year.
Passive income generally includes dividends, interest, royalties, rents (other than certain rents and royalties derived in the active conduct of a trade or business), annuities and gains from the disposition of assets that produce passive income. Any cash we hold generally will be treated as held for the production of passive income for the purpose of the PFIC test, and any income generated from cash or other liquid assets generally will be treated as passive income for such purpose. If a non-U.S. corporation owns at least 25% by value of the shares of another corporation, the non-U.S. corporation is treated for purposes of the PFIC tests as owning its proportionate share of the assets of the other corporation, and as receiving directly its proportionate share of the other corporation’s income.
Although we do not believe that we are currently a PFIC, the determination of PFIC status is highly factual and based on technical rules that are difficult to apply. Accordingly, there can be no assurances that we will not be a PFIC for the current year or any future taxable year. U.S. Holders should consult their own tax advisors regarding the application of the PFIC rules to their investment in our ADSs.
Tax on net investment income
In addition to regular U.S. federal income tax, certain U.S. Holders that are individuals, estates, or trusts are subject to a 3.8% tax on all or a portion of their “net investment income,” which may include all or a portion of their dividend income and net gain from the sale, exchange or other disposition of their ADSs.
U.S. information reporting and backup withholding
Dividends paid on, and proceeds on a sale or other dispositions of, ADSs paid to a U.S. Holder within the U.S. or through U.S.-related financial intermediaries are subject to information reporting and may be subject to backup withholding at a current rate of 24% unless you (1) are a corporation or other exempt recipient or (2) provide a taxpayer identification number and certify (on IRS Form W-9) that no loss of exemption from backup withholding has occurred.
Backup withholding is not an additional tax, and any amounts withheld under the backup withholding rules will be allowed as a refund or a credit against a U.S. Holder’s U.S. federal income tax liability, provided the required information is furnished to the IRS in a timely manner.
Holders other than U.S. Holders are generally not subject to backup withholding. However, such a non-U.S. Holder may be required to provide a certification (generally on IRS Form W-8BEN or W-8BEN-E) of its non-U.S. status in connection with payments received in the U.S. or through a U.S.-related financial intermediary in order to establish its exemption from backup withholding.
164
Individuals who are U.S. Holders, and who hold “specified foreign financial assets” (as defined in section 6038D of the Code), including debt or ordinary shares of a non-U.S. corporation that are held for investment and not held in an account maintained by a financial institution whose aggregate value exceeds certain thresholds during the tax year, may be required to attach to their tax returns for the year certain specified information. An individual who fails to timely furnish the required information may be subject to a penalty. Additionally, in the event a U.S. Holder does not file the required information, the statute of limitations may not close before such information is filed. Under certain circumstances, an entity may be treated as an individual for purposes of the foregoing rules.
U.S. and non-U.S. Holders may be subject to other U.S. information reporting requirements. U.S. and non-U.S. Holders should consult their own advisors regarding the application of U.S. information reporting rules in light of their particular circumstances.
The above summary is not intended to constitute a complete analysis of all tax consequences relating to the ownership and disposition of ADSs. U.S. Holders should consult their own tax advisors concerning the tax consequences of the ownership and disposition of ADSs in light of their particular circumstances, including the application of the U.S. federal income tax considerations discussed above, as well as the application of state, local, non-U.S. or other laws.
|
H. |
Documents on display |
We file periodic reports and furnish other information with the SEC. You may obtain copies of these reports without charge from the Internet site maintained by the SEC, which contains reports, proxy and information statements and other information regarding registrants that file electronically with the SEC. The SEC’s website is www.sec.gov. The reports and other documents that we filed in our legal form of a partnership limited by shares before the Conversion will continue to be available on the SEC’s website on the same page as the reports and other documents that we file in our corporate form as Fresenius Medical Care AG. You can also obtain copies of these reports on the “Investors” page under “Publications” on our own website, www.freseniusmedicalcare.com. In furnishing our website address in this report, however, we do not intend to incorporate any information on our website into this report, and any information on our website should not be considered part of this report, except as expressly set forth herein.
The NYSE currently lists American Depositary Shares representing our shares. As a result, we are subject to the periodic reporting requirements of the Exchange Act and we file reports with, and furnish other information to, the SEC. We are not subject to the SEC proxy rules but, in accordance with the rules of NYSE, we provide for voting by proxy at our general meetings. These reports, proxy statements and other information and exhibits and schedules thereto may be inspected without charge at, and copies thereof may be obtained at prescribed rates from, the public reference facilities of the SEC and the electronic sources listed in the preceding paragraph.
In addition to the reports and other information that we file with or furnish to the SEC, we prepare annual and quarterly reports. Our annual reports contain financial statements examined and reported upon, with opinions expressed by our independent auditors. Our consolidated financial statements included in our reports are prepared in conformity with IFRS Accounting Standards as issued by the IASB. For information regarding ESG matters, see “Introduction — Forward-looking statements.” Our annual and quarterly reports to our shareholders are posted under “Publications” on the “Investors” page of our website at www.freseniusmedicalcare.com.
We will also furnish the ADR depositary with all notices of shareholder meetings and other reports and communications that are made generally available to our shareholders. The depositary, to the extent permitted by law, shall arrange for the transmittal to the registered holders of American Depositary Receipts of all notices, reports and communications, together with the governing instruments affecting our shares and any amendments thereto. Such documents are also available for inspection by registered holders of American Depositary Receipts at the principal office of the depositary. For additional information regarding the dissemination of such notices, reports and communications, see the information under the heading “D. American Depositary Shares — Description of American depositary receipts — Voting rights” in Exhibit 2.1.
Documents referred to in this report which relate to us as well as future annual and interim reports prepared by us may also be inspected at our offices, Else-Kröner-Strasse 1, 61352 Bad Homburg v. d. Höhe, Germany.
165
Item 11. Quantitative and qualitative disclosures about market risk
Market risk
Our businesses operate in highly competitive markets and are subject to changes in business, economic and competitive conditions. Our business is subject to:
| ● | changes in reimbursement rates; |
| ● | intense competition; |
| ● | inflation; |
| ● | foreign exchange rate and interest rate fluctuations; |
| ● | varying degrees of acceptance of new product introductions; |
| ● | technological developments in our industry; |
| ● | uncertainties in litigation or investigative proceedings and regulatory developments in the health care sector; and |
| ● | the availability of financing. |
The information required by this Item is contained in note 26 of the notes to the consolidated financial statements included in this report and is incorporated by this reference in response to this Item. We also enter in non-speculative derivative contracts to hedge these risks which are also discussed in detail in note 26. Additional information related to interest rates is discussed in note 17 of the notes to the consolidated financial statements included in this report.
Additional factors and further information
Our business is also subject to other risks and uncertainties that we describe from time to time in our public filings. See Item 3.D, “Key information – Risk factors.” Developments in any of these areas could cause our results to differ materially from the results that we or others have projected or may project.
Reimbursement rates
Approximately 18% of our worldwide revenue for 2024 was for services rendered to patients covered by Medicare’s ESRD program and Medicaid. In order to be eligible for reimbursement by Medicare, ESRD facilities must meet conditions for coverage established by CMS. Additionally, government agencies may make changes in program interpretations, requirements or conditions of participation, and retain the right to audit the accuracy of our computations of rebates and pricing, some of which may result in implications (such as recoupment) for amounts previously estimated or paid which may have a material adverse effect on the Company’s revenues, profitability and financial condition. See Item 4.B, “Information on the Company – Business overview – Regulatory and legal matters – Reimbursement” and “– Health care reform” and Item 5, “Operating and financial review and prospects – II. Financial Condition and Results of Operations – Significant U.S. Reimbursement Developments.”
We also obtain a significant portion of our revenues from reimbursement by non-government payors. Historically, these payors’ reimbursement rates generally have been higher than government program rates in their respective countries. However, non-governmental payors are imposing cost containment measures that are creating significant downward pressure on reimbursement levels that we receive for our services and products. See Item 3.D, “Key information – Risk factors.”
166
Inflation
A major portion of our revenues from health care are subject to reimbursement rates regulated by governmental authorities, and a significant portion of other revenues, especially revenues from the U.S., is received from customers whose revenues are subject to these regulated reimbursement rates. Non-governmental payors are also exerting downward pressure on reimbursement rates. Increased operation costs that are subject to inflation may not be recoverable through price increases in the absence of a compensating increase in reimbursement rates payable to us and our customers, and could materially adversely affect our business, financial condition and results of operations.
In recent years, we faced significant challenges in the labor market, in particular in the U.S., resulting in staff shortages, high turnover rates and meaningfully higher costs, which could continue in the future. These impacts, combined with uncertainty in the macroeconomic environment, which drove inflationary cost increases and supply chain constraints, have had a materially adverse effect on our results of operations. While we have seen a stabilization of both the labor market and the inflationary environment during 2024, such impacts could continue to impact us in the future. Additionally, although there are indications that raw material markets are stabilizing, we expect our products business to continue to be impacted by supply chain and material cost challenges in 2025.
For further information regarding the effects of inflation on our results of operations, see Item 5, “Operating and financial review and prospects – III. Results of operations, financial position and net assets.”
Item 12. Description of securities other than equity securities
D. American depositary shares
Items 12A, 12B and 12C are not applicable to the Company. The information required by Items 12.D.1 and 12.D.2 is incorporated herein by reference to Exhibit 2.1 to this report. The description of our American Depositary Shares contained in Exhibit 2.1 is qualified in its entirety by reference to the complete text of the Amended and Restated Deposit Agreement referred to below, which is available on the SEC website, www.sec.gov.
Information regarding the fees and charges that a holder of our American Depositary Receipts may have to pay, either directly or indirectly, and the fees and other direct and indirect payments made by the depositary to the Company, is set forth in Items 12.D.3 and 12.D.4 below.
|
D.3. |
Fees and expenses |
Under the Amended and Restated Deposit Agreement dated as of November 30, 2023, between the Company and The Bank of New York Mellon, as depositary, ADS holders will be charged a fee for each issuance of ADSs, including issuances resulting from distributions of shares, rights and other property, and for each surrender of ADSs in exchange for deposited securities. The fee in each case is up to $5.00 for each 100 ADSs (or any portion thereof) issued or surrendered.
The following additional charges shall be incurred by the ADS holders, by any party depositing or withdrawing shares or by any party surrendering ADSs or to whom ADSs are issued (including, without limitation, issuance pursuant to a stock dividend or stock split declared by the Company or an exchange of stock regarding the ADSs or the deposited securities or a distribution of ADRs), whichever is applicable:
| ● | a fee of $0.05 or less per ADS (or portion thereof) for any cash distribution made pursuant to the deposit agreement; |
| ● | a fee of $0.05 per ADS (or portion thereof) per year for services performed by the depositary in administering our ADS program (which fee shall be assessed against holders of ADSs as of the record date set by the depositary not more than once each calendar year and shall be payable in the manner described in the next succeeding provision); |
| ● | any other charge payable by any of the depositary or the custodian, any of the depositary’s or custodian’s agents, or the agents of the depositary’s or custodian’s agents in connection with the servicing of our shares or other deposited securities (which charge shall be assessed against registered holders of our ADSs as of the record date or dates set by the depositary and shall be payable at the sole discretion of the depositary by billing such registered holders or by deducting such charge from one or more cash dividends or other cash distributions); |
167
| ● | a fee for the distribution of securities or of rights where the depositary will not exercise or sell those rights on behalf of holders (or the sale of securities in connection with a distribution), such fee being in an amount equal to the fee for the execution and delivery of ADSs which would have been charged as a result of the deposit of such securities (treating all such securities as if they were ordinary shares) but which securities or the net cash proceeds from the sale thereof are instead distributed by the depositary to those holders entitled thereto; |
| ● | stock transfer or other taxes and other governmental charges; |
| ● | cable, (including SWIFT) and facsimile transmission and delivery charges as are expressly provided for in the deposit agreement; |
| ● | transfer or registration fees for the registration of transfer of deposited securities on any applicable register in connection with the deposit or withdrawal of deposited securities; and |
| ● | expenses of the depositary in connection with the conversion of foreign currency into U.S. dollars. |
The depositary may collect any of its fees by deduction from any cash distribution payable, or by selling a portion of any securities to be distributed, to holders that are obligated to pay those fees. In performing its duties under the deposit agreement, the depositary may use brokers, dealers, foreign currency dealers or other service providers that are owned by or affiliated with the depositary and that may earn or share fees, spreads or commissions. The depositary may own and deal in any class of securities of the Company and its affiliates and in the ADSs.
The depositary collects its fees for delivery and surrender of ADSs directly from investors depositing shares or surrendering ADSs for the purpose of withdrawal or from intermediaries acting for them. The depositary may collect its annual fee for depositary services by deduction from cash distributions or by directly billing investors or by charging the book-entry system accounts of participants acting for them. The depositary may generally refuse to provide fee-attracting services until its fees for those services are paid.
We will pay all other charges and expenses of the depositary and any agent of the depositary (except the custodian) pursuant to agreements from time to time between us and the depositary. The fees described above may be amended from time to time. If an amendment adds or increases fees or charges, except for taxes or other governmental charges or expenses of the depositary for registration fees, facsimile costs, delivery charges or similar items, or prejudice a substantial right of ADS holders, it will not become effective for outstanding ADSs until 30 days after the depositary notifies ADS holders of the amendment.
|
D.4. |
Amounts payable by the depositary to the Company |
Under the fee agreement for the ADS program between us and The Bank of New York Mellon, the depositary has agreed to waive and/or pay its standard out-of-pocket facility administrative and maintenance expenses and registered ADR holder services expenses, as defined by the agreement. Moreover, the depositary has agreed to pay us 100% of the net cash dividend fee collected by the depositary during each contract year. Net cash dividend fees are defined as gross cash dividend fees collected by the depositary less any expenses incurred by the depositary relating to the collection of such fees. For 2024, we received €1.1 M in aggregate payments from the depositary for such fees and expenses.
168
Part II
Item 13. Defaults, dividend arrearages and delinquencies
None.
Item 14. Material modifications to the rights of security holders and use of proceeds
Not applicable.
Item 15A. Disclosure controls and procedures
The Company’s management, including the members of the Management Board performing the functions of Chief Executive Officer and Chief Financial Officer, has evaluated the effectiveness of the Company’s disclosure controls and procedures, as defined in Rules 13a-15(e) and 15d-15(e) under the Exchange Act, as of December 31, 2024. Based on such evaluation, the persons performing the functions of Chief Executive Officer and Chief Financial Officer have concluded that as of December 31, 2024, the Company’s disclosure controls and procedures were effective.
Item 15B. Management’s annual report on internal control over financial reporting
Management of the Company is responsible for establishing and maintaining adequate internal control over financial reporting, as such term is defined in Exchange Act Rules 13a-15(f) and 15(d)-15(f). The Company’s internal control over financial reporting is a process designed by or under the supervision of the members of the Management Board performing the functions of Chief Executive Officer and Chief Financial Officer, to provide reasonable assurance regarding the reliability of financial reporting and the preparation of the Company’s financial statements for external reporting purposes in accordance with IFRS Accounting Standards as issued by the IASB. Internal control over financial reporting includes policies and procedures that (1) pertain to the maintenance of records that, in reasonable detail, accurately and fairly reflect transactions and dispositions of our assets; (2) provide reasonable assurance that the Company’s transactions are recorded as necessary to permit preparation of the consolidated financial statements in accordance with IFRS Accounting Standards as issued by the IASB, and that the Company’s receipts and expenditures are being made only in accordance with authorizations of management and directors of the Company; and (3) provide reasonable assurance regarding prevention or timely detection of unauthorized acquisition, use or disposition of the Company’s assets that could have a material effect on the Company’s financial statements.
The Company’s management assessed the effectiveness of the Company’s internal control over financial reporting based on the criteria established in Internal Control – Integrated Framework (2013) issued by COSO as of December 31, 2024. Based on such assessment, management has concluded that the Company’s internal control over financial reporting as of December 31, 2024 was effective.
Inherent limitations of internal control over financial reporting
Because of its inherent limitations, internal control over financial reporting, no matter how well designed, cannot provide absolute assurance of achieving financial reporting objectives and may not prevent or detect misstatements. Therefore, even if the internal control over financial reporting is determined to be effective it can provide only reasonable assurance with respect to financial statement preparation and presentation. Also, projections of any evaluation of effectiveness to future periods are subject to the risk that controls may become inadequate because of changes in conditions, or that the degree of compliance with the policies or procedures may deteriorate.
Item 15C. Attestation report of the independent registered public accounting firm
The effectiveness of our internal control over financial reporting as of December 31, 2024, has been audited by PricewaterhouseCoopers GmbH Wirtschaftsprüfungsgesellschaft, an independent registered public accounting firm, as stated in their report included on page F-2.
Item 15D. Changes in internal control over financial reporting
There were no changes in our internal control over financial reporting during the year ended December 31, 2024 which have materially affected, or are reasonably likely to materially affect, our internal control over financial reporting.
169
Item 16A. Audit committee financial expert
Our Supervisory Board has determined that each of Dr. Marcus Kuhnert and Mr. Gregory Sorensen, M.D. qualifies as an audit committee financial expert and is “independent” as defined in Rule 10A-3 under the Exchange Act, in accordance with the instructions in Item 16A of Form 20-F.
Item 16B. Code of ethics
On October 14, 2020, we adopted a revised Code of Ethics and Business Conduct. As adopted, the revised Code applies to members of the Management Board, including its Chair and the responsible member for Finance & Controlling, other senior officers and all Company employees.
A copy of our Code of Ethics and Business Conduct is available on our website under “About Us – Compliance” at: www.freseniusmedicalcare.com/en/about-us/compliance/our-code-of-ethics-and-business-conduct/
Item 16C. Principal accountant fees and services
At the AGM held on May 16, 2024, our shareholders approved the appointment of PwC to serve as our independent auditors for the 2024 fiscal year, for the potential review of interim financial information for fiscal year 2024 prepared after the AGM in 2024 and as auditor for the potential review of interim financial information for fiscal year 2025 prepared prior to the AGM in 2025. At the AGM held on May 12, 2023, confirmed by the EGM held on July 14, 2023, our shareholders approved the appointment of PwC to serve as our independent auditors for the 2023 fiscal year, for the potential review of interim financial information for fiscal year 2023 prepared after the AGM in 2023 and as auditor for the potential review of interim financial information for fiscal year 2024 prepared prior to the AGM in 2024.
For the fees billed by our principal accountant for the last three years, comprising audit fees, audit related fees, tax fees and other fees, see note 32 of the notes to the consolidated financial statements included in this report.
Audit Committee’s pre-approval policies and procedures
As a German company, we prepare statutory financial statements under German law on the basis of the accounting principles of the German Commercial Code ( Handelsgesetzbuch or HGB ) and consolidated financial statements in accordance with IFRS Accounting Standards. Our Supervisory Board engages our independent auditors to audit these financial statements, in consultation with our Audit Committee and subject to election by our shareholders at our AGM in accordance with German law.
Our financial statements are also included in registration statements and reports that we file with the SEC. Our Audit Committee engages our independent auditors to audit these financial statements in accordance with Rule 10A-3 under the Exchange Act and Rule 303A.06 of the NYSE Governance Rules. See also the description in “Item 6C. Directors, senior management and employees – Board practices.”
Our Audit Committee also adopted a policy requiring management to obtain the committee’s approval before engaging our independent auditors to provide any permitted non-audit services to us or our subsidiaries. Pursuant to this policy, which is designed to assure that such engagements do not impair the independence of our auditors, the Audit Committee pre-approves a catalog of specific non-audit services that may be performed by our auditors. The policy also provides for additional approval requirements based on fee amount.
The Chief Financial Officer reviews all individual management requests to engage our auditors as a service provider in accordance with this catalog and, if the requested services are permitted pursuant to the catalog, approves the request accordingly. Services that are not included in the catalog or are included but exceed applicable fee levels are passed on either to the chair of the Audit Committee or to the full committee, for approval on a case-by-case basis. In addition, the Audit Committee is informed about all approvals on a quarterly basis. Neither the chair of our Audit Committee nor the full committee is permitted to approve any engagement of our auditors if the services to be performed either fall into a category of services that are not permitted by applicable law or would be inconsistent with maintaining the auditors’ independence.
170
Item 16D. Exemptions from the listing standards for audit committees
SEC Rule 10A-3 under the Exchange Act requires that all members of the Audit Committee of our Supervisory Board be independent, as defined by that rule, subject to certain exceptions. In accordance with German law, our Audit Committee consists of both board members elected by our shareholders and board members elected by our employees. Under Rule 10A-3, a company employee is ordinarily not considered independent. However, Rule 10A-3 provides an exception for an employee of a foreign private issuer who is not an executive officer of that issuer and who is elected to the supervisory board or audit committee of that issuer pursuant to the issuer’s governing law. In such a case, the employee is exempt from the independence requirements of Rule 10A-3 and is permitted to serve on the audit committee.
We rely on this exemption. Our Audit Committee includes two employee representatives, Ms. Stefanie Balling and Mr. Frank Michael Prescher, who were appointed to our Supervisory Board pursuant to the provisions of the German Stock Corporation Act (AktG) and the German Co-Determination Act (MitbestG). See Item 6A, “Directors, Senior Management and Employees - Directors and senior management” and Item 16G, “Corporate Governance” for additional information. We believe that our reliance on this exemption does not materially adversely affect the ability of our Audit Committee to act independently and to satisfy the other requirements of Rule 10A-3.
Item 16E. Purchase of equity securities by the issuer and affiliated purchasers
See note 20 of the notes to the consolidated financial statements included in this report for information on the authorization of our Management Board to purchase treasury shares. As of December 31, 2024 and 2023, we did not hold treasury shares and have not made any share repurchases under such authorization or otherwise.
Item 16F. Change in registrant’s certifying accountant
Not applicable.
Item 16G. Corporate governance
Introduction
ADSs representing our shares are listed on the NYSE. However, because we are a “foreign private issuer,” as defined in the rules of the SEC, we are exempt from substantially all of the governance rules set forth in Section 303A of the NYSE’s Listed Companies Manual, other than the obligations to:
| ● | maintain an audit committee in accordance with Rule 10A-3 under the Exchange Act, |
| ● | maintain (and enforce, if required) an incentive-based compensation recovery policy, |
| ● | notify the NYSE if any of our executive officers becomes aware of any material non-compliance with any applicable provisions of Section 303A, |
| ● | file annual and interim written affirmations, on forms mandated by the NYSE, relating to our compliance with applicable NYSE governance rules, and |
| ● | disclose the significant ways in which the governance standards that we follow differ from those applicable to U.S. companies under the NYSE governance rules. |
171
Many of the governance reforms instituted by the Dodd-Frank Wall Street Reform and Consumer Protection Act of 2010, including the requirements to provide shareholders with “say-on-pay” and “say-on-when” advisory votes related to the compensation of certain executive officers, are implemented through the SEC’s proxy rules. Because foreign private issuers are exempt from the proxy rules, these governance rules are not applicable to us. Under German law, our compensation system must be submitted for approval to the AGM if relevant amendments to the system are made and every four years, at a minimum. Each of the Compensation System 2020+ and the Compensation System 2024+ for our Management Board was submitted to, and was approved by, our AGM on August 27, 2020, and May 16, 2024, respectively. The compensation system is also reviewed by an independent external compensation expert if relevant amendments to the system are made. Similarly, the more detailed disclosure requirements regarding management compensation applicable to U.S. domestic companies (including requirements to provide pay ratio disclosure and a “Compensation Discussion and Analysis,” as well as disclosure of the relationship between executive compensation actually paid and a registrant’s financial performance) are found in SEC Regulation S-K, whereas compensation disclosure requirements for foreign private issuers are set forth in Form 20-F. Item 6.B of Form 20-F generally requires foreign private issuers to disclose executive compensation on an individual basis for all officers unless the issuer does not disclose individual compensation pursuant to home country law or otherwise. We disclose the compensation paid to members of the Management Board and the Supervisory Board on an individual basis in the Compensation Report that we prepare and disclose under German law. A convenience translation of our Compensation Report for 2024, which discloses the compensation received by these board members and describes our compensation system and the performance targets included in the system, is included in this Form 20-F. See Item 6.B, “Directors, senior management and employees — Compensation.”
In October 2022, the SEC issued its final compensation “clawback” (recovery) rule. That rule, originally proposed in 2015, directed U.S. stock exchanges to establish listing standards requiring their listed issuers to adopt, implement and disclose policies providing for the recovery, under certain circumstances, of incentive-based compensation paid on the basis of financial information that is subsequently restated. In addition, if a company prepares such an accounting restatement, it will be required to disclose information regarding the enforcement of its recovery policy, including whether the company has foregone any such recovery under the limited conditions permitted by the rule and whether any executive officer owes any amounts of recoverable compensation to the company. See Item 6.F, “Directors, senior management and employees — Disclosure of a registrant’s action to recover erroneously awarded compensation.” The clawback rule and related disclosure requirements apply to both U.S. domestic and foreign private issuers and impose clawback requirements without fraud or other misconduct as a necessary prerequisite. Our incentive-based compensation recovery policy is available at www.sec.gov. Under the terms and conditions of our long-term incentive plans and the service agreements concluded with the members of the Management Board, the Company is entitled to reclaim certain previously earned and paid compensation components. Such right to reclaim exists in case of relevant violations of internal guidelines or undutiful conduct. The SEC’s clawback rule does not affect our rights to seek recovery under these compensation plans and service agreements, but any such recovery could not be applied to offset amounts due under our incentive-based compensation recovery policy unless such violation or undutiful conduct were directly related to an accounting restatement.
In addition to the comparative governance disclosure requirements of this Item 16.G, as a German company, we disclose certain governance matters in a Declaration on Corporate Governance ( Erklärung zur Unternehmensführung ) that we prepare and make available pursuant to German law as well as certain other governance-related information that we prepare and make available pursuant to German and EU law, as described in the Introduction to this Form 20-F. Our Declaration on Corporate Governance, in addition to the information in Item 6.A, “Directors, senior management and employees — Directors and senior management” and Item 6.C “Directors, senior management and employees — Board practices,” each above, in particular includes information on the composition and practices of the Management Board, our Supervisory Board and the committees of our Supervisory Board. Our Declaration on Corporate Governance for 2023 is posted on our website at www.freseniusmedicalcare.com/en/investors/corporate-governance/declaration-on-corporate-governance. We will post our 2024 Declaration on Corporate Governance on our website when it becomes available following the filing of this report on Form 20-F.
In contrast, SEC rules require certain sustainability-related information in reports filed with the SEC. See Item 16K, “Cybersecurity.” In March 2024 the SEC adopted disclosure requirements regarding climate-related matters in SEC reports and registration statements filed with the SEC, including information about a company’s climate-related risks, disclosure of a company’s GHG emissions, and inclusion of certain climate-related financial metrics in a company’s audited financial statements. Similar to the cybersecurity rules, the SEC’s climate disclosure rules apply to both U.S. domestic and foreign private issuers. The SEC has stayed the effectiveness of these rules pending resolution of litigation regarding the SEC’s authority to adopt such rules and their validity. On February 11, 2025, the acting chairman of the SEC instructed staff to request that the court not schedule the case for argument to provide time for the SEC to deliberate and determine the appropriate next steps in these cases.
172
As a German company, FME AG follows German corporate governance practices. German corporate governance practices generally derive from the provisions of the AktG, capital market related laws, the German Co-Determination Act ( Mitbestimmungsgesetz, or MitBestG) and the German Corporate Governance Code. Our Articles of Association also include provisions relevant to our corporate governance. German standards differ from the corporate governance listing standards applicable to U.S. domestic companies which have been adopted by the NYSE. The discussion below provides certain information regarding our organizational structure, management arrangements and governance. It should be noted that the information in the discussion below relating to the voting and other rights of our shareholders under our Articles of Association and German law applies only to persons who actually hold our shares, but not to holders of our ADSs. Holders of our ADSs have only the rights provided under the deposit agreement governing the terms of the ADSs. For detailed information regarding those rights, including information regarding how holders of ADSs may instruct the depositary to vote the shares represented by their ADSs, see the information under the heading “D. American Depositary Shares — Description of American depositary receipts” in Exhibit 2.1 to this report.
The legal structure of the Company
The Company is a stock corporation under German law. The corporate bodies of a German stock corporation are its management board, its supervisory board and its general meeting of shareholders.
Management and oversight
The governance structure of FME AG is illustrated as follows:
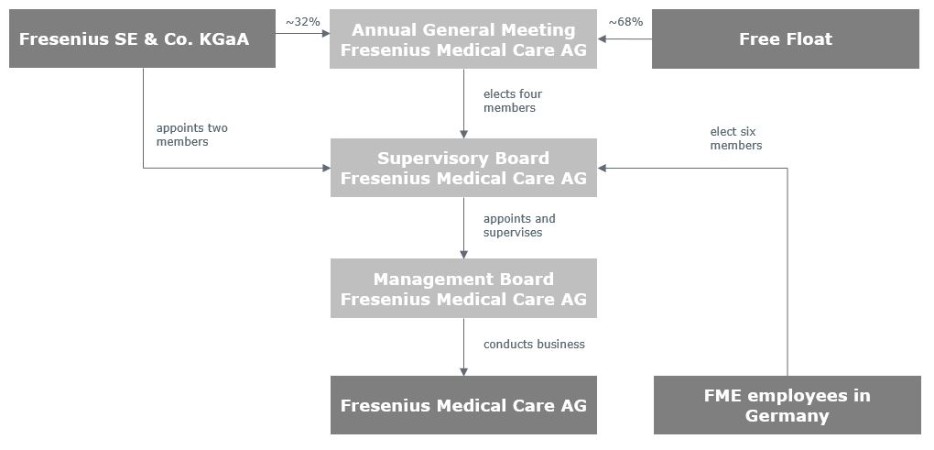
Management Board
The Management Board manages the Company and conducts its business.
Supervisory Board
The Supervisory Board supervises and advises the Management Board and performs the other duties assigned to it by law and the Articles of Association. In accordance with principle 6 of the German Corporate Governance Code, supervision and advice include sustainability matters. The Supervisory Board is further involved in strategy and planning as well as all matters of fundamental importance for the Company.
173
Pursuant to the applicable statutory provisions of the German Stock Corporation Act ( Aktiengesetz — AktG), the German Co-Determination Act ( Mitbestimmungsgesetz – MitbestG) and in accordance with the more detailed provisions of the Articles of Association of the Company, the Supervisory Board of the Company consists of twelve members, of whom, subject to Fresenius SE’s appointment right pursuant to Article 8 paragraph 2 of the Articles of Association, six are to be elected by the General Meeting (shareholder representatives) and six are to be elected by the employees (employee representatives) in accordance with the provisions of the MitbestG. See Item 6A, “Directors, senior management and employees — Directors and senior management - Supervisory Board.”
The Supervisory Board does not include any members who were previously members of the Management Board.
German regulations have several rules applicable to supervisory board members which are designed to ensure that the supervisory board in its entirety possesses the knowledge, ability and expert experience to properly fulfill its tasks as well as to ensure a certain degree of independence of the board’s members. German law prohibits members of the management board from contemporaneously serving on the supervisory board. This may be contrasted with the U.S. practice under which executive officers may, and often do, serve as both officers and directors of a company, subject to stock exchange rules requiring listed U.S. domestic companies (but not foreign private issuers such as the Company) to have a majority of independent directors (further subject to certain additional exceptions). German law requires members of the supervisory board to act in the best interest of the company. They do not have to follow directions or instructions from third parties. Any service, consulting or similar agreements between an AG and any of its supervisory board members require approval by the supervisory board and are only permitted in such cases where the subject matter is beyond the scope of a supervisory board member’s duties.
General meeting
The general meeting is the resolution body of the Company’s shareholders. The rules of the NYSE require companies with voting securities listed on the NYSE to solicit proxies for all meetings of shareholders; however, such solicitations by foreign private issuers need not comply with the SEC’s proxy rules. Shareholders can exercise their voting rights at the general meeting themselves, by proxy via a representative of their choice, or by a company-nominated proxy acting on their instructions. Instructions for voting by proxy are included in the invitation for the general meeting. The agenda and resolution proposals for the general meeting are prepared by the Management Board and the Supervisory Board. The Management Board, however, cannot propose nominees for election as members of the Supervisory Board or make proposals for the Company’s auditors.
The Articles of Association of FME AG
For information regarding our Articles of Association, including information regarding the Company’s authorized share of capital, see Exhibit 2.1. The information about our Articles of Association summarized in Exhibit 2.1 is not complete and is qualified in its entirety by reference to the complete form of Articles of Association of FME AG. A convenience English translation of our Articles of Association is on file with the SEC and can also be found on the Company’s website under www.freseniusmedicalcare.com.
Managers’ transactions
According to Article 19(1) of the MAR, persons discharging managerial responsibilities within an issuer of shares, as well as persons closely associated with them, are obligated to notify the issuer and the competent authority, i.e. for the Company as issuer, BaFin , of every transaction conducted on their own account relating to the shares or debt instruments of the issuer or to derivatives or other financial instrument linked thereto no later than three business days after the date of the transaction, once the volume of all transactions conducted within a calendar year exceeds a total amount of €20,000. Persons discharging managerial responsibilities include, inter alia, the members of management boards and supervisory boards. We make public the information received through these notifications and publish them on our website in accordance with the MAR. As of January 1, 2021, we must make public the information contained in a notification received from a person discharging managerial responsibilities within two business days of receipt of such a notification. Pursuant to Article 19(11) of the MAR, a person discharging managerial responsibilities within an issuer must not either conduct any transactions on its own account or for the account of a third party, directly or indirectly, relating to, inter alia , the shares or debt instruments of the issuer during a closed period of 30 calendar days before the announcement of an interim financial report or a year-end report which the issuer is obliged to make public.
174
Holders of more than 5% of our voting securities are, however, required to comply with the reporting requirements of Section 13(d) of the Exchange Act. See Item 7A, “Major shareholders and related party transactions – Major shareholders. However, the reporting requirements of Section 16 of the Exchange Act do not apply to the equity securities of a foreign private issuer. Accordingly, the members of our Management Board and our Supervisory Board, and holders of more than 10% of our voting securities, are not subject to these requirements with respect to their ownership of or transactions in our shares, and transactions in our shares are not subject to “short-swing” profit recovery by us or our shareholders. As a foreign private issuer, we are also exempt from the SEC proxy rules. Therefore, we are also not subject to rules adopted by the SEC in December 2018 that require U.S. domestic public companies to disclose in their proxy statements their practices or policies regarding the ability of their directors, officers or employees (or their respective designees) to purchase financial instruments that are designed to hedge or offset any decrease in the market value of equity securities granted to them as compensation or directly or indirectly held by them. However, our Insider Policy provides that persons subject to the policy are discouraged from engaging in such transactions.
We are subject to SEC rules adopted in December 2022 requiring disclosure in annual reports whether or not (and if not, why not) a company has adopted insider trading policies and procedures and requiring a company that has adopted such policies and procedures to disclose such policies and to file its policies as an exhibit to its annual report. In 2022, we revised our prior U.S. and global insider trading policies and combined them into a single global Insider Policy that sets forth our insider trading policy. Our Insider Policy is available on the SEC’s website, www.sec.gov and on our website, www.freseniusmedicalcare.com.
Certain share issuances
Under the listing rules of the NYSE, the issuance of securities of the same class as the listed class, or of securities convertible into or exchangeable for the listed securities, may require shareholder approval as a condition to the listing of such additional securities on the NYSE. Subject to certain exceptions (including the issuance of shares in public offerings for cash and issuances for cash at a price equal to or exceeding a defined minimum), shareholder approval may be required for the listing of shares to be issued to certain related parties, issuances of shares having voting power equal to or in excess of 20% of the voting power outstanding before the issuance of such securities, and issuances pursuant to share-based incentive compensation plans. However, under NYSE policy, such approval is not required for issuances of securities by foreign private issuers if it is not required by the issuer’s home country law and the NYSE receives an opinion of counsel in the issuer’s home jurisdiction to that effect. Subject to shareholder approval requirements under the stock exchange listing rules referred to above, companies organized under the corporate statutes of the states of the U.S. may generally issue shares solely by action of a company’s board of directors, assuming, in the case of common shares, the availability of a sufficient number of authorized but unissued and unreserved shares or, in the case of preferred stock, the inclusion of “blank-check” preferred authorization in a company’s charter document. In contrast, under the AktG, the issuance of new shares requires a capital increase ( Kapitalerhöhung ) of the Company by way of an approval by the shareholders requiring the affirmative vote of a majority of three quarters of the capital represented at the vote. Next to a capital increase against contribution ( Kapitalerhöhung gegen Einlagen ), a capital increase may also be conducted from Authorized Capital ( genehmigtes Kapital ) or Conditional Capital ( bedingtes Kapital ). The resolution creating Authorized Capital may authorize the Management Board to issue new shares up to a stated amount for a period of up to five years. The nominal value of any proposed increase of the Authorized Capital may not exceed half of the issued capital stock at the time of the authorization. In addition, Conditional Capital may be created for the purpose of issuing (i) new shares to holders of convertible bonds or other securities which grant a right to shares, (ii) new shares as the consideration in a merger with another company, or (iii) new shares offered to management or employees. The nominal value for any Conditional Capital may not exceed 60% of the Company’s issued capital at the time of the resolution. The nominal value for any Conditional Capital created for the purpose of issuing new shares to holders of convertible bonds or other securities which grant a right to shares may not exceed 50% of the Company’s issued capital at the time of the resolution. The nominal value for any Conditional Capital created for the purpose of issuing shares to management and employees may not exceed 20% of the Company’s issued capital at the time of the resolution. For information regarding our authorized capital, including provisions permitting the exclusion of shareholder subscription (pre-emptive) rights, and our conditional capital, see Exhibit 2.1 to this report.
175
Comparison with U.S. and NYSE governance standards and practices
Although, as noted above, our status as a foreign private issuer exempts us from most of the NYSE requirements, several of the concepts addressed by the NYSE rules are also addressed (but not mandated) by the German Corporate Governance Code. The most recent applicable version of the German Corporate Governance Code is dated April 28, 2022 which became effective June 27, 2022 (German Corporate Governance Code). The German Corporate Governance Code’s governance rules applicable to German corporations are not legally binding. However, companies that do not comply with the German Corporate Governance Code’s recommendations must disclose publicly whether and for what reason their practices differ from the recommendations of the German Corporate Governance Code. Under the German Corporate Governance Code, a well justified deviation from a recommendation may be in the interest of good corporate governance. A convenience translation of our most recent annual “Declaration of Compliance” with the recommendations of the German Corporate Governance Code, including certain deviations, is posted on our website, www.freseniusmedicalcare.com in the section “Corporate Governance” of the Investor Relations page under “Declaration of Compliance” at www.freseniusmedicalcare.com/en/investors/corporate-governance/declaration-of-compliance/, together with our declarations for prior years.
The listing standards of the NYSE require that a U.S. domestic listed company have a majority of independent board members and that the independent directors meet in regularly scheduled sessions without management. U.S. listed companies must also adopt corporate governance guidelines that address director qualification standards, director responsibilities, director access to management and independent advisors, director compensation, director orientation and continuing education, management succession, and an annual performance evaluation of the board. Some of the German Corporate Governance Code’s recommendations address the independence and qualifications of supervisory board members. Specifically, the German Corporate Governance Code recommends that the supervisory board shall determine specific objectives regarding its composition and shall prepare a profile of skills and expertise for the entire board while taking the principle of diversity into account. Our Supervisory Board has determined concrete objectives for its composition and prepared such a profile of skills and expertise, which is posted on our website at www.freseniusmedicalcare.com/en/about-us/supervisory-board. Proposals by the supervisory board to the general meeting shall take these objectives into account, while simultaneously aiming at fulfilling the overall profile of required skills and expertise of the supervisory board. The objectives regarding its composition shall, inter alia, also take into account potential conflicts of interest. Further, information shall be provided about what the supervisory board regards as the appropriate number of independent supervisory board members, and the names of those members. Our independent shareholder representatives on the Supervisory Board within the meaning of the German Corporate Governance Code are Mr. Shervin J. Korangy, Dr. Marcus Kuhnert, Mr. Gregory Sorensen, M.D., and Ms. Pascale Witz. Similarly, if a substantial and not merely temporary conflict of interest between a company and a member of its supervisory board arises, the German Corporate Governance Code recommends that the term of that member be terminated. The German Corporate Governance Code further recommends that at any given time not more than two former members of the management board shall serve on the supervisory board. Presently, no member of our Supervisory Board is a former member of our Management Board. As previously noted, we are exempt from the SEC proxy rules, which require U.S. issuers to include in SEC filings a discussion of the specific experience, qualifications, attributes or skills that led to directors’ inclusion as board members. However, Form 20-F requires that we disclose, inter alia, the business experience, functions and areas of experience in the Company of our directors and their principal business activities performed outside the Company. Under the German Corporate Governance Code, the composition of the supervisory board has to ensure that its members collectively have the knowledge, skills, and professional expertise required to properly perform all duties. For information regarding the professional backgrounds of our board members, see Item 6. Directors, senior management and employees.
Since the Company’s change of legal form to that of an AG took effect and the German Co-Determination Act ( Mitbestimmungsgesetz ) became applicable to the Company, at least 30% of the members of the Supervisory Board must be women and at least 30% must be men in accordance with Section 7 paragraph 3 sentence 1 MitbestG, Section 96 paragraph 2 AktG. For a twelve-member supervisory board, this corresponds to at least four women and at least four men. This requirement was met during 2024.
Since the change of the Company’s legal form to that of an AG took effect and the German Co-Determination Act ( Mitbestimmungsgesetz ) became applicable to the Company, gender requirements for the composition of the Management Board are also applicable. According to Section 76 paragraph 3a AktG, if the Management Board of the Company consists of more than three persons, it must include at least one woman and at least one man. This requirement was met at all times during 2024 and continues to be met as of the date of this report.
176
The NYSE, on which ADSs representing our shares are listed, does not impose specific diversity requirements for boards of directors of NYSE-listed companies, and has noted that in at least one state, laws mandating diversity have been struck down.
As noted above, as a company listed on the NYSE, we are required to maintain an audit committee in accordance with Rule 10A-3 under the Exchange Act. The NYSE’s governance rules applicable to U.S. domestic listed companies also require that such companies also maintain a nominating committee to select nominees to the board of directors and a compensation committee, each consisting solely of directors who are “independent” as defined in the NYSE’s governance rules. While we maintain a nominating committee and a compensation committee of our Supervisory Board, we are exempt from the NYSE rules requiring such committees and that they consist solely of independent directors.
In contrast to U.S. practice, with two exceptions, German corporate law does not mandate the creation of specific supervisory board committees, independent or otherwise. As a company subject to the MitbestG, we are required to establish a mediation committee with a charter to resolve any disputes among the members of the supervisory board that may arise in connection with the appointment or dismissal of members of the management board. In addition, the AktG provides that the supervisory board of public interest entities within the meaning of the German Commercial Law must establish an audit committee that supervises the monitoring of the accounting process, the effectiveness of the internal control system, the risk management system and the internal audit function as well as the annual auditing, in particular the selection and the independence of the external auditor, the quality of the audit, and the additional services rendered by the external auditor. Most of these functions are also the responsibility of the audit committee under the NYSE and SEC audit committee rules. Our Audit Committee within the Supervisory Board, which functions in each of these areas, also serves as our audit committee required by SEC Rule 10A-3 and the NYSE rules. The Rules of Procedure of our Audit Committee, and the SEC and NYSE rules all require that the Audit Committee consist solely of “independent” directors, except that committee members may serve in reliance on an applicable exemption from such independence requirements. Under the Audit Committee Rules of Procedure and the Corporate Governance Code, an Audit Committee member is independent if such member has no significant business, professional or personal relationship with the Company or its affiliates and satisfies the SEC and NYSE independence requirements, is independent from the Company, the Management Board and from any controlling shareholder as defined by the German Corporate Governance Code and, in case of a conflict of interest, the Supervisory Board determines that such conflict does not interfere with the exercise of such member’s independent judgment as a member of the Audit Committee. Under the SEC and NYSE rules, an audit committee member is not independent if he or she receives any compensation other than fees for board and committee service and certain permitted retirement compensation. Co-determination requires that our Supervisory Board include employee representatives. However, under the SEC and NYSE audit committee rules, Supervisory Board members who are also employees would not be independent because, in addition to any fees they receive for service on the board and the Audit Committee, they receive compensation as employees. The SEC and NYSE audit committee rules recognize our co-determination obligations and provide that employees of a foreign private issuer who serve on the issuer’s board of directors or audit committee pursuant to the issuer’s governing law or documents, a collective bargaining or similar agreement or other home country legal or listing requirements, and who are not “executive officers” (as defined in SEC Rule 3c-7 under the Exchange Act) of the foreign private issuer are exempt from those rules’ independence requirements. See Item 16D. “Exemptions from the listing standards for audit committees.” In accordance with Rule 303A.12 of the NYSE listing rules, we also report our reliance on this exemption in an Annual Affirmation to the NYSE.
In addition, our Supervisory Board has formed a Presiding Committee, a Compensation Committee, a Nomination Committee and a Mediation Committee. For information regarding the members of our Audit Committee as well as the functions of the Audit Committee, the Presiding Committee, the Compensation Committee, the Nomination Committee and the Mediation Committee, see Item 6.C, “Directors, senior management and employees — Board practices.”
Under the NYSE compensation committee rule, as adopted to implement SEC Rule 10C-1 adopted under the Dodd-Frank Act, NYSE-listed companies must maintain a compensation committee consisting solely of independent directors. Unlike the SEC Audit Committee Rule, which identifies specific factors that preclude independence, Rule 10C-1 provides that independence is to be determined considering “all relevant factors.” Under SEC Rule 10C-1, a compensation committee is a committee with functions that include “oversight” of executive compensation on behalf of the board of directors. NYSE Rule 303A.05 provides that a NYSE-listed company’s compensation committee must have, inter alia , “direct responsibility” to determine and approve the CEO’s compensation level and make recommendations to the board with respect to non-CEO executive officer compensation. Under the NYSE rules, foreign private issuers such as FME AG continue to be exempt from all requirements to maintain an independent compensation committee. Our Compensation Committee prepares proposals for the Supervisory Board regarding the compensation of the Management Board, but the Supervisory Board itself must decide upon such compensation.
177
The SEC’s incentive compensation “clawback” rule permits a company to refrain from pursuing recovery of incentive compensation if it would be “impracticable” to do so (see Item 6.F, “Disclosure of a registrant’s actions to recover erroneously awarded compensation”). The rule requires that the impracticability determination must be made by a company’s independent committee responsible for executive compensation or, in the absence of such a committee, a majority of the independent directors on the company’s board. For foreign private issuers, recovery may be “impracticable” if (in addition to other bases available to all issuers) recovery would violate the issuer’s home country law where that law was adopted prior to November 28, 2022. In such a case, the issuer must obtain an opinion of home country counsel to that effect and provide such opinion to the stock exchange on which it is listed.
Item 16H. Mine safety disclosure
Not applicable.
Item 16I. Disclosure regarding foreign jurisdictions that prevent inspections
Not applicable.
Item 16J. Insider trading policies
Our insider trading policy, as contemplated by Item 16J. of Form 20-F, is
Item 16K. Cybersecurity
Risk Management and Strategy
During 2024, we successfully delivered the key initiatives outlined in our security roadmap, including improving our risk management and global cybersecurity operations. We increased our cybersecurity effectiveness by implementing strategic initiatives focused on cybersecurity governance, risk and compliance, cyber operations, third-party risk and data security programs. For example, we have implemented a new IT risk and compliance platform, allowing us to consolidate all risk management and internal audit monitoring and remediation. Additionally, we have completed our roll-out of a unified endpoint detection and response system, providing a single security view of our network.
In managing and measuring performance as part of our global cybersecurity program, we have adopted the standards set out in the globally recognized NIST Cyber Security Framework. These standards guide our activities in identifying, protecting, detecting, responding to and recovering from cybersecurity incidents.
In 2024, we continued to update and implement new policies and controls based on the U.S. National Institute of Standards and Technology (NIST) Cybersecurity Framework.
178
Employee awareness and training are essential to our ability as a company to thwart cyber-attacks. In 2024, we continued to raise employees’ risk awareness with mandatory, regular online training for all employees and complimentary awareness campaigns. We conducted a month-long global campaign to promote cybersecurity awareness among our employees. The event’s primary objective was to apprise our staff members of the measures and protocols in place for the safety of our company, patients and employees in the digital realm. The event also aimed to educate our employees on best practices and steps to mitigate the risks of cyber threats, including techniques and clues to recognize various forms of “phishing” and efforts to deploy viruses and malware in our systems.
For additional
Governance
179
Managing and measuring performance is an integral part of our global cybersecurity program oversight. As noted above, we have adopted the standards of the NIST Cyber Security Framework. This framework is risk-driven and helps us to identify, protect, detect, respond to and recover from cybersecurity incidents.
In 2023, we engaged
As part of our cybersecurity roadmap, we set annual maturity targets based on the NIST Cyber Security Framework. We use these metrics to measure our effectiveness in improving risk management and global cybersecurity processes. In 2024, we continued to enhance the effectiveness of our cybersecurity program with a focus on areas such as cybersecurity governance, risk management and cyber operations.
180
Part III
Item 17. Financial statements
Not applicable. See Item 18. “Financial statements.”
Item 18. Financial statements
The information called for by this item commences on Page F-1.
Item 19. Exhibits
A listing of our exhibits can be found immediately following the notes to the consolidated financial statements included in this report.
181
Signatures
The registrant hereby certifies that it meets all of the requirements for filing on Form 20-F and that it has duly caused and authorized the undersigned to sign this annual report on its behalf.
DATE: February 25, 2025
|
|
FRESENIUS MEDICAL CARE AG |
|
|
|
|
|
|
|
By: |
/s/ HELEN GIZA |
|
|
Name: |
Helen Giza |
|
|
Title: |
Chief Executive Officer and Chair of the Management Board |
|
|
|
|
|
|
|
|
|
|
By: |
/s/ MARTIN FISCHER |
|
|
Name: |
Martin Fischer |
|
|
Title: |
Chief Financial Officer and member of the Management Board |
182
Index of financial statements
Audited consolidated financial statements
F-1
Report of Independent Registered Public Accounting Firm
To the Shareholders and Supervisory Board of Fresenius Medical Care AG
Opinions on the Financial Statements and Internal Control over Financial Reporting
We have audited the accompanying consolidated balance sheets of Fresenius Medical Care AG and its subsidiaries (the “ Company ” ) as of December 31, 2024 and 2023, and the related consolidated statements of income, comprehensive income, shareholders ’ equity and cash flows for each of the three years in the period ended December 31, 2024, including the related notes (collectively referred to as the “ consolidated financial statements ” ). We also have audited the Company ’ s internal control over financial reporting as of December 31, 2024, based on criteria established in Internal Control - Integrated Framework (2013) issued by the Committee of Sponsoring Organizations of the Treadway Commission (COSO).
In our opinion, the consolidated financial statements referred to above present fairly, in all material respects, the financial position of the Company as of December 31, 2024 and 2023, and the results of its operations and its cash flows for each of the three years in the period ended December 31, 2024 in conformity with International Financial Reporting Standards (IFRS Accounting Standards) as issued by the International Accounting Standards Board (IASB). Also in our opinion, the Company maintained, in all material respects, effective internal control over financial reporting as of December 31, 2024, based on criteria established in Internal Control - Integrated Framework (2013) issued by the COSO.
Basis for Opinions
The Company ’ s management is responsible for these consolidated financial statements, for maintaining effective internal control over financial reporting, and for its assessment of the effectiveness of internal control over financial reporting, included in Management ’ s Annual Report on Internal Control over Financial Reporting appearing under Item 15B. Our responsibility is to express opinions on the Company ’ s consolidated financial statements and on the Company ’ s internal control over financial reporting based on our audits. We are a public accounting firm registered with the Public Company Accounting Oversight Board (United States) (PCAOB) and are required to be independent with respect to the Company in accordance with the U.S. federal securities laws and the applicable rules and regulations of the Securities and Exchange Commission and the PCAOB.
We conducted our audits in accordance with the standards of the PCAOB. Those standards require that we plan and perform the audits to obtain reasonable assurance about whether the consolidated financial statements are free of material misstatement, whether due to error or fraud, and whether effective internal control over financial reporting was maintained in all material respects.
Our audits of the consolidated financial statements included performing procedures to assess the risks of material misstatement of the consolidated financial statements, whether due to error or fraud, and performing procedures that respond to those risks. Such procedures included examining, on a test basis, evidence regarding the amounts and disclosures in the consolidated financial statements. Our audits also included evaluating the accounting principles used and significant estimates made by management, as well as evaluating the overall presentation of the consolidated financial statements. Our audit of internal control over financial reporting included obtaining an understanding of internal control over financial reporting, assessing the risk that a material weakness exists, and testing and evaluating the design and operating effectiveness of internal control based on the assessed risk. Our audits also included performing such other procedures as we considered necessary in the circumstances. We believe that our audits provide a reasonable basis for our opinions.
Definition and Limitations of Internal Control over Financial Reporting
A company ’ s internal control over financial reporting is a process designed to provide reasonable assurance regarding the reliability of financial reporting and the preparation of financial statements for external purposes in accordance with generally accepted accounting principles. A company ’ s internal control over financial reporting includes those policies and procedures that (i) pertain to the maintenance of records that, in reasonable detail, accurately and fairly reflect the transactions and dispositions of the assets of the company; (ii) provide reasonable assurance that transactions are recorded as necessary to permit preparation of financial statements in accordance with generally accepted accounting principles, and that receipts and expenditures of the company are being made only in accordance with authorizations of management and directors of the company; and (iii) provide reasonable assurance regarding prevention or timely detection of unauthorized acquisition, use, or disposition of the company ’ s assets that could have a material effect on the financial statements.
Because of its inherent limitations, internal control over financial reporting may not prevent or detect misstatements. Also, projections of any evaluation of effectiveness to future periods are subject to the risk that controls may become inadequate because of changes in conditions, or that the degree of compliance with the policies or procedures may deteriorate.
F-2
Critical Audit Matter
The critical audit matter communicated below is a matter arising from the current period audit of the consolidated financial statements that was communicated or required to be communicated to the audit committee and that (i) relates to accounts or disclosures that are material to the consolidated financial statements and (ii) involved our especially challenging, subjective, or complex judgments. The communication of critical audit matters does not alter in any way our opinion on the consolidated financial statements, taken as a whole, and we are not, by communicating the critical audit matter below, providing a separate opinion on the critical audit matter or on the accounts or disclosures to which it relates.
Goodwill Impairment Assessment – Care Delivery and Care Enablement
As described in Notes 1g), 2a) and 12 to the consolidated financial statements, the Company ’ s consolidated goodwill balance as of December 31, 2024 was € 15,170,652k, thereof € 2,155,727k related to the group of cash generating units ( “ CGUs ” ) that comprise the Care Enablement segment and € 13,014,925k related to the group of CGUs that comprise the Care Delivery segment. Management conducts an impairment test as of October 1 of each year, or more frequently if events or circumstances indicate that the carrying value of goodwill may be impaired. Management identified its groups of CGUs and determined their carrying value by assigning the operating assets and liabilities, including the existing goodwill and intangible assets, to those groups of CGUs. Groups of CGUs reflect the lowest level on which goodwill is monitored for internal management purposes. To comply with IFRS to determine possible impairments of these assets, the value in use of each group of CGUs is first compared to the group of CGUs ’ carrying amount. In cases where the value in use of the group of CGUs is less than its carrying amount and the fair value less cost of disposal is not estimated to be higher than the value in use, the difference is recorded as an impairment of the carrying amount of the group of CGUs. The value in use of each group of CGUs is determined using estimated future cash flows for the unit discounted by a pre-tax discount rate ( “ WACC ” ) specific to that group of CGUs.
The principal considerations for our determination that performing procedures relating to the goodwill impairment assessments of the Care Delivery and Care Enablement groups of CGUs is a critical audit matter are (i) the significant judgment by management when developing the value in use estimate of the Care Delivery and Care Enablement groups of CGUs, and (ii) a high degree of auditor judgement, subjectivity, and effort in performing procedures and evaluating management ’ s significant assumptions related to revenue growth rates, projected operating income margins, residual value growth rates, and the pre-tax discount rates; and (iii) the audit effort involved the use of professionals with specialized skill and knowledge.
Addressing the matter involved performing procedures and evaluating audit evidence in connection with forming our overall opinion on the consolidated financial statements. These procedures included testing the effectiveness of controls relating to management ’ s goodwill impairment assessments, including controls over the valuation of the Company ’ s groups of CGUs. These procedures also included, among others (i) testing management ’ s process for developing the value in use estimate of the Care Delivery and Care Enablement groups of CGUs; (ii) evaluating the appropriateness of the discounted cash flow model used by management; (iii) testing the completeness and accuracy of underlying data used in the discounted cash flow model; and (iv) evaluating the reasonableness of the significant assumptions used by management related to revenue growth rates, projected operating income margins, residual value growth rates, and the pre-tax discount rates. Evaluating management ’ s assumptions related to revenue growth rates and projected operating income margins involved evaluating whether the assumptions used by management were reasonable considering (i) the current and past performance of the Care Delivery and Care Enablement groups of CGUs; (ii) the consistency with external market and industry data; and (iii) whether the assumptions were consistent with evidence obtained in other areas of the audit. Professionals with specialized skill and knowledge were used to assist in evaluating the appropriateness of the Company ’ s valuation model and the pre-tax discount rate for both groups of CGUs.
February 25, 2025
Wirtschaftspr ü fungsgesellschaft
We have served as the Company ’ s auditor since 2020.
F-3
FRESENIUS MEDICAL CARE AG
|
Consolidated statements of income |
|
|
|
|
|
|
|
|
|
in € thousands (THOUS), except per share data |
|
|
|
|
|
|
|
|
|
|
|
Note |
|
2024 |
|
2023 |
|
2022 |
|
Revenue: |
|
|
|
|
|
|
|
|
|
Health care services |
|
5 a, 29 |
|
|
|
|
|
|
|
Health care products |
|
5 a, 29 |
|
|
|
|
|
|
|
|
|
5 a, 29 |
|
|
|
|
|
|
|
|
|
|
|
|
|
|
|
|
|
Costs of revenue: |
|
|
|
|
|
|
|
|
|
Health care services |
|
|
|
|
|
|
|
|
|
Health care products |
|
|
|
|
|
|
|
|
|
|
|
|
|
|
|
|
|
|
|
|
|
|
|
|
|
|
|
|
|
Operating (income) expenses: |
|
|
|
|
|
|
|
|
|
Selling, general and administrative |
|
5 b |
|
|
|
|
|
|
|
Research and development |
|
|
|
|
|
|
|
|
|
Income from equity method investees |
|
29 |
|
(
|
|
(
|
|
(
|
|
Other operating income |
|
5 e |
|
(
|
|
(
|
|
(
|
|
Other operating expense |
|
5 e |
|
|
|
|
|
|
|
Remeasurement Gain from Interwell Health |
|
|
|
— |
|
— |
|
(
|
|
Operating income |
|
|
|
|
|
|
|
|
|
|
|
|
|
|
|
|
|
|
|
Other (income) expense: |
|
|
|
|
|
|
|
|
|
Interest income |
|
5 f |
|
(
|
|
(
|
|
(
|
|
Interest expense |
|
5 f |
|
|
|
|
|
|
|
|
|
|
|
|
|
|
|
|
|
Income before income taxes |
|
|
|
|
|
|
|
|
|
Income tax expense |
|
5 g |
|
|
|
|
|
|
|
Net income |
|
|
|
|
|
|
|
|
|
Net income attributable to noncontrolling interests |
|
|
|
|
|
|
|
|
|
Net income attributable to shareholders of FME AG |
|
|
|
|
|
|
|
|
|
|
|
|
|
|
|
|
|
|
|
Basic earnings per share |
|
22 |
|
|
|
|
|
|
|
Diluted earnings per share |
|
22 |
|
|
|
|
|
|
The following notes are an integral part of the consolidated financial statements.
F-4
FRESENIUS MEDICAL CARE AG
|
Consolidated statements of comprehensive income |
|
|
|
|
|
|
|
|
|
in € THOUS |
|
|
|
|
|
|
|
|
|
|
|
Note |
|
2024 |
|
2023 |
|
2022 |
|
|
|
|
|
|
|
|
|
|
|
Net income |
|
|
|
|
|
|
|
|
|
Other comprehensive income (loss): |
|
|
|
|
|
|
|
|
|
Components that will not be reclassified to profit or loss: |
|
|
|
|
|
|
|
|
|
Equity method investees - share of OCI |
|
27 |
|
— |
|
— |
|
|
|
FVOCI equity investments |
|
27 |
|
(
|
|
|
|
|
|
Actuarial gain (loss) on defined benefit pension plans |
|
19, 27 |
|
|
|
(
|
|
|
|
Income tax (expense) benefit related to components of other comprehensive income not reclassified |
|
27 |
|
(
|
|
|
|
(
|
|
|
|
|
|
(
|
|
(
|
|
|
|
Components that may be reclassified subsequently to profit or loss: |
|
|
|
|
|
|
|
|
|
Gain (loss) related to foreign currency translation, net of reclassification adjustments resulting from deconsolidation |
|
27 |
|
|
|
(
|
|
|
|
FVOCI debt securities |
|
27 |
|
(
|
|
|
|
(
|
|
Gain (loss) related to cash flow hedges |
|
26, 27 |
|
(
|
|
(
|
|
|
|
Cost of hedging |
|
27 |
|
|
|
(
|
|
(
|
|
Income tax (expense) benefit related to components of other comprehensive income that may be reclassified |
|
27 |
|
|
|
|
|
|
|
|
|
|
|
|
|
(
|
|
|
|
Other comprehensive income (loss), net of tax |
|
|
|
|
|
(
|
|
|
|
Total comprehensive income |
|
|
|
|
|
|
|
|
|
|
|
|
|
|
|
|
|
|
|
Comprehensive income attributable to noncontrolling interests |
|
|
|
|
|
|
|
|
|
Comprehensive income (loss) attributable to shareholders of FME AG |
|
|
|
|
|
(
|
|
|
The following notes are an integral part of the consolidated financial statements.
F-5
FRESENIUS MEDICAL CARE AG
|
Consolidated balance sheets |
|
|
|
|
|
|
|
in € THOUS, except share data |
|
|
|
|
|
|
|
|
|
Note |
|
2024 |
|
2023 |
|
|
|
|
|
|
|
|
|
Assets |
|
|
|
|
|
|
|
Cash and cash equivalents |
|
7 |
|
|
|
|
|
Trade accounts and other receivables from unrelated parties |
|
8 |
|
|
|
|
|
Accounts receivable from related parties |
|
6 |
|
|
|
|
|
Inventories |
|
9 |
|
|
|
|
|
Other current assets |
|
10 |
|
|
|
|
|
Other current financial assets |
|
10 |
|
|
|
|
|
Assets held for sale |
|
4 |
|
|
|
|
|
Total current assets |
|
|
|
|
|
|
|
|
|
|
|
|
|
|
|
Property, plant and equipment |
|
11 |
|
|
|
|
|
Right-of-use assets |
|
24 |
|
|
|
|
|
Intangible assets |
|
12 |
|
|
|
|
|
Goodwill |
|
12 |
|
|
|
|
|
Deferred taxes |
|
5 g |
|
|
|
|
|
Investment in equity method investees |
|
13 |
|
|
|
|
|
Other non-current assets |
|
|
|
|
|
|
|
Other non-current financial assets |
|
14 |
|
|
|
|
|
Total non-current assets |
|
|
|
|
|
|
|
Total assets |
|
|
|
|
|
|
|
|
|
|
|
|
|
|
|
Liabilities |
|
|
|
|
|
|
|
Accounts payable to unrelated parties |
|
|
|
|
|
|
|
Accounts payable to related parties |
|
6 |
|
|
|
|
|
Current provisions and other current liabilities |
|
15 |
|
|
|
|
|
Other current financial liabilities |
|
15 |
|
|
|
|
|
Short-term debt from unrelated parties |
|
16 |
|
|
|
|
|
Current portion of long-term debt |
|
17 |
|
|
|
|
|
Current portion of lease liabilities from unrelated parties |
|
|
|
|
|
|
|
Current portion of lease liabilities from related parties |
|
6 |
|
|
|
|
|
Income tax liabilities |
|
|
|
|
|
|
|
Liabilities directly associated with assets held for sale |
|
4 |
|
|
|
|
|
Total current liabilities |
|
|
|
|
|
|
|
Long-term debt, less current portion |
|
17 |
|
|
|
|
|
Lease liabilities from unrelated parties, less current portion |
|
|
|
|
|
|
|
Lease liabilities from related parties, less current portion |
|
6 |
|
|
|
|
|
Non-current provisions and other non-current liabilities |
|
18 |
|
|
|
|
|
Other non-current financial liabilities |
|
18 |
|
|
|
|
|
Pension liabilities |
|
19 |
|
|
|
|
|
Income tax liabilities |
|
|
|
|
|
|
|
Deferred taxes |
|
5 g |
|
|
|
|
|
Total non-current liabilities |
|
|
|
|
|
|
|
Total liabilities |
|
|
|
|
|
|
|
|
|
|
|
|
|
|
|
Shareholders’ equity: |
|
|
|
|
|
|
|
Ordinary shares, no par value, €
|
|
20 |
|
|
|
|
|
Additional paid-in capital |
|
20 |
|
|
|
|
|
Retained earnings |
|
20 |
|
|
|
|
|
Accumulated other comprehensive income (loss) |
|
27 |
|
(
|
|
(
|
|
Total FME AG shareholders’ equity |
|
|
|
|
|
|
|
Noncontrolling interests |
|
20 |
|
|
|
|
|
Total equity |
|
|
|
|
|
|
|
Total liabilities and equity |
|
|
|
|
|
|
The following notes are an integral part of the consolidated financial statements.
F-6
FRESENIUS MEDICAL CARE AG
|
Consolidated statements of cash flows |
|
|
|
|
|
|
||
|
in € THOUS |
|
|
|
|
|
|
|
|
|
|
|
|
|
For the twelve months ended December 31, |
||||
|
|
|
Note |
|
2024 |
|
2023 |
|
2022 |
|
|
|
|
|
|
|
|
|
|
|
Operating activities |
|
|
|
|
|
|
|
|
|
Net income |
|
|
|
|
|
|
|
|
|
Adjustments to reconcile net income to net cash provided by operating activities: |
|
|
|
|
|
|
|
|
|
Depreciation, amortization and impairment loss |
|
11, 12, 24, 29 |
|
|
|
|
|
|
|
Change in deferred taxes, net |
|
|
|
(
|
|
(
|
|
(
|
|
(Gain) loss from the sale of fixed assets, right-of-use assets, investments and divestitures |
|
|
|
(
|
|
(
|
|
(
|
|
Income from equity method investees |
|
|
|
(
|
|
(
|
|
(
|
|
Interest expense, net |
|
5 f |
|
|
|
|
|
|
|
Changes in assets and liabilities, net of amounts from businesses acquired: |
|
|
|
|
|
|
|
|
|
Trade accounts and other receivables from unrelated parties |
|
|
|
(
|
|
(
|
|
(
|
|
Inventories |
|
|
|
|
|
(
|
|
(
|
|
Other current and non-current assets |
|
|
|
(
|
|
|
|
|
|
Accounts receivable from related parties |
|
|
|
|
|
(
|
|
|
|
Accounts payable to related parties |
|
|
|
(
|
|
(
|
|
(
|
|
Accounts payable to unrelated parties, provisions and other current and non-current liabilities |
|
|
|
|
|
|
|
(
|
|
Income tax liabilities |
|
|
|
|
|
|
|
|
|
Received dividends from investments in equity method investees |
|
|
|
|
|
|
|
|
|
Paid interest |
|
|
|
(
|
|
(
|
|
(
|
|
Received interest |
|
|
|
|
|
|
|
|
|
Paid income taxes |
|
|
|
(
|
|
(
|
|
(
|
|
Net cash provided by (used in) operating activities |
|
|
|
|
|
|
|
|
|
Investing activities |
|
|
|
|
|
|
|
|
|
Purchases of property, plant and equipment and capitalized development costs |
|
|
|
(
|
|
(
|
|
(
|
|
Acquisitions, net of cash acquired, investments and purchases of intangible assets |
|
3, 28 |
|
(
|
|
(
|
|
(
|
|
Investments in debt securities |
|
3 |
|
(
|
|
(
|
|
(
|
|
Proceeds from sale of property, plant and equipment |
|
|
|
|
|
|
|
|
|
Proceeds from divestitures, net of cash disposed |
|
3, 28 |
|
|
|
|
|
|
|
Proceeds from sale of debt securities |
|
3 |
|
|
|
|
|
|
|
Net cash provided by (used in) investing activities |
|
|
|
(
|
|
(
|
|
(
|
|
Financing activities |
|
|
|
|
|
|
|
|
|
Proceeds from short-term debt from unrelated parties |
|
|
|
|
|
|
|
|
|
Repayments of short-term debt from unrelated parties |
|
|
|
(
|
|
(
|
|
(
|
|
Proceeds from short-term debt from related parties |
|
|
|
— |
|
|
|
|
|
Repayments of short-term debt from related parties |
|
|
|
— |
|
(
|
|
(
|
|
Proceeds from long-term debt |
|
|
|
|
|
|
|
|
|
Repayments of long-term debt |
|
|
|
(
|
|
(
|
|
(
|
|
Repayments of lease liabilities from unrelated parties |
|
|
|
(
|
|
(
|
|
(
|
|
Repayments of lease liabilities from related parties |
|
|
|
(
|
|
(
|
|
(
|
|
Increase (decrease) of accounts receivable facility |
|
|
|
(
|
|
(
|
|
|
|
Proceeds from exercise of stock options |
|
|
|
— |
|
— |
|
|
|
Dividends paid |
|
20 |
|
(
|
|
(
|
|
(
|
|
Distributions to noncontrolling interests |
|
|
|
(
|
|
(
|
|
(
|
|
Contributions from noncontrolling interests |
|
|
|
|
|
|
|
|
|
Net cash provided by (used in) financing activities |
|
|
|
(
|
|
(
|
|
(
|
|
Effect of exchange rate changes on cash and cash equivalents |
|
|
|
|
|
(
|
|
(
|
|
Cash and cash equivalents: |
|
|
|
|
|
|
|
|
|
Net increase (decrease) in cash and cash equivalents |
|
|
|
(
|
|
|
|
(
|
|
Cash and cash equivalents at beginning of period |
|
|
|
|
|
|
|
|
|
Cash and cash equivalents at end of period |
|
7 |
|
|
|
|
|
|
|
Thereof: cash and cash equivalents within the disposal groups |
|
4 |
|
|
|
|
|
— |
The following notes are an integral part of the consolidated financial statements.
F-7
FRESENIUS MEDICAL CARE AG
|
Consolidated statements of shareholders´ equity |
|
|
|
|
|
|
|
|
|
|
|
|
|
|
|
|
|
|
|
|
|
|
|
|
|
in € THOUS, except share data |
|
|
|
|
|
|
|
|
|
|
|
Accumulated |
|
|
|
|
|
|
||||||
|
|
|
|
|
Ordinary shares |
|
|
|
|
|
other comprehensive income (loss) |
|
|
|
|
|
|
||||||||
|
|
|
|
|
|
|
|
|
Additional |
|
|
|
Foreign |
|
|
|
|
|
|
|
Total FME AG |
|
|
|
|
|
|
|
|
|
Number of |
|
|
|
paid-in |
|
Retained |
|
currency |
|
Cash flow |
|
|
|
Fair value |
|
shareholders’ |
|
Noncontrolling |
|
|
|
|
|
Note |
|
shares |
|
No par value |
|
capital |
|
earnings |
|
translation |
|
hedges |
|
Pensions |
|
changes |
|
equity |
|
interests |
|
Total equity |
|
Balance at December 31, 2021 |
|
|
|
|
|
|
|
|
|
|
|
(
|
|
(
|
|
(
|
|
|
|
|
|
|
|
|
|
|
|
|
|
|
|
|
|
|
|
|
|
|
|
|
|
|
|
|
|
|
|
|
|
|
|
Proceeds from exercise of options and related tax effects |
|
23 |
|
|
|
|
|
|
|
— |
|
— |
|
— |
|
— |
|
— |
|
|
|
— |
|
|
|
Dividends paid |
|
20 |
|
— |
|
— |
|
— |
|
(
|
|
— |
|
— |
|
— |
|
— |
|
(
|
|
— |
|
(
|
|
Transactions with noncontrolling interests without loss of control |
|
|
|
— |
|
— |
|
|
|
— |
|
— |
|
— |
|
— |
|
— |
|
|
|
|
|
|
|
Noncontrolling interests due to changes in consolidation group |
|
|
|
— |
|
— |
|
— |
|
— |
|
— |
|
— |
|
— |
|
— |
|
— |
|
|
|
|
|
Contributions from/ to noncontrolling interests |
|
|
|
— |
|
— |
|
— |
|
— |
|
— |
|
— |
|
— |
|
— |
|
— |
|
(
|
|
(
|
|
Put option liabilities |
|
26 |
|
— |
|
— |
|
— |
|
(
|
|
— |
|
— |
|
— |
|
— |
|
(
|
|
— |
|
(
|
|
Transfer of cumulative gains/losses of equity investments |
|
26 |
|
— |
|
— |
|
— |
|
|
|
— |
|
— |
|
— |
|
(
|
|
— |
|
— |
|
— |
|
Net Income |
|
|
|
— |
|
— |
|
— |
|
|
|
— |
|
— |
|
— |
|
— |
|
|
|
|
|
|
|
Other comprehensive income (loss) related to: |
|
|
|
|
|
|
|
|
|
|
|
|
|
|
|
|
|
|
|
|
|
|
|
|
|
Foreign currency translation, net of reclassification adjustments resulting from deconsolidation |
|
5 e, 27 |
|
— |
|
— |
|
— |
|
— |
|
|
|
(
|
|
(
|
|
|
|
|
|
|
|
|
|
Cash flow hedges, net of related tax effects |
|
27 |
|
— |
|
— |
|
— |
|
— |
|
— |
|
|
|
— |
|
— |
|
|
|
— |
|
|
|
Pensions, net of related tax effects |
|
19 |
|
— |
|
— |
|
— |
|
— |
|
— |
|
— |
|
|
|
— |
|
|
|
— |
|
|
|
Fair value changes, net of related tax effects |
|
27 |
|
— |
|
— |
|
— |
|
— |
|
— |
|
— |
|
— |
|
(
|
|
(
|
|
— |
|
(
|
|
Comprehensive income |
|
|
|
— |
|
— |
|
— |
|
— |
|
— |
|
— |
|
— |
|
— |
|
|
|
|
|
|
|
Balance at December 31, 2022 |
|
|
|
|
|
|
|
|
|
|
|
(
|
|
(
|
|
(
|
|
(
|
|
|
|
|
|
|
|
|
|
|
|
|
|
|
|
|
|
|
|
|
|
|
|
|
|
|
|
|
|
|
|
|
|
Proceeds from exercise of options and related tax effects |
|
23 |
|
— |
|
— |
|
(
|
|
— |
|
— |
|
— |
|
— |
|
— |
|
(
|
|
— |
|
(
|
|
Dividends paid |
|
20 |
|
— |
|
— |
|
— |
|
(
|
|
— |
|
— |
|
— |
|
— |
|
(
|
|
— |
|
(
|
|
Transactions with noncontrolling interests without loss of control |
|
20 |
|
— |
|
— |
|
|
|
— |
|
— |
|
— |
|
— |
|
— |
|
|
|
(
|
|
(
|
|
Noncontrolling interests due to changes in consolidation group |
|
20 |
|
— |
|
— |
|
— |
|
— |
|
— |
|
— |
|
— |
|
— |
|
— |
|
(
|
|
(
|
|
Contributions from/ to noncontrolling interests |
|
|
|
— |
|
— |
|
— |
|
— |
|
— |
|
— |
|
— |
|
— |
|
— |
|
(
|
|
(
|
|
Put option liabilities |
|
26 |
|
— |
|
— |
|
— |
|
|
|
— |
|
— |
|
— |
|
— |
|
|
|
— |
|
|
|
Transfer of cumulative gains/losses of equity investments |
|
26 |
|
— |
|
— |
|
— |
|
|
|
— |
|
— |
|
— |
|
(
|
|
— |
|
— |
|
— |
|
Net Income |
|
|
|
— |
|
— |
|
— |
|
|
|
— |
|
— |
|
— |
|
— |
|
|
|
|
|
|
|
Other comprehensive income (loss) related to: |
|
|
|
|
|
|
|
|
|
|
|
|
|
|
|
|
|
|
|
|
|
|
|
|
|
Foreign currency translation, net of reclassification adjustments resulting from deconsolidation |
|
5 e, 27 |
|
— |
|
— |
|
— |
|
— |
|
(
|
|
(
|
|
|
|
(
|
|
(
|
|
(
|
|
(
|
|
Cash flow hedges, net of related tax effects |
|
27 |
|
— |
|
— |
|
— |
|
— |
|
— |
|
(
|
|
— |
|
— |
|
(
|
|
— |
|
(
|
|
Pensions, net of related tax effects |
|
19 |
|
— |
|
— |
|
— |
|
— |
|
— |
|
— |
|
(
|
|
— |
|
(
|
|
— |
|
(
|
|
Fair value changes, net of related tax effects |
|
27 |
|
— |
|
— |
|
— |
|
— |
|
— |
|
— |
|
— |
|
|
|
|
|
— |
|
|
|
Comprehensive income |
|
|
|
— |
|
— |
|
— |
|
— |
|
— |
|
— |
|
— |
|
— |
|
(
|
|
|
|
|
|
Balance at December 31, 2023 |
|
|
|
|
|
|
|
|
|
|
|
(
|
|
(
|
|
(
|
|
(
|
|
|
|
|
|
|
|
Dividends paid |
|
20 |
|
— |
|
— |
|
— |
|
(
|
|
— |
|
— |
|
— |
|
— |
|
(
|
|
— |
|
(
|
|
Transactions with noncontrolling interests without loss of control |
|
20 |
|
— |
|
— |
|
(
|
|
— |
|
— |
|
— |
|
— |
|
— |
|
(
|
|
(
|
|
(
|
|
Noncontrolling interests due to changes in consolidation group |
|
20 |
|
— |
|
— |
|
— |
|
— |
|
— |
|
— |
|
— |
|
— |
|
— |
|
(
|
|
(
|
|
Contributions from/ to noncontrolling interests |
|
20 |
|
— |
|
— |
|
— |
|
— |
|
— |
|
— |
|
— |
|
— |
|
— |
|
(
|
|
(
|
|
Put option liabilities |
|
3, 26 |
|
— |
|
— |
|
— |
|
|
|
— |
|
— |
|
— |
|
— |
|
|
|
— |
|
|
|
Net Income |
|
|
|
— |
|
— |
|
— |
|
|
|
— |
|
— |
|
— |
|
— |
|
|
|
|
|
|
|
Other comprehensive income (loss) related to: |
|
|
|
|
|
|
|
|
|
|
|
|
|
|
|
|
|
|
|
|
|
|
|
|
|
Foreign currency translation, net of reclassification adjustments resulting from deconsolidation |
|
5 e, 27 |
|
— |
|
— |
|
— |
|
— |
|
|
|
(
|
|
(
|
|
(
|
|
|
|
|
|
|
|
Cash flow hedges, net of related tax effects |
|
27 |
|
— |
|
— |
|
— |
|
— |
|
— |
|
(
|
|
— |
|
— |
|
(
|
|
— |
|
(
|
|
Pensions, net of related tax effects |
|
19 |
|
— |
|
— |
|
— |
|
— |
|
— |
|
— |
|
|
|
— |
|
|
|
— |
|
|
|
Fair value changes, net of related tax effects |
|
27 |
|
— |
|
— |
|
— |
|
— |
|
— |
|
— |
|
— |
|
(
|
|
(
|
|
— |
|
(
|
|
Comprehensive income |
|
|
|
— |
|
— |
|
— |
|
— |
|
— |
|
— |
|
— |
|
— |
|
|
|
|
|
|
|
Balance at December 31, 2024 |
|
|
|
|
|
|
|
|
|
|
|
(
|
|
(
|
|
(
|
|
(
|
|
|
|
|
|
|
The following notes are an integral part of the consolidated financial statements.
F-8
FRESENIUS MEDICAL CARE AG
NOTES TO THE CONSOLIDATED FINANCIAL STATEMENTS
(in THOUS, except share and per share data)
1. The Company, basis of presentation and significant accounting policies
The Company
Fresenius Medical Care AG (FME AG or the Company) is a German stock corporation (Aktiengesellschaft — AG) registered with the commercial register of Hof (Saale) under HRB 6841, with its business address at Else-Kröner-Str. 1, 61352 Bad Homburg v. d. Höhe, Germany. The Company is the world’s leading provider of products and services for individuals with renal diseases, based on publicly reported revenue and number of patients treated. The Company provides dialysis and related services for individuals with renal diseases as well as other health care services. The Company also develops, manufactures and distributes a wide variety of health care products. The Company’s health care products include hemodialysis machines, peritoneal dialysis cyclers, dialyzers, peritoneal dialysis solutions, hemodialysis concentrates, solutions and granulates, bloodlines, renal pharmaceuticals, systems for water treatment as well as acute cardiopulmonary and apheresis products. The Company supplies dialysis clinics it owns, operates or manages with a broad range of products and also sells dialysis products to other dialysis service providers. The Company’s other health care services include value and risk-based care programs, pharmacy services, vascular specialty services as well as ambulatory surgery center services, physician nephrology practice management and ambulant treatment services.
At an extraordinary general meeting (EGM) of the Company held on July 14, 2023, the shareholders of the Company approved a proposal to change the legal form of the Company from a partnership limited by shares (Kommanditgesellschaft auf Aktien – KGaA) into an AG (the Conversion). Upon effectiveness of the Conversion, which occurred upon registration of the Conversion with the competent commercial register on November 30, 2023, the Company’s former general partner exited the Company, Fresenius SE ceased to control (as defined by IFRS 10, Consolidated Financial Statements) the Company and the Company ceased to be a member of the Fresenius SE consolidated group. Fresenius SE continues to have significant influence over the Company.
In these notes, “FME AG,” the “Company” or the “Group” refers to Fresenius Medical Care AG or Fresenius Medical Care AG and its subsidiaries on a consolidated basis, as the context requires. “Fresenius SE” and “Fresenius SE & Co. KGaA” refer to Fresenius SE & Co. KGaA. “Management AG” and the “General Partner” refer to Fresenius Medical Care Management AG (renamed Fresenius Vermögensverwaltung AG), which was the Company’s general partner prior to the Conversion and is wholly owned by Fresenius SE. Management AG ceased to be a General Partner of the Company when the Conversion took effect. “Management Board” refers to the members of the management board of the Company (or of Management AG, prior to the Conversion) and, except as otherwise specified, “Supervisory Board” refers to the supervisory board of the Company.
The term “Care Enablement” refers to the Company’s Care Enablement operating segment and the term “Care Delivery” refers to the Care Delivery operating segment. Prior to January 1, 2023, discrete financial information was not provided to the chief operating decision maker on the basis of the new structure and the necessary system and reporting changes to effect the new structure were not in place. Due to the change in the Company’s operating structure, the Company has adjusted the prior year financial information for its operating segments in order to conform to the current year’s presentation. For further discussion of the Company’s operating and reportable segments, see note 29.
Basis of presentation
The consolidated financial statements and other financial information included in the Company’s Annual Report on Form 20-F are prepared solely in accordance with International Financial Reporting Standards (IFRS® Accounting Standards) as issued by the International Accounting Standards Board (IASB), using the euro as the Company’s reporting and functional currency. At December 31, 2024, there were no IFRS Accounting Standards or IFRS Interpretations Committee interpretations as endorsed by the European Union relevant for the Company’s reporting that differed from IFRS Accounting Standards as issued by the IASB.
F-9
FRESENIUS MEDICAL CARE AG
NOTES TO THE CONSOLIDATED FINANCIAL STATEMENTS
(in THOUS, except share and per share data)
The preparation of consolidated financial statements in conformity with IFRS Accounting Standards requires management to make estimates and assumptions that affect the reported amounts of assets and liabilities and disclosure of contingent assets and liabilities at the date of the consolidated financial statements and the reported amounts of revenues and expenses during the reporting period. Actual results could differ from those estimates. Such financial statements reflect all adjustments that, in the opinion of management, are necessary to provide a fair statement of the results of the periods presented. All such adjustments are of a normal recurring nature. Estimates and underlying assumptions are reviewed on an ongoing basis. Revisions to accounting estimates are recognized in the period in which the estimates are revised and in all future periods affected.
In order to improve clarity of presentation, various items are aggregated in the consolidated balance sheets and consolidated statements of income. These items are analyzed separately in the notes where this provides useful information to the users of the consolidated financial statements.
The consolidated balance sheets contain all information required to be disclosed by IAS 1, Presentation of Financial Statements (IAS 1) and is classified on the basis of the liquidity of assets and liabilities. The consolidated statements of income are classified using the cost-of-sales accounting format.
The Company applies IAS 29, Financial Reporting in Hyperinflationary Economies (IAS 29), in its Lebanese and Turkish subsidiaries due to inflation in these countries. The table below details the date of initial application of IAS 29 and the specific inputs used to calculate the gain or loss on net monetary position on a country-specific basis for the year ended December 31, 2024. The ongoing re-translation effects of hyperinflationary accounting and its impact on comparative amounts are recorded in other comprehensive income (loss) within the Company’s consolidated financial statements. The subsequent gains or losses on net monetary position are recorded in other operating income and other operating expense, respectively, within the Company’s consolidated statements of income and within other current and non-current assets within the Company’s consolidated statements of cash flows.
|
Inputs for the calculation of (gains) losses on net monetary positions |
|
||||
|
|
|
Lebanon |
|
Türkiye |
|
|
|
|
|
|
|
|
|
Date of IAS 29 initial application |
|
December 31, 2020 |
|
June 30, 2022 |
|
|
Consumer price index |
|
Central Administration of Statistics |
|
Turkish Statistical Institute |
|
|
Index at December 31, 2024 |
|
|
|
|
|
|
Calendar year increase |
|
|
% |
|
% |
|
(Gain) loss on net monetary position in € THOUS |
|
(
|
|
|
|
At February 24, 2025, the Management Board and Supervisory Board authorized the consolidated financial statements for issue.
Significant accounting policies
a) Principles of consolidation and composition of the group
The financial statements of consolidated entities have been prepared using uniform accounting methods in accordance with IFRS 10, Consolidated Financial Statements (IFRS 10). Acquisitions of companies are accounted for under the acquisition method.
Besides FME AG, the consolidated financial statements include all material subsidiaries according to IFRS 10 over which the Company has control. The Company controls an entity if it has power over the entity through existing rights that give the Company the current ability to direct the activities that significantly affect the entity’s return. In addition, the Company is exposed to, or has rights to, variable returns from the involvement with the entity and the Company has the ability to use its power over the entity to affect the amount of the Company’s return. In most cases, control is achieved when the Company has the majority of a subsidiary’s equity ownership and voting rights.
F-10
FRESENIUS MEDICAL CARE AG
NOTES TO THE CONSOLIDATED FINANCIAL STATEMENTS
(in THOUS, except share and per share data)
For certain subsidiaries in which the Company has the majority of the equity ownership and voting rights and does not consolidate, an assessment of materiality is made in order to determine that the subsidiary is insignificant to the Company’s results based on qualitative and quantitative factors. Such factors include quantitative analyses noting that the sum of these unconsolidated subsidiaries is less than
The equity method is applied in accordance with IAS 28, Investments in Associates and Joint Ventures (IAS 28). Generally, equity method investees are entities in which the Company, directly or indirectly, holds 50% or less of the voting power and can exercise significant influence over their financial and operating policies. For information on the Company’s investment in Vifor Fresenius Medical Care Renal Pharma Ltd., which makes up a large portion of its equity method investees, see note 13.
Acquisitions of companies are accounted for in accordance with IFRS 3, Business Combinations (IFRS 3) at the date of acquisition. Initially, all identifiable assets acquired and liabilities assumed as well as the noncontrolling interests, when applicable, are recognized at their fair values. The fair value of the consideration transferred is then compared with the fair value of the assets acquired and liabilities assumed. Any remaining balance is recognized as goodwill and is tested at least once a year for impairment. Generally, adjustments made to the fair value of identifiable assets and liabilities during the measurement period are recorded as an offset to goodwill. Any adjustments made subsequent to the measurement period are recognized immediately in profit or loss.
Intercompany revenues, expenses, income, receivables, payables, accruals, provisions and commitments and contingencies, are eliminated. Profits and losses on items of property, plant and equipment and inventory acquired from other group entities are also eliminated.
Deferred tax assets and liabilities are recognized due to temporary differences resulting from consolidation procedures.
Noncontrolling interest (NCI) is the portion of equity in a subsidiary not attributable, directly or indirectly, to a parent and is recognized at its fair value at the date of first consolidation using the full goodwill method. Profits and losses attributable to the noncontrolling interests are separately disclosed in the consolidated statements of income. Summarized financial information relating to our U.S.-based subsidiary, InterWell Topco L.P. (NewCo), in which the noncontrolling interest owners hold approximately
The Company writes put options on certain noncontrolling interests. A portion of these put options relate to dialysis clinics in which nephrologists or nephrology groups own an equity interest. In addition, as part of the transaction with Cricket Health, Inc. (Cricket), and InterWell Health LLC, the Company also granted put options to noncontrolling interest owners of the newly created value-based kidney care entity (see note 3 for further information). Generally, the put options associated with this business model are valid for an unlimited time. Accordingly, the put options represent a long-term investment into a dialysis clinic for the NCI holder. The put options provide for settlement in cash. For these put options, IAS 32, Financial Instruments: Presentation (IAS 32) paragraph 23 requires the Company to recognize a liability for the present value of the exercise price of the option. The put option liability is recorded in other current financial liabilities and other non-current financial liabilities at present value of the redemption amount at the balance sheet date. The Company believes the accounting treatment of the changes to the put option liability under IFRS Accounting Standards to this date has not been finally clarified. In the absence of IFRS Accounting Standards guidance specifically applicable to the accounting for put options on NCI, the Company, in line with IAS 8, Accounting Policies, Changes in Accounting Estimates and Errors (IAS 8) paragraph 10, applied the present access method. According to the present access method, NCI are recorded in equity when the risks and rewards of ownership reside with the NCI holders. The initial recognition of the put option liability, as well as valuation differences, is recorded in equity with no impact to the income statement (see note 1 h)). This presentation results in information that is relevant to the economic decision-making needs of the users of the Company’s financial statements and to provide reliable financial information as the Company considers these NCI with written put options as equity holders and accordingly attributes net income to NCI. For further information regarding the valuation of the put option liabilities, see note 26.
The consolidated financial statements for 2024 include FME AG as well as
F-11
FRESENIUS MEDICAL CARE AG
NOTES TO THE CONSOLIDATED FINANCIAL STATEMENTS
(in THOUS, except share and per share data)
The principal subsidiaries of the Company are those with the most significant contribution to the Company’s revenue, net income or net assets. The Company’s interest in these subsidiaries for the years ended December 31, 2024 and 2023 are listed in the table below:
|
Principal subsidiaries |
|
||||||
|
Name |
|
Country |
|
Main activity |
|
Ownership |
|
|
|
|
|
|
|
|
|
|
|
Fresenius Medical Care Australia Pty. Ltd. |
|
Australia |
|
Provision of health care services |
|
|
% |
|
|
|
|
|
Sale of health care products |
|
|
|
|
Fresenius Medical Care Colombia S.A. (1) |
|
Colombia |
|
Provision of health care services |
|
|
% |
|
Fresenius Medical Care Deutschland GmbH |
|
Germany |
|
Sale of health care products |
|
|
% |
|
|
|
|
|
Production of health care products |
|
|
|
|
|
|
|
|
Research and development |
|
|
|
|
Fresenius Medical Care France S.A.S. |
|
France |
|
Sale of health care products |
|
|
% |
|
Fresenius Medical Care GmbH |
|
Germany |
|
Sale of health care products |
|
|
% |
|
Fresenius Medical Care Holdings, Inc. (FMCH) |
|
USA |
|
Provision of health care services |
|
|
% |
|
|
|
|
|
Sale of health care products |
|
|
|
|
|
|
|
|
Production of health care products |
|
|
|
|
|
|
|
|
Research and development |
|
|
|
|
Fresenius Medical Care Italia S.p.A. |
|
Italy |
|
Sale of health care products |
|
|
% |
|
Fresenius Medical Care Korea Ltd. |
|
South Korea |
|
Sale of health care products |
|
|
% |
|
Fresenius Medical Care Ltda. |
|
Brazil |
|
Sale of health care products |
|
|
% |
|
Fresenius Medical Care Shanghai Ltd. |
|
China |
|
Sale of health care products |
|
|
% |
|
Fresenius Medical Care (U.K.) Ltd. |
|
United Kingdom |
|
Provision of health care services |
|
|
% |
|
|
|
|
|
Sale of health care products |
|
|
|
|
|
|
|
|
Production of health care products |
|
|
|
|
National Medical Care of Spain, S.A.U. |
|
Spain |
|
Provision of health care services |
|
|
% |
|
NephroCare Portugal, S.A. |
|
Portugal |
|
Provision of health care services |
|
|
% |
|
|
|
|
|
Sale of health care products |
|
|
|
| (1) | Divested in December 2024. |
The complete list of participations in affiliated and associated companies of FME AG will be submitted to the electronic companies register.
F-12
FRESENIUS MEDICAL CARE AG
NOTES TO THE CONSOLIDATED FINANCIAL STATEMENTS
(in THOUS, except share and per share data)
For 2024, the following fully consolidated German subsidiaries of the Company will apply the exemption provided in Section 264 (3) or Section 264b of the HGB and therefore will be exempt from applying certain legal requirements to prepare notes to the statutory standalone financial statements and a management report as well as the requirements of an independent audit and public disclosure.
|
Companies exempt from applying certain legal requirements |
|
|
|
|
Name of the company |
|
Registered office of the company |
|
|
|
|
|
|
|
DiZ München Nephrocare GmbH |
|
Munich, Germany |
|
|
ET Software Developments GmbH |
|
Heidelberg, Germany |
|
|
Fresenius Medical Care Beteiligungsgesellschaft mbH |
|
Bad Homburg v. d. Höhe, Germany |
|
|
Fresenius Medical Care Data Solutions GmbH |
|
Berlin, Germany |
|
|
Fresenius Medical Care Deutschland GmbH |
|
Bad Homburg v. d. Höhe, Germany |
|
|
Fresenius Medical Care GmbH |
|
Bad Homburg v. d. Höhe, Germany |
|
|
Fresenius Medical Care Investment GmbH |
|
Bad Homburg v. d. Höhe, Germany |
|
|
Fresenius Medical Care US Vermögensverwaltungs GmbH & Co. KG |
|
Bad Homburg v. d. Höhe, Germany |
|
|
Fresenius Medical Care US Zwei Vermögensverwaltungs GmbH & Co. KG |
|
Bad Homburg v. d. Höhe, Germany |
|
|
Fresenius Medical Care Ventures GmbH |
|
Bad Homburg v. d. Höhe, Germany |
|
|
MVZ Gelsenkirchen-Buer GmbH |
|
Gelsenkirchen, Germany |
|
|
Nephrocare Ahrensburg GmbH |
|
Ahrensburg, Germany |
|
|
Nephrocare Augsburg GmbH |
|
Augsburg, Germany |
|
|
Nephrocare Berlin-Weißensee GmbH |
|
Berlin, Germany |
|
|
Nephrocare Betzdorf GmbH |
|
Betzdorf, Germany |
|
|
Nephrocare Bielefeld GmbH |
|
Bielefeld, Germany |
|
|
Nephrocare Buchholz GmbH |
|
Buchholz, Germany |
|
|
Nephrocare Daun GmbH |
|
Daun, Germany |
|
|
Nephrocare Deutschland GmbH |
|
Bad Homburg v. d. Höhe, Germany |
|
|
Nephrocare Döbeln GmbH |
|
Döbeln, Germany |
|
|
Nephrocare Dortmund GmbH |
|
Dortmund, Germany |
|
|
Nephrocare Friedberg GmbH |
|
Friedberg, Germany |
|
|
Nephrocare Grevenbroich GmbH |
|
Grevenbroich, Germany |
|
|
Nephrocare Hagen GmbH |
|
Hagen, Germany |
|
|
Nephrocare Hamburg-Altona GmbH |
|
Hamburg, Germany |
|
|
Nephrocare Hamburg-Barmbek GmbH |
|
Hamburg, Germany |
|
|
Nephrocare Hamburg-Süderelbe GmbH |
|
Hamburg, Germany |
|
|
Nephrocare Ingolstadt GmbH |
|
Ingolstadt, Germany |
|
|
Nephrocare Kaufering GmbH |
|
Kaufering, Germany |
|
|
Nephrocare Krefeld GmbH |
|
Krefeld, Germany |
|
|
Nephrocare Lahr GmbH |
|
Lahr, Germany |
|
|
Nephrocare Leverkusen GmbH |
|
Leverkusen, Germany |
|
|
Nephrocare Ludwigshafen GmbH |
|
Ludwigshafen am Rhein, Germany |
|
|
Nephrocare Mettmann GmbH |
|
Mettmann, Germany |
|
|
Nephrocare Mönchengladbach GmbH |
|
Mönchengladbach, Germany |
|
|
Nephrocare Mühlhausen GmbH |
|
Mühlhausen, Germany |
|
|
Nephrocare München-Ost GmbH |
|
Munich, Germany |
|
|
Nephrocare Münster GmbH |
|
Münster, Germany |
|
|
Nephrocare MVZ Aalen GmbH |
|
Aalen, Germany |
|
|
Nephrocare Oberhausen GmbH |
|
Oberhausen, Germany |
|
|
Nephrocare Papenburg GmbH |
|
Papenburg, Germany |
|
|
Nephrocare Pirmasens GmbH |
|
Pirmasens, Germany |
|
|
Nephrocare Püttlingen GmbH |
|
Püttlingen, Germany |
|
|
Nephrocare Recklinghausen GmbH |
|
Recklinghausen, Germany |
|
|
Nephrocare Rostock GmbH |
|
Rostock, Germany |
|
|
Nephrocare Salzgitter GmbH |
|
Salzgitter, Germany |
|
|
Nephrocare Schrobenhausen GmbH |
|
Schrobenhausen, Germany |
|
|
Nephrocare Schwandorf-Regenstauf GmbH |
|
Schwandorf, Germany |
|
|
Nephrocare Wetzlar GmbH |
|
Wetzlar, Germany |
|
|
Nephrocare Witten GmbH |
|
Witten, Germany |
|
|
Nephrologisch-Internistische Versorgung Ingolstadt GmbH |
|
Ingolstadt, Germany |
|
|
Nova Med GmbH Vertriebsgesellschaft für medizinischtechnische Geräte und Verbrauchsartikel |
|
Bad Homburg v. d. Höhe, Germany |
|
|
ProCure Medical GmbH |
|
Bad Homburg v. d. Höhe, Germany |
|
|
VIVONIC GmbH |
|
Sailauf, Germany |
|
b) Cash and cash equivalents
Cash and cash equivalents comprise cash funds and all short-term investments (measured at fair value through profit and loss) with original maturities of up to three months. Short-term investments are highly liquid and readily convertible into known amounts of cash. The risk of changes in value is insignificant.
c) Trade accounts and other receivables from unrelated parties
Trade accounts and other receivables from unrelated parties are recognized initially at fair value and subsequently at amortized cost. For information regarding expected credit losses, see note 2 c).
F-13
FRESENIUS MEDICAL CARE AG
NOTES TO THE CONSOLIDATED FINANCIAL STATEMENTS
(in THOUS, except share and per share data)
The Company provides reinsurance to a health care insurer of end-stage renal diseases and has entered into renal care coordination agreements to arrange and provide health care services to patients with chronic kidney disease (CKD). The Company accounts for both its reinsurance contract and renal care coordination agreement as insurance contracts, classified as separate portfolios, under IFRS 17.
Premium revenue is received throughout the year based on claims experience. For both insurance and reinsurance portfolios, the Company applies the premium allocation approach (PAA) under IFRS 17 as the contract boundary of the cash flows is one year or less. On initial recognition of the liabilities for incurred claims, the estimation and valuation processes remain unchanged as compared to the application of IFRS 4, Insurance Contracts (IFRS 4). The subsequent measurement of insurance liabilities is based on the estimated cost of settling the claims incurred, but not yet recorded (IBNR). IBNR is estimated using actual paid claim data and applying historical claim completion factors, which may include the effects of both inflationary and socio-economic factors as well as using past experience adjusted for current trends and any other factors that would modify past experience. Regarding the measurement of the liabilities for the remaining coverage, the liabilities are equal to the premiums received less any insurance acquisition cash flows. Any insurance acquisition cash flows will be expensed when incurred. The Company does not consider the effects and time value of money when measuring the liabilities for the remaining coverage as the related cash flows are expected to be paid or received within one year or less from the date the claims are incurred. The Company does not receive any premiums in advance. As a result, the liabilities for the remaining coverage is
The Company has applied the modified retrospective approach at the date of transition due to the impracticability of collecting cash flow estimations and risk adjustments for non-financial risk at the date of initial recognition of the reinsurance contract. Insurance premium revenues are recognized based upon the passage of time, therefore the pattern of revenue recognition has not changed with the application of IFRS 17. For additional information see note 5 a) and note 8.
d) Inventories
Inventories are stated at the lower of cost (determined by using the average or first-in, first-out method) or net realizable value (see note 9). Costs included in inventories are based on invoiced costs and/or production costs as applicable. Included in production costs are material, direct labor and production overhead and applicable depreciation charges.
e) Property, plant and equipment
Property, plant and equipment are stated at cost less accumulated depreciation (see note 11). Maintenance and repair costs (day-to-day servicing) are expensed as incurred. The Company recognizes in the carrying amount of an item of property, plant and equipment the cost of replacing parts and major inspections if it is probable that the future economic benefits associated with the item will flow to the Company and the cost can be measured reliably. Depreciation on property, plant and equipment is calculated using the straight-line method over the estimated useful lives of the assets ranging from
f) Leases
A lease is defined as a contract that conveys the right to use an underlying asset for a period of time in exchange for consideration. According to IFRS 16, a contract is or contains a lease if:
| ● | the underlying asset is identified in the contract, and |
| ● | the customer has both the right to direct the identified asset’s use and to obtain substantially all the economic benefits from that use. |
Under IFRS 16, the Company is required to recognize a right-of-use asset representing its right to use the underlying asset and a lease liability representing its obligation to make lease payments for almost all leases.
F-14
FRESENIUS MEDICAL CARE AG
NOTES TO THE CONSOLIDATED FINANCIAL STATEMENTS
(in THOUS, except share and per share data)
The Company applies both the short-term and low-value lease exemption. These leases are exempt from balance sheet recognition and lease payments will be recognized as expenses over the lease term.
IFRS 16 is not applied to leases of intangible assets.
Lease liabilities
Lease liabilities are initially recognized at the present value of the following payments:
| ● | fixed lease payments (including in-substance fixed payments), less any lease incentives receivable, |
| ● | variable lease payments (linked to an index or interest rate), |
| ● | expected payments under residual value guarantees, |
| ● | the exercise price of purchase options, where exercise is reasonably certain, |
| ● | lease payments in optional renewal periods, where exercise of extension options is reasonably certain, and |
| ● | penalty payments for the termination of a lease, if the lease term reflects the exercise of the respective termination option. |
Lease payments are discounted using the implicit interest rate underlying the lease if this rate can be readily determined. Otherwise, the incremental borrowing rate of the lessee is used as the discount rate.
Lease liabilities are subsequently measured at amortized cost using the effective interest method. Furthermore, lease liabilities may be remeasured due to lease modifications or reassessments of the lease.
For lease contracts that include both lease and non-lease components that are not separable from lease components, no allocation is performed. Each lease component and any associated non-lease components are accounted for as a single lease. If the lease contracts include lease and non-lease costs that are separable, the lease contract costs are divided into lease and non-lease components.
Right-of-use assets
The Company recognizes right-of-use assets at the commencement date of the respective lease. Right-of-use assets are stated at cost less accumulated depreciation. Upon initial recognition, cost comprises of:
| ● | the initial lease liability amount, |
| ● | initial direct costs incurred when entering into the lease |
| ● | (lease) payments before commencement date of the respective lease, and |
| ● | less any lease incentives received. |
Right-of-use assets are depreciated over the shorter of the lease term or the useful life of the underlying asset using the straight-line method. Where a lease agreement includes a transfer of ownership at the end of the lease term or the exercise of a purchase option is deemed reasonably certain, right-of-use assets are depreciated over the useful life of the underlying asset using the straight-line method. In addition, right-of-use assets are reduced by impairment losses, if any, and adjusted for certain remeasurements.
Right-of-use assets are classified into right-of-use assets relating to land, buildings and improvements or machinery and equipment. In addition, prepayments on right-of-use assets are presented separately (see note 24).
F-15
FRESENIUS MEDICAL CARE AG
NOTES TO THE CONSOLIDATED FINANCIAL STATEMENTS
(in THOUS, except share and per share data)
g) Intangible assets and goodwill
Intangible assets such as non-compete agreements, technology, distribution agreements, patents, licenses to treat, licenses to manufacture, distribute and sell pharmaceutical drugs, exclusive contracts and exclusive licenses, trade names, management contracts, application software, acute care agreements, customer relationships and emission certificates are recognized and reported apart from goodwill (see note 12). If acquired, those intangible assets are recorded at estimated fair value at the date of the acquisition. Patient relationships, however, are not reported as separate intangible assets due to the missing contractual basis but are part of goodwill.
Expenditures related to application software, either hosted by the Company or within a software as a service arrangement, that fully meet the criteria for the recognition of an intangible asset set out in IAS 38, Intangible Assets (IAS 38) are capitalized as intangible assets.
Goodwill and identifiable intangibles with indefinite useful lives are not amortized but tested for impairment annually or when an event becomes known that could trigger an impairment. The Company identified certain trade names and qualified management contracts as intangible assets with indefinite useful lives because there is no foreseeable limit to the period over which those assets are expected to generate net cash inflows for the Company.
Intangible assets with finite useful lives are amortized over their respective useful lives to their residual values on a straight-line basis. The Company amortizes non-compete agreements over their useful lives which, on average, are
To perform the annual impairment test of goodwill, the Company identified its groups of cash generating units (CGUs) and determined their carrying value by assigning the operating assets and liabilities, including the existing goodwill and intangible assets, to those groups of CGUs. Groups of CGUs reflect the lowest level on which goodwill is monitored for internal management purposes.
For further information see note 2 a).
h) Financial instruments
The Company classifies its financial instruments in accordance with IFRS 9 in the following measurement categories: at amortized cost, at fair value through profit and loss (FVPL) and at fair value through other comprehensive income (FVOCI).
Financial assets are classified depending on the business model in which the financial assets are held and the contractual terms of the cash flows. Financial assets are only reclassified when the business model for managing those assets changes. During the reporting period, no financial instruments were reclassified. Purchases and sales of financial assets are recognized or derecognized on the trading date. The Company makes use of the fair value option, which allows financial instruments to be classified at FVPL upon initial recognition, in very rare cases. At initial recognition financial assets and financial liabilities are measured at fair value. Subsequent measurement is either at cost, FVPL or FVOCI.
In general, financial liabilities are classified and subsequently measured at amortized cost, with the exception of contingent consideration resulting from a business combination, put option liabilities as well as derivative financial liabilities. For debt instruments, accrued interest is included in the line items on the consolidated balance sheets where the borrowing is presented.
F-16
FRESENIUS MEDICAL CARE AG
NOTES TO THE CONSOLIDATED FINANCIAL STATEMENTS
(in THOUS, except share and per share data)
Investments in equity instruments are recognized and subsequently measured at fair value. The Company’s equity investments are not held for trading. In general, changes in the fair value of equity investments are recognized in the income statement. However, at initial recognition the Company elected, on an instrument-by-instrument basis, to represent subsequent changes in the fair value of individual strategic equity investments in other comprehensive income (loss) (OCI).
The Company invested in several debt securities, with the objective to achieve both collecting contractual cash flows and selling the financial assets. All debt securities are consequently measured at fair value. Some of these securities give rise on specified dates to cash flows that are solely payments of principal and interest. These securities are subsequently measured at FVOCI. Other securities are measured at FVPL.
The Company, as option writer of existing put options, can be obligated to purchase the noncontrolling interests held by third parties. The obligations are in the form of put liabilities and are exercisable at the third-party owners’ discretion within specified periods or upon the occurrence of certain events as outlined in each specific put option. If these put option liabilities were exercised, the Company would be required to purchase all or part of third-party owners’ noncontrolling interests at the appraised fair value at the time of exercise. The initial recognition and subsequent measurement are recognized in equity of the Company. For further information related to the estimation of these fair values, see note 26.
Certain put option arrangements contain contingent triggers based on changes in legislation, which the Company has concluded are not genuine using the guidance in IFRS 9 B4.1.18 and IAS 32.25. The Company considers this subset of contracts as being non-genuine as the trigger in these clauses is considered to be an event that is extremely rare, highly abnormal and very unlikely to occur. Therefore, the Company has not recorded a liability on the balance sheet relating to this subset of puts option contracts.
Derivative financial instruments which primarily include foreign currency forward contracts are recognized as assets or liabilities at fair value in the balance sheet (see note 26). From time to time, the Company may enter into other types of derivative instruments, such as interest rate swaps and derivatives embedded in Virtual Power Purchase Agreements (vPPAs), which are dealt with on a transaction-by-transaction basis.
Changes in the fair value of derivative financial instruments designated and qualifying as cash flow hedges are recognized in accumulated OCI (AOCI) in shareholders’ equity. The Company only designated the change in fair value of the spot element of foreign exchange forward contracts as the hedging instrument in cash flow hedging relationships and uses a hedge ratio for designated risks of 1:1. The forward elements are separately accounted for as cost of hedging in a separate component within AOCI. The ineffective portion of cash flow hedge is recognized in the income statement.
The amounts recorded in AOCI are subsequently reclassified into earnings as a component of revenue for those foreign exchange contracts, entered into with financial institutions, that hedge forecasted sales or as an adjustment of cost of revenue for those contracts that hedge forecasted intercompany product purchases. In connection with intercompany loans in foreign currency, the Company uses foreign exchange swaps with third parties to assure that no foreign exchange risks arise from those loans, which, if they qualify for cash flow hedge accounting, are also reported in AOCI and subsequently reclassified to other operating income or other operating expense. The amounts recorded in AOCI are reclassified in the same period in which the hedged transaction affects earnings. Amounts recorded in AOCI for cash flow hedges related to product purchases from third parties are removed from AOCI and included directly in the carrying amount of the asset at initial recognition. Product purchases and sales designated in a cash flow hedging relationship are expected to affect profit and loss in the same period in which the cash flows occur. The critical terms of the forward exchange contracts generally align with the hedged item. The economic relationship between forward exchange contracts and the hedged forecast transaction is based on the timing, currency and amount of the hedged cash flows. Ineffectiveness could arise in case the timing of the hedged transaction or the credit default risk changes.
From time to time, the Company enters into derivatives (particularly interest rate swaps and, to a certain extent, interest rate options) to protect against the risk of rising interest rates. When applicable, these interest rate derivatives are designated as cash flow hedges and have been entered into in order to effectively convert payments based on variable interest rates into payments at a fixed interest rate. The Company determines the existence of an economic relationship between the hedging instrument and hedged item based on the reference interest rates, maturities and the notional amounts. As applicable, the effective portion of gains and losses of derivatives designated as cash flow hedges is deferred in AOCI; the amount of gains and losses reclassified from AOCI are recorded in interest income and interest expenses.
F-17
FRESENIUS MEDICAL CARE AG
NOTES TO THE CONSOLIDATED FINANCIAL STATEMENTS
(in THOUS, except share and per share data)
The change in fair value of derivatives that do not qualify for hedge accounting is recorded in the income statement and usually offsets the change in value recorded in the income statement for the underlying asset or liability.
Derivatives embedded in host contracts, such as derivatives embedded in vPPAs, are accounted for as separate derivatives if their economic characteristics and risks are not closely related to those of the host contracts. Currently, these embedded derivatives are limited to those embedded in vPPAs which are measured at fair value with changes in fair value recognized in the income statement within other operating income or other operating expense.
i) Impairment of financial assets
The impairment of financial assets is based on the expected credit loss approach, as introduced by IFRS 9. The expected credit loss approach requires that all impacted financial assets will carry a loss allowance based on their expected credit losses. Expected credit losses are a probability-weighted estimate of credit losses over the contractual life of the financial assets.
This model comprises a three-stage approach. Upon recognition, the Company shall recognize expected lifetime losses. When assessing for significant increases in credit risk, the Company shall compare the risk of a default occurring on the financial instrument at the reporting date with the risk of a default occurring on the financial instrument at the date of initial recognition. The Company should consider reasonable and supportable information including historic loss rates, present developments such as liquidity issues and information about future economic conditions, to ensure foreseeable changes in the customer-specific or macroeconomic environment are considered. Separately, there is the rebuttable presumption that the credit risk has increased significantly since the initial recognition when contractual payments are overdue by more than 30 days.
In case of objective evidence of impairment there is an assignment to stage 3. The assignment of a financial asset to stage 3 should rely on qualitative knowledge on the customers’ unfavorable financial position (for example bankruptcy, lawsuits with private or public payers), or quantitative criteria, based on an individual maturity analysis. Independently, there is an assignment to stage 3 if the contractual payments are overdue by more than 360 days. When a counterpart defaults, all financial assets against this counterpart are considered impaired. The definition of default is mainly based on payment practices specific to individual regions and businesses.
The Company recognizes a loss allowance for expected credit losses on financial assets measured at amortized cost, contract assets and lease receivables as well as on investments in debt securities measured at fair value through other comprehensive income. The financial assets mainly comprise of accounts receivable as well as cash and cash equivalents. The amount of expected credit losses is updated at each reporting date to reflect changes in credit risk since initial recognition of the respective instrument. Financial assets whose expected credit loss is not assessed individually are grouped on the basis of geographical regions and the impairment is generally assessed on the basis of macroeconomic indicators such as credit default swaps.
For accounts receivable, the Company uses the simplified method which requires recognizing lifetime expected credit losses at inception. However, expected credit losses on cash and cash equivalents are measured according to the general method based on IFRS 9.
Based on the external credit ratings of the counterparties the Company considers that its cash and cash equivalents have a low credit risk (as the counterparties are generally investment grade). A significant increase in credit risk will be assessed based on qualitative as well as quantitative information.
F-18
FRESENIUS MEDICAL CARE AG
NOTES TO THE CONSOLIDATED FINANCIAL STATEMENTS
(in THOUS, except share and per share data)
j) Foreign currency translation
For purposes of these consolidated financial statements, the euro is the reporting currency. The requirement to report in euro arises from Section 244 HGB. Substantially all assets and liabilities of foreign subsidiaries that use a functional currency other than the euro are translated at year-end exchange rates, while profit and loss positions are translated at annual average exchange rates. Adjustments for foreign currency translation fluctuations are excluded from net earnings and are reported in AOCI. In addition, the translation adjustments of certain intercompany borrowings, which are of a long-term nature, are reported in AOCI. Transactions in foreign currencies recorded by subsidiaries are accounted for at the prevailing spot rate on the date of the respective transaction. Foreign exchange gains and losses resulting from the settlement of such transactions are generally recognized in profit and loss. Financial instruments denominated in a foreign currency are revalued at the spot rate as of the date of the consolidated statement of financial position. On the disposal of a foreign operation, all of the foreign currency translation differences accumulated in AOCI in respect of that disposed operation are reclassified to the consolidated statements of income. On a partial disposal of a subsidiary that includes a foreign operation that does not result in the loss of control over the subsidiary, the proportionate share of accumulated foreign currency translation differences is re-attributed to noncontrolling interests.
The exchange rates of the U.S. dollar affecting foreign currency translation developed as follows:
|
Exchange rates |
|
|
|
|
|
|
|
|
|
|
|
|
|
December 31, 2024 |
|
December 31, 2023 |
|
2024 |
|
2023 |
|
2022 |
|
|
|
spot exchange |
|
spot exchange |
|
average exchange |
|
average exchange |
|
average exchange |
|
|
|
rate in € |
|
rate in € |
|
rate in € |
|
rate in € |
|
rate in € |
|
1 U.S. dollar |
|
|
|
|
|
|
|
|
|
|
k) Revenue recognition
For both health care services revenue and health care products revenue, amounts billed to patients, third party payors and customers are recorded net of contractual allowances, discounts or rebates to reflect the estimated amounts to be receivable from these payors.
Health care services
Health care services revenue, other than insurance revenues discussed below, are recognized on the date the patient receives treatment and includes amounts related to certain services, products and supplies utilized in providing such treatment at an amount to which the Company expects to be entitled. The patient is obligated to pay for health care services at amounts estimated to be receivable based upon the Company’s standard rates or at rates determined under reimbursement arrangements. In the U.S., these arrangements are generally with third party payors, such as Medicare, Medicaid or commercial insurers. Outside the U.S., the reimbursement is usually made through national or local government programs with reimbursement rates established by statute or regulation.
For services performed for patients where the collection of the billed amount or a portion of the billed amount cannot be determined at the time services are performed, the Company concludes that the consideration is variable (implicit price concession) and records the difference between the billed amount and the amount estimated to be collectible as a reduction to health care services revenue. Implicit price concessions include such items as amounts due from patients without adequate insurance coverage, patient co-payment and deductible amounts due from patients with health care coverage. The Company determines implicit price concessions based primarily upon historical collections, denials, delays, refunds and payment adjustments as well as regulatory compliance. Upon receipt of new information relevant for the determination of the implicit price concession, the Company constrains, or adjusts the constraints for the variable consideration of the transaction price. Furthermore, collections, refunds and payment adjustments often continue for up to three years or more following the provision of services.
The Company has entered into shared savings arrangements with certain payors to provide care and care coordination services to certain end-stage renal disease (ESRD) and chronic kidney disease patients. Under these arrangements, the Company may earn variable reimbursement or may owe the payor reimbursement.
In the U.S., the Company generates revenue from insurance (including reinsurance) contracts, such as sub-capitation arrangements, for which the Company applies IFRS 17, Insurance Contracts (IFRS 17). Insurance premium revenue is recognized as earned each month and risk adjustments are offset against revenue.
F-19
FRESENIUS MEDICAL CARE AG
NOTES TO THE CONSOLIDATED FINANCIAL STATEMENTS
(in THOUS, except share and per share data)
“Revenue from insurance contracts” is disclosed separately from “Revenue from contracts with customers” in the notes to the consolidated financial statements.
Health care products
In the health care product business, major revenues are generated from the sale of dialysis machines and water treatment systems, home hemodialysis products, disposable products and maintenance agreements for the Company´s health care products. Revenues from the sale of dialysis machines and water treatment system are typically recognized upon installation and provision of the necessary technical instructions as only thereafter the customer obtains control of the medical device. A small portion of the Company´s revenue is recognized from sales of dialysis machines, home hemodialysis products and other products used for in-center hemodialysis treatment to distributors. When the distributor is the principal in the contract, the revenue allocated to the machine or the products will be recognized upon transfer of control to the distributor. In case the Company is committed to perform the installation, revenue allocated to the installation, as a separate performance obligation, would be recorded upon installation of the machine at the end-customers’ premises. In case the distributor is only an agent in the contract, revenue for sale of the machine would be recorded upon installation.
Under consignment arrangements revenue is recognized upon withdrawal of the products by the customer.
Maintenance is provided over time, and as such revenue is typically recognized on a straight-line basis as the customer is simultaneously receiving and consuming the benefits provided by the Company’s performance.
All other dialysis and non-dialysis product revenues are recognized upon transfer of control to the customer. Product revenues are normally based upon pre-determined rates that are established by contractual arrangement.
A portion of dialysis product revenues is generated from arrangements which give the customer, typically a health care provider, the right to use dialysis machines. In the same contract the customer agrees to purchase the related treatment disposables at a price marked up from the standard price list. If the right to use the machine is conveyed through an operating lease and the customer agrees to purchase a minimum number of related treatment disposables, the Company does not recognize revenue upon delivery of the dialysis machine but recognizes revenue on the sale of disposables upon transfer of control with revenue for the use of dialysis machines recognized straight-line over the term of the lease contract. When there is no such agreement that the customer purchases a minimum number of related treatment disposables, revenue is recognized only on the sale of disposables unless the timing of the first purchase order of related treatment disposables justifies a combination of contracts according to IFRS 15.
If the lease of the machines is a finance lease, ownership of the dialysis machine is transferred to the user upon installation of the dialysis machine at the customer site. In this type of contract, revenue is recognized in accordance with the accounting principles for finance leases under IFRS 16. The allocation of the transaction price to lease and non-lease components is based on stand-alone selling prices.
For certain home-dialysis products the Company offers month-to-month rental arrangements, where revenue is recognized on a monthly basis.
In addition, for some licensing agreements and equipment sales to dialysis clinic customers in the area of home-dialysis, the Company recognizes upfront fees received as lease revenue on a straight-line basis over the term of the contract.
IFRS 15 specifically excludes leases from the scope of the revenue standard. The transaction price of contracts which include lease components is allocated in accordance with IFRS 15. Revenue is recognized separately for the lease and the non-lease components of the contract.
“Revenue from lease contracts” is disclosed separately from “Revenue from contracts with customers” in the notes to the consolidated financial statements.
F-20
FRESENIUS MEDICAL CARE AG
NOTES TO THE CONSOLIDATED FINANCIAL STATEMENTS
(in THOUS, except share and per share data)
l) Capitalized interest
For significant construction projects exceeding six months, the Company includes capitalized interest costs that are directly attributable to the construction or the production of a qualifying asset as part of the cost of the asset. For the fiscal years 2024, 2023 and 2022, interest of €
m) Research and development expenses
Research is the original and planned investigation undertaken with the prospect of gaining new scientific or technical knowledge. Development is the technical and commercial implementation of research results and takes place before the start of commercial production or use. Research costs are expensed as incurred. Development costs that fully meet the criteria for the recognition of an intangible asset, as set out in IAS 38, are capitalized and are primarily development projects related to dialysis machines. Such costs are capitalized when the Company’s commitment to finalize the project has been formalized and approved by management, the design input of the project or machine has been finalized and, based on experience with similar projects, the Company has determined that technical feasibility has been achieved and future economic benefits are probable.
n) Income taxes
Current taxes are calculated based on the profit (loss) of the fiscal year and in accordance with local tax rules of the respective tax jurisdictions. Expected and executed additional tax payments and tax refunds for prior years are also taken into account.
Deferred tax assets and liabilities are recognized for the future tax consequences attributable to temporary differences between the single entity’s financial statement carrying amounts of existing assets and liabilities and their respective tax basis, tax credits and tax loss carryforwards which are probable to be utilized. Deferred tax assets and liabilities are measured at the tax rates that are expected to apply to the period when the asset is realized or the liability is settled, based on tax rates that have been enacted or substantially enacted by the end of the reporting period. A change in tax rate for the calculation of deferred tax assets and liabilities is recognized in the period the new laws are enacted or substantively enacted. The effects of the adjustment are generally recognized in the income statement. The effects of the adjustment are recognized in equity, if the temporary differences are related to items directly recognized in equity.
Deferred tax liabilities are not recognized if they arise from the initial recognition of goodwill. In addition, deferred tax assets and liabilities are not recognized if they arise from the initial recognition of an asset or a liability in a transaction other than a business combination that at the time of the transaction affects neither accounting profit nor taxable profit or loss and does not give rise to equal taxable and deductible temporary differences.
The carrying amount of a deferred tax asset is reviewed at each balance sheet date. A deferred tax asset is recognized to the extent that the utilization of parts or all of it is probable because sufficient taxable profit will be available (see note 5 g). The determination of future taxable income is based on assumptions on future market conditions and future profits of FME AG and considers all currently available information as well as the level of historical taxable income. In addition, the determination of the recoverable amount of deferred tax assets considers implemented tax strategies.
With respect to the interpretation of tax laws, the amount and the timing of future taxable income, complex tax rules may lead to uncertainties in tax treatments. The Company recognizes assets and liabilities for uncertain tax treatments based on reasonable estimates to the extent it is probable the tax will be recovered or that the tax will be payable, respectively.
In the U.S. and Germany, interest and penalties related to income taxes, including uncertain tax treatments, do not meet the definition of income taxes, and therefore are accounted for under IAS 37. All other jurisdictions account for interest and penalties related to income taxes in accordance with local tax rules of the respective tax jurisdiction either under IAS 37 or as income tax expense under IAS 12. Under IAS 37, penalties related to income taxes, including uncertain tax treatments, are recorded within selling, general and administrative expense. Additionally, in accordance with IAS 37, interest related to income taxes, including uncertain tax treatments, are recorded within other (income) expense.
F-21
FRESENIUS MEDICAL CARE AG
NOTES TO THE CONSOLIDATED FINANCIAL STATEMENTS
(in THOUS, except share and per share data)
In 2023, the Company implemented a Global Intercompany Service Charging (GISC) initiative reflecting its new global operating model described above. The initiative aligns with the Company’s vertical integration strategy, seeking to consolidate functions through business partnering, centers of excellence and global shared services. The GISC initiative established a standardized and simplified global framework for intercompany service charging. Consistent with Organisation for Economic Co-operation and Development Transfer Pricing Guidelines, service fees are charged based on associated costs and arm’s length mark-ups using allocation keys which reflect the benefits received by the service recipients.
Due to the size of the Company’s revenue, the Company is within the scope of the Organisation for Economic Co-operation and Development’s Inclusive Framework on Base Erosion Profit Shifting (BEPS) Global Anti-Base Erosion Model Rules (GloBE): Global Minimum Taxation (Pillar Two) legislation. The legislation was enacted in Germany on December 15, 2023, the jurisdiction in which the Company resides, and became effective on January 1, 2024. The Company applies the exception not to recognize or disclose deferred taxes in connection with Pillar Two income taxes. Income tax expenses related to Pillar Two income taxes are included within the income tax expense line item in the Company’s consolidated statements of income.
o) Impairment
The Company reviews the carrying amount of its property, plant and equipment, its intangible assets with definite useful lives, its right-of-use assets as well as other non-current assets for impairment whenever events or changes in circumstances indicate that the carrying amount is higher than the asset’s recoverable amount in accordance with IAS 36, Impairment of Assets (IAS 36). The fair value less cost of disposal of an asset is estimated as its net realizable value. The value in use is the present value of future cash flows expected to be derived from the relevant asset. If it is not possible to estimate the future cash flows from the individual assets, impairment is tested on the basis of the corresponding group of CGUs.
Impairment losses, except impairment losses recognized on goodwill, are reversed up to the amount of the amortized acquisition cost, as soon as the reasons for impairment no longer exist.
Non-current assets to be disposed of by sale are reported at the lower of carrying value or fair value less cost to sell and depreciation is ceased. Non-current assets to be disposed of other than by sale are considered to be held and used until disposal.
p) Debt issuance costs
Debt issuance costs related to a recognized debt liability are presented on the balance sheet as a direct deduction from the carrying amount of that debt liability. Debt issuance costs related to undrawn credit facilities are presented in Other assets. These costs are amortized over the term of the related obligation or credit facility.
For further information see note 17.
q) Self-insurance programs
See note 2 d).
r) Concentration of risk
The Company is engaged in the manufacture and sale of products for all forms of kidney dialysis, principally to health care providers throughout the world, and in providing kidney dialysis treatment as well as providing other health care services. The Company performs ongoing evaluations of its customers’ financial condition and, generally, requires no collateral.
Revenues which were earned and subject to regulations under Medicare and Medicaid (excluding Medicare Part C, also known as Medicare Advantage plans), governmental health care programs administered by the U.S. government, were approximately
See note 2 c) for concentration risks of debtors or group of debtors as well as note 9 for discussion of suppliers with long-term purchase commitments.
F-22
FRESENIUS MEDICAL CARE AG
NOTES TO THE CONSOLIDATED FINANCIAL STATEMENTS
(in THOUS, except share and per share data)
s) Legal contingencies
See note 2 b).
t) Other provisions
In accordance with IAS 37, provisions are recognized when there is a present obligation to a third party arising from past events, it is probable that the obligation will be settled in the future and the required amount can be reliably estimated. Provisions by their nature are more uncertain than most other items in the statement of financial position.
Non-current provisions with a remaining period of more than one year are discounted to the present value of the expenditures expected to settle the obligation. The applied discount rate is a pre-tax rate that reflects current market assessments of the time value of money and the risks specific to the liability.
u) Earnings per share
Basic earnings per share is calculated in accordance with IAS 33, Earnings per Share (IAS 33). Basic earnings per share is calculated by dividing net income attributable to shareholders by the weighted average number of shares outstanding during the year. Diluted earnings per share include the effect of all potentially dilutive instruments on shares that would have been outstanding during the years presented had the dilutive instruments been issued. For the calculation of basic earnings per share, treasury stock is not considered outstanding and is therefore deducted from the number of shares outstanding.
Equity-settled awards granted under the Company’s stock incentive plans (see note 23) are potentially dilutive equity instruments.
v) Treasury stock
The Company may, from time to time, acquire its own shares (Treasury Stock) as approved by its shareholders. The acquisition, sale or retirement of its Treasury Stock is recorded separately in equity. The value of such Treasury Stock is shown as a reduction of the Company’s equity.
w) Employee benefit plans
Pension obligations for post-employment benefits are measured in accordance with IAS 19, Employee Benefits (IAS 19), using the projected unit credit method, taking into account future salary and trends for pension increase.
The Company uses December 31 as the measurement date when measuring the net pension liability.
For the Company’s funded benefit plans the defined benefit obligation is offset against the fair value of plan assets (net pension liability). Plan assets comprise assets held by a long-term employee benefit fund and qualifying insurance policies. A pension liability is recognized in the consolidated balance sheet if the defined benefit obligation exceeds the fair value of plan assets. A pension asset is recognized (and reported under “Other non-current assets” in the consolidated balance sheet) if the fair value of plan assets exceeds the defined benefit obligation and if the Company has a right of refund against the fund or a right to reduce future payments to the fund.
Net interest costs are calculated by multiplying the benefit obligation (fair value of plan assets) at beginning of the year with the discount rate utilized in determining the benefit obligation.
Remeasurements include actuarial gains and losses resulting from the evaluation of the defined benefit obligation as well as from the difference between actual investment returns and the return implied by the net interest cost. In the event of a surplus for a defined benefit pension plan remeasurements can also contain the effect from asset ceiling, as far as this effect is not included in net interest costs.
Remeasurements are recognized in AOCI completely. Remeasurements may not be reclassified in subsequent periods. Components of net periodic benefit cost are recognized in profit and loss of the period.
F-23
FRESENIUS MEDICAL CARE AG
NOTES TO THE CONSOLIDATED FINANCIAL STATEMENTS
(in THOUS, except share and per share data)
x) Share-based plans
The grant date fair value of stock options and convertible equity instruments that are settled by delivering equity instruments granted to the Management Board and executive employees of the Company and its subsidiaries by FME AG is measured in accordance with IFRS 2, Share-based Payment (IFRS 2) using the binomial option pricing model and recognized as expense over the vesting period of the stock option plans. For certain exceptions, as defined in the respective plan terms, a shorter vesting period may apply after which the stock options will not forfeit in any way. In such cases the vesting period is shortened accordingly.
The balance sheet date fair value of cash-settled performance shares granted to the Management Board and executive employees of the Company is calculated using the Monte Carlo pricing model in accordance with IFRS 2. The corresponding liability based on the balance sheet date fair value is accrued over the vesting periods of the performance share plans. For certain exceptions a shorter vesting period may apply after which the performance shares will not forfeit in any way. In such cases the vesting period is shortened accordingly.
y) Government grants
In accordance with IAS 20, Accounting for Government Grants and Disclosure of Government Assistance, government grants, including non-monetary grants at fair value, are recognized only when there is reasonable assurance that the Company will comply with all conditions attached to the grant and that the grants will be received. Government grants or government assistance are recognized directly against the respective qualifying expense in either the cost of revenue line item or selling, general and administrative expense line item within the statement of profit and loss. Amounts received for which a respective cost is not yet incurred are recorded as a liability on the Company’s consolidated balance sheet and offset against all qualifying costs that are incurred in future periods.
z) Impacts of climate change on accounting
The Company continually analyzes potential sustainability risks in the areas of climate change, water scarcity, and resource usage. In particular, during 2024, we entered into several vPPAs with wind and solar energy project developers in Germany and in the U.S. in order to receive guarantees of origin and renewable energy certificates, respectively, to address our sustainability objectives. Volatility in the valuation of financial instruments connected to energy prices or energy production volumes, including as a result of the heightened risk of volatility due to geopolitical conflicts in certain regions, could result in a material adverse effect on our business or results of operations. Other than the aforementioned risk, the Company has not identified any significant risks for its business model in 2024.
aa) Recent pronouncements
Recently implemented accounting pronouncements
The Company has prepared its consolidated financial statements at and for the year ended December 31, 2024 in conformity with IFRS Accounting Standards that have to be applied for fiscal years beginning on January 1, 2024. For the year ended December 31, 2024, the Company applied the following new standard relevant for its business for the first time:
Disclosure of Revenues and Expenses for Reportable Segments under IFRS 8, Operating Segments (International Financial Reporting Interpretations Committee Agenda Decision)
In July 2024, the International Financial Reporting Interpretations Committee issued an agenda decision on the disclosure of revenues and expenses for reportable segments under IFRS 8, Operating Segments. Under IFRS 8, companies are required to disclose certain specified income and expense items if such items are included within the segment profit measure that is provided to the chief operating decision maker, regardless of whether such items are provided to the chief operating decision maker separately. The agenda decision further clarifies that additional material items of income and expense included within a measure of segment profit reported to the chief operating decision maker may also need to be disclosed, based on management judgment. The Company evaluated the International Financial Reporting Interpretations Committee decision and has adjusted its segment reporting presentation to include costs of revenue and research and development (R&D) at the segment level.
F-24
FRESENIUS MEDICAL CARE AG
NOTES TO THE CONSOLIDATED FINANCIAL STATEMENTS
(in THOUS, except share and per share data)
Recent accounting pronouncements not yet adopted
IFRS 18, Presentation and Disclosure in Financial Statements
On April 9, 2024, the IASB issued IFRS 18, Presentation and Disclosure in Financial Statements (IFRS 18). IFRS 18 aims to improve how information is communicated in financial statements to give investors a more comparable basis to analyze companies’ performance. The standard introduces three sets of new requirements: new categories and subtotals in the consolidated statements of income, disclosure regarding management-defined performance measures and guidance related to the aggregation and disaggregation of certain information. The consolidated statements of income will be split into three newly defined categories (operating, investing and financing) and will include two newly defined subtotals (operating profit and profit before financing and income taxes). Management-defined performance measures are subtotals of income and expense used in public communication outside the financial statements and communicate management’s view of certain aspects of a company’s performance. Such measures are required to be described in a clear and understandable manner in a single note explaining how the measure is calculated, why it is useful, providing a reconciliation to the most directly comparable subtotal noted above, the income tax and the effect on non-controlling interest for each item disclosed in the reconciliation and how the income tax effect was determined. Lastly, companies must disaggregate items if such information is material and avoid using the label “other” in financial statements. Certain additional details for depreciation and amortization, impairment and other expense classifications may be required. Additionally, IFRS 18 introduces limited changes to IAS 7, Statement of Cash Flows. The operating profit will be the starting point for reporting cash flows from operating activities using the indirect method and the option for classifying interest and dividend cash flows as operating activities has been eliminated. Dividends and interest paid will be classified in cash flows from financing activities whereas dividends and interest received will be classified in cash flows from investing activities. An entity shall apply those amendments when it applies IFRS 18. IFRS 18 is effective for fiscal periods commencing on or after January 1, 2027. Earlier adoption is permitted. The standard is expected to impact the Company’s presentation of items within the consolidated financial statements and its notes disclosures once implemented, though the standard is not expected to change how the Company recognizes or measures items in its consolidated financial statements.
In the Company’s view, no other pronouncements issued by the IASB are expected to have a material impact on the consolidated financial statements.
2. Significant judgments and sources of estimation uncertainties
The Company’s reported results of operations, financial position and net assets are sensitive to significant judgments, assumptions and estimates that are the basis for its financial statements. The critical accounting policies, the judgments made in the creation and application of these policies and the sensitivities of reported results to changes in accounting policies, significant judgments and estimates are factors to be considered along with the Company’s financial statements. In the opinion of the Management of the Company, the following accounting policies, significant judgments and sources of estimation uncertainties are critical for the consolidated financial statements in the present economic environment.
a) Recoverability of goodwill and intangible assets
The growth of the business through acquisitions has created a significant amount of intangible assets, including goodwill, trade names, management contracts, non-compete agreements, technology and customer relationships as well as licenses and distribution agreements. In addition, the Company recognizes internally developed intangible assets related to R&D and software development projects. At December 31, 2024, the carrying amount of goodwill and non-amortizable intangible assets amounted to €
In accordance with IAS 36, the Company performs an impairment test of goodwill and non-amortizable intangible assets at least once a year for each group of CGUs or more frequently if the Company becomes aware of events that occur or if circumstances change that would indicate the carrying value may not be recoverable (see also note 1 g).
F-25
FRESENIUS MEDICAL CARE AG
NOTES TO THE CONSOLIDATED FINANCIAL STATEMENTS
(in THOUS, except share and per share data)
To comply with IFRS Accounting Standards to determine possible impairments of these assets, the value in use of the group of CGUs is first compared to the group of CGUs’ carrying amount. In cases where the value in use of the group of CGUs is less than its carrying amount and the fair value less cost of disposal is not estimated to be higher than the value in use, the difference is recorded as an impairment of the carrying amount of the group of CGUs.
To evaluate the recoverability of intangible assets with indefinite useful lives, the Company compares the recoverable amounts of the smallest identifiable group of assets that generate largely independent cash inflows with their carrying values.An intangible asset’s fair value is determined using a discounted cash flow approach or other methods, if appropriate.
The value in use of each group of CGUs is determined using estimated future cash flows for the unit discounted by a pre-tax discount rate (WACC) specific to that group of CGUs. The Company’s WACC consists of a basic rate adjusted by a weighted average country risk rate and, if appropriate, by a factor to reflect higher risks associated with the cash flows from recent material acquisitions within each group of CGUs, until they are appropriately integrated as well as country-specific risks identified within a group of CGUs. The Company’s WACC is impacted by macro-economic and other specific uncertainties. Estimating the future cash flows involves significant assumptions, especially regarding future reimbursement rates and sales prices, number of treatments, sales volumes and costs. The estimates were largely impacted by the continuing deterioration of the macroeconomic environment in recent years.
The Company performed an analysis in connection with the annual goodwill impairment test as of October 1, 2024, which included qualitative and quantitative simulations to assess the potential impact of GLP-1 receptor agonists and the potential impact of sodium-glucose cotransporter 2 (SGLT2) inhibitors on the CKD and ESRD populations, specifically in relation to cash flow projections and goodwill sensitivity assessments based on the analysis of the population impact model (a computational tool to predict the size and age distribution of future patient populations with kidney disease for the coming decade, based on various public-health scenarios). In the Company’s population impact model the sensitivity bands of the various scenarios of GLP-1 receptor agonist and SGLT2 inhibitor utilization in the CKD population suggest a slight increase in the total CKD population and a slight reduction in the ESRD population growth rate that remain materially consistent with the patient population forecasts which do not include the utilization of these drugs. Considering the positive cardiovascular effects of the drugs, reducing mortality, as well as the progression-delaying effect on the CKD population, the Company sees a balanced effect of the drugs on the patient population.
The Company’s assessment concluded that underlying patient growth assumptions used in its
cash flow projections reflect the current understanding of treatment developments. In addition, the Company performed a most conservative scenario based on the population impact model, which did not result in an impairment loss as the recoverable amount of the Care Delivery and Care Enablement groups of CGUs continued to exceed the carrying amount by €
The key assumptions represent management’s assessment of future trends and have been based on historical data from both external and internal sources, including the population impact model as described above. In determining discounted cash flows for every group of CGUs, the Company utilizes its
The annual impairment test performed as of October 1, 2024 did not result in an impairment.
Goodwill as of December 31, 2024 was €
F-26
FRESENIUS MEDICAL CARE AG
NOTES TO THE CONSOLIDATED FINANCIAL STATEMENTS
(in THOUS, except share and per share data)
The market capitalization of the Company increased by
Due to the carrying amount of net assets exceeding the Company’s market capitalization, a continued higher level of interest rates and ongoing uncertainties in the macroeconomic environment, the Company performed an impairment test as of December 31, 2024, in addition to the annual impairment test as of October 1, 2024. Additionally, the ability to delay CKD or ESRD progression and cardiovascular mortality improvements as a result of the use of GLP-1 receptor agonists, SGLT2 inhibitors and other pharmaceuticals or treatment modalities could have an impact on our patient population in the future. Cash flow projections were updated to reflect the impacts of divestitures and the classification of certain entities as held for sale during the fourth quarter, while CGU residual value growth rates remained unchanged as compared to the annual impairment test performed as of October 1, 2024. In addition, WACC parameters were updated as of December 31, 2024. The goodwill impairment test performed as of December 31, 2024 did not result in any impairment.
The following table shows the key assumptions of value-in-use calculations, which are presented based upon the goodwill impairment test performed as of December 31, 2024 and December 31, 2023. There are no reasonably possible changes in assumptions that would lead to an impairment in these groups of CGUs.
|
Key assumptions |
||||||||
|
in % |
|
|
|
|
|
|
|
|
|
|
|
Care Delivery |
|
Care Enablement |
||||
|
|
|
December 31, |
|
December 31, |
|
December 31, |
|
December 31, |
|
|
|
2024 |
|
2023 |
|
2024 |
|
2023 |
|
Average revenue growth in ten year projection period (1) |
|
mid-single-digit |
|
mid-single-digit |
|
mid-single-digit |
|
mid-single-digit |
|
Average operating income growth in ten year projection period (1) |
|
mid-single-digit |
|
high-single-digit |
|
low-double-digit |
|
low-double-digit |
|
Residual value growth (1) |
|
|
|
|
|
|
|
|
|
Pre-tax WACC (2) |
|
|
|
|
|
|
|
|
|
After-tax WACC (2) |
|
|
|
|
|
|
|
|
| (1) | The key assumptions as of December 31, 2024 match the respective assumptions as of October 1, 2024. The key assumptions as of December 31, 2023 match the respective assumptions as of October 1, 2023. |
| (2) |
As of October 1, 2024 the pre-tax WACC of Care Delivery and Care Enablement was
|
An overview of the carrying amounts of goodwill and intangibles with indefinite useful life for each group of CGUs is shown in note 12.
A prolonged downturn in the health care industry with lower than expected increases in reimbursement rates and/or higher than expected costs for providing health care services and for procuring and selling health care products or a significant increase of mortality of patients with chronic kidney diseases have and could continue to adversely affect the Company’s estimated future cash flows. Future adverse changes in a cash-generating unit’s economic environment of a group of CGUs could affect the country specific risk rate and therefore the discount rate. Equally an increase of the general interest rate level could affect the base rate and therefore the discount rate. Additionally, changing market conditions and new market entrants could have a negative impact on the estimated future cash flows and/or a decline in the cash-generating units economic environment, both of which are, by their nature, difficult to predict. As noted in the sensitivity analysis below, if the Company’s assumptions change or actual future performance is lower than expected, the Company could record goodwill impairments in the future, and such impairments could be material to its net income.
F-27
FRESENIUS MEDICAL CARE AG
NOTES TO THE CONSOLIDATED FINANCIAL STATEMENTS
(in THOUS, except share and per share data)
As of December 31, 2024, the recoverable amount of the Care Delivery group of CGUs exceeded the carrying amount by €
|
Sensitivity analysis (1) |
||||||||
|
Change in percentage points |
|
Care Delivery |
|
Care Enablement |
||||
|
|
|
December 31, 2024 |
|
October 1, 2024 |
|
December 31, 2024 |
|
October 1, 2024 |
|
Pre-tax WACC |
|
|
|
|
|
|
|
|
|
After-tax WACC |
|
|
|
|
|
|
|
|
|
Residual value growth |
|
(
|
|
(
|
|
(
|
|
(
|
|
Operating income margin of each projection year |
|
(
|
|
(
|
|
(
|
|
(
|
| (1) | The sensitivity analysis is based upon the goodwill impairment tests performed as of December 31, 2024 and October 1, 2024. |
|
Sensitivity analysis (1) |
||||||||
|
Change in percentage points |
|
|
|
|
||||
|
|
|
Care Delivery |
|
Care Enablement |
||||
|
|
|
December 31, |
|
October 1, |
|
December 31, |
|
October 1, |
|
|
|
2023 |
|
2023 |
|
2023 |
|
2023 |
|
Pre-tax WACC |
|
|
|
|
|
|
|
|
|
After-tax WACC |
|
|
|
|
|
|
|
|
|
Residual value growth |
|
(
|
|
(
|
|
(
|
|
(
|
|
Operating income margin of each projection year |
|
(
|
|
(
|
|
(
|
|
(
|
| (1) | The sensitivity analysis is based upon the goodwill impairment tests performed as of December 31, 2023 and October 1, 2023. |
b) Legal contingencies
From time to time, during the ordinary course of operations as well as due to acquisitions, the Company is party to litigation and arbitration and is subject to investigations relating to various aspects of its business (see note 25). The Company regularly analyzes current information about such claims for probable losses and provides accruals for such matters, including the estimated legal expenses and consulting services in connection with these matters, as appropriate. The Company utilizes its internal legal department as well as external resources for these assessments. In making the decision regarding the need for loss accrual, the Company considers the degree of probability of an unfavorable outcome and its ability to make a reasonable estimate of the amount of loss.
The filing of a suit or formal assertion of a claim or assessment, or the disclosure of any such suit or assertion, does not necessarily indicate that accrual of a loss is appropriate.
The outcome of these matters may have a material adverse effect on the results of operations, financial position and net assets of the Company.
c) Trade accounts and other receivables from unrelated parties and expected credit losses
Trade accounts and other receivables from unrelated parties are a substantial asset of the Company and the expected credit losses are based upon a significant estimate made by management. Trade accounts and other receivables from unrelated parties were €
The Company sells health care products directly or through distributors in around
F-28
FRESENIUS MEDICAL CARE AG
NOTES TO THE CONSOLIDATED FINANCIAL STATEMENTS
(in THOUS, except share and per share data)
Receivables resulting from revenue recognized for health care services provided are recorded at amounts estimated to be collectable under government reimbursement programs and reimbursement arrangements with third party payors. U.S. Medicare and Medicaid government programs are billed at pre-determined net realizable rates per treatment that are established by statute or regulation. Revenues for non-governmental payors with which the Company has contracts or letters of agreement in place are recognized at the prevailing contract rates. The remaining non-governmental payors are billed at the Company’s standard rates for services and, for U.S. revenue within the Company’s Care Delivery segment, a contractual adjustment is recorded to recognize revenues based on historic reimbursement. The contractual adjustment and the expected credit losses are reviewed quarterly for their adequacy. No material changes in estimates were recorded for the contractual allowance in the periods presented. The collectability of receivables is reviewed locally on a regular basis, generally monthly. For further information, see note 1 k).
In the Company’s U.S. operations within its Care Delivery segment, the collection process is usually initiated shortly after service is provided or upon the expiration of the time provided by contract. For Medicare and Medicaid, once the services are approved for payment, the collection process begins upon the expiration of a period of time based upon experience with Medicare and Medicaid. In all cases where co-payment is required the collection process usually begins within
Public health institutions in a number of countries outside the U.S. require a significant amount of time until payment is made because a substantial number of payors are government entities whose payments are often determined by local laws and regulations and budget constraints. Depending on local facts and circumstances, the period of time to collect can be quite lengthy. In those instances where there are commercial payors, the same type of collection process is initiated as in the U.S.
Due to the number of subsidiaries and different countries that the Company operates in, the Company’s policy of determining when an individual expected credit loss is required considers the appropriate individual local facts and circumstances that apply to an account. While payment and collection practices vary significantly between countries and even agencies within one country, government payors usually represent low to moderate credit risks. It is the Company’s policy to determine when receivables should be classified as bad debt on a local basis taking into account local payment practices and local collection experience. An individual expected credit loss is calculated locally if specific circumstances indicate that amounts will not be collectible.
Receivables where the expected credit losses are not assessed individually are grouped based on geographical regions and the impairment is assessed based on macroeconomic indicators such as credit default swaps. For more information regarding the impairment on trade accounts and other receivables from unrelated parties, refer to note 1 i).
When all efforts to collect a receivable, including the use of outside sources where required and allowed, have been exhausted, and after appropriate management review, a receivable deemed to be uncollectible is considered a bad debt and written off.
Write offs are taken on a claim-by-claim basis. Due to the fact that a large portion of its reimbursement is provided by public health care organizations and private insurers, the Company expects that most of its accounts receivables will be collectible, albeit potentially more slowly outside the U.S. A significant change in the Company’s collection experience, deterioration in the aging of receivables and collection difficulties could require that the Company increases its estimate of the expected credit losses. Any such additional bad debt charges could materially and adversely affect the Company’s future operating results.
If, in addition to the Company’s existing expected credit losses,
F-29
FRESENIUS MEDICAL CARE AG
NOTES TO THE CONSOLIDATED FINANCIAL STATEMENTS
(in THOUS, except share and per share data)
The following table shows the portion of major debtors or debtor groups of trade accounts and other receivables from unrelated parties as of December 31, 2024 and 2023. Other than U.S. Medicare and Medicaid,
|
Composition of trade accounts and other receivables from unrelated parties in % |
||||
|
|
|
December 31, |
||
|
|
|
2024 |
|
2023 |
|
|
|
|
|
|
|
U.S. Government health care programs |
|
|
|
|
|
U.S. commercial payors |
|
|
|
|
|
U.S. hospitals |
|
|
|
|
|
Self-pay of U.S. patients |
|
|
|
|
|
Other U.S. payors |
|
|
|
|
|
Product customers and health care payors outside U.S. |
|
|
|
|
|
Total |
|
|
|
|
d) Self-insurance programs
Under the Company’s insurance programs for professional, product and general liability, auto liability, worker’s compensation and medical malpractice claims, the Company’s largest subsidiary which is located in the U.S. is partially self-insured for professional liability claims. For all other coverages, the Company assumes responsibility for incurred claims up to predetermined amounts above which third party insurance applies. Reported liabilities for the year represent estimated future payments of the anticipated expense for claims incurred (both reported and incurred but not reported) based on historical experience and existing claim activity. This experience includes both the rate of claims incidence (number) and claim severity (cost) and is combined with individual claim expectations to estimate the reported amounts. For further information, see note 15 and note 18.
e) Level 3 financial instruments
Put option liabilities, variable payments outstanding for acquisitions, equity investments, derivatives embedded in vPPAs as well as receivables for royalty payments from one of the Company’s equity investments and certain receivables from the sale of investments are recognized at their fair value. Each put option contract contains specific clauses related to the terms of exercisability, which require significant judgment in order to determine appropriate liability recognition and classification. For further information related to the significant judgments and estimates related to these instruments and their fair values, see notes 1 h) and 26.
F-30
FRESENIUS MEDICAL CARE AG
NOTES TO THE CONSOLIDATED FINANCIAL STATEMENTS
(in THOUS, except share and per share data)
f) Income taxes
The Company is subject to ongoing and future tax audits in the U.S., Germany and other jurisdictions. Different interpretations of tax laws, particularly due to the Company’s international activities, may lead to potential additional tax payments or tax refunds for prior years. To consider income tax liabilities or income tax receivables of uncertain tax assessments management’s estimations are based on experiences with previous tax audits and local tax rules of the respective tax jurisdiction and the interpretation of such. Differences between actual results and management’s estimates or future changes in these estimates may have an impact on future tax payments or tax refunds. Estimates are revised in the period in which there is sufficient evidence to revise the assumption. For further information to estimates related to the recoverability of deferred taxes, see notes 1 n) and 5 g). Further information on the status of current tax audits or objections from taxation authorities is provided in note 25.
g) Business combinations and disposal groups classified as held for sale
The Company measures the noncontrolling interest in an acquisition at fair value using the full goodwill method and classifies costs related to its business combinations within general and administrative expense. In determining whether an intangible asset related to a business combination is identifiable and should be separated from goodwill, significant judgment is required. Additionally, estimation of the acquisition-date fair values of identifiable assets acquired and liabilities assumed also involves significant judgment. The applicable measurements and inputs used in this estimation (including revenue growth rates, gross profit margin adjusted for synergy assumptions associated with manufacturing savings and the discount rate) are based upon information available at the acquisition date using expectations and assumptions that management deems reasonable. Such judgments, estimates and assumptions could materially affect the Company’s business, results of operations and financial condition, primarily due to:
| ● | Fair values assigned to assets subject to depreciation and amortization directly impact the depreciation and amortization recorded in the Company’s consolidated statements of income in periods subsequent to a related acquisition. |
| ● | Any subsequent measurement resulting in a decrease in the estimated fair values of assets acquired may result in impairment. |
| ● | Subsequent changes resulting in an increase or decrease to the estimated fair values of liabilities assumed may result in additional expense or income, respectively. |
For further information on business combinations, see note 3.
A non-current asset or a disposal group is classified as held for sale if its carrying amount will be recovered principally through a sale transaction rather than through continuing use. The criteria for held for sale classification is only met if the asset or group is available for immediate sale in its present condition and the sale transaction is considered highly probable. A transaction is assumed to be highly probable if there is no significant risk of completion of the transaction. Disposal groups are recognized at the lower of their carrying amounts or fair value less costs to sell. Any impairment loss on the disposal group is allocated first to goodwill and then to the remaining non-current assets within the IFRS 5 measurement scope on a pro rata basis. The determination of the fair value less costs to sell requires the use of estimates and assumptions.
For further information on disposal groups classified as held for sale, see note 4.
h) Leases and interest rate determination
IFRS 16 requires the Company to make judgments that affect the valuation of lease liabilities as well as of right- of-use assets (see notes 24 and 26), including the determination of which contracts are within the scope of IFRS 16, identifying the contract lease term and determining the incremental borrowing rate.
F-31
FRESENIUS MEDICAL CARE AG
NOTES TO THE CONSOLIDATED FINANCIAL STATEMENTS
(in THOUS, except share and per share data)
The lease term is determined as the non-cancellable period of a lease, together with periods covered by an option to extend the lease if the Company is reasonably certain to exercise that option and periods covered by an option to terminate the lease if the Company is reasonably certain not to exercise that option. During the “reasonably certain” assessments, the Company considers all relevant facts and circumstances that create an economic incentive for the Company to exercise, or not to exercise, an option, including any expected changes in facts and circumstances (e.g., contract-, object-, entity- or market-specific factors) from the commencement date until the exercise date of the option. Other examples of considered terms are termination penalties or costs relating to the termination of the lease, such as negotiation costs, relocation costs, costs of identifying another lease asset suitable for the Company’s needs, costs of integrating a new asset into the Company’s operations and termination penalties and similar costs, including costs associated with returning the underlying asset in a contractually specified condition or to a contractually specified location. Additionally, the Company’s historical practice regarding the period over which it has typically used particular types of assets, and its economic reasons for doing so, is also relevant. Unrecognized extension options are shown as potential future cash outflows (see note 24).
The Company uses the rate implicit in the lease if agreed with the lessor and/or available, while the incremental borrowing rate is used for all other leases. The incremental borrowing rate is defined as the rate that the lessee would have to pay on the commencement date of the lease for a similar loan (regarding its term, security, underlying asset, and economic environment). The incremental borrowing rate is determined when the Company initiates a lease contract or changes an existing lease. The interest rate is calculated based on following components: available interest rate sampling points, group risk margins, shadow rating (credit risk) margins, country risk margins, handling margins and other risk margins.
The Company is subject to residual value guarantees in certain lease contracts, primarily real estate contracts, for which it is the lessee. Under the terms of these leases, the Company has the option to remarket the underlying leased properties to satisfy its residual value guarantee obligations at the end of the lease term. At the end of each reporting period, the expected residual values are compared to the estimated fair market value of the underlying leased assets utilizing third-party valuations. For additional information regarding residual value guarantees in certain lease contracts, see note 25.
|
3. |
Acquisitions, business combinations, investments (including debt securities), purchases of intangible assets, divestitures and sale of debt securities |
The Company completed acquisitions, investments (including debt securities) and the purchase of intangible assets in the amount of €
Acquisitions
The Company made acquisitions of €
In 2024, the Company’s acquisition spending was driven by the purchase of certain assets from a medical technology business. In 2023 and 2022, the Company’s acquisition spending was driven primarily by the purchase of dialysis clinics and other health care service facilities in the normal course of its operations as well as the business combination of Interwell Health in 2022 (as defined and discussed below).
Impacts on consolidated financial statements from acquisitions
The assets and liabilities of all acquisitions were recorded at their estimated fair value at the date of the acquisition and are included in the Company’s financial statements and operating results from the effective date of acquisition. The measurement period adjustments from the previous year’s acquisitions did not have a significant impact on the consolidated financial statements in 2024.
The excess of the total acquisition costs over the fair value of the net assets acquired resulted in goodwill of €
F-32
FRESENIUS MEDICAL CARE AG
NOTES TO THE CONSOLIDATED FINANCIAL STATEMENTS
(in THOUS, except share and per share data)
The purchase price allocations for all collectively and individually non-material acquisitions for 2024 are not yet finalized. The Company is in the process of obtaining and evaluating the information necessary for the purchase price allocations, primarily related to property, plant and equipment, intangible assets, accounts receivable and other liabilities. In 2024, based on preliminary purchase price allocations, the Company recorded €
Business combinations during 2024 increased the Company’s net income attributable to shareholders of FME AG (Net Income) by €
Business combination of Interwell Health
On August 24, 2022 (Acquisition Date), the Company completed a business combination among Fresenius Health Partners, Inc. (FHP), the value-based care division of the Company’s wholly owned subsidiary Fresenius Medical Care Holdings, Inc., InterWell Health LLC, a physician organization driving innovation in the kidney care space in the U.S., and Cricket, a U.S. provider of value-based kidney care with a patient engagement and data platform. The new company, InterWell Topco L.P. (NewCo), operates under the Interwell Health brand (Interwell Health).
This business combination was conducted as a non-cash transaction. The contributions of the net assets of InterWell Health LLC and Cricket were accounted for as a business combination in accordance with IFRS 3. The Company’s contribution of the net assets of FHP was recorded under common control at their respective carrying values at the Acquisition Date and the reduction of the Company’s interest in FHP, in exchange for net assets received of InterWell Health LLC and Cricket, was accounted for as an equity transaction. Upon consummation of the business combination described above, the Company holds approximately
Based on the final purchase price allocation, the following assets, including goodwill (which will not be deductible for tax purposes), were acquired and liabilities were assumed as of the Acquisition Date:
|
Reconciliation of goodwill recognized |
||||
|
|
|
in $ THOUS |
|
in € THOUS |
|
Fair value of consideration transferred of the Company’s interest in FHP |
|
|
|
|
|
Fair value of previously held equity method investment in InterWell Health LLC |
|
|
|
|
|
|
|
|
|
|
|
|
|
|
|
|
|
Fair Values of Assets Acquired and Liabilities Assumed |
|
|
|
|
|
Less: Cash and cash equivalents |
|
(
|
|
(
|
|
Less: Other assets |
|
(
|
|
(
|
|
Less: Intangible assets |
|
(
|
|
(
|
|
Other liabilities |
|
|
|
|
|
Noncontrolling interests |
|
|
|
|
|
Goodwill |
|
|
|
|
Investments (including debt securities) and purchases of intangible assets
Investments (including debt securities) and purchases of intangible assets were €
F-33
FRESENIUS MEDICAL CARE AG
NOTES TO THE CONSOLIDATED FINANCIAL STATEMENTS
(in THOUS, except share and per share data)
Divestitures and sale of debt securities and equity investments
Proceeds from divestitures and sale of debt securities were €
As a result of the loss of control relating to divestitures, the Company divested current assets of €
4. Disposal groups classified as held for sale
As of December 31, 2024, the Company’s management committed to a plan to sell the following in connection with its Legacy Portfolio Optimization program (as defined below):
| ● | the Company signed an agreement to sell its renal dialysis clinics in Brazil, currently included in its Care Delivery Segment; |
| ● | the Company signed an agreement to sell select assets of the Company’s wholly owned Spectra Laboratories, currently included in its Care Delivery segment; and |
| ● | the Company has committed to a plan to sell its renal dialysis clinics and products business in Kazakhstan, currently included in its Care Delivery and Care Enablement segments, respectively. |
Transactions which remain open as of the date of this report are subject to regulatory approvals or certain other closing conditions, but are expected to be completed within a year from the date of classification as assets held for sale. The sale of the select assets of the Company’s wholly owned Spectra Laboratories qualifies as a divestiture of a business. Immediately before the classification of the agreed-upon divestiture in Brazil as held for sale, an impairment loss was recognized and is included in other operating expenses in the consolidated statements of income. The carrying amount of the disposal group for the proposed divestiture of facilities in Brazil is recognized at its fair value less costs to sell. The portion of the non-recurring fair value measurement attributable to the Company and its shareholders of €
F-34
FRESENIUS MEDICAL CARE AG
NOTES TO THE CONSOLIDATED FINANCIAL STATEMENTS
(in THOUS, except share and per share data)
As of December 31, 2024 and 2023, the following assets and liabilities were classified as held for sale:
|
Assets and liabilities of disposal groups classified as held for sale |
|
|
|
|
|
in € THOUS |
|
|
|
|
|
|
|
2024 |
|
2023 |
|
|
|
|
|
|
|
Cash and cash equivalents |
|
|
|
|
|
Trade accounts and other receivables from unrelated parties |
|
|
|
|
|
Property, plant and equipment |
|
|
|
|
|
Right-of-use assets |
|
|
|
|
|
Goodwill (1) |
|
|
|
|
|
Other |
|
|
|
|
|
Assets held for sale |
|
|
|
|
|
|
|
|
|
|
|
Accounts payable to unrelated parties |
|
|
|
|
|
Lease liabilities |
|
|
|
|
|
Provisions and other liabilities |
|
|
|
|
|
Liability directly associated with assets held for sale |
|
|
|
|
| (1) | Goodwill was allocated to the disposal groups on a relative fair value basis. |
As of December 31, 2024 and 2023, the accumulated foreign currency translation losses recognized in other comprehensive income related to the disposal groups amounted to €
For information regarding disposal groups previously held for sale and subsequently divested, including the gains and losses recorded as a result of these divestitures, see notes 3 and 5 e).
5. Notes to the consolidated statements of income
a) Revenue
The Company recognized the following revenue in the consolidated statements of income for the years ended December 31, 2024, 2023 and 2022:
|
Revenue |
|
|
|
|
|
|
|
|
|
in € THOUS |
|
|
|
|
|
|
|
|
|
|
|
Revenue from |
|
Revenue from |
|
Revenue from |
|
|
|
|
|
contracts with |
|
insurance |
|
lease |
|
|
|
|
|
customers |
|
contracts |
|
contracts |
|
Total |
|
|
|
For the year ended December 31, 2024 |
||||||
|
|
|
|
|
|
|
|
|
|
|
Health care services |
|
|
|
|
|
— |
|
|
|
Health care products |
|
|
|
— |
|
|
|
|
|
Total |
|
|
|
|
|
|
|
|
|
|
|
|
|
|
|
|
|
|
|
|
|
For the year ended December 31, 2023 |
||||||
|
|
|
|
|
|
|
|
|
|
|
Health care services |
|
|
|
|
|
— |
|
|
|
Health care products |
|
|
|
— |
|
|
|
|
|
Total |
|
|
|
|
|
|
|
|
|
|
|
|
|
|
|
|
|
|
|
|
|
For the year ended December 31, 2022 |
||||||
|
|
|
|
|
|
|
|
|
|
|
Health care services |
|
|
|
|
|
— |
|
|
|
Health care products |
|
|
|
— |
|
|
|
|
|
Total |
|
|
|
|
|
|
|
|
F-35
FRESENIUS MEDICAL CARE AG
NOTES TO THE CONSOLIDATED FINANCIAL STATEMENTS
(in THOUS, except share and per share data)
The following table contains a disaggregation of revenue by categories for the years ended December 31, 2024, 2023 and 2022:
|
Disaggregation of revenue by categories |
|
|
|
|
|
|
|
in € THOUS |
|
|
|
|
|
|
|
|
|
For the year ended December 31, |
||||
|
|
|
2024 |
|
2023 |
|
2022 |
|
Care Delivery |
|
|
|
|
|
|
|
US |
|
|
|
|
|
|
|
International |
|
|
|
|
|
|
|
Total (1) |
|
|
|
|
|
|
|
|
|
|
|
|
|
|
|
Care Enablement |
|
|
|
|
|
|
|
Total (including inter-segment revenues) (1) |
|
|
|
|
|
|
|
Inter-segment eliminations |
|
(
|
|
(
|
|
(
|
|
Total Care Enablement revenue external customers |
|
|
|
|
|
|
|
Total |
|
|
|
|
|
|
| (1) | For further information on the revenue attributable to the Company’s operating segments, see note 29. |
The Company recognized the following amounts as receivables and contract liabilities relating to contracts with customers for the years ended December 31, 2024 and 2023:
|
Trade accounts receivables from unrelated parties and contract liabilities |
||||
|
in € THOUS |
||||
|
|
|
2024 |
|
2023 |
|
|
|
|
|
|
|
Trade accounts receivables from unrelated parties |
|
|
|
|
|
Contract liabilities |
|
|
|
|
Impairment loss in the amount of €
The change in contract liabilities during the period results from the ordinary course of business.
Contract liabilities primarily relate to advance payments from customers and to sales of dialysis machines where revenue is recognized upon installation and provision of the necessary technical instructions whereas a receivable is recognized once the machine is billed to the customer.
Contract liabilities are shown in the consolidated balance sheet in line items “Current provisions and other current liabilities” and “Non-current provisions and other non-current liabilities.”
At December 31, 2024, revenue recognized that was included in contract liabilities at the beginning of the period was €
At December 31, 2024, performance obligations of €
F-36
FRESENIUS MEDICAL CARE AG
NOTES TO THE CONSOLIDATED FINANCIAL STATEMENTS
(in THOUS, except share and per share data)
The expected recognition of the transaction price allocated to unsatisfied performance obligations as revenue for the next five years and in the aggregate for the five years thereafter is as follows:
|
Unsatisfied performance obligations |
||||
|
in € THOUS |
|
|
|
|
|
|
|
2024 |
|
2023 |
|
|
|
|
|
|
|
1 year |
|
|
|
|
|
1 - 3 years |
|
|
|
|
|
3 - 5 years |
|
|
|
|
|
5 - 10 years |
|
|
|
|
|
Total |
|
|
|
|
b) Selling, general and administrative expense
Selling, general and administrative expense recorded in the consolidated statements of income comprises both distribution costs as well as general and administrative expense. Distribution costs are generated in the selling, marketing and warehousing functions of the Company which are not attributable to production or R&D. General and administrative expense is generated in the administrative function of the Company’s business and is not attributable to selling, production or R&D.
The following table discloses the distribution costs as well as general and administrative expense recorded by the Company for the years ended December 31, 2024, 2023 and 2022:
|
Selling, general and administrative expense |
||||||
|
in € THOUS |
|
|
|
|
|
|
|
|
|
2024 |
|
2023 |
|
2022 |
|
Distribution costs |
|
|
|
|
|
|
|
General and administrative expense |
|
|
|
|
|
|
|
Selling, general and administrative expense |
|
|
|
|
|
|
c) Cost of materials
The cost of materials for the year ended December 31, 2024, 2023 and 2022 consisted of the following:
|
Cost of materials |
||||||
|
in € THOUS |
||||||
|
|
|
2024 |
|
2023 |
|
2022 |
|
|
|
|
|
|
|
|
|
Cost of raw materials, supplies and purchased components |
|
|
|
|
|
|
|
Cost of purchased services |
|
|
|
|
|
|
|
Cost of materials |
|
|
|
|
|
|
F-37
FRESENIUS MEDICAL CARE AG
NOTES TO THE CONSOLIDATED FINANCIAL STATEMENTS
(in THOUS, except share and per share data)
d) Personnel expenses
Personnel expenses included within costs of revenue, selling, general and administrative expenses and research and development expenses consisted of the following:
|
Personnel expenses |
||||||
|
in € THOUS |
||||||
|
|
|
2024 |
|
2023 |
|
2022 |
|
|
|
|
|
|
|
|
|
Wages and salaries (1) |
|
|
|
|
|
|
|
Social security contributions and cost of retirement benefits and social assistance (1) |
|
|
|
|
|
|
|
thereof retirement benefits (1) |
|
|
|
|
|
|
|
Personnel expenses |
|
|
|
|
|
|
| (1) |
Wages and salaries previously disclosed as
security
and cost of retirement benefits and social assistance in the amount of
€
|
The Company employed the following personnel on a total headcount basis, on average, for the following years:
|
Employees by function |
||||||
|
|
|
2024 |
|
2023 |
|
2022 |
|
|
|
|
|
|
|
|
|
Production and services |
|
|
|
|
|
|
|
Administration |
|
|
|
|
|
|
|
Sales and marketing |
|
|
|
|
|
|
|
Research and development |
|
|
|
|
|
|
|
Total employees |
|
|
|
|
|
|
F-38
FRESENIUS MEDICAL CARE AG
NOTES TO THE CONSOLIDATED FINANCIAL STATEMENTS
(in THOUS, except share and per share data)
e) Other operating income and expense
The following table contains reconciliations of the amounts included in other operating income and expense for the years ended December 31, 2024, 2023 and 2022:
|
Other operating income |
|
|
|
|
|
|
|
in € THOUS |
|
For the year ended December 31, |
||||
|
|
|
2024 |
|
2023 |
|
2022 |
|
|
|
|
|
|
|
|
|
Foreign exchange gains |
|
|
|
|
|
|
|
Gains on right-of-use assets, from the sale of fixed assets, clinics and investments |
|
|
|
|
|
|
|
Revaluation of certain investments |
|
|
|
|
|
— |
|
Income from strategic transactions and programs |
|
|
|
|
|
— |
|
Income attributable to a consent agreement on foregone profits from the sale of certain pharmaceuticals to non-associated companies |
|
|
|
|
|
|
|
Other |
|
|
|
|
|
|
|
Other operating income |
|
|
|
|
|
|
|
Other operating expense |
|
|
|
|
|
|
|
in € THOUS |
|
For the year ended December 31, |
||||
|
|
|
2024 |
|
2023 |
|
2022 |
|
|
|
|
|
|
|
|
|
Foreign exchange losses |
|
|
|
|
|
|
|
Losses on right-of-use assets, from the sale of fixed assets, clinics and investments |
|
|
|
|
|
|
|
Revaluation of certain investments |
|
|
|
— |
|
|
|
Expenses from strategic transactions and programs |
|
|
|
|
|
|
|
Other |
|
|
|
|
|
|
|
Other operating expense |
|
|
|
|
|
|
Included within the “income from strategic transactions and programs” line item in other operating income are the gains from divestitures of certain businesses in connection with strategic programs such as Legacy Portfolio Optimization, defined below. The amount presented for the year ended December 31, 2024 primarily relates to the revaluation of certain assets held for sale in the amount of €
F-39
FRESENIUS MEDICAL CARE AG
NOTES TO THE CONSOLIDATED FINANCIAL STATEMENTS
(in THOUS, except share and per share data)
Included within the “expenses from strategic transactions and programs” line item in other operating expense are the divestitures (including proposed divestitures as of each reporting date and associated impairment losses) of certain businesses in connection with strategic programs such as Legacy Portfolio Optimization, defined below, and the FME25 Program and, in 2022, costs related to the Interwell Health business combination. For further information on the divestitures and associated impairment losses, see note 4. Consistent with the Company’s policy to present impairment losses within other operating expense, such costs related to cost of revenues, selling, general and administrative expense or R&D expenses are included within other operating expense. “Expenses from strategic transactions and programs” primarily consist of:
| ● |
strategic divestiture program expenses identified during the review of the Company’s business portfolio, mainly due to exiting unsustainable markets and divesting non-core businesses, as well as the cessation of certain R&D programs to enable more focused capital allocation towards areas in the Company’s core business that are expected to have higher profitable growth. In 2024 and 2023, the amount includes the proposed divestitures identified in note 4, the cessation of a dialysis cycler development program, impairment losses resulting from the measurement of asset held for sale (NCP as well as the Company’s service businesses in Colombia, Brazil, Ecuador, Türkiye, Peru, Guatemala, Curacao), the divestitures of the Company’s service businesses in Colombia, Argentina, Chile, Ecuador, Sub-Saharan Africa, Türkiye, Guatemala, Curacao, Peru and the Cura Day Hospitals Group in Australia (Legacy Portfolio Optimization) and the write-down of non-current assets and a provision for onerous contracts related to the proposed divestitures. For the year ended December 31, 2024, the Company recorded a net loss related to reclassification adjustments of foreign currency translation in the amount of
€
|
| ● | certain impairment losses in connection with the FME25 Program; |
| ● | certain costs associated with the Conversion, primarily related to the requisite relabeling of its products, transaction costs (such as costs for external advisors and conducting an extraordinary general meeting) and costs related to the establishment of dedicated administrative functions required to manage certain services which have historically been administered at the Fresenius SE group level and paid by the Company through corporate charges (Legal Form Conversion Costs); and |
| ● |
expenses and impairment loss related to the InterWell Health business combination. As contemplated in the agreement, the Company transferred Acumen Physician Solutions, LLC (Acumen) to NewCo shortly after the Acquisition Date with working capital in the amount of
$
|
F-40
FRESENIUS MEDICAL CARE AG
NOTES TO THE CONSOLIDATED FINANCIAL STATEMENTS
(in THOUS, except share and per share data)
Expenses from strategic transactions and programs comprised the following for the years ended December 31, 2024, 2023 and 2022:
|
Expenses from strategic transactions and programs |
|
|
|
|
|
|
|
in € THOUS |
|
|
|
|
|
|
|
|
|
For the year ended December 31, |
||||
|
|
|
2024 |
|
2023 |
|
2022 |
|
Derecognition of capitalized development costs and termination costs (1) |
|
— |
|
|
|
— |
|
Legacy Portfolio Optimization |
|
— |
|
|
|
— |
|
Impairment of intangible and tangible assets (2) |
|
|
|
|
|
|
|
Legacy Portfolio Optimization |
|
|
|
|
|
— |
|
FME25 Program |
|
|
|
|
|
|
|
Interwell Health |
|
— |
|
— |
|
|
|
Other |
|
— |
|
— |
|
|
|
Impairment resulting from the measurement of assets held for sale |
|
|
|
|
|
— |
|
Legacy Portfolio Optimization |
|
|
|
|
|
— |
|
FME25 Program |
|
— |
|
|
|
— |
|
Loss from the sale of business |
|
|
|
|
|
— |
|
Legacy Portfolio Optimization |
|
|
|
|
|
— |
|
Other (3) |
|
|
|
|
|
|
|
Legacy Portfolio Optimization |
|
|
|
|
|
— |
|
Legal Form Conversion Costs |
|
|
|
|
|
— |
|
FME25 Program |
|
|
|
— |
|
— |
|
Interwell Health transaction-related costs |
|
— |
|
— |
|
|
|
Expenses from strategic transactions and programs |
|
|
|
|
|
|
| (1) | Primarily research and development expense. |
| (2) | For the year ended December 31, 2024, the amount relates primarily to cost of revenues and selling, general and administrative expense, while the amounts for the years ended December 31, 2023 and 2022, relate primarily to R&D expense and cost of revenues, respectively. |
| (3) | For the year ended December 31, 2024, the amount relates primarily to selling, general and administrative expense, while the amounts for the years ended December 31, 2023 and 2022, relate primarily to selling, general and administrative expense. |
For more information on the disposal groups classified as held for sale, see note 4.
F-41
FRESENIUS MEDICAL CARE AG
NOTES TO THE CONSOLIDATED FINANCIAL STATEMENTS
(in THOUS, except share and per share data)
f) Net interest
Net interest in the amount of €
g) Income taxes
Income before income taxes is attributable to the following geographic locations:
|
Income before income taxes |
||||||
|
in € THOUS |
||||||
|
|
|
2024 |
|
2023 |
|
2022 |
|
|
|
|
|
|
|
|
|
Germany |
|
(
|
|
(
|
|
(
|
|
United States |
|
|
|
|
|
|
|
Other |
|
|
|
|
|
|
|
Total |
|
|
|
|
|
|
Income tax expense (benefit) for the years ended December 31, 2024, 2023 and 2022 consisted of the following:
|
Income tax expense (benefit) |
||||||
|
in € THOUS |
||||||
|
|
|
2024 |
|
2023 |
|
2022 |
|
Current |
|
|
|
|
|
|
|
Germany |
|
|
|
|
|
(
|
|
United States |
|
|
|
|
|
|
|
Other |
|
|
|
|
|
|
|
|
|
|
|
|
|
|
|
Deferred |
|
|
|
|
|
|
|
Germany |
|
(
|
|
|
|
|
|
United States |
|
(
|
|
(
|
|
(
|
|
Other |
|
|
|
(
|
|
(
|
|
|
|
(
|
|
(
|
|
(
|
|
Total |
|
|
|
|
|
|
F-42
FRESENIUS MEDICAL CARE AG
NOTES TO THE CONSOLIDATED FINANCIAL STATEMENTS
(in THOUS, except share and per share data)
A reconciliation between the expected and actual income tax expense is shown below. The expected corporate income tax expense is computed by applying the German corporation tax rate (including the solidarity surcharge) and the trade tax rate on income before income taxes. The German combined statutory tax rates were
|
Reconciliation of income taxes |
|
||||||
|
in € THOUS |
|
||||||
|
|
|
2024 |
|
2023 |
|
2022 |
|
|
|
|
|
|
|
|
|
|
|
Expected corporate income tax expense |
|
|
|
|
|
|
|
|
Tax free income |
|
(
|
|
(
|
|
(
|
|
|
Income from equity method investees |
|
(
|
|
(
|
|
(
|
|
|
Tax rate differentials |
|
(
|
|
(
|
|
(
|
|
|
Non-deductible expenses |
|
|
|
|
|
|
|
|
Tax expense (income) for prior years |
|
|
|
(
|
|
(
|
|
|
Noncontrolling partnership interests |
|
(
|
|
(
|
|
(
|
|
|
Tax rate changes |
|
(
|
|
|
|
(
|
|
|
Change in realizability of deferred tax assets and tax credits |
|
|
|
|
|
|
|
|
Withholding taxes |
|
|
|
|
|
|
|
|
Other |
|
|
|
|
|
|
|
|
Income tax expense |
|
|
|
|
|
|
|
|
|
|
|
|
|
|
|
|
|
Effective tax rate |
|
|
% |
|
% |
|
% |
F-43
FRESENIUS MEDICAL CARE AG
NOTES TO THE CONSOLIDATED FINANCIAL STATEMENTS
(in THOUS, except share and per share data)
The tax effects of the temporary differences and net operating losses that give rise to deferred tax assets and liabilities at December 31, 2024 and 2023, are presented below:
|
Deferred income tax assets and liabilities |
||||
|
in € THOUS |
||||
|
|
|
2024 |
|
2023 |
|
Deferred tax assets |
|
|
|
|
|
Trade accounts receivable |
|
|
|
|
|
Inventories |
|
|
|
|
|
Intangible assets |
|
|
|
|
|
Property, plant and equipment and other non-current assets |
|
|
|
|
|
Lease liabilities |
|
|
|
|
|
Provisions and other liabilities |
|
|
|
|
|
Pension liabilities |
|
|
|
|
|
Net operating loss carryforwards, tax credit carryforwards and interest carryforwards |
|
|
|
|
|
Derivatives |
|
|
|
|
|
Other |
|
|
|
|
|
Total deferred tax assets |
|
|
|
|
|
|
|
|
|
|
|
Deferred tax liabilities |
|
|
|
|
|
Trade accounts receivable |
|
|
|
|
|
Inventories |
|
|
|
|
|
Intangible assets |
|
|
|
|
|
Property, plant and equipment and other non-current assets |
|
|
|
|
|
Right-of-use assets |
|
|
|
|
|
Provisions and other liabilities |
|
|
|
|
|
Pension liabilities |
|
|
|
|
|
Derivatives |
|
|
|
|
|
Other |
|
|
|
|
|
Total deferred tax liabilities |
|
|
|
|
|
Net deferred tax liabilities |
|
(
|
|
(
|
In the consolidated balance sheets, the accumulated amounts of deferred tax assets and liabilities are shown as follows:
|
Net deferred income tax assets and liabilities |
||||
|
in € THOUS |
||||
|
|
|
2024 |
|
2023 |
|
|
|
|
|
|
|
Deferred tax assets |
|
|
|
|
|
Deferred tax liabilities |
|
|
|
|
|
Net deferred tax liabilities |
|
(
|
|
(
|
The change in the balance of deferred tax assets and deferred tax liabilities does not equal the deferred tax expense/(benefit) due to deferred taxes that are booked directly to equity, the effects of exchange rate changes on tax assets and liabilities denominated in currencies other than euro and the acquisition and disposal of entities as part of ordinary activities.
F-44
FRESENIUS MEDICAL CARE AG
NOTES TO THE CONSOLIDATED FINANCIAL STATEMENTS
(in THOUS, except share and per share data)
The net operating losses included in the table below reflect U.S. federal tax, German corporate income tax and other tax loss carryforwards in the various countries in which the Company operates, and expire as follows:
|
Net operating loss carryforwards |
||||||
|
in € THOUS |
|
|
|
|
|
|
|
For the year ended December 31, 2024 |
|
For the year ended December 31, 2023 |
||||
|
2025 |
|
|
|
2024 |
|
|
|
2026 |
|
|
|
2025 |
|
|
|
2027 |
|
|
|
2026 |
|
|
|
2028 |
|
|
|
2027 |
|
|
|
2029 |
|
|
|
2028 |
|
|
|
2030 |
|
|
|
2029 |
|
|
|
2031 |
|
|
|
2030 |
|
|
|
2032 |
|
|
|
2031 |
|
|
|
2033 |
|
|
|
2032 |
|
|
|
2034 and thereafter |
|
|
|
2033 and thereafter |
|
|
|
Without expiration date |
|
|
|
Without expiration date |
|
|
|
Total |
|
|
|
Total |
|
|
Included in the balance of net operating loss carryforwards at December 31, 2024 are €
In assessing the realizability of deferred tax assets, management considers to which extent it is probable that the deferred tax asset will be realized. The ultimate realization of deferred tax assets is dependent upon the generation of future taxable income during the periods in which those temporary differences and tax loss carryforwards become deductible. Management considers the expected reversal of deferred tax liabilities and projected future taxable income in making this assessment and believes it is probable the Company will realize the benefits of these deferred tax assets at December 31, 2024.
At December 31, 2024 and 2023, the Company had an unrecognized net deferred tax asset arising from unutilized notional interest deduction of $
At December 31, 2024, the Company recognized income tax expenses related to Pillar Two income taxes in the amount of €
F-45
FRESENIUS MEDICAL CARE AG
NOTES TO THE CONSOLIDATED FINANCIAL STATEMENTS
(in THOUS, except share and per share data)
6. Related party transactions
Fresenius SE is the Company’s largest shareholder and owns
a) Service agreements and products
Prior to the Conversion, the Company was party to service agreements with Fresenius SE and certain of its affiliates (collectively, Fresenius SE Companies) to receive services, including, but not limited to: administrative services, management information services, employee benefit administration, insurance, information technology services, tax services and treasury management services. These related party agreements generally had a duration of
In connection with and subsequent to the Conversion, the Company entered into transition service agreements with Fresenius SE Companies to receive services, including, but not limited to: administrative and facility management services, employee benefit administration, insurance brokerage, information technology, intellectual property and certain treasury services. These related party agreements have generally been entered into for transitional periods of several months up to
The Company provides administrative services to one of its equity method investees.
The Company also sells products to Fresenius SE Companies and purchases products from Fresenius SE Companies and equity method investees. In connection with, and subsequent to, the Conversion, the Company entered into a limited amount of shared procurement contracts with Fresenius SE Companies for the purchase of products from third parties.
In December 2010, the Company and Galenica Ltd. (now known as CSL Vifor) formed the renal pharmaceutical company Vifor Fresenius Medical Care Renal Pharma Ltd., an equity method investee of which the Company owns
F-46
FRESENIUS MEDICAL CARE AG
NOTES TO THE CONSOLIDATED FINANCIAL STATEMENTS
(in THOUS, except share and per share data)
Below is a summary, including the Company’s receivables from and payables to the indicated parties, resulting from the above-described transactions with related parties.
|
Service agreements and products with related parties |
||||||||||||||||||||
|
in € THOUS |
||||||||||||||||||||
|
|
|
2024 |
|
2023 |
|
2022 |
|
December 31, 2024 |
|
December 31, 2023 |
||||||||||
|
|
|
Sales of |
|
Purchases of |
|
Sales of |
|
Purchases of |
|
Sales of |
|
Purchases of |
|
|
|
|
|
|
|
|
|
|
|
goods and |
|
goods and |
|
goods and |
|
goods and |
|
goods and |
|
goods and |
|
Accounts |
|
Accounts |
|
Accounts |
|
Accounts |
|
|
|
services |
|
services |
|
services |
|
services |
|
services |
|
services |
|
receivable |
|
payable |
|
receivable |
|
payable |
|
Service agreements (1) |
|
|
|
|
|
|
|
|
|
|
|
|
|
|
|
|
|
|
|
|
|
Fresenius SE |
|
|
|
|
|
|
|
|
|
|
|
|
|
|
|
|
|
|
|
|
|
Fresenius SE affiliates |
|
|
|
|
|
|
|
|
|
|
|
|
|
|
|
|
|
|
|
|
|
Equity method investees |
|
|
|
|
|
|
|
|
|
|
|
— |
|
|
|
— |
|
|
|
— |
|
Total |
|
|
|
|
|
|
|
|
|
|
|
|
|
|
|
|
|
|
|
|
|
|
|
|
|
|
|
|
|
|
|
|
|
|
|
|
|
|
|
|
|
|
|
Products |
|
|
|
|
|
|
|
|
|
|
|
|
|
|
|
|
|
|
|
|
|
Fresenius SE affiliates (2) |
|
|
|
|
|
|
|
|
|
|
|
|
|
|
|
|
|
|
|
|
|
Equity method investees |
|
— |
|
|
|
— |
|
|
|
— |
|
|
|
— |
|
|
|
— |
|
|
|
Total |
|
|
|
|
|
|
|
|
|
|
|
|
|
|
|
|
|
|
|
|
| (1) |
In addition to the above shown accounts payable, accrued expenses for service agreements with related parties amounted to
€
|
| (2) |
Purchases of goods related to Fresenius SE affiliates for the year ended December 31, 2023 and 2022 in the amount of
€
|
b) Lease agreements
In addition to the above-mentioned product and service agreements, the Company is a party to real estate lease agreements with Fresenius SE Companies, which mainly include leases for the Company’s corporate headquarters in Bad Homburg, Germany, and production sites in Schweinfurt and St. Wendel, Germany. The leases have maturities up to the end of 2032. In December 2022, the Company sold a building and other assets to a Fresenius SE Company for consideration in the aggregated amount of €
Below is a summary resulting from the above described lease agreements with related parties.
|
Lease agreements with related parties |
||||||||||||||||||
|
in € THOUS |
||||||||||||||||||
|
|
|
2024 |
|
2023 |
|
2022 |
||||||||||||
|
|
|
|
|
Interest |
|
Lease |
|
|
|
Interest |
|
Lease |
|
|
|
Interest |
|
Lease |
|
|
|
Depreciation |
|
expense |
|
expense (1) |
|
Depreciation |
|
expense |
|
expense (1) |
|
Depreciation |
|
expense |
|
expense (1) |
|
Fresenius SE |
|
|
|
|
|
|
|
|
|
|
|
|
|
|
|
|
|
|
|
Fresenius SE affiliates |
|
|
|
|
|
— |
|
|
|
|
|
— |
|
|
|
|
|
— |
|
Total |
|
|
|
|
|
|
|
|
|
|
|
|
|
|
|
|
|
|
| (1) | Short-term leases and expenses relating to variable lease payments as well as low value leases are exempted from balance sheet recognition. |
|
Lease agreements with related parties |
||||||||
|
in € THOUS |
||||||||
|
|
|
December 31, 2024 |
|
December 31, 2023 |
||||
|
|
|
Right-of-use |
|
Lease |
|
Right-of-use |
|
Lease |
|
|
|
asset |
|
liability |
|
asset |
|
liability |
|
Fresenius SE |
|
|
|
|
|
|
|
|
|
Fresenius SE affiliates |
|
|
|
|
|
|
|
|
|
Total |
|
|
|
|
|
|
|
|
c) Financing
As of December 31, 2024 and December 31, 2023, the Company had outstanding accounts payable related to a cash pooling program with certain equity-method investees in the amount of €
F-47
FRESENIUS MEDICAL CARE AG
NOTES TO THE CONSOLIDATED FINANCIAL STATEMENTS
(in THOUS, except share and per share data)
d) Key management personnel
Due to the Company’s previous legal form of a German partnership limited by shares until the effectiveness of the Conversion, Fresenius Medical Care Management AG (Management AG), the Company’s former general partner (General Partner), held a key management position within the Company. In addition, as key management personnel, members of the management board and supervisory board of Management AG, as well as their close relatives, were considered related parties. Upon effectiveness of the Conversion, the General Partner exited the Company and is no longer entitled to reimbursement of the remuneration of its board members. The members of the Supervisory Board and the newly established Management Board, as key management personnel, as well as their close relatives, are considered related parties of the Company. Also upon effectiveness of the Conversion, the existing service agreements between the General Partner and the members of the management board of Management AG were transferred to FME AG at unchanged conditions. The Company’s unfunded pension plan in Germany also comprises the benefit obligations of former board members of Management AG as well as of active board members which were appointed to the Management Board before January 1, 2019 in the amount of €
Prior to the Conversion, the Company’s Articles of Association provided that the General Partner shall be reimbursed for any and all expenses in connection with the management of the Company’s business, including remuneration of the members of the General Partner’s supervisory board and the members of the management board of Management AG. The aggregate amount reimbursed to the General Partner was €
For information regarding compensation of the Management Board and the Supervisory Board of the Company see note 31.
7. Cash and cash equivalents
As of December 31, 2024 and 2023, cash and cash equivalents are as follows:
|
Cash and cash equivalents |
||||
|
in € THOUS |
||||
|
|
|
2024 |
|
2023 |
|
Cash |
|
|
|
|
|
Securities and time deposits |
|
|
|
|
|
Cash and cash equivalents |
|
|
|
|
The cash and cash equivalents disclosed in the table above, and respectively in the consolidated statement of cash flows, include at December 31, 2024 an amount of €
For further information on the Company’s multi-currency notional pooling cash management system, see note 16.
F-48
FRESENIUS MEDICAL CARE AG
NOTES TO THE CONSOLIDATED FINANCIAL STATEMENTS
(in THOUS, except share and per share data)
8. Trade accounts and other receivables from unrelated parties
As of December 31, 2024 and December 31, 2023, trade accounts and other receivables from unrelated parties are as follows:
|
Trade accounts and other receivables from unrelated parties |
||||||||
|
in € THOUS |
||||||||
|
|
|
December 31, |
|
December 31, |
||||
|
|
|
2024 |
|
2023 |
||||
|
|
|
|
|
thereof credit- |
|
|
|
thereof credit- |
|
|
|
|
|
impaired (1) |
|
|
|
impaired (1) |
|
Trade accounts and other receivables, gross |
|
|
|
|
|
|
|
|
|
thereof finance lease receivables |
|
|
|
— |
|
|
|
— |
|
less expected credit losses |
|
(
|
|
(
|
|
(
|
|
(
|
|
Trade accounts and other receivables |
|
|
|
|
|
|
|
|
| (1) | Trade accounts receivable balances are credit-impaired when one or more events have occurred that have a detrimental impact on the estimated future cash flows of the receivable balance (e.g. overdue by more than one year, etc.). |
Other receivables in the amount of €
All trade accounts and other receivables from unrelated parties are due within
Trade accounts receivables and finance lease receivables with a term of more than one year in the amount of €
When utilized, the Company assigned interests in certain receivables to institutional investors under its Accounts Receivable Facility (as defined below), which was fully repaid during 2024. The receivables assigned under the facility amounted to $
The following table shows the development of expected credit losses in the fiscal years 2024, 2023 and 2022:
|
Development of expected credit losses for doubtful accounts from unrelated parties |
||||||
|
in THOUS € |
||||||
|
|
|
2024 |
|
2023 |
|
2022 |
|
|
|
|
|
|
|
|
|
Expected credit losses as of January 1 |
|
|
|
|
|
|
|
Change in valuation allowances as recorded in the consolidated statements of income |
|
|
|
|
|
|
|
Write-offs and recoveries of amounts previously written-off |
|
(
|
|
(
|
|
(
|
|
Changes in consolidation group |
|
(
|
|
(
|
|
— |
|
Reclassifications (1) |
|
(
|
|
(
|
|
— |
|
Foreign currency translation |
|
(
|
|
(
|
|
(
|
|
Expected credit losses as of December 31 |
|
|
|
|
|
|
| (1) | Includes expected credit losses related to trade accounts and other receivables from unrelated parties which have been reclassified as assets held for sale. |
F-49
FRESENIUS MEDICAL CARE AG
NOTES TO THE CONSOLIDATED FINANCIAL STATEMENTS
(in THOUS, except share and per share data)
The following tables show the aging analysis of trade accounts and other receivables from unrelated parties and expected credit losses as of December 31, 2024 and as of December 31, 2023:
Aging analysis of trade accounts and other receivables from unrelated parties 2024
in € THOUS
|
|
|
|
|
up to 3 |
|
3 to 6 |
|
6 to 12 |
|
more than |
|
|
|
|
|
not |
|
months |
|
months |
|
months |
|
12 months |
|
|
|
|
|
overdue |
|
overdue |
|
overdue |
|
overdue |
|
overdue |
|
Total |
|
|
|
|
|
|
|
|
|
|
|
|
|
|
|
Trade accounts and other receivables |
|
|
|
|
|
|
|
|
|
|
|
|
|
less expected credit losses |
|
(
|
|
(
|
|
(
|
|
(
|
|
(
|
|
(
|
|
Trade accounts and other receivables, net |
|
|
|
|
|
|
|
|
|
|
|
|
Aging analysis of trade accounts and other receivables from unrelated parties 2023
in € THOUS
|
|
|
|
|
up to 3 |
|
3 to 6 |
|
6 to 12 |
|
more than |
|
|
|
|
|
not |
|
months |
|
months |
|
months |
|
12 months |
|
|
|
|
|
overdue |
|
overdue |
|
overdue |
|
overdue |
|
overdue |
|
Total |
|
|
|
|
|
|
|
|
|
|
|
|
|
|
|
Trade accounts and other receivables |
|
|
|
|
|
|
|
|
|
|
|
|
|
less expected credit losses |
|
(
|
|
(
|
|
(
|
|
(
|
|
(
|
|
(
|
|
Trade accounts and other receivables, net |
|
|
|
|
|
|
|
|
|
|
|
|
The following table provides a reconciliation of the Company’s portfolios of insurance and reinsurance contracts, showing the change in insurance and reinsurance contract receivables (liabilities) as of December 31, 2024 and 2023. These receivables are recognized in the consolidated balance sheet within trade accounts and other receivables from unrelated parties (accounts payable to unrelated parties) which were previously presented on a net basis within trade accounts and other receivables from unrelated parties as of December 31, 2023.
|
Reinsurance contract receivables and liabilities |
|
|
|
|
|
|
|
|
|
|
|
|
|
in € THOUS |
|
|
|
|
|
|
|
|
|
|
|
|
|
|
|
2024 |
|
2023 |
||||||||
|
|
|
Present value of |
|
Risk adjustment for |
|
|
|
Present value of |
|
Risk adjustment for |
|
|
|
|
|
future cash flows |
|
non-financial risk |
|
Total |
|
future cash flows |
|
non-financial risk |
|
Total |
|
Reinsurance contract receivables (liabilities) as at January 1, |
|
|
|
(
|
|
|
|
|
|
(
|
|
|
|
Incurred claims and other directly attributable expenses |
|
(
|
|
|
|
(
|
|
(
|
|
|
|
(
|
|
Changes that relate to past service – changes in the fulfillment cash-flows relating to LIC (1) |
|
(
|
|
— |
|
(
|
|
|
|
— |
|
|
|
Claims and other directly attributable expenses paid |
|
(
|
|
— |
|
(
|
|
(
|
|
— |
|
(
|
|
Premium revenue |
|
|
|
— |
|
|
|
|
|
— |
|
|
|
Foreign currency translation and other changes |
|
|
|
(
|
|
|
|
(
|
|
|
|
(
|
|
Reinsurance contract receivables (liabilities) as at December 31, |
|
(
|
|
(
|
|
(
|
|
|
|
(
|
|
|
| (1) |
Changes that relate to past service include premium revenue, or a reduction in premium revenue, for past performance years of
€(
|
F-50
FRESENIUS MEDICAL CARE AG
NOTES TO THE CONSOLIDATED FINANCIAL STATEMENTS
(in THOUS, except share and per share data)
|
Insurance contract receivables and liabilities |
|
|
|
|
|
|
|
|
|
|
|
|
|
in € THOUS |
|
2024 |
|
2023 |
||||||||
|
|
|
Present value of |
|
Risk adjustment for |
|
|
|
Present value of |
|
Risk adjustment for |
|
|
|
|
|
future cash flows |
|
non-financial risk |
|
Total |
|
future cash flows |
|
non-financial risk |
|
Total |
|
Insurance contract receivables (liabilities) as at January 1, |
|
|
|
(
|
|
|
|
|
|
(
|
|
|
|
Incurred claims and other directly attributable expenses |
|
(
|
|
— |
|
(
|
|
(
|
|
(
|
|
(
|
|
Changes that relate to past service – changes in the fulfillment cash-flows relating to LIC (1) |
|
(
|
|
— |
|
(
|
|
(
|
|
— |
|
(
|
|
Claims and other directly attributable expenses paid |
|
(
|
|
— |
|
(
|
|
(
|
|
— |
|
(
|
|
Premium revenue |
|
|
|
— |
|
|
|
|
|
— |
|
|
|
Foreign currency translation and other changes |
|
|
|
(
|
|
|
|
(
|
|
|
|
(
|
|
Insurance contract receivables (liabilities) as at December 31, |
|
(
|
|
(
|
|
(
|
|
|
|
(
|
|
|
| (1) |
Changes that relate to past service include premium revenue, or a reduction in premium revenue, for past performance years of
€(
|
9. Inventories
At December 31, 2024 and December 31, 2023, inventories consisted of the following:
Inventories
in € THOUS
|
|
|
2024 |
|
2023 |
|
|
|
|
|
|
|
Finished goods |
|
|
|
|
|
Health care supplies |
|
|
|
|
|
Raw materials and purchased components |
|
|
|
|
|
Work in process |
|
|
|
|
|
Inventories |
|
|
|
|
Under the terms of certain unconditional purchase agreements, the Company is obligated to purchase approximately €
Write-downs of inventories amounted to €
10. Other current financial and non-financial assets
At December 31, 2024 and 2023, other current financial assets consisted of the following:
|
Other current financial assets |
|
|
|
|
|
in € THOUS |
|
|
|
|
|
|
|
2024 |
|
2023 |
|
|
|
|
|
|
|
Debt securities |
|
|
|
|
|
Notes receivable |
|
|
|
|
|
Receivables for supplier rebates |
|
|
|
|
|
Derivatives |
|
|
|
|
|
Third party receivables from the sale of investments |
|
|
|
|
|
Deposit / guarantee / security |
|
|
|
|
|
Loans to customers or suppliers |
|
|
|
|
|
Other |
|
|
|
(
|
|
Total |
|
|
|
|
F-51
FRESENIUS MEDICAL CARE AG
NOTES TO THE CONSOLIDATED FINANCIAL STATEMENTS
(in THOUS, except share and per share data)
The item “Other” in the table above includes receivables related to consent agreement on certain pharmaceuticals as of December 31, 2024.
At December 31, 2024 and 2023, other current assets consisted of the following:
Other current assets
in € THOUS
|
|
|
2024 |
|
2023 |
|
|
|
|
|
|
|
Income tax receivable |
|
|
|
|
|
Other tax receivable |
|
|
|
|
|
Payments on account |
|
|
|
|
|
Prepaid insurance |
|
|
|
|
|
Interest receivables related to income tax |
|
|
|
|
|
Prepaid rent |
|
|
|
|
|
Other |
|
|
|
|
|
Total |
|
|
|
|
The item “Other” in the table above includes various prepaid expenses relating to, amongst others, utility costs and freight expense.
11. Property, plant and equipment
At December 31, 2024 and 2023, the acquisition or manufacturing costs and the accumulated depreciation and impairment of property, plant and equipment consisted of the following:
Acquisition or manufacturing costs
in € THOUS
|
|
|
|
|
Foreign |
|
Changes in |
|
|
|
|
|
|
|
|
|
|
|
January 1, |
|
currency |
|
consolidation |
|
|
|
|
|
|
|
December 31, |
|
|
|
2024 |
|
translation |
|
group |
|
Additions |
|
Reclassifications |
|
Disposals |
|
2024 |
|
|
|
|
|
|
|
|
|
|
|
|
|
|
|
|
|
Land |
|
|
|
(
|
|
(
|
|
|
|
(
|
|
(
|
|
|
|
Buildings and improvements |
|
|
|
|
|
(
|
|
|
|
|
|
(
|
|
|
|
Machinery and equipment |
|
|
|
|
|
(
|
|
|
|
(
|
|
(
|
|
|
|
Construction in progress |
|
|
|
|
|
(
|
|
|
|
(
|
|
(
|
|
|
|
Property, plant and equipment |
|
|
|
|
|
(
|
|
|
|
(
|
|
(
|
|
|
Acquisition or manufacturing costs
in € THOUS
|
|
|
|
|
Foreign |
|
Changes in |
|
|
|
|
|
|
|
|
|
|
|
January 1, |
|
currency |
|
consolidation |
|
|
|
|
|
|
|
December 31, |
|
|
|
2023 |
|
translation |
|
group |
|
Additions |
|
Reclassifications |
|
Disposals |
|
2023 |
|
|
|
|
|
|
|
|
|
|
|
|
|
|
|
|
|
Land |
|
|
|
(
|
|
(
|
|
|
|
(
|
|
(
|
|
|
|
Buildings and improvements |
|
|
|
(
|
|
(
|
|
|
|
|
|
(
|
|
|
|
Machinery and equipment |
|
|
|
(
|
|
(
|
|
|
|
(
|
|
(
|
|
|
|
Construction in progress |
|
|
|
(
|
|
(
|
|
|
|
(
|
|
(
|
|
|
|
Property, plant and equipment |
|
|
|
(
|
|
(
|
|
|
|
(
|
|
(
|
|
|
F-52
FRESENIUS MEDICAL CARE AG
NOTES TO THE CONSOLIDATED FINANCIAL STATEMENTS
(in THOUS, except share and per share data)
Accumulated depreciation and impairment
in € THOUS
|
|
|
|
|
Foreign |
|
Changes in |
|
|
|
|
|
|
|
|
|
|
|
|
|
January 1, |
|
currency |
|
consolidation |
|
|
|
|
|
|
|
|
|
December 31, |
|
|
|
2024 |
|
translation |
|
group |
|
Additions |
|
Impairment |
|
Reclassifications |
|
Disposals |
|
2024 |
|
|
|
|
|
|
|
|
|
|
|
|
|
|
|
|
|
|
|
Land |
|
|
|
(
|
|
— |
|
— |
|
|
|
(
|
|
(
|
|
|
|
Buildings and improvements |
|
|
|
|
|
(
|
|
|
|
|
|
(
|
|
(
|
|
|
|
Machinery and equipment |
|
|
|
|
|
(
|
|
|
|
|
|
(
|
|
(
|
|
|
|
Construction in progress |
|
|
|
— |
|
— |
|
— |
|
— |
|
(
|
|
— |
|
— |
|
Property, plant and equipment |
|
|
|
|
|
(
|
|
|
|
|
|
(
|
|
(
|
|
|
Accumulated depreciation and impairment
in € THOUS
|
|
|
|
|
Foreign |
|
Changes in |
|
|
|
|
|
|
|
|
|
|
|
|
|
January 1, |
|
currency |
|
consolidation |
|
|
|
|
|
|
|
|
|
December 31, |
|
|
|
2023 |
|
translation |
|
group |
|
Additions |
|
Impairment |
|
Reclassifications |
|
Disposals |
|
2023 |
|
|
|
|
|
|
|
|
|
|
|
|
|
|
|
|
|
|
|
Land |
|
|
|
(
|
|
(
|
|
— |
|
|
|
|
|
(
|
|
|
|
Buildings and improvements |
|
|
|
(
|
|
(
|
|
|
|
|
|
(
|
|
(
|
|
|
|
Machinery and equipment |
|
|
|
(
|
|
(
|
|
|
|
|
|
(
|
|
(
|
|
|
|
Construction in progress |
|
— |
|
— |
|
|
|
— |
|
|
|
— |
|
— |
|
|
|
Property, plant and equipment |
|
|
|
(
|
|
(
|
|
|
|
|
|
(
|
|
(
|
|
|
Book value
in € THOUS
|
|
|
December 31, |
|
December 31, |
|
|
|
2024 |
|
2023 |
|
|
|
|
|
|
|
Land |
|
|
|
|
|
Buildings and improvements |
|
|
|
|
|
Machinery and equipment |
|
|
|
|
|
Construction in progress |
|
|
|
|
|
Property, plant and equipment |
|
|
|
|
Depreciation expense for property, plant and equipment amounted to €
Under the terms of certain unconditional purchase agreements, the Company is obligated to purchase approximately €
Included in machinery and equipment at December 31, 2024 and 2023 were €
F-53
FRESENIUS MEDICAL CARE AG
NOTES TO THE CONSOLIDATED FINANCIAL STATEMENTS
(in THOUS, except share and per share data)
At December 31, 2024 and 2023, the effects of hyperinflation on property, plant and equipment consisted of the following:
Effect of hyperinflation
in € THOUS
|
|
|
|
|
Accumulated |
|
|
|
|
|
Acquisition or |
|
depreciation |
|
December 31, |
|
|
|
manufacturing costs |
|
and impairment |
|
2024 |
|
|
|
|
|
|
|
|
|
Land |
|
— |
|
— |
|
— |
|
Buildings and improvements |
|
|
|
|
|
|
|
Machinery and equipment |
|
|
|
|
|
|
|
Construction in progress |
|
— |
|
— |
|
— |
|
Property, plant and equipment |
|
|
|
|
|
|
|
|
|
|
|
Accumulated |
|
|
|
|
|
Acquisition or |
|
depreciation |
|
December 31, |
|
|
|
manufacturing costs |
|
and impairment |
|
2023 |
|
|
|
|
|
|
|
|
|
Land |
|
|
|
— |
|
|
|
Buildings and improvements |
|
|
|
|
|
|
|
Machinery and equipment |
|
|
|
|
|
|
|
Construction in progress |
|
|
|
|
|
|
|
Property, plant and equipment |
|
|
|
|
|
|
12. Intangible assets and goodwill
At December 31, 2024 and 2023, the acquisition or manufacturing costs and the accumulated amortization and impairment of intangible assets and goodwill consisted of the following:
Acquisition or manufacturing costs
in € THOUS
|
|
|
|
|
Foreign |
|
Changes in |
|
|
|
|
|
|
|
|
|
|
|
January 1, |
|
currency |
|
consolidation |
|
|
|
|
|
|
|
December 31, |
|
|
|
2024 |
|
translation |
|
group |
|
Additions |
|
Reclassifications |
|
Disposals (1) |
|
2024 |
|
Amortizable intangible assets |
|
|
|
|
|
|
|
|
|
|
|
|
|
|
|
Non-compete agreements |
|
|
|
|
|
(
|
|
|
|
(
|
|
(
|
|
|
|
Technology |
|
|
|
|
|
— |
|
— |
|
(
|
|
(
|
|
|
|
Licenses and distribution agreements |
|
|
|
|
|
(
|
|
|
|
(
|
|
(
|
|
|
|
Customer relationships |
|
|
|
|
|
— |
|
— |
|
— |
|
(
|
|
|
|
Construction in progress |
|
|
|
|
|
— |
|
|
|
(
|
|
(
|
|
|
|
Internally developed intangibles |
|
|
|
|
|
(
|
|
|
|
|
|
(
|
|
|
|
Other |
|
|
|
|
|
(
|
|
|
|
(
|
|
(
|
|
|
|
|
|
|
|
|
|
(
|
|
|
|
(
|
|
(
|
|
|
|
Non-amortizable intangible assets |
|
|
|
|
|
|
|
|
|
|
|
|
|
|
|
Trade names |
|
|
|
|
|
— |
|
— |
|
|
|
(
|
|
|
|
Management contracts |
|
|
|
|
|
|
|
— |
|
— |
|
— |
|
|
|
Emission certificates |
|
|
|
— |
|
— |
|
— |
|
— |
|
(
|
|
|
|
|
|
|
|
|
|
|
|
— |
|
|
|
(
|
|
|
|
|
|
|
|
|
|
|
|
|
|
|
|
|
|
|
|
Intangible assets |
|
|
|
|
|
(
|
|
|
|
(
|
|
(
|
|
|
|
|
|
|
|
|
|
|
|
|
|
|
|
|
|
|
|
Goodwill |
|
|
|
|
|
(
|
|
— |
|
(
|
|
— |
|
|
| (1) |
Included within the amounts presented for non-compete agreements, licenses and distribution agreements, internally developed intangibles and other intangible assets are
€
|
F-54
FRESENIUS MEDICAL CARE AG
NOTES TO THE CONSOLIDATED FINANCIAL STATEMENTS
(in THOUS, except share and per share data)
Acquisition or manufacturing costs
in € THOUS
|
|
|
|
|
Foreign |
|
Changes in |
|
|
|
|
|
|
|
|
|
|
|
January 1, |
|
currency |
|
consolidation |
|
|
|
|
|
|
|
December 31, |
|
|
|
2023 |
|
translation |
|
group |
|
Additions |
|
Reclassifications |
|
Disposals |
|
2023 |
|
Amortizable intangible assets |
|
|
|
|
|
|
|
|
|
|
|
|
|
|
|
Non-compete agreements |
|
|
|
(
|
|
(
|
|
— |
|
(
|
|
(
|
|
|
|
Technology |
|
|
|
(
|
|
— |
|
|
|
|
|
(
|
|
|
|
Licenses and distribution agreements |
|
|
|
(
|
|
(
|
|
— |
|
(
|
|
(
|
|
|
|
Customer relationships |
|
|
|
(
|
|
(
|
|
— |
|
— |
|
— |
|
|
|
Construction in progress |
|
|
|
(
|
|
|
|
|
|
(
|
|
(
|
|
|
|
Internally developed intangibles |
|
|
|
(
|
|
(
|
|
|
|
|
|
(
|
|
|
|
Other |
|
|
|
(
|
|
(
|
|
|
|
|
|
(
|
|
|
|
|
|
|
|
(
|
|
(
|
|
|
|
|
|
(
|
|
|
|
Non-amortizable intangible assets |
|
|
|
|
|
|
|
|
|
|
|
|
|
|
|
Trade names |
|
|
|
(
|
|
|
|
— |
|
(
|
|
(
|
|
|
|
Management contracts |
|
|
|
(
|
|
— |
|
— |
|
— |
|
— |
|
|
|
Emission certificates |
|
|
|
— |
|
— |
|
|
|
— |
|
— |
|
|
|
|
|
|
|
(
|
|
|
|
|
|
(
|
|
(
|
|
|
|
|
|
|
|
|
|
|
|
|
|
|
|
|
|
|
|
Intangible assets |
|
|
|
(
|
|
(
|
|
|
|
(
|
|
(
|
|
|
|
|
|
|
|
|
|
|
|
|
|
|
|
|
|
|
|
Goodwill |
|
|
|
(
|
|
(
|
|
— |
|
(
|
|
— |
|
|
Accumulated amortization and impairment
in € THOUS
|
|
|
|
|
Foreign |
|
Changes in |
|
|
|
|
|
|
|
|
|
|
|
|
|
January 1, |
|
currency |
|
consolidation |
|
|
|
Impairment |
|
|
|
|
|
December 31, |
|
|
|
2024 |
|
translation |
|
group |
|
Additions |
|
loss |
|
Reclassifications |
|
Disposals (1) |
|
2024 |
|
Amortizable intangible assets |
|
|
|
|
|
|
|
|
|
|
|
|
|
|
|
|
|
Non-compete agreements |
|
|
|
|
|
(
|
|
|
|
|
|
(
|
|
(
|
|
|
|
Technology |
|
|
|
|
|
— |
|
|
|
— |
|
|
|
(
|
|
|
|
Licenses and distribution agreements |
|
|
|
|
|
(
|
|
|
|
— |
|
(
|
|
(
|
|
|
|
Customer relationships |
|
|
|
|
|
— |
|
|
|
— |
|
— |
|
(
|
|
|
|
Construction in progress |
|
|
|
|
|
— |
|
— |
|
— |
|
— |
|
(
|
|
— |
|
Internally developed intangibles |
|
|
|
|
|
(
|
|
|
|
|
|
(
|
|
(
|
|
|
|
Other |
|
|
|
|
|
(
|
|
|
|
|
|
(
|
|
(
|
|
|
|
|
|
|
|
|
|
(
|
|
|
|
|
|
(
|
|
(
|
|
|
|
Non-amortizable intangible assets |
|
|
|
|
|
|
|
|
|
|
|
|
|
|
|
|
|
Trade names |
|
|
|
(
|
|
— |
|
— |
|
— |
|
— |
|
(
|
|
|
|
Management contracts |
|
|
|
|
|
— |
|
— |
|
— |
|
— |
|
— |
|
|
|
|
|
|
|
|
|
— |
|
— |
|
— |
|
— |
|
(
|
|
|
|
|
|
|
|
|
|
|
|
|
|
|
|
|
|
|
|
|
|
Intangible assets |
|
|
|
|
|
(
|
|
|
|
|
|
(
|
|
(
|
|
|
|
|
|
|
|
|
|
|
|
|
|
|
|
|
|
|
|
|
|
Goodwill |
|
|
|
|
|
(
|
|
— |
|
|
|
(
|
|
— |
|
|
| (1) |
Included within the amounts presented for non-compete agreements, licenses and distribution agreements, internally developed intangibles and other intangible assets are
€
|
F-55
FRESENIUS MEDICAL CARE AG
NOTES TO THE CONSOLIDATED FINANCIAL STATEMENTS
(in THOUS, except share and per share data)
Accumulated amortization and impairment
in € THOUS
|
|
|
|
|
Foreign |
|
Changes in |
|
|
|
|
|
|
|
|
|
|
|
|
|
January 1, |
|
currency |
|
consolidation |
|
|
|
Impairment |
|
|
|
|
|
December |
|
|
|
2023 |
|
translation |
|
group |
|
Additions |
|
loss |
|
Reclassifications |
|
Disposals |
|
31, 2023 |
|
Amortizable intangible assets |
|
|
|
|
|
|
|
|
|
|
|
|
|
|
|
|
|
Non-compete agreements |
|
|
|
(
|
|
(
|
|
|
|
|
|
(
|
|
(
|
|
|
|
Technology |
|
|
|
(
|
|
— |
|
|
|
— |
|
— |
|
— |
|
|
|
Licenses and distribution agreements |
|
|
|
(
|
|
(
|
|
|
|
|
|
|
|
(
|
|
|
|
Customer relationships |
|
|
|
(
|
|
(
|
|
|
|
— |
|
— |
|
— |
|
|
|
Construction in progress |
|
— |
|
(
|
|
— |
|
— |
|
|
|
— |
|
— |
|
|
|
Internally developed intangibles |
|
|
|
(
|
|
(
|
|
|
|
|
|
|
|
(
|
|
|
|
Other |
|
|
|
(
|
|
(
|
|
|
|
|
|
(
|
|
(
|
|
|
|
|
|
|
|
(
|
|
(
|
|
|
|
|
|
(
|
|
(
|
|
|
|
Non-amortizable intangible assets |
|
|
|
|
|
|
|
|
|
|
|
|
|
|
|
|
|
Trade names |
|
|
|
(
|
|
|
|
— |
|
— |
|
(
|
|
(
|
|
|
|
Management contracts |
|
|
|
(
|
|
— |
|
— |
|
— |
|
— |
|
— |
|
|
|
|
|
|
|
(
|
|
|
|
— |
|
— |
|
(
|
|
(
|
|
|
|
|
|
|
|
|
|
|
|
|
|
|
|
|
|
|
|
|
|
Intangible assets |
|
|
|
(
|
|
(
|
|
|
|
|
|
(
|
|
(
|
|
|
|
|
|
|
|
|
|
|
|
|
|
|
|
|
|
|
|
|
|
Goodwill |
|
|
|
(
|
|
(
|
|
— |
|
|
|
(
|
|
— |
|
|
Book value
in € THOUS
|
|
|
December 31, 2024 |
|
December 31, 2023 |
|
Amortizable intangible assets |
|
|
|
|
|
Non-compete agreements |
|
|
|
|
|
Technology |
|
|
|
|
|
Licenses and distribution agreements |
|
|
|
|
|
Customer relationships |
|
|
|
|
|
Construction in progress |
|
|
|
|
|
Internally developed intangibles |
|
|
|
|
|
Other |
|
|
|
|
|
|
|
|
|
|
|
Non-amortizable intangible assets |
|
|
|
|
|
Trade names |
|
|
|
|
|
Management contracts |
|
|
|
|
|
Emission certificates |
|
|
|
|
|
|
|
|
|
|
|
|
|
|
|
|
|
Intangible assets |
|
|
|
|
|
|
|
|
|
|
|
Goodwill |
|
|
|
|
The amortization of intangible assets amounted to €
The Company capitalized development costs of €
F-56
FRESENIUS MEDICAL CARE AG
NOTES TO THE CONSOLIDATED FINANCIAL STATEMENTS
(in THOUS, except share and per share data)
At December 31, 2024 and 2023, the effects of hyperinflation on intangible assets and goodwill consisted of the following:
Effect of hyperinflation
in € THOUS
|
|
|
|
|
Accumulated |
|
|
|
|
|
Acquisition or |
|
amortization and |
|
|
|
|
|
manufacturing costs |
|
impairment |
|
December 31, 2024 |
|
|
|
|
|
|
|
|
|
Non-compete agreements |
|
|
|
|
|
|
|
Licenses and distribution agreements |
|
|
|
|
|
|
|
Construction in progress |
|
|
|
— |
|
|
|
Internally developed intangibles |
|
|
|
|
|
|
|
Other |
|
|
|
|
|
|
|
Amortizable intangible assets |
|
|
|
|
|
|
|
Total Intangible assets |
|
|
|
|
|
|
|
Goodwill |
|
|
|
|
|
|
|
|
|
|
|
Accumulated |
|
|
|
|
|
Acquisition or |
|
amortization and |
|
|
|
|
|
manufacturing costs |
|
impairment |
|
December 31, 2023 |
|
|
|
|
|
|
|
|
|
Non-compete agreements |
|
|
|
|
|
|
|
Licenses and distribution agreements |
|
|
|
|
|
|
|
Construction in progress |
|
|
|
— |
|
|
|
Internally developed intangibles |
|
|
|
|
|
|
|
Other |
|
|
|
|
|
|
|
Amortizable intangible assets |
|
|
|
|
|
|
|
Total Intangible assets |
|
|
|
|
|
|
|
Goodwill |
|
|
|
|
|
|
Goodwill and intangible assets with indefinite useful lives
The increase in the carrying amount of goodwill during 2024 is mainly a result of the impact of foreign currency translations, partially offset by impacts of asset held for sale classifications and divestitures (for further information, see notes 3 and 4).
The carrying amount of goodwill and intangibles with indefinite useful lives is allocated to the groups of CGUs at December 31, 2024 and 2023:
Allocation of the carrying amount to the groups of CGUs
in € THOUS
|
|
|
Care Delivery |
|
Care Enablement |
||||
|
|
|
2024 |
|
2023 |
|
2024 |
|
2023 |
|
|
|
|
|
|
|
|
|
|
|
Goodwill |
|
|
|
|
|
|
|
|
|
Management contracts with indefinite useful life |
|
|
|
|
|
— |
|
— |
|
Trade names with indefinite useful life |
|
|
|
|
|
|
|
|
|
Emission certificates |
|
— |
|
— |
|
|
|
|
The Company did not record any impairment losses related to goodwill in 2024 and 2023 after comparing the value in use to the respective carrying amount for the Care Delivery and Care Enablement groups of CGUs.
F-57
FRESENIUS MEDICAL CARE AG
NOTES TO THE CONSOLIDATED FINANCIAL STATEMENTS
(in THOUS, except share and per share data)
13. Interests in associates
The following table shows the Company’s interests in associates of the Company which management considered to be material to the Company as of December 31, 2024 and 2023:
|
Interests in associates |
|
|
|
|
|
|
|
|
|
|
|
in € THOUS, except where otherwise specified |
|
|
|
|
|
|
|
|
|
|
|
|
|
Country of |
|
Ownership |
|
Method of |
|
|
|
|
|
Name of the entity |
|
incorporation |
|
interest in % |
|
measurement |
|
Carrying value |
||
|
|
|
|
|
|
|
|
|
2024 |
|
2023 |
|
|
|
|
|
|
|
|
|
|
|
|
|
Vifor Fresenius Medical Care Renal Pharma Ltd. |
|
Switzerland |
|
|
|
Equity method |
|
|
|
|
|
Other associates |
|
|
|
|
|
|
|
|
|
|
|
Equity method investees |
|
|
|
|
|
|
|
|
|
|
In December 2010, the Company and CSL Vifor formed a new renal pharmaceutical company, Vifor Fresenius Medical Care Renal Pharma Ltd., recognized as an equity method investee of which the Company owns
The following table contains the summarized financial information for Vifor Fresenius Medical Care Renal Pharma Ltd as of and for the year ended December 31, 2024 and 2023:
|
Summarized financial information |
|
|
|
|
|
In € THOUS |
|
|
|
|
|
Summarized balance sheets |
|
2024 |
|
2023 |
|
|
|
|
|
|
|
Current assets |
|
|
|
|
|
Non-current assets |
|
|
|
|
|
Current liabilities |
|
|
|
|
|
Non-current liabilities |
|
|
|
|
|
Net assets |
|
|
|
|
|
Reconciliation to carrying amounts (net assets) |
|
2024 |
|
2023 |
|
|
|
|
|
|
|
Opening balance net assets January 1, |
|
|
|
|
|
Profit for the period |
|
|
|
|
|
Other comprehensive income |
|
(
|
|
(
|
|
Dividends paid |
|
(
|
|
(
|
|
Foreign currency translation |
|
|
|
(
|
|
Closing balance net assets December 31, |
|
|
|
|
|
|
|
|
|
|
|
Company’s share in net assets |
|
|
|
|
|
Other reconciling items |
|
|
|
|
|
Eliminations |
|
(
|
|
(
|
|
Carrying amount |
|
|
|
|
F-58
FRESENIUS MEDICAL CARE AG
NOTES TO THE CONSOLIDATED FINANCIAL STATEMENTS
(in THOUS, except share and per share data)
|
|
|
For the year ended |
|
For the year ended |
|
Summarized statement of comprehensive income |
|
December 31, 2024 |
|
December 31, 2023 |
|
|
|
|
|
|
|
Revenue |
|
|
|
|
|
Profit from continuing operations |
|
|
|
|
|
Profit for the period |
|
|
|
|
|
Other comprehensive income |
|
(
|
|
(
|
|
Total comprehensive income |
|
|
|
|
|
|
|
|
|
|
|
Dividends received |
|
|
|
|
14. Other non-current financial assets
At December 31, 2024 and 2023, other non-current financial assets consisted of the following:
|
Other non-current financial assets |
|
|
|
|
|
in € THOUS |
|
|
|
|
|
|
|
2024 |
|
2023 |
|
|
|
|
|
|
|
Debt securities |
|
|
|
|
|
Equity investments |
|
|
|
|
|
Other financial assets |
|
|
|
|
|
|
|
|
|
|
|
Total |
|
|
|
|
15. Current provisions and other current financial and non-financial liabilities
Current provisions
The following table shows a reconciliation of the current provisions for 2024:
Development of current provisions
in € THOUS
|
|
|
|
|
Foreign |
|
Changes in |
|
|
|
|
|
|
|
|
|
|
|
|
|
January 1, |
|
currency |
|
consolidation |
|
|
|
|
|
|
|
|
|
|
|
|
|
2024 |
|
translation |
|
group |
|
Utilized |
|
Reversed |
|
Additions |
|
Reclassifications |
|
December 31, 2024 |
|
|
|
|
|
|
|
|
|
|
|
|
|
|
|
|
|
|
|
Personnel expenses |
|
|
|
|
|
(
|
|
(
|
|
(
|
|
|
|
|
|
|
|
Self-insurance programs |
|
|
|
|
|
— |
|
(
|
|
(
|
|
|
|
|
|
|
|
Risk of lawsuit |
|
|
|
|
|
(
|
|
(
|
|
(
|
|
|
|
(
|
|
|
|
Other current provisions |
|
|
|
|
|
(
|
|
(
|
|
(
|
|
|
|
(
|
|
|
|
Current provisions |
|
|
|
|
|
(
|
|
(
|
|
(
|
|
|
|
|
|
|
Self-insurance programs
See note 2 d).
F-59
FRESENIUS MEDICAL CARE AG
NOTES TO THE CONSOLIDATED FINANCIAL STATEMENTS
(in THOUS, except share and per share data)
Personnel expenses
Personnel expenses mainly refer to provisions for the Company’s global performance-based compensation plan for managerial staff, the current portion of the provisions for accrued severance payments, provisions for share-based plans and jubilee payments. As of December 31, 2024, provisions for the Company’s global performance-based compensation plan for managerial staff amounted to €
Risk of lawsuit
Legal matters that the Company currently deems to be material or noteworthy are described in note 25.
Other current provisions
The item “Other current provisions” in the table above includes provisions for onerous contracts, warranties, physician compensation and return of goods.
Other current financial liabilities
As of December 31, 2024 and 2023 other current financial liabilities consisted of the following:
|
Other current financial liabilities |
|
|
|
|
|
in € THOUS |
|
|
|
|
|
|
|
2024 |
|
2023 |
|
|
|
|
|
|
|
Put option liabilities |
|
|
|
|
|
Unapplied cash and receivable credit balances |
|
|
|
|
|
Invoices outstanding |
|
|
|
|
|
Derivatives |
|
|
|
|
|
Bonuses, commissions |
|
|
|
|
|
Legal matters, advisory and audit fees |
|
|
|
|
|
Variable payments outstanding for acquisitions |
|
|
|
|
|
Other |
|
|
|
|
|
Other current financial liabilities |
|
|
|
|
Other current liabilities
As of December 31, 2024 and 2023 other current liabilities consisted of the following:
Other current liabilities
in € THOUS
|
|
|
2024 |
|
2023 |
|
Personnel liabilities |
|
|
|
|
|
VAT and other (non-income) tax liabilities |
|
|
|
|
|
Contract liabilities |
|
|
|
|
|
Deferred Income |
|
|
|
|
|
Other liabilities |
|
|
|
|
|
Other current liabilities |
|
|
|
|
Personnel liabilities
The personnel liabilities mainly refer to liabilities for wages and salaries, bonuses and vacation payments.
F-60
FRESENIUS MEDICAL CARE AG
NOTES TO THE CONSOLIDATED FINANCIAL STATEMENTS
(in THOUS, except share and per share data)
Contract liabilities
Contract liabilities also relate to advance payments from customers and to sales of dialysis machines where revenue is recognized upon installation and provision of the necessary technical instructions whereas a receivable is recognized once the machine is billed to the customer.
Other liabilities
The item “Other liabilities” in the table above includes liabilities for the current portion of pension liabilities and interest payables related to income taxes.
16. Short-term debt
At December 31, 2024 and December 31, 2023, short-term debt consisted of the following:
Short-term debt
in € THOUS
|
|
|
2024 |
|
2023 |
|
Commercial paper program |
|
— |
|
|
|
Borrowings under lines of credit |
|
|
|
|
|
Other |
|
|
|
|
|
Short-term debt |
|
|
|
|
Commercial paper program
The Company maintains a commercial paper program under which short-term notes of up to €
Borrowings under lines of credit and further availabilities
Borrowings under lines of credit in the amount of €
Excluding amounts available under the Syndicated Credit Facility (see note 17 below), at December 31, 2024 and 2023, the Company had €
The Company and certain consolidated entities operate a multi-currency notional cash pooling management system. In this cash pooling management system, amounts in euro and other currencies are offset without being transferred to a specific cash pool account. The system is used for an efficient utilization of funds within the Company. The Company met the conditions to offset balances within this cash pool for reporting purposes. At December 31, 2024 and 2023, cash and borrowings under lines of credit in the amount of €
F-61
FRESENIUS MEDICAL CARE AG
NOTES TO THE CONSOLIDATED FINANCIAL STATEMENTS
(in THOUS, except share and per share data)
17. Long-term debt
As of December 31, 2024 and 2023, long-term debt consisted of the following:
Long-term debt
in € THOUS
|
|
|
2024 |
|
2023 |
|
|
|
|
|
|
|
Schuldschein loans |
|
|
|
|
|
Bonds |
|
|
|
|
|
Accounts Receivable Facility |
|
— |
|
|
|
Other |
|
|
|
|
|
Long-term debt |
|
|
|
|
|
Less current portion |
|
(
|
|
(
|
|
Long-term debt, less current portion |
|
|
|
|
The Company’s long-term debt as of December 31, 2024, all of which ranks equally in rights of payment, are described as follows:
Schuldschein loans
On February 14, 2022, the Company issued €
Bonds
At December 31, 2024 and 2023, the Company’s bonds consisted of the following:
Bonds
in THOUS
|
|
|
Face |
|
|
|
|
|
Book value in € |
|||
|
Issuer/Transaction |
|
amount |
|
Maturity |
|
Coupon |
|
2024 |
|
2023 |
|
|
FME US Finance II, Inc. 2014 |
|
$ |
|
|
October 15, 2024 |
|
|
% |
— |
|
|
|
Fresenius Medical Care AG, 2018 |
|
€ |
|
|
July 11, 2025 |
|
|
% |
|
|
|
|
Fresenius Medical Care AG, 2020 |
|
€ |
|
|
May 29, 2026 |
|
|
% |
|
|
|
|
Fresenius Medical Care AG, 2019 |
|
€ |
|
|
November 30, 2026 |
|
|
% |
|
|
|
|
FME US Finance III, Inc. 2021 |
|
$ |
|
|
December 1, 2026 |
|
|
% |
|
|
|
|
Fresenius Medical Care AG, 2022 |
|
€ |
|
|
September 20, 2027 |
|
|
% |
|
|
|
|
FME US Finance III, Inc. 2019 |
|
$ |
|
|
June 15, 2029 |
|
|
% |
|
|
|
|
Fresenius Medical Care AG, 2019 |
|
€ |
|
|
November 29, 2029 |
|
|
% |
|
|
|
|
Fresenius Medical Care AG, 2020 |
|
€ |
|
|
May 29, 2030 |
|
|
% |
|
|
|
|
FME US Finance III, Inc. 2020 |
|
$ |
|
|
February 16, 2031 |
|
|
% |
|
|
|
|
FME US Finance III, Inc. 2021 |
|
$ |
|
|
December 1, 2031 |
|
|
% |
|
|
|
|
|
|
|
|
|
|
|
|
|
|
|
|
All bonds issued by entities other than Fresenius Medical Care AG are guaranteed by the Company. All U.S. dollar bonds outstanding may be redeemed at the option of the respective issuers at any time at
F-62
FRESENIUS MEDICAL CARE AG
NOTES TO THE CONSOLIDATED FINANCIAL STATEMENTS
(in THOUS, except share and per share data)
The Company has agreed to a number of covenants to provide protection to the bond holders which, under certain circumstances, limit the ability of the Company and its subsidiaries to, among other things, incur debt, incur liens, engage in sale-leaseback transactions and merge or consolidate with other companies or sell assets. At December 31, 2024, the Company was in compliance with all of its covenants under the bonds.
Since 2018, bonds can be issued with different maturities under the Company’s €
On October 15, 2024, Fresenius Medical Care US Finance II, Inc. redeemed $
Accounts Receivable Facility
The Company maintained an accounts receivable securitization program (Accounts Receivable Facility) with a maximum capacity of $
The following table shows the available and outstanding amounts under the Accounts Receivable Facility at December 31, 2024 and December 31, 2023:
|
Accounts Receivable Facility - Maximum amount available and balance outstanding |
||||||||||||
|
in THOUS |
|
|
|
|
|
|
|
|
|
|
|
|
|
|
|
|
|
|
|
|
|
|
|
|
|
|
|
|
|
Maximum amount available |
|
Balance outstanding |
||||||||
|
|
|
2024 |
|
2024 |
||||||||
|
Accounts Receivable Facility |
|
$ |
— |
|
€ |
— |
|
$ |
— |
|
€ |
— |
|
|
|
Maximum amount available (1) |
|
Balance outstanding (2) |
||||||||
|
|
|
2023 |
|
2023 |
||||||||
|
Accounts Receivable Facility |
|
$ |
|
|
€ |
|
|
$ |
|
|
€ |
|
| (1) | Subject to availability of sufficient accounts receivable meeting funding criteria. |
| (2) | Amounts shown are excluding debt issuance costs and accrued interests. |
The Company also had letters of credit outstanding under the Accounts Receivable Facility in the amount of $
Credit Facilities
Syndicated Credit Facility
The Company entered into a €
Other
At December 31, 2024 and 2023, in conjunction with certain acquisitions and investments, the Company had fixed payments outstanding for acquisitions totaling approximately €
F-63
FRESENIUS MEDICAL CARE AG
NOTES TO THE CONSOLIDATED FINANCIAL STATEMENTS
(in THOUS, except share and per share data)
18. Non-current provisions and other non-current financial and non-financial liabilities
Of the total amount of non-current provisions and other non-current financial and non-financial liabilities amounting to €
|
Development of non-current provisions |
||||||||||||||||
|
in € THOUS |
|
|
|
|
|
|
|
|
|
|
|
|
|
|
|
|
|
|
|
|
|
Foreign |
|
Changes in |
|
|
|
|
|
|
|
|
|
|
|
|
|
January 1, |
|
currency |
|
consolidation |
|
|
|
|
|
|
|
|
|
December 31, |
|
|
|
2024 |
|
translation |
|
group |
|
Utilized |
|
Reversed |
|
Additions |
|
Reclassifications |
|
2024 |
|
|
|
|
|
|
|
|
|
|
|
|
|
|
|
|
|
|
|
Self-insurance programs |
|
|
|
|
|
— |
|
— |
|
— |
|
— |
|
(
|
|
|
|
Personnel expenses |
|
|
|
|
|
(
|
|
(
|
|
(
|
|
|
|
(
|
|
|
|
Asset retirement obligations |
|
|
|
(
|
|
|
|
(
|
|
(
|
|
|
|
— |
|
|
|
Interest payable related to income taxes |
|
|
|
|
|
— |
|
— |
|
— |
|
|
|
— |
|
|
|
Other non-current provisions |
|
|
|
(
|
|
(
|
|
(
|
|
(
|
|
|
|
(
|
|
|
|
Non-current provisions |
|
|
|
|
|
(
|
|
(
|
|
(
|
|
|
|
(
|
|
|
For further information regarding self-insurance programs, see note 2 d).
Personnel expenses mainly refer to provisions for severance payments and provisions for share-based plans. As of December 31, 2024, provisions for share-based plans amounted to €
The item “Other non-current provisions” in the table above includes provisions for litigation and warranties. The increase during the period that arises from the passage of time and the effect of any change in the discount rate are not material.
Other non-current financial liabilities
As of December 31, 2024 and 2023 other non-current financial liabilities consisted of the following:
|
Other non-current financial liabilities |
|
|
|
|
|
in € THOUS |
|
|
|
|
|
|
|
2024 |
|
2023 |
|
|
|
|
|
|
|
Put option liabilities |
|
|
|
|
|
Variable payments outstanding for acquisitions |
|
|
|
|
|
Other |
|
|
|
|
|
Other non-current financial liabilities |
|
|
|
|
F-64
FRESENIUS MEDICAL CARE AG
NOTES TO THE CONSOLIDATED FINANCIAL STATEMENTS
(in THOUS, except share and per share data)
Other non-current liabilities
As of December 31, 2024 and 2023 other non-current liabilities consisted of the following:
|
Other non-current liabilities |
|
|
|
|
|
in € THOUS |
|
|
|
|
|
|
|
2024 |
|
2023 |
|
|
|
|
|
|
|
Labor Expense non-current |
|
|
|
|
|
Deferred Income |
|
|
|
|
|
Other |
|
|
|
|
|
Other non-current liabilities |
|
|
|
|
19. Employee benefit plans
General
The Company recognizes pension costs and related pension liabilities for current and future benefits to qualified current and former employees of the Company. The Company’s pension plans are structured in accordance with the differing legal, economic and fiscal circumstances in each country. The Company currently has two types of plans, defined benefit and defined contribution plans. In general, plan benefits in defined benefit plans are based on all or a portion of the employees’ years of services and final salary. Plan benefits in defined contribution plans are determined by the amount of contribution by the employee and the employer, both of which may be limited by legislation, and the returns earned on the investment of those contributions.
Upon retirement under defined benefit plans, the Company is required to pay defined benefits to former employees when the defined benefits become due. Defined benefit plans may be funded or unfunded. The Company has
Actuarial assumptions generally determine benefit obligations under defined benefit plans. The actuarial calculations require the use of estimates. The main factors used in the actuarial calculations affecting the level of the benefit obligations are: assumptions on life expectancy, the discount rate and future salary and benefit levels. Under the Company’s funded plans, assets are set aside to meet future payment obligations. An estimated return on the plan assets is recognized as income in the respective period. Actuarial gains and losses are generated when there are variations in the actuarial assumptions and by differences between the actual and the estimated projected benefit obligations and the return on plan assets for that year. The Company’s pension liability is impacted by these actuarial gains or losses.
Under defined contribution plans, the Company pays defined contributions to an independent third party as directed by the employee during the employee’s service life, which satisfies all obligations of the Company to the employee. The employee retains all rights to the contributions made by the employee and to the vested portion of the Company–paid contributions upon leaving the Company. The Company has a defined contribution plan in the U.S.
F-65
FRESENIUS MEDICAL CARE AG
NOTES TO THE CONSOLIDATED FINANCIAL STATEMENTS
(in THOUS, except share and per share data)
Defined benefit pension plans
During the first quarter of 2002 FMCH, the Company’s U.S. subsidiary, curtailed its defined benefit and supplemental executive retirement plans. Under the curtailment amendment for substantially all employees eligible to participate in the plan, benefits have been frozen as of the curtailment date and no additional defined benefits for future services will be earned. The Company has retained all employee benefit obligations as of the curtailment date. Each year FMCH contributes at least the minimum amount required by the Employee Retirement Income Security Act of 1974, as amended. In 2024, FMCH did not have a minimum funding requirement. The Company voluntarily provided €
The Company paid contributions to the plan in Germany which is funded by insurance contracts as defined in the pension plan of €
The benefit obligation for all defined benefit plans at December 31, 2024 and 2023, including funded and unfunded obligations, are presented in the following table:
|
Benefit obligation for defined benefit plans |
|
|
|
|
|
in € THOUS |
|
|
|
|
|
|
|
2024 |
|
2023 |
|
Partially funded obligations |
|
|
|
|
|
U.S. plan |
|
|
|
|
|
French plan |
|
|
|
|
|
|
|
|
|
|
|
Funded obligations by insurance contracts |
|
|
|
|
|
German plan |
|
|
|
|
|
|
|
|
|
|
|
Unfunded obligations |
|
|
|
|
|
German plan |
|
|
|
|
|
French plans |
|
|
|
|
|
|
|
|
|
|
|
Total benefit obligations |
|
|
|
|
Controlling and managing the administration of the plan in the U.S. was delegated by the Company to an administrative committee. This committee has the authority and discretion to manage the assets of the fund and to approve and adopt certain plan amendments. The board of directors of National Medical Care, Inc., a subsidiary of the Company, reserves the right to approve or adopt all major plan amendments, such as termination, modification or termination of the future benefit accruals and plan mergers with other pension plans.
Related to defined benefit plans, the Company is exposed to certain risks. Besides general actuarial risks, e.g. the longevity risk and the interest rate risk, the Company is exposed to market risk as well as to investment risk.
F-66
FRESENIUS MEDICAL CARE AG
NOTES TO THE CONSOLIDATED FINANCIAL STATEMENTS
(in THOUS, except share and per share data)
The following table shows the changes in benefit obligations, the changes in plan assets, the net funded position and the net liability of the pension plans. Benefits paid as shown in the changes in benefit obligations represent payments made from both the funded and unfunded plans while the benefits paid as shown in the changes in plan assets include only benefit payments from the Company’s funded benefit plan.
|
Net pension liability |
||||
|
in € THOUS |
||||
|
|
|
2024 |
|
2023 |
|
Change in benefit obligation: |
|
|
|
|
|
Benefit obligation at beginning of year |
|
|
|
|
|
Foreign currency translation (gains) losses |
|
|
|
(
|
|
Current service cost |
|
|
|
|
|
Past service cost |
|
(
|
|
(
|
|
Interest cost |
|
|
|
|
|
Transfer of plan participants (1) |
|
|
|
|
|
Actuarial (gains) losses arising from changes in financial assumptions |
|
(
|
|
|
|
Actuarial (gains) losses arising from changes in demographic assumptions |
|
|
|
(
|
|
Actuarial (gains) losses arising from experience adjustments |
|
(
|
|
(
|
|
Remeasurements |
|
(
|
|
|
|
Benefits paid |
|
(
|
|
(
|
|
|
|
|
|
|
|
Benefit obligation at end of year |
|
|
|
|
|
|
|
|
|
|
|
Change in plan assets: |
|
|
|
|
|
Fair value of plan assets at beginning of year |
|
|
|
|
|
Foreign currency translation gains (losses) |
|
|
|
(
|
|
Transfer of plan participants (1) |
|
— |
|
|
|
Interest income from plan assets |
|
|
|
|
|
Actuarial gains (losses) arising from experience adjustments |
|
(
|
|
|
|
Actual return on plan assets |
|
|
|
|
|
Employer contributions |
|
|
|
|
|
Benefits paid |
|
(
|
|
(
|
|
Fair value of plan assets at end of year |
|
|
|
|
|
Net funded position at end of year |
|
|
|
|
|
Benefit plans offered by other subsidiaries |
|
|
|
|
|
Net pension liability at end of year |
|
|
|
|
| (1) | Transfer of plan participants for 2023 includes pension liabilities related to Management Board members which were attributable to Management AG prior to the Conversion and are included in the Company’s balance sheet subsequent to the Conversion. |
For the years 2024 and 2023, there were no effects from the asset ceiling.
At December 31, 2024, the weighted average duration of the defined benefit obligation was
F-67
FRESENIUS MEDICAL CARE AG
NOTES TO THE CONSOLIDATED FINANCIAL STATEMENTS
(in THOUS, except share and per share data)
Pension assets and liabilities related to benefit plans offered by the Company and its subsidiaries as of December 31, 2024 and 2023 are presented in the following table:
|
Pension plan assets and liabilities |
|
|
|
|
|
in € THOUS |
|
|
|
|
|
|
|
2024 |
|
2023 |
|
Pension plan liabilities |
|
|
|
|
|
U.S. plan |
|
|
|
|
|
German plan |
|
|
|
|
|
French plans |
|
|
|
|
|
Total |
|
|
|
|
|
Thereof current (1) |
|
|
|
|
|
Thereof non-current (2) |
|
|
|
|
|
|
|
|
|
|
|
Benefit plans offered by other subsidiaries |
|
|
|
|
|
Pension assets (3) |
|
(
|
|
— |
|
Current pension liabilities (1) |
|
|
|
|
|
Non-current pension liabilities (2) |
|
|
|
|
|
Total other pension liabilities, net |
|
|
|
|
| (1) | Recorded in the line item “Current provisions and other current liabilities” in the consolidated balance sheets. |
| (2) | Recorded in non-current liabilities as “Pension liabilities” in the consolidated balance sheets. |
| (3) | Recorded as “Other non-current assets” in the consolidated balance sheets. |
Non-current pension liabilities were €
Approximately
The discount rates for all plans are based upon yields of portfolios of highly rated debt instruments with maturities that mirror each plan’s benefit obligation. The Company’s discount rates at December 31, 2024 and 2023 are the weighted average of these plans based upon their benefit obligations.
The following weighted-average assumptions were utilized in determining benefit obligations at December 31, 2024 and 2023:
|
Weighted average assumptions |
||||
|
in % |
||||
|
|
|
2024 |
|
2023 |
|
|
|
|
|
|
|
Discount rate |
|
|
|
|
|
Rate of compensation increase |
|
|
|
|
|
Rate of pension increase |
|
|
|
|
F-68
FRESENIUS MEDICAL CARE AG
NOTES TO THE CONSOLIDATED FINANCIAL STATEMENTS
(in THOUS, except share and per share data)
Sensitivity analysis
Increases and decreases in principal actuarial assumptions by
|
Sensitivity analysis |
||||
|
in € THOUS |
||||
|
|
|
0.5% increase |
|
0.5% decrease |
|
|
|
|
|
|
|
Discount rate |
|
(
|
|
|
|
Rate of compensation increase |
|
|
|
(
|
|
Rate of pension increase |
|
|
|
(
|
An increase of the mortality rate of
The sensitivity analysis was calculated based on the average duration of the pension obligations determined at December 31, 2024. The calculations were performed isolated for each significant actuarial parameter, in order to show the effect on the fair value of the pension liability separately.
The sensitivity analysis for compensation increases and for pension increases excludes the U.S. pension plan because it is frozen and therefore is not affected by changes from these two actuarial assumptions.
The defined benefit pension plans’ net periodic benefit costs are comprised of the following components for the years ended December 31, 2024, 2023 and 2022:
|
Components of net periodic benefit cost |
||||||
|
in € THOUS |
||||||
|
|
|
2024 |
|
2023 |
|
2022 |
|
|
|
|
|
|
|
|
|
Service cost |
|
|
|
|
|
|
|
Net interest cost |
|
|
|
|
|
|
|
Prior service cost |
|
(
|
|
(
|
|
(
|
|
Net periodic benefit costs |
|
|
|
|
|
|
Service cost and net interest cost are allocated as personnel expense within costs of revenues, selling, general and administrative expense or R&D expense depending upon the area in which the beneficiary is employed. The gain from settlement is included in selling, general and administrative expense.
The following weighted-average assumptions were used in determining net periodic benefit cost for the years ended December 31, 2024, 2023 and 2022:
|
Weighted average assumptions |
||||||
|
in % |
||||||
|
|
|
2024 |
|
2023 |
|
2022 |
|
|
|
|
|
|
|
|
|
Discount rate |
|
|
|
|
|
|
|
Rate of compensation increase |
|
|
|
|
|
|
|
Rate of pension increase |
|
|
|
|
|
|
F-69
FRESENIUS MEDICAL CARE AG
NOTES TO THE CONSOLIDATED FINANCIAL STATEMENTS
(in THOUS, except share and per share data)
Expected benefit payments are as follows:
|
Defined benefit pension plans: cash outflows |
||||
|
in € THOUS |
||||
|
|
|
2024 |
|
2023 |
|
|
|
|
|
|
|
1 year |
|
|
|
|
|
1 - 3 years |
|
|
|
|
|
3 - 5 years |
|
|
|
|
|
5 - 10 years |
|
|
|
|
|
Total |
|
|
|
|
Plan Assets
The following table presents the fair values of the Company´s pension plan assets at December 31, 2024 and 2023:
|
Fair values of plan assets |
||||||||||||||||
|
in € THOUS |
||||||||||||||||
|
|
|
|
|
Quoted prices |
|
|
|
|
|
|
|
Quoted prices |
|
|
|
|
|
|
|
|
|
in active |
|
|
|
|
|
|
|
in active |
|
|
|
|
|
|
|
|
|
markets for |
|
Significant |
|
Significant |
|
|
|
markets for |
|
Significant |
|
Significant |
|
|
|
|
|
identical |
|
observable |
|
unobservable |
|
|
|
identical |
|
observable |
|
unobservable |
|
Asset category |
|
Total |
|
assets |
|
inputs |
|
inputs |
|
Total |
|
assets |
|
inputs |
|
inputs |
|
|
|
|
|
(Level 1) |
|
(Level 2) |
|
(Level 3) |
|
|
|
(Level 1) |
|
(Level 2) |
|
(Level 3) |
|
|
|
|
|
2024 |
|
|
|
2023 |
||||||||
|
Equity investments |
|
|
|
|
|
|
|
|
|
|
|
|
|
|
|
|
|
Index funds (1) |
|
|
|
|
|
|
|
— |
|
|
|
|
|
|
|
— |
|
|
|
|
|
|
|
|
|
|
|
|
|
|
|
|
|
|
|
Fixed income investments |
|
|
|
|
|
|
|
|
|
|
|
|
|
|
|
|
|
Government securities (2) |
|
|
|
|
|
|
|
— |
|
|
|
|
|
|
|
— |
|
Corporate bonds (3) |
|
|
|
— |
|
|
|
— |
|
|
|
— |
|
|
|
— |
|
Other bonds (4) |
|
|
|
— |
|
|
|
|
|
|
|
— |
|
|
|
|
|
U.S. treasury money market funds (5) |
|
|
|
|
|
— |
|
— |
|
|
|
|
|
— |
|
— |
|
|
|
|
|
|
|
|
|
|
|
|
|
|
|
|
|
|
|
Other types of investments |
|
|
|
|
|
|
|
|
|
|
|
|
|
|
|
|
|
Cash, money market and mutual funds (6) |
|
|
|
|
|
|
|
— |
|
|
|
|
|
|
|
— |
|
Total |
|
|
|
|
|
|
|
|
|
|
|
|
|
|
|
|
| (1) | This category comprises low-cost equity index funds not actively managed that track the S&P 500, S&P 400, Russell 2000, MSCI Emerging Markets Index and the MSCI EAFE Index. |
| (2) | This category comprises fixed income investments by the U.S. government and government sponsored entities. |
| (3) | This category primarily represents investment grade bonds of U.S. issuers from diverse industries. |
| (4) | This category comprises private placement bonds as well as collateralized mortgage obligations. |
| (5) | This category represents funds that invest in U.S. treasury obligations directly or in U.S. treasury backed obligations. |
| (6) | This category represents cash, money market funds as well as mutual funds comprised of high grade corporate bonds. |
The methods and inputs used to measure the fair value of plan assets at the balance sheet date are as follows:
| ● | Common stocks are valued at their market prices. |
| ● | Index funds are valued based on market quotes. |
| ● | Government bonds are valued based on both market prices and market quotes. |
| ● | Corporate bonds and other bonds are valued based on market quotes. |
F-70
FRESENIUS MEDICAL CARE AG
NOTES TO THE CONSOLIDATED FINANCIAL STATEMENTS
(in THOUS, except share and per share data)
| ● | Cash is stated at nominal value which equals the fair value. |
| ● | U.S. Treasury money market funds as well as other money market and mutual funds are valued at their market price. |
Plan investment policy and strategy in the U.S.
The Company periodically reviews the assumption for long-term expected return on pension plan assets. As part of the assumptions review, a range of reasonable expected investment returns for the pension plan as a whole was determined based on an analysis of expected future returns for each asset class weighted by the allocation of the assets. The range of returns developed relies both on forecasts, which include the actuarial firm’s expected long-term rates of return for each significant asset class or economic indicator, and on broad-market historical benchmarks for expected return, correlation, and volatility for each asset class.
The Company´s overall investment strategy is to achieve a mix of approximately
The plan investment policy, utilizing a revised target investment allocation in a range around
Defined contribution plans
Most FMCH employees are eligible to join a 401(k) savings plan. Employees can deposit up to
Additionally, the Company contributed for the years ended December 31, 2024, 2023, and 2022 €
20. Shareholders’ equity
Capital stock
At December 31, 2024, the Company’s share capital consists of
Pursuant to Sections 33 and 34 of the German Securities Trading Act (WpHG) any party subject to the notification requirement shall notify the Company when certain mandatory reportable thresholds for voting rights, also by taking into account attribution provisions, are reached, exceeded or fallen below. Section 38 WpHG also stipulates a notification requirement when certain thresholds are reached, exceeded or have fallen below through directly or indirectly held instruments and Section 39 WpHG also stipulates a notification requirement when certain thresholds are reached, exceeded or have fallen below through the addition of voting rights according to Section 33 WpHG and instruments according to Section 38 WpHG. Notifications received by the Company subject to the notification requirements were published in accordance with the applicable legal provisions, as well as posted in the Investors section of the Company’s website.
In a notification dated February 8, 2011, Fresenius SE disclosed to the Company pursuant to Section 21 of the WpHG at the date of notification (predecessor provision to Section 33 of the WpHG) that it held
F-71
FRESENIUS MEDICAL CARE AG
NOTES TO THE CONSOLIDATED FINANCIAL STATEMENTS
(in THOUS, except share and per share data)
On January 7, 2025, Harris Associates Investment Trust, Boston, Massachusetts, U.S., disclosed pursuant to Section 33 of the WpHG that
On October 28, 2024, Harris Associates L.P., Wilmington, Delaware, U.S., with respect to attributed voting rights, disclosed pursuant to Sections 33, 34 of the WpHG that
On October 4, 2024, BlackRock, Inc., Wilmington, Delaware, U.S., with respect to attributed voting rights, disclosed pursuant to Sections 33, 34 of the WpHG that
On January 6, 2023, Dodge & Cox International Stock Fund, San Francisco, California, U.S., disclosed pursuant to Section 33 of the WpHG that
On December 16, 2022, Dodge & Cox, San Francisco, California, U.S., with respect to attributed voting rights, disclosed pursuant to Sections 33, 34 of the WpHG that
On October 28, 2022, Richard Pzena, with respect to attributed voting rights, disclosed pursuant to Sections 33, 34 of the WpHG that
On July 14, 2022, Artisan Partners Asset Management Inc., Wilmington, Delaware, U.S., with respect to attributed voting rights, disclosed pursuant to Sections 33, 34 of the WpHG that
The general meeting of the Company may approve Authorized Capital (
genehmigtes Kapital
). The resolution creating Authorized Capital requires the affirmative vote of a majority of
quarters of the capital represented at the vote and may authorize the Management Board to issue new shares up to a stated amount for a period of up to
In addition, the general meeting of the Company may create Conditional Capital (
bedingtes Kapital
) for the purpose of issuing (i) new shares to holders of convertible bonds or other securities which grant a right to shares, (ii) new shares as the consideration in a merger with another company, or (iii) new shares offered to management or employees. In each case, the authorizing resolution requires the affirmative vote of a majority of
quarters of the capital represented at the vote. The nominal value for any Conditional Capital may not exceed
Authorized capital
By resolution of the Company’s Annual General Meeting (AGM) on August 27, 2020, having become effective upon registration with the commercial register of the local court (
Amtsgericht
) of Hof (Saale) on September 23, 2020, amended by resolution of the Company’s EGM on July 14, 2023 in its wording with respect to the Company’s change of legal form, registered with the local court (
Amtsgericht
) of Hof (Saale) on November 30, 2023, the Management Board is authorized until August 26, 2025, to increase the share capital of the Company with the approval of the Supervisory Board by up to a total of €
F-72
FRESENIUS MEDICAL CARE AG
NOTES TO THE CONSOLIDATED FINANCIAL STATEMENTS
(in THOUS, except share and per share data)
However, the Management Board is authorized with the approval of the Supervisory Board to exclude the shareholders’ subscription rights in order to eliminate fractional amounts from the subscription right. The Management Board may only exercise the aforementioned authorization to exclude subscription rights to the extent that the proportional amount of the total shares issued subject to an exclusion of subscription rights exceeds
No Authorized Capital 2020/I has been issued at December 31, 2024.
In addition, by resolution of the AGM on August 27, 2020, having become effective upon registration with the commercial register of the local court (
Amtsgericht
) of Hof (Saale) on September 23, 2020, amended by resolution of the Company’s EGM on July 14, 2023 in its wording with respect to the Company’s change of legal form, registered with the local court (
Amtsgericht
) of Hof (Saale) on November 30, 2023, the Management Board is authorized until August 26, 2025 to increase the share capital of the Company with the approval of the Supervisory Board by up to a total of €
| ● | in the case of one or more capital increases for contributions in kind for the purpose of acquiring companies, parts of companies, interests in companies or other assets, or |
| ● |
in the case of one or more capital increases for cash if the issue price for the shares does not significantly fall below the stock exchange price of the shares already listed and the proportionate amount of the share capital of the Company attributable to the shares issued with exclusion of subscription rights exceeds
|
The Management Board may only exercise the aforementioned authorizations to exclude subscription rights to the extent that the proportional amount of the total shares issued subject to an exclusion of subscription rights exceeds
No Authorized Capital 2020/II has been issued at December 31, 2024.
F-73
FRESENIUS MEDICAL CARE AG
NOTES TO THE CONSOLIDATED FINANCIAL STATEMENTS
(in THOUS, except share and per share data)
Conditional capital
By resolution of the Company’s AGM on May 12, 2011, as amended by the Company’s EGM on July 14, 2023, the Company’s share capital was conditionally increased with regards to the Stock Option Plan 2011 (2011 SOP) by up to €
Treasury stock
By resolution of the Company’s AGM on May 20, 2021, amended by the Company’s EGM on July 14, 2023 in its wording with respect to the Company’s change of legal form, the Management Board is authorized until May 19, 2026 to purchase treasury shares up to a maximum amount of
Additional paid-in capital
Additional paid-in capital is comprised of the premium paid on the issue of shares and stock options, the tax effects from stock options, the compensation expense from stock options, which is recognized according to IFRS 2, as well as changes in ownership interest in a subsidiary that do not result in a loss of control. Additional paid in capital decreased primarily as a result of transactions with noncontrolling interests in the United States.
Retained earnings
Retained earnings is comprised mainly of earnings generated by group entities in prior years, to the extent that they have not been distributed, as well as changes of put option liabilities.
Dividends
Under German law, the amount of dividends available for distribution to shareholders is based upon the unconsolidated balance sheet profit ( Bilanzgewinn ) of the Company as reported in its balance sheet determined in accordance with the German Commercial Code ( Handelsgesetzbuch ).
Cash dividends of €
Cash dividends of €
Cash dividends of €
F-74
FRESENIUS MEDICAL CARE AG
NOTES TO THE CONSOLIDATED FINANCIAL STATEMENTS
(in THOUS, except share and per share data)
At the Company’s AGM scheduled to be held on May 22, 2025, the Company’s Management Board and Supervisory Board will propose to the shareholders a dividend of €
Noncontrolling interests
Noncontrolling interests represent the proportion of the net assets of consolidated subsidiaries owned by minority shareholders. The Company has purchase obligations under put options held by the holders of noncontrolling interests in certain of its subsidiaries. These obligations result from contractual put options and are exercisable by the owners of the noncontrolling interests. In addition to noncontrolling interests, the related potential obligations under these put options are reclassified from equity of the Company, with no impact to the income statement, and recognized as a put option liability at the present value of the exercise price of the options in other current or non-current liabilities. Accumulated other comprehensive income allocated to noncontrolling interests mainly relates to currency effects from the translation of foreign operations.
21. Capital management
The principle objectives of the Company’s capital management strategy are to optimize the weighted average cost of capital and to achieve a balanced mix of total equity and debt. The dialysis industry, in which the Company has a strong market position in global, growing and largely non-cyclical markets, is characterized by recurring cash flows. Due to the Company’s payors’ mostly high credit quality, it is able to generate high, stable, predictable and sustainable cash flows. These generated cash flows allow a reasonable proportion of debt.
As of December 31, 2024 and December 31, 2023, total equity and debt were as follows:
|
Total equity, debt and total assets |
||||
|
in € THOUS |
|
|
|
|
|
|
|
2024 |
|
2023 |
|
|
|
|
|
|
|
Total equity including noncontrolling interests |
|
|
|
|
|
Debt and lease liabilities (including amounts directly associated with assets held for sale) |
|
|
|
|
|
Total assets |
|
|
|
|
|
Debt and lease liabilities in % of total assets |
|
|
|
|
|
Total equity in % of total assets (equity ratio) |
|
|
|
|
The Company is not subject to any capital requirements provided for in its Articles of Association.
The Company’s financing strategy aims at ensuring financial flexibility, managing financial risks and optimizing financing costs. Financial flexibility is ensured through maintaining sufficient liquidity. Refinancing risks are limited due to the Company’s balanced maturity profile, which is characterized by a wide range of maturities of up to 2031. When deciding upon the use of available financing instruments, market capacity, investor diversification, financing conditions and the existing maturity profile are taken into account (see note 17).
The Company’s financing structure and business model are reflected in its credit ratings. The Company is rated investment grade by S&P Global, Moody’s and Fitch. The Company’s current corporate credit ratings and outlooks from the credit rating agencies are provided in the table below:
|
Rating (1) |
||||||
|
|
|
S&P Global |
|
Moody’s |
|
Fitch |
|
|
|
|
|
|
|
|
|
Corporate credit rating |
|
BBB- |
|
Baa3 |
|
BBB- |
|
Outlook |
|
stable |
|
stable |
|
stable |
| (1) | A rating is not a recommendation to buy, sell or hold securities of the Company, and may be subject to suspension, change or withdrawal at any time by the assigning rating agency. |
F-75
FRESENIUS MEDICAL CARE AG
NOTES TO THE CONSOLIDATED FINANCIAL STATEMENTS
(in THOUS, except share and per share data)
22. Earnings per share
The following table contains reconciliations of the numerators and denominators of the basic and diluted earnings per share computations for 2024, 2023 and 2022:
|
Reconciliation of basic and diluted earnings per share |
||||||
|
in € THOUS, except share and per share data |
|
|
|
|
|
|
|
|
|
2024 |
|
2023 |
|
2022 |
|
Numerator: |
|
|
|
|
|
|
|
Net income attributable to shareholders of FME AG |
|
|
|
|
|
|
|
Denominators: |
|
|
|
|
|
|
|
Weighted average number of shares outstanding |
|
|
|
|
|
|
|
Potentially dilutive shares |
|
— |
|
— |
|
— |
|
Basic earnings per share |
|
|
|
|
|
|
|
Diluted earnings per share |
|
|
|
|
|
|
23. Share-based plans
General information on the Company’s long-term incentive plans (performance shares)
The Company accounts for its share-based plans in accordance with IFRS 2 and has, as of December 31, 2024, various share-based compensation plans, which may either be equity- or cash-settled. These plans enable the members of the Management Board, the members of the management boards of affiliated companies of FME AG and managerial staff members to adequately participate in the long-term, sustained success of the Company. The Fresenius Medical Care Long Term Incentive Plan 2016 (LTIP 2016), the Fresenius Medical Care NxStage Long Term Incentive Plan (NxStage LTIP), the Fresenius Medical Care Management Board Long Term Incentive Plan 2019 (MB LTIP 2019), the Fresenius Medical Care Long Term Incentive Plan 2019 (LTIP 2019), the Fresenius Medical Care Management Board Long Term Incentive Plan 2020 (MB LTIP 2020), the Fresenius Medical Care Long Term Incentive Plan 2022+ (LTIP 2022+), the Fresenius Medical Care Management Board Long-Term Incentive Plan 2024+ (MB LTIP 2024+) and the Fresenius Medical Care Long-Term Incentive Plan 2024+ (LTIP 2024+) are or were each variable compensation programs with long-term incentive effects which allocate or allocated so-called “performance shares.” Performance shares are compensation instruments which may entitle plan participants to receive a cash payment depending on the achievement of pre-defined performance targets (further defined below) as well as the Company’s share price development throughout the respective vesting period (Performance Shares). For allocations under the MB LTIP 2024+ which have not yet been effected, the Supervisory Board may instead determine to settle in Company shares prior to each allocation. The final cash payments under the LTIP 2016 and under the NxStage LTIP took place in 2022, the final cash payments under the MB LTIP 2019 took place in 2023 and the final cash payments under the LTIP 2019 took place in 2024.
The following table provides an overview of these plans.
|
|
|
MB LTIP 2024+ |
|
LTIP 2024+ |
|
LTIP 2022+ |
|
MB LTIP 2020 |
|
LTIP 2019 |
|
MB LTIP 2019 |
|
NxStage LTIP |
|
LTIP 2016 |
|
Eligible persons |
|
Members of the Management Board (1) |
|
Other Plan participants |
|
Other Plan participants |
|
Members of the Management Board (1) |
|
Other Plan participants |
|
Members of the Management Board (1) |
|
Other Plan participants |
|
Members of the Management Board (1) and other plan participants |
|
Years in which an allocation occurred |
|
2024 |
|
2024 |
|
2022–2023 |
|
2020–2023 |
|
2019–2021 |
|
2019 |
|
2019 |
|
2016–2018 |
|
Months in which an allocation occurred |
|
March, June |
|
July, December |
|
July, December |
|
November (2020),
|
|
July, December |
|
July, December |
|
February |
|
July, December |
| (1) | Also includes former members of the management board of the General Partner. |
F-76
FRESENIUS MEDICAL CARE AG
NOTES TO THE CONSOLIDATED FINANCIAL STATEMENTS
(in THOUS, except share and per share data)
For members of the Management Board, the respective allocation value is determined by the Supervisory Board. For other plan participants, the determination of the allocation value will be made by the Management Board, taking into account the individual responsibilities of each plan participant. The initial allocation value is determined in the currency in which the respective participant receives their base salary at the time of the allocation. In order to determine the number of Performance Shares that each plan participant receives, the allocation value is divided by the value per Performance Share at the time of the allocation, which in turn is determined based on the Company’s average share price over a period of
calendar days prior to the respective allocation date and assuming a
During 2024, the Company allocated
During 2024, the Company allocated
During 2023, the Company allocated
During 2023, the Company allocated
During 2022, the Company allocated
During 2022, the Company allocated
The number of allocated Performance Shares may change over the performance period of
The Company’s long-term incentive plans during 2024 (Performance Shares)
The Supervisory Board has approved and adopted the MB LTIP 2024+ effective January 1, 2024, for members of the Management Board. For the members of the management boards of affiliated companies of FME AG and managerial staff members, the Management Board has approved and adopted the LTIP 2024+ effective January 1, 2024.
For allocations in fiscal year 2024, the performance targets are as follows: (i) return on invested capital (ROIC), (ii) Relative TSR and (iii) reduction in market-based CO
2
equivalents emissions (CO
2
e Reduction). The CO
2
e Reduction reflects the Company’s expressed goal to reduce Scope-1 and Scope-2 emissions by
F-77
FRESENIUS MEDICAL CARE AG
NOTES TO THE CONSOLIDATED FINANCIAL STATEMENTS
(in THOUS, except share and per share data)
For allocations in fiscal year 2024, the profitability target ROIC has a weight of
For allocations in fiscal year 2024, the performance target Relative TSR is measured on the basis of the TSR compared to European and U.S. peer groups. The target achievement for this performance target is determined using the percentile ranking method. For this purpose, the TSR values of the peer companies within the respective comparison groups over the performance period are ranked and the relative positioning of the Company within the respective comparison group is determined on the basis of the percentile achieved. The performance target Relative TSR is weighted with
For allocations in fiscal year 2024, the achievement of the sustainability performance target CO
2
e Reduction is based on the Company’s sustainability statement, such reporting being reviewed by an independent auditor, and is measured by the reduction of market-based emissions in CO
2
equivalents in comparison to the base year 2020. This reduction is expressed in percent. The sustainability performance target has a weight of
The overall target achievement will not exceed
Under the MB LTIP 2024+, the final number of Performance Shares generally vests
Under the LTIP 2024+, the final number of Performance Shares generally vests
The Company’s long-term incentive plans during 2016–2023 (Performance Shares)
For allocations until 2023, the performance targets are as follows: (i) revenue growth at constant currency (Revenue Growth), (ii) net Income growth at constant currency (Net Income Growth) and (iii) ROIC.
Revenue and net income are determined according to the Company’s consolidated reported and audited figures in euro for the financial statements prepared in accordance with IFRS Accounting Standards, applying the respective plan terms. While the ROIC metric is not audited, the calculation of the metric is based upon financial measures derived from the Company’s consolidated financial statements and further adjusted to apply the respective plan conditions. Revenue Growth and Net Income Growth, for the purpose of the relevant plan, are determined at constant currency.
For Performance Shares allocated in years 2022 and 2023, the target achievements of the performance targets Revenue Growth and Net Income Growth are calculated based on a Compound Annual Growth Rate (CAGR) over the
performance period. For ROIC, annual target values apply. For all
F-78
FRESENIUS MEDICAL CARE AG
NOTES TO THE CONSOLIDATED FINANCIAL STATEMENTS
(in THOUS, except share and per share data)
For Performance Shares allocated in years 2022 and 2023, the degree of target achievement for all
For Performance Shares allocated in years 2020 and 2021, for each individual year of the three-year performance period an annual target achievement level of
For Performance Shares allocated in years 2020 and 2021, for each individual year of the three-year performance period an annual target achievement level of
For Performance Shares allocated in years 2020 and 2021, for each individual year of the three-year performance period an annual target achievement level of
For Performance Shares allocated during the period from 2016 to 2019, for each individual year of the three-year performance period an annual target achievement level of
For Performance Shares allocated during the period from 2016 to 2019, for each individual year of the three-year performance period an annual target achievement level of
For Performance Shares allocated during the period from 2016 to 2019, an annual target achievement level of
F-79
FRESENIUS MEDICAL CARE AG
NOTES TO THE CONSOLIDATED FINANCIAL STATEMENTS
(in THOUS, except share and per share data)
For Performance Shares allocated during the period from 2016 to 2021, the target achievement level for each of the
For Performance Shares allocated in fiscal year 2019 under the LTIP 2019, the level of target achievement was subject to an increase if certain targets in relation to the second phase of the Company’s Global Efficiency Program (GEP-II targets), which were measured at constant currency, and in relation to the Free Cash Flow (Free Cash Flow target) were achieved. For these Performance Shares, the overall target achievement was increased by
The number of Performance Shares allocated to the plan participants at the beginning of the performance period is multiplied by the level of overall target achievement in order to determine the final number of Performance Shares.
Under the LTIP 2022+, the final number of Performance Shares generally vests
F-80
FRESENIUS MEDICAL CARE AG
NOTES TO THE CONSOLIDATED FINANCIAL STATEMENTS
(in THOUS, except share and per share data)
Under the MB LTIP 2020, the final number of Performance Shares generally vests
Under the MB LTIP 2019, the final number of Performance Shares generally vested
Under the NxStage LTIP, the final number of Performance Shares allocated in February 2019 generally vested in December 2022. Several payout conditions, such as the continuation of the service relationship (with exceptions, e.g., in the event of occupational disability or retirement), applied. The number of such vested Performance Shares was then multiplied by the average share price of the Company over a period of calendar days prior to the lapse of the vesting period. The resulting amount was paid out as cash compensation.
Under the LTIP 2016, the final number of Performance Shares generally vested
The Company`s long-term incentive program 2011 (stock options and phantom stock)
On May 12, 2011, the 2011 SOP was established by resolution of the Company’s AGM. The 2011 SOP, together with the Phantom Stock Plan 2011, which was established by resolution of the General Partner’s management board and supervisory board and the Company’s Supervisory Board, formed the Company’s LTIP 2011. Under the LTIP 2011, participants were granted awards, which consisted of a combination of stock options and phantom stock. Awards under the LTIP 2011 were subject to a
Stock options granted under the LTIP 2011 had an
F-81
FRESENIUS MEDICAL CARE AG
NOTES TO THE CONSOLIDATED FINANCIAL STATEMENTS
(in THOUS, except share and per share data)
Phantom stock awards under the LTIP 2011 entitled the holders to receive payment in euro from the Company upon exercise of the phantom stock. The payment per phantom stock in lieu of the issuance of such stock was based upon the share price on the Frankfurt Stock Exchange of one of the Company’s shares on the exercise date. Phantom stock awards had a
Additional information on share-based plans
At December 31, 2024 and 2023, the members of the Management Board and plan participants other than the members of the Management Board held the following Performance Shares under the share-based plans:
|
Outstanding Performance Shares |
|
|
|
|
|
|
|
|
|
|
|
|
|
|
|
2024 |
|
2023 |
||||||||
|
|
|
Members of the |
|
|
|
|
|
Members of the |
|
|
|
|
|
|
|
Management |
|
Other plan |
|
|
|
Management |
|
Other plan |
|
|
|
|
|
Board |
|
participants |
|
Total |
|
Board |
|
participants |
|
Total |
|
MB LTIP 2024+ |
|
|
|
|
|
|
|
— |
|
— |
|
— |
|
LTIP 2024+ |
|
— |
|
|
|
|
|
— |
|
— |
|
— |
|
LTIP 2022+ |
|
— |
|
|
|
|
|
— |
|
|
|
|
|
MB LTIP 2020 |
|
|
|
|
|
|
|
|
|
|
|
|
|
LTIP 2019 |
|
— |
|
— |
|
— |
|
— |
|
|
|
|
As the 2011 SOP expired in 2023,
|
Transactions |
||||
|
|
|
|
|
Weighted |
|
|
|
|
|
average |
|
|
|
|
|
exercise |
|
|
|
Options |
|
price |
|
Stock options for shares |
|
in thousands |
|
in € |
|
Balance at December 31, 2022 |
|
|
|
|
|
Granted |
|
— |
|
— |
|
Exercised |
|
— |
|
— |
|
Expired |
|
|
|
|
|
Balance at December 31, 2023 |
|
— |
|
— |
During the fiscal years ended December 31, 2024, and 2023,
F-82
FRESENIUS MEDICAL CARE AG
NOTES TO THE CONSOLIDATED FINANCIAL STATEMENTS
(in THOUS, except share and per share data)
The compensation expense related to cash-settled share-based payment transactions is determined based upon the fair value at the measurement date and the number of Performance Shares allocated which will be recognized over the vesting period. The compensation expense that the Company recognized for Performance Shares for the fiscal years ended December 31, 2024, 2023 and 2022, respectively, is presented in the table below.
|
Compensation expense related to cash-settled plans |
|
|
|
|
|
|
|
in € THOUS |
|
|
|
|
|
|
|
|
|
2024 |
|
2023 |
|
2022 |
|
MB LTIP 2024+ |
|
|
|
— |
|
— |
|
LTIP 2024+ |
|
|
|
— |
|
— |
|
LTIP 2022+ |
|
|
|
|
|
|
|
MB LTIP 2020 |
|
(
|
|
|
|
(
|
|
LTIP 2019 |
|
|
|
|
|
(
|
|
MB LTIP 2019 |
|
— |
|
|
|
(
|
|
NxStage LTIP |
|
— |
|
— |
|
(
|
|
LTIP 2016 |
|
— |
|
— |
|
(
|
24. Leases
The Company leases land, buildings and improvements, machinery and equipment, as well as IT- and office equipment under various lease agreements.
Leasing in the consolidated statements of income
The following table shows the effects from lease agreements on the consolidated statements of income for the year ended December 31, 2024, 2023 and 2022:
|
Leasing in the consolidated statements of income |
||||||
|
in € THOUS |
|
|
|
|
|
|
|
|
|
2024 |
|
2023 |
|
2022 |
|
Depreciation on right-of-use assets |
|
|
|
|
|
|
|
Impairments on right-of-use assets |
|
|
|
|
|
|
|
Expenses relating to short-term leases |
|
|
|
|
|
|
|
Expenses relating to leases of low-value assets |
|
|
|
|
|
|
|
Expenses relating to variable lease payments |
|
|
|
|
|
|
|
Income from subleasing right-of-use assets |
|
|
|
|
|
|
|
Interest expense on lease liabilities |
|
|
|
|
|
|
For information regarding leases with related parties, see note 6 b).
F-83
FRESENIUS MEDICAL CARE AG
NOTES TO THE CONSOLIDATED FINANCIAL STATEMENTS
(in THOUS, except share and per share data)
Leases in the consolidated balance sheets
At December 31, 2024 and 2023, the acquisition costs and the accumulated depreciation of right-of-use assets consisted of the following:
|
Acquisition costs |
||||||||||||||
|
in € THOUS |
|
|
|
|
|
|
|
|
|
|
|
|
|
|
|
|
|
|
|
Foreign |
|
Changes in |
|
|
|
|
|
|
|
|
|
|
|
January 1, |
|
currency |
|
consolidation |
|
|
|
|
|
|
|
December 31, |
|
|
|
2024 |
|
translation |
|
group |
|
Additions |
|
Reclassifications |
|
Disposals (1) |
|
2024 |
|
|
|
|
|
|
|
|
|
|
|
|
|
|
|
|
|
Right-of-use assets: Land |
|
|
|
|
|
(
|
|
|
|
(
|
|
(
|
|
|
|
Right-of-use assets: Buildings and improvements |
|
|
|
|
|
(
|
|
|
|
(
|
|
(
|
|
|
|
Right-of-use assets: Machinery and equipment |
|
|
|
|
|
— |
|
|
|
|
|
(
|
|
|
|
Right-of-use assets |
|
|
|
|
|
(
|
|
|
|
(
|
|
(
|
|
|
| (1) |
Included within the amounts presented for “Right-of-use assets: Building and improvements” and “Right-of-use assets: Machinery and equipment” are
€
|
|
Acquisition costs |
||||||||||||||
|
in € THOUS |
|
|
|
|
|
|
|
|
|
|
|
|
|
|
|
|
|
|
|
Foreign |
|
Changes in |
|
|
|
|
|
|
|
|
|
|
|
January 1, |
|
currency |
|
consolidation |
|
|
|
|
|
|
|
December 31, |
|
|
|
2023 |
|
translation |
|
group |
|
Additions |
|
Reclassifications |
|
Disposals |
|
2023 |
|
|
|
|
|
|
|
|
|
|
|
|
|
|
|
|
|
Right-of-use assets: Land |
|
|
|
(
|
|
(
|
|
|
|
(
|
|
(
|
|
|
|
Right-of-use assets: Buildings and improvements |
|
|
|
(
|
|
(
|
|
|
|
(
|
|
(
|
|
|
|
Right-of-use assets: Machinery and equipment |
|
|
|
(
|
|
|
|
|
|
(
|
|
(
|
|
|
|
Right-of-use assets |
|
|
|
(
|
|
(
|
|
|
|
(
|
|
(
|
|
|
|
Accumulated depreciation and impairment |
||||||||||||||||
|
in € THOUS |
|
|
|
|
|
|
|
|
|
|
|
|
|
|
|
|
|
|
|
|
|
Foreign |
|
Changes in |
|
|
|
|
|
|
|
|
|
|
|
|
|
January 1, |
|
currency |
|
consolidation |
|
|
|
Impairment |
|
|
|
|
|
December 31, |
|
|
|
2024 |
|
translation |
|
group |
|
Additions |
|
loss |
|
Reclassifications |
|
Disposals (1) |
|
2024 |
|
|
|
|
|
|
|
|
|
|
|
|
|
|
|
|
|
|
|
Right-of-use assets: Land |
|
|
|
|
|
(
|
|
|
|
|
|
(
|
|
(
|
|
|
|
Right-of-use assets: Buildings and improvements |
|
|
|
|
|
(
|
|
|
|
|
|
(
|
|
(
|
|
|
|
Right-of-use assets: Machinery and equipment |
|
|
|
|
|
— |
|
|
|
|
|
(
|
|
(
|
|
|
|
Right-of-use assets |
|
|
|
|
|
(
|
|
|
|
|
|
(
|
|
(
|
|
|
| (1) |
Included within the amounts presented for “Right-of-use assets: Building and improvements” and “Right-of-use assets: Machinery and equipment” are
€
|
F-84
FRESENIUS MEDICAL CARE AG
NOTES TO THE CONSOLIDATED FINANCIAL STATEMENTS
(in THOUS, except share and per share data)
|
Accumulated depreciation and impairment |
||||||||||||||||
|
in € THOUS |
|
|
|
|
|
|
|
|
|
|
|
|
|
|
|
|
|
|
|
|
|
Foreign |
|
Changes in |
|
|
|
|
|
|
|
|
|
|
|
|
|
January 1, |
|
currency |
|
consolidation |
|
|
|
Impairment |
|
|
|
|
|
December 31, |
|
|
|
2023 |
|
translation |
|
group |
|
Additions |
|
loss |
|
Reclassifications |
|
Disposals |
|
2023 |
|
|
|
|
|
|
|
|
|
|
|
|
|
|
|
|
|
|
|
Right-of-use assets: Land |
|
|
|
(
|
|
(
|
|
|
|
|
|
(
|
|
(
|
|
|
|
Right-of-use assets: Buildings and improvements |
|
|
|
(
|
|
(
|
|
|
|
|
|
(
|
|
(
|
|
|
|
Right-of-use assets: Machinery and equipment |
|
|
|
(
|
|
|
|
|
|
|
|
(
|
|
(
|
|
|
|
Right-of-use assets |
|
|
|
(
|
|
(
|
|
|
|
|
|
(
|
|
(
|
|
|
|
Book value |
||||
|
in € THOUS |
|
|
|
|
|
|
|
December 31, |
|
December 31, |
|
|
|
2024 |
|
2023 |
|
Right-of-use assets: Land |
|
|
|
|
|
Right-of-use assets: Buildings and improvements |
|
|
|
|
|
Right-of-use assets: Machinery and equipment |
|
|
|
|
|
Right-of-use assets |
|
|
|
|
Depreciation expense is allocated within costs of revenue, selling, general and administrative and R&D expenses, depending upon the area in which the asset is used.
Impairment losses are allocated within costs of revenue, selling, general and administrative and R&D expenses, depending upon the area in which the asset is used, or are included within other operating expense in certain instances when the corresponding assets have been identified as strategic transactions and/or programs.
For a maturity analysis of lease liabilities see note 26.
Leasing in the consolidated statements of cash flows
Total cash outflows from leases were €
Leases that the Company entered into as a lessee that have not yet begun as of December 31, 2024 will result in future cash outflows of €
Potential future cash outflows resulting from purchase options €
Potential future cash outflows resulting from extension options of €
Potential future cash outflows resulting from termination options of €
F-85
FRESENIUS MEDICAL CARE AG
NOTES TO THE CONSOLIDATED FINANCIAL STATEMENTS
(in THOUS, except share and per share data)
For additional information regarding residual value guarantees in certain lease contracts, see note 25.
25. Commitments and contingencies
Legal and regulatory matters
The Company is routinely involved in claims, lawsuits, regulatory and tax audits, investigations and other legal matters arising, for the most part, in the ordinary course of its business of providing health care services and products. Legal matters that the Company currently deems to be material or noteworthy are described below. The Company records its litigation reserves for certain legal proceedings and regulatory matters to the extent that the Company determines an unfavorable outcome is probable and the amount of loss can be reasonably estimated. For the other matters described below, the Company believes that the loss is not probable and/or the loss or range of possible losses cannot be reasonably estimated at this time. The outcome of litigation and other legal matters is always difficult to predict accurately and outcomes that are not consistent with the Company’s view of the merits can occur. The Company believes that it has valid defenses to the legal matters pending against it and is defending itself vigorously. Nevertheless, it is possible that the resolution of one or more of the legal matters currently pending or threatened could have a material adverse effect on its business, results of operations and financial condition.
Beginning in 2012, the Company received certain communications alleging conduct in countries outside the U.S. that might violate the U.S. Foreign Corrupt Practices Act (FCPA) or other anti-bribery laws. The Company conducted investigations with the assistance of outside counsel and, in a continuing dialogue, advised the Securities and Exchange Commission (SEC) and the U.S. Department of Justice (DOJ) about these investigations. The DOJ and the SEC also conducted their own investigations, in which the Company cooperated.
In the course of this dialogue, the Company identified and reported to the DOJ and the SEC, and took remedial actions with respect to, conduct that resulted in the DOJ and the SEC seeking monetary penalties including disgorgement of profits and other remedies. This conduct revolved principally around the Company’s products business in countries outside the United States. The Company’s remedial actions included separation of those employees responsible for the above-mentioned conduct.
On March 29, 2019, the Company entered into a non-prosecution agreement (NPA) with the DOJ and a separate agreement with the SEC (SEC Order) intended to resolve fully and finally the U.S. government allegations against the Company arising from the investigations that included provisions for penalties and disgorgement, self-reporting obligations and retention of an independent compliance monitor whose certification of the Company’s implementation of an effective anti-corruption compliance program was finalized in January 2023. The DOJ and SEC accepted the Monitor’s certification and the NPA and SEC Order expired on March 1, 2023 and March 29, 2023, respectively.
In 2015, the Company self-reported certain legacy conduct with a potential nexus to Germany to the German prosecutor in the state of Hesse and continues to cooperate with government authorities in Germany in their review of the conduct that prompted the Company’s and U.S. government investigations. In September 2023, the Hessian prosecutor opened independent disgorgement proceedings against a German subsidiary of the Company relating to the aforementioned conduct in West Africa.
Since 2012, the Company has made significant investments in its compliance and financial controls and in its compliance, legal and financial organizations and is continuing to further implement its compliance program in connection with the resolution with the DOJ and SEC. The Company continues to address post-FCPA review matters on various levels. The Company also continues to be fully committed to compliance with the FCPA and other applicable anti-bribery laws.
F-86
FRESENIUS MEDICAL CARE AG
NOTES TO THE CONSOLIDATED FINANCIAL STATEMENTS
(in THOUS, except share and per share data)
In August 2014, FMCH received a subpoena from the U.S. Attorney’s Office (USAO) for the District of Maryland inquiring into FMCH’s contractual arrangements with hospitals and physicians relating to the management of in-patient acute dialysis services. Thereafter, the USAO conducted an investigation in which FMCH cooperated, and the USAO declined to intervene in the matter. After the U.S. District Court for Maryland unsealed the 2014 relator’s qui tam complaint that gave rise to the investigation, the relator served the complaint and proceeded on his own by filing an amended complaint, which FMCH moved to dismiss on multiple grounds. On October 5, 2021, on FMCH’s motion, the District Court for Maryland transferred the case to the U.S. District Court for Massachusetts. Flanagan v. Fresenius Medical Care Holdings, Inc., 1:21-cv-11627 (Flanagan). On December 5, 2022, the Massachusetts District Court granted FMCH’s motion and dismissed the case with prejudice. Relator has filed an appeal.
On October 19, 2023, a subsidiary of the Company was served with a complaint alleging that an employee was terminated in retaliation for raising concerns similar to those raised in the Flanagan litigation. Rowe v. Fresenius Medical Care Holdings, Inc., et al, 3:23-cv-00331, U.S. District Court for the Eastern District of Tennessee. FMCH will defend itself in the litigation.
In 2014, two New York physicians filed under seal a qui tam complaint in the U.S. District Court for the Eastern District of New York (Brooklyn), alleging violations of the False Claims Act relating to FMCH’s vascular access line of business. On October 6, 2015, the U.S. Attorney for the Eastern District of New York (Brooklyn) issued subpoenas to FMCH indicating its investigation is seen to be related to the two relators’ complaint.
FMCH cooperated in the Brooklyn investigation, which was understood to be separate and distinct from settlements entered in 2015 in Connecticut, Florida and Rhode Island of allegations against American Access Care LLC (AAC) following FMCH’s 2011 acquisition of AAC.
On July 12, 2022, after the court denied the USAO’s motions to renew the sealing of the relators’ complaint, the USAO filed a complaint-in-intervention. United States ex rel. Pepe and Sherman v. Fresenius Vascular Care, Inc. et al, 1:14-cv-3505. On October 3, 2023, the states of New York, New Jersey and Georgia filed a consolidated complaint-in-intervention. The U.S.’, the three states’, and relators’ complaints allege that the defendants billed and received government payment for surgery that was not medically necessary. On October 31, 2024, the court granted FMCH’s motion to dismiss the relators’ complaint. FMCH is defending the allegations asserted in the litigation now proceeding with the remaining complainants.
On November 18, 2016, FMCH received a subpoena under the False Claims Act from the U.S. Attorney for the Eastern District of New York (Brooklyn) seeking documents and information relating to the operations of Shiel Medical Laboratory, Inc. (Shiel), which FMCH acquired in October 2013. FMCH advised the USAO that, under the asset sale provisions of its 2013 Shiel acquisition, it was not responsible for Shiel’s conduct prior to the date of the acquisition. On December 12, 2017, FMCH sold to Quest Diagnostics certain Shiel operations. Nonetheless, FMCH cooperated in the Brooklyn USAO’s investigation.
On June 14, 2022, the Brooklyn USAO declined to intervene on two relator complaints that underlay the investigation. The relators proceeded with litigation at their own expense against both Shiel and FMCH entities, alleging that the defendants wrongly caused government payers to pay for laboratory tests that were falsely or improperly invoiced and retaliated against relators for objecting to the alleged misconduct. Relator v. Shiel Medical Laboratory, 1:16-cv-01090 (E.D.N.Y. 2016); Relator v. Shiel Holdings, 1:17-cv-02732 (E.D.N.Y. 2017). FMCH reached a settlement in Relator v. Shiel Holdings , 1:17-cv-02732 and the matter has been dismissed with prejudice. FMCH is defending allegations directed against entities it controls in the remaining matter.
In February 2022, the Company received a formal request for information from the Hessian Data Protection Authority (Hessischer Beauftragter für Datenschutz und Informationsfreiheit or HBDI). The information request related to specific data processing functions of a few of the Company’s peritoneal dialysis devices. The Company fully cooperated with the HBDI and provided all relevant information. In November 2024, the HBDI discontinued the formal request for information and closed the matter.
On January 3, 2023, FMCH received a subpoena from the Attorney General for the District of Columbia related to the activities of the American Kidney Foundation (AKF) that is grounded in anti-trust concerns, including market allocation within the District of Columbia. FMCH’s relationship with AKF was the subject of a previously reported and resolved investigation by agencies of the U.S.and litigation against United Healthcare. FMCH is cooperating in the District of Columbia investigation.
F-87
FRESENIUS MEDICAL CARE AG
NOTES TO THE CONSOLIDATED FINANCIAL STATEMENTS
(in THOUS, except share and per share data)
On February 20, 2023, the Company received a statement of claim via the London Court of International Arbitration from its former distributor in Iraq. The Company terminated the distribution agreement in 2018. The former distributor seeks, inter alia, compensation for alleged wrongful termination and “quality issues,” as well as damages for lost profits. Some of the claims are not yet quantified by the former distributor as further information from the Company is requested. The Company has denied the allegations and filed a counterclaim for malperformance under the distribution agreement. The parties have exchanged several rounds of briefs and the oral hearing in the case took place in November 2024. A decision of the arbitral tribunal is expected in 2025.
On April 5, 2024, FMCH received
From time to time, the Company is a party to or may be threatened with other litigation or arbitration, claims or assessments arising in the ordinary course of its business. Management regularly analyzes current information including, as applicable, the Company’s defenses and insurance coverage and, as necessary, provides accruals for probable liabilities for the eventual disposition of these matters.
F-88
FRESENIUS MEDICAL CARE AG
NOTES TO THE CONSOLIDATED FINANCIAL STATEMENTS
(in THOUS, except share and per share data)
The Company, like other health care providers, insurance plans and suppliers, conducts its operations under intense government regulation and scrutiny. The Company must comply with regulations which relate to or govern the safety and efficacy of medical products and supplies, the marketing and distribution of such products, the operation of manufacturing facilities, laboratories, dialysis clinics and other health care facilities, and environmental and occupational health and safety. With respect to its development, manufacture, marketing and distribution of medical products, if such compliance is not maintained, the Company could be subject to significant adverse regulatory actions by the U.S. Food and Drug Administration (FDA) and comparable regulatory authorities outside the U.S. These regulatory actions could include warning letters or other enforcement notices from the FDA, and/or comparable foreign regulatory authority which may require the Company to expend significant time and resources in order to implement appropriate corrective actions. If the Company does not address matters raised in warning letters or other enforcement notices to the satisfaction of the FDA and/or comparable regulatory authorities outside the U.S., these regulatory authorities could take additional actions, including product recalls, injunctions against the distribution of products or operation of manufacturing plants, civil penalties, seizures of the Company’s products and/or criminal prosecution. FMCH completed remediation efforts with respect to a pending FDA warning letter issued in 2011 and is awaiting confirmation as to whether the letter is now closed. FMCH has responded to a second warning letter issued in December 2023 and is engaged with the FDA about continuing remediation efforts under that letter. The Company must also comply with the laws of the U.S., including the federal Anti-Kickback Statute, the federal False Claims Act, the federal Stark Law, the federal Civil Monetary Penalties Law and the federal Foreign Corrupt Practices Act as well as other federal and state fraud and abuse laws. In Germany, where corporations are not subject to criminal law, management boards of companies must ensure business activities comply with the anti-corruption provisions of the criminal code, sections 331 et seq. ( Strafgesetzbuch ); breaches by individuals exercising commercial activity are subject to prosecution which can result in corporate fines and/or orders for the disgorgement of profit. Applicable laws or regulations may be amended, or enforcement agencies or courts may make interpretations that differ from the Company’s interpretations or the manner in which it conducts its business. In the U.S., enforcement has become a high priority for the federal government and some states. In addition, the provisions of the False Claims Act authorizing payment of a portion of any recovery to the party bringing the suit encourage private plaintiffs to commence whistleblower actions. By virtue of this regulatory environment, the Company’s business activities and practices are subject to extensive review by regulatory authorities and private parties, and continuing audits, subpoenas, other inquiries, claims and litigation relating to the Company’s compliance with applicable laws and regulations. The Company may not always be aware that an inquiry or action has begun, particularly in the case of whistleblower actions, which are initially filed under court seal.
F-89
FRESENIUS MEDICAL CARE AG
NOTES TO THE CONSOLIDATED FINANCIAL STATEMENTS
(in THOUS, except share and per share data)
The Company operates many facilities and handles the personal data of its patients and beneficiaries throughout the U.S. and other parts of the world and engages with other business associates to help it carry out its health care activities. While the Company is committed to training its employees and business associates on applicable laws and procedures, investigating concerns and incidents in a timely manner and taking remedial and corrective action (including disciplinary action) as necessary, in such a widespread, global system it may be difficult to maintain the desired level of oversight and control over the thousands of individuals employed by the Company, its many affiliated companies and its service providers or business associates. The Company recognizes that the laws, regulations and interpretative guidance on data privacy are evolving along with potential litigation and enforcement risks, and it continues to review its processes to adapt to those changes. On occasion, the Company or its business associates may experience a breach under the Health Insurance Portability and Accountability Act Privacy Rule and Security Rules, the EU’s General Data Protection Regulation or other similar laws (Data Protection Laws), which may involve certain impermissible use, access, or disclosure of unsecured personal data pertaining to patients, employees, beneficiaries or others. On those occasions, the Company is committed to compliance with applicable notification and/or reporting requirements and to take appropriate remedial and corrective action. Included within the Company’s notification requirements are SEC rules that require the Company to report the occurrence of material cybersecurity incidents in a report on Form 6-K. Any such report could trigger litigation arising out of the incident. On September 29, 2023, Cardiovascular Consultants, Ltd. (CCL), a former subsidiary of the Company located in the U.S., became aware that some of its computer systems in the U.S. were affected by a security incident. The Company publicly disclosed information regarding this security breach in a Form 6-K furnished to the SEC, noting that the Company does not expect the incident to have a material impact on its financial condition or results of operations. Subsequently, Fresenius Vascular Care, Inc. d/b/a Azura Vascular Care (Azura), a wholly owned subsidiary of the Company located in the U.S., became aware that some of its files had been affected by the same security incident. There are
The Company relies upon its management structure, regulatory and legal resources, and the effective operation of its compliance program to direct, manage and monitor the activities of its employees. On occasion, the Company may identify instances where employees or other agents deliberately, recklessly or inadvertently contravene the Company’s policies or violate applicable law and, in such instances, the Company will take appropriate corrective and/or disciplinary action. The actions of such persons may subject the Company and its subsidiaries to liability under the Anti-Kickback Statute, the Stark Law, the False Claims Act, Data Protection Laws, the Health Information Technology for Economic and Clinical Health Act and the FCPA, among other laws and comparable state laws or laws of other countries.
Physicians, hospitals and other participants in the health care industry are also subject to a large number of lawsuits alleging professional negligence, malpractice, product liability, worker’s compensation or related claims, many of which involve large claims and significant defense costs. The Company has been and is currently subject to these suits due to the nature of its business and expects that those types of lawsuits may continue. Although the Company maintains insurance at a level which it believes to be prudent, it cannot assure that the coverage limits will be adequate or that insurance will cover all asserted claims. A successful claim against the Company or any of its subsidiaries in excess of insurance coverage could have a material adverse effect upon it and the results of its operations. Any claims, regardless of their merit or eventual outcome, could have a material adverse effect on the Company’s reputation and business.
F-90
FRESENIUS MEDICAL CARE AG
NOTES TO THE CONSOLIDATED FINANCIAL STATEMENTS
(in THOUS, except share and per share data)
The Company has also had claims asserted against it and has had lawsuits filed against it relating to alleged patent infringements or businesses that it has acquired or divested. These claims and suits relate both to operation of the businesses and to acquisition and divestiture transactions. The Company has, when appropriate, asserted its own claims, and claims for indemnification. A successful claim against the Company or any of its subsidiaries could have a material adverse effect upon its business, financial condition, and the results of its operations. Any claims, regardless of their merit or eventual outcome, could have a material adverse effect on the Company’s reputation and business.
The Company is subject to ongoing and future tax audits in the U.S., Germany and other jurisdictions in the ordinary course of business. Tax authorities routinely pursue adjustments to the Company’s tax returns and disallowances of claimed tax deductions. When appropriate, the Company defends these adjustments and disallowances and asserts its own claims. A successful tax related claim against the Company or any of its subsidiaries could have a material adverse effect upon its business, financial condition and results of operations.
The German tax authorities re-qualified dividends received in connection with intercompany mandatorily redeemable preferred shares into fully taxable interest payments for the years 2006 until 2013, which could lead to additional tax payments in the mid-double-digit million range. Additionally, German tax authorities objected to the Company’s tax returns and took the position that income of one of the Company’s finance entities for 2017 and future periods should be subject to German Controlled Foreign Corporation taxation resulting in potential additional income tax payments in the low end of triple-digit millions. In both cases, the Company will take any appropriate legal action to defend its position.
The Company is subject to residual value guarantees in certain lease contracts, primarily real estate contracts, for which it is the lessee in the amount of €
Other than those individual contingent liabilities mentioned above, the current estimated amount of the Company’s other known individual contingent liabilities is immaterial. For further information regarding the Company’s purchase commitments, see note 9 and note 11.
F-91
FRESENIUS MEDICAL CARE AG
NOTES TO THE CONSOLIDATED FINANCIAL STATEMENTS
(in THOUS, except share and per share data)
26. Financial instruments
The following tables show the carrying amounts and fair values of the Company’s financial instruments at December 31, 2024 and December 31, 2023:
|
Carrying amount and fair value of financial instruments |
|
|
||||||||||||||
|
in € THOUS |
|
|
|
|
|
|
|
|
|
|
|
|
|
|
|
|
|
December 31, 2024 |
|
Carrying amount |
|
Fair value |
||||||||||||
|
|
|
Amortized |
|
|
|
|
|
Not |
|
|
|
|
|
|
|
|
|
|
|
cost |
|
FVPL |
|
FVOCI |
|
classified |
|
Total |
|
Level 1 |
|
Level 2 |
|
Level 3 |
|
|
|
|
|
|
|
|
|
|
|
|
|
|
|
|
|
|
|
Cash and cash equivalents |
|
|
|
|
|
— |
|
— |
|
|
|
|
|
— |
|
— |
|
Trade accounts and other receivables from unrelated parties (1) |
|
|
|
— |
|
— |
|
|
|
|
|
— |
|
— |
|
— |
|
Accounts receivable from related parties |
|
|
|
— |
|
— |
|
— |
|
|
|
— |
|
— |
|
— |
|
Derivatives - cash flow hedging instruments |
|
— |
|
— |
|
— |
|
|
|
|
|
— |
|
|
|
— |
|
Derivatives - not designated as hedging instruments |
|
— |
|
|
|
— |
|
— |
|
|
|
— |
|
|
|
— |
|
Equity investments |
|
— |
|
|
|
|
|
— |
|
|
|
|
|
|
|
|
|
Debt securities |
|
— |
|
|
|
|
|
— |
|
|
|
|
|
— |
|
— |
|
Other financial assets (2) |
|
|
|
|
|
— |
|
|
|
|
|
— |
|
— |
|
|
|
Other current and non-current assets |
|
|
|
|
|
|
|
|
|
|
|
— |
|
— |
|
— |
|
Financial assets |
|
|
|
|
|
|
|
|
|
|
|
— |
|
— |
|
— |
|
|
|
|
|
|
|
|
|
|
|
|
|
|
|
|
|
|
|
Accounts payable to unrelated parties (1) |
|
|
|
— |
|
— |
|
— |
|
|
|
— |
|
— |
|
— |
|
Accounts payable to related parties |
|
|
|
— |
|
— |
|
— |
|
|
|
— |
|
— |
|
— |
|
Short-term debt |
|
|
|
— |
|
— |
|
— |
|
|
|
— |
|
— |
|
— |
|
Long-term debt |
|
|
|
— |
|
— |
|
— |
|
|
|
|
|
|
|
— |
|
Lease liabilities |
|
— |
|
— |
|
— |
|
|
|
|
|
— |
|
— |
|
— |
|
Derivatives - cash flow hedging instruments |
|
— |
|
— |
|
— |
|
|
|
|
|
— |
|
|
|
— |
|
Derivatives - not designated as hedging instruments |
|
— |
|
|
|
— |
|
— |
|
|
|
— |
|
|
|
— |
|
Derivatives embedded in vPPAs |
|
— |
|
|
|
— |
|
— |
|
|
|
— |
|
— |
|
|
|
Variable payments outstanding for acquisitions |
|
— |
|
|
|
— |
|
— |
|
|
|
— |
|
— |
|
|
|
Put option liabilities |
|
— |
|
— |
|
— |
|
|
|
|
|
— |
|
— |
|
|
|
Other financial liabilities (3) |
|
|
|
— |
|
— |
|
— |
|
|
|
— |
|
— |
|
— |
|
Other current and non-current liabilities |
|
|
|
|
|
— |
|
|
|
|
|
— |
|
— |
|
— |
|
Financial liabilities |
|
|
|
|
|
— |
|
|
|
|
|
— |
|
— |
|
— |
F-92
FRESENIUS MEDICAL CARE AG
NOTES TO THE CONSOLIDATED FINANCIAL STATEMENTS
(in THOUS, except share and per share data)
|
Carrying amount and fair value of financial instruments |
|
|
||||||||||||||
|
in € THOUS |
|
|
|
|
|
|
|
|
|
|
|
|
|
|
|
|
|
December 31, 2023 |
|
Carrying amount |
|
Fair value |
||||||||||||
|
|
|
Amortized |
|
|
|
|
|
|
|
|
|
|
|
|
|
|
|
|
|
cost |
|
FVPL |
|
FVOCI |
|
Not classified |
|
Total |
|
Level 1 |
|
Level 2 |
|
Level 3 |
|
|
|
|
|
|
|
|
|
|
|
|
|
|
|
|
|
|
|
Cash and cash equivalents |
|
|
|
|
|
— |
|
— |
|
|
|
|
|
— |
|
— |
|
Trade accounts and other receivables from unrelated parties |
|
|
|
— |
|
— |
|
|
|
|
|
— |
|
— |
|
— |
|
Accounts receivable from related parties |
|
|
|
— |
|
— |
|
— |
|
|
|
— |
|
— |
|
— |
|
Derivatives - cash flow hedging instruments |
|
— |
|
— |
|
— |
|
|
|
|
|
— |
|
|
|
— |
|
Derivatives - not designated as hedging instruments |
|
— |
|
|
|
— |
|
— |
|
|
|
— |
|
|
|
— |
|
Equity investments |
|
— |
|
|
|
|
|
— |
|
|
|
|
|
|
|
|
|
Debt securities |
|
— |
|
|
|
|
|
— |
|
|
|
|
|
— |
|
— |
|
Other financial assets (2) |
|
|
|
— |
|
— |
|
|
|
|
|
— |
|
— |
|
— |
|
Other current and non-current assets |
|
|
|
|
|
|
|
|
|
|
|
— |
|
— |
|
— |
|
Financial assets |
|
|
|
|
|
|
|
|
|
|
|
— |
|
— |
|
— |
|
|
|
|
|
|
|
|
|
|
|
|
|
|
|
|
|
|
|
Accounts payable to unrelated parties |
|
|
|
— |
|
— |
|
— |
|
|
|
— |
|
— |
|
— |
|
Accounts payable to related parties |
|
|
|
— |
|
— |
|
— |
|
|
|
— |
|
— |
|
— |
|
Short-term debt |
|
|
|
— |
|
— |
|
— |
|
|
|
— |
|
— |
|
— |
|
Long-term debt |
|
|
|
— |
|
— |
|
— |
|
|
|
|
|
|
|
— |
|
Lease liabilities |
|
— |
|
— |
|
— |
|
|
|
|
|
— |
|
— |
|
— |
|
Derivatives - cash flow hedging instruments |
|
— |
|
— |
|
— |
|
|
|
|
|
— |
|
|
|
— |
|
Derivatives - not designated as hedging instruments |
|
— |
|
|
|
— |
|
— |
|
|
|
— |
|
|
|
— |
|
Variable payments outstanding for acquisitions |
|
— |
|
|
|
— |
|
— |
|
|
|
— |
|
— |
|
|
|
Put option liabilities |
|
— |
|
— |
|
— |
|
|
|
|
|
— |
|
— |
|
|
|
Other financial liabilities (3) |
|
|
|
— |
|
— |
|
— |
|
|
|
— |
|
— |
|
— |
|
Other current and non-current liabilities |
|
|
|
|
|
— |
|
|
|
|
|
— |
|
— |
|
— |
|
Financial liabilities |
|
|
|
|
|
— |
|
|
|
|
|
— |
|
— |
|
— |
| (1) | In 2024, trade accounts and other receivables from unrelated parties as well as accounts payable to unrelated parties no longer include insurance and reinsurance contract receivables (liabilities) recorded in accordance with IFRS 17, Insurance Contracts, which are presented in note 5 as such receivables and liabilities are not within the scope of IFRS 7, Financial Instruments: Disclosures. |
| (2) | As of December 31, 2024, other financial assets primarily include receivables for royalty payments from one of the Company’s equity investments, lease receivables, receivables related to consent agreement on certain pharmaceuticals, deposits, guarantees, securities, notes receivable, receivables from sale of investments as well as vendor and supplier rebates. As of December 31, 2023, other financial assets primarily include lease receivables, deposits, guarantees, securities, receivables from sale of investments, vendor and supplier rebates as well as notes receivable. |
| (3) | As of December 31, 2024 and 2023, other financial liabilities primarily include receivable credit balances and goods and services received. |
Derivative and non-derivative financial instruments are categorized in the following three-tier fair value hierarchy that reflects the significance of the inputs in making the measurements. Level 1 inputs are quoted prices for similar instruments in active markets. Level 2 is defined as using valuation models (i.e. mark-to-model) with input factors that are inputs other than quoted prices in active markets that are directly or indirectly observable. Level 3 is defined as using valuation models (i.e. mark-to-model) with input factors that are unobservable inputs for which little or no market data exists, therefore requiring the Company to develop its own assumptions. Fair value information is not provided for financial instruments, if the carrying amount is a reasonable estimate of fair value due to the relatively short period of maturity of these instruments. This includes cash and cash equivalents measured at amortized costs, trade accounts and other receivables from unrelated parties, accounts receivable from related parties, other financial assets as well as accounts payable to unrelated parties, accounts payable to related parties, short-term debt and other financial liabilities. Transfers between levels of the fair value hierarchy have not occurred as of December 31, 2024 or December 31, 2023. The Company accounts for transfers at the end of the reporting period.
Non-derivative financial instruments
The significant methods and assumptions used for the classification and measurement of non-derivative financial instruments are as follows:
The Company assessed its business models and the cash flow characteristics of its financial assets. The vast majority of the non-derivative financial assets are held in order to collect contractual cash flows. The contractual terms of the financial assets allow the conclusion that the cash flows represent payment of principal and interest only. Trade accounts and other receivables from unrelated parties (including receivables related to the former Accounts Receivable Facility, see note 17), accounts receivable from related parties and other financial assets are consequently measured at amortized cost.
F-93
FRESENIUS MEDICAL CARE AG
NOTES TO THE CONSOLIDATED FINANCIAL STATEMENTS
(in THOUS, except share and per share data)
Cash and cash equivalents are comprised of cash funds and other short-term investments. Cash funds are measured at amortized cost. Short-term investments are highly liquid and readily convertible to known amounts of cash. Short-term investments are measured at FVPL. The risk of changes in fair value is insignificant.
Equity investments are not held for trading. At initial recognition the Company elected, on an instrument-by-instrument basis, to represent subsequent changes in the fair value of individual strategic investments in OCI. All equity investments for which changes in fair value are recorded in OCI relate to purchases of publicly traded shares or percentage ownership of companies in the health sciences or adjacent fields and are made up of individually non-significant investments. At December 31, 2024, the Company held
|
Equity investments measured at FVOCI |
|
|
|
|
|
in € THOUS |
|
|
|
|
|
|
|
2024 |
|
2023 |
|
|
|
|
|
|
|
Listed equity investments |
|
— |
|
— |
|
Non-listed equity investments |
|
|
|
|
|
Equity investments FVOCI |
|
|
|
|
The majority of the debt securities are held within a business model whose objective is achieving both contractual cash flows and selling the securities. The standard coupon bonds give rise on specified dates to cash flows that are solely payments of principal and interest on the outstanding principal amount. Subsequently these financial assets have been classified as FVOCI. The smaller part of debt securities does not give rise to cash flows that are solely payments of principal and interest. Consequently, these securities are measured at FVPL. In general, most of the debt securities are quoted in an active market.
Long-term debt is initially recognized at its fair value and subsequently measured at amortized cost. The fair values of major long-term debt are calculated on the basis of market information. Liabilities for which market quotes are available are measured using these quotes. The fair values of the other long-term debt are calculated at the present value of the respective future cash flows. To determine these present values, the prevailing interest rates and credit spreads for the Company as of the balance sheet date are used.
Variable payments outstanding for acquisitions are recognized at their fair value. The estimation of the individual fair values is based on the key inputs of the arrangement that determine the future contingent payment as well as the Company’s expectation of these factors. The Company assesses the likelihood and timing of achieving the relevant objectives. The underlying assumptions are reviewed regularly.
F-94
FRESENIUS MEDICAL CARE AG
NOTES TO THE CONSOLIDATED FINANCIAL STATEMENTS
(in THOUS, except share and per share data)
Put option liabilities are recognized at the present value of the exercise price of the option. The exercise price of the option is generally based on fair value and, in certain limited instances, might contain a fixed floor price. The methodology the Company uses to estimate the fair values assumes the greater of net book value or a multiple of earnings, based on historical earnings, development stage of the underlying business and other factors. From time to time the Company engages an external valuation firm to assist in the valuation of certain put options. The external valuation assists the Company in estimating the fair values using a combination of discounted cash flows and a multiple of earnings and/or revenue. Under those limited circumstances in which the put option might contain a fixed floor price, the external valuation firm may assist the Company with the valuation by performing a Monte Carlo Simulation analysis to simulate the exercise price. The put option liabilities are discounted at a pre-tax discount rate that reflects current market assessments of the time value of money and the risks specific to the liability. The estimated fair values of these put options can also fluctuate, and the discounted cash flows as well as the implicit multiple of earnings and/or revenue at which these obligations may ultimately be settled could vary significantly from the Company’s current estimates depending upon market conditions. For the purpose of analyzing the impact of changes in unobservable inputs on the fair value measurement of put option liabilities, the Company assumes an increase on earnings (or enterprise value, where applicable) of
At December 31, 2024, 2023 and 2022 the Company’s potential obligations under these put option liabilities, which are recorded in other current liabilities and other non-current liabilities, were €
The following table provides a reconciliation of Level 3 financial instruments, excluding vPPAs as disclosed below, at December 31, 2024, 2023 and 2022:
|
Reconciliation from beginning to ending balance of level 3 financial instruments |
||||||||||||||||||||
|
in € THOUS |
|
|
|
|
|
|
|
|
|
|
|
|
|
|
|
|
|
|
|
|
|
|
|
2024 |
|
2023 |
|
2022 |
||||||||||||||
|
|
|
|
|
Variable |
|
|
|
Other |
|
|
|
Variable |
|
|
|
|
|
Variable |
|
|
|
|
|
|
|
payments |
|
|
|
financial assets |
|
|
|
payments |
|
|
|
|
|
payments |
|
|
|
|
|
Equity |
|
outstanding for |
|
Put option |
|
measured |
|
Equity |
|
outstanding for |
|
Put option |
|
Equity |
|
outstanding for |
|
Put option |
|
|
|
investments |
|
acquisitions |
|
liabilities |
|
at FVPL (1) |
|
investments |
|
acquisitions |
|
liabilities |
|
investments |
|
acquisitions |
|
liabilities |
|
|
|
|
|
|
|
|
|
|
|
|
|
|
|
|
|
|
|
|
|
|
|
Beginning balance at January 1, |
|
|
|
|
|
|
|
— |
|
|
|
|
|
|
|
|
|
|
|
|
|
Increase |
|
|
|
|
|
|
|
|
|
|
|
|
|
|
|
|
|
|
|
|
|
Decrease |
|
— |
|
(
|
|
(
|
|
(
|
|
— |
|
(
|
|
(
|
|
— |
|
(
|
|
(
|
|
Reclassifications |
|
— |
|
— |
|
— |
|
|
(2) |
— |
|
— |
|
— |
|
— |
|
— |
|
— |
|
Gain / loss recognized in profit or loss (3) |
|
(
|
|
(
|
|
— |
|
|
|
(
|
|
(
|
|
— |
|
(
|
|
(
|
|
— |
|
Gain / loss recognized in equity |
|
— |
|
— |
|
(
|
|
— |
|
— |
|
— |
|
(
|
|
— |
|
— |
|
(
|
|
Foreign currency translation and other changes |
|
|
|
|
|
|
|
|
|
(
|
|
(
|
|
(
|
|
|
|
|
|
|
|
Ending balance at December 31, |
|
|
|
|
|
|
|
|
|
|
|
|
|
|
|
|
|
|
|
|
| (1) | Other financial assets measured at FVPL consist of receivables from licensing agreements and receivables from sale of investments. |
| (2) | Receivables for royalty payments from one of the Company’s equity investments were previously reported as a non-financial asset and were revised as of December 31, 2024. |
| (3) | Includes realized and unrealized gains / losses. |
Derivative financial instruments
Derivative financial risks
The Company is exposed to effects related to foreign exchange fluctuations in connection with its international business activities that are denominated in various currencies. In order to finance its business operations, the Company issues bonds and enters mainly into long-term credit agreements with banks. Due to these financing activities, the Company is exposed to changes to the prevailing interest rates.
F-95
FRESENIUS MEDICAL CARE AG
NOTES TO THE CONSOLIDATED FINANCIAL STATEMENTS
(in THOUS, except share and per share data)
In order to manage the risk of currency exchange rate and interest rate fluctuations, the Company enters into various hedging transactions by means of derivative instruments with highly rated financial institutions (generally investment grade) as authorized by the Company’s Management. On a quarterly basis, the Company performs an assessment of its counterparty credit risk. The Company currently considers this risk to be low (as the counterparties are generally investment grade). The Company’s policy, which has been consistently followed, is that financial derivatives be used only for the purpose of hedging foreign currency and interest rate exposure.
In certain instances, the Company enters into derivative contracts that do not qualify for hedge accounting but are utilized for economic purposes (economic hedges). The Company does not use financial instruments for trading purposes. The Company established guidelines for risk assessment procedures and controls for the use of financial instruments. They include a clear segregation of duties with regard to execution on one side and administration, accounting and controlling on the other.
To reduce the credit risk arising from derivatives, the Company entered into master netting agreements with banks. Through such agreements, positive and negative fair values of the derivative contracts could be offset against one another if a partner becomes insolvent. This offsetting is valid for transactions where the aggregate amount of obligations owed to and receivable from are not equal. If insolvency occurs, the party which owes the larger amount is obliged to pay the other party the difference between the amounts owed in the form of one net payment.
These master netting agreements do not provide a basis for offsetting the fair values of derivative financial instruments in the statement of financial position as the offsetting criteria under IFRS Accounting Standards are not satisfied.
At December 31, 2024 and December 31, 2023, the Company had €
The Company calculates benchmarks for individual exposures in order to quantify interest and foreign exchange risks. The benchmarks are derived from achievable and reasonable market rates. Depending on the individual benchmarks, hedging strategies are agreed on and implemented.
In April 2024, the Company signed several vPPAs with wind and solar energy project developers in Germany and in the U.S. with terms of up to
|
Sensitivities of derivatives embedded in vPPAs to changes in unobservable inputs |
||||||||||
|
in € THOUS |
||||||||||
|
Change in expected electricity prices |
|
Change in expected production volumes |
|
Change in expected interest rates |
||||||
|
|
|
|
|
|
|
|
|
|
|
|
|
|
|
(
|
|
(
|
|
|
|
|
|
(
|
F-96
FRESENIUS MEDICAL CARE AG
NOTES TO THE CONSOLIDATED FINANCIAL STATEMENTS
(in THOUS, except share and per share data)
Due to the volatile nature of such instruments which may be considered to be speculative, it is difficult to accurately predict what impact the volatility of unobservable inputs, such as changes in expected energy prices or production volumes, may have on the valuation of such instruments in the future. The estimated fair values of these derivative instruments may fluctuate significantly from quarter to quarter and the price at which these derivatives may ultimately be settled could vary significantly from the Company’s current estimates, depending upon market conditions.
The following table provides a reconciliation of derivatives embedded in the vPPAs at December 31, 2024:
|
Reconciliation of derivatives embedded in vPPAs |
|
|
|
in € THOUS |
|
2024 |
|
|
|
Derivatives embedded in |
|
|
|
the vPPAs - Liabilities |
|
Beginning balance at January 1, |
|
— |
|
Settlements |
|
|
|
Gain (loss) recognized in profit or loss (1) |
|
(
|
|
Foreign currency translation and other changes |
|
(
|
|
Ending balance at December 31, |
|
(
|
| (1) | Includes realized and unrealized gains / losses. |
Market risk
Foreign exchange risk management
The Company conducts business on a global basis in various currencies, though a majority of its operations are in Germany and the United States. For financial reporting purposes, the Company reports in euro pursuant to Section 315e and Section 244 HGB. Therefore, changes in the rate of exchange between the euro and the local currencies in which the financial statements of the Company’s international operations are maintained, affect its results of operations and financial position as reported in its consolidated financial statements.
Additionally, individual subsidiaries are exposed to transactional risks mainly resulting from intercompany purchases between production sites and other subsidiaries with different functional currencies. This exposes the subsidiaries to fluctuations in the rate of exchange between the invoicing currencies and the currency in which their local operations are conducted. For the purpose of hedging existing and foreseeable foreign exchange transaction exposures the Company enters into foreign exchange hedge contracts.
The notional amounts of foreign exchange contracts in place that are designated and qualify as cash flow hedges totaled €
The Company also enters into derivative contracts for forecasted product purchases and sales and for intercompany loans in foreign currencies which do not qualify for hedge accounting but are utilized for economic hedges as defined above. The notional amounts of economic hedges totaled €
The Company uses a Cash-Flow-at-Risk (CFaR) model in order to estimate and quantify transaction risks from foreign currencies. The basis for the analysis of the currency risks are the foreign currency cash flows that are reasonably expected to arise within the following twelve months, less any hedges. Under the CFaR approach, the potential currency fluctuations of these net exposures are shown as probability distributions based on historical volatilities and correlations using the values of the last
F-97
FRESENIUS MEDICAL CARE AG
NOTES TO THE CONSOLIDATED FINANCIAL STATEMENTS
(in THOUS, except share and per share data)
The following table shows the average hedging rate and the nominal amount of the foreign exchange forward contracts for the currencies with highest hedging volume at December 31, 2024:
|
Significant currency pairs |
||||
|
in € THOUS |
|
|
|
|
|
|
|
Nominal |
|
Average |
|
|
|
amount |
|
hedging rate |
|
|
|
|
|
|
|
EUR/USD |
|
|
|
|
|
EUR/CNY |
|
|
|
|
|
EUR/GBP |
|
|
|
|
Interest rate risk management
The Company’s interest rate risks mainly arise from money market and capital market transactions of the group for financing its business activities.
For purposes of analyzing the impact of changes in the relevant reference interest rates on the Company’s results of operations, the Company calculates the portion of financial debt which bears variable interest rate and which has not been hedged by means of interest rate swaps or options against rising interest rates. For this particular part of its liabilities, the Company assumes an increase in the Reference Rates of
The Company entered into interest rate hedges (pre-hedges) in anticipation of future long-term debt issuance. These pre-hedges are used to hedge interest rate exposures with regard to interest rates which are relevant for the future long-term debt issuance and which could rise until the respective debt is actually issued. These pre-hedges were settled at the issuance date of the corresponding long-term debt with the settlement amount recorded in AOCI amortized to interest expense over the life of the debt. At December 31, 2024 and December 31, 2023, the Company had €
Derivative financial instruments valuation
The following table shows the carrying amounts of the Company’s derivatives at December 31, 2024 and December 31, 2023:
|
Derivative financial instruments valuation |
||||||||
|
in € THOUS |
|
|
|
|
|
|
|
|
|
|
|
2024 |
|
2023 |
||||
|
|
|
Assets |
|
Liabilities |
|
Assets |
|
Liabilities |
|
Current |
|
|
|
|
|
|
|
|
|
Foreign exchange contracts |
|
|
|
(
|
|
|
|
(
|
|
|
|
|
|
|
|
|
|
|
|
Non-current |
|
|
|
|
|
|
|
|
|
Foreign exchange contracts |
|
— |
|
— |
|
— |
|
— |
|
Derivatives in cash flow hedging relationships |
|
|
|
(
|
|
|
|
(
|
|
|
|
|
|
|
|
|
|
|
|
Current |
|
|
|
|
|
|
|
|
|
Foreign exchange contracts |
|
|
|
(
|
|
|
|
(
|
|
|
|
|
|
|
|
|
|
|
|
Non-current |
|
|
|
|
|
|
|
|
|
Foreign exchange contracts |
|
|
|
(
|
|
|
|
— |
|
Derivatives embedded in vPPAs |
|
— |
|
(
|
|
— |
|
— |
|
Derivatives not designated as hedging instruments |
|
|
|
(
|
|
|
|
(
|
F-98
FRESENIUS MEDICAL CARE AG
NOTES TO THE CONSOLIDATED FINANCIAL STATEMENTS
(in THOUS, except share and per share data)
The significant methods and assumptions used in estimating the fair values of derivative financial instruments are as follows:
To determine the fair value of foreign exchange forward contracts, the contracted forward rate is compared to the current forward rate for the remaining term of the contract as of the balance sheet date. The result is then discounted on the basis of the market interest rates prevailing at the balance sheet date for the applicable currency.
The Company’s own credit risk is incorporated in the fair value estimation of derivatives that are liabilities. Counterparty credit risk adjustments are factored into the valuation of derivatives that are assets. The Company monitors and analyses the credit risk from derivative financial instruments on a regular basis. For the valuation of derivative financial instruments, the credit risk is considered in the fair value of every individual instrument. The default probability is based upon the credit default swap spreads of each counterparty appropriate for the duration. The calculation of the credit risk considered in the valuation is performed by multiplying the default probability appropriate for the duration with the expected discounted cash flows of the derivative financial instrument.
The effect of financial instruments on the consolidated statements of income
The effects of financial instruments recorded in the consolidated statements of income consist of interest income of €
In the fiscal year 2024, net losses from foreign currency transactions amount to €
The following table shows the effect of derivatives in cash flow hedging relationship on the consolidated financial statement:
|
The effect of derivatives in cash flow hedging relationships on the consolidated financial statements |
||||||||||
|
in € THOUS |
|
|
|
|
|
|
|
|
|
|
|
|
|
Fair value gain |
|
Fair value gain |
|
|
|
|
|
|
|
|
|
(loss) recognized in |
|
(loss) recognized in |
|
|
|
Amount |
|
Amount |
|
|
|
AOCI on hedging |
|
AOCI on hedging |
|
Location of |
|
reclassified |
|
reclassified |
|
|
|
instrument (hedge |
|
instrument (cost of |
|
reclassified |
|
from hedge |
|
from cost of |
|
|
|
reserve) |
|
hedging) |
|
amounts from AOCI |
|
reserve |
|
hedging |
|
For the year ended December 31, 2024 |
|
|
|
|
|
|
|
|
|
|
|
|
|
|
|
|
|
|
|
|
|
|
|
Foreign exchange contracts |
|
(
|
|
(
|
|
Interest income/expense |
|
|
|
— |
|
|
|
|
|
|
|
thereof: |
|
|
|
|
|
|
|
|
|
|
|
Revenue |
|
(
|
|
|
|
|
|
|
|
|
|
Costs of revenue |
|
(
|
|
|
|
Total |
|
(
|
|
(
|
|
|
|
(
|
|
|
|
|
|
|
|
|
|
|
|
|
|
|
|
For the year ended December 31, 2023 |
|
|
|
|
|
|
|
|
|
|
|
Foreign exchange contracts |
|
|
|
(
|
|
Interest income/expense |
|
|
|
— |
|
|
|
|
|
|
|
thereof: |
|
|
|
|
|
|
|
|
|
|
|
Revenue |
|
(
|
|
|
|
|
|
|
|
|
|
Costs of revenue |
|
(
|
|
|
|
Total |
|
|
|
(
|
|
|
|
(
|
|
|
F-99
FRESENIUS MEDICAL CARE AG
NOTES TO THE CONSOLIDATED FINANCIAL STATEMENTS
(in THOUS, except share and per share data)
The following table shows the effect of derivatives not designated as hedging instruments on the consolidated financial statements:
|
The effect of derivatives not designated as hedging instruments on the consolidated financial statements |
||||||
|
in € THOUS |
|
|
|
|
|
|
|
|
|
|
|
Amount of (gain) loss recognized in |
||
|
|
|
|
|
income on derivatives |
||
|
|
|
Location of (gain) loss recognized in |
|
for the year ended, December 31 |
||
|
|
|
income on derivatives |
|
2024 |
|
2023 |
|
|
|
|
|
|
|
|
|
Foreign exchange contracts |
|
Other operating income/expense |
|
|
|
(
|
|
Foreign exchange contracts |
|
Interest income/expense |
|
|
|
|
|
Derivatives embedded in vPPAs |
|
Other operating income/expense |
|
|
|
— |
|
Derivatives not designated as hedging instruments |
|
|
|
|
|
(
|
Credit risk
The Company is exposed to potential losses in the event of non-performance by counterparties. With respect to derivative financial instruments it is not expected that any counterparty will fail to meet its obligations as the counterparties are highly rated financial institutions (generally investment grade). The maximum credit exposure of derivatives is represented by the fair value of those contracts with a positive fair value at the balance sheet date. The maximum credit exposure of all derivatives amounted to €
Liquidity risk
The liquidity risk is defined as the risk that a company is potentially unable to meet its financial obligations. The Management of the Company manages the liquidity of the group by means of effective working capital and cash management as well as an anticipatory evaluation of refinancing alternatives. The Company’s management believes that existing credit facilities, net cash provided by operating activities and additional short-term debt are sufficient to meet the Company’s foreseeable demand for liquidity (see note 16).
F-100
FRESENIUS MEDICAL CARE AG
NOTES TO THE CONSOLIDATED FINANCIAL STATEMENTS
(in THOUS, except share and per share data)
The following table shows the future undiscounted contractual cash flows (including interest) resulting from recognized financial liabilities and derivative financial instruments recorded in the consolidated balance sheets:
|
Payments agreed by contracts |
||||||||
|
in € THOUS |
|
|
|
|
|
|
|
|
|
|
|
Payments due by period of |
||||||
|
|
|
Less than 1 year |
|
1 - 3 years |
|
3 - 5 years |
|
Over 5 years |
|
2024 |
|
|
|
|
|
|
|
|
|
Non-Derivatives |
|
|
|
|
|
|
|
|
|
Accounts payable to unrelated parties |
|
|
|
|
|
— |
|
— |
|
Accounts payable to related parties |
|
|
|
— |
|
— |
|
— |
|
Other financial liabilities |
|
|
|
|
|
|
|
|
|
Short-term debt |
|
|
|
— |
|
— |
|
— |
|
Bonds |
|
|
|
|
|
|
|
|
|
Other long-term debt |
|
|
|
|
|
|
|
|
|
Lease liabilities (1) |
|
|
|
|
|
|
|
|
|
Variable payments outstanding for acquisitions |
|
|
|
|
|
|
|
|
|
Put option liabilities |
|
|
|
|
|
|
|
|
|
|
|
|
|
|
|
|
|
|
|
|
|
|
|
|
|
|
|
|
|
Derivatives |
|
|
|
|
|
|
|
|
|
Derivative financial instruments - in cash flow hedging relationships |
|
|
|
|
|
|
|
|
|
(Inflow) |
|
(
|
|
— |
|
— |
|
— |
|
Outflow |
|
|
|
— |
|
— |
|
— |
|
|
|
|
|
— |
|
— |
|
— |
|
|
|
|
|
|
|
|
|
|
|
Derivative financial instruments - not designated as hedging instrument |
|
|
|
|
|
|
|
|
|
(Inflow) |
|
(
|
|
(
|
|
(
|
|
(
|
|
Outflow |
|
|
|
|
|
|
|
|
|
|
|
|
|
|
|
|
|
|
|
|
|
|
|
|
|
|
|
|
|
Total |
|
|
|
|
|
|
|
|
|
|
|
|
|
|
|
|
|
|
|
2023 |
|
|
|
|
|
|
|
|
|
Non-Derivatives |
|
|
|
|
|
|
|
|
|
Accounts payable to unrelated parties |
|
|
|
|
|
— |
|
— |
|
Accounts payable to related parties |
|
|
|
— |
|
— |
|
— |
|
Other financial liabilities |
|
|
|
— |
|
— |
|
— |
|
Short-term debt |
|
|
|
— |
|
— |
|
— |
|
Bonds |
|
|
|
|
|
|
|
|
|
Accounts receivable facility (2) |
|
|
|
— |
|
— |
|
— |
|
Other long-term debt |
|
|
|
|
|
|
|
|
|
Lease liabilities (1) |
|
|
|
|
|
|
|
|
|
Variable payments outstanding for acquisitions |
|
|
|
|
|
— |
|
|
|
Put option liabilities |
|
|
|
|
|
|
|
|
|
Letters of credit |
|
|
|
— |
|
— |
|
— |
|
|
|
|
|
|
|
|
|
|
|
|
|
|
|
|
|
|
|
|
|
Derivatives |
|
|
|
|
|
|
|
|
|
Derivative financial instruments - in cash flow hedging relationships |
|
|
|
|
|
|
|
|
|
(Inflow) |
|
(
|
|
— |
|
— |
|
— |
|
Outflow |
|
|
|
— |
|
— |
|
— |
|
|
|
|
|
— |
|
— |
|
— |
|
|
|
|
|
|
|
|
|
|
|
Derivative financial instruments - not designated as hedging instrument |
|
|
|
|
|
|
|
|
|
(Inflow) |
|
(
|
|
— |
|
— |
|
— |
|
Outflow |
|
|
|
— |
|
— |
|
— |
|
|
|
|
|
— |
|
— |
|
— |
|
|
|
|
|
|
|
|
|
|
|
Total |
|
|
|
|
|
|
|
|
| (1) | Includes amounts from related parties. |
| (2) | Future interest payments for financial liabilities with variable interest rates were calculated using the latest interest rates fixed prior to the end of the respective reporting period . |
F-101
FRESENIUS MEDICAL CARE AG
NOTES TO THE CONSOLIDATED FINANCIAL STATEMENTS
(in THOUS, except share and per share data)
27. Other comprehensive income (loss)
The changes in the components of other comprehensive income (loss) for the years ended December 31, 2024, 2023, and 2022 are as follows:
|
Other comprehensive income (loss) |
||||||||||||||||||
|
in € THOUS |
|
|
|
|
|
|
|
|
|
|
|
|
|
|
|
|
|
|
|
|
|
2024 |
|
2023 |
|
2022 |
||||||||||||
|
|
|
|
|
|
|
|
|
|
|
|
|
|
|
|
|
|
|
|
|
|
|
Pretax |
|
Tax effect |
|
Net |
|
Pretax |
|
Tax effect |
|
Net |
|
Pretax |
|
Tax effect |
|
Net |
|
Components that will not be reclassified to profit or loss: |
|
|
|
|
|
|
|
|
|
|
|
|
|
|
|
|
|
|
|
Equity method investees - share of OCI |
|
— |
|
— |
|
— |
|
— |
|
— |
|
— |
|
|
|
— |
|
|
|
FVOCI equity investments |
|
(
|
|
(
|
|
(
|
|
|
|
(
|
|
|
|
|
|
(
|
|
|
|
Actuarial gain (loss) on defined benefit pension plans |
|
|
|
(
|
|
|
|
(
|
|
|
|
(
|
|
|
|
(
|
|
|
|
|
|
|
|
|
|
|
|
|
|
|
|
|
|
|
|
|
|
|
|
Components that may be reclassified subsequently to profit or loss: |
|
|
|
|
|
|
|
|
|
|
|
|
|
|
|
|
|
|
|
Foreign currency translation adjustment, net of reclassification adjustments resulting from deconsolidation |
|
|
|
— |
|
|
|
(
|
|
— |
|
(
|
|
|
|
— |
|
|
|
FVOCI debt securities |
|
(
|
|
|
|
(
|
|
|
|
(
|
|
|
|
(
|
|
|
|
(
|
|
Other comprehensive income (loss) relating to cash flow hedges: |
|
|
|
|
|
|
|
|
|
|
|
|
|
|
|
|
|
|
|
Changes in fair value of cash flow hedging reserve during the period |
|
(
|
|
|
|
(
|
|
|
|
(
|
|
|
|
|
|
(
|
|
|
|
Cost of hedging |
|
(
|
|
|
|
(
|
|
(
|
|
|
|
(
|
|
(
|
|
|
|
(
|
|
Reclassification adjustments |
|
(
|
|
|
|
(
|
|
(
|
|
|
|
(
|
|
|
|
(
|
|
|
|
Total other comprehensive income (loss) relating to cash flow hedges |
|
(
|
|
|
|
(
|
|
(
|
|
|
|
(
|
|
|
|
(
|
|
|
|
|
|
|
|
|
|
|
|
|
|
|
|
|
|
|
|
|
|
|
|
Other comprehensive income (loss) |
|
|
|
(
|
|
|
|
(
|
|
|
|
(
|
|
|
|
(
|
|
|
F-102
FRESENIUS MEDICAL CARE AG
NOTES TO THE CONSOLIDATED FINANCIAL STATEMENTS
(in THOUS, except share and per share data)
28. Supplementary cash flow information
The following additional information is provided with respect to net cash provided by (used in) investing activities for the years ended December 31, 2024, 2023 and 2022:
|
Details for net cash provided by (used in) investing activities |
||||||
|
in € THOUS |
|
|
|
|
|
|
|
|
|
2024 |
|
2023 |
|
2022 |
|
Details for acquisitions |
|
|
|
|
|
|
|
Assets acquired |
|
(
|
|
(
|
|
(
|
|
Liabilities assumed |
|
— |
|
— |
|
|
|
Noncontrolling interests |
|
— |
|
|
|
|
|
Non-cash consideration |
|
|
|
|
|
|
|
Cash paid |
|
(
|
|
(
|
|
(
|
|
Less cash acquired |
|
— |
|
— |
|
|
|
Net cash paid for acquisitions |
|
(
|
|
(
|
|
|
|
|
|
|
|
|
|
|
|
Cash paid for investments |
|
(
|
|
(
|
|
(
|
|
Cash paid for intangible assets |
|
(
|
|
(
|
|
(
|
|
Total cash paid for acquisitions and investments, net of cash acquired, and purchases of intangible assets |
|
(
|
|
(
|
|
(
|
|
|
|
|
|
|
|
|
|
Details for divestitures |
|
|
|
|
|
|
|
Cash received from sale of subsidiaries or other businesses, less cash disposed |
|
|
|
|
|
|
|
Proceeds from divestitures |
|
|
|
|
|
|
The following table shows a reconciliation of debt to net cash provided by (used in) financing activities for 2024:
|
Reconciliation of debt to net cash provided by (used in) financing activities |
||||||||||||||
|
in € THOUS |
|
|
|
|
|
|
|
|
|
|
|
|
|
|
|
|
|
|
|
|
|
Non-cash changes |
|
|
||||||
|
|
|
|
|
|
|
|
|
|
|
Amortization |
|
|
|
|
|
|
|
|
|
|
|
Acquisitions |
|
Foreign |
|
of debt |
|
|
|
|
|
|
|
January 1, |
|
Cash |
|
(net of |
|
currency |
|
issuance costs |
|
|
|
December 31, |
|
|
|
2024 |
|
Flow |
|
divestitures) |
|
translation |
|
and discounts |
|
Other |
|
2024 |
|
|
|
|
|
|
|
|
|
|
|
|
|
|
|
|
|
Short-term debt from unrelated parties |
|
|
|
(
|
|
|
|
|
|
— |
|
(
|
|
|
|
Long-term debt (excluding Accounts Receivable Facility) |
|
|
|
(
|
|
(
|
|
|
|
|
|
(
|
|
|
|
Accounts Receivable Facility |
|
|
|
(
|
|
— |
|
|
|
— |
|
(
|
|
— |
|
Lease liabilities from unrelated parties |
|
|
|
(
|
|
(
|
|
|
|
— |
|
|
(1) |
|
|
Lease liabilities from related parties |
|
|
|
(
|
|
— |
|
(
|
|
— |
|
|
(1) |
|
| (1) |
Includes newly concluded leases, lease modifications and reassessments of leases with third parties and related parties. Furthermore, interest expense in the amount of
€
|
F-103
FRESENIUS MEDICAL CARE AG
NOTES TO THE CONSOLIDATED FINANCIAL STATEMENTS
(in THOUS, except share and per share data)
The following table shows a reconciliation of debt to net cash provided by (used in) financing activities for 2023:
|
Reconciliation of debt to net cash provided by (used in) financing activities |
||||||||||||||
|
in € THOUS |
|
|
|
|
|
|
|
|
|
|
|
|
|
|
|
|
|
|
|
|
|
Non-cash changes |
|
|
||||||
|
|
|
|
|
|
|
|
|
|
|
Amortization |
|
|
|
|
|
|
|
|
|
|
|
Acquisitions |
|
Foreign |
|
of debt |
|
|
|
|
|
|
|
January 1, |
|
Cash |
|
(net of |
|
currency |
|
issuance costs |
|
|
|
December 31, |
|
|
|
2023 |
|
Flow |
|
divestitures) |
|
translation |
|
and discounts |
|
Other (1) |
|
2023 |
|
|
|
|
|
|
|
|
|
|
|
|
|
|
|
|
|
Short-term debt from unrelated parties |
|
|
|
(
|
|
(
|
|
(
|
|
— |
|
|
|
|
|
Short-term debt from related parties |
|
|
|
(
|
|
— |
|
— |
|
— |
|
— |
|
— |
|
Long-term debt (excluding Accounts Receivable Facility) (1) |
|
|
|
(
|
|
(
|
|
(
|
|
|
|
|
|
|
|
Accounts Receivable Facility |
|
|
|
(
|
|
— |
|
(
|
|
|
|
|
|
|
|
Lease liabilities from unrelated parties |
|
|
|
(
|
|
(
|
|
(
|
|
— |
|
|
(2) |
|
|
Lease liabilities from related parties |
|
|
|
(
|
|
— |
|
|
|
— |
|
|
(2) |
|
| (1) |
Included within “Other” are
€
|
| (2) |
Includes newly concluded leases, lease modifications and reassessments of leases with third parties and related parties. Furthermore, interest expense in the amount of
€
|
Interest payments are included in operating activities in the consolidated statements of cash flows in the amount of €
F-104
FRESENIUS MEDICAL CARE AG
NOTES TO THE CONSOLIDATED FINANCIAL STATEMENTS
(in THOUS, except share and per share data)
29. Segment and corporate information
The operating segments are determined based upon how the Company manages its businesses and allocates resources with responsibilities by products and services and is aligned to the financial information that is presented on a quarterly basis to the chief operating decision maker. The Care Enablement segment is primarily engaged in the distribution of health care products and equipment, including R&D, manufacturing, supply chain and commercial operations, as well as supporting functions, such as regulatory and quality management. The Care Delivery segment is primarily engaged in providing health care services for the treatment of CKD, ESRD and other extracorporeal therapies, including value and risk-based care programs. Care Delivery also includes the pharmaceutical products business and the income from equity method investees related to the sale of certain renal pharmaceuticals from Vifor Fresenius Medical Care Renal Pharma Ltd., which are used in the Company’s clinics to provide health care services to its patients.
The Company’s Global Medical Office, which seeks to optimize medical treatments and clinical processes within the Company and supports both Care Delivery and Care Enablement, is centrally managed and its profit and loss are allocated to the segments. Similarly, the Company allocates costs related primarily to headquarters’ overhead charges, including accounting and finance as well as certain human resources, legal and IT costs, as the Company believes that these costs are attributable to the segments and used in the allocation of resources to Care Delivery and Care Enablement. These costs are allocated at budgeted amounts, with the difference between budgeted and actual figures recorded at the corporate level. However, certain costs, which relate mainly to shareholder activities, management activities, global internal audit and the remeasurement of certain investments and vPPAs are not allocated to a segment but are accounted for as corporate expenses. These activities do not fulfill the definition of a segment according to IFRS 8, Operating Segments and are reported separately as Corporate (Corporate). Financing is a corporate function which is not controlled by the operating segments. Therefore, the Company does not include interest expense relating to financing as a segment measurement. In addition, the Company does not include income taxes as it believes taxes are outside the segments’ control.
Management evaluates each segment using measures that reflect all of the segment’s controllable revenues and expenses. With respect to the performance of business operations, management believes that the most appropriate measures are revenue and operating income. The Company transfers products between segments at fair market value. The associated internal revenues and expenses and any remaining internally generated profit or loss for the product transfers are recorded within the operating segments initially, are eliminated upon consolidation and are included within “Inter-segment eliminations.” Capital expenditures for production are based on the expected demand of the segments and consolidated profitability considerations.
F-105
FRESENIUS MEDICAL CARE AG
NOTES TO THE CONSOLIDATED FINANCIAL STATEMENTS
(in THOUS, except share and per share data)
Information pertaining to the Company’s segment and Corporate activities for the years ended December 31, 2024, 2023 and 2022 is set forth below:
|
Segment and corporate information |
||||||||||||
|
in € THOUS |
|
|
|
|
|
|
|
|
|
|
|
|
|
|
|
Care |
|
Care |
|
Total |
|
Inter-segment |
|
|
|
|
|
|
|
Delivery |
|
Enablement |
|
Segment |
|
eliminations |
|
Corporate |
|
Total |
|
2024 |
|
|
|
|
|
|
|
|
|
|
|
|
|
Revenue from health care services (1) |
|
|
|
— |
|
|
|
— |
|
— |
|
|
|
Revenue from health care products (1) |
|
|
|
|
|
|
|
— |
|
— |
|
|
|
Revenue from contracts with customers (1) |
|
|
|
|
|
|
|
— |
|
— |
|
|
|
Revenue from insurance contracts (1) |
|
|
|
— |
|
|
|
— |
|
— |
|
|
|
Revenue from lease contracts (1) |
|
— |
|
|
|
|
|
— |
|
— |
|
|
|
Revenue from external customers |
|
|
|
|
|
|
|
— |
|
— |
|
|
|
Inter-segment revenue |
|
— |
|
|
|
|
|
(
|
|
— |
|
— |
|
Revenue |
|
|
|
|
|
|
|
(
|
|
— |
|
|
|
Costs of revenue |
|
(
|
|
(
|
|
(
|
|
|
|
(
|
|
(
|
|
Research and development |
|
(
|
|
(
|
|
(
|
|
— |
|
(
|
|
(
|
|
Operating income (loss) |
|
|
|
|
|
|
|
(
|
|
(
|
|
|
|
Interest |
|
|
|
|
|
|
|
|
|
|
|
(
|
|
Income before income taxes |
|
|
|
|
|
|
|
|
|
|
|
|
|
Depreciation and amortization |
|
(
|
|
(
|
|
(
|
|
|
|
(
|
|
(
|
|
Impairment loss |
|
(
|
|
(
|
|
(
|
|
— |
|
(
|
|
(
|
|
Income (loss) from equity method investees |
|
|
|
— |
|
|
|
— |
|
— |
|
|
|
Total assets (1) |
|
|
|
|
|
|
|
(
|
|
|
|
|
|
thereof investment in equity method investees (1) |
|
|
|
— |
|
|
|
— |
|
— |
|
|
|
Additions of property, plant and equipment, intangible assets and right-of-use assets (1) |
|
|
|
|
|
|
|
(
|
|
|
|
|
|
|
|
|
|
|
|
|
|
|
|
|
|
|
|
2023 |
|
|
|
|
|
|
|
|
|
|
|
|
|
Revenue from health care services (1) |
|
|
|
— |
|
|
|
— |
|
— |
|
|
|
Revenue from health care products (1) |
|
|
|
|
|
|
|
— |
|
— |
|
|
|
Revenue from contracts with customers (1) |
|
|
|
|
|
|
|
— |
|
— |
|
|
|
Revenue from insurance contracts (1) |
|
|
|
— |
|
|
|
|
|
|
|
|
|
Revenue from lease contracts (1) |
|
— |
|
|
|
|
|
— |
|
— |
|
|
|
Revenue from external customers |
|
|
|
|
|
|
|
— |
|
— |
|
|
|
Inter-segment revenue |
|
— |
|
|
|
|
|
(
|
|
— |
|
— |
|
Revenue |
|
|
|
|
|
|
|
(
|
|
— |
|
|
|
Costs of revenue |
|
(
|
|
(
|
|
(
|
|
|
|
(
|
|
(
|
|
Research and development |
|
(
|
|
(
|
|
(
|
|
— |
|
(
|
|
(
|
|
Operating income (loss) |
|
|
|
(
|
|
|
|
(
|
|
(
|
|
|
|
Interest |
|
|
|
|
|
|
|
|
|
|
|
(
|
|
Income before income taxes |
|
|
|
|
|
|
|
|
|
|
|
|
|
Depreciation and amortization |
|
(
|
|
(
|
|
(
|
|
|
|
(
|
|
(
|
|
Impairment loss |
|
(
|
|
(
|
|
(
|
|
— |
|
(
|
|
(
|
|
Income (loss) from equity method investees |
|
|
|
|
|
|
|
— |
|
— |
|
|
|
Total assets (1) |
|
|
|
|
|
|
|
(
|
|
|
|
|
|
thereof investment in equity method investees (1) |
|
|
|
— |
|
|
|
— |
|
— |
|
|
|
Additions of property, plant and equipment, intangible assets and right-of-use assets (1) |
|
|
|
|
|
|
|
(
|
|
|
|
|
|
|
|
|
|
|
|
|
|
|
|
|
|
|
|
2022 |
|
|
|
|
|
|
|
|
|
|
|
|
|
Revenue from health care services (1) |
|
|
|
— |
|
|
|
— |
|
— |
|
|
|
Revenue from health care products (1) |
|
|
|
|
|
|
|
— |
|
— |
|
|
|
Revenue from contracts with customers (1) |
|
|
|
|
|
|
|
— |
|
— |
|
|
|
Revenue from insurance contracts (1) |
|
|
|
— |
|
|
|
|
|
|
|
|
|
Revenue from lease contracts (1) |
|
— |
|
|
|
|
|
— |
|
— |
|
|
|
Revenue from external customers |
|
|
|
|
|
|
|
— |
|
— |
|
|
|
Inter-segment revenue |
|
— |
|
|
|
|
|
(
|
|
— |
|
— |
|
Revenue |
|
|
|
|
|
|
|
(
|
|
— |
|
|
|
Costs of revenue |
|
(
|
|
(
|
|
(
|
|
|
|
— |
|
(
|
|
Research and development |
|
(
|
|
(
|
|
(
|
|
— |
|
— |
|
(
|
|
Operating income (loss) |
|
|
|
(
|
|
|
|
|
|
(
|
|
|
|
Interest |
|
|
|
|
|
|
|
|
|
|
|
(
|
|
Income before income taxes |
|
|
|
|
|
|
|
|
|
|
|
|
|
Depreciation and amortization |
|
(
|
|
(
|
|
(
|
|
|
|
(
|
|
(
|
|
Impairment loss |
|
(
|
|
(
|
|
(
|
|
— |
|
(
|
|
(
|
|
Income (loss) from equity method investees |
|
|
|
(
|
|
|
|
— |
|
|
|
|
|
Total assets (1) |
|
|
|
|
|
|
|
(
|
|
|
|
|
|
thereof investment in equity method investees (1) |
|
|
|
|
|
|
|
— |
|
— |
|
|
|
Additions of property, plant and equipment, intangible assets and right-of-use assets (1) |
|
|
|
|
|
|
|
(
|
|
|
|
|
| (1) | These line items are included to comply with requirements under IFRS 8 and IFRS 15 or are provided on a voluntary basis, but not included in the information regularly reviewed by the chief operating decision maker. |
F-106
FRESENIUS MEDICAL CARE AG
NOTES TO THE CONSOLIDATED FINANCIAL STATEMENTS
(in THOUS, except share and per share data)
For the geographic presentation, revenues are attributed to specific countries based on the end user’s location for products and the country in which the service is provided. Information with respect to the Company’s geographic operations is set forth in the table below:
|
Geographic presentation |
|
|
|
|
|
|
|
|
|
in € THOUS |
|
|
|
|
|
|
|
|
|
|
|
|
|
|
|
Rest of |
|
|
|
|
|
Germany |
|
U.S. |
|
the world |
|
Total |
|
2024 |
|
|
|
|
|
|
|
|
|
Revenue from external customers |
|
|
|
|
|
|
|
|
|
Long-lived assets |
|
|
|
|
|
|
|
|
|
|
|
|
|
|
|
|
|
|
|
2023 |
|
|
|
|
|
|
|
|
|
Revenue from external customers |
|
|
|
|
|
|
|
|
|
Long-lived assets |
|
|
|
|
|
|
|
|
|
|
|
|
|
|
|
|
|
|
|
2022 |
|
|
|
|
|
|
|
|
|
Revenue from external customers |
|
|
|
|
|
|
|
|
|
Long-lived assets |
|
|
|
|
|
|
|
|
30. Subsequent events
No other significant activities have taken place subsequent to the balance sheet date December 31, 2024 that have a material impact on the key figures and earnings presented. Currently, there are no other significant changes in the Company’s structure, management, legal form or personnel.
31. Compensation of the Management Board and the Supervisory Board
Compensation of the Management Board
The total compensation of the members of the Management Board for the fiscal year 2024 amounted to €
Under IFRS Accounting Standards, pension expense (service costs) for the members of the Management Board in 2024 amounted to €
F-107
FRESENIUS MEDICAL CARE AG
NOTES TO THE CONSOLIDATED FINANCIAL STATEMENTS
(in THOUS, except share and per share data)
As of December 31, 2024, outstanding balances with respect to the members of the Management Board amounted to €
The total compensation of former members of the Management Board and the management board of Fresenius Medical Care Management AG amounted to €
Compensation of the supervisory board
In 2024, the total compensation of the members of the Supervisory Board amounted to €
In 2023, the compensation of the supervisory board of the Fresenius Medical Care Management AG and the compensation of its committees was, in compliance with article 7 para. 3 of the Articles of Association of the Company valid until the Conversion, charged to the Company; the total compensation of the members of the supervisory board of Fresenius Medical Care Management AG in 2023 amounted to €
32. Principal accountant fees and services
In 2024, 2023 and 2022, fees for the auditor, PricewaterhouseCoopers GmbH Wirtschaftsprüfungsgesellschaft (PwC), and its affiliates were expensed as follows:
|
Fees |
||||||||||||
|
in € THOUS |
|
|
|
|
|
|
|
|
|
|
|
|
|
|
|
Consolidated |
|
thereof |
|
Consolidated |
|
thereof |
|
Consolidated |
|
thereof |
|
|
|
group |
|
Germany |
|
group |
|
Germany |
|
group |
|
Germany |
|
|
|
2024 |
|
2023 |
|
2022 |
||||||
|
|
|
|
|
|
|
|
|
|
|
|
|
|
|
Audit fees |
|
|
|
|
|
|
|
|
|
|
|
|
|
Audit-related fees |
|
|
|
|
|
|
|
|
|
|
|
|
|
Tax fees |
|
— |
|
— |
|
— |
|
— |
|
|
|
— |
|
Other fees |
|
— |
|
— |
|
— |
|
— |
|
|
|
|
Audit fees are the aggregate fees billed by the Company’s auditors for the audit of the Company’s consolidated financial statements and the statutory financial statements of FME AG and of its subsidiaries, reviews of interim financial statements and attestation services that are provided in connection with statutory and regulatory filings or engagements. Fees related to the audit of internal control over financial reporting are included in audit fees.
F-108
FRESENIUS MEDICAL CARE AG
NOTES TO THE CONSOLIDATED FINANCIAL STATEMENTS
(in THOUS, except share and per share data)
Audit-related fees are fees charged by the Company’s auditors for assurance and related services that are reasonably related to the performance of the audit or review of the Company’s financial statements and are not reported under audit fees. This category mainly comprises fees billed by PwC for comfort letters, audit of the compensation report of the management board, audit of the sustainability reporting, agreed-upon procedure engagements and other attestation services subject to regulatory requirements.
Tax fees are fees for professional services rendered by the Company’s auditors for tax compliance, tax consulting associated with international transfer prices, as well as support services related to tax audits.
In 2022, other fees included amounts related to services from the Company’s auditors, mainly related to corporate governance.
F-109
183
|
2.16 |
|
|
4.1 |
|
|
4.2 |
|
|
4.3 |
|
|
4.4 |
|
|
4.5 |
Trademark License Agreement dated September 27, 1996 by and between Fresenius AG and Fresenius Medical Care AG. (Incorporated by reference to Exhibit 10.8 to Fresenius Medical Care AG’s Registration Statement on Form F-1, Registration No. 333-05922, filed November 16, 1996). |
|
4.6 |
|
|
4.7 |
|
|
4.8 |
|
|
4.9 |
|
|
4.10 |
|
|
4.11 |
|
|
4.12 |
|
|
4.13 |
|
|
4.14 |
|
|
4.15 |
|
|
4.16 |
184
|
4.17 |
|
|
4.18 |
|
|
4.19 |
|
|
4.20 |
|
|
8.1 |
|
|
11.1 |
Code of Business Conduct. A copy of the Registrant’s revised Code of Ethics and Business Conduct is available on the Registrant’s website at: www.freseniusmedicalcare.com/en/about-us/compliance/our-code-of-ethics-and-business-conduct/ |
|
11.2 |
|
|
11.3 |
|
|
12.1 |
|
|
12.2 |
|
|
13.1 |
|
|
13.2 |
|
|
97 |
|
|
101 |
The following financial statements as of and for the twelve-month period ended December 31, 2024 from the Company’s Annual Report on Form 20-F for the fiscal year ended December 31, 2024, formatted in XBRL (eXtensible Business Reporting Language): (i) Consolidated Statements of Income, (ii) Consolidated Statements of Comprehensive Income, (iii) Consolidated Balance Sheets, (iv) Consolidated Statements of Cash Flows, (v) Consolidated Statements of Shareholders’ Equity and (vi) notes to the consolidated financial statements (filed herewith). |
|
104 |
Cover page interactive data file (formatted as Inline XBRL and included in Exhibit 101). |
| (1) | Pursuant to the Amendment and Restatement Agreement (Exhibit 2.16), FMCH ceased to be a borrower and a guarantor under the Sustainability-Linked Revolving Credit Facility Agreement (Exhibit 2.14). The termination of FMCH’s guarantee under this agreement terminated FMCH’s guarantee under each of the indentures listed as Exhibits 2.4, 2.5, 2.6, and 2.7 relating to the USD denominated notes issued by Fresenius Medical Care US Finance III, Inc. under such indentures and under the final terms of each issue of Euro-Denominated Bonds listed as Exhibits 2.8, 2.9, 2.10, 2.11, 2.12 and 2.13 issued by Fresenius Medical Care AG. |
| (2) | In accordance with the Instructions as to Exhibits to Form 20-F, certain schedules and annexes to this exhibit have been omitted. |
185